2-thiophene carboxaldehyde as corrosion inhibitor for … · 2-thiophene carboxaldehyde as...
TRANSCRIPT

Chem Sci Trans., 2012, 1(2), 355-364 Chemical Science Transactions
DOI:10.7598/cst2012.4730 ISSN/E-ISSN: 2278-3458/2278-3318
2-Thiophene Carboxaldehyde as Corrosion
Inhibitor for Zinc in Phosphoric Acid Solution
M. BOULKROUNE* and A. CHIBANI
Laboratoire de Chimie Moléculaire, du Contrôle de l’Environnement, et de Mesures
physico-chimiques, Université Mentouri, route de Ain El-Bey, Constantine, Algérie
Received 15 May 2012 / Accepted 20 June 2012
Abstract: The inhibitive effect of 2-thiophene carboxaldehyde (TCAl) on zinc corrosion in 1 M H3PO4
solutions has been studied by weight loss, potentiodynamic polarisation and open-circuit potential (OCP)
methods. The obtained results revealed that TCAl is an effective corrosion inhibitor for zinc in H3PO4
solutions. Inhibition efficiency values obtained from gravimetric and electrochemical measurements were
in good agreement. The inhibition efficiency increases with increasing inhibitor concentration and
decreases with increasing temperature. Potentiodynamic polarisation studies showed that TCAl acts as a
mixed type inhibitor. Scanning electron microscopy (SEM), OCP measurements and the thermodynamic
data of dissolution and adsorption processes showed that inhibition of zinc corrosion in phosphoric acid
solutions by TCAl is due to the formation of a physisorbed film on the zinc surface. Adsorption of the
compound studied on zinc surface obeys to Langmuir adsorption isotherm.
Keywords: Corrosion, Inhibition, Zinc, Acid, Thiophene, Adsorption
Introduction
Corrosion control of metals is an activity of technical, economical, environmental and
aesthetical importance. Thus, the search for new and efficient corrosion inhibitors has
become a necessity to secure metallic materials against corrosion.
Acid solutions are generally used for the removal of undesirable scale and rust in
several industrial process. Since acids are aggressive, inhibitors are usually used to control
the metal dissolution. The use of organic compounds as corrosion inhibitors in acidic media
have been widely reported by several authors1-10
.
Zinc finds numerous applications in technology and industry. Consequently, the study
of its corrosion inhibition is of great importance. A survey of literature reveals that there are
very few substances, which may be considered as good inhibitors for corrosion of zinc in
acidic media. These include the inhibitive action of phosphonium salts11,12
, organic dyes13
,
substituted N-arylpyrroles14
, organic onium compounds15
, ethoxylated fatty alcohols16
,
2-mercaptobenzimidazole17
Schiff bases of ethylenediamine18
, ethoxylated fatty acids19
, and
m-substituted aniline-N-salicylidenes20
.
RESEARCH ARTICLE

356 Chem Sci Trans., 2012, 1(2), 355-364
Some thiophene compounds have been reported earlier as good inhibitors for steel
and AISI austenitic stainless steel in acidic media21-25
. In the present work, the corrosion
inhibition of 2-thiophene carboxaldehyde for zinc in 1 M H3PO4 solution has been studied
by weight loss and electrochemical methods. The efficiency of the inhibitors was
evaluated at various concentrations and temperatures. Surface examinations were made
using scanning electron microscopy (SEM). The molecular structure of the thiophene
studied is shown in Figure 1.
(TCAl)
Figure 1. Molecular structure of 2-thiophene carboxaldehyde
Experimental
All solutions were prepared using distilled water and commercial products. Thiophene
carboxaldhyde 98% (TCAl) was Fluka product and was used as received. The aggressive
solution (1 M H3PO4) was prepared by dilution of analytical grade 85% H3PO4 (Merck).
Zinc specimens were cut from industrial zinc (0.9 mm thickness).
Weight loss measurements
Gravimetric measurements were carried out in a double walled glass cell equipped with a
thermostated cooling condenser. Weight loss was measured on sheets of zinc of apparent
surface area of 2 cm2. Prior to all measurements, the zinc samples were mechanically
abraded using a series of emery paper from 400 to 1200 grade. The specimens were then
rinsed with distilled water, degreased with acetone, rinsed again with distilled water and
finally dried before being weighed and immersed in 100 cm3 of the corrosive solution at
298±0.5 K. At the end of the tests, the specimens were taken out from the solution at regular
intervals of time (10-90 min), rinsed with distilled water, degreased with acetone, dried and
weighed using an analytical balance.
Electrochemical measurements
Electrochemical measurements were carried out in a conventional three-electrode
cylindrical glass cell with a thermostatic jacket and a disc sample holder. The working
electrode had the form of a disc cut form zinc sheet. The exposed area to the corrosive
solution was 0.95 cm2. The electrode surface was prepared in a similar way as used in
case of weight loss measurements. A saturated calomel electrode (SCE) and a platinum
electrode were used as reference and auxiliary electrode, respectively. The temperature
was thermostatically controlled at 298±0.5 K. Electrochemical measurements were done
using PGP 201 potentiostat/galvanostat controlled by Volta Master 1 corrosion
software.
Polarisation measurements
The polarisation curves were recorded after the electrode potential reaches a steady-state
value. The polarisation curves are obtained from -1090 mV/SCE to more positive values at a
scan rate of 20 mV/min. The test solution is deaerated with pure nitrogen. Gas bubbling is
maintained through the experiments. Corrosion current density values were obtained by
Tafel extrapolation method.

Chem Sci Trans., 2012, 1(2), 355-364 357
Open circuit measurements
The variation of the open circuit potential (OCP) of the zinc electrode was followed as a
function of time from the moment of its introduction into the cell during 1 hour.
SEM
Scanning electron microscopy (SEM) observations of Zn surface before and after immersion
in acid solution in the absence and the presence of the inhibitor were performed using
scanning electron microscopy (SEM) Jeol JSM-6400 model.
Results and Discussion
Weight loss measurements
Effect of TCAl concentration
Since corrosion inhibitors may accelerate corrosion when used at low concentrations or may
cause emulsification when used at high concentrations16
, it was necessary to study the effect
of 2-thiophene carboxaldehyde concentration on zinc corrosion.
The corrosion rates in 1 M H3PO4 (0
corrW ) and at different concentrations of the tested
compound (Wcorr) are determined after 1 h of immersion. The values of corrosion rates and
inhibition efficiencies are given in Table 1. The inhibition efficiency (IEw) was calculated
using the equation:
IEw = 100 × (1-0
corr
corr
W
W ) (1)
It is clear from Table 1 that the corrosion rate decreases in the presence of TCAl and
that it depends on the inhibitor concentration, hence, the inhibition efficiency increases with
the inhibitor concentration to reach near 97% at 5 x 10⁻³
M. This trend may result from the
fact that adsorption and surface coverage increases with the increase in TCAl concentration;
thus the surface is separated from the medium26
.
Table 1. Gravimetric results of zinc corrosion in 1 M H3PO4 without and with various
concentrations of TCAl at 298 K after 1 h of immersion period
Concentration, M Wcorr, mg/cm2 h IEw, %
Blank TCAl 33.4 -
5 x 10⁻⁴
15.8 52.69
1 x 10⁻³
11.28 66.28
2 x 10⁻³
4.95 85.18
3 x 10⁻³
3.65 89.07
4 x 10⁻³
2.00 94.01
5 x 10⁻³
1.15 96.56
6 x 10⁻³
1.35 95.95
7 x 10⁻³
1.25 96.26
Effect of immersion time
To elucidate the influence of immersion time on the corrosion rate of zinc, the data obtained
from weight loss measurements for different periods are collected in Figure 2. The curves
show the variation of the weight loss of zinc with the immersion time in 1 M H3PO4
solutions without and with TCAl at the concentrations 10-3
M and 5x10⁻³
M.

t, min
358 Chem Sci Trans., 2012, 1(2), 355-364
From these data, it is obvious that the weight loss of zinc enhances with immersion
time. On the other hand, addition of increasing concentrations of the inhibitor, retards the
corrosion of zinc in these solutions. This is clearly seen from the decrease in weight loss,
corresponding to a noticeable decrease in the slope of each curve, with increase in inhibitor
concentration. These results indicate that the compound under investigation does not lose its
efficiency after long periods of immersion.
0 20 40 60 80 1000
20
40
60
80
Blank
10-3M
5 x 10⁻³M
Figure 2. Weight loss of zinc as function of immersion time in 1 M H3PO4 solution without
and with TCAl at 298K
Polarisation measurements
The potentiodynamic polarisation curves of zinc in phosphoric acid in the absence and
presence of the tested inhibitor are shown in Figure 3. Electrochemical parameters obtained
from the Tafel extrapolation method are given in Table 2. The inhibition efficiencies were
calculated using the following equation:
IEI = 100 × (1-0
corr
corr
I
I ) (2)
Where Icorr and 0
corrI are the corrosion current density values with and without the
inhibitor, respectively.
-1,6 -1,4 -1,2 -1,0 -0,8 -0,6 -0,4
-6,5
-6,0
-5,5
-5,0
-4,5
-4,0
-3,5
-3,0
-2,5
-2,0
-1,5
-1,0
65432
1
E(mV/SCE)
1 : Blank
2 : 5x10⁻⁴M
3 : 10-3M
4 : 2x10⁻³M
5 : 5x10⁻³M
6 : 7x10⁻³M
Figure 3. Potentiodynamic polarization curves for zinc in 1 M H3PO4 containing different
concentrations of TCAl
Wei
ght
loss
, m
g.c
m-2
lo
gI,
mA
/cm
2
E(m V/SCE)

t, min
Chem Sci Trans., 2012, 1(2), 355-364 359
Table 2. Electrochemical parameters and the corresponding corrosion inhibition efficiencies
of zinc in 1 M H3PO4 without and with various concentration of TCAl at 298 K
Concentration, M Ecorr, mV/SCE Icorr, mA/ cm2 ba, mV/dec bc, mV/dec IEI, %
Blank TCAl -1011 6.637 789.4 -701.8 -
5x10⁻⁴
-993 4.8305 676.3 -614.8 27.22
10-3
-981 2.897 633.4 -502.7 56.35
2x10⁻³
-969 0.8453 600 -389.7 87.26
5x10⁻³
-961 0.1795 511.9 -306.7 97.29
7x10⁻³
-954 0.2084 495.3 -434.4 96.86
The corrosion of zinc in acidic solution is the result of the galvanic cell of the anodic
dissolution of zinc and the cathodic evolution of hydrogen27
. From electrochemical
polarisation measurements, it is clearly seen that TCAl shifts both the anodic and cathodic
branches of the polarization curves of the pure acid solution to lower values of current density,
but inhibits the hydrogen evolution reaction more than the anodic dissolution of zinc.
IEI (%) values increase with increasing inhibitor concentration reaching a maximum
value at 5x10⁻³
M (Table 2). These results are in good agreement with those obtained from
the gravimetric tests.
Increase in concentration of TCAl causes shifting of corrosion potentials to noble
direction. According to Ferreira et al. 28
and Li et al.29
, if the displacement in corrosion
potential is more than 85 mV with respect to corrosion potential of the blank, the inhibitor
can be considered as a cathodic or an anodic type. However, the maximum displacement in
this study is 57 mV, which indicates that TCAl is a mixed type inhibitor. The changes in
both the anodic and cathodic Tafel slopes observed on the addition of TCAl indicate that
both anodic and cathodic reactions are affected by the addition of the inhibitor.
Open-circuit potential measurements
The open-circuit potentials of zinc in the absence and the presence of TCAl at different
concentrations were traced over 60 min from the electrode immersion in the test solution.
The obtained results are depicted in Figure 4.
0 10 20 30 40 50 60
-1030
-1020
-1010
-1000
-990
-980
-970
-960
-950
-940
5 x 10⁻³M
2 x 10⁻³M
10-3M
5 x 10⁻⁴M
Blank
Figure 4. Open circuit potential variation of zinc in 1 M H3PO4 without and with various
concentrations TCAl
E(m
V)

1000/T (K-1)
360 Chem Sci Trans., 2012, 1(2), 355-364
The dependence of OCP on time at various concentrations of TCAl is clearly seen from
Figure 6. The presence of TCAl in the acidic solution shifts the steady-state potential
towards noble values. This potential gets more positive as the additive concentration
increases. The potential shift reveals that the inhibition efficiency of TCAl is enhanced. This
behavior can be interpreted by the formation of a protective film on the electrode surface26,30
.
Temperature effect
The effect of temperature on the inhibitive efficiency of TCAl was studied by gravimetric
method at various temperatures. Weight losses were determined in 1 M phosphoric acid
solutions without and with 10-3
M of the inhibitor studied in the temperature range (298-338 K),
after 1 h of immersion.
The results given in Table 3 show that in inhibited as well as in uninhibited solutions
the corrosion rate increases with a rise in temperature and as a result the inhibition efficiency
decreases indicating that at higher temperatures the dissolution of Zinc predominates over
inhibitor adsorption. This may be attributed to the desorption of the inhibitor molecules, thus
exposing the metal surface to further attack18
.
Table 3. Corrosion parameters and inhibition efficiencies for zinc in 1 M H3PO4 without and
with the addition of TCAl 10-3
M at different temperatures
T, K W°corr, mg/cm2 h Wcorr, mg/cm
2 h Ew, %
298 33.4 11.28 66.23
308 67.05 24.3 63.76
318 98.65 44.63 54.76
328 154.6 78.15 49.45
338 207.6 135.8 34.59
The activation energy (Ea) of the corrosion process can be determined from the
Arrhenius plots (ln Wcorr. Vs. 1/T) presented in Figure 5 by using the following equation31
:
Wcorr. = A e-Ea/RT
(3)
and logarithmic form:
ln Wcorr. = ln A – Ea/RT (4)
2,9 3,0 3,1 3,2 3,3 3,4
2,0
2,5
3,0
3,5
4,0
4,5
5,0
5,5
-1
Blank
TCAL
Figure 5. Arrhenius plots of zinc in 1 M H3PO4 without and with TCAl 10-3
M
LnW
(m
g.c
m-2
.h-1
)
1000/T (K-1)
Chem Sci Trans., 2012, 1(2), 355-364 361
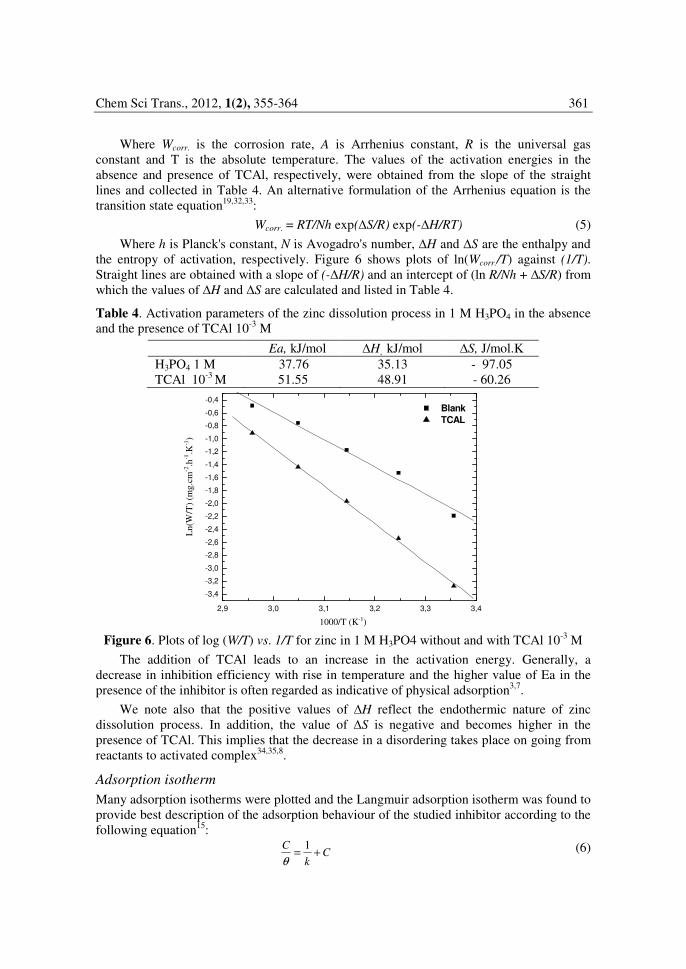
Where Wcorr. is the corrosion rate, A is Arrhenius constant, R is the universal gas
constant and T is the absolute temperature. The values of the activation energies in the
absence and presence of TCAl, respectively, were obtained from the slope of the straight
lines and collected in Table 4. An alternative formulation of the Arrhenius equation is the
transition state equation19,32,33
:
Wcorr. = RT/Nh exp(∆S/R) exp(-∆H/RT) (5)
Where h is Planck's constant, N is Avogadro's number, ∆H and ∆S are the enthalpy and
the entropy of activation, respectively. Figure 6 shows plots of ln(Wcorr./T) against (1/T).
Straight lines are obtained with a slope of (-∆H/R) and an intercept of (ln R/Nh + ∆S/R) from
which the values of ∆H and ∆S are calculated and listed in Table 4.
Table 4. Activation parameters of the zinc dissolution process in 1 M H3PO4 in the absence
and the presence of TCAl 10-3
M
Ea, kJ/mol ∆H, kJ/mol ∆S, J/mol.K
H3PO4 1 M 37.76 35.13 - 97.05
TCAl 10-3
M 51.55 48.91 - 60.26
2,9 3,0 3,1 3,2 3,3 3,4
-3,4
-3,2
-3,0
-2,8
-2,6
-2,4
-2,2
-2,0
-1,8
-1,6
-1,4
-1,2
-1,0
-0,8
-0,6
-0,4
Blank
TCAL
Figure 6. Plots of log (W/T) vs. 1/T for zinc in 1 M H3PO4 without and with TCAl 10-3
M
The addition of TCAl leads to an increase in the activation energy. Generally, a
decrease in inhibition efficiency with rise in temperature and the higher value of Ea in the
presence of the inhibitor is often regarded as indicative of physical adsorption3,7
.
We note also that the positive values of ∆H reflect the endothermic nature of zinc
dissolution process. In addition, the value of ∆S is negative and becomes higher in the
presence of TCAl. This implies that the decrease in a disordering takes place on going from
reactants to activated complex34,35,8
.
Adsorption isotherm
Many adsorption isotherms were plotted and the Langmuir adsorption isotherm was found to
provide best description of the adsorption behaviour of the studied inhibitor according to the
following equation15
:
Ck
C+=
1
θ
(6)
Ln
(W/T
) (m
g.c
m-2
.h-1
.K-1
)
C mol/L
362 Chem Sci Trans., 2012, 1(2), 355-364
Where C is the inhibitor concentration, θ the fraction of the surface covered determined
by E/100 and k the equilibrium constant which is related to the standard free energy of
adsorption 0
adsG∆ by the equation15,36
:
)exp(5.55
10
RT
Gk ads∆
−= (7)
The value of 55.5 is the concentration of water in solution expressed in M. Plotting C/θ
against C gave a straight line with a slope close to unity (Figure 7) indicating that the
adsorption of TCAl on zinc surface follows Langmuir adsorption isotherm and
consequently, there is no interaction between the adsorbed molecules33,37
. The negative
value obtained of 0
adsG∆ (-28.94 kJ mol-1
) suggests that TCAl is spontaneously physisorbed
on the metal surface5,38
.
0,000 0,001 0,002 0,003 0,004 0,005 0,006 0,007 0,008
0,000
0,001
0,002
0,003
0,004
0,005
0,006
0,007
0,008
C/ θθ θθ
C (mol/L)
Figure 7. Langmuir adsorption isotherm of TCAl on the surface of zinc in 1 M H3PO4
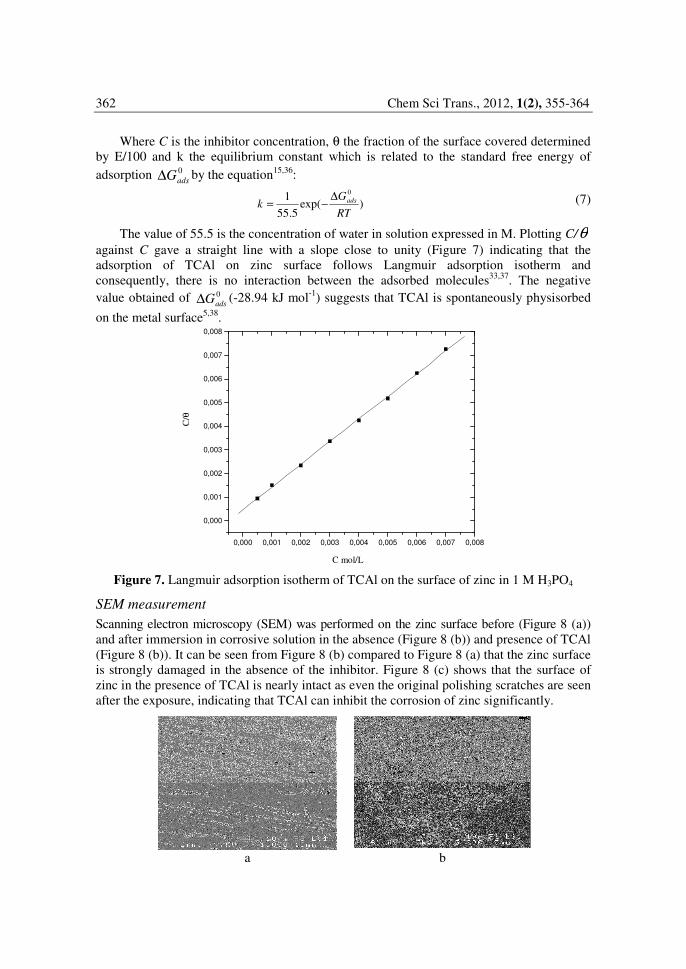
SEM measurement
Scanning electron microscopy (SEM) was performed on the zinc surface before (Figure 8 (a))
and after immersion in corrosive solution in the absence (Figure 8 (b)) and presence of TCAl
(Figure 8 (b)). It can be seen from Figure 8 (b) compared to Figure 8 (a) that the zinc surface
is strongly damaged in the absence of the inhibitor. Figure 8 (c) shows that the surface of
zinc in the presence of TCAl is nearly intact as even the original polishing scratches are seen
after the exposure, indicating that TCAl can inhibit the corrosion of zinc significantly.
a b
C/θ

Chem Sci Trans., 2012, 1(2), 355-364 363
Figure 8. SEM images of zinc surface, before its exposure to electrolyte (a), after 1 h of
immersion in 1 M H3PO4 in the absence (b) and presence (c) of TCAl 5x10⁻³
M
Conclusion
From the above results, the following conclusions are made:
• 2-Thiophene carboxaldehyde is considered as a good inhibitor for zinc corrosion in
1 M H3PO4.
• The protection efficiency increases with increase in inhibitor concentration to reach to
reach near 97% at 5x10⁻³
M and decreases with increase in temperature.
• The inhibition efficiencies obtained from polarization measurements shows good
agreement with those obtained from weight loss method.
• Polarisation measurements show that TCAl acts as a mixed type inhibitor.
• The Scanning electron microscopy (SEM), OCP measurements and the
thermodynamic parameters of dissolution and adsorption processes, indicate that the
inhibition characteristic of TCAl is attributed to its physisorption on the zinc surface.
• The adsorption of TCAl on the Zinc surface obeys to the Langmuir adsorption
isotherm model.
References
1. Wang L, Corros Sci., 2001, 43, 1637-1644.
2. Benchekroun K, Dalard F, Rameaub J J and El Ghazalic A, New J Chem., 2002, 26,
153-159.
3. Popova A, Sokolova E, Raicheva S and Christov M, Corros Sci., 2003, 45, 33-58.
4. Yurt A, Balaban A, Ustün Kandemir S, Bereket G and Erk B, Mater Chem Phys.,
2004, 85(2), 420.
5. Ouchrif A, Zegmout M, Hammouti B, El-Kadiri S and Ramdani A, Appl Surf Sci.,
2005, 252(2), 339-344.
6. Fouda A S, Mostafa H A and Moussa M N, Port Electrochim Acta, 2005, 23(2),
275-287.
7. Tebbji K, Aouniti A, Benkaddour M, Oudda H, Bouabdallah I, Hammouti B and
Ramdani A, Prog Org Coat., 2005, 54, 170-174.
8. Benabdellah M, Ousslim A, Hammouti B, Elidrissi A, Aouniti A, Dafali A, Bekkouch K
and Benkaddour M, J Appl Electrochem., 2007, 37(7), 819-826.
9. Quraishi M A, Rafiquee M Z A, Khan S and Saxena N, J Appl Electrochem., 2007,
37, 1153-1162.
10. Antonijevic M M and Petrovic M B, Int J Electrochem Sci., 2008, 3, 1-26.
11. Troquet M, Labbe J P and Pagetti J, Corros Sci., 1981, 21(2), 101-117.
(c)

364 Chem Sci Trans., 2012, 1(2), 355-364
12. Troquet M and Pagetti J, Electrochem Acta, 1982, 27(2), 197-203.
13. Mourad M Y, Seliman S A and Abde El-Metaal S M, Bull Soc Chim Fr., 1991, 128, 832.
14. Stupnisek-Lisac E and Podbrscek S, J Appl Electrochem., 1994, 24, 779.
15. Morad M S, J Appl Electrochem., 1999, 29, 619-626.
16. Abdellah M, Corros Sci., 2003, 45, 2705.
17. Wang L, Pu J X and Luo H C, Corros Sci., 2003, 45(4), 677-683.
18. Agrawal Y K, Talati J D, Shah M D, Desai M N and Shah N K, Corros Sci., 2004,
46(3), 633-651.
19. Foad El-Sherbini E E, Abdel Wahaab S M and Deyab M, Mater Chem Phys., 2005,
89, 183-191.
20. Talati J D, Desai M N and Shah N K, Mater Chem Phys., 2005, 93(1), 54-64.
21. Bouklah M, Hammouti B, Aouniti A and Benhadda T, Prog Org Coat., 2004, 49(3),
225-228.
22. Galal A, Atta N F and Al-Hassan M H S, Mater Chem Phys., 2005, 89(1), 28-37.
23. Galal A, Atta N F and Al-Hassan M H S, Mater Chem Phys., 2005, 89, 38.
24. Benabdellah M, Aouniti A, Dafali A, Hammouti B, Benkaddour M, Yahyi A and
Ettouhami A, Appl Surf Sci., 2006, 252 , 8341.
25. Bouklah M, Hammouti B, Benkaddour M and Benhadda T, J Appl Electrochem.,
2005, 35(11), 1095-1101.
26. Abdel Rehim S S, Hazzazi O A, Amin M A and Khaled K F, Corros Sci., 2008, 50,
2258-2271.
27. Rudresh H B and Mayanna S M, Corros Sci., 1979, 19(6), 361-370.
28. Ferreira ES, Giancomelli C, Giacomelli F C and Spinelli A, Mater Chem Phys., 2004,
83, 129.
29. Li W , He Q , Zhang S, Pei C and Hou B, J Appl Electrochem., 2008, 38, 289-295.
30. Helal N H, El-Rabiee M M, Abd El-Hafez G M and Badawy W A, J Alloys Comp.,
2008, 456(1-2), 372-378.
31. Huang W and Zhao J, Coll Surf A: Physicochem Eng Aspects, 2006, 278, 246.
32. Bouklah M and Hammouti B, Port Electrochim Acta, 2006, 24(4), 457-468.
33. Abdallah M, Corros Sci., 2004, 46(8), 1981-1996.
34. Martinez S and Stern I, Appl Surf Sci., 2002, 199, 83-89.
35. Abd El-Rehim S S, Ibrahim M A M and Khaled K F, J Appl Electrochem., 1999, 29,
593-599.
36. Lebrini M, Lagrenée M, Traisnel M, Gengembre L, Vezin H and Bentiss F, Appl Surf
Sci., 2007, 253, 9267.
37. El-Etre A Y, Abdallah M and El-Tantawy Z E, Corro Sci., 2005, 47, 385-395.
38. Herrag L, Hammouti B, Aouniti A, El Kadiri S and Touzani R, Acta Chim Slov.,
2007, 54(2), 419-423.