2 the abecedarian project - welfare reform academy · besharov, germanis, higney, and call 2: the...
TRANSCRIPT

2The Abecedarian Project
Douglas J. Besharov Peter Germanis Caeli A. Higney
and Douglas M. Call
September 2011
Maryland School of Public PolicyWelfare Reform Academywww.welfareacademy.org
Part of a forthcoming volumeAssessments of Twenty-Six Early Childhood Evaluations
by Douglas J. Besharov, Peter Germans, Caeli A. Higney, and Douglas M. Call

In the last years of this period, the program was limited to school-related services provided to a subset of1
program and control group children.
Craig T. Ramey and Frances A. Campbell, “Preventive Education for High-Risk Children: Cognitive2
Consequences of the Carolina Abecedarian Project,” American Journal of Mental Deficiency 88, no. 5 (March
1984): 516. See also, The Carolina Abecedarian Project website, http://www.fpg.unc.edu/~abc (accessed June 28,
2010).
Craig T. Ramey, Frances A. Campbell, Margaret Burchinal, Martie L. Skinner, David M. Gardner, and3
Sharon L. Ramey, “Persistent Effects of Early Childhood Education on High-Risk Children and Their Mothers,”
Applied Developmental Science 4, no. 1 (January 2000): 5, stating: “The most vulnerable children benefitted the
most from the preschool program. We estimated the effects of the preschool treatment on intellectual development
from 6 through 54 months of age (Martin, Ramey, & Ramey, 1990). The IQs of preschool treatment group children
ranged from 8 to 20 points higher than those of control children when maternal mental retardation and home
environment, both important factors in the occurrence of developmental delay, were statistically accounted for via
multiple-regression analyses. The children who benefitted the most had mothers with IQs below 70.”
Note: This report is open to public comments, subject to review by the forum moderator. Toleave a comment, please send an email to [email protected] or fill out the commentform at http://www.welfareacademy.org/pubs/early_education/chapter2.html.
2The Abecedarian Project
The Abecedarian Project, operating between 1972 and 1985, was an intensive, center-1
based program that began working with children in infancy and continued through preschool(and the early school years for some children). It was designed to “test the hypothesis thatproviding socially disadvantaged children with an intellectually stimulating environment fromearly infancy could prevent the development of mild mental retardation.”2
Craig Ramey and his colleagues at the Frank Porter Graham (FPG) Child DevelopmentInstitute at the University of North Carolina, Chapel Hill (the “UNC team”) conducted a randomassignment evaluation of the program between 1972 and 1977, with follow-ups through agetwenty-one. They concluded that the program successfully achieved positive and lasting gains ona wide range of cognitive and school-related outcomes. These gains, however, appear to havebeen concentrated among the subgroup of children whose mothers had IQs below 70 at the timeof entry into the study, and some faded over time. Moreover, these early gains did not lead to3
many improved outcomes in adulthood (when the children were age twenty-one), with, forexample, no statistically significant increases in employment or reductions in criminal activity.Although the project was evaluated using random assignment, the post-random assignmentrefusal to participate in the evaluation of over 10 percent of families assigned to the programgroup raises the possibility of selection bias. In addition, the fact that the project was composedmainly of low-income, black children (at “high risk” of intellectual or academic failure) in anotherwise affluent area and the absence of successful replications raise questions about the

Besharov, Germanis, Higney, and Call 2: The Abecedarian Project
Craig T. Ramey and Frances A. Campbell, “Preventive Education for High-Risk Children: Cognitive4
Consequences of the Carolina Abecedarian Project,” American Journal of Mental Deficiency 88, no. 5 (March
1984): 515–523.
The Abecedarian Project offered as much as 10,000 hours of preschool intervention services per child5
(eight hours per day, five days per week, fifty weeks per year, for five years) compared to the 720 hours received in
a typical Head Start program at that time (four hours per day, five days per week, for thirty-six weeks).
Assessments of Twenty-Six Early Childhood Evaluations 2-2
generalizability of the findings.
Program Design
Program group. The Abecedarian Project recruited 122 children from 120 low-incomefamilies (including one set of twins and one pair of siblings) from local prenatal clinics and fromfamilies identified by the local Department of Social Services as falling within the eligibilitycriteria.
Eligibility was based on a thirteen-factor High Risk Index, which included mother’s andfather’s educational level, family income, father’s absence, welfare receipt, and other factorsrelated to children’s lower levels of intellectual functioning and/or academic failure. All familieswhose scores exceeded a threshold level for risk and who agreed to participate were included inthe experiment. Infants who were subsequently observed to have an obvious neurologic disorder,however, were dropped from the study.
At the time of enrollment, the mean age of the mothers in the program group compared tothe control group were sightly younger on average (about 19.7 years vs. about 20.4 years), hadabout the same average educational level (about 10.6 years vs. 10.1 years), were more likely tobe single mothers (83 percent vs. 75 percent), less likely to be black (94 percent vs 100 percent),and more likely to be first-time mothers (67 percent vs. 60 percent). All differences were notstatistically significant.4
Services. The Abecedarian Project provided a full-day (six to eight hours per day), full-year preschool program, beginning with children as young as six weeks of age (with an averageage of entry of 4.4 months) and continuing until the children entered kindergarten. Staff-to-child5
ratios were 1:3 for infants and children up to age two and 1:6 for two- to five-year-olds. Highlytrained and well supervised staff taught age-appropriate curricula that emphasized thedevelopment of communication skills. An infant curriculum for children up to age three focusedon language, motor, social, and cognitive skills. For the older children, staff developedindividualized education programs that emphasized language, cognitive, social, and physicaldevelopment. Parents were offered varying amounts of social services including personalcounseling, and they were encouraged to participate in group sessions on topics such asparenting and family development.
Besharov, Germanis, Higney, and Call 2: The Abecedarian Project
Craig T. Ramey, Frances A. Campbell, Margaret Burchinal, Martie L. Skinner, David M. Gardner, and6
Sharon L. Ramey, “Persistent Effects of Early Childhood Education on High-Risk Children and Their Mothers,”
Applied Developmental Science 4, no. 1 (January 2000): 2–14,
http://web.pdx.edu/~stipakb/download/PA555/EarlyChildhoodEducStudy.pdf (accessed June 28, 2010).
Leonard N. Masse and W. Steven Barnett, A Benefit Cost Analysis of the Abecedarian Early Childhood7
Intervention (New Brunswick, NJ: National Institute for Early Education Research, 2002),
http://nieer.org/resources/research/AbecedarianStudy.pdf (accessed June 28, 2010).
Unless otherwise noted, all findings are from: Frances A. Campbell, Craig T. Ramey, Elizabeth Pungello,8
Joseph Sparling, and Shari Miller-Johnson, “Early Childhood Education: Young Adult Outcomes from the
Abecedarian Project,” Applied Developmental Science 6, no. 1 (January 2002): 42-57; Craig T. Ramey, Frances A.
Campbell, Margaret Burchinal, Martie L. Skinner, David M. Gardner, and Sharon L. Ramey, “Persistent Effects of
Early Childhood Education on High-Risk Children and Their Mothers,” Applied Developmental Science 4, no. 1
(January 2000): 2–14, http://web.pdx.edu/~stipakb/download/PA555/EarlyChildhoodEducStudy.pdf (accessed June
Assessments of Twenty-Six Early Childhood Evaluations 2-3
To address the possibility of “fade out”—or loss of early gains, a pattern observed inother experiments—a second phase of the program was created for about half of the childrenfrom kindergarten through second grade (K-2). (Half of the program group and half of thecontrol group were randomly assigned to this component.) This second phase paired familieswith experienced home/school resource teachers (HSTs) who visited the family every twoweeks, providing additional educational material, designing educational activities for parents toconduct with their children, and offering parental support and advocacy. In addition, the HSTsvisited the child’s classroom every two weeks to ensure that the supplemental materials providedat home complemented the child’s school curriculum and emphasized areas in which the childneeded extra help. During some summers, participants in the K–2 program group also attendedsummer camp as a further developmental supplement.6
The Evaluation. The UNC team conducted the evaluation. Between 1972 and 1977, theyrandomly assigned 120 families (with 122 children) to either a program group or to a controlgroup. Follow-up was conducted periodically until participants turned twenty-one. When thechildren reached age five, ninety-six remained in the sample and were randomly assigned againto one of four groups: (1) a preschool plus school-age program group; (2) a preschool-onlyprogram group; (3) a control group; and (4) a preschool control plus school-age program group.This allowed the UNC team to compare child outcomes for: early intervention, early interventionplus transitional school support, school-age intervention only, and no intervention. LeonardMasse and Steven Barnett, both at the National Institute for Early Education Research at RutgersUniversity, conducted a benefit-cost analysis published in 2002.7
Major Findings
The Abecedarian evaluation findings suggest that the program successfully achievedpositive and lasting gains on a wide range of cognitive and school-related outcomes, includingIQ, reading, and mathematics achievement scores. However, these gains became ambiguous as8

Besharov, Germanis, Higney, and Call 2: The Abecedarian Project
28, 2010); and Frances A. Campbell, Elizabeth P. Pungello, Shari Miller-Johnson, Margaret Burchinal, and Craig T.
Ramey, “The Development of Cognitive and Academic Abilities: Growth Curves from an Early Childhood
Educational Experiment,” Developmental Psychology 37, no. 2 (March 2001): 231–244.
Craig T. Ramey, Frances A. Campbell, Margaret Burchinal, Martie L. Skinner, David M. Gardner, and9
Sharon L. Ramey, “Persistent Effects of Early Childhood Education on High-Risk Children and Their Mothers,”
Applied Developmental Science 4, no. 1 (January 2000): 2–14,
http://web.pdx.edu/~stipakb/download/PA555/EarlyChildhoodEducStudy.pdf (accessed June 28, 2010).
As will be discussed later, this adds support to the theory behind the Milwaukee Project that lower IQs10
among at-risk children are often a function of being raised by “an intellectually limited caregiver.”
Craig T. Ramey, Frances A. Campbell, Margaret Burchinal, Martie L. Skinner, David M. Gardner, and11
Sharon L. Ramey, “Persistent Effects of Early Childhood Education on High-Risk Children and Their Mothers,”
Applied Developmental Science 4, no. 1 (January 2000): 10,
http://web.pdx.edu/~stipakb/download/PA555/EarlyChildhoodEducStudy.pdf (accessed June 28, 2010).
Assessments of Twenty-Six Early Childhood Evaluations 2-4
time went on, as described below. At age fifteen, the Abecedarian group had less grade retentionand fewer special education placements. These early gains, however, did not lead to manyimproved outcomes in adulthood (when the children were age twenty-one), with, for example, nostatistically significant differences in high school graduation rates, employment, or criminalactivity.
Cognitive. The evaluation included findings for both IQ and achievement scores.
IQ. Differences in cognitive development between the program and control groupsbecame apparent almost immediately and increased throughout the first three years of thepreschool treatment period (see table 1). For example, no statistically significant difference in IQwas observed when the children were three months old. By six months, however, the programgroup averaged IQs that were 5 points higher than the control group and, by age three, their IQswere 17 points higher. After age three, these differences diminished, and at age five, the IQ gainswere only 7 points. At age twelve, the program group’s average IQ was 6 points higher than thecontrol group, but there were no statistically significant differences at age eight or age fifteen. Atage twenty-one, however, the program group showed gains of about 5 points. (These final gainswere limited to female participants, who gained an average of 8 points [90 vs. 82].)
The UNC team points out that some subgroups gained more than others. In particular,9
the children who had mothers with IQs below 70 had the largest gains. Among this subgroup,10
at age fifteen, the effect of preschool on child IQ was about 10 points (91 vs. 81). Given the11
small sample size (six program individuals and six control individuals), this finding should beviewed as suggestive only. However, it is consistent with two themes underlying many studies:(1) Only those children who are more “at risk” seem to show the most substantial benefits fromearly childhood programs, and (2) first-time mothers seem to be the most amenable to programservices and interventions.

Besharov, Germanis, Higney, and Call 2: The Abecedarian Project
Assessments of Twenty-Six Early Childhood Evaluations 2-5
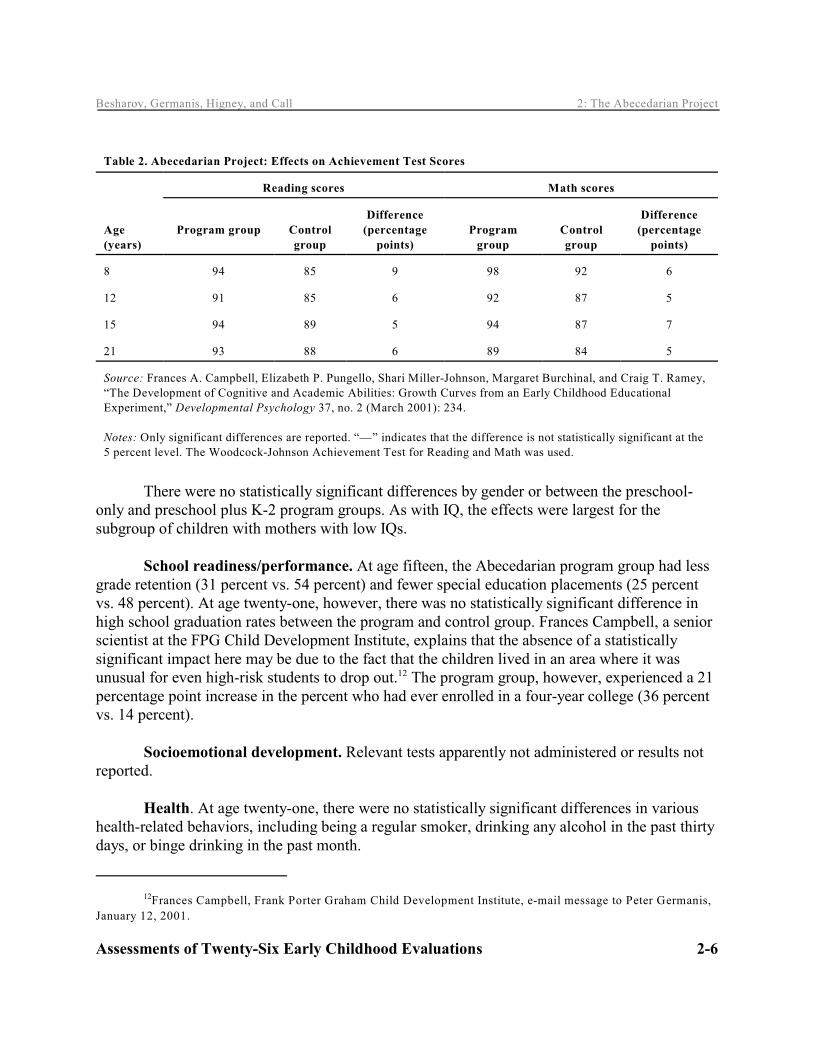
Achievement. The reading and mathematics achievement scores were consistently higherfor the program group throughout school to age twenty-one (see table 2). At age twenty-one, theprogram group outscored the control group by about 5 points on the Woodcock-Johnson BroadReading (93 vs. 88) and Broad Mathematics (89 vs. 84) tests. These differences translate into agrade-equivalent increase in reading scores of two years (11.1 vs. 9.2) and in math scores ofmore than one year (9.2 vs. 7.9).
Table 1. Abecedarian Project: IQ Effects
Age Program group Control group
Difference
(percentage points)
3 months 95 95 —
6 months 107 101 6
9 months 110 110 —
12 months 111 105 6
18 months 108 90 18
2 years 96 85 11
3 years 101 84 17
4 years 102 89 13
5 years 101 94 7
6.5 years 98 93 5
8 years 98 94 —
12 years 95 89 6
15 years 96 90 —
21 years 90 85 5
Sources: Craig T. Ramey, Frances A. Campbell, Margaret Burchinal, Martie L. Skinner, David M. Gardner, andSharon L. Ramey, “Persistent Effects of Early Childhood Education on High-Risk Children and Their Mothers,”Applied Developmental Science 4, no. 1 (January 2000): 2–14,http://web.pdx.edu/~stipakb/download/PA555/EarlyChildhoodEducStudy.pdf (accessed June 28, 2010); Frances A.Campbell, Elizabeth P. Pungello, Shari Miller-Johnson, Margaret Burchinal, and Craig T. Ramey, “The Developmentof Cognitive and Academic Abilities: Growth Curves from an Early Childhood Educational Experiment,”Developmental Psychology 37, no. 2 (March 2001): 231–244.
Notes: Only statistically significant differences are reported. “—” indicates that the difference is not statisticallysignificant at the 5 percent level. The Bayley Mental Development Index (MDI) was used for measurements betweenthree and eighteen months; the Stanford-Binet was used for measurements at ages two to four; the Wechsler Preschooland Primary Scale of Intelligence was used at age five; the Wechsler Intelligence Scale for Children-Revised was usedat ages six and one-half, eight, twelve, and fifteen; and the Wechsler Adult Intelligence Scale-Revised was used at agetwenty-one.
Besharov, Germanis, Higney, and Call 2: The Abecedarian Project
Frances Campbell, Frank Porter Graham Child Development Institute, e-mail message to Peter Germanis,12
January 12, 2001.
Assessments of Twenty-Six Early Childhood Evaluations 2-6
Table 2. Abecedarian Project: Effects on Achievement Test Scores
Reading scores Math scores
Age
(years)
Program group Control
group
Difference
(percentage
points)
Program
group
Control
group
Difference
(percentage
points)
8 94 85 9 98 92 6
12 91 85 6 92 87 5
15 94 89 5 94 87 7
21 93 88 6 89 84 5
Source: Frances A. Campbell, Elizabeth P. Pungello, Shari Miller-Johnson, Margaret Burchinal, and Craig T. Ramey,“The Development of Cognitive and Academic Abilities: Growth Curves from an Early Childhood EducationalExperiment,” Developmental Psychology 37, no. 2 (March 2001): 234.
Notes: Only significant differences are reported. “—” indicates that the difference is not statistically significant at the5 percent level. The Woodcock-Johnson Achievement Test for Reading and Math was used.
There were no statistically significant differences by gender or between the preschool-only and preschool plus K-2 program groups. As with IQ, the effects were largest for thesubgroup of children with mothers with low IQs.
School readiness/performance. At age fifteen, the Abecedarian program group had lessgrade retention (31 percent vs. 54 percent) and fewer special education placements (25 percentvs. 48 percent). At age twenty-one, however, there was no statistically significant difference inhigh school graduation rates between the program and control group. Frances Campbell, a seniorscientist at the FPG Child Development Institute, explains that the absence of a statisticallysignificant impact here may be due to the fact that the children lived in an area where it wasunusual for even high-risk students to drop out. The program group, however, experienced a 2112
percentage point increase in the percent who had ever enrolled in a four-year college (36 percentvs. 14 percent).
Socioemotional development. Relevant tests apparently not administered or results notreported.
Health. At age twenty-one, there were no statistically significant differences in varioushealth-related behaviors, including being a regular smoker, drinking any alcohol in the past thirtydays, or binge drinking in the past month.

Besharov, Germanis, Higney, and Call 2: The Abecedarian Project
Frances Campbell, Frank Porter Graham Child Development Institute, e-mail message to Peter Germanis,13
January 12, 2001.
Assessments of Twenty-Six Early Childhood Evaluations 2-7
Behavior. After three years of school, there were no statistically significant differencesin children’s behavior, based on parental responses to the Child Behavior Checklist.
Crime/delinquency. At age twenty-one, there were no statistically significantdifferences in self-reported misdemeanor convictions, felony convictions, or incarceration.While the Abecedarian group was less likely to have smoked marijuana in the past month (18percent vs. 39 percent), there was no statistically significant difference in the use of cocaine orother drugs.
Besides the possibility or probability that the program had no impact on crime, onereason for the absence of any apparent impact on this measure may have been the relatively lowcrime rate in the area in which the project operated, so that the rates were low for both thecontrol and program groups. Another possibility is that the project did not provide services toaddress this issue. Stevens Clarke, professor of Public Law and Government at the University ofNorth Carolina at Chapel Hill, examined the Abecedarian data. He explains that one differencebetween the Abecedarian Project and other programs that have found impacts in this area (mostnotably, the High/Scope Perry Preschool Project and the Syracuse Family DevelopmentProgram) is that the latter programs had a more intensive family involvement component duringthe treatment phase.13
Early/nonmarital births. The program group was more likely to delay having a firstchild. Only 26 percent of program group children reported becoming parents in their teens,compared to 45 percent of control group children. Among those who did have a child by agetwenty-one, the mean age at the birth of the first child was 19.1 years for the program group,compared to 17.7 years for the control group.
Economic outcomes. At age twenty-one, the employment rate was higher for theprogram group (64 percent vs. 50 percent), but the difference was not statistically significant.There were, however, differences in the reported skill levels of employment, with 47 percent ofthe program group reporting that they were in a skilled job, compared to 27 percent of thecontrol group. (Skill level was measured by the Hollingshead index.) There were no statisticallysignificant differences in various measures of self-sufficiency, such as maintaining a home,providing full support for themselves, or owning a car.
Effects on parents. Mothers who were teens when they enrolled in the project weremuch more likely to complete high school than were teen mothers in the control group (46percent vs. 13 percent). In addition, they were more likely to be employed when the childrenwere fifteen years old (92 percent vs. 66 percent). There was little difference for mothers whowere not teens at the time of enrollment.

Besharov, Germanis, Higney, and Call 2: The Abecedarian Project
W. Steven Barnett and Leonard N. Masse, “Comparative Benefit-Cost Analysis of the Abecedarian14
Program and Its Policy Implications,” Economics of Education Review 26 (2007): 113–125,
http://nieer.org/resources/research/BenefitCostAbecedarian.pdf (accessed October 20, 2010).
Other perspectives might also be examined. The “participant” perspective compares the benefits of a15
program to participants relative to the program costs they bear. The “social” perspective takes the point of view of
the society as a whole, which reflects both the “participant” and “taxpayer” perspectives. For example, the “social”
perspective would count increased participant earnings as a social benefit and increased administrative costs as a
social cost. In some cases, the benefits and costs counted by the “participant” and “taxpayer” perspectives offset
each other. For example, a program that reduces welfare payments would produce a cost to participants, but an
offsetting gain to taxpayers.
Leonard N. Masse and W. Steven Barnett, A Benefit Cost Analysis of the Abecedarian Early Childhood16
Intervention (New Brunswick, NJ: National Institute for Early Education Research, 2002), 45,
http://nieer.org/resources/research/AbecedarianStudy.pdf (accessed June 28, 2010).
Assessments of Twenty-Six Early Childhood Evaluations 2-8
Benefit-cost findings. Early childhood intervention programs are often justified on theassertion that they produce savings that exceed their costs. Masse and Barnett conducted apreliminary benefit-cost analysis of the Abecedarian project. Their analysis included benefits14
and costs to participants, their families, government, and the program itself. In this paper, weonly consider the project from the government’s perspective, to determine whether a programlike the Abecedarian project could save more in government expenditures than it cost, oftencalled the “taxpayer” perspective.15
Since program costs are incurred “up front” while some benefits and costs appear onlylater, the rate at which society is willing to tradeoff future benefits and costs for current benefitsand costs (the discount rate) affects the estimated “present value” of benefits and costs. For thepurpose of this analysis, all estimates are adjusted to 2005 dollars, using a 3 percent annualdiscount rate.
Costs. Masse and Barnett estimated the total, five-year cost of the Abecedarian Project tobe about $73,000 per child (undiscounted, in 2005 dollars). In a benefit-cost analysis, however,16
the focus is not on total costs, but on a comparison of net benefits to net costs. In an experimentalevaluation, for example, this means comparing the difference in dollars between program andcontrol group members for both benefits and costs. The net cost is the additional cost beyond thecost of child care for children in the control group. Masse and Barnett based their estimate of thecost of child care services for the control group children on: (1) participation data documentingtheir use of center-based child care; (2) estimates of the hours spent in center-based and informalcare arrangements (based on national data from the National Household Education Survey); (3)the price of child care (during preschool years only) for relative and non-relative care (estimatedusing data from the National Child Care Survey) and for center-based care (estimated at theaverage rate reported for centers accredited by the National Academy of Early ChildhoodPrograms in a U.S. Government Accountability Office report). In addition to the estimated out-of-pocket child care expenditures, Masse and Barnett added a cost for “parental care” for parents

Besharov, Germanis, Higney, and Call 2: The Abecedarian Project
An hour of parental care was valued at the price of non-relative care.17
Assessments of Twenty-Six Early Childhood Evaluations 2-9
who stay at home with their children. As a result, they estimated the five-year, net cost of the17
program (in 2005 dollars, using a 3 percent discount rate) to be about $38,900 per child.
Benefits. Estimated benefits were calculated in four main categories: earnings and fringebenefits of the participants’ mothers, the participants themselves, and future generations;education-related costs; health; and welfare use.
Masse and Barnett estimated the effect of the project on the child participants’ lifetimeearnings. Lacking direct information about earnings, they estimated earnings impacts based onthe differences in educational attainment at age twenty-one between those in the program groupand those in the control group. They also estimated future educational attainment and thenestimated earnings effects through age sixty-five. Using this approach, they estimated lifetimeearnings gains of about $40,700 per child participant. In addition, they estimated the impacts onearnings for the mothers (while they were between the ages of twenty-six and sixty) based ondifferences in earnings when the child participants were twelve, fifteen, and twenty-one years ofage. They assumed no change in the earnings differential between the two groups at younger andolder ages and thereby estimated lifetime compensation gains of $74,600 per mother. Finally,Masse and Barnett estimated the program’s effect on the earnings of future generations to beabout $6,200 per participant. The total lifetime compensation gains for children, their mothers,and future generations were estimated at about $121,500. This very large impact, however, wasachieved only by relying on highly uncertain assumptions about educational attainment andearnings differentials. Moreover, from the government’s budgetary standpoint, these earningsgains are relevant only in so far as they affect tax revenues and public outlays on welfare andother social programs. The impact of the project on these outcomes was largely ignored,however.
The savings (and costs) associated with schooling, including special education, werebased on school attendance patterns, using national estimates of the costs of regular educationand special education. The savings from reduced grade retention and special educationplacement were estimated to be about $9,600 per child participant. However, the added costs ofhigher education were estimated to be about $8,800 greater, since program group participantswere more likely to be attending postsecondary educational institutions at age twenty-one. Thenet effect on education-related costs, thus, was estimated to be a net savings of about $800 perchild participant.
At age twenty-one, the program group was less likely to use welfare (8 percent vs. 16percent), although this difference was not statistically significant. Nevertheless, Masse andBarnett estimated savings in welfare administrative costs of $215 per participant. (The authorsdid not estimate savings from welfare benefits as “a reduction in welfare payments to programparticipants represents a transfer of money to the general taxpayer and does not change total
Besharov, Germanis, Higney, and Call 2: The Abecedarian Project
W. Steven Barnett and Leonard N. Masse, “Comparative Benefit-Cost Analysis of the Abecedarian18
Program and Its Policy Implications,” Economics of Education Review 26 (2007): 119,
http://nieer.org/resources/research/BenefitCostAbecedarian.pdf (accessed October 20, 2010).
The question was worded: “How old were you when you started smoking on a regular basis?” 19
Lawrence J. Schweinhart, Helen V. Barnes, and David P. Weikart, Significant Benefits: The High/Scope20
Perry Preschool Study Through Age 27 (Ypsilanti, MI: High/Scope Press, 1993).
Frank Porter Child Development Institute, University of North Carolina, Chapel Hill, “High-Quality Child21
Care Returns Far More Than Cost - New Report,”(press release, Frank Porter Child Development Institute,
November 20, 2002).
Assessments of Twenty-Six Early Childhood Evaluations 2-10
social benefits associated with the program.”)18
The final component of the benefit-cost analysis was based on a relatively large, but notstatistically significant, program/control difference in those reporting to be “regular smokers” asyoung adults (39 percent vs. 55 percent). Masse and Barnett used estimates of life expectancy forthose who were or had been regular smokers at age twenty and the value of a life. They19
estimated savings of $19,300 for each child. The impact of smoking on total government costs,however, was not estimated. While publicly funded medical costs may be higher for smokers,transfer payments such as social security may be lower due to their shorter life expectancy. Also,reductions in smoking have been associated with improved birth outcomes, which could lead toreductions in future health and special education costs for the next generation. Insufficient detailis provided to assess this aspect of their estimates.
Notably, their benefit-cost analysis did not include savings due to reductions in crime-related costs. In the High/Scope Perry Preschool Project (see chapter 14), the largest societalsavings came from reductions in crime. As noted above, however, there were no statistically20
significant crime effects in the Abecedarian Project, so crime-associated public costs wereestimated to have zero dollar value.
Benefit-cost ratio. Masse and Barnett estimated that the Abecedarian Project had a netpresent value of $102,915 per child, saving $3.64 for every $1.00 spent. Table 3 summarizes thebenefits and costs of the program. Indeed, a press release from the FPG Child DevelopmentInstitute asserts that “For every dollar spent on high-quality early education programs, taxpayerscan expect four dollars in benefits.” 21
Most of the benefits in their analysis, however, accrued to individuals in the form ofgreater earnings, rather than to the taxpayer. (Moreover, most of the earnings gain was projectedand had not yet materialized.) Using their data, however, it is possible to estimate roughly thebenefits and costs to the government. The Masse and Barnett estimate of the participants’lifetime compensation gains can be used to estimate increased tax revenues. For example, in theHigh/Scope Perry Preschool evaluation, Barnett assumed that increased tax revenues would be
Besharov, Germanis, Higney, and Call 2: The Abecedarian Project
W. Steven Barnett, “Cost-Benefit Analysis,” in Significant Benefits: The High/Scope Perry Preschool22
Study Through Age 27 (Ypsilanti, MI: High/Scope Press, 1993), 143–73.
Assessments of Twenty-Six Early Childhood Evaluations 2-11
equal to 25 percent of the compensation gain. Applying the same assumption here results in22
estimated added tax revenues of about $10,200 from participants, about $1,550 from theirchildren, and $18,650 from the mothers of the child participants. In addition, as noted earlier, theestimate of the program’s net cost was based in part on an imputed parental cost for the controlgroup, which did not involve governmental payments. Excluding this “cost” raises the net cost ofthe Abecedarian intervention to $49,141. (Even this is a conservative estimate of thegovernment’s net costs, since it assumes that the government absorbed all of the child care costsfor control group children in center-based child care and other arrangements, which would beunlikely. Those payments made by parents themselves should be excluded from a benefit-costanalysis from the taxpayer perspective.) After making these modifications, this approachsuggests that the Abecedarian Project would save taxpayers only about 63 cents for each dollarspent. Given the uncertainty of the various estimated benefits of the program, this casts a largequestion mark over Abecedarian’s potential impact on government spending.

Besharov, Germanis, Higney, and Call 2: The Abecedarian Project
Assessments of Twenty-Six Early Childhood Evaluations 2-12
Table 3. Abecedarian Project: Estimated Net Benefits
Net benefits to:
Society (Masse/Barnett)
Taxpayers
(authors’ calculations)
Benefits
Education K-12 Higher education
$9,600 -$8,800
$9,600 -$8,800
Taxes Participants Children of child participants Maternal
———
$10,175 1,550 18,650
Earnings Participants Children of child participants Maternal
$40,700 $6,200 $74,600
———
Smoking $19,300 ?
AFDC $215 $215
Total benefits $141,815 $31,175
Program cost $38,900 $49,141(less parental cost)a
Net present value $102,915 -$17,976
Benefit-cost ratio $3.64/1 $0.63/1
Source: Adapted from Leonard N. Masse and W. Steven Barnett, A Benefit Cost Analysis of the Abecedarian EarlyChildhood Intervention (New Brunswick, NJ: National Institute for Early Education Research, 2002),http://nieer.org/resources/research/AbecedarianStudy.pdf (accessed June 28, 2010).Notes: In 2005 dollars discounted at 3 percent. The cost estimate used by Masse and Barnett included an imputed “parental cost” to families in the control group.a
This does not involve governmental payments. Excluding this “cost,” raises the net cost to $49,141 (authors’calculation).
Of course, this is still a crude estimate, as it is based on many assumptions and leaves outmany potential benefits and costs. Nevertheless, it highlights the sensitivity of these findings tothe assumptions behind them—especially concerning what is and is not included in the benefit-cost calculation—and the resulting uncertainty of benefit-cost claims.
Abecedarian’s relatively small sample size also adds uncertainty. In a reanalysis of theHigh/Scope Perry Preschool Project and the Parental/Early Infancy Project, Lynn Karoly and hercolleagues at RAND estimated savings in both projects of about $31,485 (in 2005 dollars), but
Besharov, Germanis, Higney, and Call 2: The Abecedarian Project
Authors’ estimate based on Lynn A. Karoly, Peter W. Greenwood, Susan S. Everingham, Jill Hoube, M.23
Rebecca Kilburn, C. Peter Rydell, Matthew Sanders, and James Chiesa, Investing in Our Children: What We Know
and Don’t Know About the Costs and Benefits of Early Childhood Interventions (Santa Monica, CA: RAND, 1998).
Frances A. Campbell, Craig T. Ramey, Elizabeth Pungello, Joseph Sparling, and Shari Miller-Johnson,24
“Early Childhood Education: Young Adult Outcomes from the Abecedarian Project,” Applied Developmental
Science 6, no. 1 (March 2002): 43.
Assessments of Twenty-Six Early Childhood Evaluations 2-13
cautioned that the true savings had a two-thirds chance of being between $24,000 and $36,000(and $18,000 to $42,000 using the standard 95 percent confidence interval). Since the23
Abecedarian Project’s sample size is in the same range as these other studies, similar confidencebands would probably apply here as well. Such wide confidence intervals also suggest thatconsiderable caution should be used in making claims about benefit-cost findings.
Hence, the benefit-cost findings are too speculative and uncertain to provide definitiveevidence on whether the program pays for itself. And, in fact, the principal investigators have notmade claims based on them.
Overall Assessment
The project was evaluated using random assignment and the researchers involveddescribed the evaluation procedures in considerable detail. However, the post-randomassignment refusal to participate in the evaluation of over 10 percent of families assigned to theprogram group raises the possibility of selection bias. In addition, the fact that the project wascomposed mainly of low-income, black children (at “high risk” of intellectual or academicfailure) in an otherwise affluent area, and the absence of successful replications raise questionsabout the generalizability of the findings.
Program theory. According to the UNC team:
The Abecedarian Project was theoretically grounded with a conceptual framework basedon General Systems Theory. From such a perspective, child development would beviewed as an ongoing process of interactions among hierarchical systems, ranging fromthat of the individual and factors that directly affect physical survival, to thepsychological, involving interactions with caregivers, social systems in homes, schools,and neighborhoods, and societal forces. . . . [The Theory] provides a framework showinghow changing the early environment, through supporting positive changes in children,could have long-term effects on later accomplishments.24
Based on this conceptual framework, one of the original purposes of the Abecedarian

Besharov, Germanis, Higney, and Call 2: The Abecedarian Project
Craig T. Ramey, M.C. Holmberg, J.H. Sparling, and A.M. Collier, “An Introduction to the Abecedarian25
Project,” in Infant Education: A Guide for Helping Handicapped Children in the First Three-Years, ed. Bettye M.
Caldwell and Donald J. Stedman (New York: Walker, 1977), as quoted in Herman H. Spitz, “Does the Carolina
Abecedarian Early Intervention Project Prevent Sociocultural Mental Retardation?” Intelligence 16, no. 2 (April-
May 1992): 17.
Herman S. Spitz, “Attempts to Raise Intelligence,” in The Development of Intelligence, ed. Mike26
Anderson (East Sussex: Psychology Press, 1999), 283.
Frances A. Campbell and Craig T. Ramey, “Effects of Early Intervention on Intellectual and Academic27
Achievement: A Follow-Up Study of Children from Low-Income Families, Child Development 65, no. 2 (April
1994): 685.
Herman S. Spitz, “Attempts to Raise Intelligence,” in The Development of Intelligence, ed. Mike28
Anderson (East Sussex: Psychology Press, 1999), 282-283.
Assessments of Twenty-Six Early Childhood Evaluations 2-14
project was to “demonstrate that sociocultural retardation can be prevented.” According to25
Herman Spitz, former director of the Research Department at the E.R. Johnstone Training andResearch Center in Bordentown, New Jersey, “As the Project director and his colleagues saw it,this type of mental retardation was a ‘sociocultural’ disorder, meaning that most children whowere mentally retarded and from poor environments were not born retarded. Rather, theirintelligence gradually descended into the mentally retarded range because of the inadequate andconfused inputs they experienced as they matured.”26
But, as Spitz points out, in later publications, the purpose was broadened to includeinvestigating “the degree to which mild retardation and school failure could be prevented.”27
Afterward, the purpose appears to have shifted to preventing “suboptimal cognitivedevelopment” and “school failure.” Spitz argues that this shift was because the Abecedarianteam “could not proved that they had prevented mental retardation unless the control groupdropped into the mentally retarded range. The failure of the mean score of the control group todrop to the mentally retarded level renders problematic any strong claim that the AbecedarianProject prevented mental retardation.” 28
The UNC team carefully examined a variety of outcomes, including IQ, achievement,and school readiness. Thus, despite the program’s evolving purpose, the evaluation seemsappropriate within the context of the underlying theory.
Program implementation. Relatively little information has been published regardingimplementation, for example, the participation patterns of program participants (and controlgroup children) in various program-related services. In any event, apparently, no seriousimplementation problems have been reported.
Assessing the randomization. Four cohorts of infants born between 1972 and 1977 wererandomly assigned in the study. The UNC team reports that: “Assignment was accomplished by
Besharov, Germanis, Higney, and Call 2: The Abecedarian Project
Craig T. Ramey and Frances A. Campbell, “The Carolina Abecedarian Project: An Educational29
Experiment Concerning Human Malleability,” in The Malleability of Children, ed. James J. Gallagher and Craig T.
Ramey (Baltimore, MD: Paul H. Brookes, 1987), 127–139.
Initially, 122 families were contacted and 121 agreed to participated. One mother miscarried, so 12030
families were randomly assigned. The sample included one set of identical twins and one pair of siblings, raising the
number of children to 122.
Frances A. Campbell and Craig T. Ramey, “Cognitive and School Outcomes for High-Risk African-31
American Students at Middle Adolescence: Positive Effects of Early Intervention,” American Educational Research
Journal 32, no. 4 (Winter 1995): 748.
The families should have been kept in the sample, even if it meant diluting the intervention. This way, if32
there had been an impact, we would have known that it was real. Even though the seven mothers in the program
group did not want to send their children to day care, they might have been willing to participate in the follow-up
data collection. Indeed, the incentives given control group members (free infant formula and disposable diapers)
could have been offered them as well to maintain their cooperation.
Robert St.Pierre, e-mail message to Peter Germanis, March 19, 2001.33
Assessments of Twenty-Six Early Childhood Evaluations 2-15
pair-matching children on the high-risk index scores and from a table of random numbersassigning one number of each pair to the experimental condition.” Most articles published by29
the UNC team describe the sample as having 111 children, 57 randomly assigned to thepreschool program group and 54 to preschool control group. In fact, 122 children were originallyassigned to the research sample, but 11 dropped out before participation began. If such attrition30
were random, this would not have been a serious problem, but this does not appear to have beenthe case. Of the eight mothers that refused to participate, seven were in the program group andone was in the control group. According to the UNC team, “The higher rate of rejection byfamilies offered the preschool treatment was generally related to mothers wanting to care forinfants in the home.” Simply dropping these cases undermined the integrity of random31
assignment. As Robert St.Pierre, former vice president and principal associate at Abt32
Associates Inc., notes:
If the cases had been kept in the data collection then the researchers could have done theanalysis with and without them, providing empirical evidence as to the importance ofthese cases. At the very least, it would have been helpful to know how the cases that weredropped compare to the cases that were retained. I assume that there are importantdifferences, as indicated by the mothers’ interest in caring for their children at home.33
Three other children were dropped. One retarded infant was removed from the programgroup because the project was not intended to serve retarded children. Two child abuse caseswere removed from the control group so they could receive the project’s services, but they were
Besharov, Germanis, Higney, and Call 2: The Abecedarian Project
Arguably, the child abuse cases too should have been retained in the research sample as control cases,34
even if it meant that some contamination crept in, since removing them undermined random assignment. While it is
unfortunate that these cases were removed, it is notable that it was only two cases.
This problem could be avoided simply by limiting the analysis to the older sibling.35
Assessments of Twenty-Six Early Childhood Evaluations 2-16
removed from the research sample. In sum, eight out of the eleven removed cases were in the34
program group, creating an immediate differential attrition rate. It would have been important toknow more about the characteristics of these families to see whether this introduced any bias.Although the UNC team reports that they found no systematic differences between refusingparents and other parents, it appears that they did not have very much data on which to make thiscomparison. As suggested by the following discussion, it is misleading to exclude these cases indiscussions about the comparability of the research groups, attrition, and potential biases, but itis too late to modify the analytic work to reflect their outcomes.
There are several other issues related to the random assignment of children. First, twosiblings were automatically assigned to the program group to avoid a family having children indifferent groups. The assignment of these siblings is somewhat problematic, since they have norandomly assigned counterpart, but given their small number, it is unlikely that this created aserious bias.35
Further, as noted earlier, most reports indicate that 111 children were randomly assigned,with 57 assigned to the program group and 54 assigned to the control group. Adding back thedropped cases (discussed earlier) resulted in eight more cases in the program group (or sixty-fivechildren) and three more in the control group (or fifty-seven children). The two siblings in theprogram group were automatically added to this group, suggesting that sixty-three families wereassigned to the program group and fifty-seven to the control group. Yet, because children werepaired and then randomly assigned, there should have been sixty families in each group; the factthat there were not suggests something else may have been amiss that was not reported.
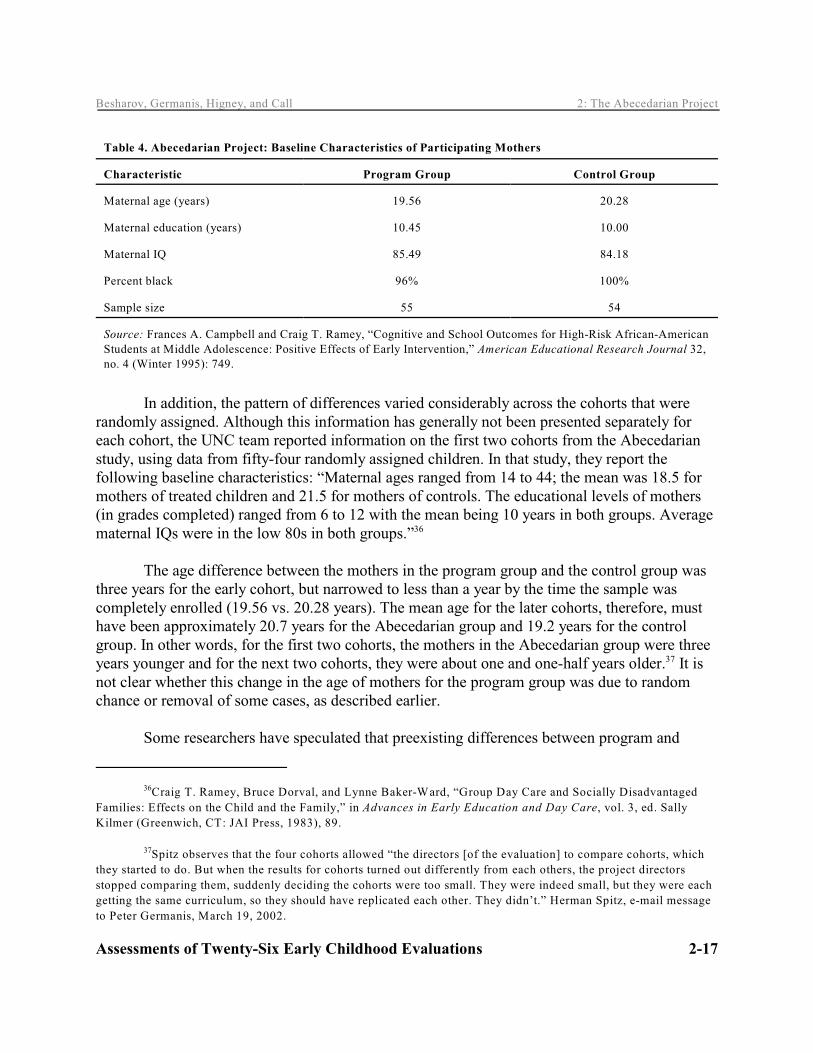
Table 4 shows the baseline characteristics of 109 families (representing 111 children).(The Abecedarian Project evaluations did not present baseline characteristics on all 122children.) Although the two groups look roughly similar, and there were no statisticallysignificant differences on these baseline measures, the program group mothers were about ninemonths younger, yet had half-a-grade more education. Unfortunately, most reports about thestudy present data on relatively few baseline characteristics, despite the fact many others wereapparently collected and used to calculate the high-risk index.
Besharov, Germanis, Higney, and Call 2: The Abecedarian Project
Craig T. Ramey, Bruce Dorval, and Lynne Baker-Ward, “Group Day Care and Socially Disadvantaged36
Families: Effects on the Child and the Family,” in Advances in Early Education and Day Care, vol. 3, ed. Sally
Kilmer (Greenwich, CT: JAI Press, 1983), 89.
Spitz observes that the four cohorts allowed “the directors [of the evaluation] to compare cohorts, which37
they started to do. But when the results for cohorts turned out differently from each others, the project directors
stopped comparing them, suddenly deciding the cohorts were too small. They were indeed small, but they were each
getting the same curriculum, so they should have replicated each other. They didn’t.” Herman Spitz, e-mail message
to Peter Germanis, March 19, 2002.
Assessments of Twenty-Six Early Childhood Evaluations 2-17
Table 4. Abecedarian Project: Baseline Characteristics of Participating Mothers
Characteristic Program Group Control Group
Maternal age (years) 19.56 20.28
Maternal education (years) 10.45 10.00
Maternal IQ 85.49 84.18
Percent black 96% 100%
Sample size 55 54
Source: Frances A. Campbell and Craig T. Ramey, “Cognitive and School Outcomes for High-Risk African-AmericanStudents at Middle Adolescence: Positive Effects of Early Intervention,” American Educational Research Journal 32,no. 4 (Winter 1995): 749.
In addition, the pattern of differences varied considerably across the cohorts that wererandomly assigned. Although this information has generally not been presented separately foreach cohort, the UNC team reported information on the first two cohorts from the Abecedarianstudy, using data from fifty-four randomly assigned children. In that study, they report thefollowing baseline characteristics: “Maternal ages ranged from 14 to 44; the mean was 18.5 formothers of treated children and 21.5 for mothers of controls. The educational levels of mothers(in grades completed) ranged from 6 to 12 with the mean being 10 years in both groups. Averagematernal IQs were in the low 80s in both groups.”36
The age difference between the mothers in the program group and the control group wasthree years for the early cohort, but narrowed to less than a year by the time the sample wascompletely enrolled (19.56 vs. 20.28 years). The mean age for the later cohorts, therefore, musthave been approximately 20.7 years for the Abecedarian group and 19.2 years for the controlgroup. In other words, for the first two cohorts, the mothers in the Abecedarian group were threeyears younger and for the next two cohorts, they were about one and one-half years older. It is37
not clear whether this change in the age of mothers for the program group was due to randomchance or removal of some cases, as described earlier.
Some researchers have speculated that preexisting differences between program and

Besharov, Germanis, Higney, and Call 2: The Abecedarian Project
Herman H. Spitz, “When Prophecy Fails: On Ramey’s Response to Spitz’s Critique of the Abecedarian38
Project,” Intelligence 17, no. 1 (January–March 1993): 20.
For more on the debate regarding this issue, see Herman H. Spitz, “Does the Carolina Abecedarian Early39
Intervention Project Prevent Sociocultural Mental Retardation?,” Intelligence 16, no. 2 (April–June 1992): 225–237;
Craig T. Ramey, “A Rejoinder to Spitz’s Critique of the Abecedarian Project,” Intelligence 17, no. 1
(January–March 1993): 25–30; Herman H. Spitz, “When Prophecy Fails: On Ramey’s Response to Spitz’s Critique
of the Abecedarian Project,” Intelligence 17, no. 1 (January–March 1993): 17–23; and Herman H. Spitz, “Spitz’s
Reply to Ramey’s Response to Spitz’s First Reply to Ramey’s First Response to Spitz’s Critique of the Abecedarian
Project,” Intelligence 17, no. 1 (January–March 1993): 31–35.
Richard Herrenstein and Charles Murray, The Bell Curve: Intelligence and Class Structure in American40
Life (New York: The Free Press, 1994), 407.
Examples include the evaluations of the Infant Health and Development Program (see chapter 16), the41
Comprehensive Child and Development Program (see chapter 3), Early Head Start (see chapter 6), and the Head
Start Impact Study (chapter 13).
Assessments of Twenty-Six Early Childhood Evaluations 2-18
control group children account for some of the observed impacts. For example, Spitz has notedthat the IQ gain at six months was only slightly lower than at age five, leading him to questionthe value of the additional “4.5 years of continuing intervention, 5 full days a week, 50 weeks ayear.” He further wondered whether the differences at six months were due to the intervention38
or to differences in preexisting characteristics of the children and their families. Richard39
Herrenstein, then professor of psychology at Harvard University, and Charles Murray, BradleyFellow at the American Enterprise Institute, offer a similar explanation for this anomaly:
Perhaps the intervention had achieved all its effects in the first months or the first year ofthe project (which, if true, would have important policy implications). Or perhaps theexperimental and control groups were different to begin with (the sample sizes for any ofthe experimental or control groups was no larger than fifteen and as small as nine, sorandom selection with such small numbers gives no guarantee that the experimental andcontrol groups will be equivalent). To make things still more uncertain, test scores forchildren younger than 3 years are poor predictors of later intelligence test scores, and testresults for infants at the age of 3 or 6 months are extremely unreliable. It would thereforebe difficult in any case to assess the random placement from early test scores. The debateover the results is ongoing . . . .40
Assessing statistical controls in experimental and nonexperimental evaluations.Given the use of random assignment, concerns about selection bias in the Abecedarian Projectare relatively small. As previously noted, the program and control groups were comparable on anumber of maternal characteristics, including high-risk index scores, maternal age, maternaleducation, maternal IQ, race, and percent living in an intact family. But, they were not identical,and the UNC team did not control for these differences, as has been common practice in manylarge-scale evaluations. In addition, as noted, the exclusion of eleven children whose mothers41
Besharov, Germanis, Higney, and Call 2: The Abecedarian Project
Even adding the eleven children lost due to the randomization problem described above results in an42
attrition rate of just 15 percent (18 children of 122 randomly assigned).
Assessments of Twenty-Six Early Childhood Evaluations 2-19
refused to participate after being randomly assigned presents a source of potential bias.
Sample size. The original sample in the Abecedarian Project consisted of 111 children.With such a small sample, only large effects would have produced statistically significantfindings. Thus, the absence of effects in some areas does not mean that the program did notaffect these outcomes, but that the effects may have been too small to be detected with thesample size. A small sample also means that differences in baseline characteristics would alsohave to be very large to be statistically significant, making it more difficult to assess thecomparability of the program and control groups.
Attrition. There was minimal attrition in the project. Although various reports producedabout the Abecedarian Project detail the extent of attrition and the reasons for it, they do notdescribe the characteristics of those dropped from the Abecedarian evaluation. Although thesample size varied somewhat depending on the year of follow-up, about 90 to 104 of therandomly assigned children have been included in most analyses. At age twenty-one, 104children were included in the analysis, representing an attrition rate of just 6 percent (assuming abase of 111 children). This was remarkably little attrition, especially compared to other42
projects, such as the evaluation of the Early Head Start program, which had an attrition rateexceeding 30 percent for most outcomes after just two years.
The UNC team noted that the subjects lost to attrition did not differ from the originalsample in terms of any entry level characteristics, but they did not specify the characteristicsexamined. Moreover, they based this comparison not on the original sample of 122, but on thealready reduced sample of 111. Given the low rate of attrition (even using the 122 child sampleas a base), attrition-related bias is not likely to be a serious concern, with one possible exception.Seven of the eight mothers that refused to participate after being randomly assigned were in theprogram group (and thus represented over 10 percent of that group). To the extent that theirinterest in being with their children also affected their children’s outcomes, this disproportionateloss may have biased the findings.
Data collection. The data collection relied on a wide range of tests and survey results.The data sources are appropriate for the questions being studied and are relatively complete. Theuse of administrative data, however, was limited. The confidence surrounding some of thesurvey findings, particularly those dealing with employment, welfare use, and crime could havebeen strengthened by obtaining data from various administrative services, such asUnemployment Insurance records for employment and earnings.
Measurement issues. Most outcomes were measured using widely recognized measures,such as various IQ and achievement tests (such as the Wechsler Preschool and Primary Scale of

Besharov, Germanis, Higney, and Call 2: The Abecedarian Project
Craig T. Ramey, Frances A. Campbell, Margaret Burchinal, Martie L. Skinner, David M. Gardner, and43
Sharon L. Ramey, “Persistent Effects of Early Childhood Education on High-Risk Children and Their Mothers,”
Applied Developmental Science 4, no. 1 (January 2000): 4,
http://web.pdx.edu/~stipakb/download/PA555/EarlyChildhoodEducStudy.pdf (accessed June 28, 2010).
Janet Currie and Duncan Thomas, “Does Head Start Make a Difference?” American Economic Review 85,44
no. 3 (June 1995): 341–364.
Assessments of Twenty-Six Early Childhood Evaluations 2-20
Intelligence), school records, and periodic surveys.
Generalizability. The Abecedarian Project was composed almost exclusively of blackchildren, despite the fact that black children were a distinct minority in the area. For example, 80percent of the children in the school district were white and only 14 percent were black.According to the UNC team:
It is important to note that the Abecedarian Project was located in a generally affluentcollege town where the vast majority of families were well-educated. Thus, there wererelatively few families in the local population who would be consideredsocioeconomically at-risk. Those who did fit this category tended to be of African-American descent.43
There were also a wide range of public and private services for those in need, including those inthe control group, and the schools to which many of the children went were good.
The elementary and secondary schools that the Abecedarian children subsequentlyattended tended to be better than those of many other early childhood interventions. This is animportant point, because some researchers have hypothesized that the subsequent schoolingexperiences of children may affect the permanency of gains. For example, University ofCalifornia, Los Angeles economists Janet Currie and Duncan Thomas estimated the persistenceof Head Start gains by examining how the effects varied by the age of the child (see chapter 5).44
They found that both white and black children who participated in Head Start had statisticallysignificant gains of nearly seven percentile points on the Peabody Picture Vocabulary Test. Byage ten, the gains for whites were about five percentage points, but the gains for blacks hadfaded out and were no longer evident. They hypothesized that the apparent impact of Head Startmay have depended on the child’s home background and the quality of schools attended afterHead Start graduation.
Thus, the findings may generalize primarily to localities where poor children are ineducationally well-off communities. Of even greater importance is that the Abecedarian childrenwere chosen because—beyond just being poor—they were at risk of intellectual or academicfailure.
In addition, the study was conducted over thirty years ago and may not be applicable to

Besharov, Germanis, Higney, and Call 2: The Abecedarian Project
Jonathan Crane, “Building on Success,” in Social Programs That Work, ed. Jonathan Crane (New York:45
Russell Sage Foundation, 1998), 22. The other outlier is the Milwaukee Project (see chapter 17).
There were some positive effects for the subgroup of heavier low-birthweight infants, but these too46
showed a pattern of fading as the children grew older.
Frank Porter Graham Child Development Institute, University of North Carolina, Chapel Hill, Early47
Learning, Later Success: The Abecedarian Study (Chapel Hill, NC: Frank Porter Child Development Institute,
1999), 2, http://www.fpg.unc.edu/~abc/ells-04.pdf (accessed June 29, 2010).
Assessments of Twenty-Six Early Childhood Evaluations 2-21
the current early education environment.
Replication. Despite major efforts, the project has not been replicated successfully. AsJonathan Crane, director of the National Center for Research on Social Programs, cautions:
The program has not been formally upscaled or replicated. Because of the lack ofreplication, there is no information on the relationship between effect size andimplementation fidelity or site experience. The most important reason for pause is thatsimilar early intervention programs have not had consistent long-term effects oncognitive test scores . . . It is possible that the Abecedarian Project is simply one of tworandom outliers.45
Indeed, the Infant Health and Development Project (IHDP) (see chapter 16), which was modeledafter the Abecedarian Project and conducted by an independent research firm, failed to achievelong-term gains in IQ or test scores. There were, however, important differences in the target46
population and duration of services between the two programs, which could account for some ofthe difference in impacts. For example, the Abecedarian Project targeted low-income/high-riskfamilies, whereas the IHDP was aimed at low-birthweight children. In addition, the AbecedarianProject provided services from birth to five years (and beyond, for some children), whereasIHDP services were limited to children from birth to age three. (Other replications could includethe Milwaukee Project (although conducted earlier; see chapter 17) and CARE; however,because of their methodological flaws, we do not consider these valid replications.)
Evaluator’s description of findings. Staff of the Frank Porter Graham ChildDevelopment Institute (FPG) has reported their findings with full confidence in the success oftheir program. A press release from the FPG Child Development Institute declares: “Theimportance of high quality, educational childcare from early infancy is now clear.” Although47
the findings may be promising, they are certainly not definitive, and do not provide a “clear”indication that high quality care is effective. In fact, this is but one study in one Southeasterntown including mainly black children and thus cannot be generalized widely, especially in lightof the disappointing findings of the IHDP and other early childhood interventions.
Age of entry is another important, but unresolved issue. As the authors themselves
Besharov, Germanis, Higney, and Call 2: The Abecedarian Project
Frances A. Campbell, Elizabeth P. Pungello, Shari Miller-Johnson, Margaret Burchinal, and Craig T.48
Ramey, “The Development of Cognitive and Academic Abilities: Growth Curves from an Early Childhood
Educational Experiment,” Developmental Psychology 37, no. 2 (March 2001): 239.
Frances A. Campbell, Elizabeth P. Pungello, Shari Miller-Johnson, Margaret Burchinal, and Craig T.49
Ramey, “The Development of Cognitive and Academic Abilities: Growth Curves from an Early Childhood
Educational Experiment,” Developmental Psychology 37, no. 2 (March 2001): 236.
Assessments of Twenty-Six Early Childhood Evaluations 2-22
concede, further investigation is necessary: “Given that age of entry was confounded with otherfactors such as duration of treatment in this study, firm conclusions concerning the importance ofbeginning intervention in infancy cannot be drawn, but the results strongly support the furtherinvestigation of this factor in early intervention studies.” Thus, we cannot be sure that the48
effects were achieved because the project started in early infancy or because it lasted as long as itdid, or for some other reason. It could be that participation in the later preschool years was moreimportant (a finding that seems possibly consistent with some of the High/Scope Perry Preschoolfindings).
Evaluator’s independence. On the one hand, some of the evaluators, including Rameyand Campbell, were closely associated with the FPG Child Development Institute. On the otherhand, their findings have been published many times in peer-reviewed journals. Additionally,Masse and Barnett conducted independent analyses of the data in the course of their benefit-costanalysis.
Statistical significance/confidence intervals. Statistical significance was measured andreported at the 5 percent level.
Effect sizes. Effect sizes were calculated and reported, using two different calculationmethods. Under the first method, the difference in the mean scores between the treatment groupand the control group was divided by the pooled sample standard deviation (SD=6.30); andunder the second method, the difference was divided by the standard deviation of the WechslerIQ tests (SD=15), resulting in a more conservative estimate. At age four (the midpoint of thetreatment period), the reported effect size for cognitive test scores was 1.75 SD using the firstmethod and 0.74 SD using the second method. At age fifteen (the midpoint of the follow-upperiod), the reported effect size for cognitive scores was 0.87 using the first method and 0.37using the second method. These effect sizes were based on statistically significant impacts.
The UNC team describe these effects as meaningful, noting, “Educators consider effectsizes of 0.25 or greater to have practical significance (Cohen 1977). . . . even the moreconservative estimates are in the range considered educationally meaningful, and both estimatesfor the period of time during the treatment are considered large.” Based on traditional49
demarcations, this conclusion seems reasonable. (See Appendix 1 for a further discussion ofeffect sizes and their interpretation.)

Besharov, Germanis, Higney, and Call 2: The Abecedarian Project
Assessments of Twenty-Six Early Childhood Evaluations 2-23
Sustained effects. The Abecedarian evaluation examined impacts through age twenty-one.
Benefit-cost analysis. A benefit-cost analysis was conducted, but not by the principalinvestigators of the study. The analysis, however, was from the perspective of society as awhole. It did not include the participant or taxpayer perspectives.
Cost-effectiveness analysis. Apparently not performed.

Besharov, Germanis, Higney, and Call 2: The Abecedarian Project
Craig T. Ramey and Frances A. Campbell are both affiliated with the Frank Porter Graham Child*
Development Institute at the University of North Carolina. Craig T. Ramey was the principal investigator of the
original study, and Frances A. Campbell was the principal investigator of the age twenty-one and later follow-up
studies.
Assessments of Twenty-Six Early Childhood Evaluations 2-24
Commentary
Craig T. Ramey and Frances A. Campbell*
We appreciate the invitation to comment on the chapter summarizing and interpreting theoutcomes from the Abecedarian Project. Brief comments on key criticisms follow.
Concerns about bias due to differential refusal of group assignment
The writers raise questions about initial random assignment and the fact that “over 10%”of the treated sample refused their random assignments.
The initial randomization procedures for the Abecedarian study met accepted scientificstandards. The sampling plan involved sampling with replacement. Once a sufficiently large poolof potential participants was identified, families within it were randomly assigned to either thetreatment or the control group. While in the ideal world, everyone who met recruitment criteriawould accept their randomly assigned group, this rarely happens. The accepted practice in a caseof refusal is to sample for cases to replace slots in the group where the refusal occurred, not fordouble that number when there would be no comparable slot in the other group. This explainswhy, if more persons offered treatment chose not to accept, more families would necessarilyhave been assigned to the treated group.
Selection bias would result if parents who refused treatment differed from those whoremained in the program in ways that interacted with treatment to affect children’s outcomes. Ifthis were the case, significant differences between parents who refused to participate and thosewho accepted their assignment would be found, and treatment would significantly interact withthe relevant parental characteristic, thus causing a differential effect of treatment on childoutcomes. We have not found systematic differences between refusing parents and other

Besharov, Germanis, Higney, and Call 2: The Abecedarian Project
Sandra L. Martin, Craig T. Ramey, and Sharon Ramey, “The Prevention of Intellectual Impairment in1
Children of Impoverished Families: Findings of a Randomized Trial of Educational Daycare,” American Journal of
Public Health 80, no. 7 (July 1990): 844–47.
Craig T. Ramey, Keith O. Yeates, and Elizabeth J. Short, “The Plasticity of Intellectual Development:2
Insights from Preventive Intervention,” Child Development 55, no. 5 (October 1984): 1913–1925; and Margaret R.
Burchinal, Frances A. Campbell, Donna M. Bryant, Barbara M. Wasik, and Craig T. Ramey, “Early Intervention and
Mediating Processes in Intellectual Development Among Low-Income African American Children,” Child
Development 68, no. 5 (October 1997): 935–954.
Craig T. Ramey, Keith O. Yeates, and Elizabeth J. Short, “The Plasticity of Intellectual Development:3
Insights from Preventive Intervention,” Child Development 55, no. 5 (October 1984): 1913–1925; and Margaret R.
Burchinal, Frances A. Campbell, Donna M. Bryant, Barbara M. Wasik, and Craig T. Ramey, “Early Intervention and
Mediating Processes in Intellectual Development Among Low-Income African American Children,” Child
Development 68, no. 5 (October 1997): 935–954.
Sandra L. Martin, Craig T. Ramey, and Sharon Ramey, “The Prevention of Intellectual Impairment in4
Children of Impoverished Families: Findings of a Randomized Trial of Educational Daycare,” American Journal of
Public Health 80, no. 7 (July 1990): 844–47; and Frances A. Campbell and Craig T. Ramey, “Cognitive and School
Outcomes for High-Risk African-American Students at Middle Adolescence: Positive Effects of Early Intervention,”
American Educational Research Journal 32, no. 4 (Winter 1995): 743–772.
Assessments of Twenty-Six Early Childhood Evaluations 2-25
parents. Neither have we found differences by family characteristic interactions. There is no1 2
indication that initial bias artificially inflated the treatment effect.
The assertion that any treatment gains in the program “appear to have been concentratedamong the subgroup of children whose mothers had IQs below 70 at the time of entry tothe study”
This statement could only be true had the Abecedarian data shown a treatment bymaternal IQ interaction when predicting child IQ. We have tested for such interactions and notfound them. In contrast, our results demonstrate that treatment and maternal IQ contribute3
independently to children’s cognitive growth. The writers of this chapter may have beenconfused by the fact that the size of the treatment/control IQ difference among the few childrenof such mothers has been described on at least two occasions. In both instances, the information4
provided was descriptive. Neither article reports an analysis in which the model tested included aterm for the interaction of maternal IQ and treatment. In analyses where this interaction has beentested, it was not similarly in the treated and control group children and the effects of treatmentdo not vary by maternal IQ. Therefore, the statement that treatment benefits “appear to have beenconcentrated among the subgroup of children whose mothers had IQs below 70 at the time ofentry to the study” reflects a basic misunderstanding of the body of results published over theyears in the refereed literature.
Concerns that the effect of treatment on cognitive function was small

Besharov, Germanis, Higney, and Call 2: The Abecedarian Project
Jacob Cohen, Statistical Power Analysis, 2 ed. (Hillsdale, NJ: Lawrence Erlbaum Associates, Inc, 1988).5 nd
Frances A. Campbell, Elizabeth P. Pungello, Shari Miller-Johnson, Margaret R. Burchinal, and Craig T.6
Ramey, “The Development of Cognitive and Academic Abilities: Growth Curves from an Early Childhood
Educational Experiment,” Developmental Psychology 37, no. 2 (March 2001): 231–244.
Craig T. Ramey and Frances A. Campbell, “Preventive Education for High-Risk Children: Cognitive7
Consequences of the Carolina Abecedarian Project,” American Journal of Mental Deficiency 88, no. 5 (March
1984): 515–523; Craig T. Ramey, and Frances A. Campbell, “Poverty, Early Childhood Education and Academic
Competence: The Abecedarian experiment,” in Children in Poverty: Child Development and Public Policy, ed.
Aletha C. Houston (New York: Cambridge University Press, 1991), 190-221; Frances A. Campbell and Craig T.
Ramey, “Effects of Early Intervention on Intellectual and Academic Achievement: A Follow-Up Study of Children
from Low-Income Families, Child Development 65, no. 2 (April 1994): 687–689; Frances A. Campbell and Craig T.
Ramey, “Cognitive and School Outcomes for High-Risk African-American Students at Middle Adolescence:
Positive Effects of Early Intervention,” American Educational Research Journal 32, no. 4 (Winter 1995): 743–772;
and Frances A. Campbell, Elizabeth P. Pungello, Shari Miller-Johnson, Margaret R. Burchinal, and Craig T. Ramey,
“The Development of Cognitive and Academic Abilities: Growth Curves from an Early Childhood Educational
Experiment,” Developmental Psychology 37, no. 2 (March 2001): 231–244.
Assessments of Twenty-Six Early Childhood Evaluations 2-26
The most widely accepted guidelines for evaluating effect sizes suggest that effect sizes5
(d: computed as a difference in group means divided by the relevant standard deviation) shouldbe regarded as small when d=.20, moderate when d=.50, and large when d is .80 or higher.Based on Cohen’s definitions, the treatment/control group effect sizes for cognitive outcomesqualify as large when the pooled sample standard deviation is used to compute it (the mostappropriate method since the findings generalize specifically to a high-risk sample) and small tomoderate when the test standard deviation is used (one that is based on a sample that includeshigh and low risk individuals). Furthermore, it is noteworthy that, through age twenty-one, the6
intellectual test score functions for the treated and control groups do not converge, but ratherchange in parallel after the early childhood years. Longitudinal analyses (repeated-measuresdesign) conducted at several points over the course of the study always show a significantdifference between the intellectual test scores of the treated and control groups. In addition, the7
preschool treatment/control group differences in intellectual test scores has been examinedseparately at thirteen time points between the ages of two and twenty-one years. Statisticallysignificant group differences were seen at eleven of the thirteen isolated points.
Far more important is the fact that in young adulthood the treated group demonstratedimportant real-life benefits in terms of better scores on objective reading and mathematics tests,reductions in early childbearing, more years of education attained, and employment in higherlevel jobs (discussed in more detail below).
Concerns that treatment effects were not linked to educational or employment outcomes inearly adulthood
This assertion appears to be based on the finding of no treatment/control differences inhigh school graduation or overall employment rates in young adulthood. However, this is

Besharov, Germanis, Higney, and Call 2: The Abecedarian Project
Frances A. Campbell, Craig T. Ramey, Elizabeth Pungello, Joseph Sparling, and Shari Miller-Johnson,8
“Early Childhood Education: Young Adult Outcomes from the Abecedarian Project,” Applied Developmental
Science 6, no. 1 (January 2002): 42–57.
James Heckman, “What’s Good Early Childhood Education Worth and Why?” (discussant, Biennial9
Meeting of the Society for Research in Child Development, Tampa, FL, April 26, 2003).
Assessments of Twenty-Six Early Childhood Evaluations 2-27
misleading because it ignores several significant outcomes found in the age twenty-one follow-up study.
For example, we learned at the age twenty-one assessment that, compared with thecontrol group, the individuals in the treatment group had significantly more years of education (abenefit with a significant treatment by gender interaction, indicating it was largely limited tofemales) and were significantly more likely to hold a job ranked four or higher on theHollingshead scale (a benefit not limited to females). We assume that, in pointing out the genderdifference in years of education attained, the writers did not intend to imply that this in any waydiminished the importance of this post-secondary education gain. More four-year college oruniversity (the gateway to professional jobs) is a benefit that did not show a significant treatmentby gender interaction, and thus, one that could be applied both to males and females.
As published in one of the peer-reviewed articles reporting the young adult findings the8
individuals in the treatment group were significantly more likely than the individuals in thecontrol group to be engaged in either higher education or skilled/professional level employment.Thus, the fact that, at age twenty-one, for the preschool treatment and control groups, there weresimilar rates of high school graduation and of employment at any level, does not equate to therebeing no group differences in post-secondary educational attainment or employment in higher-level jobs.
Concerns that cost-benefit figures are inflated
A noted economist, Dr. Steve Barnett, of the National Institute for Early EducationResearch, and his student, Dr. Leonard Masse, have conducted an independent cost-benefitanalysis of the Abecedarian Project. However, we would like to note that the Nobel Prize-winning economist, Dr. James Heckman of the University of Chicago, has examined Masse andBarnett’s work and did not raise these concerns. Instead, Dr. Heckman argued that cost-benefit9
analyses to date, including this one of the Abecedarian study along with others, indicate thatearly childhood programs offer one of the best opportunities for our society to further economicgrowth and for children from low-income families eventually to achieve betters lives.
Conclusions
In summary, the authors have raised a number of concerns about the study’s methods andalso question whether the findings support the value of early childhood education. In general,

Besharov, Germanis, Higney, and Call 2: The Abecedarian Project
Assessments of Twenty-Six Early Childhood Evaluations 2-28
they have highlighted non-significant treatment/control differences found (e.g., similar rates ofhigh school graduation, overall employment, and lawbreaking at age twenty-one) whiledownplaying a number of significant findings (e.g., better reading and math achievement scores,higher rates of attendance at four-year college or universities, employment in higher-level jobs,and reductions in early childbearing). That a well-controlled experimental study of an earlychildhood program could demonstrate such important real-life benefits years after treatmentended offers strong support for providing early learning supports for children who grow up inpoverty.
Note: This report is open to public comments, subject to review by the forum moderator. To

Besharov, Germanis, Higney, and Call 2: The Abecedarian Project
Assessments of Twenty-Six Early Childhood Evaluations 2-29
leave a comment, please send an email to [email protected] or fill out the commentform at http://www.welfareacademy.org/pubs/early_education/chapter2.html.