2 related work - dbd.puc-rio.br
TRANSCRIPT

Related Work 32
2 Related Work
In this chapter we present a few major works that motivated us to conduct
this research towards the conception of the CEE Conceptual model, presented
formally in Chapter 3. In what follows we justify the choice of the selected
technologies used in CEE answering the following questions:
Why use Workflow Management Systems (WfMS) and Grid Computing
(GC) infrastructure.
Why use Virtual Reality Visualization technology.
Why use a Service Oriented Architecture (SOA) for the implementation of
CEE.
2.1. Workflow Management Systems and Grid Computing
Since the last decade, several industries have been improving their
operations through the adoption of Workflow Management Systems (WfMS).
Those systems allowed them to improve the management of activities and the
flow of information in the organization through the restructuring of their business
processes known as Business Process Management (BPM) [BPMI]. Initially the
WfMS were associated to the automation of business processes, during which,
documents, information and/or tasks are passed from one participant (human
being or machine) to another for the accomplishment of an action, in agreement
with a set of defined rules. Such systems have enabled productivity
enhancements in tasks such as processing of customers purchase orders,
invoice processing, authority-for-expenditure management, etc.
For the oil & gas industry, especially in production operations, there are
innumerous advantages for adopting Workflow Management Systems. The
automation of engineering processes not only requires fewer workers to manage
the same assets but also allows knowledge to be transferred between workforce
generations in the form of well documented, previously tested and standardized
workflows. Thus new employees will be able to accomplish the same work with
less experience and knowledge. Moreover the increasing complexity of
Related Work 33
production operations requires the management of larger data sets, more precise
decision making, and creates opportunities for optimization through more
sophisticated control mechanisms. Therefore, Engineering Workflows constitute
an adequate tool to embrace all these challenges.
Recently, several industries have begun focusing on Scientific and
Engineering Workflows (ScWfMS) that differ in many ways from Business
Workflows. Scientific Workflows gained wide acceptance in the field of
bioinformatics in the early 2000s [VEG07]. While Business Workflows tend to
deal with discrete transactions, Scientific and Engineering Workflows tend to deal
with large data quantities, multiple data sources in multiple formats, and multiple
interconnected tools. New software tools and architecture can be created to
standardize Engineering Workflows by bringing together data from
heterogeneous systems and consolidating separate engineering capabilities
within a single platform.
2.1.1. Data Driven Multiphysics Simulation Framework (DDMSF)
In Reservoir Engineering, the need to perform extensive reservoir studies
for either uncertainty assessment or optimal exploitation plans brings up
demands of computing power and data management in a more extended way.
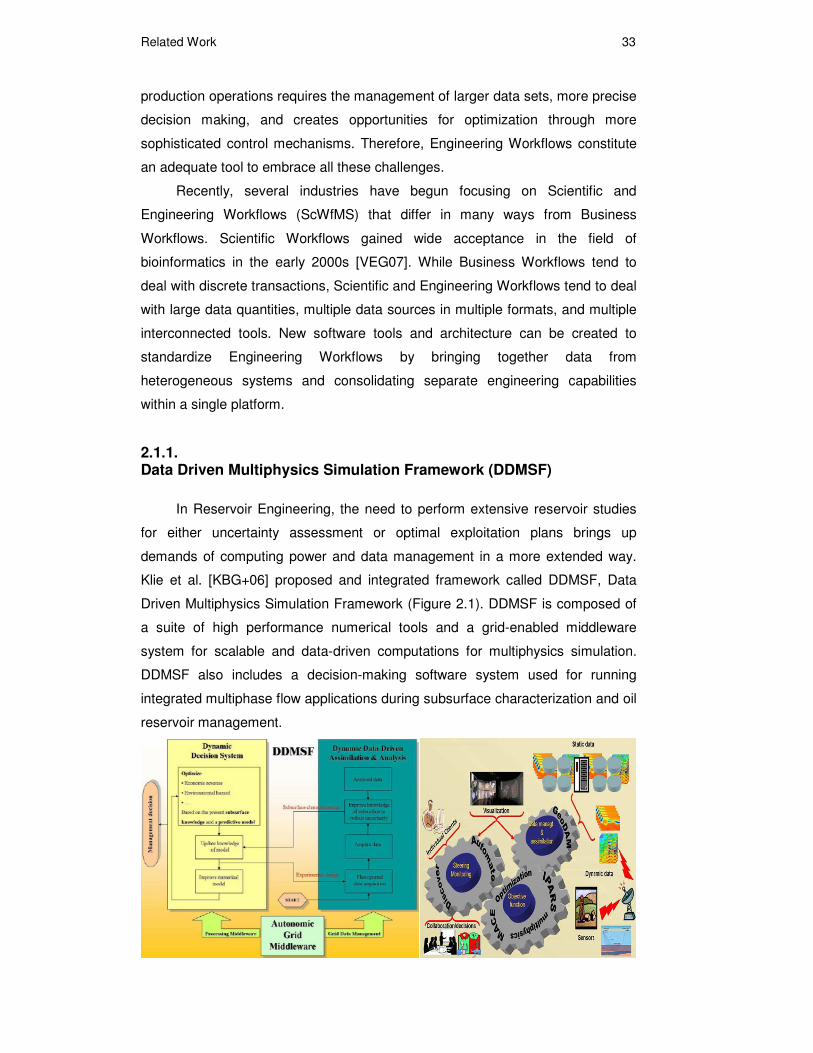
Klie et al. [KBG+06] proposed and integrated framework called DDMSF, Data
Driven Multiphysics Simulation Framework (Figure 2.1). DDMSF is composed of
a suite of high performance numerical tools and a grid-enabled middleware
system for scalable and data-driven computations for multiphysics simulation.
DDMSF also includes a decision-making software system used for running
integrated multiphase flow applications during subsurface characterization and oil
reservoir management.

Related Work 34
Figure 2.1: DDMSF and its components. Architecture (left) and interaction scenario
(right).
The proposed suite of tools and systems consists of
� IPARS – a scalable and integrated multi-physics/multi-block
reservoir simulator (encompassing flow, geomechanics,
petrophysics and seismic);
� Seine/MACE (multiblock adaptive computational engine), SPSA
(simultaneous perturbation stochastic approximation) and the
VFSA (very fast simulated annealing), very efficient stochastic
optimization algorithms (global, local and hybrid approaches)
executing on distributed computing systems on the grid;
� GeoDAM – a geosystem data access and management software
component for storing, querying, and retrieving distributed data
archives of historical, experimental (e.g., data from field sensors)
and simulated data;
� Discover - a decentralized grid middleware service that provide
secure and coordinated access to the resources and information
required by the simulations;
� External services that provide data, such as current oil market
prices, relevant to the optimization of oil production or the
economic profit.
The aforementioned components offer enormous potential for performing
data-driven studies and efficient execution of complex, large-scale reservoir
models in a collaborative environment. In Figure 2.1 the right side illustrates the
interaction scenario of all these components for the optimal reservoir
management carried on with DDMSF.
Dynamic data-driven approaches are increasingly becoming more feasible
because of the confluence of several technologies. First, advanced sensor
technologies have improved the ability to capture data faster and at higher
resolution. Second, Grid Computing (GC) is making possible to realize large-
scale, complex numerical models [FKN+01, FKN+02a, FKN+02b]. GC
infrastructure aims to dynamically and seamlessly link powerful and remote
resources to support the execution of large scale and disparate processes
characterizing a particular problem. In order to harness wide-area network of
resources into a distributed system, many researchers have been focused on
developing grid middleware frameworks, protocols, programming and runtime

Related Work 35
environments. These efforts have led to the development of middleware tools
and infrastructures such as Globus [FK99], Condor-G [FTF+01], Storage
Resource Broker [RWM+02] and others.
Among all DDMSF components, the Discover Computational Collaboratory
[MP03] strongly inspired the solution proposed here. Its overall objective is to
realize a CPSE that enables geographically distributed scientists and engineers
to collaboratively monitor, interact with, and control high performance
applications in a truly pervasive manner, transforming high-performance
simulations into modalities for research and instruction. Key features of Discover
include a collaborative portal for interaction and control, mechanisms for web-
based runtime visualization, scalable interaction and collaboration servers that
reliably provide uniform access to remote distributed applications, and also
security, authentication and access control mechanisms that guarantee
authorized access to applications.
2.1.2. Wind Tunnel
Paventhan et al. [PTC+06] proposed the creation of a Scientific Workflow
for wind tunnel applications. They observed that scientific and engineering
experiments often produce large volumes of data that should ideally be
processed and visualized in near real-time. The difficulty to achieve this goal is
that the overall turnaround time from data acquisition, movement to a data
processor and visualization of he results is frequently inhibited by factors such as
manual data movement, system interoperability issues, manual resource
discovery for job scheduling and disparate physical locality between the
experiment and the scientist or engineer workstation. They argued that
customized application specific workflows can reduce the time taken to
accomplish a job by automating data flow driven activities, supplementing or
replacing manual user-driven tasks.

Related Work 36
Figure 2.2: Sequential workflow using customized wind tunnel grid activities.
Two different approaches based on Windows Workflow Foundation (WWF),
an extensible framework for developing workflow solutions were implemented.
The WWF is a component of Microsoft WINFX [WINFX07]. It has a predefined
set of activities (if-else, while, parallel, invoke WebService and so on), and allows
the creation of user-defined custom activities. The first approach consisted of the
extension of WINFX workflow activities to deliver a set of application-specific
wind tunnel activities allowing the users to compose sequential workflows and
seamlessly access Globus Grid services using a .NET-based Commodity Grid
Toolkit created by the authors, MyCoG.NET [PT05]. Figure 2.2 shows a
sequential workflow designed using customized wind tunnel grid workflow
activities. The DAQevent is a customized event driven activity, that upon
completion of the data acquisition, verifies the raw data files for completeness
and in case of success enables workflow transition to next activity. The
MyGridFTP, MyGRAM and MyMDS activities use MyCoG.NET Commodity
Toolkit to access Globus resources. These Grid service access activities are
further customized for individual experiments, as is the case of Upload and
FetchResults which are activities derived from MyGridFTP, for respectively
automatic uploading of raw data files from Data Acquisition host to GRAM-server
(Grid Resource Allocation Management) and transfer of the results from GRAM-
server to WWF server and to the user's desktop.

Related Work 37
In the second approach, they presented a database-centric architecture for
wind tunnel experimental workflow that hosts both data and processing. The
strategy is to run the data parallel code on a database cluster that hosts both
experimental data and user algorithms. The customized database activity set will
allow the user to compose workflows based on this approach. With the rapidly
evolving capabilities of Database Management Systems (DBMS) such as high-
level language stored procedures (Java, C#, etc.), native support for XML, XML
Web Services and Transactional Messaging are changing the role of DBMS in
Scientific Workflows.
2.1.3. Vistrails
Vistrails [CFS+06] is a visualization management system developed at the
University of Utah. It provides a Scientific Workflow infrastructure which can be
combined with existing visualization systems and libraries. A key feature that sets
Vistrails apart from other Visualization Systems as well as Scientific Workflow
Systems is the support for data exploration. It separates the notion of dataflow
specification from its instances. A dataflow instance consists of a sequence of
operations used to generate a specific visualization.
Data provenance, i.e., the capacity of maintaining information of how a
given data product was generated [SPG05], has many uses, from purely
informational to enabling the representation of the data product. By maintaining a
detailed data provenance infrastructure of the exploration process, in a structured
way, with a flexible XML schema to represent different kinds of dataflows, the
system allows the visualization experiments to be queried and mined. Users can
query a set of saved dataflows to locate a suitable one for the current task; query
saved dataflow instance to locate anomalies documented in annotations of
previously generated visualizations; locate data products and visualizations
based on the operations applied in a dataflow; cluster dataflows based on
different criteria; etc. With Vistrails, users have the ability to steer their own
simulations.
Data provenance is a very important feature for any CPSE because
scientists and engineers often create several variations of a workflow in a trial-
and-error process when solving a particular problem. Data exploration through
visualization requires scientists and engineers to go through several steps. In
essence, they need to assemble complex workflows that consist of dataset

Related Work 38
selection, specification of series of operations that need to be applied to the data,
and creation of appropriate visual representations, before they can finally view
and analyze the results. Usually, insight comes from comparing the results of
multiple visualizations that are created during the data exploration process.
Unfortunately, today this exploratory process is far from interactive and contains
many error-prone and time-consuming tasks.
Figure 2.3: The Vistrails Builder (left) and Vistrails Spreadsheet (right)
Vistrails manage both the data and metadata associated with visualization
products. Users create and edit data flows using the Vistrails Builder user
interface. The dataflow specifications are saved in the Vistrails Repository. Users
may also interact with saved dataflows by invoking them through the Vistrails
Server, through a web-based interface, or by importing them into the Vistrails
Visualization Spreadsheet. Each cell in the spreadsheet represents a view that
corresponds to a dataflow instance; users can modify the parameters of a
dataflow as well as synchronize parameters across cells (Figure 2.3). Dataflow
execution is controlled by the Vistrails Cache Manager, which keeps track of
operations that are invoked and their respective parameters. Vistrails Cache
Manager infrastructure was implemented using Kepler [LAB+06, Kepler 07].
2.1.4. Discussion
Scientific Workflows and Grid Computing enable the development of
complex engineering simulations. The ability to compose, design and execute
rapid prototyping of experiments, provided by ScWfMS together with the grid

Related Work 39
philosophy of "on-demand" availability of computational resources are valuable
features for LSEP.
The capacity of sharing resources across organizational boundaries
provided by a grid computing infrastructure gives a lot of flexibility for LSEP,
allowing the execution of engineering simulations “transparently everywhere”.
2.2. Virtual Reality Visualization Technology
Visualization is an important component for many PSEs. For example,
Parker et al. [PMH+98] describe SCIRun [SCIRun], a PSE that allows users to
interactively compose, execute, and control a large-scale computer simulation by
visually "steering" a dataflow network model. SCIRun supports parallel computing
and output visualization, but originally has no mechanisms for experiment
managing and archiving, optimization, real-time collaboration, or modifying the
simulation models themselves.
Paraview [Paraview] is a kind of PSE for visualization that allows the
interactive creation and manipulation of complex visualizations. Paraview is also
based on the notion of dataflow, and provides visual interfaces to produce
visualizations by assembling pipelines out of modules that are connected in a
network. However, both SCIRun and Paraview have important limitations which
hamper their ability to support the data exploration process. First, there is no
separation between the definition of a dataflow and its instances. In order to
execute a given dataflow with different parameters (e.g., different input files),
users need to manually set these parameters through a GUI — clearly this
process does not scale to more than a few visualizations. Second, modifications
to parameters or to the definition of a dataflow are destructive — no change
history is maintained. This places the burden on the scientist to first construct the
visualization and then to remember the values and the exact dataflow
configuration that led to a particular image.
Despite their limitations, SCIRun and Paraview show the importance of
combining visualization with PSE. As we pointed out before in Chapter 1, the
importance of three-dimensional modeling and visualization has led engineering
companies to increasingly adopt the use of VRCs in order to favor visual
communication in technical work sessions and decision-making meetings. In this
kind of environment, collaboration is greatly improved, as compared to the use of
desktop displays, mainly due to fact that people share the same physical space,

Related Work 40
with their attention dedicated to large-size representation of their models,
facilitating the communication of concepts and reducing misunderstandings.
2.2.1. Immersive Well Path Planning
In the Upstream segment of the oil & gas industry, the determination of
optimal well locations is a challenging problem for Reservoir engineers since it
depends on geological and fluid properties as well as on economic parameters
[KBW+04].
Figure 2.4 : IDP Desktop interface and an IDP user interacting with the virtual world.
Gruchalla [Gru04] investigated the benefits of immersive VR for well-path
editing. He reported speed and accuracy improvements of immersive systems
over desktop system, based in a study with 16 participants who planned the
paths of four oil wells. Each participant planned two well paths on a desktop
workstation with a stereoscopic display and two well paths in a CAVE-like
[CS+92] Immersive Virtual Environment (IVE) (Figure 2.4). Fifteen of the
participants completed well path editing tasks faster in the IVE than in the
desktop environment. The increased speed in the IVE was complimented by a
statistically significant increase in correct solutions. The results suggest that an
IVE allows for faster and more accurate problem solving in a complex interactive
three dimensional domain. The Immersive Drilling Planner is a long-term project
to explore the impact of immersive visualization for drilling, in an effort to reduce
drilling costs, risks, and time spent [DVRC].
2.2.2. VRGeo Demonstrator
The VRGeo Consortium [VRGeo] is an oil and gas international consortium
for developing visualization technology for Geosciences and Engineering
Related Work 41
applications in Virtual Environments (VEs), conducted by Fraunhofer
Gesellschaft (FhG, Germany)1.
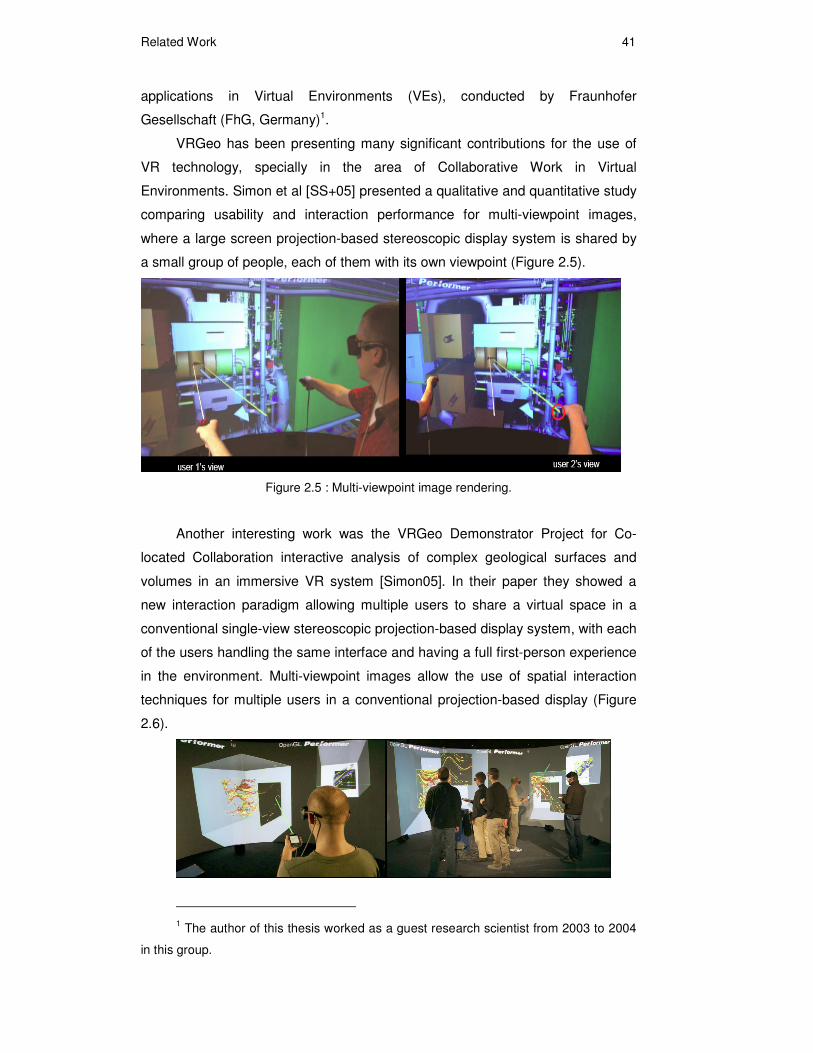
VRGeo has been presenting many significant contributions for the use of
VR technology, specially in the area of Collaborative Work in Virtual
Environments. Simon et al [SS+05] presented a qualitative and quantitative study
comparing usability and interaction performance for multi-viewpoint images,
where a large screen projection-based stereoscopic display system is shared by
a small group of people, each of them with its own viewpoint (Figure 2.5).
Figure 2.5 : Multi-viewpoint image rendering.
Another interesting work was the VRGeo Demonstrator Project for Co-
located Collaboration interactive analysis of complex geological surfaces and
volumes in an immersive VR system [Simon05]. In their paper they showed a
new interaction paradigm allowing multiple users to share a virtual space in a
conventional single-view stereoscopic projection-based display system, with each
of the users handling the same interface and having a full first-person experience
in the environment. Multi-viewpoint images allow the use of spatial interaction
techniques for multiple users in a conventional projection-based display (Figure
2.6).
1 The author of this thesis worked as a guest research scientist from 2003 to 2004
in this group.

Related Work 42
Figure 2.6 : Multiple users interacting with multiple workspaces.
2.2.3. Geological-Mapping and Displacement Analysis (GMDA)
In the Geology field, Kreylos et al [KBB+06] presented an approach for
turning immersive visualization software into scientific tool. They created
immersive visualization measurement and analysis tools that allow scientists to
use real word skills and methods inside Virtual Environments. They emphasized
that VR visualization alone is not sufficient to enable an effective work
environment. They have also conducted some informal studies to determine the
impact of using VR methods on some geosciences tasks such as Geological-
Mapping (identification of structures; facets, folded layers of rock and geomorphic
features) and Displacement Analysis (measure the deformation of the Earth’s
surface and of natural or man-made structures due of geological events such as
landslides, floods or earthquakes). Although not being a quantitative study, due
to the small numbers of participants, they observed that VR visualization enabled
scientists to make more accurate observations in less time, and to be more
confident about their observations.
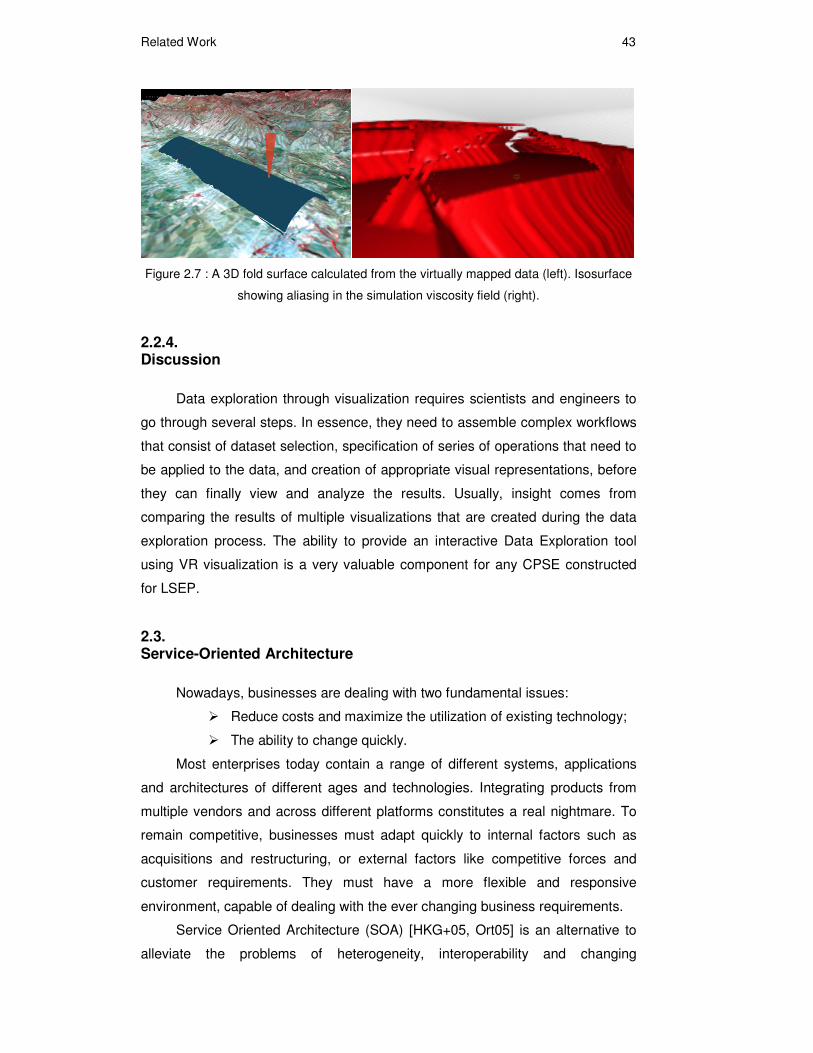
Another very important result, that has caught our attention, was the usage
of their system as a debugging tool for Finite Element Method (FEM) simulations.
Through the coupling of their VR visualization system and a FEM simulator they
could solve a convergence failure in their simulation of a Plate Subduction
analysis in the Aleutian chain region. For such a problem scientists use
Computational Fluid Dynamics (CFD) to investigate the fact of tectonic plates
entering the Earth’s mantle in the vicinity of subduction zones. After having failed
to find the cause of the problem using conventional tools, only by exploring their
data in the VR application they could find the reason. There were several regions
where one component of the simulation input exhibited severe aliasing that
resulted in numerical convergence and stability problems as can be seen in the
Figure 2.7-right.
Related Work 43
Figure 2.7 : A 3D fold surface calculated from the virtually mapped data (left). Isosurface
showing aliasing in the simulation viscosity field (right).
2.2.4. Discussion
Data exploration through visualization requires scientists and engineers to
go through several steps. In essence, they need to assemble complex workflows
that consist of dataset selection, specification of series of operations that need to
be applied to the data, and creation of appropriate visual representations, before
they can finally view and analyze the results. Usually, insight comes from
comparing the results of multiple visualizations that are created during the data
exploration process. The ability to provide an interactive Data Exploration tool
using VR visualization is a very valuable component for any CPSE constructed
for LSEP.
2.3. Service-Oriented Architecture
Nowadays, businesses are dealing with two fundamental issues:
� Reduce costs and maximize the utilization of existing technology;
� The ability to change quickly.
Most enterprises today contain a range of different systems, applications
and architectures of different ages and technologies. Integrating products from
multiple vendors and across different platforms constitutes a real nightmare. To
remain competitive, businesses must adapt quickly to internal factors such as
acquisitions and restructuring, or external factors like competitive forces and
customer requirements. They must have a more flexible and responsive
environment, capable of dealing with the ever changing business requirements.
Service Oriented Architecture (SOA) [HKG+05, Ort05] is an alternative to
alleviate the problems of heterogeneity, interoperability and changing
Related Work 44
requirements. SOA provides a platform for building application services with the
following characteristics: loose coupling, location transparency and protocol
independence. Based on SOA, a service consumer does not even have to care
about a particular service it is communicating with, because the underlying
infrastructure, or service “bus”, will make an appropriate choice on behalf of the
consumer. The infrastructure hides as many technicalities as possible from a
requestor. Wrapping a well defined service invocation interface around a
functional module hides implementation details from other service requestors.
Thus, particularly, technical specificities from different implementation
technologies do not affect SOA participants. It is also possible to reconsider and
substitute a service implementation for another one with an improved
implementation, or with better quality of service characteristics.
2.3.1. Real-Time Architecture Project (RTAP)
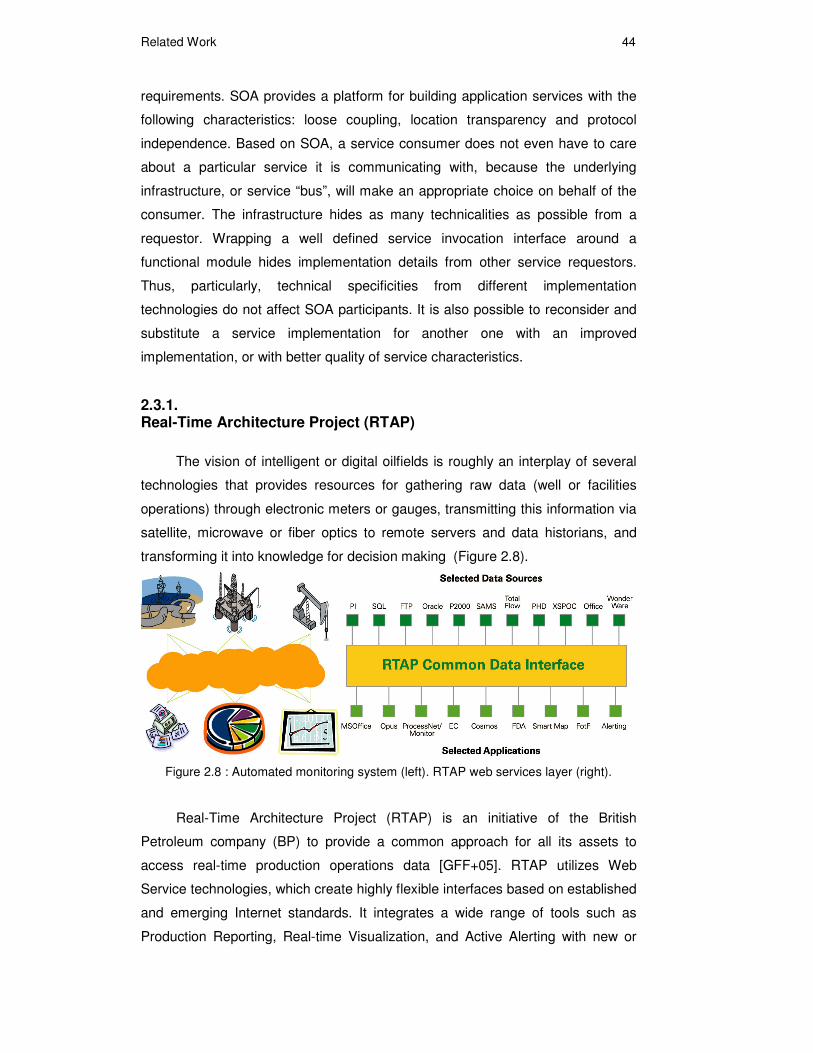
The vision of intelligent or digital oilfields is roughly an interplay of several
technologies that provides resources for gathering raw data (well or facilities
operations) through electronic meters or gauges, transmitting this information via
satellite, microwave or fiber optics to remote servers and data historians, and
transforming it into knowledge for decision making (Figure 2.8).
Figure 2.8 : Automated monitoring system (left). RTAP web services layer (right).
Real-Time Architecture Project (RTAP) is an initiative of the British
Petroleum company (BP) to provide a common approach for all its assets to
access real-time production operations data [GFF+05]. RTAP utilizes Web
Service technologies, which create highly flexible interfaces based on established
and emerging Internet standards. It integrates a wide range of tools such as
Production Reporting, Real-time Visualization, and Active Alerting with new or

Related Work 45
existing data sources of many kinds. BP has already implemented this solution in
many locations and in a number of business units, providing many common
applications with access to a dozen commercial and proprietary data sources
(Figure 2.8).
The ultimate goal of RTAP is to implement a common, standards-based
architecture for data access and integration, replacing the large number of
custom, proprietary interfaces currently in use. Since RTAP launching some
years ago, significant progress has been made toward this goal, with the intent of
expanding the current implementation to a next generation SOA in the near
future.
2.3.2. Integrated Asset Management framework (IAM)
Another SOA application that influenced this research is the Integrated
Asset Management framework (IAM). IAM provides to its users a front-end
modeling environment for specifying and executing a variety of workflows from
reservoir simulations to economic evaluation [SBO+06]. The IAM framework is
intended to facilitate seamless interaction of diverse and independently
developed applications that accomplish various sub-tasks in the overall workflow.
For instance, with IAM a user can pipe the output of a reservoir simulator running
on one machine to a forecasting and optimization toolkit running on another node
and in turn piping its output to a third piece of software that can convert the
information into a set of reports in a specified format (Figure 2.9).
Figure 2.9: IAM graphical modeling tool (left) and its architecture (right).
IAM adopted a service-oriented approach where every component,
regardless of its functionality, resource requirements, language of
implementation, etc., provides a well-defined service interface that can be used

Related Work 46
by any other component in the framework. The service abstraction provides a
uniform way to mask a variety of underlying data sources (real-time production
data, historical data, model parameters, reports, etc.) and functionalities
(simulators, optimizers, sensors, actuators, etc.). Workflows can be composed by
coupling service interfaces in the desired order, through a graphical modeling or
textual front-end and the actual service calls can be generated automatically.
Data composition is one of the key components of the IAM framework. It
refers to a general process of applying a variety of intermediate transformations
to data as it flows from one service to another as part of a larger workflow.
Automating data flow among multiple information consumers will greatly expedite
many workflows by eliminating the typically laborious tasks involved in manual
preparation of data for input to various tools. In order to enable a Data
composition perspective they created the following components and services:
� Data sources. The production data and the recovery curve
catalog are the sources of ‘raw’ data that could be stored in a
standard database. Access to the database could be through a
web service that provides a query interface for data retrieval and
update;
� Aggregation service. A software module aggregates time-based
raw data (from production as well as simulation), and generates
type curves along the desired dimensions - e.g., cumulative oil
production vs. reservoir pressure;
� Pattern matching service. This software module accepts a set of
reference curves from the catalog and a type curve derived from
the production data, and performs pattern matching to estimate
the best fit.
Figure 2.9-left illustrates the use of their graphical modeling tool for building
a highly simplified real-time reservoir management workflow. In this workflow, a
catalog of type curves is available from a series of a priori reservoir simulation
runs. The curves in the catalog correspond to a set of differing models of the
reservoir. As real world production data from the reservoir becomes available, it
is periodically compared to the type curves in the catalog to estimate the best fit.
The type curve(s) that best matches the production data at a given time could
then be used as input to other disjoint workflows such as oil production
forecasting.

Related Work 47
2.3.3. Discussion
We argue that SOA offer to Large Scale Engineering Projects a number of
compelling benefits for allowing the development of a flexible and stable
architecture. Through the use of its three main concepts - loose coupling, location
transparency and protocol independence – a Problem Solving Environment
developed for a LSEP using an SOA will be able to:
� respond efficiently to changes in the business and competitive
landscape,
� reuse of legacy system while enhancing integration;
� reduce overall technology development costs by:
o leveraging functions already built into legacy system
services;
o reusing services developed for other process;
o simplifying maintenance and support through elimination of
redundant and siloed applications.
2.4. CEE Main Ideas
The work of the Data Driven Multiphysics Simulation Framework (DDMSF)
and the former OE characteristics discussed in chapter 1, pointed out to the
necessity of integrating a myriad of different applications to solve common OE
problems (Figure 2.1). This motivated us to the pursuit of an Enterprise
Application Integration (EAI) for CEE. Recently, EAI has been greatly simplified
by the adoption of an SOA integrated with an Enterprise Service Bus [HKG+05].
In Chapter 4 we provide more detailed information about the usage of ESB in the
CEE SOA architecture.
Wind Tunnel provides a series of workflow activities allowing the users to
compose sequential workflows and seamlessly access Grid services (Figure 2.2).
The Wind Tunnel approach also inspired the development of our CEE by
combining the ScWfMS with the execution of engineering applications in a Grid
infrastructure computing environment through the use of Grid Resource
Allocation & Management (GRAM) job submission.
The Vistrails approach inspired our CEE strategy, but some of the
differences of the CEE are the use of a BPEL (Business Process Execution
Related Work 48
Language) ScWfMS, the focus on immersive and realistic visualization and the
absence of data provenance support.
The VRGeo Demonstrator’s collaboration capabilities showed the benefits
of collaboration in a Virtual Environment for interpreting geological data (Figure
2.6) or investigating platform 3D CAD models (Figure 2.5). This is a very
important feature for our CEE which has the Offshore Engineering field as its
main target (see Chapter 1).
As shown by GMDA, the usage of a VR Visualization system to debug
engineering simulations is a very powerful tool for Large Scale Engineering
Projects. Their observation that VR visualization enabled scientists to make more
accurate observations in less time and with more confidence has also motivated
to include a VR Visualization system as an important component of the CEE
architecture. The fact that VR visualization alone is not sufficient to enable an
effective work environment has stimulated us to create additional tools for the VR
Visualization component of CEE (CEE-VRV). Some of those tools are
Annotations and Measurements and are discussed further in the Collaborative
Tools section in Chapter 3.
The IAM project has inspired very much the CEE architecture. The
adoption of an SOA with services encapsulated as components motivated us to
use a Service Component Architecture [SCA] in the development of the CEE.
To finalize this chapter we present a comparison of the features provided
by CEE and the features presented by the related solutions. It can be seen from
this comparison that CEE has a wider spectra addressing the most important
requirements of Large Scale Engineering Projects.

Related Work 49
Table 2.1 Feature comparisons between CEE and related solutions