2- phase relations · 2019-03-09 · phase relations 9 17 definitions bulk, saturated, dry and...
TRANSCRIPT

Phase Relations 1
1
2
Phase Relations

Phase Relations 2
Rock and Soil: A 3-Phase Material
Solid
WaterAir
4
Three Phase Diagram
Solid
Air
Water
Mineral Skeleton Idealization:
Three Phase Diagram
Phase Relations 3
5
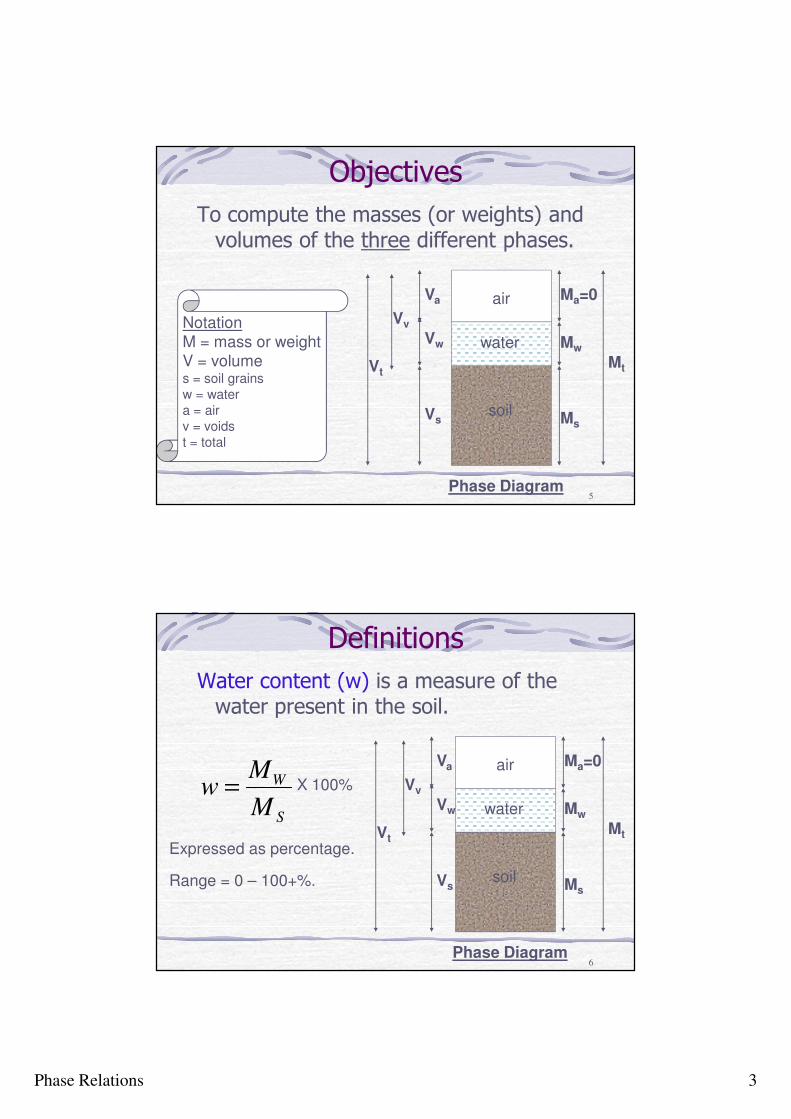
Objectives
To compute the masses (or weights) and volumes of the three different phases.
soil
air
water
Vs
Va Ma=0
Ms
Mw
Mt
Vw
Vv
Vt
Phase Diagram
Notation
M = mass or weight
V = volumes = soil grains
w = water
a = air
v = voids
t = total
6
Definitions
Water content (w) is a measure of the water present in the soil.
soil
air
water
Vs
Va Ma=0
Ms
Mw
Mt
Vw
Vv
Vt
Phase Diagram
S
W
M
Mw =
Expressed as percentage.
Range = 0 – 100+%.
X 100%

Phase Relations 4
7
Definitions
Void ratio (e) is a measure of the void volume.
soil
air
water
Vs
Va Ma=0
Ms
Mw
Mt
Vw
Vv
Vt
Phase Diagram
S
V
V
Ve =
8
Definitions
Porosity (n) is also a measure of the void volume, expressed as a percentage.
soil
air
water
Vs
Va Ma=0
Ms
Mw
Mt
Vw
Vv
Vt
Phase Diagram
T
V
V
Vn = X 100%
Theoretical range: 0 – 100%

Phase Relations 5
9
Definitions
Degree of saturation (S) is the percentage of the void volume filled by water.
soil
air
water
Vs
Va Ma=0
Ms
Mw
Mt
Vw
Vv
Vt
Phase Diagram
V
W
V
VS =
Range: 0 – 100%
X 100%
Dr
y Saturate
d
10
A Simple Example
water
air
soil
In this illustration,
e = 1
n = 50%
S = 50%
Phase Relations 6
11
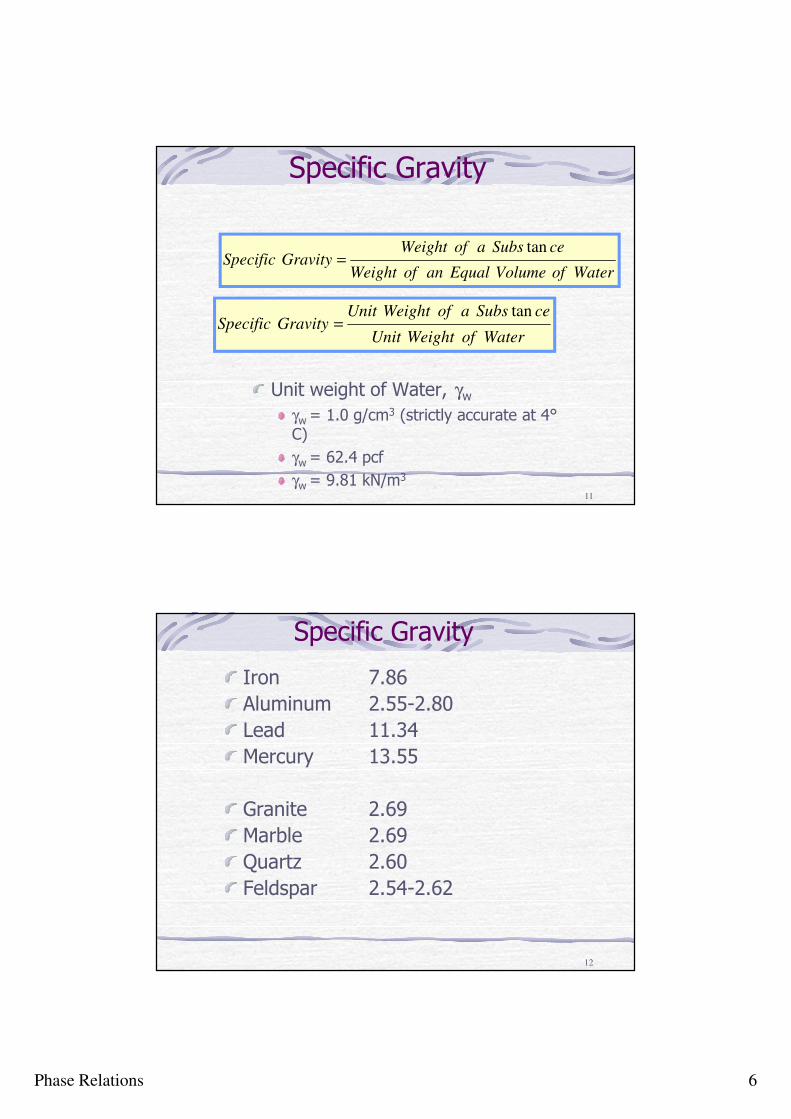
Specific Gravity
Unit weight of Water, γw
γw = 1.0 g/cm3 (strictly accurate at 4°
C)
γw = 62.4 pcf
γw = 9.81 kN/m3
WaterofVolumeEqualanofWeight
ceSubsaofWeightGravitySpecific
tan=
WaterofWeightUnit
ceSubsaofWeightUnitGravitySpecific
tan=
12
Specific Gravity
Iron 7.86
Aluminum 2.55-2.80
Lead 11.34
Mercury 13.55
Granite 2.69
Marble 2.69
Quartz 2.60
Feldspar 2.54-2.62
Phase Relations 7
13
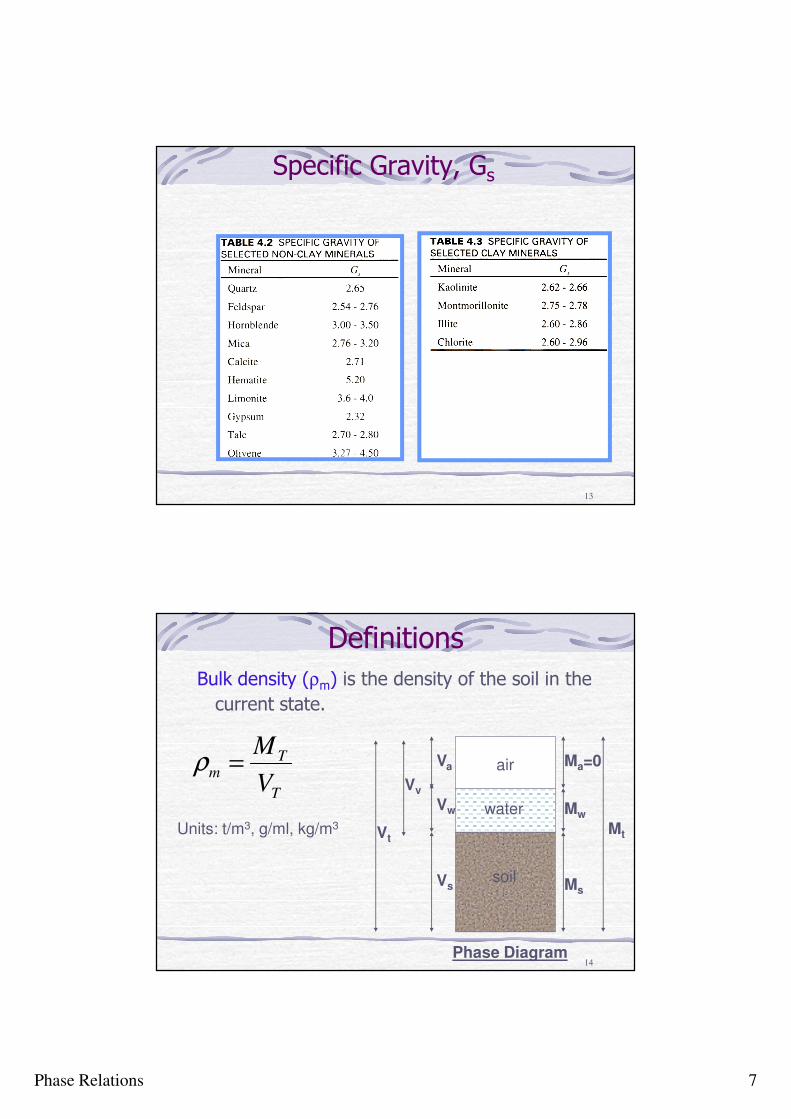
Specific Gravity, Gs
14
Definitions
Bulk density (ρm) is the density of the soil in the
current state.
soil
air
water
Vs
Va Ma=0
Ms
Mw
Mt
Vw
Vv
Vt
Phase Diagram
T
Tm
V
M=ρ
Units: t/m3, g/ml, kg/m3
Phase Relations 8
15
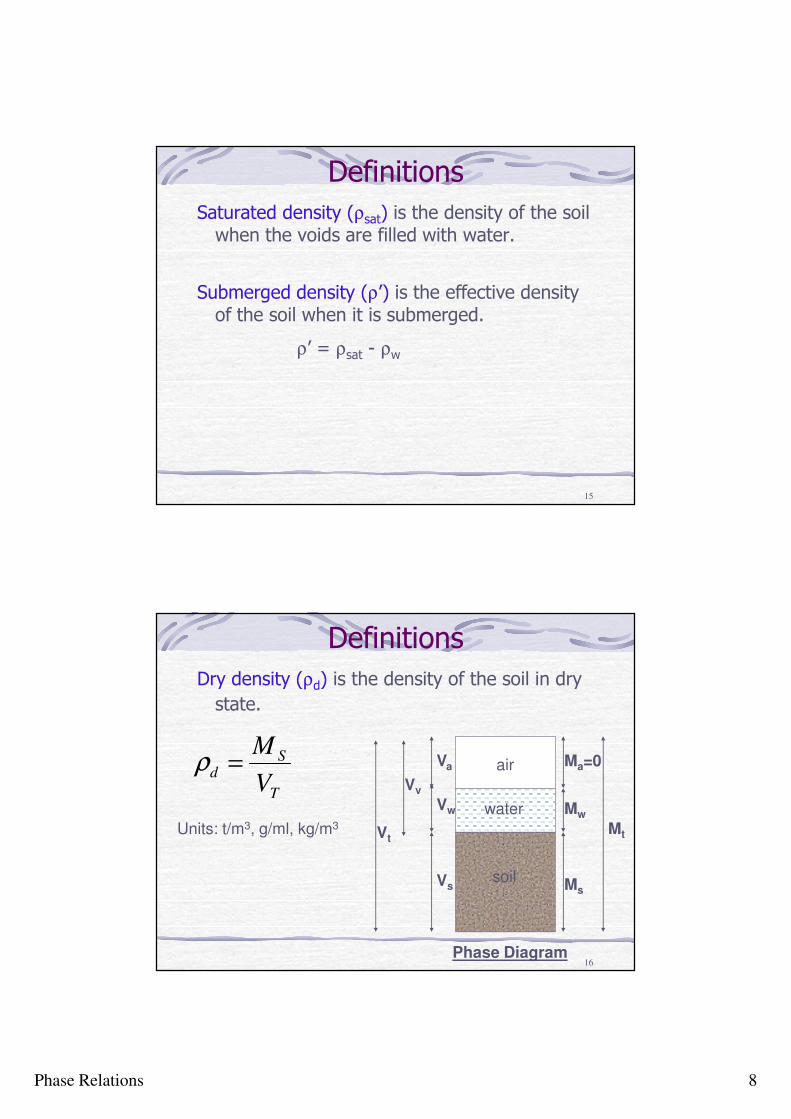
Definitions
Saturated density (ρsat) is the density of the soil when the voids are filled with water.
Submerged density (ρ’) is the effective density of the soil when it is submerged.
ρ’ = ρsat - ρw
16
Definitions
Dry density (ρd) is the density of the soil in dry
state.
soil
air
water
Vs
Va Ma=0
Ms
Mw
Mt
Vw
Vv
Vt
Phase Diagram
T
Sd
V
M=ρ
Units: t/m3, g/ml, kg/m3

Phase Relations 9
17
Definitions
Bulk, saturated, dry and submerged unit weights (γ)are defined in a similar manner.
γ = ρg
Here, use weight (kN) instead of mass (kg).
Specific gravity of the soil grains (Gs) typically varies between 2.6 and 2.8.
kg/m3N/m3 m/s2
Phase RelationsConsider a fraction of the soil where Vs = 1.
soil
air
water
1 Gsρρρρw
SeρρρρwSe
e
Phase Diagram
The other volumes can be obtained from the previous definitions.
Mass = Density x Volume
volumes masses
The masses can be obtained from:

Phase Relations 10
19
Phase RelationsFrom the previous definitions,
soil
air
water
1 Gsρρρρw
SeρρρρwSe
e
Phase Diagram
SS
W
G
Se
M
Mw ==
e
e
V
Vn
T
V
+==
1
20
Unit Weights
The bulk unit weight
The saturated unit weight (S = 1)
The dry unit weight (S = 0)
The submerged unit weight
γγ γ γ
bulk
w s s w s
s s
w sW
V
G V eSV
V eV
G eS
e= =
+
+=
+
+
( )
1
γγ
sat
w sG e
e=
+
+
( )
1
γγ
d r y
w sG
e=
+1
γ γ γ' = −sat w

Phase Relations 11
21
Phase Relations
soil
air
water
1 Gsρρρρw
SeρρρρwSe
e
Phase Diagram
WS
T
Tm
e
SeG
V
Mρρ
+
+==
1
WS
T
Tsat
e
eG
V
Mρρ
+
+==
1
WS
T
Sd
e
G
V
Mρρ
+==
1
22
Typical Unit weights

Phase Relations 12
23
Relative Density (Dr)Measure of how densely the grains are packed in a coarse grain soil in %.
0 100
Loosest Densest
minmax
max
ee
eeDr
−
−=
Also known as density index (ID).
24
Try not to memorise the equations. Understand the definitions, and develop the relations from the phase diagram with VS = 1;
Assume GS (2.6-2.8) when not given;
Do not mix densities and unit weights;
Rock and Soil grains are incompressible. Their mass and volume remain the same at any void ratio.

Phase Relations 13
25
Testing Times…
State whether the following are true or false?
(a) Dry density is greater than submerged density
(b) In unsaturated rocks, water content is always
less than 100%.
(c) Larger the void ratio, larger the porosity.
True
False
True
26
Example 1
Phase Trimmings Mass
(g)
Sample Mass, M
(g)
Sample Weight, Mg
(kN)
Total 55 290 2845 × 10-6
Solid 45 237.3 2327.9 × 10-6
Water 10 52.7 517 × 10-6
• Distribution by mass and weight

Phase Relations 14
27
Example 1
Phase Trimmings Mass
(g)
Sample Mass, M
(g)
Sample Weight, Mg
(kN)
Total 55 290 2845 × 10-6
Solid 45 237.3 2327.9 × 10-6
Water 10 52.7 517 × 10-6
• Distribution by mass and weight
• Distribution by volume (assume Gs = 2.65)
Total Volume V = π r2 l
28
Example 1
Phase Trimmings Mass
(g)
Sample Mass, M
(g)
Sample Weight, Mg
(kN)
Total 55 290 2845 × 10-6
Solid 45 237.3 2327.9 × 10-6
Water 10 52.7 517 × 10-6
• Distribution by mass and weight
• Distribution by volume (assume Gs = 2.65)
Total Volume V = π r2 l
Water Volume VW
w
w
w
=γ

Phase Relations 15
29
Example 1
Phase Trimmings Mass
(g)
Sample Mass, M
(g)
Sample Weight, Mg
(kN)
Total 55 290 2845 × 10-6
Solid 45 237.3 2327.9 × 10-6
Water 10 52.7 517 × 10-6
• Distribution by mass and weight
• Distribution by volume (assume Gs = 2.65)
Total Volume V = π r2 l
Water Volume
Solids Volume
VW
w
w
w
=γ
VW
Gs
s
w s
=γ
30
Example 1
Phase Trimmings Mass
(g)
Sample Mass, M
(g)
Sample Weight, Mg
(kN)
Total 55 290 2845 × 10-6
Solid 45 237.3 2327.9 × 10-6
Water 10 52.7 517 × 10-6
• Distribution by mass and weight
• Distribution by volume (assume Gs = 2.65)
Total Volume V = π r2 l
Water Volume
Solids Volume
Air Volume Va = V - Vs - Vw
VW
w
w
w
=γ
VW
Gs
s
w s
=γ

Phase Relations 16
31
Moisture content mW
W
w
s
= = = =10
450 222 22 2. . %
32
Moisture content
Voids ratio
mW
W
w
s
= = = =10
450 222 22 2. . %
eV
V
V V
V
v
s
a w
s
= =+
= 0 755.

Phase Relations 17
33
Moisture content
Voids ratio
Degree of Saturation
mW
W
w
s
= = = =10
450 222 22 2. . %
eV
V
V V
V
v
s
a w
s
= =+
= 0 755.
SV
V
V
V V
w
v
w
a w
= =+
= =0 780 78 0. . %
34
Moisture content
Voids ratio
Degree of Saturation
Bulk unit weight
mW
W
w
s
= = = =10
450 222 22 2. . %
eV
V
V V
V
v
s
a w
s
= =+
= 0 755.
SV
V
V
V V
w
v
w
a w
= =+
= =0 780 78 0. . %
γ bulk
W
VkN m= = 181 3. /

Phase Relations 18
35
Moisture content
Voids ratio
Degree of Saturation
Bulk unit weight
Dry unit weight
mW
W
w
s
= = = =10
450 222 22 2. . %
eV
V
V V
V
v
s
a w
s
= =+
= 0 755.
SV
V
V
V V
w
v
w
a w
= =+
= =0 780 78 0. . %
γ bulk
W
VkN m= = 181 3. /
γ dry
sW
VkN m= = 14 8 3. /
36
Moisture content
Voids ratio
Degree of Saturation
Bulk unit weight
Dry unit weight
Saturated unit weight
Note that γdry < γbulk < γsat
mW
W
w
s
= = = =10
450 222 22 2. . %
eV
V
V V
V
v
s
a w
s
= =+
= 0 755.
SV
V
V
V V
w
v
w
a w
= =+
= =0 780 78 0. . %
γ bulk
W
VkN m= = 181 3. /
γ dry
sW
VkN m= = 14 8 3. /
γ sat
W
VkN m=
+ × ×=
−( . . )
. /14 9 10 981
19 046
3

Phase Relations 19
37
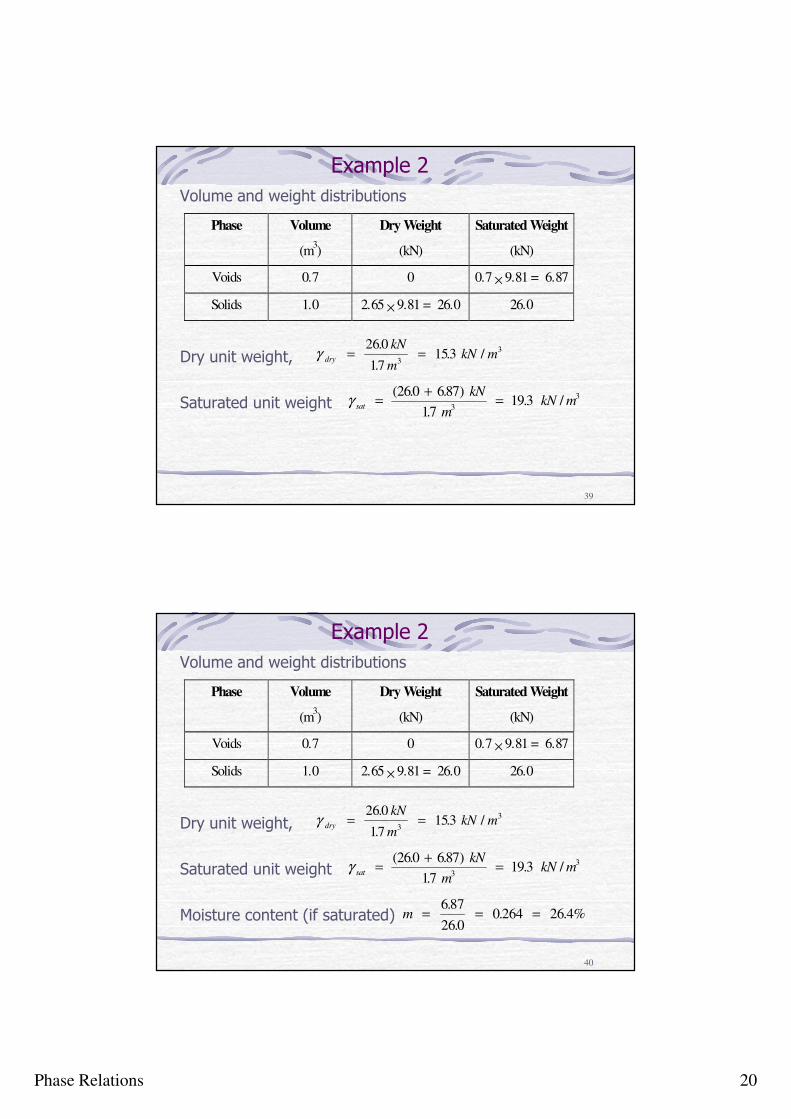
Example 2
Volume and weight distributions
Phase Volume
(m3)
Dry Weight
(kN)
Saturated Weight
(kN)
Voids 0.7 0 0.7 × 9.81 = 6.87
Solids 1.0 2.65 × 9.81 = 26.0 26.0
38
Example 2
Volume and weight distributions
Dry unit weight,
Phase Volume
(m3)
Dry Weight
(kN)
Saturated Weight
(kN)
Voids 0.7 0 0.7 × 9.81 = 6.87
Solids 1.0 2.65 × 9.81 = 26.0 26.0
γ dry
kN
mkN m= =
26 0
17153
3
3.
.. /
Phase Relations 20
39
Example 2
Volume and weight distributions
Dry unit weight,
Saturated unit weight
Phase Volume
(m3)
Dry Weight
(kN)
Saturated Weight
(kN)
Voids 0.7 0 0.7 × 9.81 = 6.87
Solids 1.0 2.65 × 9.81 = 26.0 26.0
γ dry
kN
mkN m= =
26 0
17153
3
3.
.. /
γ sat
kN
mkN m=
+=
( . . )
.. /
260 687
17193
3
3
40
Example 2
Volume and weight distributions
Dry unit weight,
Saturated unit weight
Moisture content (if saturated)
Phase Volume
(m3)
Dry Weight
(kN)
Saturated Weight
(kN)
Voids 0.7 0 0.7 × 9.81 = 6.87
Solids 1.0 2.65 × 9.81 = 26.0 26.0
γ dry
kN
mkN m= =
26 0
17153
3
3.
.. /
γ sat
kN
mkN m=
+=
( . . )
.. /
260 687
17193
3
3
m = = =6 87
26 00 264 26 4%
.
.. .
Phase Relations 21
41
Durability of Rock Materials
Longevity of the materials for use in construction (fill, backfill, rockfill)
Will the rock deteriorate when exposed to the elements, time, freeze-thaw, wet-dry cycles, temperatures, chemicals.
Tests used to accelerate exposure (slake durability, LA abrasion, freeze-thaw).
42
Slake Durability Test of Rocks
Evaluate shales and weak rocks that may degrade in service environment.
Rock fragments of known weight placed in rotating drum apparatus (ASTM D 4644).
Materials are circulated through wet & dry cycles.
reweigh rock fragments to determine the Slake Durability Index (SDI).

Phase Relations 22
43
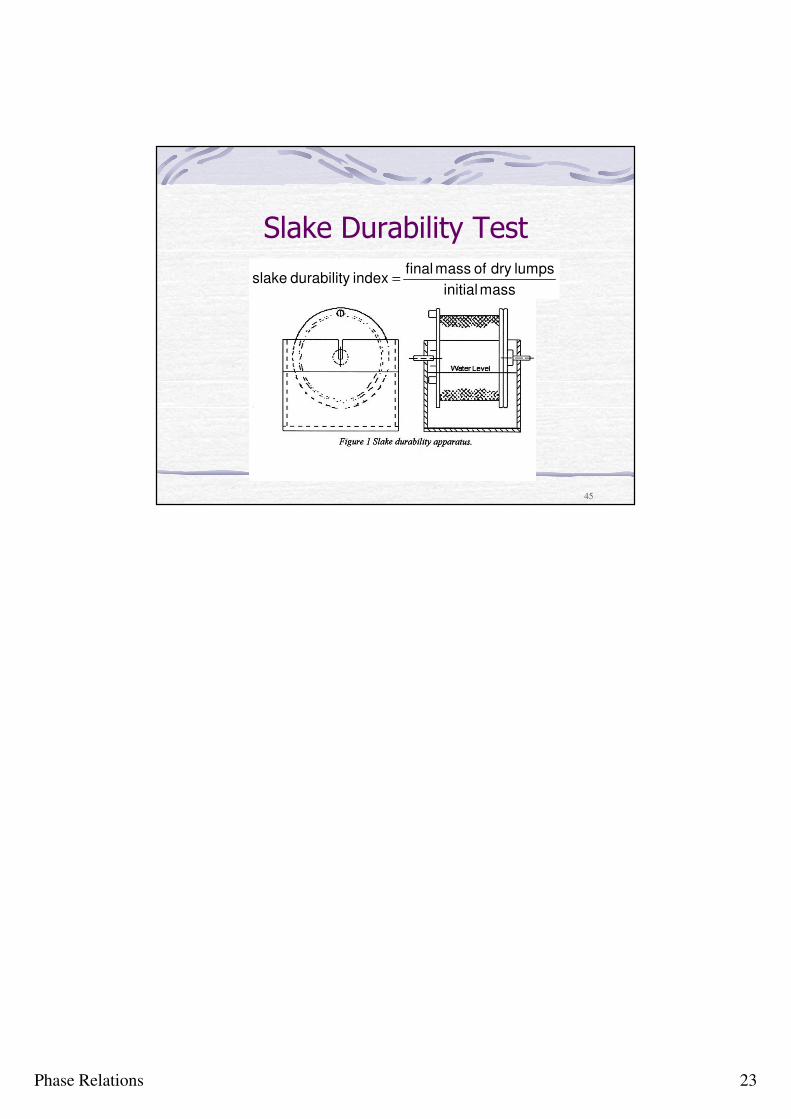
Slake Durability Test
44
Slake Durability Testpotential weathering of exposed rock
Resistance to two standard cycles of
drying & wetting
Rotating drum (20 rpm); rotates in water
10 small dry lumps rotated for 10 mins
Dried out and repeated
Mass loss recorded
Phase Relations 23
45
Slake Durability Test
mass initial
lumpsdry of mass final index durability slake =