2 overview of the radiation survey and site investigation ......
TRANSCRIPT

2-1August 2000 MARSSIM, Revision 1
2 OVERVIEW OF THE RADIATION SURVEY AND SITEINVESTIGATION PROCESS
2.1 Introduction
This chapter provides a brief overview of the Radiation Survey and Site Investigation (RSSI)Process, several important aspects of this Process, and its underlying principles. The conceptsintroduced here are discussed in detail throughout the manual.
The purpose of MARSSIM is to provide a standardized approach to demonstrating compliancewith a dose- or risk-based regulation. Since most of the manual is based on general technical andstatistical concepts, much of the guidance can still be applied to other types of regulations orstandards. The purpose of this chapter is to provide the overview information required tounderstand the rest of this manual.
Section 2.2 introduces and defines key terms used throughout the manual. Some of these termsmay be familiar to the MARSSIM user, while others are new terms developed specifically for thismanual.
Section 2.3 describes the flow of information used to decide whether or not a site or facilitycomplies with a regulation. The section describes the framework that is used to demonstratecompliance with a regulation, and is the basis for all guidance presented in this manual. Thedecision-making process is broken down into four phases: 1) planning, 2) implementation,3) assessment, and 4) decision making.
Section 2.4 introduces the Radiation Survey and Site Investigation Process, which can be used forcompliance demonstration at many sites. The section describes a series of surveys that combineto form the core of this process. Each survey has specified goals and objectives to support a finaldecision on whether or not a site or facility complies with the appropriate regulations. Flowdiagrams showing how the different surveys support the overall process are provided, along withdescriptions of the information provided by each type of survey.
Section 2.5 presents major considerations that relate to the decision-making and survey-designprocesses. This section, as well as the examples discussed in detail throughout the manual,focuses on residual radioactive contamination in surface soils and on building surfaces. Recommended survey designs for demonstrating compliance are presented along with therationale for selecting these designs.
Section 2.6 recognizes that the methods presented in MARSSIM may not represent the optimalsurvey design at all sites. Some alternate methods for applying the Radiation Survey and SiteInvestigation process are discussed. Different methods for demonstrating compliance that aretechnically defensible may be developed with the approval of the responsible regulatory agency.

Overview of the Radiation Survey and Site Investigation Process
2-2MARSSIM, Revision 1 August 2000
MARSSIM provides an approach that is technically defensible and flexible enough to be appliedto a variety of site-specific conditions. Applying this guidance to a dose- or risk-based regulationprovides a consistent approach to protecting human health and the environment. The manual’sperformance-based approach to decision making provides the flexibility needed to addresscompliance demonstration at individual sites.
2.2 Understanding Key MARSSIM Terminology
The first step in understanding the Radiation Survey and Site Investigation (RSSI) Process isaccomplished by understanding the scope of this manual, the terminology, and the concepts setforth. Some of the terms used in MARSSIM were developed for the purposes of this manual,while other commonly used terms are also adopted for use in MARSSIM. This section explainssome of the terms roughly in the order of their presentation in the manual.
The process described in MARSSIM begins with the premise that a release criterion has alreadybeen provided in terms of a measurement quantity. The methods presented in MARSSIM aregenerally applicable and are not dependent on the value of the release criterion.
A release criterion is a regulatory limit expressed in terms of dose (mSv/y or mrem/y) or risk(cancer incidence or cancer mortality). The terms release limit or cleanup standard are also usedto describe this term. A release criterion is typically based on the total effective dose equivalent(TEDE), the committed effective dose equivalent (CEDE), risk of cancer incidence (morbidity),or risk of cancer death (mortality) and generally cannot be measured directly. Exposure pathwaymodeling is used to calculate a radionuclide-specific predicted concentration or surface areaconcentration of specific nuclides that could result in a dose (TEDE or CEDE) or specific riskequal to the release criterion. In this manual, such a concentration is termed the derivedconcentration guideline level (DCGL). Exposure pathway modeling is an analysis of variousexposure pathways and scenarios used to convert dose or risk into concentration. In many casesDCGLs can be obtained from responsible regulatory agency guidance based on default modelinginput parameters, while other users may elect to take into account site-specific parameters todetermine DCGLs. In general, the units for the DCGL are the same as the units for measurementsperformed to demonstrate compliance (e.g., Bq/kg or pCi/g, Bq/m2 or dpm/100 cm2). This allowsdirect comparisons between the survey results and the DCGL. A discussion of the uncertaintyassociated with using DCGLs to demonstrate compliance is included in Appendix D, Section D.6.
An investigation level is a radionuclide-specific level based on the release criterion that, ifexceeded, triggers some response such as further investigation or remediation. An investigationlevel may be used early in decommissioning to identify areas requiring further investigation, andmay also be used as a screening tool during compliance demonstration to identify potentialproblem areas. A DCGL is an example of a specific investigation level.

Overview of the Radiation Survey and Site Investigation Process
1 The “W” in DCGLW stands for Wilcoxon Rank Sum test, which is the statistical test recommended inMARSSIM for demonstrating compliance when the contaminant is present in background. The Sign testrecommended for demonstrating compliance when the contaminant is not present in background also uses theDCGLW.
2 A small area of elevated activity, or maximum point estimate of contamination, might also be referred to as a“hot spot.” This term has been purposefully omitted from MARSSIM because the term often has differentmeanings based on operational or local program concerns. As a result, there may be problems associated withdefining the term and reeducating MARSSIM users in the proper use of the term. Because these implications areinconsistent with MARSSIM concepts, the term is not used.
2-3August 2000 MARSSIM, Revision 1
While the derivation of DCGLs is outside the scope of MARSSIM, it is important to understandthe assumptions that underlie this derivation. The derivation assumptions must be consistent withthose used for planning a compliance demonstration survey. One of the most importantassumptions used for converting a dose or risk limit into a media-specific concentration is themodeled area of contamination. Other considerations include sample depth, composition,modeling parameters, and exposure scenarios. MARSSIM defines two potential DCGLs basedon the area of contamination.
! If the residual radioactivity is evenly distributed over a large area, MARSSIM looks at theaverage activity over the entire area. The DCGLW
1 (the DCGL used for the statisticaltests, see Section 2.5.1.2) is derived based on an average concentration over a large area.
! If the residual radioactivity appears as small areas of elevated activity2 within a larger area,typically smaller than the area between measurement locations, MARSSIM considers theresults of individual measurements. The DCGLEMC (the DCGL used for the elevatedmeasurement comparison (EMC), see Section 2.5.3 and Section 2.5.4) is derivedseparately for these small areas and generally from different exposure assumptions thanthose used for larger areas.
A site is any installation, facility, or discrete, physically separate parcel of land, or any building orstructure or portion thereof, that is being considered for survey and investigation.
Area is a very general term that refers to any portion of a site, up to and including the entire site.
Decommissioning is the process of safely removing a site from service, reducing residualradioactivity through remediation to a level that permits release of the property, and terminationof the license or other authorization for site operation. Although only part of the process, theterm decommissioning is used in this sense for the Radiation Survey and Site Investigation (RSSI)Process, and is used this way throughout MARSSIM.

Overview of the Radiation Survey and Site Investigation Process
2-4MARSSIM, Revision 1 August 2000
A survey unit is a physical area consisting of structure or land areas of specified size and shape forwhich a separate decision will be made as to whether or not that area exceeds the releasecriterion. This decision is made as a result of the final status survey—the survey in the RSSIProcess used to demonstrate compliance with the regulation or standard. The size and shape ofthe survey unit are based on factors, such as the potential for contamination, the expecteddistribution of contamination, and any physical boundaries (e.g., buildings, fences, soil type,surface water body) at the site.
For MARSSIM, measurement is used interchangeably to mean: 1) the act of using a detector todetermine the level or quantity of radioactivity on a surface or in a sample of material removedfrom a media being evaluated, or 2) the quantity obtained by the act of measuring. Directmeasurements are obtained by placing a detector near the media being surveyed and inferring theradioactivity level directly from the detector response. Scanning is a measurement techniqueperformed by moving a portable radiation detector at a constant speed above a surface to semi-quantitatively detect areas of elevated activity. Sampling is the process of collecting a portion ofan environmental medium as being representative of the locally remaining medium. The collectedportion, or aliquot, of the medium is then analyzed to identify the contaminant and determine theconcentration. The word sample may also refer to a set of individual measurements drawn from apopulation whose properties are studied to gain information about the entire population. Thissecond definition of sample is primarily used for statistical discussions.
To make the best use of resources for decommissioning, MARSSIM places greater survey effortson areas that have, or had, the highest potential for contamination. This is referred to as a gradedapproach. The final status survey uses statistical tests to support decision making. Thesestatistical tests are performed using survey data from areas with common characteristics, such ascontamination potential, which are distinguishable from other areas with different characteristics. Classification is the process by which an area or survey unit is described according to radiologicalcharacteristics. The significance of survey unit classification is that this process determines thefinal status survey design and the procedures used to develop this design. Preliminary areaclassifications, made earlier in the MARSSIM Process, are useful for planning subsequentsurveys.
Areas that have no reasonable potential for residual contamination are classified as non-impactedareas. These areas have no radiological impact from site operations and are typically identifiedearly in decommissioning. Areas with some potential for residual contamination are classified asimpacted areas.
Impacted areas are further divided into one of three classifications:

Overview of the Radiation Survey and Site Investigation Process
3 Remediated areas are identified as Class 1 areas because the remediation process often results in less than100% removal of the contamination, even though the goal of remediation is to comply with regulatory standardsand protect human health and the environment. The contamination that remains on the site after remediation isoften associated with relatively small areas with elevated levels of residual radioactivity. This results in a non-uniform distribution of the radionuclide and a Class 1 classification. If an area is expected to have no potential toexceed the DCGLW and was remediated to demonstrate the residual radioactivity is as low as reasonably achievable(ALARA), the remediated area might be classified as Class 2 for the final status survey.
2-5August 2000 MARSSIM, Revision 1
! Class 1 Areas: Areas that have, or had prior to remediation, a potential for radioactivecontamination (based on site operating history) or known contamination (based onprevious radiation surveys) above the DCGLW. Examples of Class 1 areas include: 1) siteareas previously subjected to remedial actions3, 2) locations where leaks or spills areknown to have occurred, 3) former burial or disposal sites, 4) waste storage sites, and 5)areas with contaminants in discrete solid pieces of material and high specific activity.
! Class 2 Areas: Areas that have, or had prior to remediation, a potential for radioactivecontamination or known contamination, but are not expected to exceed the DCGLW. Tojustify changing the classification from Class 1 to Class 2, there should be measurementdata that provides a high degree of confidence that no individual measurement wouldexceed the DCGLW. Other justifications for reclassifying an area as Class 2 may beappropriate, based on site-specific considerations. Examples of areas that might beclassified as Class 2 for the final status survey include: 1) locations where radioactivematerials were present in an unsealed form, 2) potentially contaminated transport routes,3) areas downwind from stack release points, 4) upper walls and ceilings of buildings orrooms subjected to airborne radioactivity, 5) areas handling low concentrations ofradioactive materials, and 6) areas on the perimeter of former contamination control areas.
! Class 3 Areas: Any impacted areas that are not expected to contain any residualradioactivity, or are expected to contain levels of residual radioactivity at a small fractionof the DCGLW, based on site operating history and previous radiation surveys. Examplesof areas that might be classified as Class 3 include buffer zones around Class 1 or Class 2areas, and areas with very low potential for residual contamination but insufficientinformation to justify a non-impacted classification.
Class 1 areas have the greatest potential for contamination and therefore receive the highestdegree of survey effort for the final status survey using a graded approach, followed by Class 2,and then by Class 3. Non-impacted areas do not receive any level of survey coverage becausethey have no potential for residual contamination. Non-impacted areas are determined on a site-specific basis. Examples of areas that would be non-impacted rather than impacted usuallyinclude residential or other buildings that have or had nothing more than smoke detectors or exitsigns with sealed radioactive sources.

Overview of the Radiation Survey and Site Investigation Process
4 The term decision maker is used throughout this section to describe the person, team, board, or committeeresponsible for the final decision regarding disposition of the survey unit.
2-6MARSSIM, Revision 1 August 2000
If the radionuclide of potential concern is present in background, or if the measurement systemused to determine concentration in the survey unit is not radionuclide-specific, backgroundmeasurements are compared to the survey unit measurements to determine the level of residualradioactivity. The background reference area is a geographical area from which representativereference measurements are performed for comparison with measurements performed in specificsurvey units. The background reference area is defined as an area that has similar physical,chemical, radiological, and biological characteristics as the survey unit(s) being investigated buthas not been contaminated by site activities (i.e., non-impacted).
The process of planning the survey, implementing the survey plan, and assessing the survey resultsprior to making a decision is called the Data Life Cycle. Survey planning uses the Data QualityObjectives (DQO) Process to ensure that the survey results are of sufficient quality and quantityto support the final decision. Quality Assurance and Quality Control (QA/QC) procedures areperformed during implementation of the survey plan to collect information necessary to evaluatethe survey results. Data Quality Assessment (DQA) is the process of assessing the survey results,determining that the quality of the data satisfies the objectives of the survey, and interpreting thesurvey results as they apply to the decision being made.
A systematic process and structure for quality should be established to provide confidence in thequality and quantity of data collected to support decision making. The data used in decisionmaking should be supported by a planning document that records how quality assurance andquality control are applied to obtain type and quality of results that are needed and expected. There are several terms used to describe a variety of planning documents, some of whichdocument only a small part of the survey design process. MARRSIM uses the term QualityAssurance Project Plan (QAPP) to describe a single document that incorporates all of theelements of the survey design. This term is consistent with consensus guidance ANSI/ASQC E4-1994 (ASQC 1995) and EPA guidance (EPA 1994c; EPA 1997a), and is recommended topromote consistency. The use of the term QAPP in MARSSIM does not exclude the use of otherterms (e.g., Decommissioning Plan, Sampling and Analysis Plan, Field Sampling Plan) to describesurvey documentation provided the information included in the documentation supports theobjectives of the survey.
2.3 Making Decisions Based on Survey Results
Compliance demonstration is simply a decision as to whether or not a survey unit meets therelease criterion. For most sites this decision is based on the results of one or more surveys. When survey results are used to support a decision, the decision maker4 needs to ensure that the
Overview of the Radiation Survey and Site Investigation Process
2-7August 2000 MARSSIM, Revision 1
PLANNING PHASE
Plan for Data Collection using theData Quality Objectives Process and
Develop a Quality Assurance Project Plan
IMPLEMENTATION PHASE
Collect Data using Documented Measurement Techniques andAssociated Quality Assurance and Quality Control Activities
ASSESSMENT PHASE
Evaluate the Collected Data Against the Survey Objectives usingData Verification, Data Validation, and Data Quality Assessment
DECISION-MAKING PHASE
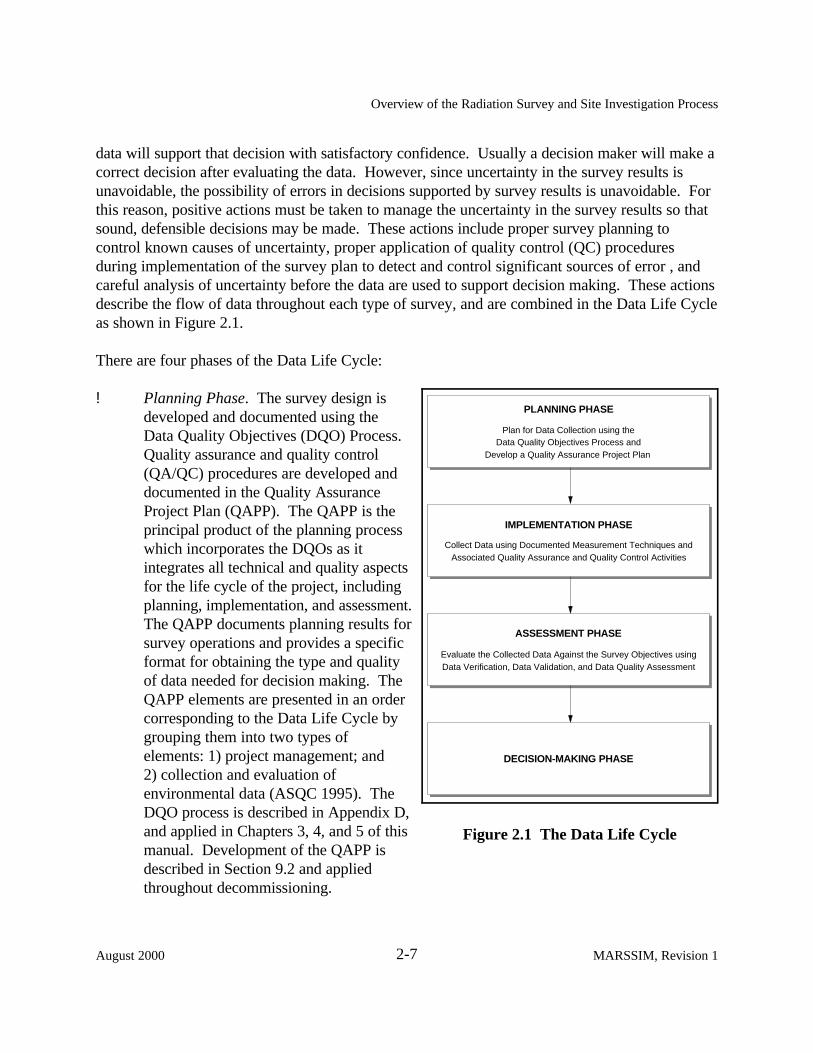
Figure 2.1 The Data Life Cycle
data will support that decision with satisfactory confidence. Usually a decision maker will make acorrect decision after evaluating the data. However, since uncertainty in the survey results isunavoidable, the possibility of errors in decisions supported by survey results is unavoidable. Forthis reason, positive actions must be taken to manage the uncertainty in the survey results so thatsound, defensible decisions may be made. These actions include proper survey planning tocontrol known causes of uncertainty, proper application of quality control (QC) proceduresduring implementation of the survey plan to detect and control significant sources of error , andcareful analysis of uncertainty before the data are used to support decision making. These actionsdescribe the flow of data throughout each type of survey, and are combined in the Data Life Cycleas shown in Figure 2.1.
There are four phases of the Data Life Cycle:
! Planning Phase. The survey design isdeveloped and documented using theData Quality Objectives (DQO) Process. Quality assurance and quality control(QA/QC) procedures are developed anddocumented in the Quality AssuranceProject Plan (QAPP). The QAPP is theprincipal product of the planning processwhich incorporates the DQOs as itintegrates all technical and quality aspectsfor the life cycle of the project, includingplanning, implementation, and assessment. The QAPP documents planning results forsurvey operations and provides a specificformat for obtaining the type and qualityof data needed for decision making. TheQAPP elements are presented in an ordercorresponding to the Data Life Cycle bygrouping them into two types ofelements: 1) project management; and2) collection and evaluation ofenvironmental data (ASQC 1995). TheDQO process is described in Appendix D,and applied in Chapters 3, 4, and 5 of thismanual. Development of the QAPP isdescribed in Section 9.2 and appliedthroughout decommissioning.

Overview of the Radiation Survey and Site Investigation Process
2-8MARSSIM, Revision 1 August 2000
! Implementation Phase. The survey design is carried out in accordance with the SOPs andQAPP, resulting in the generation of raw data. Chapter 6, Chapter 7, and Appendix Hprovide information on the selection of data collection techniques. The QA and QCmeasurements, discussed in Chapter 6 and Chapter 7, also generate data and otherimportant information that will be used during the Assessment Phase.
! Assessment Phase. The data generated during the Implementation Phase are first verifiedto ensure that the SOPs specified in the QAPP were actually followed and that themeasurement systems performed in accordance with the criteria specified in the QAPP. Then the data are validated to ensure that the results of data collection activities supportthe objectives of the survey as documented in the QAPP, or permit a determination thatthese objectives should be modified. The data quality assessment (DQA) process is thenapplied using the validated data to determine if the quality of the data satisfies the datauser’s needs. Data verification and validation are described in Section 9.3. The DQAprocess is described in Appendix E and is applied in Chapter 8.
! Decision-Making Phase. A decision is made, in coordination with the responsibleregulatory agency, based on the conclusions drawn from the assessment process. Theultimate objective is to make technically defensible decisions with a specified level ofconfidence (Chapter 8).
2.3.1 Planning Effective Surveys—Planning Phase
The first step in designing effective surveys is planning. The DQO Process is a series of planningsteps based on the scientific method for establishing criteria for data quality and developing surveydesigns (ASQC 1995, EPA 1994a, EPA 1987b, EPA 1987c). Planning radiation surveys usingthe DQO Process improves the survey effectiveness and efficiency, and thereby the defensibility ofdecisions. This minimizes expenditures related to data collection by eliminating unnecessary,duplicative, or overly precise data. Using the DQO Process ensures that the type, quantity, andquality of environmental data used in decision making will be appropriate for the intendedapplication. MARSSIM supports the use of the DQO Process to design surveys for input to bothevaluation techniques (elevated measurement comparison and the statistical test). The DQOProcess provides systematic procedures for defining the criteria that the survey design shouldsatisfy, including what type of measurements to perform, when and where to performmeasurements, the level of decision errors for the survey, and how many measurements toperform.
The level of effort associated with planning a survey is based on the complexity of the survey. Large, complicated sites generally receive a significant amount of effort during the planningphase, while smaller sites may not require as much planning. This graded approach defines dataquality requirements according to the type of survey being designed, the risk of making a decision

Overview of the Radiation Survey and Site Investigation Process
2-9August 2000 MARSSIM, Revision 1
error based on the data collected, and the consequences of making such an error. This approachprovides a more effective survey design combined with a basis for judging the usability of the datacollected.
DQOs are qualitative and quantitative statements derived from the outputs of the DQO Processthat:
! clarify the study objective! define the most appropriate type of data to collect! determine the most appropriate conditions for collecting the data! specify limits on decision errors which will be used as the basis for establishing the
quantity and quality of data needed to support the decision
The DQO Process consists of seven steps, as shown in Figure 2.2. Each step is discussed in detailin Appendix D. While all of the outputs of the DQO Process are important for designing efficientsurveys, there are some that are referred to throughout the manual. These DQOs are mentionedbriefly here, and are discussed in detail throughout MARSSIM and in Appendix D.
The minimum information (outputs) required from the DQO Process to proceed with the methodsdescribed in MARSSIM are:
! classify and specify boundaries of survey units: this can be accomplished at any time, butmust be finalized during final status survey planning (Section 4.4, Section 4.6)
! state the null hypothesis (H0): the residual radioactivity in the survey unit exceeds therelease criterion (Section 2.5, Appendix D, Section D.6)
! specify a gray region where the consequences of decision errors are relatively minor: theupper bound of the gray region is defined as the DCGLW, and the lower bound of the grayregion (LBGR) is a site-specific variable generally initially selected to equal one half theDCGLW and adjusted to provide an acceptable value for the relative shift (Section 5.5.2.2,Section 5.5.2.3, Appendix D, Section D.6)
! define Type I and Type II decision errors and assign probability limits for the occurrenceof these errors: the probability of making a Type I decision error (α) or a Type II decisionerror (β) are site-specific variables (Section 5.5.2.2, Section 5.5.2.3, Appendix D,Section D.6)
! estimate the standard deviation of the measurements in the survey unit: the standarddeviation (σ) is a site-specific variable, typically estimated from preliminary survey data(Section 5.5.2.2, Section 5.5.2.3)
! specify the relative shift: the shift (∆) is equal to the width of the gray region(DCGLW - LBGR), and the relative shift is defined as ∆/σ, which is generally designed tohave a value between one and three (Section 5.5.2.2, Section 5.5.2.3)

Overview of the Radiation Survey and Site Investigation Process
2-10MARSSIM, Revision 1 August 2000
STEP 6: SPECIFY LIMITS ON DECISION ERRORS
STEP 5: DEVELOP A DECISION RULE
STEP 4: DEFINE THE STUDY BOUNDARIES
STEP 3: IDENTIFY INPUTS TO THE DECISION
STEP 2: IDENTIFY THE DECISION
STEP 1: STATE THE PROBLEM
STEP 7:OPTIMIZE THEDESIGN FOR
OBTAINING DATA
Figure 2.2 The Data Quality Objectives Process
! specify the detection limit for all measurement techniques (scanning, direct measurement,and sample analysis) specified in the QAPP: the minimum detectable concentration(MDC) is unique for each measurement system (Section 6.7)
! calculate the estimated number of measurements (N) and specify the measurementlocations required to demonstrate compliance: the number of measurements depends onthe relative shift (∆/σ), Type I and Type II decision error rates (α and β), the potential forsmall areas of elevated activity, and the selection and classification of survey units (Section5.5.2.2, Section 5.5.2.3)
! specify the documentation requirements for the survey, including survey planningdocumentation: documentation supporting the decision on whether or not the sitecomplies with the release criterion is determined on a site-specific basis (Appendix N,Section N.2)

Overview of the Radiation Survey and Site Investigation Process
2-11August 2000 MARSSIM, Revision 1
In addition to DQOs, values for the Data Quality Indicators (DQIs) should also be established andrecorded during the planning stage. Where DQOs include performance measures and goals inrelation to a specific intended use of the data, DQIs quantify the amount of error in the datacollection process and the analytical measurement system regardless of how the data may be used(EPA 1997a). Precision, bias, accuracy, representativeness, comparability, and completeness arethe DQIs recommended for quantifying the amount of error for survey data. These DQIs arediscussed in detail in Appendix N, Section N.6.
2.3.2 Estimating the Uncertainty in Survey Results—Implementation Phase
To encourage flexibility and the use of optimal measurement techniques for a specific site,MARSSIM does not provide detailed guidance on specific techniques. Instead, MARSSIMencourages the decision maker to evaluate available techniques based on the survey objectives. Guidance on evaluating these objectives, such as detection limit, is provided.
QC programs can both lower the chances of making an incorrect decision and help the data userunderstand the level of uncertainty that surrounds the decision (EPA 1997a). As discussedpreviously, QC data are collected and analyzed during implementation to provide an estimate ofthe uncertainty associated with the survey results. QC measurements (scans, directmeasurements, and samples) are technical activities performed to measure the attributes andperformance of the survey. During any survey, a certain number of measurements should betaken for QC purposes.
2.3.3 Interpreting Survey Results—Assessment Phase
Assessment of environmental data is used to evaluate whether the data meet the objectives of thesurvey and whether the data are sufficient to determine compliance with the DCGL (EPA 1992a,EPA 1992b, EPA 1996a). The assessment phase of the Data Life Cycle consists of three phases: data verification, data validation, and Data Quality Assessment (DQA).
Data verification is used to ensure that the requirements stated in the planning documents areimplemented as prescribed (see Section 9.3). Data validation is used to ensure that the results ofthe data collection activities support the objectives of the survey as documented in the QAPP, orpermit a determination that these objectives should be modified (see Section 9.3 andAppendix N). Data quality assessment (DQA) is the scientific and statistical evaluation of data todetermine if the data are of the right type, quality, and quantity to support their intended use(EPA 1996a). DQA helps complete the Data Life Cycle by providing the assessment needed todetermine that the planning objectives are achieved (see Section 8.2). Figure 2.3 illustrates wheredata verification, data validation, and DQA fit into the Assessment Phase of the Data Life Cycle.

Overview of the Radiation Survey and Site Investigation Process
2-12MARSSIM, Revision 1 August 2000
INPUTS
OUTPUT
INPUT
OUTPUT
Verify Measurement PerformanceVerify Measurement Procedures and Reporting Requirements
DATA VALIDATION/VERIFICATION
Review DQOs and DesignConduct Preliminary Data ReviewSelect Statistical TestVerify AssumptionsDraw Conclusions
DATA QUALITY ASSESSMENT
QC/PerformanceEvaluation DataRoutine Data
VALIDATED/VERIFIED DATA
CONCLUSIONS DRAWN FROM DATA
Figure 2.3 The Assessment Phase of theData Life Cycle (EPA 1996a)
There are five steps in the DQA Process:
! Review the DQOs and Survey Design! Conduct a Preliminary Data Review! Select the Statistical Test! Verify the Assumptions of the
Statistical Test! Draw Conclusions from the Data
The strength of DQA is its design thatprogresses in a logical and efficient manner topromote an understanding of how well thedata meet the intended use. The AssessmentPhase is described in more detail in AppendixE. Section 2.6 discusses the flexibility of theData Life Cycle and describes the use ofsurvey designs other than those described laterin MARSSIM.
2.3.4 Uncertainty in Survey Results
Uncertainty in survey results arises primarilyfrom two sources: survey design errors andmeasurement errors. Survey design errorsoccur when the survey design is unable tocapture the complete extent of variability thatexists for the radionuclide distribution in asurvey unit. Since it is impossible in everysituation to measure the residual radioactivity at every point in space and time, the survey resultswill be incomplete to some degree. It is also impossible to know with complete certainty theresidual radioactivity at locations that were not measured, so the incomplete survey results giverise to uncertainty. The greater the natural or inherent variation in residual radioactivity, thegreater the uncertainty associated with a decision based on the survey results. The unansweredquestion is: “How well do the survey results represent the true level of residual radioactivity in thesurvey unit?”
Measurement errors create uncertainty by masking the true level of residual radioactivity and maybe classified as random or systematic errors. Random errors affect the precision of themeasurement system, and show up as variations among repeated measurements. Systematicerrors show up as measurements that are biased to give results that are consistently higher orlower than the true value. Measurement uncertainty is discussed in Section 6.8.

Overview of the Radiation Survey and Site Investigation Process
2-13August 2000 MARSSIM, Revision 1
MARSSIM uses the Data Life Cycle to control and estimate the uncertainty in the survey resultson which decisions are made. Adequate planning should minimize known sources of uncertainty. QC data collected during implementation of the survey plan provide an estimate of theuncertainty. Statistical hypothesis testing during the assessment phase provides a level ofconfidence for the final decision. There are several levels of decisions included within each surveytype. Some decisions are quantitative, based on the numerical results of measurements performedduring the survey. Other decisions are qualitative based on the available evidence and bestprofessional judgment. The Data Life Cycle can and should be applied consistently to both typesof decisions.
2.3.5 Reporting Survey Results
The process of reporting survey results is an important consideration in planning the survey. Again, the level of effort for reporting should be based on the complexity of the survey. A simplesurvey with relatively few results may specify a single report, while a more complicated surveymay specify several reports to meet the objectives of the survey. Reporting requirements forindividual surveys should be developed during planning and clearly documented in the QAPP. These requirements should be developed with cooperation from the people performing theanalyses (e.g., the analytical laboratory should be consulted on reporting results for samples). The Health Physics Society has developed several suggestions for reporting survey results(EPA 1980c). These suggestions include:
! Report the actual result of the analysis. Do not report data as “less than the detectionlimit.” Even negative results and results with large uncertainties can be used in thestatistical tests to demonstrate compliance. Results reported only as “<MDC” cannot befully used and, for example, complicate even such simple analyses as calculating anaverage. While the nonparametric tests described in Section 8.3 and Section 8.4 canaccommodate as much as 40% of the results as non-detects, it is better to report the actualresults and avoid the possibility of exceeding this limit.
! Report results using the correct units and the correct number of significant digits. Thechoice of reporting results using SI units (e.g., Bq/kg, Bq/m2) or conventional units(e.g., pCi/g, dpm/100 cm2) is made on a site-specific basis. Generally, MARSSIMrecommends that all results be reported in the same units as the DCGLs. Sometimes theresults may be more convenient to work with as counts directly from the detector. Inthese cases the user should decide what the appropriate units are for a specific surveybased on the survey objectives. The user should also report the correct number ofsignificant digits as described in EPA 1980c.

Overview of the Radiation Survey and Site Investigation Process
2-14MARSSIM, Revision 1 August 2000
! Report the measurement uncertainty for every analytical result or series of results, such asfor a measurement system. This uncertainty, while not directly used for demonstratingcompliance with the release criterion, is used for survey planning and data assessmentthroughout the Radiation Survey and Site Investigation Process. In addition, theuncertainty is used for evaluating the performance of measurement systems using QCmeasurement results (as described in Section 6.2 for scans and direct measurements, andin Section 7.2 for laboratory analysis of samples). The uncertainty is also used forcomparing individual measurements to the action level, which is especially important in theearly stages of decommissioning (scoping, characterization, and remedial action supportsurveys described in Section 2.4) when decisions are made based on a limited number ofmeasurements. Section 6.8 discusses methods for calculating the measurementuncertainty.
! Report the minimum detectable concentration (MDC) for the measurement system as wellas the method used to calculate the MDC. The MDC is an a priori estimate of thecapability for detecting an activity concentration with a specific measurement system (EPA1980c). As such, this estimate is valuable for planning and designing radiation surveys. Optimistic estimates of the MDC (calculated using ideal conditions that may not apply toactual measurements) overestimate the ability of a technique to detect residualradioactivity, especially when scanning for alpha or low-energy beta radiations. This caninvalidate survey results, especially for scanning surveys. Using a more realistic MDC, asdescribed in Section 6.7, during scoping and characterization surveys helps in the properclassification of survey units for final status surveys and minimizes the possibility ofdesigning and performing subsequent surveys because of errors in classification. Estimates of the MDC that minimize potential decision errors should be used for planningsurveys.
Reporting requirements for individual surveys should be developed during planning and clearlydocumented in the QAPP.
2.4 Radiation Survey and Site Investigation Process
The Data Life Cycle discussed in Section 2.3 is the basis for the performance-based guidance inMARSSIM. As a framework for collecting the information required for demonstratingcompliance identified using the DQO Process, MARSSIM recommends using a series of surveys. The Radiation Survey and Site Investigation (RSSI) Process is an example of a series of surveysdesigned to demonstrate compliance with a dose- or risk-based regulation for sites withradioactive contamination.

Overview of the Radiation Survey and Site Investigation Process
2-15August 2000 MARSSIM, Revision 1
There are six principal steps in the RSSI Process:
! Site Identification! Historical Site Assessment! Scoping Survey! Characterization Survey! Remedial Action Support Survey! Final Status Survey
Table 2.1 provides a simplified overview of the principal steps in the RSSI process and how theData Life Cycle can be used in an iterative fashion within the process. Each of these steps isbriefly described in the Sections 2.4.1 through 2.4.6, and described in more detail in Chapter 3and Chapter 5. In addition, there is a brief description of regulatory agency confirmation andverification (see Section 2.4.7). Because MARSSIM focuses on demonstrating compliance with arelease criterion, specifically through the use of a final status survey, these surveys have additionalobjectives that are not fully discussed in MARSSIM (e.g., health and safety of workers,supporting selection of values for exposure pathway model parameters).
Figure 2.4 illustrates the Radiation Survey and Site Investigation Process in terms of areaclassification, and lists the major decision to be made for each type of survey. The flowchartdemonstrates one method for quickly estimating the survey unit classification early in theMARSSIM Process based on limited information. While this figure shows the relationshipbetween area classification and survey unit classification along with the major decision points thatdetermine classification, this illustration is not designed to comprehensively consider everypossibility that may occur at individual survey units. As such, it is a useful tool for visualizing theclassification process, but there are site-specific characteristics that may cause variation from thisscheme.
The flowchart, illustrated in Figures 2.5 through 2.8, presents the principal steps and decisions inthe site investigation process and shows the relationship of the survey types to the overallassessment process. As shown in these figures, there are several sequential steps in the siteinvestigation process and each step builds on information provided by its predecessor. Properlyapplying each sequential step in the RSSI Process should provide a high degree of assurance thatthe release criterion has not been exceeded.

Overview of the Radiation Survey and Site Investigation Process
2-16MARSSIM, Revision 1 August 2000
Table 2.1 The Data Life Cycle used to Support theRadiation Survey and Site Investigation Process
RSSI Process Data Life Cycle MARSSIM Guidance
Site Identification Provides information on identifying potential radiationsites (Section 3.3)
Historical SiteAssessment
Historical SiteAssessmentData Life Cycle
PlanImplementAssessDecide
Provides information on collecting and assessingexisting site data (Sections 3.4 through 3.9) andpotential sources of information (Appendix G)
Scoping Survey Scoping DataLife Cycle
PlanImplementAssessDecide
Discusses the purpose and general approach forperforming scoping surveys, especially as sources ofinformation when planning final status surveys(Section 5.2)
CharacterizationSurvey
Characterization Data LifeCycle
PlanImplementAssessDecide
Discusses the purpose and general approach forperforming characterization surveys, especially assources of information when planning final statussurveys (Section 5.3)
Remedial ActionSupport Survey
RemedialAction DataLife Cycle
PlanImplementAssessDecide
Discusses the purpose and general approach forperforming remedial action support surveys, especiallyas sources of information when planning final statussurveys (Section 5.4)
Final Status Survey Final StatusData Life Cycle
PlanImplementAssessDecide
Provides detailed guidance for planning final statussurveys (Chapter 4 and Section 5.5), selectingmeasurement techniques (Chapter 6, Chapter 7, andAppendix H), and assessing the data collected duringfinal status surveys (Chapter 8 and Chapter 9)
2.4.1 Site Identification
The identification of known, likely, or potential sites is generally easily accomplished, and istypically performed before beginning decommissioning. Any facility preparing to terminate anNRC or agreement state license would be identified as a site. Formerly terminated NRC licensesmay also become sites for the EPA Superfund Program. Portions of military bases or DOEfacilities may be identified as sites based on records of authorization to possess or handleradioactive materials. In addition, information obtained during the performance of surveyactivities may identify additional potential radiation sites related to the site being investigated. Information on site identification is provided in Section 3.3.

Overview of the Radiation Survey and Site Investigation Process
2-17August 2000 MARSSIM, Revision 1
Historical SiteAssessment
Is the AreaImpacted?
Scoping Survey
Is theArea PotentiallyContaminated?
CharacterizationSurvey
Is the Probabilityof Exceeding theDCGLW Small?
Remedial ActionSupport Survey
Non-ImpactedNo Survey Required
Class 3 Final StatusSurvey
Class 2 Final StatusSurvey
Class 1 Final StatusSurvey
Initially Assumes a Class 1Projected Final StatusSurvey Classification
No
Is the Probabilityof Exceeding theDCGLEMC Small?
IsThere Sufficient
Information to SupportClassification as
Class 2?
Yes/Unknown
Yes/Unknown
No
No
Yes
Yes
Yes
Yes
No
No
No
Is theArea Actually
Contaminated?
Figure 2.4 The Radiation Survey and Site Investigation Processin Terms of Area Classification

Overview of the Radiation Survey and Site Investigation Process
2-18MARSSIM, Revision 1 August 2000
Design Historical SiteAssessment (HSA)Using Data QualityObjectives (DQO)
Process
Perform HSA
Validate Dataand AssessData Quality
Reassess DQOs
Are the DQOsSatisfied?
Is the AreaImpacted?
Document FindingsSupporting Non-Impacted
Classification
Area PreviouslyRemediated and
Currently Poses LowHuman Health
Risk?
Provide DocumentationSufficent to Demonstrate
Compliance
DocumentFindings of HSA
Decision toRelease Area
To Figure2.6
Survey Objectives1) Identify potential sources of contamination2) Determine whether or not sites pose a threatto human health and the environment3) Differentiate impacted from non-impactedareas4) Provide input to scoping and characterizationsurvey designs5) Provide an assessment of the likelihood ofcontaminant migration6) Identify additional potential radiation sitesrelated to the site being investigated
No
Yes No
Yes/Unknown
Yes
No
Site Identification
Figure 2.5 The Historical Site Assessment Portion of theRadiation Survey and Site Investigation Process

Overview of the Radiation Survey and Site Investigation Process
2-19August 2000 MARSSIM, Revision 1
FromFigure 2.5
Design Scoping SurveyPlan Using
DQO Process
PerformScoping Survey
Validate Data andAssess Data Quality
Are the DQOsSatisfied?
Reassess DQOs
IsThere Sufficient
Information to SupportClassification as
Class 3?
Document FindingsSupporting Class 3
Classification
To Figure2.7
To Figure2.8
Survey Objectives1) Perform a preliminary hazardassessment2) Support classification of all or partof the site as a Class 3 area3) Evaluate whether survey plan canbe optimized for use incharacterization or final status survey4) Provide input to thecharacterization survey design
No
Yes No/Unknown
Yes
Figure 2.6 The Scoping Survey Portion of theRadiation Survey and Site Investigation Process

Overview of the Radiation Survey and Site Investigation Process
2-20MARSSIM, Revision 1 August 2000
DesignCharacterization
Survey Plan UsingDQO Process
Reassess DQOsPerform
CharacterizationSurvey
Are the DQOsSatisfied?
Validate Dataand AssessData Quality
Classify Areas asClass 1, Class 2,
or Class 3
Do theClass 1 and Class 2
Areas RequireRemediation?
Reassess RemedialAlternative and Site
Specific DCGLs
Remediate the Area
Perform RemedialAction Support Survey
Does theRemedial Action
Support Survey Indicatethe Remediation is
Complete?
Survey Objectives1) Determine the nature and extent ofthe contamination2) Evaluate remedial alternatives andtechnologies3) Evaluate whether survey plan can beoptimized for use in the final statussurvey4) Provide input to the final status surveydesign
Is Reassessmentof Remedial Alternative
and Site Specific DCGLsNecessary?
FromFigure 2.6
FromFigure2.8*
To Figure2.8
No
Yes
Yes
Yes
No
No
No
Yes
Determine RemedialAlternative and Site
Specific DCGLs
* The point where survey units that fail to demonstrate compliance in the final status survey in Figure 2.8 re-enter the process
Figure 2.7 The Characterization and Remedial Action Support Survey Portionof the Radiation Survey and Site Investigation Process
Overview of the Radiation Survey and Site Investigation Process
2-21August 2000 MARSSIM, Revision 1
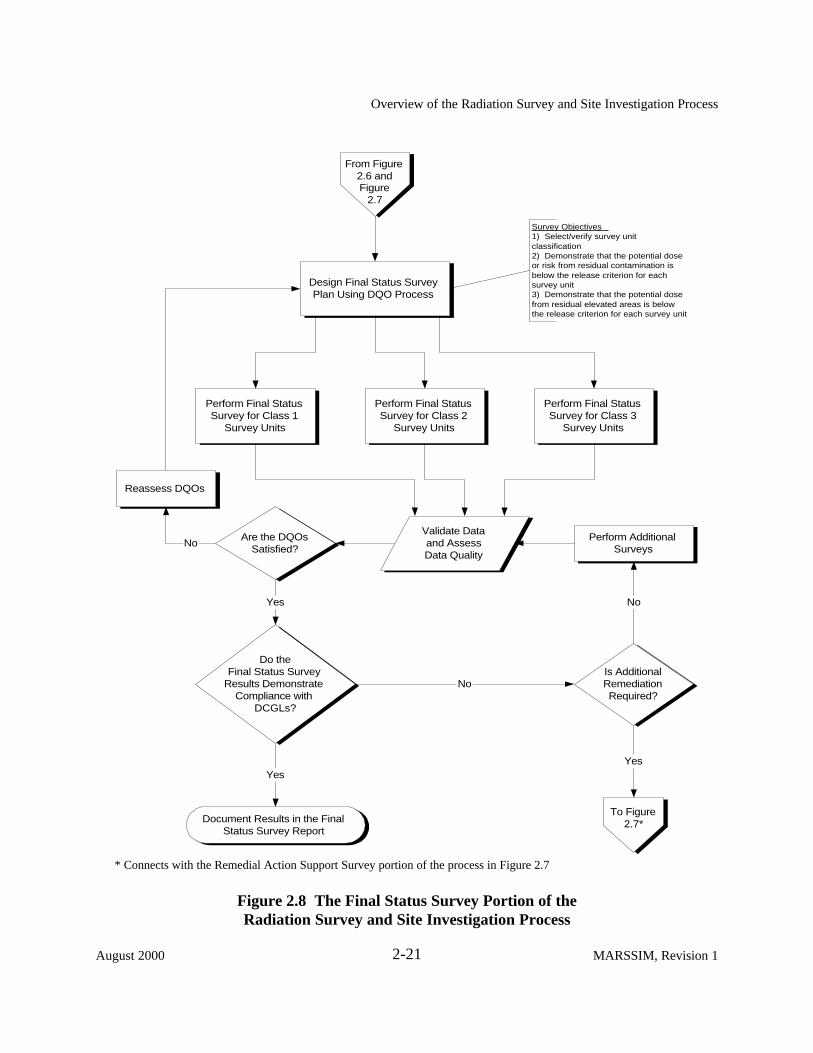
Design Final Status SurveyPlan Using DQO Process
Perform Final StatusSurvey for Class 1
Survey Units
Perform Final StatusSurvey for Class 2
Survey Units
Perform Final StatusSurvey for Class 3
Survey Units
Perform AdditionalSurveys
Reassess DQOs
Validate Dataand AssessData Quality
Are the DQOsSatisfied?
Do theFinal Status Survey
Results DemonstrateCompliance with
DCGLs?
Is AdditionalRemediationRequired?
Document Results in the FinalStatus Survey Report
Survey Objectives1) Select/verify survey unitclassification2) Demonstrate that the potential doseor risk from residual contamination isbelow the release criterion for eachsurvey unit3) Demonstrate that the potential dosefrom residual elevated areas is belowthe release criterion for each survey unit
From Figure2.6 andFigure
2.7
To Figure2.7*
Yes
Yes
No
Yes
No
No
* Connects with the Remedial Action Support Survey portion of the process in Figure 2.7
Figure 2.8 The Final Status Survey Portion of theRadiation Survey and Site Investigation Process

Overview of the Radiation Survey and Site Investigation Process
2-22MARSSIM, Revision 1 August 2000
2.4.2 Historical Site Assessment
The primary purpose of the Historical Site Assessment (HSA) is to collect existing informationconcerning the site and its surroundings.
The primary objectives of the HSA are to:
! identify potential sources of contamination! determine whether or not sites pose a threat to human health and the environment! differentiate impacted from non-impacted areas! provide input to scoping and characterization survey designs! provide an assessment of the likelihood of contaminant migration! identify additional potential radiation sites related to the site being investigated
The HSA typically consists of three phases: identification of a candidate site, preliminaryinvestigation of the facility or site, and site visits or inspections. The HSA is followed by anevaluation of the site based on information collected during the HSA.
2.4.3 Scoping Survey
If the data collected during the HSA indicate an area is impacted, a scoping survey could beperformed. Scoping surveys provide site-specific information based on limited measurements.
The primary objectives of a scoping survey are to:
! perform a preliminary hazard assessment! support classification of all or part of the site as a Class 3 area! evaluate whether the survey plan can be optimized for use in the characterization or final
status surveys! provide data to complete the site prioritization scoring process (CERCLA and RCRA sites
only)! provide input to the characterization survey design if necessary
Scoping surveys are conducted after the HSA is completed and consist of judgment measurementsbased on the HSA data. If the results of the HSA indicate that an area is Class 3 and nocontamination is found, the area may be classified as Class 3 and a Class 3 final status survey isperformed. If the scoping survey locates contamination, the area may be considered as Class 1(or Class 2) for the final status survey and a characterization survey is typically performed. Sufficient information should be collected to identify situations that require immediate radiologicalattention. For sites where the Comprehensive Environmental Response, Compensation, andLiability Act (CERCLA) requirements are applicable, the scoping survey should collect sufficient

Overview of the Radiation Survey and Site Investigation Process
2-23August 2000 MARSSIM, Revision 1
data to complete the Hazard Ranking System (HRS) scoring process. For sites where theResource Conservation and Recovery Act (RCRA) requirements are applicable, the scopingsurvey should collect sufficient data to complete the National Corrective Action PrioritizationSystem (NCAPS) scoring process. Sites that meet the National Contingency Plan (NCP) criteriafor a removal should be referred to the Superfund removal program (EPA 1988c). A comparisonof MARSSIM guidance to CERCLA and RCRA requirements is provided in Appendix F.
2.4.4 Characterization Survey
If an area could be classified as Class 1 or Class 2 for the final status survey, based on the HSAand scoping survey results, a characterization survey is warranted. The characterization survey isplanned based on the HSA and scoping survey results. This type of survey is a detailedradiological environmental characterization of the area.
The primary objectives of a characterization survey are to:
! determine the nature and extent of the contamination! collect data to support evaluation of remedial alternatives and technologies! evaluate whether the survey plan can be optimized for use in the final status survey! support Remedial Investigation/Feasibility Study requirements (CERCLA sites only) or
Facility Investigation/Corrective Measures Study requirements (RCRA sites only)! provide input to the final status survey design
The characterization survey is the most comprehensive of all the survey types and generates themost data. This includes preparing a reference grid, systematic as well as judgmentmeasurements, and surveys of different media (e.g., surface soils, interior and exterior surfaces ofbuildings). The decision as to which media will be surveyed is a site-specific decision addressedthroughout the Radiation Survey and Site Investigation Process.
2.4.5 Remedial Action Support Survey
If an area is adequately characterized and is contaminated above the derived concentrationguideline levels (DCGLs), a decontamination plan should be prepared. A remedial action supportsurvey is performed while remediation is being conducted, and guides the cleanup in a real-timemode.
Remedial action support surveys are conducted to:
! support remediation activities! determine when a site or survey unit is ready for the final status survey

Overview of the Radiation Survey and Site Investigation Process
2-24MARSSIM, Revision 1 August 2000
! provide updated estimates of site-specific parameters used for planning the final statussurvey
This manual does not provide guidance on the routine operational surveys used to supportremediation activities. The determination that a survey unit is ready for a final status surveyfollowing remediation is an important step in the RSSI Process. In addition, remedial activitiesresult in changes to the distribution of contamination within the survey unit. For most surveyunits, the site-specific parameters used during final status survey planning (e.g., variability in theradionuclide concentration, probability of small areas of elevated activity) will need to be re-established following remediation. Obtaining updated values for these critical parameters shouldbe considered when planning a remedial action support survey.
2.4.6 Final Status Survey
The final status survey is used to demonstrate compliance with regulations. This type of survey isthe major focus of this manual.
The primary objectives of the final status survey are to:
! select/verify survey unit classification! demonstrate that the potential dose or risk from residual contamination is below the
release criterion for each survey unit! demonstrate that the potential dose or risk from small areas of elevated activity is below
the release criterion for each survey unit
The final status survey provides data to demonstrate that all radiological parameters satisfy theestablished guideline values and conditions.
Although the final status survey is discussed as if it were an activity performed at a single stage ofthe site investigation process, this does not have to be the case. Data from other surveysconducted during the Radiation Survey and Site Investigation Process—such as scoping,characterization, and remedial action support surveys—can provide valuable information forplanning a final status survey provided they are of sufficient quality.
Professional judgment and biased sampling are important for locating contamination andcharacterizing the extent of contamination at a site. However, the MARSSIM focus is onplanning the final status survey which utilizes a more systematic approach to sampling. Systematic sampling is based on rules that endeavor to achieve the representativeness in samplingconsistent with the application of statistical tests.

Overview of the Radiation Survey and Site Investigation Process
2-25August 2000 MARSSIM, Revision 1
2.4.7 Regulatory Agency Confirmation and Verification
The regulatory agency responsible for the site often confirms whether the site is acceptable forrelease. This confirmation may be accomplished by the agency or an impartial party. Althoughsome actual measurements may be performed, much of the work required for confirmation andverification will involve evaluation and review of documentation and data from survey activities. The evaluation may include site visits to observe survey and measurement procedures or split-sample analyses by the regulatory agency's laboratory. Therefore, accounting for confirmationand verification activities during the planning stages is important to each type of survey. In somecases, post-remedial sampling and analysis may be performed by an impartial party. The review ofsurvey results should include verifying that the data quality objectives are met, reviewing theanalytical data used to demonstrate compliance, and verifying that the statistical test resultssupport the decision to release the site. Confirmation and verification are generally ongoingprocesses throughout the Radiation Survey and Site Investigation (RSSI) Process.
2.5 Demonstrating Compliance With a Dose- or Risk-Based Regulation
MARSSIM presents a process for demonstrating compliance with a dose- or risk-basedregulation. The RSSI Process provides flexibility in planning and performing surveys based onsite-specific considerations. A dose- or risk-based regulation usually allows one to take intoaccount radionuclide and site-specific differences.
The final status survey is designed to demonstrate compliance with the release criterion. Theearlier surveys in the RSSI Process are performed to support decisions and assumptions used inthe design of the final status survey. These preliminary surveys (e.g., scoping, characterization)may have other objectives in addition to compliance demonstration that need to be consideredduring survey planning that are not fully discussed in this manual. For this reason MARSSIMfocuses on final status survey design. To allow maximum flexibility in the survey design,MARSSIM provides guidance on designing a survey using the RSSI Process. This allows userswith few resources available for planning to develop an acceptable survey design. The rationalefor the development of the guidance in MARSSIM is presented in the following sections. Userswith available planning resources are encouraged to investigate alternate survey designs for site-specific applications using the information provided in Section 2.6.
2.5.1 The Decision to Use Statistical Tests
The objective of compliance demonstration is to provide some level of confidence that the releasecriterion is not exceeded. As previously stated, 100% confidence in a decision cannot be provenbecause the data always contain some uncertainty. The use of statistical methods is necessary toprovide a quantitative estimate of the probability that the release criterion is not exceeded at a

Overview of the Radiation Survey and Site Investigation Process
2-26MARSSIM, Revision 1 August 2000
particular site. Statistical methods provide for specifying (controlling) the probability of makingdecision errors and for extrapolating from a set of measurements to the entire site in ascientifically valid fashion (EPA 1994b).
Clearly stating the null hypothesis is necessary before a statistical test can be performed. The nullhypothesis recommended for use in MARSSIM is: “The residual radioactivity in the survey unitexceeds the release criterion.” This statement directly addresses the issue of compliancedemonstration for the regulator and places the burden of proof for demonstrating compliance onthe site owner or responsible party. The statistical tests are only applied at sites that weresubjected to an Historical Site Assessment (HSA). At this point, the results of the HSA havebeen reviewed and the site is determined to be impacted based on existing data and professionaljudgment as described in Chapter 3. An impacted site, by definition, is expected to contain areasof contamination, so this statement of the null hypothesis is reasonable for these sites.
The information needed to perform a statistical test is determined by the assumptions used todevelop the test. MARSSIM recommends the use of nonparametric statistical tests because thesetests use fewer assumptions, and consequently require less information to verify theseassumptions. The tests described in MARSSIM (see Chapter 8) are relatively easy to understandand implement compared to other statistical tests.
Site conditions can also affect the selection of statistical tests. The distribution of contaminationis of particular concern at sites with residual radioactivity. Is the contamination distributeduniformly, or is it located in small areas of elevated activity? Is the residual radioactivity presentas surface, volumetric, or subsurface contamination? To demonstrate the use of the RSSI Process at radiation sites, MARSSIM addresses only surface soil and building surfaces for thefinal status survey to demonstrate compliance. This represents a situation that is expected tocommonly occur at sites with radioactive contamination, and allows the survey design to take intoaccount the ability to directly measure surface radioactivity using scanning techniques. Othercontaminated media may be identified during the HSA or preliminary surveys (i.e., scoping,characterization, remedial action support). If other contaminated media (e.g., subsurfacecontamination, volumetric contamination of building materials) are identified, methodologies fordemonstrating compliance other than those described in this manual may need to be developed orevaluated. Situations where scanning techniques may not be effective (e.g., volumetric orsubsurface contamination) are discussed in existing guidance (EPA 1989a, EPA 1994b, EPA1994d).
Overview of the Radiation Survey and Site Investigation Process
2-27August 2000 MARSSIM, Revision 1
2.5.1.1 Small Areas of Elevated Activity
While the development of DCGLs is outside the scope of MARSSIM, this manual assumes thatDCGLs will be developed using exposure pathway models which in turn assume a relativelyuniform distribution of contamination. While this represents an ideal situation, small areas ofelevated activity are a concern at many sites.
MARSSIM addresses the concern for small areas of elevated activity by using a simplecomparison to an investigation level as an alternative to statistical methods. Using the elevatedmeasurement comparison (EMC) represents a conservative approach, in that every measurementneeds to be below the action level. The investigation level for this comparison is called theDCGLEMC, which is the DCGLW modified to account for the smaller area. This area factorcorrection (discussed in Section 5.5.2.4) is considered to be a defensible modification because theexposure assumptions (e.g., exposure time and duration) are the same as those used to developthe DCGLW. In the case of multiple areas of elevated activity in a survey unit, a posting plot(discussed in Section 8.2.2.2) or similar representation of the distribution of activity in the surveyunit can be used to determine any pattern in the location of these areas.
If elevated levels of residual radioactivity are found in an isolated area, in addition to residualradioactivity distributed relatively uniformly across the survey unit, the unity rule (Section 4.3.3)can be used to ensure that the total dose or risk meets the release criterion. If there is more thanone of these areas, a separate term should be included in the calculation for each area of elevatedactivity. As an alternative to the unity rule, the dose or risk due to the actual residualradioactivity distribution can be calculated if there is an appropriate exposure pathway modelavailable. Note that these considerations generally only apply to Class 1 survey units, since areasof elevated activity should not be present in Class 2 or Class 3 survey units.
2.5.1.2 Relatively Uniform Distribution of Contamination
As discussed previously, the development of a DCGL starts with the assumption of a relativelyuniform distribution of contamination. Some variability in the measurements is expected. This isprimarily due to a random spatial distribution of contamination and uncertainties in themeasurement process. The arithmetic mean of the measurements taken from such a distributionwould represent the parameter of interest for demonstrating compliance.
Whether or not the radionuclide of concern is present in background determines the form of thestatistical test. The Wilcoxon Rank Sum (WRS) test is recommended for comparisons of surveyunit radionuclide concentrations with background. When the radionuclide of concern is notpresent in background, the Sign test is recommended. Instructions on performing these tests areprovided in Section 8.3 and Section 8.4.

Overview of the Radiation Survey and Site Investigation Process
2-28MARSSIM, Revision 1 August 2000
The WRS and Sign tests are designed to determine whether or not the level of residual activityuniformly distributed throughout the survey unit exceeds the DCGLW. Since these methods arebased on ranks, the results are generally expressed in terms of the median. When the underlyingmeasurement distribution is symmetric, the mean is equal to the median. When the underlyingdistribution is not symmetric, these tests are still true tests of the median but only approximatetests of the mean. However, numerous studies show that this is a fairly good approximation(Hardin and Gilbert, 1993). The assumption of symmetry is less restrictive than that of normalitybecause the normal distribution is itself symmetric. If, however, the measurement distribution isskewed to the right, the average will generally be greater than the median. In severe cases, theaverage may exceed the DCGLW while the median does not. For this reason, MARSSIMrecommends comparing the arithmetic mean of the survey unit data to the DCGLW as a first stepin the interpretation of the data (see Section 8.2.2.1).
The WRS test is a two-sample test that compares the distribution of a set of measurements in asurvey unit to that of a set of measurements in a reference area. The test is performed by firstadding the value of the DCGLW to each measurement in the reference area. The combined set ofsurvey unit data and adjusted reference area data are listed, or ranked, in increasing numericalorder. If the ranks of the adjusted reference site measurements are significantly higher than theranks of the survey unit measurements, the survey unit demonstrates compliance with the releasecriterion.
The Sign test is a one-sample test that compares the distribution of a set of measurements in asurvey unit to a fixed value, namely the DCGLW. First, the value for each measurement in thesurvey unit is subtracted from the DCGLW. The resulting distribution is tested to determine if thecenter of the distribution is greater than zero. If the adjusted distribution is significantly greaterthan zero, the survey unit demonstrates compliance with the release criterion.
Guidance on performing the statistical tests and presenting graphical representations of the data isprovided in Chapter 8 and Appendix I.
2.5.2 Classification
Classifying a survey unit is crucial to the survey design because this step determines the level ofsurvey effort based on the potential for contamination. Areas are initially classified as impacted ornon-impacted based on the results of the HSA. Non-impacted areas have no reasonable potentialfor residual contamination and require no further evidence to demonstrate compliance with therelease criterion. When planning the final status survey, impacted areas may be further dividedinto survey units. If a survey unit is classified incorrectly, the potential for making decision errorsincreases. For this reason, all impacted areas are initially assumed to be Class 1. Class 1 areasrequire the highest level of survey effort because they are known to have contaminantconcentrations above the DCGLW, or the contaminant concentrations are unknown. Information

Overview of the Radiation Survey and Site Investigation Process
2-29August 2000 MARSSIM, Revision 1
indicating the potential or known contaminant concentration is less than the DCGLW can be usedto support re-classification of an area or survey unit as Class 2 or Class 3.
There is a certain amount of information necessary to demonstrate compliance with the releasecriterion. The amount of this information that is available and the level of confidence in thisinformation is reflected in the area classification. The initial assumption for affected areas is thatnone of the necessary information is available. This results in a default Class 1 classification. Thiscorresponds with the statement of the null hypothesis that the survey unit is contaminated, andrepresents the most efficient case for the regulator. For this reason, the recommendations for aClass 1 final status survey represent the minimal amount of information necessary to demonstratecompliance.
Not all of the information available for an area will have been collected for purposes ofcompliance demonstration. For example, data are collected during characterization surveys todetermine the extent, and not necessarily the amount, of contamination. This does not mean thatthe data do not meet the objectives of compliance demonstration, but may mean that statisticaltests would be of little or no value because the data have not been collected using appropriateprotocols or design. Rather than discard potentially valuable information, MARSSIM allows for aqualitative assessment of existing data (Chapter 3). Non-impacted areas represent areas where allof the information necessary to demonstrate compliance is available from existing sources. Forthese areas, no statistical tests are considered necessary. A classification as Class 2 or Class 3indicates that some information on describing the potential for contamination is available for thatsurvey unit. The data collection recommendations are modified to account for the informationalready available, and the statistical tests are performed on the data collected during the finalstatus survey.
As previously stated, the conservative assumption that an area receive a classification of Class 1 isonly applied to impacted sites. The HSA (described in Chapter 3) is used to provide an initialclassification for the site of impacted or non-impacted based on existing data and professionaljudgment.
2.5.3 Design Considerations for Small Areas of Elevated Activity
Scanning surveys are typically used to identify small areas of elevated activity. The size of thearea of elevated activity that the survey is designed to detect affects the DCGLEMC , which in turndetermines the ability of a scanning technique to detect these areas. Larger areas have a lowerDCGLEMC and are more difficult to detect than smaller areas.
The percentage of the survey unit to be covered by scans is also an important consideration. 100% coverage means that the entire surface area of the survey unit has been covered by the fieldof view of the scanning instrument. 100% scanning coverage provides a high level of confidence

Overview of the Radiation Survey and Site Investigation Process
2-30MARSSIM, Revision 1 August 2000
that all areas of elevated activity have been identified. If the available information concerning thesurvey unit provides information demonstrating that areas of elevated activity may not be present,the survey unit may be classified as Class 2 or Class 3. Because there is already some level ofconfidence that areas of elevated activity are not present, 100% coverage may not be necessary todemonstrate compliance. The scanning survey coverage may be adjusted based on the level ofconfidence supplied by the existing data. If there is evidence providing a high level of confidencethat areas of elevated activity are not present, 10% scanning coverage may meet the objectives ofthe survey. If the existing information provides a lower level of confidence, the scanningcoverage may be adjusted between 10 and 100% based on the level of confidence and theobjectives of the survey. A general recommendation is to always err to minimize the decisionerror. In general, scanning the entire survey unit is less expensive than finding areas of elevatedactivity later in the survey process. Finding such areas will lead to performing additional surveysdue to survey unit misclassification.
Another consideration for scanning surveys is the selection of scanning locations. This is not anissue when 100% of the survey unit is scanned. Whenever less than 100% of the survey unit isscanned, a decision must be made on what areas are scanned. The general recommendation isthat when large amounts of the survey unit are scanned (e.g., >50%), the scans should besystematically performed along transects of the survey unit. When smaller amounts of the surveyunit are scanned, selecting areas based on professional judgment may be more appropriate andefficient for locating areas of elevated activity (e.g., drains, ducts, piping, ditches). A combinationof 100% scanning in portions of the survey unit selected based on professional judgement and lesscoverage (e.g., 20-50%) for all remaining areas may result in an efficient scanning survey designfor some survey units.
2.5.4 Design Considerations for Relatively Uniform Distributions of Contamination
The survey design for areas with relatively uniform distributions of contamination is primarilycontrolled by classification and the requirements of the statistical test. Again, therecommendations provided for Class 1 survey units are designed to minimize the decision error. Recommendations for Class 2 or Class 3 surveys may be appropriate based on the existinginformation and the level of confidence associated with this information.
The first consideration is the identification of survey units. The identification of survey units maybe accomplished early (e.g., scoping) or late (e.g., final status) in the survey process, but must beaccomplished prior to performing a final status survey. Early identification of survey units canhelp in planning and performing surveys throughout the RSSI Process. Late identification ofsurvey units can prevent misconceptions and problems associated with reclassification of areasbased on results of subsequent surveys. The area of an individual survey unit is determined basedon the area classification and modeling assumptions used to develop the DCGLW. Identificationof survey units is discussed in Section 4.6.

Overview of the Radiation Survey and Site Investigation Process
2-31August 2000 MARSSIM, Revision 1
Another consideration is the estimated number of measurements to demonstrate compliance usingthe statistical tests. Section 5.5.2 describes the calculations used to estimate the number ofmeasurements. These calculations use information that is usually available from planning or frompreliminary surveys (i.e., scoping, characterization, remedial action support).
The information needed to perform these calculations is: 1) acceptable values for the probabilitiesof making Type I (α) or Type II (β) decision errors, 2) the estimates of the measurementvariability in the survey unit (σs ) and the reference area (σr ) if necessary, and 3) the shift (∆).
MARSSIM recommends that site-specific values be determined for each of these parameters. Toassist the user in selecting site-specific values for decision error rates and ∆, MARSSIMrecommends that an initial value be selected and adjusted to develop a survey design that isappropriate for a specific site. An arbitrary initial value of one half the DCGLW is selected for thelower bound of the gray region. This value is adjusted to provide a relative shift (∆/σ) valuebetween one and three as described in Section 5.5.2. For decision error rates a value thatminimizes the risk of making a decision error is recommended for the initial calculations. Thenumber of measurements can be recalculated using different decision error rates until an optimumsurvey design is obtained. A prospective power curve (see Appendix D, Section D.6 andAppendix I, Section I.9) that considers the effects of these parameters can be very helpful indesigning a survey and considering alternative values for these parameters, and is highlyrecommended.
To ensure that the desired power is achieved with the statistical test and to account foruncertainties in the estimated values of the measurement variabilities, MARSSIM recommendsthat the estimated number of measurements calculated using the formulas in Section 5.5.2.2 and5.5.2.3 be increased by 20%. Insufficient numbers of measurements may result in failure toachieve the DQO for power and result in increased Type II decision errors, where survey unitsbelow the release criterion fail to demonstrate compliance.
Once survey units are identified and the number of measurements is determined, measurementlocations should be selected. The statistical tests assume that the measurements are taken fromrandom locations within the survey unit. A random survey design is used for Class 3 survey units,and a random starting point for the systematic grid is used for Class 2 and Class 1 survey units.
2.5.5 Developing an Integrated Survey Design
To account for assumptions used to develop the DCGLW and the realistic possibility of small areasof elevated activity, an integrated survey design should be developed to include all of the designconsiderations. An integrated survey design combines a scanning survey for areas of elevated

Overview of the Radiation Survey and Site Investigation Process
2-32MARSSIM, Revision 1 August 2000
activity with random measurements for relatively uniform distributions of contamination. Table2.2 presents the recommended conditions for demonstrating compliance for a final status surveybased on classification.
Table 2.2 Recommended Conditions for Demonstrating Compliance Based onSurvey Unit Classification for a Final Status Survey
Survey UnitClassification
StatisticalTest
Elevated MeasurementComparison
Sampling and/orDirect Measurements
Scanning
Impacted Class 1 Yes Yes Systematic 100% Coverage
Class 2 Yes Yes Systematic 10-100% Systematic
Class 3 Yes Yes Random Judgmental
Non-Impacted No No No None
Random measurement patterns are used for Class 3 survey units to ensure that the measurementsare independent and meet the requirements of the statistical tests. Systematic grids are used forClass 2 survey units because there is an increased probability of small areas of elevated activity. The use of a systematic grid allows the decision maker to draw conclusions about the size of anypotential areas of elevated activity based on the area between measurement locations, while therandom starting point of the grid provides an unbiased method for determining measurementlocations for the statistical tests. Class 1 survey units have the highest potential for small areas ofelevated activity, so the areas between measurement locations are adjusted to ensure that theseareas can be identified by the scanning survey if the area of elevated activity is not detected by thedirect measurements or samples.
The objectives of the scanning surveys are different. Scanning is used to identify locations withinthe survey unit that exceed the investigation level. These locations are marked and receiveadditional investigations to determine the concentration, area, and extent of the contamination.
For Class 1 areas, scanning surveys are designed to detect small areas of elevated activity that arenot detected by the measurements using the systematic grids. For this reason, the measurementlocations and the number of measurements may need to be adjusted based on the sensitivity of thescanning technique (see Section 5.5.2.4). This is also the reason for recommending 100%coverage for the scanning survey.
Scanning surveys in Class 2 areas are also performed primarily to find areas of elevated activitynot detected by the measurements using the systematic pattern. However, the measurement

Overview of the Radiation Survey and Site Investigation Process
2-33August 2000 MARSSIM, Revision 1
locations are not adjusted based on sensitivity of the scanning technique, and scanning is onlyperformed in portions of the survey unit. The level of scanning effort should be proportional tothe potential for finding areas of elevated activity: in Class 2 survey units that have residualradioactivity close to the release criterion a larger portion of the survey unit would be scanned,but for survey units that are closer to background scanning a smaller portion of the survey unitmay be appropriate. Class 2 survey units have a lower probability for areas of elevated activitythan Class 1 survey units, but some portions of the survey unit may have a higher potential thanothers. Judgmental scanning surveys would focus on the portions of the survey unit with thehighest probability for areas of elevated activity. If the entire survey unit has an equal probabilityfor areas of elevated activity, or the judgmental scans don’t cover at least 10% of the area,systematic scans along transects of the survey unit or scanning surveys of randomly selected gridblocks are performed.
Class 3 areas have the lowest potential for areas of elevated activity. For this reason, MARSSIMrecommends that scanning surveys be performed in areas of highest potential (e.g., corners,ditches, drains) based on professional judgment. This provides a qualitative level of confidencethat no areas of elevated activity were missed by the random measurements or that there were noerrors made in the classification of the area.
Note that the DCGL itself is not free of error. The assumptions made in any model used todevelop DCGLs for a site should be examined carefully. The results of this examination shoulddetermine if the use of site-specific parameters result in large changes in the DCGLs, or whether asite-specific model should be developed to obtain DCGLs more relevant to the exposureconditions at the site. Appendix D, Section D.6 provides additional information about theuncertainty associated with the DCGL and other considerations for developing an integratedsurvey design using the DQO Process.
2.6 Flexibility in Applying MARSSIM Guidance
Section 2.5 describes an example that applies the performance-based guidance presented inSection 2.3 and Section 2.4 to design a survey for a site with specific characteristics (i.e., surfacesoil and building surface contamination). Obviously this design cannot be uniformly applied atevery site with radioactive contamination, so flexibility has been provided in the form ofperformance-based guidance. This guidance encourages the user to develop a site-specific surveydesign to account for site-specific characteristics. It is expected that most users will adopt theportions of the MARSSIM guidance that apply to their site. In addition, changes to the overallsurvey design that account for site-specific differences would be presented as part of the surveyplan. The plan should also demonstrate that the extrapolation from measurements performed atspecific locations to the entire site or survey unit is performed in a technically defensible manner.

Overview of the Radiation Survey and Site Investigation Process
2-34MARSSIM, Revision 1 August 2000
Where Section 2.5 describes the development of a generic survey design that will be applicable atmost radiation sites, this section describes the flexibility available within the MARSSIM fordesigning a site-specific survey design. Alternate methods for accomplishing the demonstration ofcompliance are briefly described and references for obtaining additional information on thesealternate methods are provided.
2.6.1 Alternate Statistical Methods
MARSSIM encourages the use of statistics to provide a quantitative estimate of the probabilitythat the release criterion is not exceeded at a site. While it is unlikely that any site will be able todemonstrate compliance with a dose- or risk-based regulation without at least considering the useof statistics, MARSSIM recognizes that the use of statistical tests may not always provide themost effective method for demonstrating compliance. For example, MARSSIM recommends asimple comparison to an investigation level to evaluate the presence of small areas of elevatedactivity in place of complicated statistical tests. At some sites a simple comparison of eachmeasurement result to the DCGLW, to demonstrate that all the measurement results are below therelease criterion, may be more effective than statistical tests for the overall demonstration ofcompliance with the regulation provided an adequate number of measurements are performed.
MARSSIM recommends the use of nonparametric statistical tests for evaluating environmentaldata. There are two reasons for this recommendation: 1) environmental data is usually notnormally distributed, and 2) there are often a significant number of qualitative survey results (e.g.,less than MDC). Either one of these conditions means that parametric statistical tests may not beappropriate. If one can demonstrate that the data are normally distributed and that there are asufficient number of results to support a decision concerning the survey unit, parametric tests willgenerally provide higher power (or require fewer measurements to support a decision concerningthe survey unit). The tests to demonstrate that the data are normally distributed generally requiremore measurements than the nonparametric tests. EPA provides guidance on selecting andperforming statistical tests to demonstrate that data are normally distributed (EPA 1996a). Guidance is also available for performing parametric statistical tests (NRC 1992, EPA 1989a,EPA 1994b, EPA 1996a).
There are a wide variety of statistical tests designed for use in specific situations. These tests maybe preferable to the generic statistical tests recommended in MARSSIM when the underlyingassumptions for these tests can be verified. Table 2.3 lists several examples of statistical tests thatmay be considered for use at individual sites or survey units. A brief description of the tests andreferences for obtaining additional information on these tests are also listed in the table. Applyingthese tests may require consultation with a statistician.

August 2000
2-35M
AR
SSIM, R
evision 1
Overview
of the Radiation Survey and Site Investigation Process
Table 2.3 Examples of Alternate Statistical Tests
AlternateTests
ProbabilityModel Assumed Type of Test Reference Advantages Disadvantages
Alternate 1-Sample Tests (no reference area measurements)
Student’s t Test Normal Parametric test for Ho: Mean < L
Guidance for DataQuality Assessment,EPA QA/G-9, p. 3.2-2.
Appropriate if dataappears to be normallydistributed andsymmetric.
Relies on a non-robustestimator for µ and σ. Sensitive to outliers anddepartures fromnormality.
t Test Applied ToLogarithms
Lognormal Parametric test for Ho:Median < L
Guidance for DataQuality Assessment,EPA QA/G-9, p. 3.2-2
This is a well- knownand easy-to-apply test. Useful for a quicksummary of thesituation if the data isskewed to right.
Relies on a non-robustestimator for σ. Sensitive to outliers anddepartures fromlognormality.
MinimumVarianceUnbiasedEstimator ForLognormal Mean
Lognormal Parametric estimatesfor mean and varianceof lognormaldistribution
Gilbert, StatisticalMethods forEnvironmentalPollutionMonitoring, p. 164,1987.
A good parametric testto use if the data islognormal.
Inappropriate if thedata is not lognormal.
Chen Test Skewed to right,includingLognormal
Parametric test forHo: Mean > 0
Journal of theAmerican StatisticalAssociation (90),p.767, 1995.
A good parametric testto use if the data islognormal.
Applicable only fortesting Ho: “survey unitis clean.” Survey unitmust be significantlygreater than 0 to fail. Inappropriate if thedata is not skewed tothe right.

MA
RSSIM
, Revision 1
2-36A
ugust 2000
Overview
of the Radiation Survey and Site Investigation Process
Table 2.3 (continued)
AlternativeTests
ProbabilityModel Assumed Type of Test Reference Advantages Disadvantages
Alternate 1-Samples Tests (no reference area measurements)
Bayesian Approaches Varies, but afamily ofprobabilitydistributionsmust be selected.
Parametric test for Ho: Mean < L
DeGroot, OptimalStatistical Decisions,p. 157, 1970.
Permits use ofsubjective “expertjudgment” ininterpretation of data.
Decisions based onexpert judgment may bedifficult to explain anddefend.
Bootstrap No restriction Nonparametric. Usesresampling methods toestimate samplingvariance.
Hall, Annals ofStatistics (22), p.2011-2030, 1994.
Avoids assumptionsconcerning the type ofdistribution.
Computer intensiveanalysis required. Accuracy of the resultscan be difficult toassess.
LognormalConfidence IntervalsUsing Bootstrap
Lognormal Uses resamplingmethods to estimateone-sided confidenceinterval for lognormalmean.
Angus, TheStatistician (43), p.395, 1994.
Nonparametric methodapplied within aparametric lognormalmodel.
Computer intensiveanalysis required. Accuracy of the resultscan be difficult toassess.

August 2000
2-37M
AR
SSIM, R
evision 1
Overview
of the Radiation Survey and Site Investigation Process
Table 2.3 (continued)
AlternativeTests
ProbabilityModel Assumed Type of Test Reference Advantages Disadvantages
Alternate 2-Sample Tests (reference area measurements are required)
Student’s t Test Symmetric,normal
Parametric test fordifference in meansHo: µx < µy
Guidance for DataQuality Assessment,EPA QA/G-9, p. 3.3-2
Easy to apply. Performance for non-normal data isacceptable.
Relies on a non-robustestimator for σ,therefore test results aresensitive to outliers.
Mann-Whitney Test No restrictions Nonparametric testdifference in locationHo: µx < µy
Hollander andWolfe,NonparametricStatistical Methods,p. 71, 1973.
Equivalent to the WRStest, but used lessoften. Similar toresampling, becausetest is based on set ofall possible differencesbetween the two datasets.
Assumes that the onlydifference between thetest and reference areasis a shift in location.
Kolmogorov-Smirnov
No restrictions Nonparametric test forany difference betweenthe 2 distributions
Hollander andWolfe,NonparametricStatistical Methods,p. 219, 1973.
A robust test forequality of two sampledistributions againstall alternatives.
May reject becausevariance is high,although mean is incompliance.
BayesianApproaches
Varies, but afamily ofprobabilitydistributions mustbe selected
Parametric tests fordifference in means ordifference in variance.
Box and Tiao,Bayesian Inferencein StatisticalAnalysis, Chapter 2,1973.
Permits use of “expertjudgment” in theinterpretation of data.
Decisions based onexpert judgement maybe difficult to explainand defend.

MA
RSSIM
, Revision 1
2-38A
ugust 2000
Overview
of the Radiation Survey and Site Investigation Process
Table 2.3 (continued)
AlternativeTests
Probability ModelAssumed Type of Test Reference Advantages Disadvantages
Alternate 2-Sample Tests (reference area measurements are required)
2-SampleQuantile Test
No restrictions Nonparametric test fordifference in shape andlocation.
EPA, Methods forEvaluating theAttainment ofCleanup Standards,Vol. 3, p. 7.1, 1992.
Will detect if surveyunit distributionexceeds referencedistribution in theupper quantiles.
Applicable only fortesting Ho: “survey unitis clean.” Survey unitmust be significantlygreater than 0 to fail.
SimultaneousWRS andQuantile Test
No restrictions Nonparametric test fordifference in shape andlocation.
EPA, Methods forEvaluating theAttainment ofCleanup Standards,Vol. 3, p. 7.17, 1992.
Additional level ofprotection provided byusing two tests. Hasadvantages of bothtests.
Cannot be combinedwith the WRS test thatuses Ho: “survey unit isnot clean.” Shouldonly be combined withWRS test for Ho:“survey unit is clean.”
Bootstrap andOther ResamplingMethods
No restrictions Nonparametric. Usesresampling methods toestimate samplingvariance.
Hall, Annals ofStatistics (22),p. 2011, 1994.
Avoids assumptionsconcerning the type ofdistribution. Generates informativeresamplingdistributions forgraphing.
Computer intensiveanalysis required.
Alternate to Statistical Tests
Decision Theory No restrictions Incorporates lossfunction in thedecision theoryapproach.
DOE, Statistical andCost-BenefitEnhancements to theDQO Process forCharacterizationDecisions, 1996.
Combines elements ofcost-benefit analysisand risk assessmentinto the planningprocess.
Limited experience inapplying the method tocompliancedemonstration anddecommissioning. Computer intensiveanalysis required.

Overview of the Radiation Survey and Site Investigation Process
5 Information on the Observational Approach recommended by Sandia National Laboratories is availableon the internet at http://www.em.doe.gov/tie/strechar.html.
2-39August 2000 MARSSIM, Revision 1
2.6.2 Alternate Null Hypothesis
The selection of the null hypothesis in MARSSIM is designed to be protective of human healthand the environment as well as consistent with current methods used for demonstratingcompliance with regulations. MARSSIM also acknowledges that site-specific conditions (e.g.,high variability in background, lack of measurement techniques with appropriate detectionsensitivity) may preclude the use of the null hypothesis that the survey unit is assumed to becontaminated. Similarly, a different null hypothesis and methodology could be used for differentsurvey units (e.g., Class 3 survey units). NUREG 1505 (NRC 1997b) provides guidance ondetermining when background variability might be an issue, designing surveys based on the nullhypothesis that the survey unit concentration is indistinguishable from the concentration in thereference area, and performing statistical tests to demonstrate that the survey unit isindistinguishable from background.
2.6.3 Integrating MARSSIM with Other Survey Designs
2.6.3.1 Accelerated Cleanup Models
There are a number of approaches designed to expedite site cleanups. These approaches can savetime and resources by reducing sampling, preventing duplication of effort, and reducing inactivetime periods between steps in a cleanup process. Although Section 2.4 describes the RSSIProcess recommended in MARSSIM as one with six principal steps, MARSSIM is not intented tobe a serial process that would slow site cleanups. Rather, MARSSIM supports existing programsand encourages approaches to expedite site cleanups. Part of the significant emphasis on planningin MARSSIM is meant to promote saving time and resources.
There are many examples of accelerated cleanup approaches. The Superfund AcceleratedCleanup Model (SACM), which includes a module called integrated site assessment, has as itsobjectives increased efficiency and shorter response times (EPA 1992f, EPA 1993c, EPA 1997b).
Sandia National Laboratories (SNL) uses the Observational Approach. This approach uses aniterative process of sample collection and real-time data evaluation to characterize a site. Thisprocess allows early field results to guide later data collection in the field. Data collection islimited to only that required for selecting a unique remedy for a site.5
At DOE’s Hanford Site, the parties to the Tri-Party Agreement negotiated a method to implementthe CERCLA process in order to 1) accelerate the assessment phase, and 2) coordinate RCRA

Overview of the Radiation Survey and Site Investigation Process
6 Information on the Hanford Past Practice Strategy is available on the internet athttp://www.bhi-erc.com/map/sec5.html.
7 Information on the Argonne National Laboratory adaptive sampling programs can be obtained on theinternet at http://www.ead.anl.gov/~web/newead/prgprj/proj/adaptive/adaptive.html.
2-40MARSSIM, Revision 1 August 2000
and CERCLA requirements whenever possible, thereby resulting in cost savings. The HanfordPast Practice Strategy (HPPS) was developed in 1991 to accelerate decisionmaking and initiationof remediation through activities that include maximizing the use of existing data consistent withdata quality objectives.6
The adaptive sampling programs at the Environmental Assessment Division (EAD) of ArgonneNational Laboratory quantitatively fuse soft data (for example, historical records, aerial photos,nonintrusive geophysical data) with hard sampling results to estimate contaminant extent, measurethe uncertainty associated with these estimates, determine the benefits from collecting additionalsamples, and assist in siting new sample locations to maximize the information gained.7
2.6.3.2 Superfund Soil Screening Guidance
The goal of the Soil Screening Guidance (EPA 1996b, EPA 1996c) is to help standardize andaccelerate the evaluation and cleanup of contaminated soils at sites on the National Priorities List(NPL) designated for future residential land use. The guidance provides a methodology forcalculating risk-based, site-specific, soil screening levels for chemical contaminants in soil thatmay be used to identify areas needing further investigation at NPL sites. While the Soil ScreeningGuidance was not developed for use with radionuclides, the methodology used is comparable tothe MARSSIM guidance for demonstrating compliance using DCGLs. The Soil ScreeningGuidance assumes that there is a low probability of contamination, and does not account for smallareas of elevated activity. These assumptions correlate to a Class 3 area in MARSSIM. Becausethe Soil Screening Guidance is designed as a screening tool instead of a final demonstration ofcompliance, the specific values for decision error levels, the bounds of the gray region, and thenumber and location of measurements are developed to support these objectives. However,MARSSIM guidance can be integrated with the survey design in the Soil Screening Guidanceusing this guidance as an alternate MARSSIM survey design.
The Soil Screening Guidance survey design is based on collecting samples, so scan surveys anddirect measurements are not considered. To reduce analytical costs the survey designrecommends compositing samples and provides a statistical test for demonstrating compliance. Compositing samples provides an additional source of uncertainty and prevents the detection ofsmall areas of elevated activity.