2. identity, physical and chemical properties, and ... · 13 2. identity, physical and chemical...
TRANSCRIPT

13
2. IDENTITY, PHYSICAL AND CHEMICALPROPERTIES, AND ANALYTICAL METHODS
This monograph deals with vinyl chloride (VC) monomer itselfand is not an evaluation of polyvinyl chloride (PVC), the polymer ofVC.
2.1 Identity
Chemical formula: C2H3Cl
Chemical structure: H2C=CHCl
Relative molecular 62.5 mass:
Common names: Vinyl chloride
CAS chemical name: Ethene, chloro-
IUPAC name: Chloroethene
CAS Registry 75-01-4 number:
EC Number: 602-023-007
EINECS Number: 2008310
Synonyms: vinyl chloride monomer, monochloro-ethene; monochloroethylene; 1-chloro-ethylene, chloroethene, chloroethylene
Purity 99.9% (by weight); water: max.120 mg/kg; HCl: max. 1 mg/kg(BUA, 1989)Up to the 1960s the purity was not sohigh (Lester et al., 1963)
Typical trace 10–100 mg/kg range: chloromethane, components chloroethane; 1–10 mg/kg range: ethyne
(acetylene), 1,3-butadiene, butene,1,2-dichloroethane, ethene, propadiene(allene), propene, 1-butyne-3-ene (vinylacetylene) (BUA, 1989)

EHC 215: Vinyl Chloride______________________________________________________
14
2.2 Physical and chemical properties
Some physical properties of VC are given in Table 1. Underambient conditions, vinyl chloride is a colourless, flammable gas witha slightly sweet odour. It is heavier than air and has relatively lowsolubility. There are discrepancies in the literature with regard toHenry's Law constant (air-water partition coefficient, Hc). Whereassome authors give a value between 1 and 3 kPa.m3/mol, other sourcesquote a value two orders higher. Large uncertainties in the absoluteaqueous solubility in older studies probably contribute most to thesediscrepancies (Ashworth et al., 1988). It is an azeotrope with water:0.1 parts water/100 parts vinyl chloride (Bönnighausen, 1986;Rossberg et al., 1986). VC is soluble in almost all organic solvents.
Since it is a gas that is heavier than air, VC can spread over theground creating an exposure long distances away from the originalsource and can form explosive mixtures. The odour threshold valueis very subjective (see Table 1) and is far above the present acceptedoccupational safety threshold values (see Annex 1).
VC is transported as a compressed liquid. As it does not tend topolymerize easily, liquid VC (in the absence of oxygen and water) canbe stored and transported without polymerization inhibitors(Bönnighausen, 1986).
At ambient temperatures in the absence of air, dry purified VC ishighly stable and non-corrosive. Above 450 °C, partial decompositionoccurs yielding acetylene, hydrogen chloride and trace amounts of2-chloro-1,3-butadiene (chloroprene) (Rossberg et al., 1986). Thisreaction also occurs by lower temperatures (at 30 °C and under) in thepresence of sodium or potassium hydroxide (Bönnighausen, 1986).
Combustion of VC in air produces carbon dioxide and hydrogenchloride. Under oxygen deficient conditions, traces of phosgene maybe formed (Rossberg et al., 1986). In chlorine-atom-initiated oxidationof VC, the vinyl chloride peroxide formed decomposes toformaldehyde, hydrogen chloride and carbon monoxide (Bauer &Sabel, 1975; Sanhueza et al., 1976).

Identity, Physical and Chemical Properties, Analytical Methods______________________________________________________
15
Table 1. Some physical and chemical properties of vinyl chloride
Melting point –153.8 °C Bönnighausen (1986);Dreher (1986)
Boiling point –13.4 °C Bönnighausen (1986); (at 101.3 kPa) Dreher (1986)
Flash point –78 °C Bönnighausen (1986); (open cup) Dreher (1986)
Autoignition 472 °C Bönnighausen (1986); temperature Dreher (1986)
Critical temperature 156 °C Bönnighausen (1986);Dreher (1986)
Critical pressure 5600 kPa Bönnighausen (1986);Dreher (1986)
Explosion limits in air 3.8–29.3 vol% Bönnighausen (1986)in air (20 °C);
4–22 vol% Dreher (1986)
Decomposition 450 °C Bönnighausen (1986) temperature
Density (20 °C) 0.910 g/cm3 Bönnighausen (1986)
Vapour pressure at –20 °C 78 kPa Dreher (1986) 0 °C 165 kPa 20 °C 333 kPa
Solubility of VC in water; 0.95 wt% (9.5 g/litre) DeLassus & Schmidtextrapolated from low over temperature (1981)pressure experiments rangeover range 15–85 °C 1.1 g/litre Euro Chlor (1999)at 20 °C
Solubility of water 0.02 ml (–20 °C) Bönnighausen (1986) in 100 g VC 0.08 ml (+ 20 °C)
Henry's Law Constant 1.96 at 17.5 °C Gossett (1987) (Hc) (kPa.m3/mol) 2.0–2.8 at 25 °C Ashworth et al. (1988)
18.8 at 20 °C Euro Chlor (1999)
Solubility in organic soluble in most Dreher (1986) solvents organic liquids and
solvents;insoluble in lower Bönnighausen (1986)polyalcohols

EHC 215: Vinyl Chloride______________________________________________________
16
Table 1 (contd).
log n-octanol/water 1.58 (measured; BUA (1989) partition coefficient 22 °C) (log Kow) 1.36 (calculated) BUA (1989)
1.52 Gossett et al. (1983)
Odour threshold value 26–52 mg/m3 by Hori et al. (1972)some, but by all at2600 mg/m3
650 mg/m3 Baretta et al. (1969)10 700 mg/m3 Patty (1963)
With air and oxygen, very explosive peroxides can be formed(Rossberg et al., 1986). There are reports of explosions in vinylchloride plants (Terwiesch, 1982). In VC recovery plants there is ahigher chance of explosion, which necessitates continuous monitoringand limitation of the oxygen content.
Polymerization reactions to form PVC are the most importantreactions from an industrial view (see section 3.2.1.2).
nH2C = CHCl 6 (– H2C – CHCl –)n; )HR = –71.2 kJ/molThe reaction is exothermic. Addition reactions with other halogensat the double bond, for instance, to yield 1,1,2-trichloroethane or1,1-dichloroethane, are also important. Catalytic halogen exchange byhydrogen fluoride gives vinyl fluoride (Rossberg et al., 1986). In thepresence of water, hydrochloric acid is formed which attacks mostmetals and alloys. This hydrolysis probably proceeds via a peroxideintermediate (Lederer, 1959).
Vinyl chlorine reacts with chlorine to form trichloroethane.1,1-Dichloroethane is formed from the exothermal reaction of VCwith hydrogen chloride in the presence of iron compounds.
2.3 Conversion factors
1 ppm = 2.59 mg/m3 at 20 °C and 101.3 kPa1 mg/m3 = 0.386 ppm

Identity, Physical and Chemical Properties, Analytical Methods______________________________________________________
17
2.4 Analytical methods
2.4.1 General analytical methods and detection
Stringent regulations for the production, use and handling ofcarcinogenic VC have been made in several countries (see Annex 1)necessitating the usage of reliable methods to detect trace amounts ofthis compound in air, water and in PVC articles in such humancontact applications as food packing, medical equipment and potablewater transport.
VC in air has been monitored by trapping it on differentadsorbents, e.g., activated charcoal, molecular sieve and carbotrap.
VC can be removed from adsorbents by liquid or thermaldesorption and analysed by GC fitted with FID, PID or MS detection.In ambient air measurements, several adsorbents in sieves orrefrigerated traps have been used to increase the efficiency oftrapping. In continuous monitoring of workplace and ambientconcentration, IR and GC/FID analysers can be used.
Direct injection, extraction and more increasingly head space orpurge and trap techniques have been applied for analysis of liquidsand solids. VC can be detected by GC fitted to, for instance, FID,PID, MS or Hall detectors.
A pre-concentration step and chemical derivatization mayincrease sensitivity.
An overview of analytical methods for detecting VC in variousmatrices is given in Table 2.
2.4.2 Sample preparation, extraction and analysis for different matrices
2.4.2.1 Air
Most methods are based on that of Hill et al. (1976a), usingadsorption on activated charcoal, desorption with carbon disulfide andanalysis by GC/FID. Kruschel et al. (1994) used a three-stage carbonmolecular sieve adsorbent cartridge to collect a wide range of selectedpolar and non-polar VOCs. After purging with helium prior to

Table 2. Analytical methodsa
Matrix Sampling/preparation Separation Detector Detection limitb Comments References
AirExpired air collected in 50 ml GC FID 50 ppb Baretta et al. (1969)
pipettes; direct (packed (130 :g/m3)injection column)
Expired air multistage cryogenic GC FID; MS low ppb low reproducibility; Conkle et al. (1975)trapping; thermal (packed & cap.) long sampling timedesorption
Expired air 500 ml charcoal tubes GC 0.3 mg/m3 Krajewski & Dobecki(1978, 1980)
Expired air 1 litre canister; pressur- capGC MS n.g. for collecting alveolar Pleil & Lindstromized with neutral gas; samples; e.g.,16 and (1997)cryogenic concentration 25 :g/m3
Air in car charcoal tube, CS2 GC FID 10 ppb Going (1976); Hedley interior desorption (26 :g/m3) et al. (1976)
Ambient air activated charcoal/CS2 GC FID 2.6 mg/m3 Hill et al. (1976a)
Ambient air silica gel at –78 °C, GC FID 2.6 mg/m3 IARC (1978)thermal desorption

Table 2 (contd).
Ambient air activated charcoal GC n.g. 0.5 ppb Dimmick (1981)column; 24-h sampling (1.3 :g/m3)
Ambient air sampling (1 to 10 litre) HRGC MS 1 ng VOCs Kruschel et al.on carbon trap; thermal FID (0.3 :g/m3) (1994)desorption
Ambient air solid phase sample capGC IMS 2 mg/m3 new method for Simpson et al.trap preconcentration field monitoring (1996)
Landfill gas (20 litre) carbon molecular capGC ECD 82 ng/m3 Wittsiepe et al.sieve; CS2 desorption; con- (1996)version to 1,2,-dibromoderivative
Tobacco charcoal tube, CS2 GLC ECD 15 pg per Hoffmann et al. smoke extraction; conversion to injection (1976)
1,2,-dibromo derivative
Workplace CS2 desorption GC (packed FID 0.04 :g (5 litre working range NIOSH (1994) (based air column) sample) 0.4 to 40 mg/m3 on Hill et al., 1976a)
Workplace charcoal sorbent tube; GC (packed FID 5 mg/m3 Kollar et al. air extraction with nitro- column) (3 dm3 sample) (1988)
methane

Table 2 (contd).
Matrix Sampling/preparation Separation Detector Detection limitb Comments References
Workplace carbon trap, thermal GC FID 2.6 mg/m3 Hung et al. (1996) air desorption
Workplace activated charcoal, GC FID 0.1 mg/m3 working range HSE (1987); air CS2 desorption 0.07–25 mg/m3 for ASTM (1993)
30-litre samplesWorkplace continuous sampling process GC FID n.g. Pau et al. (1988) air
Workplace continuous sampling pyrolysis detection of 1 mg/m3 Nakano et al. (1996) air HCl
WaterWater purge & trap GC MC n.g. in PVC pipes Dressman &
McFarren (1978)
Water purge & trap GC MS 0.05 :g/litre Schlett & Pfeifer(1993)
Water headspace capGC MS 1 :g/litre Gryder-Boutet &Kennish (1988)
Water purge & trap capGC PID-ELCD n.g. modification of US Driscoll et al.EPA Methods 601 (1987)& 602 for VOC

Table 2 (contd).
Water purge & trap capGC PID-ELCD 0.1 :g/litre VOC Ho (1989)
Water purge & trap; CS2 capGC ECD 1.6 ng/litre Wittsiepe et al.desorption; 1,2-dibromo (1990, 1993)derivatization
Water GC PID and Hall n.g. VCM loss during Soule et al.detector laboratory holding (1996)
timeWater purge & trap GC FID n.g. VOC Lopez-Avila et al.
(1987a)Water CS2 desorption; conver- capGC ECD 1.6 ng/litre Wittsiepe et al.
sion to 1,2,-dibromo (1990, 1996)derivative
Bottled headspace with thermal GC MS 10 ng/litre Benfenati et al. drinking-water desorption cold-trap (1991)
injector (TCT)
Water solid phase micro- capGC FID n.g. Shirey (1995)extraction MS
Food, liquids, biological fluids and tissuesLiquid drugs; headspace GC FID 0.1 ppb Watson et al. cosmetics (1979)
Food; liquids headspace GLC confirmation 10 ppb Williams (1976a)with MS

Table 2 (contd).
Matrix Sampling/preparation Separation Detector Detection limitb Comments References
Liquids derivatization to GLC ECD 15 :g/litre Williams (1976b)1-chloro-1,2-dibromoethane (vinegar);
50 :g/litre oil
Food direct injection GC FID 2–5 :g/kg detection limit UK MAFF (1978)depends on medium
Food headspace GC FID 1 :g/kg IARC (1978)
Oil GC FID 5 :g/litre Rösli et al. (1975)based on Williams &Miles (1975)
Food headspace GC n.g. 2–5 :g/kg UK MAFF (1978)
Intravenous headspace capGC FID 1 :g/litre Arbin et al. solutions (1983)
Blood (rat) headspace ethanol- GC FID 5 :g/litre Zuccato et al.water extraction (1979)
Tissues (rat) freezing, homogenization GC FID 30 :g/kg Zuccato et al.then as above (1979)

Table 2 (contd).
Urine dry; dissolution in GC MS 50 :g/litre TDGA Müller et al.methanol; methylation (1979)with diazomethane
Urine extraction and silylation GC FID 10 mg/litre TDGA; standard: Draminski &o-phthalic acid Trojanowska (1981)
Urine conversion to dibutyl ester GC MS < 0.5 :mol/litre TDGA; standard: Pettit (1986)pimelic acid
PVCPVC products charcoal tube, CS2 GC FID 10 ppb Going (1976)
desorption (26 :g/m3)
PVC headspace packed column GC 5 ppb ASTM (1985)
PVC headspace capGC FID update suggestion for Wright et al.FID-PID ASTM (1985) (1992)
PVC extraction/headspace GC FID 0.1 mg/kg Puschmann (1975);IARC (1978)
PVC HPLC < 1 ppm for temperatures Kontominas et al. packaging simulating storage (1985) of foods conditions (8 to 27 °C)

Table 2 (contd).
Matrix Sampling/preparation Separation Detector Detection limitb Comments References
PVC dynamic headspace with GC FID low ppb Poy et al. (1987)a sparging and focusingstep before thermaldesorption
PVC film or GC FID 2.2 ng Gilbert et al. resin (5 ppb (w/w)) (1975)
Packaging MS 8.7 pg materials
PVC bags purge/trap (Tenax/charcoal) GC FID/ECD 0.3 ppb Thomas & Ramstad(1992)
a Abbreviations: capGC = capillary gas chromatography; ECD = electron capture; ELCD = electrolytic conductivity detector; FID = flame ionizationdetector; GC = gas chromatography; GLC = gas-liquid chromatography; HRGL = high-resolution gas chromatography; IMS = ion mobilityspectrometry; MC = microcoulometric titration detector; MS = mass spectrometry; PID = photoionization detector; SPME = solid-phasemicroextraction; TDGA = determination of the metabolite, thiodiglycolic acid; VOC = volatile organic chemical (a general method); n.g. = not given
b The % recovery was not given in most cases

Identity, Physical and Chemical Properties, Analytical Methods______________________________________________________
25
analysis, levels of water and other interfering compounds werereduced sufficiently to allow cryogenic preconcentration and focusingof the sample onto the head of the analytical column. VC was detectedat levels below the detection limit of former methods.
Landfill gas monitoring has been carried out by trapping VC ona molecular sieve, and samples have been analysed using, forinstance, GC/MS (Bruckmann & Mülder, 1982) or GC/ECD withprior conversion to the 1,2-dibromo derivative (Wittsiepe et al., 1996).
2.4.2.2 Water
VC is first purged from the water and then collected for GCanalysis by headspace/purge and trap. VC is highly volatile and hasa low specific retention volume on Tenax-GC, the most commonlyused trapping medium in purge/trap analysis. Combination traps suchas Tenax/silica gel/charcoal (Ho, 1989) or Tenax/OV-1/silica (Lopez-Avila et al., 1987b) have been used. Another approach is to bypass thetrap altogether by purging directly onto a cryocooled capillary column(Gryder-Boutet & Kennish, 1988; Pankow & Rosen, 1988; Cochran,1988; Cochran & Henson, 1988), but here there are complications dueto the need to remove water when stripping from an aqueous solution.A more recent adaptation of the headspace method uses solid-phasemicroextraction (SPME) in which a stationary phase, usuallypoly(dimethylsiloxane), coated on a fused-silica fibre is used to extractaqueous samples in completely filled sealed vials (Shirey, 1995).
It should be noted when measuring VC content in water orgroundwater that samples should be analysed as soon as possible, asthe VC content decreases with holding time (Soule et al., 1996).
2.4.2.3 PVC resins and PVC products
For the quantification of residual VC in PVC, a solid and asolution approach have been used. The former involves theequilibration of a solid polymer sample at 90 °C in a sealed system,followed by headspace analysis with single or multiple extraction(Berens et al., 1975; Kolb, 1982). The solution approach involves theequilibration of a 10% solution of PVC in dimethylacetamide in asealed system, followed by analysis of the headspace gas (Puschmann,1975). A automatic dynamic headspace method involving a sparging

EHC 215: Vinyl Chloride______________________________________________________
26
and a focusing step before desorption into the GC column has beendeveloped to increase the sensitivity of the solution approach method(Poy et al., 1987).
2.4.2.4 Food, liquid drug and cosmetic products
For monitoring VC in foods in contact with PVC packaging,headspace GC is the usual method. Before the levels of VC allowedin PVC was regulated in the 1970s (see Annex I), many of the VClevels observed were high enough to be determined by direct injectionmethods. Limits of detection are given as 2, 5 and 5 :g/kg foraqueous, ethanolic, and oleaginous medium respectively usingheadspace-GC-FID (UK MAFF, 1978). Williams (1976a,b) reporteda gas-liquid chromatographic method using subsequent GC-MSconfirmation, and a further GC/ECD method requiring derivatizationto 1-chloro-1,2-dibromoethane for determination of VC content inliquid foods.
Methods for VC levels in liquid drug and cosmetic preparationswere described by Watson et al. (1979). A weighed aliquot of thecommercial product in a tightly septum-sealed vial with accuratelyknown headspace volume is heated to 50 °C for 30 min. A portion ofthe warm headspace gas is then injected into a GC equipped with FIDand a styrene-divinylbenzene porous polymer column.
2.4.2.5 Biological samples
There are few data on VC analysis in biological tissues. The onlyreport available was on rat blood and tissues (Zuccato et al., 1979).
2.4.2.6 Human monitoring
Methods for measuring VC concentrations in exhaled air (breath)have been described (see Table 2) but, although useful for studyingmetabolism, they are not well suited for biological monitoring due tothe short half times in the body and the saturable metabolism of VC.
Metabolites of vinyl chloride have been identified in the urine ofrats (Müller et al., 1976; Green & Hathway, 1977) and humans(Müller et al., 1979) using GC-MS. As there is a strong correlationbetween VC exposure in humans and increased excretion ofthiodiglycolic acid (Müller et al. 1978), this metabolite has been using

Identity, Physical and Chemical Properties, Analytical Methods______________________________________________________
27
for monitoring purposes. It is, however, not specific for VC as certaindrugs and other C2 compounds also have thiodiglycolic acid as aurinary metabolite (Müller et al., 1979). Since thiodiglycolic acid isalso detected in unexposed subjects (Müller et al., 1979; van Sittert &de Jong, 1985) and even premature babies (Pettit, 1986), thisapproach can only be used to demonstrate high levels of exposure. Adiscussion of biological markers for VC exposures and VC-inducedliver cancer is presented in section 8.5.
Thiodiglycolic acid has been determined by dissolving the driedurine residue in methanol, methylating with diazomethane andanalysing with GC-MS (Müller et al., 1979), analysing the metaboliteas its dibutyl ester by GC-MS using selected ion monitoring (Pettit,1986), and by using GC/FID (Draminski & Trojanowska, 1981).Care must be taken with methods which analyse for VC metabolites,as these metabolites are not specific to VC.
A specific and sensitive new method has been reported for thequantification of the VC metabolite N-acetyl-S-(2-hydroxyethyl)cysteine by exchange solid-phase extraction and isotope dilutionHPLC-tandem mass spectrometry (Barr & Ashley, 1998). Thismethod may prove useful for monitoring occupational VC exposure,as the detection limit of 0.68 :g/litre is low enough to detect thismetabolite even in people with no overt exposure to VC, ethyleneoxide or ethylene dibromide.
2.4.2.7 Workplace air monitoring
Before the 1960s, when it was established that VC was acarcinogenic substance, halogen detectors and explosimeters wereused, non-specific for VC, with detection limits of 518–1295 mg/m3
(200-500 ppm). Gradually more sophisticated techniques becameavailable for detection of low ppm levels of VC, such as IR analysers,FID, PID (ECETOC, 1988) and more recently mass spectrometry. Inorder to check for leaks or for control measurements during cleaningand repair work, detector tubes or direct-reading instruments withFID or PID can be used, although they are not specific for VC andregular calibration is necessary (Depret & Bindelle, 1998).

EHC 215: Vinyl Chloride______________________________________________________
28
Continuous analyses based on, for instance, IR, GC/FID or HCldetection have been developed (IARC, 1978; Pau et al., 1988; Nakanoet al., 1996). Analysers can be equipped for computerized datalogging and processing. The detection limit of an IR analyserdepends on, for instance, path length and is about 1.3 mg/m3 (IARC,1978). The analyser detecting HCl from VC pyrolyzed in a quartztube was reported to have a detection limit of 1 mg/m3 when thesampling time was 40 seconds (Nakano et al., 1996).
Breathing zone concentrations can be measured by sampling VCwith portable pumps or diffusion on activated charcoal (Nelms et al.,1977; Heger et al., 1981; ASTM, 1993; NIOSH, 1994; Du et al.,1996). By using thermosorption tubes (carbotrap 110-400), detectionlimits can be decreased and the use of carbon disulfide in desorptionavoided (Hung et al., 1996).
Passive monitors for occupational personal monitoring ofexposure to VC are commercially available.

29
3. SOURCES OF HUMAN ANDENVIRONMENTAL EXPOSURE
3.1 Natural occurrence
VC is not known to occur naturally.
3.2 Anthropogenic sources
Anthropogenic sources of VC include the intentional manufactureof the compound for further processing, primarily to PVC, andunintentional formation of VC in, for instance, sanitary landfills, asa degradation product of chlorinated hydrocarbons such as those usedas solvents, and the subsequent presence of VC in emitted gases andgroundwater. VC is also found in tobacco smoke.
3.2.1 Production levels and processes
VC was first synthesized by Regnault in 1835. It was not until the1930s that techniques were devised to polymerize VC into stableforms of PVC.
VC production methods were altered in 1974 in many countriesafter the confirmation that VC was a human carcinogen.Manufacturers developed closed production methods to reduceexposure of the workforce.
Annual total world production of VC, which is approximatelyequal to PVC production, was about 17 million tonnes in 1985 andover 26 million tonnes in 1995 (see Table 3). More than half theworld’s capacity (64%) in 1985 was concentrated in Western Europeand the USA. Since that time many new VC/PVC plants have beenopened or are under construction in SE Asia, Eastern Europe, theIndian subcontinent and developing and oil-producing countries. Thusthere has been a geographical shift of VC/PVC production.
The leading producers of PVC and therefore also of VC are theUSA, Japan, Germany, France and SE Asian countries such as

EHC 215: Vinyl Chloride______________________________________________________
30
Table 3. World PVC (and therefore VC) production/capacity 1980–1998
Region Production/capacity in 1000 tonnes/year-----------------------------------------------------------
1980a 1985a 1990a 1995b 1998c
World capacity 16 000 17 000 20 700 26 400 ~27 000World production 11 750 14 200 18 300
North America total 3200 3390 4700 6070 Suspension and mass 2810 2990 Vinyl acetate copolymer 200 210 Emulsion 190 190
Western Europe total 3900 4330 4800 5750 ~ 5600 Suspension and mass 33 350 3700 Vinyl acetate copolymer 130 130 Emulsion 420 500
Eastern Europe 925 1100 1200 2700d
Former Soviet Union 370 700 760
China 150 400 790Japan 1400 1550 2070 8200e
SE Asia 330 600 900
South America 400 540 780Rest of the world 1075 1590 2300 3680
a Allsopp & Vianello (1992)b Rehm & Werner (1996)c Although exact figures are not available, an increase in world production
was seen in 1998 but no great increase in Western Europe (personalcommunication, European Council of Vinyl Manufacturers, 1999)
d Including former Soviet Republicse Total Asia
Taiwan and China (CHEM-FACTS, 1992). The capacity has onlyincreased moderately in the USA and Western Europe in recent years.Significant increases in production have been reported for Japan andTaiwan. All the countries of Eastern Europe have PVC plants andhave exported PVC to Western European countries. The PVC capacityand imports and exports for each country are given in CHEM-FACTS(1992).

Sources of Human and Environmental Exposure______________________________________________________
31
VC is produced in Western Europe by 14 companies. The plantsare in Belgium (3 plants), France (3 plants), Germany (8 plants), Italy(4 plants), the Netherlands (1 plant), Spain (2 plants), Sweden (2plants), United Kingdom (1 plant) (Euro Chlor, 1999).
The manufacture of VC/PVC is one of the largest consumers ofchlorine.
3.2.1.1 Production of VC
VC is produced industrially by two main reactions, the first ishydrochlorination of acetylene, which proceeds via the followingreaction:
C2H2 + HCl 6 CH2=CHCl
This route was used in the past when acetylene, produced via calciumcarbide from coal, was one of the important basic feedstocks for thechemical industry (Rossberg et al., 1986). Today all USA and mostWestern European manufacturers use the “balanced process”described below. However, many Eastern European countries such asPoland and the countries of the former Soviet Union still use acetyleneto manufacture VC because of relatively cheap raw materials such ascalcium carbide and natural gas. Mercury has been used as a catalyst,although a new catalyst has now been developed in Russia, based onplatinum metal salts instead of mercury, which has increased yieldswith acetylene conversion from 95 to 99% (Randall, 1994).
The second major production process involves thermal cracking[reaction iii] (at about 500 °C) of 1,2-dichloroethane (EDC), producedby direct chlorination [reaction i] of ethylene or oxychlorination[reaction ii] of ethylene in the “balanced process”.
[i] CH2=CH2 + Cl2 6 Cl CH2–CH2 Cl
[ii] CH2=CH2 + 2 HCl + 5 O2 6 Cl CH2–CH2 Cl + H2O
[iii] Cl CH2–CH2 Cl 6 CH2=CHCl + HCl
After the cracking (pyrolysis), HCl and unconverted EDC areseparated from VC by two steps of distillation and recycled. The VC

EHC 215: Vinyl Chloride______________________________________________________
32
is stored either under pressure at ambient temperature or refrigeratedat approximately atmospheric pressure (European Council of VinylManufacturers, 1994). More than 90% of the VC produced today isbased on this route (Rossberg et al., 1986; Allsopp & Vianello, 1992).
Other methods of industrial production include:
a) VC from crack gases, where unpurified acetylene and ethyleneare chlorinated together, acetylene being first chlorinated to1,2-dichloroethane.
b) VC from ethane, which is readily available in some countries.The major drawback is that ethane must first be functionalized bysubstitution reactions giving rise to a variety of side chainreactions and therefore the reaction must be kinetically controlledto obtain maximal VC yield.
3.2.1.2 Production of PVC from VC
Many PVC plants are fully integrated beginning with ethyleneand chlorine (or sodium chloride).
VC is a gas at ambient temperatures but is handled as acompressed volatile liquid in all polymerization operations. PVCpolymerization reactors are thick-walled jacketed steel vessels with apressure rating of 1725 kPa. The polymerization of VC is stronglyexothermic. The explosive limits of VC in air are 4–22 vol%, and theplant must be designed and operated with this in mind, particularlywhen handling unreacted VC in the recovery system (Allsopp &Vianello, 1992).
Three main processes are used for the commercial production ofPVC: suspension (providing 80% of world production), emulsion(12%) and mass or bulk (8%). In Western Europe, the proportion ofPVC produced by the different processes is: 80% suspension; 13%mass; 5% emulsion and 2% copolymers (Wrede, 1995).
In the suspension (also called dispersion) process, polymerizationtakes place at 40–70 °C (depending on the type of PVC beingproduced) in a reactor (autoclave) of 25–150 m3 capacity fitted with

Sources of Human and Environmental Exposure______________________________________________________
33
a jacket and/or condenser for heat removal, as the reaction is stronglyexothermic. Precautions have to be taken in order to avoid explosivemixtures with air. Liquid VC under its autogenous vapour pressure isdispersed in water by vigorous stirring to form droplets of averagediameter 30–40 :m. The polymerization takes place within thesedroplets and is started by addition of initiators dissolved in themonomer. Stabilizers are added to prevent the drops rejoining and toprevent the already polymerized PVC particles from agglomerating.The reaction conditions can be exactly controlled and the propertiesof the product, such as relative molecular mass, can be controlledexactly. Once polymerization has ended, the autoclave charge isemptied into degassing tanks, and the non-polymerized VC isdegassed, compressed and stored for reuse (ECETOC, 1988; Allsopp& Vianello, 1992).
During the polymerization process, the PVC is dispersed in theaqueous phase and it cannot be prevented that a film of PVC forms onthe inside wall of the reactor. This film interferes with the transfer ofheat between the reactor and contents, and the process has to beinterrupted periodically to allow the reactor to be cleaned. Theautoclave, after being emptied, is opened, rinsed and washed eitherwith solvents or more usually by means of automatic high-pressurejets (ECETOC, 1988). The latest development in this area is the useof proprietary build-up suppressants, which are applied before everyPVC batch. After each batch, low pressure rinse with water canremove loose polymers and the batch cycle is ready to restart. Thereactor needs then to be opened for a thorough cleaning only after 500or more batches (Randall, 1994).
Before awareness of the toxicity of VC, it was the autoclavecleaning personnel who were primarily highly exposed to thecompound. In the past autoclaves were cleaned manually; the insidehad to be scraped with a spatula, or sometimes hammer and chisel toremove the encrusted polymer adhering to the walls of the vessel andmixing devices. Lumps of polymer often released monomer whenbroken, resulting in high concentrations of VC in the autoclave.Before about 1970, it was usual to check that the level was below1036 mg/m3 (400 ppm), i.e. two orders of magnitude below the lowerexplosion limit of VC. Occupational exposure limits are now 18mg/m3 (7 ppm) or less (see Annex I). Further details of workplaceswith a former high exposure to VC are given in section 5.3 and Jones(1981).

EHC 215: Vinyl Chloride______________________________________________________
34
Once polymerization has ended, the polymerization batch istransferred to the stripping unit and then to the slurry tank. The slurryis a suspension of PVC in water that has to be permanently stirred; itis then dewatered in a centrifuge decanter and dried. The resultingdried powder is either stored in silos or bagged. PVC is then furtherprocessed into ready-to-use resins (Depret & Bindelle, 1998).
3.2.1.3 PVC products
PVC is a polymer of VC with 700–1500 monomeric units. It isrelatively inexpensive and is used in a wide range of applications.PVC is a generic name. Each producer makes a range of PVCpolymers, which vary in morphology and in molecular mass accordingto the intended use. PVC resins are rarely used alone but can be mixedwith heat stabilizers, e.g., lead, zinc and tin compounds (Allsopp &Vianello, 1992), lubricants, plasticizers (e.g., diethylhexyl phthalate)fillers and other additives, all of which can influence its physical andmechanical properties (Williamson & Kavanagh, 1987; Allsopp &Vianello, 1992). Such additives may constitute up to 60% of the totalweight in some finished PVC plastics (Froneberg et al., 1982). Theseplastics are formed into a multitude of consumer products byextrusion, thermoprocessing and rotational moulding, and into rigidor flexible film by extrusion or calendering.
PVC accounts for 20% of plastic material usage and is used inmost industrial sectors (ECETOC, 1988; European Council of VinylManufacturers, 1994).
CC PackagingC bottles (produced by blow-moulding) for containing liquid
foods, beverages, cooking oils, vinegar, etc.C rigid film (calendered or extruded) which is converted into
tubes and shaped containers by subsequent vacuum orpressure-forming for packaging of various foodstuffs
C flexible film (made by blowing or calendering) for wrappingsolid foods such as cheese, meat, vegetables, fresh fruit, etc.
C coatings in metal cans
CC Building - floor coverings, wall coverings, windows, rollershutters, piping; 58% of the water supply network and 80% of the

Sources of Human and Environmental Exposure______________________________________________________
35
waste water disposal systems in Europe use pipes and fittingsmade from PVC.
CC Electrical appliances - wires and cables insulation
CC Medical care - equipment such as blood bags and gloves;pharmaceutical and cosmetic packaging. Worldwide, more than25% of all plastic-based medical devices used in hospitals aremade from PVC (Hansen, 1991)
CC Agriculture - piping; drainage; tubing in dairy industry
CC Automobiles - car dash boards and lateral trimming
CC Toys
At present, the largest use of PVC is in the building sector (Rehm& Werner, 1996).
3.2.2 Emissions from VC/PVC plants
3.2.2.1 Sources of emission during the production of VC
Process waste, by-products and unreacted material from abalanced process and from a PVC plant include (Randall, 1994):a) light/heavy ends from EDC purification (from direct chlorinationand oxychlorination reactors); b) heavy ends from VC purification(from pyrolysis reactor); c) pyrolysis coke/tars (from thermal reactionsin the pyrolysis reactor); d) spent catalyst (from direct chlorination,oxychlorination); e) recovery of unreacted VC (from PVC reactor); f)offspec batches (from PVC reactor); g) aqueous streams (from EDCwashing, vent scrubbing, oxychlorination water; from centrifuge, VCstripping, slurry tanks); h) vent gases (from distillation columns, flashdrums, reactor vents, storage tanks, vessel openings; from VCrecovery systems, dryer stacks, centrifuge vent, blending, storagefacilities); i) spills and leaks (sampling, pumps, flanges, pipes,loading/unloading, valves; bag filling, agitator seals); and j)equipment cleaning (tanks, towers, heat exchangers, piping; PVCreactor, product dryer, recovery system).

EHC 215: Vinyl Chloride______________________________________________________
36
a) Strategies for minimizing emissions
During the sixties, some control of exposure levels was introducedresulting in an important decrease of estimated ambient levels of VC.
In the 1970s, efforts were focused on controlling emissions at themost significant emission points: reactors, filters and storage tanks.Elementary modifications of equipment, room and local ventilation byfans, provisional operation procedures, etc., enabled the reduction ofexposure levels in working areas.
Technical developments have achieved further reductions:
C removal of residual VC from the PVC suspension by strippingbetween polymerization and drying with a flow of steam or inclosed-loop systems;
C appropriate collection of residual vents to thermal oxidizers orother abatement systems;
C reduction of all sources of fugitive emission by maintenance andupgraded equipment;
C high pressure internal cleaning of the autoclaves to remove PVCcrusts;
C intensive removal of VC before opening or a closed processdesign.
Appropriate working procedures, personnel awareness and highstandard equipment, associated with good maintenance practices, arethe recommended ways to reduce fugitive emission to very low levels(Depret & Bindelle, 1998).
b) Disposal of by-products
The main waste streams of EDC/VC production process inEurope are light ends (gases: VC, EDC, HCl, ethylene, dioxins;aqueous effluents: EDC, copper, dioxins) and heavy ends (viscoustars). According to the PVC Information Council the total amountproduced is approximately 0.03 tonnes of by-products per tonne of VCproduced (European Council of Vinyl Manufacturers, 1994). The

Sources of Human and Environmental Exposure______________________________________________________
37
fractions are either used as feedstocks for other processes orcombusted under controlled conditions (> 900 °C) or by catalyticoxidation to produce CO2, CO, HCl and water which can be recycled(see above). Exit gases should be treated using HCl absorbers and gasscrubbers. Spent catalyst, metal sludges and coke from EDC crackingshould be disposed of in controlled hazardous waste dumps (HWD) orincinerated under controlled conditions. Sludges from effluentpurification should be either combusted under controlled conditionsor deposited in HWD (European Council of Vinyl Manufacturers,1994).
3.2.2.2 Emission of VC and dioxins from VC/PVC plants during production
a) VC
An estimated 550 tonnes of VC was released into air, 451 kg towater and 1554 kg to soil from manufacturing and processingfacilities in the USA in 1992, although this was not an exhaustive list(ATSDR, 1997). From a VC capacity of 6 200 000 tonnes, an averageemission of 80 g/tonne can be calculated (Depret & Bindelle, 1998).
Euro Chlor (1999) reported emissions of VC from suspensionPVC plants in Europe to be 448 tonnes/year, 22 tonnes/year beingreleased in waste water. An estimated emission value of 300 tonnesVC/year was provided by German producers (BUA, 1989), i.e., about55 g VC/tonne PVC. Total VC emissions in England and Wales werereported to be 3800 tonnes in 1993 and 18 990 tonnes in 1994 (HMIP,1996).
An estimated 200 000 tonnes of VC was released into theworldwide atmosphere during 1982 (based on a worldwide PVCproduction of 17 million tonnes), i.e., 12 kg/tonne of PVC produced(Hartmans et al., 1985). In 1974, a VC emission of 0.5 kg/tonne PVCwas estimated (Kopetz et al., 1986).
b) Dioxins
PCDDs/PCDFs, some of which are classified as humancarcinogens (IARC, 1997), are formed during EDC/VC production.Concentrations in VC distillation residues (PU4043) (probably “heavyends”) for two production factories were 3192 and 5602 ng ITEQ

EHC 215: Vinyl Chloride______________________________________________________
38
(international toxic equivalent)/kg, which was estimated to be 12 to30 g of dioxin/year at a production level of 200 000 tonnes VC/yearin heavy ends (Stringer et al., 1995). However, the VC/PVC industryargues that, although dioxins may be found in production wastes,these are incinerated and are not ultimately emitted to theenvironment (Fairley, 1997), at least in those countries where wastestreams are regulated (not all countries possess such high standardsof waste incineration). Some companies do not incinerate their wasteproducts but dispose of them in other ways, e.g., deep-well injection(Stringer et al., 1995).
Wastewater from VC production can also be contaminated withPCDDs/PCDFs, in particular if they contain suspended solids.Installation of filtration devices should lower solid levels andsubsequently PCDD/PCDF emissions (Stringer et al., 1995). Usingsuch filtration devices, PCDD/PCDF concentrations in wastewaterfrom EDC/VC/PVC facilities in the USA ranged from not detectableto 6.7 pg/litre TEQ (Carroll et al., 1996).
Annual global emission of dioxins into the environment fromEDC/VC manufacture has been estimated to be 0.002–0.09 kg TEQby the European PVC industry but 1.8 kg by Greenpeace (Miller,1993).
Virgin suspension PVC resin from 11 major production sites inEurope was found not to contain any process-generatedPCDDs/PCDFs at concentrations above the limits of quantification (2ppt) (Wagenaar et al., 1998).
3.2.3 Accidental releases of VC
3.2.3.1 PVC plant and transport accidents
An explosion occurred at a VC recovery plant in 1978 inGermany, which was set off by vinyl chloride peroxides (Terwiesch,1982; see also section 2.2).
A freight train with 12 tank cars of VC was derailed inMcGregor, Manitoba, Canada in March, 1980 under near-blizzardconditions and –20 °C and two of the tanks released VC (Charlton etal., 1983). One car lost 47 500 litres in the first hour and the other car

Sources of Human and Environmental Exposure______________________________________________________
39
lost 23 100 litres at an initial rate of 1400 litres/hour, decreasing to45 litres/hour after 31 h. In the first 15 min, 5680 litres of VCvapourized by free surface evaporation; thereafter only 2.5% of thedischarging liquid evaporated rapidly. The remaining liquid in thesnow bank was assumed to have evaporated at a rate of 15% per hour,leaving about 900 litres of VC in the snow bank after 36 h. Althoughthere was an explosion hazard, no fire occurred.
Two incidences, in 1988 and 1996, occurred in Germanyinvolving accidental release of VC due to derailment of trainstransporting the liquid substance (Neuhoff, 1988; Anon, 1996). Bothaccidents were followed by explosion and fire. Derailment of a goodstrain occurred 1 km from Schönebeck (near Magdeburg in Germany)and the subsequent explosion and fire produced a 600- to 800-m blackcolumn of smoke. In all, 1044 tonnes of VC were involved of which261 tonnes burnt and 350 tonnes could be reclaimed after the fire;153 tonnes of HCl were released. Median measurements of thenumerous air samples taken at the place of accident or surroundingsdid not exceed the German technical guidance level of 5 vol ppm,although these were not taken until 14 h after the fire. Maximumconcentrations of VC measured were 78 mg/m3 (30 ppm) near thetrain and 26 mg/m3 (10 ppm) at a distance of 200 m from the centreof the fire (Hahn et al., 1998). Levels in nearby industrial sewagepipes were up to 1250 ppm (Anon, 1996). A cytogenic analysis wascarried out on some of the general population exposed to VC from thisaccident (Hüttner & Nikolova, 1998; see section 8.1 and Table 42).
3.2.3.2 Leakage and discharge from VC/PVC plants
Leakage from a waste liquor basin of a VC/PVC plant in Finlandcaused high concentrations of VC and dichloroethene in groundwaterin 1974. Concentrations of up to 484 mg/litre of the chlorocarbonswere measured in groundwater in the mid-1980s (Nystén, 1988).
It should be noted that in the 1960s and before, when the toxicityof VC was not known, large amounts of PVC production sludgescontaining VC were dumped onto landfills (and possibly still are incountries where there are no adequate restrictions).

EHC 215: Vinyl Chloride______________________________________________________
40
3.2.4 VC residues in virgin PVC resin and products
3.2.4.1 VC residues in different PVC samples
VC is not soluble in PVC nor is it absorbed or adsorbed in theresin particle. It is entrapped and can escape to the ambient air(Wheeler, 1981). PVC in a bulk-container loses its residual monomerat a rate of 25 to 50% per month. Heating tends to accelerate this step,but when the residual monomer has disappeared PVC is not asignificant source of VC.
Since the 1970s when VC was confirmed as a human carcinogen,it has been mandatory in many countries to “degas” PVC afterpolymerization (see section 3.3.1) and before further processing.There are limit values for VC content in PVC (see Annex I). Forexample, in 1974 raw PVC usually contained more than 1000 ppm ofresidual VC. This was subsequently reduced to 10 ppm by regulation(German Environmental Office, 1978). In a survey of 45 samples ofraw PVC from various countries carried out in 1976–1977, over athird had VC residues of > 1 ppm, but a third had residues of over50 ppm, with 4 samples over 200 ppm. The samples with the highestresidue level came from Hungary, Rumania, Italy and the USA(German Environmental Office, 1978).
3.2.4.2 VC residues in PVC products
In a survey of PVC products carried out in 1976–1977, thefollowing indoor articles had a VC content of > 0.05 ppm: bathroomtiles, piping, plastic bottle for table oil, and kitchen film. The highestconcentrations were found in music records, those bought recentlyhaving a VC content of up to 210 ppm and one record 10 years oldhaving a content of 970 ppm. In record shops and other roomscontaining many records, this could have been an important source ofVC. In contrast, the VC content of toys, kitchen utensils, foodwrappings, wallpaper and car interiors was < 0.05 ppm (GermanEnvironmental Office, 1978).
Whereas in 1974 the typical level of residual VC in PVC bottleswas 50 mg/kg, introduction of improved manufacturing practices atthe polymer resin processing stage reduced this to 3 mg/kg by 1975.In a 1978 survey, 22 out of 24 PVC bottles contained VC at less than0.4 mg/kg (UK MAFF, 1978).

Sources of Human and Environmental Exposure______________________________________________________
41
In a more recent survey, VC residues in various PVC sampleswere given as follows: rigid water bottle (850 ppb); thin plasticizedfood film (3 ppb); monopolymer powder (10 ppb); copolymer film(15 ppb) (Poy et al., 1987). PVC film is still used widely for foodpackaging. For example, in Denmark, in 1990, 129/239 samples ofcling-film used for cheese wrapping were of PVC (Svensson, 1994).
Residual VC could not be detected (< 0.1 ppm) in two PVCproducts from Thailand (Smerasta et al., 1991) or in PVC andproducts from it in Poland (Stareczek, 1988). PVC medical devicesare regulated in the USA and have to meet certain requirements (amaximum of 5 ppb residual monomer for flexible compounds and a10 ppb ceiling for rigid compounds (Rakus et al., 1991)).
Levels of VC found in food and pharmaceutical articles are givenin section 5.1.4. Annex I gives current regulations for VC content invarious PVC products.
3.2.4.3 VC formation as a result of heating PVC
a) Thermal degradation of PVC
PVC is thermally stable below 225 °C. Between 225 °C and itsignition temperature of 475 °C, thermal degradation results in therelease of about 50 compounds (Boettner et al. 1969). PVC does notdegrade back to VC. Thermal degradation of two types of bulk PVCsamples at 148–232 °C resulted in the release of long-chain aliphaticalcohols, toluene, benzene, various chlorinated species, and a majorpeak of HCl. The main components released at 260 °C–315 °C werearomatic hydrocarbons such as benzene, phenol and adipates, alongwith various aliphatic alcohols, alkenes, anhydrides, some of themchlorinated, and carbon monoxide (Froneberg et al., 1982). When1 kg of PVC is heated to 300 °C, it releases about 13 g HCl and 5 gCO.
b) Release of VC from heating PVC
Various PVC resins from different producers were tested for VCevolution over the 130 to 500 °C range using a heating rate of10 °C/min. A consistently low level of VC, amounting to 15–30 ppm(based on resin), was found in the volatile decomposition products

EHC 215: Vinyl Chloride______________________________________________________
42
from all of the samples tested, regardless of resin type ormanufacturing source (USA) (Wakeman & Johnson, 1978). A 100-mgsample was programmed for heating from 200 to 450 °C at 3 °C/min;this resulted in the formation of a total of 23.2 ppm VC, the majorportion being generated in the 275–350 °C region. Dehydro-chlorination occurred most rapidly between 250 and 275 °C. Duringthis period only 2.3 ppm of VC was formed. The VC evolved byheating PVC is the VC monomer entrapped in the PVC resin.
At temperatures required for thermoforming PVC for foodpackaging applications (90–120 °C for a few seconds), no detectableVC was formed in up to 1 h of exposure at 130 °C (detection limit ofanalysis in air - 1 ppb). Temperatures for calendering and extrusionoperations are 175–210 °C. Maximum VC levels determined at210 °C were 0.5 ppm (resin basis) after 5 min and 1.2 ppm after30 min (Wakeman & Johnson, 1978).
In more recent studies into VC formation during the thermalwelding of plasticized PVC sheeting (about 225 °C), in normal fieldsituations such as piping in sewers, VC concentrations were usuallynot above the detection limit of 0.05 ppm. Only where there was poorventilation were higher levels detected (0.2 ppm VC; 1.0–3.5 ppmHCl) (Williamson & Kavanagh, 1987).
3.2.5 Other sources of VC
3.2.5.1 VC as a degradation product of chlorinated hydrocarbons
VC as a gas, in leachate and groundwater (see Table 4), has beenfound in landfills and surroundings where there were no VC/PVCproduction facilities in the vicinity. It was found that VC can beformed, under anaerobic conditions, from the reductive halogenationof the more highly chlorinated chloroethenes: tetrachloroethylene(PCE), trichloroethene (TCE), and the dichloroethene isomers (cis-1,2-DCE, trans-1,2-DCE, and 1,1-DCE) (Parsons et al., 1984; Vogel& McCarty, 1985; McCarty, 1996, 1997, see Fig. 1). PCE and TCEare widely used as industrial solvents in particular for degreasing andcleaning metal parts and electronic components, and in dry cleaning.Production levels for 1984 were 260 and 200 thousand tonnes for PCEand TCE, respectively (Wolf et al., 1987). Careless handling, storageand disposal, as well as the high chemical stability of these

Sources of Human and Environmental Exposure______________________________________________________
43
Fig. 1
Fig. 1. Pathway for anaerobic microbial degradation of chlorinatedethenes to form vinyl chloride
(PCE = perchloroethene, TCE = trichloroethene, DCE = dichloroethene)

Table 4. Vinyl chloride found in landfill/waste disposal sites as a gas, in leachate and in groundwaterformed probably from degradation of higher chloroethenes
Sample Place (year) of sampling Valuea Concentrations Reference
Landfill gas 2 landfills USA max 230 mg/m3 Lipsky & Jacot (1985)average 34 mg/m3
Landfill gas landfill, UK max 11 mg/m3 Ward et al. (1996)plume, 100 m from boundary due to subsurface 40 mg/m3
migration (1991)
Landfill gas landfill, Braunschweig, Germany mean 9 mg/m3 Henning & Richter (1985)
Gas effluents garbage dump, Berlin, Germany 0.27 mg/m3 Höfler et al. (1986)
Gas Germany, average Janson (1989)industrial waste disposal site 41 mg/m3
municipal waste disposal site 10 mg/m3
Gas Germany, waste disposal site range 0.03–0.3 mg/m3 Bruckmann & Mülder (1982)
Landfill gas UK, 7 waste disposal sites range < 0.1–87 mg/m3 Allen et al. (1997)Soil air Germany, solvent waste sites 3 max out of 200 128 mg/m3, Köster (1989)
47 mg/m3,5 mg/m3

Table 4 (contd).
Leachate MSW, Wisconsin, USA (1982) range 61 :g/litre Sabel & Clark (1984)Leachate USA sites established before 1980 range 8–61 :g/litre Chilton & Chilton (1992)
(6 chosen sites)Leachate or industrial landfill range 140–32 500, Brown & Donnelly (1988) groundwater municipal landfill 20–61 000 :g/litre plume
Groundwater, Germany, contaminated water range < 5–460 :g/litre Brauch et al. (1987)Wells range 15–1000 :g/litreGroundwater Germany, solvent waste site 3 max samples/200 1000 :g/litre, Köster (1989)
500 :g/litre,200 :g/litre
Groundwater Germany max 120 :g/litre Milde et al. (1988)Groundwater Santa Clara Valley, USA (near plants manu- range 50–500 :g/litre Wolf et al. (1987)
facturing electronic equipment which usesignificant amounts of chlorinated solvents)
Groundwater Germany: 136 samples from down-gradient max 12 000 :g/litre Dieter & Kerndorff (1993)wells of 100 waste disposal sites mean 1694 :g/litre
Groundwater sand aquifer near industrial site, Michigan, max > 5 :g/litre at 10 m; Semprini et al. (1995)USA. Concentration increased with depth 56 400 :g/litre at 23 mconsistent with methane
Outwash aquifer Gloucester landfill, Canada (1988) range < 1–40 :g/litre Lesage et al. (1990)
a This column indicates whether the concentration is a maximum (max), average or range value

EHC 215: Vinyl Chloride______________________________________________________
46
compounds, have made them, and consequently VC, some of the mostfrequently encountered groundwater contaminants (Arneth et al.,1988). Although VC may be further degraded to less chlorinated andnon-chlorinated ethenes, and possibly finally to carbon dioxide andethane, this proceeds only at a slow rate under highly reducingconditions (Freedman & Gossett, 1989; DiStefano et al., 1991; DeBruin et al., 1992; see also section 4.2). As a consequence, VC can bedetected in landfill sites in and surrounding areas through spreading.Reports from several countries show high levels of VC contaminationof soil and groundwater, aquifers and wells (see Table 4 and section5.1).
There have recently been several field studies in PCE/TCE-contaminated landfill sites and aquifers (Major et al., 1991, 1995;Fiorenza et al., 1994; Lee et al., 1995, see Table 5). These have shownthat under anaerobic conditions, PCE and TCE can be intrinsicallybiodegraded to ethene by indigenous methanogenic, acetogenic andsulfate-reducing bacteria. Furthermore, under aerobic conditions thereis a potential for direct or co-metabolic oxidation of DCE and VC.Therefore, an efficient bioremediation of chlorinated ethene-contaminated aquifers may occur in contaminant plumescharacterized by upgradient anaerobic and downgradient aerobiczones, such as where anaerobic, chlorinated ethene plumes dischargeto aerobic surface water bodies. However, this depends on the abilityof the stream-bed microbial community to degrade efficiently andcompletely DCE and VC over a range of contaminant concentrations(Cox et al., 1995; Bradley & Chapelle, 1998a). It should be noted thatthis bioremediation occurs under specific conditions. Thebiodegradation studies listed in chapter 4 give conflicting results.
Each landfill site has individual conditions (e.g., presence ofother solvents such as acetone and methanol), so that the degradationrates cannot be directly compared. The most extensively studied siteof intrinsic chlorinated solvent biodegradation is the St Joseph(Michigan, USA) Superfund site where groundwater concentrationsof TCE as high as 100 mg/litre have been found, with extensivetransformation to cis-DCE, VC and ethene. Conversion of TCE toethene was most complete where methane production was highest andwhere removal of nitrate and sulfate by reduction was most complete(McCarty, 1996; Weaver et al., 1996). At another site in the USA(Dover Air Force Base), half-lives of 1 to 2 years have been estimated

Table 5. Some examples of formation of VC through biodegradation of tetrachloroethenein landfill sites (concentrations in mg/litre unless stated otherwise)a
Site Sample PCE TCE cis-DCE VC Ethene Reference
Chemical transfer groundwater 4.4 1.7 5.8 0.22 0.01 Major et al. factory facility, North downgradient well n.d. none 76 9.7 0.42 (1991) Toronto, Canada
Carpet backing manu- groundwater n.d. 56 4.2 0.076 Fiorenza et al. facturing plant, downgradient from n.d. 4.5 5.2 low (1994) Ontario, Canada lagoon
Refuse landfills 7.15 (ppmv) 5.09 (ppmv) not measured 5.6 (ppmv) McCarty & (average of 8) Reinhard (1993)
Landfill groundwater 0.54 2.6 2.2 2.7 33 Lee et al. (1995)well 3.4 14 44 54 43
15 270 140 48 14
Heavily polluted site groundwater 20 70 20 2 Middeldorp et (solvent distributor) al. (1998) in Netherlands
a PCE = tetrachloroethene; TCE = trichloroethene; DCE = dichloroethene; n.d. = not detected

EHC 215: Vinyl Chloride______________________________________________________
48
for each stage in the reaction chain (e.g., DCE to VC; VC to ethene)(Ellis et al., 1996). The degradability of chlorinated aliphaticcompounds was studied under methanogenic conditions in batchreactors with leachate from eight landfill sites in Denmark. PCE andTCE were found to be degraded in only three of the eight leachates,with significantly different conversion rates. In one leachate, completeconversion of chlorinated ethenes, including conversion of VC, wasobserved within 40 days, while another leachate showed only 50%conversion of PCE (Kromann et al., 1998).
No known microorganism can aerobically destroy PCE.Laboratory studies have shown that some anaerobic bacteria (e.g.,Dehalobacter restrictus) use chlorinated solvents for respiration(halorespiration), breaking them down in the process to formcis-dichloroethene, although restricted diet conditions are necessary(Sharma & McCarty, 1996). Recently, a coccoid bacterium has beenisolated (provisionally named Dehalococcoides ethenogenes strain195) which, together with extracts from mixed microbial cultures, candechlorinate PCE, removing further chlorine atoms to form vinylchloride and finally ethene (Maymó-Gatell et al., 1997).
Escape of landfill gas from the disposal site can take place via thesurface (emission) or into the ambient soil (migration). VC is emittedfrom the landfill surface into the ambient air (Wittsiepe et al., 1996).Awareness of this problem has encouraged the development of in situbioremediation of chlorinated solvents and VC using anaerobic oraerobic co-metabolic processes (Dolan & McCarty, 1995b; Jain &Criddle, 1995; Semprini, 1995; see section 4.2).
The estimated emission of vinyl chloride from landfill sites in theUSA is 60–33 000 tonnes/annum (Lahl et al., 1991).
3.2.5.2 VC formation from tobacco
VC was identified in the smoke of all 13 cigarettes tested(1.3–16 ng/cigarette) and in both small cigars tested (14–27 ng/cigar).The level correlates directly with the chloride content of the tobacco.Filter tips with charcoal reduce selectively the VC content of cigarettesmoke (Hoffmann et al., 1976).

Sources of Human and Environmental Exposure______________________________________________________
49
3.3 Uses
About 95% of the world production of VC is used for theproduction of PVC. The remainder is used for the production ofchlorinated solvents, primarily 1,1,1-trichloroethane (10 000 tonnesper year; European Council of Vinyl Manufacturers, 1994), via themore toxic 1,1,2-trichloroethane and 1,1-dichloroethane.
VC was previously used as a refrigerant (Danziger, 1960) and asa propellant in aerosol sprays for a variety of products, such aspesticides, drugs and cosmetics (Wolf et al., 1987). These uses havebeen banned since 1974 in the USA and in other countries.

50
4. ENVIRONMENTAL TRANSPORT,DISTRIBUTION AND TRANSFORMATION
4.1 Transport and distribution between media
Depending on the sources, VC can enter the environment via air,water or soil. The most critical matrices are probably air andgroundwater. Euro Chlor (1999) calculated the partitioning of VCinto environmental compartments, based upon the Mackay Level 1model, to be 99.99% air, 0.01% water, < 0.01% soil and < 0.01%sediment.
4.1.1 Air
Owing to its high vapour pressure (saturation vapour pressureP0 $ 10-4 mmHg; see also section 2), VC released to the atmosphereis expected, based on calculations of Eisenreich et al. (1981), to existalmost entirely in the vapour phase. The atmospheric life-time of VCis limited by its reaction with photochemically produced OH radicals(see section 4.2.2).
VC is volatilized to the atmosphere from area sources such aslandfill sites. Models have been developed to predict such short-rangedispersion. These models were validated by VC concentrationsranging from < 5 to 31 :g/m3 (< 2 to 12 ppb) measured in the vicinityof a landfill in Los Angeles 3 years after it last received any wastecontaining VC (Chitgopekar et al., 1990).
No data are available on wet deposition.
In order to model distribution processes, liquid : air partitioncoefficients have been determined (Gargas et al., 1989). Coefficientsof 0.43 and of 24.4 were obtained for 0.9% saline : air and for oliveoil : air, respectively.
4.1.2 Water and sediments
VC has a relatively low solubility in water (see section 2), and thesolubility can be increased by the presence of salts (see section 4.2.3).

Environmental Transport, Distribution and Transformation______________________________________________________
51
Experimental data on adsorption to particulate matter in the watercolumn or to sediment are not available. A partition constant(unitless) of 8.2 for a sediment-water system was calculated (from aKow value of 17) by Mabey et al. (1982), indicating a low adsorptioncapacity. A high input of VC into water may lead to low-level long-term storage in the associated sediment (Hill et al., 1976b).
Volatilization of VC acts as a significant transport mechanism.It is considered to be the most rapid route for removal of VC fromsurface water, but to be an unlikely pathway for disappearance fromgroundwater that is not directly exposed to air (Smith & Dragun,1984). Volatilization parameters such as vapour pressure and Henry’sLaw constants indicate that VC is highly volatile. Another factor, thereaeration rate ratio (rate constant for loss of VC from aqueoussolution divided by the rate constant for oxygen uptake by the samesolution), was reported to be 0.675 at 25 °C (theoretical calculation byMabey et al., 1982) and approximately 2 (experimental measurementby Hill et al., 1976b). The results of measurements or calculations ofvolatilization half-lives of VC from water bodies are given in Table6; they range from < 1 h to 5 h (measured in models for disturbed orquiescent water) and from 2.5 to 43 h (calculated for natural waterbodies). In groundwater, however, VC may remain for months oryears (ATSDR, 1990).
More or less complex models have been developed to describe thestability of VC in aquatic ecosystems (Hill et al., 1976b; Miller,1992).
4.1.3 Soil and sewage sludge
Owing to its high vapour pressure, VC can be expected tovolatilize rapidly, especially from dry soil surfaces. No experimentaldata are available. However, volatilization of VC from soil can bepredicted based upon its physicochemical properties. The amount ofVC volatilized from a soil depth of 1 m in 1 year was reported torange from 16 to 45% in a sandy soil and 0.1 to 0.7% in a clay soil.These calculations were based upon a Henry’s Law constant of 0.44and a degradation half-life of between 30 and 180 days (Jury et al.,1992).
It has been observed at landfill sites that subsurface migration ofVC is a significant transport mechanism (Hodgson et al., 1992; Little

Table 6. Half-lives reported for volatilization of VC from water
Source Method Conditions Half-life Reference
Dilute aqueous solution experimental 22–25 °C, Dilling et al. (1975); (200 ml) stored in an (laboratory) rapid continuous stirring 25.8 min Dilling (1977); open container continuous stirring (200 rpm) 26–27.6 min Callahan et al. (1979) discontinuous stirring (5% of time) ~ 80–90 min
quiescent, no stirring 290 min
Flowing channel experimental water input: 35 litre/second 0.9 h Scherb (1978)(field) flow velocity: # 0.50 m/second
depth: 30 cm
Stream calculation based on Hc = 243 kPa.m3/mol 2.5 h Lyman et al. (1990)depth: 1 mflow velocity: 1 m/secondwind current: 3 m/second
calculation based on reaeration rate ratio of 2; US EPA (1985a)assumed oxygen reaeration ratesa:
Pond 0.008 h-1 43.3 hRiver 0.04 h-1 8.7 hLake 0.01 h-1 34.7 h
a According to Tsivoglou (1967); Lyman et al. (1990)

Environmental Transport, Distribution and Transformation______________________________________________________
53
et al., 1992; Ward et al., 1996). Quantitative experimental data on thepotential of VC for gaseous subsurface migration (see section 5.1.1)were not found.
Because of its solubility in water, VC can be leached through thesoil to groundwater. Additionally, the high solubility of VC in manyorganic solvents may increase its mobility at special locations, e.g.,landfills or waste disposal sites. Standard experimental studies on soilsorption of VC are lacking. The soil adsorption coefficients of VCwere estimated from its water solubility, octanol/water partitioncoefficient and from the molecular topology and quantitativestructure-activity relationship analysis method according to equationsgiven by Chiou et al. (1979), Kenaga & Goring (1980), Lyman et al.(1982, 1990) and Sabljic (1984). The Koc values obtained ranged from14 to 240, indicating a low adsorption tendency and therefore a highmobility of VC introduced into soil (US EPA , 1985a; Stephens et al.,1986; ATSDR, 1997).
A field study performed to determine non-extractable (bound)residues (NER) of highly volatile chlorinated hydrocarbons gave a lowvalue of 2.4% for VC, as measured in a lysimeter after one growthperiod in the upper (10 cm) soil layer (Klein et al., 1989).
VC was assumed not to appear frequently in sewage sludge dueto its low adsorption potential (log Kow < 2.0) and its highvolatilization tendency (Wild & Jones, 1992).
4.1.4 Biota
VC has been identified in environmental samples of fish tissue(see section 5.1.5) and in several species of aquatic laboratory animals(molluscs, crustaceans, insects and vertebrates) and algaeexperimentally exposed to VC-containing water (see section 4.3).Reports on the presence of VC in terrestrial plants and animals havenot been found in the literature.
Further experimental data, e.g., in what way and to what extentVC is capable of entering the biota, are lacking. However, a fewestimations have been made on the basis of the physicochemicalproperties of VC. They refer to uptake of VC by terrestrial plants and

EHC 215: Vinyl Chloride______________________________________________________
54
animals. Plant uptake was considered to be unlikely (Ryan et al.,1988; Shimp et al., 1993) because, at an assumed half-life of< 10 days (Ryan et al., 1988), VC should be lost from the systemrather than be taken up by the plant. Another study (Wild & Jones,1992) screened organic contaminants for possible transfers into plantsand animals by summarizing approach data. Within the threecategories used (high, moderate, low potential) VC was classified inthe following way:
C retention by root surface: low;C uptake and translocation: moderate;
C foliar uptake: high;
C transfer to animal tissues by soil ingestion: low;
C transfer to animal tissues by foliage ingestion: moderate.
4.2 Transformation
4.2.1 Microbial degradation
There have been many studies on the biodegradation of VC undervarious simulated environmental conditions and these are listed inTables 8 to 10. The biodegradation studies have given contradictoryresults, with no evidence of degradation under some aerobicconditions such as surface water (Hill et al., 1976b) and sewage(Helfgott et al., 1977) and under anaerobic conditions such asgroundwater (Barrio-Lage et al., 1990). Unacclimated biodegradationhalf-lives of VC were generally estimated to be of the order of severalmonths or years (Howard et al., 1991). However, other studiesreported complete degradation in 3 months in simulated aerobicgroundwater (Davis & Carpenter, 1990). Where degradation isreported care must be taken to ensure that the loss of VC is due todegradation and not from other losses such as volatilization from thetest system. Phelps et al. (1991b) reported that > 99% of VC was lostfrom a bioactive reactor compared to 60% from the control reactor.
Significant microbial degradation of VC under aerobic andanaerobic conditions has been detected in studies using enrichment orpure cultures isolated mostly from sites contaminated with differentorganic chemicals (Tables 8 to 10). Vinyl chloride cannot be used bymost microorganisms as sole carbon source, but it can bedegraded/metabolized in the presence of propane, methanol,

Environmental Transport, Distribution and Transformation______________________________________________________
55
3-chloropropanol, propylene, isopropene and glucose. However, insome cases VC can even serve as sole substrate, as is seen withMycobacterium sp. (Table 9). The main degradation products includeglycolic acid or CO2 after aerobic conversion (Tables 7 to 9) andethane, ethene, methane or chloromethane after anaerobic transform-ation (Table 10). Anaerobic mineralization of VC to CO2 has beendemonstrated (Table 10) and may occur under special conditions(Bradley & Chapelle, 1998b).
A complete mass balance was given by degradation studies withradiolabelled VC, for example, in aerobic resting cell suspensions ofRhodococcus sp. A starting concentration of 1 mg [1,2-14C] VCproduced more than 66% 14CO2 and 20% 14C aqueous phase products,and 10% was incorporated into the biomass (Malachowsky et al.,1994). Aerobic cultures of Mycobacterium aurum growing on aspecial filter material were reported to mineralize VC quantitativelyaccording to the following equation:
VC + microorganisms 6 biomass + HCl + CO2 + H2O (Meier, 1994).
The underlying reaction mechanisms for the aerobic andanaerobic degradation of VC have been postulated to be oxidative andreductive dehalogenations, respectively, involving a variety ofpathways (Vogel et al., 1987; Barrio-Lage et al., 1990; Ensley, 1991;Castro et al., 1992a; Leisinger, 1992; Castro, 1993; Meier, 1994;Hartmans, 1995; Jain & Criddle, 1995).
Frequently, the degradation reaction of VC proceeds more readilywith aerobes than with anaerobes (Tables 7 to 10). The reverse occurs(Freedman & Gossett, 1989; Semprini et al., 1995) with PCE, animportant precursor of VC in the environment (see chapter 3). Thus,two-stage treatment systems consisting of anaerobic (first stage) andaerobic (second stage) cultures have been proposed to achieve thecomplete degradation of a range of alkenes having different degreesof chlorination (Leisinger, 1992; Murray & Richardson, 1993; Nelson& Jewell, 1993). Recently, a chlorobenzoate-enriched biofilm reactorusing Desulfomonile tiedjei DCB-1 was developed which degradedPCE under anaerobic conditions without any detectable VC remaining(Fathepure & Tiedje, 1994).

Table 7. Aerobic degradation of vinyl chloride by mixed microbial consortia from different sites
Inoculum Test design/ Measured Initial Duration Efficiency of Referenceconditionsa parameter concentration degradation
Surface water samples room temperature VC 20 ml/2.9 ml 41 h no degradation Hill et al. (1976b)
Mixed consortium from 21 °C; VC 20–120 mg/litre several weeks no degradaion Hill et al. (1976b) natural aquatic systems + / - nutrients
Mixed consortium from 20 °C oxygen 25 days no degradation Helfgott et al. domestic sewage + nutrients demand (1977)
Mixed consortium from 25 °C; 14CO2 0.05 mg/litre 5 days 21.5% degradation Freitag et al. activated municipal + nutrients (1982, 1985) sewage sludge
Naturally occurring simulated aquifers: 14CO2, 1 mg/kg 108 days > 99% degradation Davis & consortium from soil-water microcosms VC soil-water 65% mineralization Carpenter (1990) groundwater (prepared with sub- (CO2)
surface soil and 0.1 mg/kg 109 days 50% mineralizationgroundwater (20 °C) soil-water (CO2)

Table 7 (contd).
Inoculum Test design/ Measured Initial Duration Efficiency of Referenceconditionsa parameter concentration degradation
Consortium indigenous aquifer sediment 14CO2, 17 :mol/litre 84 h 22–39% Bradley & to anaerobic aquifer microcosms VC mineralization Chapelle (1996) systems (contaminated (CO2) with CHs)
Consortium indigenous creek bed sediment 14CO2, 0.2–57 :mol/litre 24 h 6.2–58% Bradley & to creek sediment microcosms VC mineralization Chapelle (1998a) (contaminated with (CO2) DCE)
Consortium from aquifer soil microcosms VC 5.3 mg/litre 95 h little change in VC Dolan & McCarty material (from a VC- concentration (1995a) contaminated site)
a CH = chlorinated hydrocarbons; DCE = dichloroethene

Table 8. Elimination of vinyl chloride in aerobic tests with mixed microbial consortia utilizing special substratesa
Inoculum Additional Test Efficiency of Remarks Referencesubstrate degradation
Mixed methane laboratory removal of up to 100% inhibition by methane and Fogel et al. (1986, 1987); methanotrophs studies within 4 h–30 days 1,1-DCE possible; toxic Strandberg et al. (1989); Uchiyama
effects of VC and VC et al. (1989); Nelson & Jewellproducts possible (1993); Dolan & McCarty (1995a);
Chang & Alvarez-Cohen (1996)
methane field study about 95% in-situ inhibition by methane Semprini et al. (1990, 1991)(groundwater) transformation possible
i.c. = 0.03 mg/litre
Mixed propane laboratory > 99% loss after 30 days > 60% loss in control Phelps et al. (1991b); microbial study i.c. = 4–20 mg/litre Lackey et al. (1994) consortia
methane laboratory 82 to > 99% loss after Phelps et al. (1991b); plus study 10–21 days; Lackey et al. (1994)propane i.c. = 1–20 mg/litre
Mixed methane laboratory 2.3 :mol VC per mg of relative TCs from highest Dolan & McCarty (1995a) methanotrophs plus study cells during 26 h to lowest: trans-DCE;
formate i.c. = 14.8 mg/litre cis-DCE; VC; TCE; 1.1-DCE
Mixed consortia methane laboratory removal of up to > 99% Deipser (1998)study within 15 days
i.c. = 0.55 mg/litre
a i.c.= Initial concentration; DCE = dichloroethene; TCE = trichloroethene; TC = transformation capacity

Table 9. Survey on isolated bacterial cultures capable of degrading vinyl chloride under aerobic conditions
Inoculum Additional Major degradation Remarks Referencesubstrate producta
Mixed culture consisting of n. sp. CO2 (> 67%) Malachowsky et al. (1991) Rhodococcus rhodochrous and 2 bacteria of the order Actinomycetales
Bacterium of the order propane, glucose CO2 (> 67%) Phelps et al. (1991a) Actinomycetales or acetate
Alcaligenes denitrificans ssp. isoprene n. sp. Ewers et al. (1990) Xylosoxidans
Methylosinus trichosporium OB3b methane n. sp. inactivation Tsien et al. (1989); Changpossible & Alvarez-Cohen (1996)
methane glycolic acid (44%; Castro et al. (1992a)determined at 68%conversion)
Mycobacterium sp. ; no CO2 ; initially: chloro- VC as primary sub- Hartmans et al. (1985, 1992);M. aurum oxirane (epoxide) strate; inhibition Hartmans & DeBont (1992);
possible Meier (1994)

Table 9 (contd).
Inoculum Additional Major degradation Remarks Referencesubstrate producta
Mycobacterium aurum L1 no CO2, HCl maximum growth Hauschild et al. (1994)rates at1 mmol VC/litre
Mycobacterium vaccae (JOB 5) propane n. sp. Wackett et al. (1989)
Nitrosomonas europaea ammonia n. sp. Vannelli et al. (1990)
Pseudomonas sp. 3-chloro-propanol glycolic acid (71%; Castro et al. (1992b)determined at25% conversion)
Rhodococcus sp. propane CO2 (> 66%) Malachowsky et al. (1994)
Rhodococcus erythropolis isoprene n. sp. Ewers et al. (1990)
Xanthobacter propylene n. sp. Ensign et al. (1992)(strain Py 2)
a The degradation efficiency is given in parentheses; n. sp. = not specified

Table 10. Survey on anaerobic microbial degradation of vinyl chloridea
Inoculum Test design/ Conditions Major degradation Efficiency of degradation Remarks Referenceproducts
Mixed methanogenic liquid cultures n. sp. i.c. = 400 :g/litre Brauch et al. consortium (from PCE-, (20 °C) groundwater (1987) TCE-, VC-contaminated with sterile sand approx. 50% (100%) groundwater) after 4 (11) weeks
without sterile sand approx. 20% (55%)after 4 (11) weeks
Mixed consortium incubation of groundwater n.sp. 94% within 16 days Nerger & (from TCE-contaminated plus waste water (9 : 1) i.c. = 18 :g/litre Mergler-Völkl water) ( 21 °C) (1988)
Mixed consortium digesters filled with mature n.sp. low degradation (0.2 mg/m3 Deipser (1998) (from compost) sieved compost from compost/h)
private households
Mixed consortium soil-groundwater (< 1% CO2) no degradation in 5 months Barrio-Lage et (from natural sites) microcosms (25 °C) i.c. = 2 mg/litre al. (1990)

Table 10 (contd).
Inoculum Test design/ Conditions Major degradation Efficiency of degradation Remarks Referenceproducts
Mixed consortium flow-through column methane plus 89% degradation traces of Barrio-Lage et (from natural sites) packed with soil, ethene (82%), (in 9–15 days) chloromethane al. (1990)
a. s.: mixture of phenol, CO2 (7%)citrate, ammoniumdihydrogenphosphate,methanol and methane
Consortium indigenous aquifer sediment micro- CO2 15–34% mineralization in Bradley & to anaerobic aquifer cosms, anaerobic con- 84 h (versus 3–5% without Chapelle (1996) systems (contaminated ditions plus Fe(III) as Fe-EDTA amendment) with CHs) Fe-EDTA i.c. = 17 :mol/litre
Mixed methanogenic or varying conditions chloroethane or slow degradation Baek et al. methanol-enriched 15–30 °C ethene (plus (1990); Carter & consortia ethane) Jewell (1993);
Skeen et al.(1995)

Table 10 (contd).
Enriched PCE- and batch cultures ethene partial to nearly complete inhibition by Freedman & TCE-degrading (35 °C) degradation PCE possible Gossett (1989); consortia DiStefano et al.
(1991); Tandoiet al. (1994)
Mixed anaerobic consortia fixed-bed columnb ethene plus almost complete conver- De Bruin et al. from river sediment and 24 °C a.s.: lactate ethane sion of PCE (95–98%) (1992) wastewater sludge via VC
Methanobacterium resting cell no degradation Castro et al. thermoautotrophicum suspensions (60 °C) i.c. = 10-3 mol/litre (1994)
“Dehalococcoides anaerobic H2-PCEb ethene 90% conversion of PCE decay in rate Maymó-Gatell ethenogenes strain 195”c enrichment culture via VC of VC et al. (1995, + mixed microbial conversion 1997) consortia
a a.s. = additional substrate; i.c. = initial concentration; n.sp. = not specified; CH = chlorinated hydrocarbons; PCE = tetrachloroethene;TCE = trichloroethene
b starting material PCEc preliminary name

EHC 215: Vinyl Chloride______________________________________________________
64
There have been many efforts to use the VC-degrading capacitiesof microorganisms in practical applications such as the purificationof waste gases (Meier, 1994) or of municipal waste waters (Narayananet al., 1995) and the remediation of landfill leachates (Lesage et al.,1993), groundwaters (McCarty, 1993; Holliger, 1995) andcontaminated soils (Schulz-Berendt, 1993). Possible limitations arisefrom physical (temperature, accessibility of substrate), chemical (pH,redox state, concentration of VC and other contaminants, presence ofadditional secondary substrates, salinity) and biological (presence ofpredators, competition phenomena, adsorption of microbes tosurfaces) factors (Van der Meer et al., 1992).
4.2.2 Abiotic degradation
4.2.2.1 Photodegradation
Studies on the photodegradation of VC are summarized inTable 11. They include direct and indirect photolysis.
VC in the vapour phase or in water does not absorb wavelengthsabove 220 nm or 218 nm, respectively (Hill et al., 1976b). However,solar radiation reaching the troposphere lacks wavelengths belowabout 290 nm due to the stratospheric ozone shield. So, directphotolysis of VC is expected to be insignificant under environmentalconditions, because there is no overlap between the absorptionspectrum of VC and the sunlight radiation spectrum (Callahan et al.,1979). Consistently, no photodegradation was observed with pure VCin the gas phase or in water at wavelengths above 220 nm. Afterirradiation at 185 nm, VC was photolysed (Table 11).
In the environment, indirect photolysis occurs and includesreactions of VC in the presence of photosensitizers and those(Table 12) with photochemically produced reactive particles.
A variety of photolytic products was formed after irradiation ofVC under several experimental conditions (Table 11). Someintermediates, e.g., chloroacetaldehyde, were of considerablephotochemical stability. Therefore, the photooxidation is unsuitableas a means of removing VC from waste gases (Gürtler et al., 1994).On the other hand, treatment of water contaminated with VC and

Table 11. Survey on vinyl chloride photolysis studies
Medium Irradiation Photolytic degradation Photolytic productsa Reference(Duration)
VC in a high-vacuum medium pressure yes primary products: radicals Fujimoto et al. (1970) system arc (C2H3, Cl); C2H2, HCl
VC in air sunlight (outdoors) yes n.sp. Pearson & McConnell(half-life = 11 weeks ± 50%) (1975)
xenon arc (> 290 nm) yes CO (90%); HCl
VC in air high pressure yes (> 99% within 15 min) chloroacetaldehyde, Kagiya et al. (1975)mercury lamp HCl, CO2
outdoors yes (55% within 2 days)
VC in air (dry) > 230 nm (4 h) yes chloroacetaldehyde (primary Müller & Korte (1977)product), HCl, CO, formyl chloride
VC in air < 400 nm (45 min) yes CO2, CO, H2O, HCl, HCOOH, Woldbaek & KlaboeC2H2 (1978)
sunshine (3–45 h) very slow
VC (adsorbed on > 290 nm (n.sp.) yes n.sp. Freitag et al. (1985) silica gel) (15.3% of applied amount)

Table 11 (contd).
Medium Irradiation Photolytic degradation Photolytic productsa Reference(Duration)
VC in an oxygen 185 nm (up to 50 min) yes formyl chloride, monochloro- Gürtler et al. (1994) atmosphereb (quantum yield: 2–3) acetaldehyde, acetylene,
CO, CO2, monochloroacetylchloride, HClc, formic acidc
254 nm (up to 6 h) no
VC in air xenon lamp yes n.sp. Haag et al. (1996)(initial k: 0.09 second-1)
VC in air plus UV (> 290 nm) yes formic acid, HCl, CO, formal- Cox et al. (1974); Dilling nitrogen oxides (up to 22 h) (half-life = 1–7 h, + NO dehyde, ozone, (other minor et al. (1976); Gay et al.
half-life = 18 h, – NO) products) (1976); Carassiti et al.(1977)
xenon lamp yes formaldehyde, Hcl Kanno et al. (1977)(0–120 min)
< 400 nm (25 min) yes at low NO2 conc.: the same Woldbaek & Klaboe(increase in reaction rate products as observed in air (1978)as compared to NO2/NO (see above);
being absent) at high NO2 conc.: additionallynitrosyl chloride, N2O

Table 11 (contd).
VC in air plus xenon lamp yes n.sp. Haag et al. (1996) 1,1-DCE (initial k: 0.15 second-1)
VC in pure water > 300 nm no Hill et al. (1976b)(10 mg/litre) (90 h)
VC in natural water > 300 nm no samples (20 h) (10 mg/litre)
VC in water plus > 300 nm yes (rapid) various products photosensitizers
VC in PVC plant > 300 nm yes (half-life = 40 h) n.sp. effluent sunlight (25 h) very little
a n.sp. = not specified; DCE = dichloroetheneb direct photolysisc in the presence of water vapour

Table 12. Rate constants and half-lives for gas-phase reactions of vinyl chloride with OH radicals and other reactive particles
VC reaction Rate constant Temperature Assumed atmospheric concentration Calculated Reference with a (in units of (°C) c of the reactive particle c half-life c,d
cm3/molecule-sec) b
C OH 5.6 × 10⁻¹² 27 1 × 10⁶ molecules/cm3 1.4 days Cox et al. (1974);(measured) US EPA (1985a)
C OH 4.5 × 10⁻¹² 23 (296 K) 1 × 10⁶ molecules/cm3 1.8 days Howard (1976); US(measured) EPA (1985a)
C OH 6.60 × 10⁻¹² 26 (299 K) n.sp. n.sp. Perry et al. (1977)5.01 × 10⁻¹² 85 (358 K)3.95 × 10⁻¹² 149 (423K)(measured)
C OH 6.60 × 10⁻¹² 26 1 × 10⁶ molecules/cm3 1.2 days US EPA (1985a)(Perry et al., 1977)
C OH 6.60 × 10⁻¹² room temperature 1 × 10⁶ molecules/cm3 (12-h (3.5 days) Atkinson et al. (1979,(Perry et al., 1977) (298 ± 2 K) daytime average, Crutzen, 1982) 1987); Atkinson (1985)
C OH 6.60 × 10⁻¹² room temperature n.sp. n.sp. Atkinson (1987)(measured)5.3 × 10⁻¹²
(calculated)

Table 12 (contd).
C OH 6.60 × 10⁻¹² 25 ± 2 5 × 10⁵ molecules/cm3 (approx 3 days) Tuazon et al. (1988)(Perry et al., 1977) (298 ± 2 K)
C OH 6.60 × 10⁻¹² 26 5 × 10⁵ molecules/cm3 2.2–2.7 days BUA (1989)(Perry et al., 1977) (Crutzen, 1982)
C OH 6.8 × 10⁻¹² 27 (300 K) 5 × 10⁵ molecules/cm3 approx 2.4 days BUA (1989)(Becker et al., 1984) (Crutzen, 1982)
C OH 6.60 × 10⁻¹² 26 8 × 10⁵ molecules/cm3 1.5 days Howard (1989)(Perry et al., 1977)
C OH 4.0 × 10⁻¹² 26 (299 K) n.sp. n.sp. Kirchner et al. (1990)cm3/mol-sec(measured)
C OH 10.6 × 10⁻¹² n.sp. n.sp. n.sp. Klamt (1993)(calculated)
C OH n.sp. n.sp. 1 × 10⁶ molecules/cm3 (42 h) Pitts (1993)(24-h average)
C OH 6.60 × 10⁻¹² n.sp. 6.5 × 10⁵ molecules/cm3 (2.7 days) Helmig et al. (1996)(Perry et al., 1977) (estimated global mean;
Tie et al., 1992)

Table 12 (contd).
VC reaction Rate constant Temperature Assumed atmospheric concentration Calculated Reference with a (in units of (°C) c of the reactive particle c half-life c,d
cm3/molecule-sec)b
C OH 6.60 × 10⁻¹² 26 7.5 × 10⁵ molecules/cm3 1.6 days Palm (1997) personal(Perry et al., 1977) (24-h average, BUA, 1993) communication
C NO3 2.3 × 10⁻¹⁶ room temperature 2.4 × 10⁹ molecules/cm3 (42 days) Atkinson et al. (1987)(measured) (298 ± 2 K) (12-h nighttime average,
Platt et al., 1984)
C NO3 1.4 × 10⁻¹⁶ 23 (296 ± 1 K) n.sp. n.sp. Andersson &(measured) Ljungström (1989)
Cl 12.7 × 10⁻¹¹ 25 (298 ± 2 K) n.sp. n.sp. Atkinson & Aschmann(measured) (1987); Grosjean &
Williams (1992)
O3 1.9 × 10⁻¹⁹ 25 n.sp. n.sp. Gay et al. (1976);Singh et al. (1984)
O3 2.0 × 10⁻¹⁸ n.sp. n.sp. 4 days Hendry & Kenley(1979);ECETOC (1983)
O3 2.45 (± 0.45) × 10-19 room temperature n.sp. n.sp. Zhang et al. (1983)(~ 25)

Table 12 (contd).
O3 2.5 × 10⁻¹⁹ 25 7 × 10¹¹ molecules/cm3 (66 days) Atkinson & Carter(Zhang et al., 1983) (Singh et al., 1978) (1984); Atkinson et
al. (1987)
O3 2.45 × 10⁻¹⁹ 25 1 × 10¹² molecules/cm3 33 days US EPA (1985a)(Zhang et al., 1983)
O3 1.2 × 10⁶ 27 1.6 × 10¹² molecules/cm3 4.2 days Lyman et al. (1982,cm3/mole-sec 1990); US EPA (1985a)
O3 1.7 × 10⁻¹⁹ 22 7 × 10¹¹ molecules/cm3 67 days Klöpffer et al. (1988)
O3 2.5 × 10⁻¹⁹ (calculated n.sp. n.sp. n.sp. Meylan & Howardaccording to AOP) (1993)
19 × 10-19 (calculated n.sp. n.sp. n.sp.according to FAP)
O (3P) 8.6 × 10 -13 25 2.5 × 10⁴ molecules/cm3 373 days Sanhueza & Heicklen(1975); US EPA (1985a)
O (3P) 5.98 × 10 -13 25 2.5 × 10⁴ molecules/cm3 532 days Atkinson & Pitts(1977); US EPA (1985a)
a O(3P) = oxygen atomb AOP = Atmospheric Oxidation Program (currently used by US EPA); FAP = Fate of Atmospheric Pollutants (part of US EPA’s Graphical Exposure
Modeling system, GEMS)c n.sp. = not specifiedd Values in parentheses reported as ‘lifetime’

EHC 215: Vinyl Chloride______________________________________________________
72
other halogenated organic compounds by means of UV-enhancedoxidation (UV/ozone or UV/hydrogen peroxide) was reported to besuccessful (Zeff & Barich, 1992).
The atmospheric fate of VC depends on its reaction with reactiveparticles such as free OH and NO3 radicals, Cl atoms, ozone andsinglet oxygen. As can be seen from Table 12, the reaction with OHradicals is the dominant transformation process, showing calculatedtropospheric half-lives of 1-2 days or more. Factors influencingindirectly (via OH radical concentration) the lifetime of VC are thedegree of air pollution and solar radiation, leading to spatial, diurnaland seasonal variations (e.g., Hesstvedt et al., 1976). Reactionproducts include formaldehyde (HCHO) and formyl chloride(HCOCl), the latter being a stable potential toxicant (Tuazon et al.,1988; Pitts, 1993).
Rate constants for the photodegradation of VC in aqueoussolutions have been reported to range from 6.99 × 10⁹ mol-1 second-1
(Grosjean & Williams, 1992) to 7.1 × 10⁹ mol-1 second-1 (Klöpffer etal., 1985). Mabey et al. (1982) reported that photolysis of VC was notan environmentally relevant process. They reported oxidation rateconstants of < 108 mol -1h -1 and 3 mol -1h -1 for reactions with singletoxygen (1O2) and peroxy radicals (RO2), respectively. On the basis ofan average OH radical concentration of 10-17 mol in natural water, thekOH rate constant resulted in a half-life of approximately 110 days (USEPA, 1985a). Both of the other reactions appeared to be negligible.
4.2.2.2 Hydrolysis
Observations on chemical hydrolysis of VC derive fromexperiments with effluent water from a VC plant (pH = 4.3–9.4;50 °C; 57 h; Callahan et al., 1979), water of different pH values(85 °C; 27 h; Hill et al., 1976b; Mabey et al., 1982), water saturatedwith O2 (85 °C; 12 h; Hill et al., 1976b), water plus ethanol (120 °C;Rappoport & Gal, 1969) and two natural water samples (pH = 6.1/4.2for river/swamp water, both at room temperature and at 85 °C; 41 h;Hill et al., 1976b). In all cases, no or only slow hydrolysis occurred.The hydrolytic half-life was estimated to be < 10 years at 25 °C (Hillet al., 1976b). Hydrolysis experiments under strongly alkaline, hightemperature (and therefore environmentally irrelevant) conditionsresulted in a polymerization of VC (Jeffers & Wolfe, 1996).

Environmental Transport, Distribution and Transformation______________________________________________________
73
4.2.3 Other interactions
Under experimental conditions, VC and chlorine in water formchloroacetaldehyde, chloroacetic acid and other unidentifiedcompounds (Ando & Sayato, 1984).
Many salts have the ability to form complexes with VC, thuspossibly leading to an increase in its solubility (Callahan et al., 1979).
4.3 Bioaccumulation
Owing to its high vapour pressure and low octanol/water partitioncoefficient, VC is expected to have little tendency for bioaccumulation(BUA, 1989). Theoretical calculations resulted in bioconcentrationfactors (BCFs) of 2.8 (based on a log Kow of approximately 0.9) andaround 7 (based on a water solubility of 2763 mg/litre) in aquaticorganisms (US EPA, 1985a). A BCF of 5.7 (based on log Kow = 1.23)was calculated by Mabey et al. (1982) for aquatic microorganisms.
Experiments performed with 14C-VC (initial concentration:250 :g/litre) in a closed laboratory model aquatic ecosystem gave thefollowing results: after 3 days at 26.7 °C 34% of the 14C was found inthe water and 65% in the air. The organisms from different trophiclevels contained 14C residues (in VC equivalents, :g/kg) of 1307(alga, Oedogonium cardiacum), 621 (waterflea, Daphnia magna), 123(snail, Physa sp.), 1196 (mosquito larva, Culex pipiensquinquefasciatus) and 312 (fish, Gambusia affinis) (Lu et al., 1977).These values led to BCFs ranging from 3 to 31 when compared to theVC water concentration of 42 :g/litre, indicating somebioaccumulation, but no biomagnification within the food chain.
Another study determined BCFs for green algae (Chlorella fusca)after a 24-h exposure to 0.05 mg VC/litre and for fish (golden ide,Leuciscus idus melanotus) exposed to a constant averageconcentration of 0.05 mg VC/litre over 3 days. BCFs of 40 and < 10,respectively, were found (Freitag et al., 1985).
After 5 days of incubation of 0.05 mg VC/litre in activatedsewage sludge, an accumulation factor of 1100 (based on thedistribution of VC between sludge, dry weight and water) wasobserved (Freitag et al., 1985).

EHC 215: Vinyl Chloride______________________________________________________
74
4.4 Ultimate fate following use
4.4.1 Waste disposal
Several methods have been employed for removal of VC fromwaste water: stripping with air, steam or inert gas (Nathan, 1978;Cocciarini & Campaña, 1992; Hwang et al., 1992), extraction(Nathan, 1978) or adsorption onto activated charcoal or adsorbentresin (Nathan, 1978; Dummer & Schmidhammer, 1983, 1984).
Like VC waste gases produced during other processes (seechapter 3), the recovered VC can be recycled or incinerated (US EPA,1982; BUA, 1989). Special biological filters have been developed fordegrading VC in waste emissions (Meier, 1994, 1996; see also section4.2.1).
Incineration leading to the total destruction of VC requirestemperatures ranging from 450 °C to 1600 °C and residence times ofseconds for gases and liquids, or hours for solids (HSDB, 1995).
Photochemical oxidations (Topudurti, 1992; Zeff & Barich, 1992;Berman & Dong, 1994; see also section 4.2.2) are further methods ofVC elimination. UV-enhanced oxidation (oxidants used: ozone,hydrogen peroxide) was applied for purification of polluted waters,(e.g., waste, leachate, groundwater) (Zeff & Barich, 1992). Treatmentwith sodium dichromate in concentrated sulfuric acid wasrecommended for the destruction of small quantities of VC, forinstance, from experimental laboratories (HSDB, 1995).
Chlorinated volatile organic compounds (VOCs) can be removedfrom drinking-water/groundwater by treatment with activatedcharcoal (Schippert, 1987), air stripping (after water is pumped to thesurface) (Boyden et al., 1992) or by air sparging (applied in situ)(Pankow et al., 1993). Recently, on-site and in situ bioremediationtechniques, which couple evaporative or other methods with microbialtreatment, have been developed for restoration of groundwater systems(Roberts et al., 1989; Portier et al., 1992, 1993; Fredrickson et al.,1993; McCarty, 1993; Lackey et al., 1994) or soils (Schulz-Berendt,1993) contaminated with VC and other VOCs.

Environmental Transport, Distribution and Transformation______________________________________________________
75
4.4.2 Fate of VC processed to PVC
Most of the VC produced is used for the manufacture of PVC (seesection 3) and will therefore be connected with the fate of PVC. PVCand articles made from it can be disposed of in landfills, incinerationor feedstock recycling. While rigid PVC is an extremely persistentmaterial, flexible PVC may be less recalcitrant to disintegration(Harris & Sarvadi, 1994). At incineration, PVC plastics do notdepolymerize to form VC (Harris & Sarvadi, 1994), but producevolatile aliphatic hydrocarbons and volatile chlorinated organiccompounds (Nishikawa et al., 1992; see also section 3.2.4). There isevidence for formation of PCDFs/PCDDs (Theisen et al., 1989, 1991;IPCS, 1989).

76
5. ENVIRONMENTAL LEVELS ANDHUMAN EXPOSURE
5.1 Environmental levels
There is very little exposure of the general population to VC.
Concentrations of VC in ambient air are low, usually less than3 :g/m3. Exposure of the general population may be higher insituations where large amounts of VC are accidentally released to theenvironment, such as a spill during transportation. However, suchexposure is likely to be transient. Near VC/PVC industry and wastedisposal sites, relatively much higher concentrations, up to8000 :g/m3 and 100 :g/m3, respectively, have been observed. VC hasonly rarely been detected in surface waters, sediment or sewagesludges. Maximal VC concentrations in groundwater or leachate fromareas contaminated with chlorinated hydrocarbons amount to 60 000:g/litre.
5.1.1 Air
5.1.1.1 Outdoor air
Atmospheric air levels of VC in rural/remote and suburban/urbanareas range from not detectable to 24 :g/m3 (Table 13). Higher valueswere recorded in industrial areas, with maxima in the vicinity ofVC/PVC producing or processing plants, even at distances of 5 km.Peak concentrations were as high as 86 mg/m3 (33 ppm) and17 mg/m3 (7 ppm), measured, respectively, in 1974 in the USA and1983 in China (Table 13). In many countries, VC concentrations nearplants have decreased with time due to regulatory measures (Table13).
In more recent years attention has been paid to the occurrence ofVC near waste disposal sites, where levels of up to 0.18 mg/m3
(70 ppb) have been detected (Table 13). This is much less than thesignificant amounts of VC found in undiluted landfill gas (seesection 3). Bruckmann & Mülder (1982) assumed that gas dischargesof landfills are diluted by a factor of 104 when entering theatmosphere.
VC emissions of < 0.5 :g/m3 (remote from VC plants) or of a few:g/m3 (near VC plants) in Germany and the Netherlands were

Environmental Levels and Human Exposure______________________________________________________
77
Table 13. Vinyl chloride measured in ambient (atmospheric) aira
Country; site and Valueb Concentrations Referenceyear of sampling (:g/m3)
Rural/remote areas single 0.1 Kruschel etCanada: pine forest al. (1994) near Barrie, Ontario year n. sp.
Germany: Westerland, mean values 6.6–24 Bauer Schwarzwald, (1981) Lüneburger Heide, Bayer Wald; prior to 1977
Germany: Taunus; mean value 0.1 Dulson 1975 (n = 4) (1978)
USA: rural Northwest (n = n. sp.) n.d. (< 0.013) Grimsrud & USA (Pullman, Rasmussen Washington); (1975)1974–1975
USA: over ocean (n = n. sp.) n.d. (< 26) Lillian et Sandy Hook, NJ al. (1975) (3 miles offshore); 1974
Suburban/urban areasCanada: urban (22) meanc 0.06 Dann & and rural (1) sites; (n = 1370; 4% Wang (1992) 1989–1990 > detection)
Germany: Berlin range (n=78) n.d. (n.sp.) – 3.5 Dulson (3 sites); 1977 means 0.3–0.4 (1978);
Lahmann(1980)
Germany: Frankfurt/M. n = 1 2.6 Bergert & (city); 1974 Betz (1976)
Germany: Frankfurt/M. mean (n = 16) 21.1 Arendt et (suburban); 1975 al. (1977)
Germany: Merkenich annual mean 3.6 German Expert (North-Rhine Group on the Westfalia); 1980 Environment
(1988)

EHC 215: Vinyl Chloride______________________________________________________
78
Table 13 (contd).
Country; site and Valueb Concentrations Referenceyear of sampling (:g/m3)
Germany: Cologne means 0.5–15.3 Anon (1981); (3 stations); (n = n.sp.) BUA (1989) 1979–1986
Germany: several mean values 0.2–11 Bouscaren sites; year n. sp. et al. (1987)
Germany: Hamburg annual means 2.4–9.0 (including Bruckmann (12 sites in the city); (n = 300) 1-butene) et al. (1988) 1986–1987
USA: New Jersey geom. mean 1981: 0 Harkov et (3 urban sites: (3/113)d and 1982: 0 al. (1983, Newark, Elizabeth, (0/105)d (detection limit: 1984) Camden); 1981–1982 0.013)
USA (eastern): urban daily mean 0.62 Dann & sites; 1989 (n=397; 2% Wang (1992)
> detection)
Industrial sitesCanada: Shawinigan range n.d. – 117 Thériault (vicinity of VC poly- et al. (1983) merization plant); year n. sp.
China: dormitories for n = 16×3 Zhao et al. workers (50, 100 and (4 h/day for (1994) 1000 m from a VC 4 days at polymerization plant) 3 stations)
1983 maxima 17 400 / 5900 / 1500daily means 4810 / 1080 / 580
1984 maxima 7800 / 2500 / 1400daily means 4080 / 720 / 500
1986 maxima 6600 / 2000 / 1100daily means 3120 / 820 / 520
1988 maxima 12 700 / 1000 / 300daily means 4430 / 320 / 200
1989 maxima 3100 / 700 / 300daily means 760 / 220 / 170

Environmental Levels and Human Exposure______________________________________________________
79
Table 13 (contd).
Country; site and Valueb Concentrations Referenceyear of sampling (:g/m3)
Finland: 1.2 km from Kinnunen a PVC plant (1996) 1993 range of 0.1–1.3
monthly means 1994 range of 0.1–0.8
monthly means 1995 range of < 0.1–0.1
monthly meansrange of single 0.1–11measurements
(n .4000) 1996 range of 0.1–0.4 Kinnunen
monthly means (1997)range of single 0.1–13measurements
(n .7000)
Germany: n.sp.; maximum 252 Bouscaren prior to 1980 et al. (1987)
Germany: Ruhrgebiet 99th percentile 69 BUA (1989) West; year n. sp.
Germany: 1978–1982 max. (n = n.sp.) 113 Bauer (1981)
Germany: Marl (80 m mean (n = 24) 213 Rohrschneider and 500 m above mean (n = 9) 108 et al. (1971) chemical plant);1970
Germany: Frankfurt/M. n.sp. 4.5 Atri (1985) (industrial area); year n.sp.
Netherlands: > 600 m maximum ca. 600 Besemer from VC plant; mean 210 et al. 1976–1977 (1984)
0–500 m distant range (n = 200) < 21–504 500 m distant; 1978 range (n = 100) 13–55
mean 18
Netherlands: range (n = n.sp.) 7.8–181 Guicherit & VC/PVC plants; Schulting 1980 (1985)

EHC 215: Vinyl Chloride______________________________________________________
80
Table 13 (contd).
Country; site and Valueb Concentrations Referenceyear of sampling (:g/m3)
UK: 5 VC plants; overall means < 13–228 Turner et al. 1984 (April–July) daily means 23–218 (1984)
(ranges related tothe 5 plants,total n = 440)
Plant VI (7 stations, max. (n = 28); 20 202 (0 km), 0–4.8 km distant) 880 (0.8 km)
Plant IX (15 stations, means (n = 180); 311–1373 0.8–5 km distant) maximum 8806 (5 km)
USA: 1974–1975; VC (n = 708) US EPA plant (Narco) means 3.4–262 (1975); (4 stations, geom. means 0–28 Dimmick < 250 – > 1000 m maximum 27 045 (< 250 m) (1981) distant)
PVC plant (Aberdeen) (n = 438) (4 stations, means 11.6–958 < 250 – > 1000 m geom. means 3.7–372 distant) maximum 23 430 (300 m)
PVC plant (Louisville) (n = 712)(4 stations, means 11.4–101 < 250 – > 1000 m geom. means 5–30 distant) maximum 814 (250–400 m)
USA: residential areas range (n = 30) n.d. – 104 US EPA near chemical plants (1975) (n = 15); 1974
USA: Houston, Texas; range (n = 18.) 8–3238 Gordon & 1974 Meeks
(1977)
USA: residential max. (n = n.sp.) > 2560 Fishbein areas in the vicinity mean (n = n.sp.) 44 (1979) of VC/PVC plants; prior to 1975
USA: vicinity of max. 34 McMurry & VC/PVC plants (Texas, Tarr (1978) 7 stations); 1977

Environmental Levels and Human Exposure______________________________________________________
81
Table 13 (contd).
Country; site and Valueb Concentrations Referenceyear of sampling (:g/m3)
Areas in the vicinity of waste sitesBelgium: Mellery; prior to no details 19 Lakhanisky 1990 et al. (1993)
Germany: surroundings no details < 3 Pudill (1993) of a hazardous waste site; about 1988
Germany: 2 landfills near range < 0.082–0.65 Wittsiepe Bochum; 1990–1991 (n = 16) et al. (1996)
USA: West Covina, range (24-h av; 26–104 Camarena & California; 1981–1984 n = 32) max 130 Coy (1984)
USA: West Covina, 24-h averages 13–31 (n = 5 days) Baker & California; 1984 5-day average 23 MacKay site A (200 m distant 24-h averages 5.7–18 (1985) from landfill) 5-day average 10.4 (n = 5 days) site B (20 m distant from landfill)
USA: southern max. 18 Stephens California, 1981 range (6 stations) 5–18 et al. (1986) after 1981
USA: California; max. 30 Little et prior to 1990 al. (1992)
USA: New York range n.d. (5.4) – 16 Lipsky & (2 sites) 1982 Jacot
(1985)MiscellaneousUSA: all outdoor site mean 8.5 Shah & types; prior to 1988 (n = 574) Singh
(1988)
a n.d. = not detected (detection limit in parentheses, if specified);n.sp. = not specified
b This column indicates whether the concentration is a maximum (max),average or range value
c Values below detection set to 0.5 method detection limit (0.1 :g/m3)d Values in parentheses = no. detected / no. sampled

EHC 215: Vinyl Chloride______________________________________________________
82
derived from a computer model (Besemer et al., 1984; WHO, 1987;LAI, 1992). Ambient air concentrations in three geographical areasof the USA were computed to range from trace to about 3 :g/m3
(Pellizzari et al., 1979).
5.1.1.2 Indoor air
Indoor air concentrations of VC in houses near landfills in theUSA reached concentrations of up to 1 mg/m3 air (Little et al., 1992:2 landfills, maxima of 0.13 and 0.3 mg/m3; Stephens et al., 1986:1 landfill, maximum of 1 mg/m3), thus exceeding the maximumoutdoor levels reported in Table 13 for areas adjacent to landfills.Moreover, the Californian monitoring programme, collecting a totalof 500 air samples at two outdoor and four indoor sites downwind ofa landfill, revealed that the 120 samples containing the most VC($ 0.025 mg/m3; 10 ppb) were taken inside homes (Little et al., 1992).It is assumed that in addition to atmospheric transport, subsurfacemigration of VC accounts for the elevated indoor air levels of VC(Wood & Porter, 1987; Hodgson et al., 1992; Little et al., 1992).
A room being painted with a red latex paint based on aterpolymer of vinyl chloride, vinyl acetate and ethylene showed VClevels of 75 and 10 :g/m3 (29 and 4 ppb), respectively, during andsome time (less than one day) after painting (Going, 1976).
In the early 1970s it was investigated whether VC was present incar interiors as a result of volatization from PVC. Measurements ofVC concentrations in the interior of seven different new 1975automobiles gave positive results for two of them. Levels of 1036 to3108 :g/m3 (0.4 to 1.2 ppm) were detected (detection limit: 130:g/m3; 0.05 ppm) (Hedley et al., 1976). Another study (Going, 1976)did not find VC in the interior ambient air of 16 new and used carsand 4 mobile homes (detection limit: 26 :g/m3; 10 ppb). It should benoted that since this time the levels of VC in PVC resins have beendrastically reduced (see section 3.2.4).
5.1.2 Water and sediment
Owing to its high volatility, VC has rarely been detected insurface waters. The concentrations measured generally do not exceed10 :g/litre, with a maximum of 570 :g/litre from contaminated sites(Table 14).

Table 14. Vinyl chloride concentrations measured in surface watera
Country, source Year of sampling Valueb Concentrations Remarks Reference(:g/litre)
Germany
River Rhine (prior to) 1978 typical conc. 1 Anna & Alberti (1978)(n = many)
River Rhine 1982 < 0.2 Malle (1984)
River Rhine 1990 range (n = 78) < 0.01–0.031 Wittsiepe (1990)
Tributaries of Rhine (prior to) 1978 typical conc. < 1–5 Anna & Alberti (1978) (Northrhine-Westfalia) (n = many)
Surface water from unspecified n.sp. range < 0.0004–0.4 $ 150 samples Wittsiepe et al. (1990) sites in former FRG (n = n.sp.)
River Main 1990 range (n = 22) < 0.004–0.008 Wittsiepe (1990)
River Lippe 1989 range (n = 54) 0.12–0.4 receiving wastewater Wittsiepe (1990)from VC/PVC plants
River Ruhr (plus 1990 range (n = 60) < 0.0004–0.005 Wittsiepe (1990) artificial lake) (lake: up to 0.06)

Table 14 (contd).
Country, source Year of sampling Valueb Concentrations Remarks Reference(:g/litre)
Germany (contd).
River Wupper 1989 range (n = 36) up to 0.069 Wittsiepe (1990)
River Saale 1990 range (n = 4) up to 69 receiving wastewater Wittsiepe (1990)from an industrial areaof the former GDR
JapanRivers in Osaka 1995 range (n = 28) up to 1.2 (3/28)c Yamamoto et
al. (1997)USADelaware River 1976–1977 (n = 11) n. d. Sheldon & Hites
(1978)
Surface water from different 1977–1979 maximum 566 (21/606)c Page (1981) sites in New Jersey (n = 606)
median 0
Surface water from 9 states n.sp. maximum 9.8 Burmaster (1982);(n = n.sp.) Dyksen & Hess (1982)

Table 14 (contd).
USA (contd).
Final effluent from a waste- 1980–1981 mean 6.2 Gossett et al. (1983) water treatment plant (n = 5) in Los Angeles
Surface waters prior to 1984 median < 5 (63/1048)c Staples et al. (1985)(n = 1048)
Indian River Lagoon (near n.sp. (n = n.sp.) n.d. (< 1.0) Wang et al. (1985) water discharge of VC), several stations
Surface water near 1985–1990 (n = n.sp.) n.d. Hallbourg et al. (1992) 3 landfills in Florida
Surface water at a landfill 1989–1990 range 0.23 Chen & Zoltek (1995) in Florida (Orange County) 1992–1993 (n = 5) n.d.
a n.d = not detected (detection limit in parentheses, if specified); n.sp. = not specified; GDR = German Democratic Republicb This column indicates whether the concentration is a maximum (max), average or range valuec Values in parentheses = no. detected / no. sampled

EHC 215: Vinyl Chloride______________________________________________________
86
Much higher levels of up to 56 000 :g/litre have been found ingroundwater samples from contaminated sites (Table 15).
The levels in drinking-water supplies ranged from not detected to2 :g/litre in samples collected in 100 German cities in 1977. In astate-wide USA study performed in 1981–1982, random samples(taken from randomly selected water systems) had concentrationranges of n.d. to 1.1 :g/litre, and non-random samples (taken fromsystems that were likely to be contaminated with VOCs) varied fromn.d. to 8 :g/litre. Prior to 1980 single maximum values of up to380 :g/litre were reported from the USA (Table 16).
One reason for the occurrence of VC in drinking-water may bethat residual VC can migrate from PVC pipes used in some waterdistribution systems into the water flowing through them. This hasbeen found out by field (Dressman & McFarren, 1978) andexperimental (Banzer, 1979; Nakamura & Mimura, 1979; Ando &Sayato, 1984) studies. The extent of leaching depended on the VCconcentration in the pipe material. In the field study the highest VCconcentrations (1.4 :g/litre) consistently occurred in water from newpipes, whereas the lowest level (0.03 :g/litre) was found in the oldest(9 years of age) distribution system. VC concentrations in landfillleachate samples amounted to up to 61 mg/litre (Table 17). A grossanalysis of water (no specification) available for the USA and basedon 5553 observations reported maximum and median concentrationsof VC as high as 202.6 mg/litre and 107 :g/litre, respectively (USEPA, 1985a).
No VC was detected in urban stormwater run-off from 15 citiesin the USA (n = 86) during a monitoring project concerning prioritypollutants (Cole et al., 1984).
Generally, a time trend cannot be derived from the water analysisdata available.
Most sediment samples contain very low VC concentrations, evenat rather contaminated sites. Sediment was monitored for VC during1981–1982 in Florida (USA) at several stations (n = 8) of the IndianRiver Lagoon and a conveying canal. Although the latter receiveddischarged water having VC concentrations of 34–135 :g/litre, noVC was detected in the sediment samples (3 from each station,

Environmental Levels and Human Exposure______________________________________________________
87
collected monthly over a year), the detection limit being 2 ng/g (Wanget al., 1985). The same was true for surface water (Table 14) andoyster (section 5.1.5) samples from this site. Sediment samples (n = 2)taken near the discharge zone of a wastewater treatment plant in LosAngeles County (California, USA) contained < 0.5 :g VC/kg dryweight. The corresponding water concentration of VC was6.2 :g/litre (Gossett et al., 1983). A survey of 343 sediment samplesfrom the USA gave a median VC concentration of < 0.5 :g/kg dryweight (Staples et al., 1985). However, higher VC concentrationswere also reported. According to US EPA (1985a), VC was detectedin sediment samples (no further details given) in the USA at levelsranging from 0–580 :g/kg (n = 649; median = 23 :g/kg).
5.1.3 Soil and sewage sludge
5.1.3.1 Soil
Subsurface soil samples near the waste pit of an abandonedchemical cleaning shop in southern Finland showed VCconcentrations as high as 900 mg/kg (Salkinoja-Salonen et al., 1995).After an accidental spillage of VC into snow in 1980, VC levels ashigh as 500 mg/kg were measured in the soil at up to 2 m depth(Charlton et al., 1983).
5.1.3.2 Sewage sludge
VC has been detected in municipal sewage sludges in the USA.The concentrations ranged from 3 to 110 mg/kg dry weight(corresponding to 145 to 3292 :g/litre), being detected in 3 of 13samples, with a median concentration of 5.7 mg/kg dry weight(corresponding to 250 :g/litre) (Naylor & Loehr, 1982). Anotherstudy reported a mean concentration of 35.4 mg/kg dry weight for 6of 44 samples (Fricke et al., 1985). A range of 8–62 000 :g/litre wasfound in 35 of 435 raw sludge samples (Burns & Roe, 1982).
5.1.4 Food, feed and other products
VC is not a general contaminant of foodstuff and pharmaceuticalor cosmetic products, but it can be detected after contact of theseproducts with PVC packaging materials. The use of PVC aspackaging material for food, drink and drugs began in the early sixties

Table 15. Vinyl chloride concentrations measured in groundwatera
Country; source of groundwater Year of sampling Valueb Concentrations Remarks Reference(:g/litre)
Canada
from a VC spill site 1980 maximum; 10 weeks 10 000 Charlton et al.after the spill < 20 (1983)
beneath a landfill near Ottawa 1988 range (n = 37) < 1–40 (5/37)c Lesage et al. (1990)
Finland
from village wells (contaminated by mid-1980 range 5–200 mg/litre Nystén (1988); leakage of a waste liquor basin of (including DCE) Salkinoja-Salonen VC/PVC industry - detected in 1974) et al. (1995)
Germany
from different sites (4 sites) mean values n.d. (< 5) – 460 Brauch et al. (1987)
from different wells of a large surface mean values 15–1040 contamination (5 wells)
from a catchment area of a water- range (n = 30) < 1–120 Milde et al. (1988); works (TCE / PCE-contaminated) Nerger & Mergler-
Völkl (1988)
contaminated by waste disposal until 1988 range (n = 113) < 1–12 000 (14/113)c Schleyer et al. sites (92 sites) mean 2700 (1988)
median 475

Table 15 (contd).
from a site contaminated with n.sp. (n = 3) corresponding air Köster (1989) chlorinated hydrocarbons pockets in soil
1000 128 000 :g/m3
500 47 000 :g/m3
200 5000 :g/m3
from a site contaminated with ca. 1989 max. (n = 5) 110 Leschber et chlorinated hydrocarbons (in Berlin) al. (1990)
from a contaminated site (in n.sp. range (n = 3) 710–1670 Kästner (1991) Braunschweig)
of a catchment area of a 1989 (n = n.sp.) up to 0.130 Wittsiepe et al. waterworks (1990)
Contaminated by accidental 1989 (n = n.sp.) up to 3 spillage of TCE and PCE
Contaminated by waste n.sp. mean (n = 136) 1693 18% positive Dieter & Kerndorff disposal sites (~ 100 sites) max. 12 000 (1993)
USA
from different sites in New Jersey 1977–1979 max. (n = 1060) 9.5 (4/1060)c Page (1981)
from 9 states max. 380 7% positive Dyksen & Hess(1982)
monitoring wells near industrial n.sp. max. 635 present in Stuart (1983) waste sites in Connecticut 3 out of 9 wells

Table 15 (contd).
Country; source of groundwater Year of sampling Valueb Concentrations Remarks Reference(:g/litre)
USA (contd).
from Nassau County, Long Island 1980 range (n = >100) 1.6–2.5 Connor (1984)
from Miami, Florida n.sp. mean (n = 3) 6.8 Parsons et al. (1984)
from a TCE spill site in Vero n.sp. mean (n = 3) 82 Parsons et al. (1984) Beach, Florida
monitoring wells near MSW n.sp. present (in 5/20 sites), Sabel & Clark (1984) landfills in Minnesota but not quantified
near 3 plants manufacturing n.sp. range (n = 3) 50–500 chlorinated solvents White Paper (1984) electronics equipment stored in underground cited in Wolf et al. (Santa Clara Valley) tanks (1987)
near solvent recovery facilities range (n = 4) Cline & Viste (1985) Connecticut 1980 n.d. (< 10) – 2700 Wisconsin 1983 n.d. (< 10) – 210
from a residential area in Long 1983 maximum 2800 contamination from Andreoli (1985) Island, New York (several wells) dry-cleaning shop
near a landfill in New Jersey (about 1981) max. (n = ~ 100) 692 Shechter (1985)

Table 15 (contd).
monitoring wells around hazardous 1985 max. 2600 seasonal, spatial and Stephens et al. waste landfill in S. California analytical variations (1986)
monitoring wells near an airforce 1990 range (n = 64) n.d. (1–2) – 12 (5/64)c EMO (1992) base in Ohio
near 3 landfills in Florida 1985–1990 mean values < 0.22–26.5 Hallbourg et al. (10 locations) (1992)
monitoring wells at a landfill in 1989–1990 range (n = 3) n.d. – 0.23 increase of VC with Chen & Zoltek central Florida (Orange County) 1992–1993 4.8–48.4 time, decrease in (1995)
total VOC
from an industrial site; recycling (n = n.sp.) 51–146 Topudurti (1992) operations (1940–1987); California
near a former waste disposal (n = n.sp.) US EPA (1992) facility in Wisconsin: on-property max. 77 off-property max. 5
Contaminated by TCE > 10 years 1991 maxima < 5–56 400 Semprini et al. before (17 sites) minima < 5–321 (1995)
near Plattburg, New York n.sp. (n = 2) 8 and 384 Bradley & Chapelle (2 locations) (1996)
a n.d. = not detected (detection limit in parentheses, if specified); n.sp. = not specified; TCE = trichloroethene; PCE = tetrachloroethene;VOC = volatile organic compounds; max. = maximum; MSW = municipal solid waste
b This column indicates whether the concentration is a maximum (max), average or range valuec Values in parentheses = no. detected / no. sampled

Table 16. Vinyl chloride measured in drinking-water suppliesa
Country; source Year of sampling Valueb Concentration Remarks Reference(:g/litre)
Germany
drinking-water supplies of 100 cities 1977 range n.d. – 1.7 Bauer (1981)
drinking-water (no details) n.sp. (n = n.sp.) ca. 1.6 ng/litre Wittsiepe et al.(1993)
USA
finished drinking-water (prior to) 1975 max. (n = n.sp.) 10 Fishbein (1979)
water supplies from Florida and (prior to) 1975 max. (n = n.sp.) 5.6 & 0.27 Philadelphia
raw drinking-water (13 cities) 1975–1979 2 positives 2.2 & 9.4 (2/13)c CEQ (1981)
finished drinking-water (25 cities) 1 positive 9.4 (1/25)c
drinking-water wells (state (prior to) 1980 max. (n = n.sp.) 50 CEQ (1981); New York) Burmaster (1982);
Craun (1984)

Table 16 (contd).
drinking-water of 113 cities (prior to) 1981 range 0.05–0.18 Kraybill (1983)mean 0.052
drinking-water supplies (166) 1977–1981 range of positives trace – 380 (82/1288)c Cotruvo et al.(1986)
finished water supplies (using 1981–1982 max.: Westrick et al. groundwater sources) from random samples: 1.1 (1/466)c (1984) 51 states in the USA (n = 466)
non-random samples: 8.4 (6/479)c
(n = 479)
private wells in Nebraska (n = 63) 1982 max. 4.5 (1/63)c Goodenkauf &Atkinson (1986)
a n.d. = not detected (detection limit in parentheses, if specified); n.sp. = not specifiedb This column indicates whether the concentration is a maximum (max), average or range valuec Values in parentheses = no. detected / no. sampled

Table 17. Vinyl chloride concentrations measured in leachatea
Country; source Year of sampling Valueb Concentrations Remarks Reference(:g/litre)
Canada
MSW landfill leachate from 1988 n.sp. 14 Lesage et al. (1993) Guelph (Ontario) 1989 n.sp. 23
USA
landfill leachates from Minnesota n.sp. (n = 6) not quantified present in 1/6 Sabel & Clark (1984)samples
landfill leachates from Wisconsin prior to 1982 max. (n = 4) 61 (1/4)c
landfill leachates (municipal and prior to 1985 range (n = 5) n.d. (< 10) – 120 Cline & Viste (1985) industrial)
landfill leachates: prior to 1988 range (n = n.sp.) total number of Brown & Donnellylandfills: 58 (1988)
municipal 20–61 000industrial 140–32 500
MSW leachates (several states (prior to) 1988 range (n = n.sp.) 8–61 in the USA) median 40 (6/?)c Chilton & Chilton
(1992)
a n.d. = not detected (detection limit in parentheses, if specified); n.sp. = not specified; MSW = municipal solid wasteb This column indicates whether the concentration is a maximum (max), average or range valuec Values in parentheses = no. detected / no. sampled

Environmental Levels and Human Exposure______________________________________________________
95
(chapter 3), whereas legislative action for safeguarding consumersfrom exposure to VC did not begin until the early seventies (startingwith a ban on the use of PVC containers for packaging alcoholicbeverages in the USA; Anon, 1973). Current EC and US FDAregulations on the level of VC in PVC materials intended to come intocontact with foodstuffs are listed in Annex 1.
VC concentrations measured in PVC-packed food and drink ofseveral countries are compiled in Table 18. A maximum value of20 mg/kg was found in liquors. Other positive samples includedvegetable oils (up to 18 mg/kg), vinegars (up to 9.8 mg/kg),margarines (up to 0.25 mg/kg), fruit drinks (> 0.2 mg/kg) and bottledwater (< 0.6 :g/litre).
Retail surveys of foods showed a significant reduction in VClevels and/or in the number of positive samples since 1974 (UKMAFF, 1978, 1984; van Lierop, 1979; Codex Committee, 1984).
The latest data were from the 1990s (Table 18) and refer tobottled drinking-water. In addition to small amounts of VC, therewere also indications for the presence of possible reaction products ofVC with chlorine (Fayad et al., 1997).
Pharmaceutical and cosmetic products were less frequentlymonitored. The highest concentration, amounting to 7.9 mg/kg, wasdetected in mouthwashes (Table 19).
Reports on analyses of animal feed were not available.
The potential for leaching of residual VC from PVC packaginginto the contents has been demonstrated by a variety of productanalyses (Tables 18 and 19) and by experimental studies using foodor food simulants (Daniels & Proctor, 1975; Hocking, 1975; Tester,1976; Diachenko et al., 1977; Pfab & Mücke, 1977; UK MAFF, 1978;Chan et al., 1978; vom Bruck et al., 1979; van Lierop, 1979;Benfenati et al., 1991; Thomas & Ramstad, 1992). Altogether, theresults indicated that the amount of VC migrating into food or solventwas proportional to the VC concentration in the PVC packaging, tostorage time and to increasing temperature.

Table 18. Levels of vinyl chloride in food and drink packaged, stored or transported in PVC articles
Country Yeara Product No.a,b Concentrationsc Reference(:g/kg)
Canada n.sp. alcoholic beverages 22 < 25–1600 Williams & Miles (1975)vinegars 28 n.d. (10) – 8400peanut oil 10 300–3300
Canada n.sp. alcoholic beverages 10 n.d. (10) – 2100 Williams (1976a)vinegars 10 300–7800vinegars 9 14–9800 Williams (1976b)sherry 3 500–2400peanut oil 3 3800–18 000
Canada n.sp. oil 5 80–2100 Page & O'Grady (1977)vinegars 5 10–5700
Canada 1981–1982 vinegars n.sp. 27–43 Codex Committee (1984)other foods n.sp. < 10
Italy n.sp. drinking-water (PVC-bottled) 10 0.013–0.083 Benfenati et al. (1991)
Netherlands 1975 oil samples 8 > 50 Van Lierop (1979)salad dressing 1 250margarine 4 60–250ready-made salads n.sp. (whole batch) > 50wine n.sp. 760

Table 18 (contd).
Netherlands 1976 margarine 1 60 Van Lierop (1979)fish 1 90biscuit 3 20–130
1977 peanut butter 1 4100 Van Lierop (1979)(very small individually wrapped portions)
1978 various foods: 67 (3 +) n.d. (0.1) – 2 Van Lierop (1979)soya oil 1 0.3vinegar 1 0.6salmon salad 1 2
Norway 1975 butter/margarine 16 n.d. (2) Ehtesham-Ud Din et al. (1977)salad 14 2–15juices 8 6–25vinegar 27 6–2790mustard 5 9–14
Saudi Arabia n.sp. drinking-water (PVC-bottled) 9 × 48d < 0.6 Fayad et al. (1997)
Sweden 1974 edible fats 127 n.d. (2) – 127 Fuchs et al. (1975)
Sweden 1975–1976 various foods 104 n.d. (2) – 600 Albanus et al. (1979)(edible fats and oils, ketchup, (mostly: < 10)vinegar, lime juice, fruit syrup)
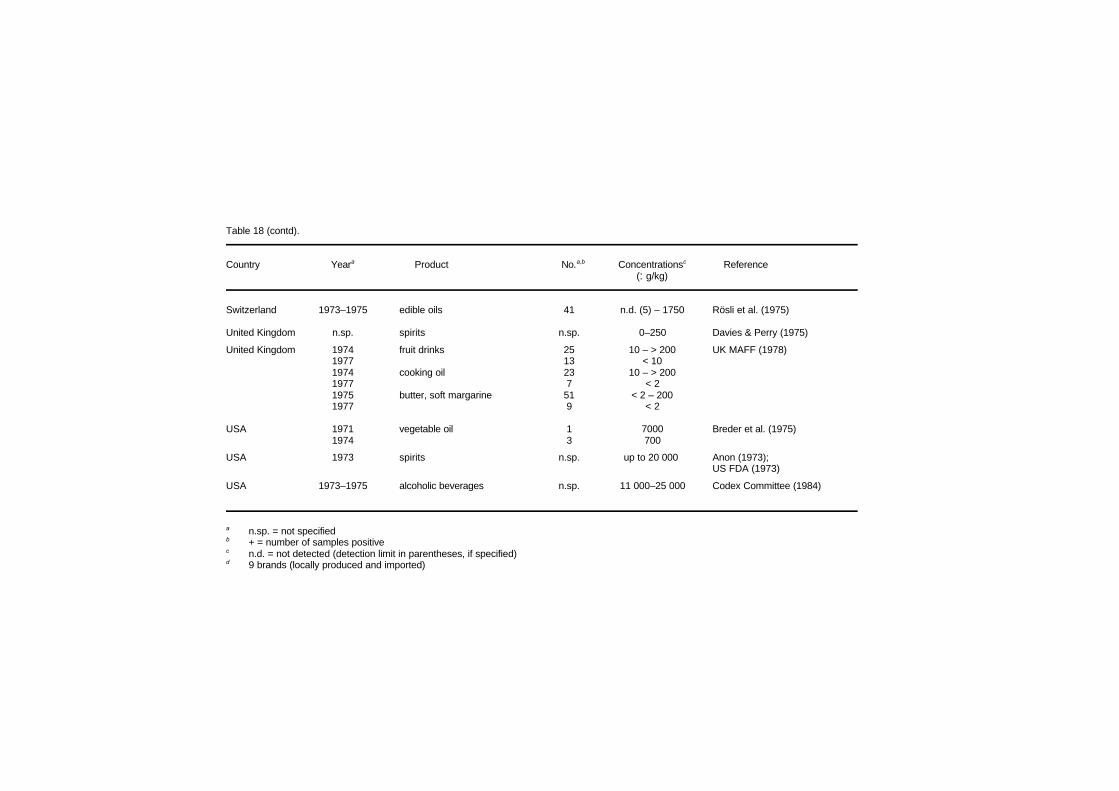
Table 18 (contd).
Country Yeara Product No.a,b Concentrationsc Reference(:g/kg)
Switzerland 1973–1975 edible oils 41 n.d. (5) – 1750 Rösli et al. (1975)
United Kingdom n.sp. spirits n.sp. 0–250 Davies & Perry (1975)
United Kingdom 1974 fruit drinks 25 10 – > 200 UK MAFF (1978)1977 13 < 101974 cooking oil 23 10 – > 2001977 7 < 21975 butter, soft margarine 51 < 2 – 2001977 9 < 2
USA 1971 vegetable oil 1 7000 Breder et al. (1975)1974 3 700
USA 1973 spirits n.sp. up to 20 000 Anon (1973);US FDA (1973)
USA 1973–1975 alcoholic beverages n.sp. 11 000–25 000 Codex Committee (1984)
a n.sp. = not specifiedb + = number of samples positivec n.d. = not detected (detection limit in parentheses, if specified)d 9 brands (locally produced and imported)

Environmental Levels and Human Exposure______________________________________________________
99
Table 19. Vinyl chloride detected in pharmaceutical and cosmeticproducts packaged in PVC materials
Product No.a Concentrationb Reference(:g/kg or :g/litre)
Blood coagulant 30 n.d. (15) Breder et al. solutions (1975)
Mouthwashes 11 n.d. (20–30) – 7900
Several capsules, tablets 11 n.d. (10–30) Watson et al. and mouthwashes (1977)
Large volume 5 n.d. (0.1) – < 1 Watson et al. parenterals (1979)
Mouthwashes 5 7–120
Shampoos 4 9–17
Body oils 4 n.d. (0.1) – 41
Intravenous solutions n.sp. n.d. (1) Arbin et al.(many) (1983)
Cefmetazole sodium 4 n.d. (0.3) – <1 Thomas & (Zefazone® sterile Ramstad powder) (1992)
a n.sp. = not specifiedb n.d. = not detected (detection limit in parentheses, if specified)
Until 1974 the use of VC as a propellant in aerosol sprays wasallowed in the USA (chapter 3). Realistic application of such aerosolproducts (hairspray, deodorant, insecticide, disinfectant, furniturepolish or window cleaner) resulted in high (ppm range) indoor airconcentrations of VC (Gay et al., 1975).
There have been no reports on VC levels found in food,pharmaceutical or cosmetic products in recent years. This may be dueto regulatory measures for PVC packaging in several countries (seeAnnex 1).

EHC 215: Vinyl Chloride______________________________________________________
100
5.1.5 Terrestrial and aquatic organisms
Oysters (Crassostrea virginica) from the Indian River Lagoon inFlorida (USA) contained no detectable levels of VC (detection limit:0.4 ng/g). The samples were collected weekly (1981) and monthly(1982) at three sites (Wang et al., 1985). VC was also not detected inthe corresponding water and sediment samples (section 5.1.2).
Another study (Gossett et al., 1983) did find low concentrationsof VC (< 0.3 :g/kg wet weight) in a sample of small invertebratesfrom just above the bottom sediments (n = 1), in a muscle sample ofshrimp (n = 1) and in liver samples of several fish species (n = 4).The animals were collected in 1981 in final effluent waters from awastewater treatment plant in Los Angeles County (Palos Verdes,California, USA) that had VC concentrations of 6.2 :g/litre (section5.1.2).
Data on fish tissue (no further details given) available from theUS EPA STORET database were reported by US EPA (1985a). VClevels ranged from 0–250 mg/kg (n = 530; median: 6 mg/kg).
5.2 General population exposure
Exposure of the general population to VC is possible by severalroutes. They include inhalation of air polluted with VC (section5.1.1), mainly in the vicinity of VC/PVC plants or waste disposalsites, intake of contaminated drinking-water (sections 5.1.2 and5.1.4), ingestion of food, beverages and medicines packed in PVC(section 5.1.4), and absorption through skin from PVC-wrappedcosmetics (section 5.1.4).
Normally, the general population is exposed to only smallamounts of VC, if at all. However, the exposure varies according tothe countries’ regulatory measures, the occurrence of accidents or thespread of precursor substances.
5.2.1 Estimations
Estimations of the respiratory intake of VC reported for the USAranged from 0 to 48.3 mg per person per day, based on exposurevalues of 0 to 2.1 mg/m3 and assuming that 23 m3 of air are inhaledper day (US EPA, 1985b). According to Seiber (1996) over 100 000Californians, particularly those living near landfills, may be exposedto VC levels of 2.59 :g/m3 (1 ppb) or more.

Environmental Levels and Human Exposure______________________________________________________
101
A European study (Besemer et al., 1984) evaluating the exposureof the Dutch population to VC in ambient air assumed an averageexposure of about 0.2 :g/m3, which resulted in a calculated dailyintake of 4 :g VC per person. Small fractions of the population wereconcluded to be exposed to higher average levels: 0.01% (> 8.5millions) to > 5 :g/m3, 0.04% to 4–5 :g/m3, and 0.05% to3–4 :g/m3. The corresponding estimated daily intakes of VC were> 100 :g, 80 :g and 60 :g, respectively.
Intake via drinking-water from public water supplies in the USAwas estimated to exceed 1 :g/litre for 0.9% of the population,5 :g/litre for 0.3% and 10 :g/litre for 0.1% of the population. Thesewould result in daily VC intakes (assuming a 70-kg man and 2 litresof water/day) of $ 2, 10, and 20 :g/day. Maximal values wereestimated to be approximately 120 :g/day (US EPA, 1985b).
Another study (Benfenati et al., 1991) estimated the daily intakeof VC from PVC-bottled drinking-water bought in Italiansupermarkets. Based on the analytical results (Table 18) and assuminga consumption of 2 litres of water per person per day and a storagetime of 2 months for the PVC bottles, the authors calculated that theoral intake could exceed 100 ng VC per person per day.
Evaluation of the results of food surveillance programmes fromthe United Kingdom led to a calculated maximum likely VC intake of1.3 :g/day per person in 1974, of 0.1 :g/day per person in 1976, andless than 0.02 :g/day per person by 1978 (UK MAFF, 1978, 1984).These calculations were based on the typical daily consumption offruit drink, cooking oil and soft margarine.
Evaluating and summing up possible maximum user intakes ofVC from PVC-bottled liquor, wine and oil, and food packaged in PVCmaterials, the US FDA calculated a maximum lifetime-averagedexposure of 25 ng/person per day (US FDA, 1986). An earlier reviewreported an estimated dietary intake of VC of 40 ng/day per person inthe USA (Codex Committee, 1984).
The intake by food and drinking-water in the Netherlands wasestimated (without specifying details) to be about 0.1 :g/day perperson or less (Besemer et al., 1984). Estimates (no details given) of

EHC 215: Vinyl Chloride______________________________________________________
102
the average human intake for Switzerland were reported to be 3 ng/kgbody weight per day (Lutz & Schlatter, 1993).
5.2.2 Monitoring data of human tissues or fluids
Monitoring human tissues or fluids as an indirect measure ofexposure to VC has not frequently been applied. As with workers inthe plastics industry (section 5.3), the urine of premature babies wasfound to contain large amounts of thiodiglycolic acid (thiodiaceticacid), a metabolite of VC (chapter 6), but the relationship to possibleVC exposure was questionable (Pettit, 1986).
5.3 Occupational exposure
The main route of occupational exposure to VC is via inhalation(Sittig, 1985), while dermal absorption is considered to be negligible(ECETOC, 1988).
Industrial environments associated with VC exposure include VCproduction plants, VC polymerization (PVC production) plants andPVC processing factories. Estimates of numbers of workers exposedto VC were, for example, in the USA (1981–1983) in the range of80 000 (ATSDR, 1997) or in Sweden (1975–1980) more than 5000(Holm et al., 1982). Since, at the onset of VC/PVC production in theUSA and Western Europe, VC was not recognized as a toxiccompound, no precautions against contact were provided for nor wasregular workplace monitoring performed. Therefore, only sporadicmeasurements or retrospective estimates (Table 20) of exposures areavailable for the period prior to 1975. Published data from variouscountries on VC contamination of workplace air throughout the earlyand later periods are compiled in Table 21 and 22. Highest exposuresoccurred in the VC/PVC production plants, with peak concentrationsof several thousand ppm whereas much lower exposure levels weremeasured in processing plants. Owing to standard-setting andlegislative regulations by national authorities and technicalimprovements, levels dropped markedly to values of a few ppm inmany countries. Official exposure limits can serve as an additionalindication of approximate VC concentrations occurring in plants inmany countries. These limits have declined gradually (IARC, 1979).Generally, standards require that exposures do not exceed 13 to

Environmental Levels and Human Exposure______________________________________________________
103
26 mg/m3 (5 to 10 ppm) (Torkelson, 1994; Rippen, 1995; ACGIH,1999).
Table 20. Retrospective estimates of daily occupationalexposures to vinyl chloride prior to 1975a
Country Period VC exposure Reference(mg/m3)
Germany “first years” > 2600 Szadkowski & Lehnertprior to 1971 1300 (1982)
1971 2601974 5.2–7.8
Norway 1950–1954 5200 Hansteen et al. (1978);1955–1959 2600 Heldaas et al. (1984)1960–1967 13001968–1972 2601973–1974 207
Sweden 1945–1954 1300 Holm et al. (1982)1955–1964 7801965–1969 5201970–1974 130
United Kingdom 1945–1955 2600 Barnes (1976);1955–1960 1040–1300 Anderson et al. (1980);1960–1970 780–1040 Purchase et al. (1987)mid 1973 390
1975 131940–1955 1300–2070 Jones et al. (1988)1956–1974 390–1300
USA 1945–1955 2600 Wu et al. (1989)1955–1970 780–13001970–1974 260–520
1975 < 2.6–13
a Exposure levels during autoclave cleaning may have been as high as7800 mg/m3 (Barnes, 1976)
However, even in the 1990s the standards were not alwaysrealized in all countries (Table 21).

Table 21. Levels of vinyl chloride reported for workplace air samples in VC/PVC production plants
Country Workplace Yearc Concentrations reported Reference(mg/m3)c
China PVC production plant n.sp. 30–210 Bao et al. (1982)
Croatia plastics industry n.sp. mean = 13 Fucic et al. (1990a)5200 (occasional peak)
Croatia VC/PVC plant 1949–1987 mean = 543 Hozo et al. (1996,up to 1300 (occasional peak) 1997)
Former n.sp. n.sp. 2–41 Hrivnak et al. (1990) Czechoslovakia
Egypt VC/PVC plant n.sp. 0.05–18 (8-h TWA) Rashad et al. (1994)
Finland PVC production plant, breathing n.d. rangezone concentrations (TWA) 1981–1985 1.6 < 0.3–57 Viinanen (1993)
1986–1989 1.6 < 0.3–461993 0.3 < 0.3–26
France PVC production plant 1977–1978 2.3–7.3 (range of monthly means) Haguenoer et al.(1979)
Germany PVC production department 1974 < 65–181 Fleig & Thiess (1974)

Table 21 (contd).
PVC production plant 1977 1.3–91 German Environ- mental Office (1978)
PVC production plant 1979 12 (12-h TWA; stationary); Heger et al. (1981)15.5 (12-h TWA; personal)
Germany 24 plants 1981–1984 3% of 33 samples: > 5 Coenen (1986);(90 percentile: < 1); (shift means) BIA (1996)
46 plants 1989–1992 all of 117 samples: < 5(90 percentile: < 0.1); (shift means)
Italy VC/PVC plants 1950–1985 < 13– $ 1300 Pirastu et al. (1991)
The Netherlands PVC plant 1976–1977 2.6–26 (8-h TWA) De Jong et al. (1988)
Norway PVC plant 1974 65 Hansteen et al.(1978)
Poland VC/PVC plant 1974 (30–600)a Studniarek et al.(several departments) 1975 (30–270)a (1989)
1976 (15–60)a
1977 (6–150)a
1978 (1–30)a
1979 (1–15)a
1981 (0.1–36)a
1982 (0.1–12)a
(autoclave cleaners) 1974 (990)a
1982 (9–180)a

Table 21 (contd).
Country Workplace Yearc Concentrations reported Reference(mg/m3)c
Poland (contd). breathing zone of VC 1986 21.3 Dobecki &synthesis mechanic 1987 66.9 Romaniwicz (1993)
1988 43.71989 0.71990 0.2
Romania PVC production plant 1965–1967 112–554 Anghelescu et al.(1969)
Russia VC/PVC plant Gáliková et al. (1994)16 probes (whole plant) 1990–1993 1–9 (range of annual means)under the reactor 1990–1993 up to 200 (range of annual means)in compressor room 1990–1993 up to 400 (range of annual mean)
Singapore PVC production plant 1976after 1983 2.6–54 (15.3)a Ho et al. (1991)
up to 26 (short-term) (3.9)a
Sweden PVC production plant 1974–1981 0.26–114 (8-h TWA) Holm et al. (1982)PVC production plant 1974–1980 0.26–5.7 (6-h TWA)

Table 21 (contd).
Taiwan PVC plants (n = 5): n.sp. Du et al. (1996)15 different operation units range (n=114): n.d. (0.13) – 1009(e.g. outside reaction tank)b range (n=4): 6–1009
(mean: 296; median: 86)15 different job titles range of TWA (n=85): n.d. – 3680(e.g. tank supplier)b range (n=9): 5.7–3680
(mean: 660; median: 23.7)
United Kingdom PVC production plant “early days” 7800 Barnes (1976)(full-time autoclave cleaner)
USA PVC plant 1950–1959 up to 10 400; 13–2140 (8-h TWA) Ott et al. (1975)1960–1963 up to 1300; 13–620 (8-h TWA)
PVC plant n.sp. up to 650 (weekly TWA) Baretta et al. (1969)
USA VC/PVC plants 1973 up to 390 (TWA); peaks 2600–10 400 Rowe (1975)
Former USSR VC/PVC plants early 1950s 100–800 Smulevich et al.(1988)
PVC producing plant 50–800 Filatova &(occasionally 87 300) Gronsberg (1957)
Former Yugoslavia PVC production plant 1974 > 195 Orusev et al. (1976)
a Concentrations in parentheses designate geometric meansb Showing highest mean VC concentrationc n.sp.= not specified; TWA = time-weighted average; n.d. = not detected
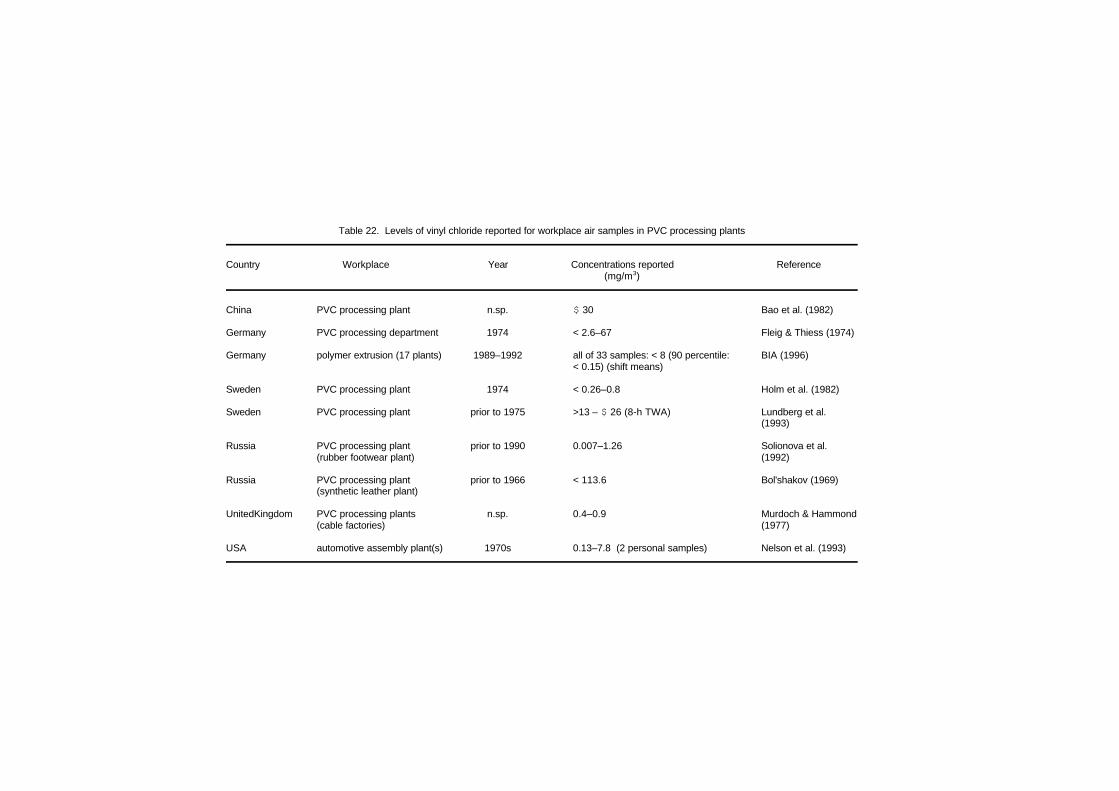
Table 22. Levels of vinyl chloride reported for workplace air samples in PVC processing plants
Country Workplace Year Concentrations reported Reference(mg/m3)
China PVC processing plant n.sp. $ 30 Bao et al. (1982)
Germany PVC processing department 1974 < 2.6–67 Fleig & Thiess (1974)
Germany polymer extrusion (17 plants) 1989–1992 all of 33 samples: < 8 (90 percentile: BIA (1996)< 0.15) (shift means)
Sweden PVC processing plant 1974 < 0.26–0.8 Holm et al. (1982)
Sweden PVC processing plant prior to 1975 >13 – $ 26 (8-h TWA) Lundberg et al.(1993)
Russia PVC processing plant prior to 1990 0.007–1.26 Solionova et al.(rubber footwear plant) (1992)
Russia PVC processing plant prior to 1966 < 113.6 Bol'shakov (1969)(synthetic leather plant)
UnitedKingdom PVC processing plants n.sp. 0.4–0.9 Murdoch & Hammond(cable factories) (1977)
USA automotive assembly plant(s) 1970s 0.13–7.8 (2 personal samples) Nelson et al. (1993)

Environmental Levels and Human Exposure______________________________________________________
109
Whereas in industrialized countries factories that could not satisfythe rigorous regulations of the early 1970s to reduce VC emissionswere forced to close down, in the countries of eastern Europe anddeveloping countries this was not possible for socioeconomic reasonsand large plants with old-fashioned technologies continued to function(Hozo et al., 1996).
Autoclave cleaners in Croatia were exposed to extremely highconcentrations of VC (between 1295 and 3885 mg/m3; 500 and1500 ppm). A retrospective investigation of exposure to VC has beenconducted with 37 autoclave workers (emptying and cleaning) inSplit, Croatia, who were exposed to VC in a suspensionpolymerization plant. The investigation covered the period from 1969to 1987, when the factory was closed because of its VC emissions. Atthe beginning, measurements were done by simple means (Draeger'stubes) and later, from 1980 on, by infra-red spectroscopy. The 37workers were exposed to average VC concentrations of 1412 mg/m3
(543 ppm) (Hozo et al., 1996; Hozo, 1998).

110
6. KINETICS AND METABOLISM INLABORATORY ANIMALS AND HUMANS
6.1 Absorption
Animal and human studies have shown that VC is readily andrapidly absorbed. The primary route of exposure to VC is inhalation.However, the net uptake after exposure by inhalation is only 30–40%of inspired VC. This is due to the fact that VC is taken up rapidlyuntil it reaches a blood concentration in equilibrium with that basedupon inspired concentration and the blood-to-air partition coefficient.Uptake then decreases to an amount sufficient to replace thatmetabolized. The importance of metabolism was shown by Bolt et al.(1977) who showed that uptake of VC ceased once equilibrium wasreached.
While uptake by the oral route is near 100%, any VC notmetabolized during first pass through the liver will be expired. Thus,the net dose may be less than the uptake, especially at high dosesresulting in saturation of metabolizing enzymes.
6.1.1 Oral exposure
In a study reported by Watanabe & Gehring (1976) and Watanabeet al. (1976a), male rats received a single dose by gavage of 0.05, 1.0,20 or 100 mg/kg body weight and 14C-labelled VC and the excretedradioactivity was determined for 72 h. As only 2.4, 2.2, 1.0 and 0.5%,respectively, of the administered radioactivity (Table 23) wasrecovered in the faeces (total recovery 91, 89, 81 and 82%,respectively), it can be assumed that there is nearly completeabsorption of VC in the gastrointestinal tract. Likewise, oraladministration of 0.25 or 450 mg/kg body weight 14C-VC to male ratsresulted in excretion of only 4.6 or 0.7%, respectively (Table 23), ofthe applied radioactivity via faeces 0–72 h after application (Green &Hathway, 1975).
Similar results were obtained by Feron et al. (1981), who fed ratswith different amounts of VC monomer in PVC powder via the diet.The average amount of VC detected in faeces was 8, 10 and 17% for

Table 23. Excretion of radioactivity in rats (in % of applied dose) 72 h after a single oral dose of VCa
Dose in mg/kg VC in CO2 in Urine Faeces Carcass and Total recovery Reference body weight exhaled air exhaled air tissues
0.05 1.4 9.0 68.3 2.4 10.1 91.2 Watanabe et al. (1976a)
0.25 3.7 13.5 75.1 4.6 n.g. n.g. Green & Hathway (1975)
1.0 2.1 13.3 59.3 2.2 11.1 88.8 Watanabe et al. (1976a)
20 41.6 4.8 22.6 1.0 11.0 81.0 Watanabe & Gehring (1976)
100 66.6 2.5 10.8 0.5 1.8 82.3 Watanabe et al. (1976a)
450 91.9 0.7 5.4 0.7 n.g. n.g. Green & Hathway (1975)
a n.g. = not given

EHC 215: Vinyl Chloride______________________________________________________
112
oral intakes of 2.3, 7.0 and 21.2 mg/kg body weight per day,respectively. Since the VC excreted in the faeces was considered bythe authors to be still enclosed in PVC granules and was notbioavailable, it was concluded that the available VC was nearlycompletely absorbed in the gastrointestinal tract.
Studies conducted by Withey (1976) have shown the rapidabsorption of VC from the gastrointestinal tract in male rats after asingle gavage application of 44 to 92 mg/kg body weight in aqueoussolution. Highest blood levels were always measured within 10 minafter administration. After an oral dose of 10 mg VC/kg body weight,peak levels in brain, liver, kidney and lung were measured 5 min afterdosing, indicating rapid absorption from gastrointestinal tract(Zuccato et al., 1979).
6.1.2 Inhalation exposure
Bolt et al. (1977) blocked the metabolism of VC in male rats byi.p. injection of 6-nitro-1,2,3-benzothiadiazole (50 mg/kg bodyweight), a compound that inhibits most microsomal monooxygenases.The rats were exposed to approximately 1.2 mg/m3 14C-labelled VCin a closed system 30 min after the injection. VC was taken up by theanimals until equilibrium was reached between VC in the atmosphereand in the organism after 15 min, suggesting a rapid uptake of VC.Similarly, equilibrium blood levels were observed by Withey (1976)in male rats 30 min after the start of exposure to 18 200 mg VC/m3
(head only).
Bolt et al. (1976) measured the decline of 14C-VC in a closedsystem due to uptake by 3 male rats using an initial concentration of130 mg/m3. The radioactivity in the air of the exposure systemdecreased with a half-life of 1.13 h. Calculation of the clearance ofVC revealed an absorption of inspired VC of about 40%. These resultsare in accordance with the data of Hefner et al. (1975a), who reportedin kinetic studies on male rats a similar decline at the same exposureconcentration.
Krajewski et al. (1980) measured the retention of VC in the lungsof five human male volunteers exposed for 6 h to 7.5, 15, 30 or60 mg/m3 through a gas mask. The percentage of retention (mean

Kinetics and Metabolism in Laboratory Animals and Humans______________________________________________________
113
42%) was independent of the VC concentration and reached thehighest level of 46% in the first 15 min of exposure.
Buchter et al. (1978) reported toxicokinetic experiments onthemselves. In an open system, about 3–5 min after the start ofinhalation of 6.5 mg VC/m3 in the exposure atmosphere, anequilibrium was reached between VC inspired and VC expired; 26%(person A) and 28% (person B) of the VC inspired were removed bythe body, probably by absorption and subsequent metabolism.Metabolism started within the first minutes of exposure, suggestingfast absorption of VC.
Breath samples were measured of volunteers who had showeredin VC-contaminated well water (Pleil & Lindstrom, 1997). For a brief10-min shower exposure of 25 :g/m3 (inhalation) and 4 :g/litre(dermal contact in water), 0.9 :g absorbed dose of VC and a bloodconcentration of 0.01 :g/litre was calculated.
6.1.3 Dermal exposure
Hefner et al. (1975b) exposed the whole body (excluding thehead) of male rhesus monkeys to 2080 (2.5 h) or 18 200 mg/m3
(2.0 h) 14C-labelled VC. Very little VC was absorbed through the skin.Although minuscule, the quantity absorbed appeared concentration-dependent. The major portion of the VC absorbed was eliminated bythe lungs. The authors argued that no significant percutaneousabsorption would be expected under occupational exposure conditions.
6.2 Distribution and retention
Data from inhalation and oral studies on rats indicate rapid andwidespread distribution of VC. Rapid distribution of VC was alsoreported in humans after inhalation exposure. Rapid metabolism andexcretion limit accumulation of VC in the body. Data on distributionafter oral exposure showed similar results. No studies are availableconcerning distribution after dermal exposure. Under conditions ofblocked VC metabolism, VC has been found to accumulate in adiposetissue.

EHC 215: Vinyl Chloride______________________________________________________
114
6.2.1 Oral exposure
Green & Hathway (1975) investigated the distribution in thetissues of young rats 0.25, 2 and 4 h after oral administration of30 mg/kg body weight [14C]-VC using whole-animal autoradiography.At 15 min after gavage, most radioactivity was detected in the liver,followed by the gut (no data about the stomach), and there were smallamounts in the lung and kidney. After 2 h, label was observed in theliver, kidney, small intestine, stomach, skin, para-auricular region(probably Zymbal glands), and there were small amounts in lung andheart. A similar distribution was determined after 4 h, with additionallabel in the thymus, salivary gland and Harders gland, but noradioactivity in the stomach lumen.
The distribution of VC and VC metabolites remaining in the body(11.1% of recovered radioactivity) 72 h after a single oral adminis-tration via gavage of 1 mg/kg body weight 14C-VC was described asfollows (expressed as % of administered radioactivity per gramtissue): liver 0.182, skin 0.076, carcass 0.046, plasma 0.053, muscle0.031, lung 0.061, fat 0.045 (no data about amount in the kidney). Asimilar distribution pattern was observed using doses of 0.05 or100 mg/kg body weight (Watanabe et al., 1976a).
6.2.2 Inhalation exposure
Whole body autoradiograms of male rats showed radioactivity inthe liver, bile duct, digestive lumen and kidneys when animals wereexposed for 5 min to 52 g/m3 14C-labelled VC and sacrificed 10 minafter the end of the exposure period. Animals sacrificed 2–3 h afterthe exposure period showed a wider distribution of radioactivity, withmost of the labelled substances being observed in the liver, urinarysystem, digestive lumen, lacrimal glands, skin and thymus (Duprat etal., 1977).
Buchter et al. (1977) pretreated male rats i.p. with 50 mg/kg bodyweight 6-nitro-1,2,3-benzothiadiazole (to block VC metabolism) andexposed the rats in a closed system for 5 h to VC concentrations ofbetween 65 and 26 000 mg/m3. Authors observed an equilibriumbetween 14C-labelled VC in the gas phase and the exposed organism.The distribution of VC was independent of the exposureconcentration. The following distribution of VC (labelled andunlabelled) in different organs (expressed as mol VC in 1 g tissue per

Kinetics and Metabolism in Laboratory Animals and Humans______________________________________________________
115
mol VC in 1 ml air) was reported immediately after the exposureperiod: blood 0.65, liver 0.62, spleen 0.59, kidney 0.59, muscle 0.68and adipose tissue 8.3. These results indicated that unmetabolized VCis accumulated in adipose tissue due to its lipophilicity. In contrast,without blockage of VC metabolism, most radioactivity was detectedin kidney and liver (5 h, 260 mg/m3).
In similar studies Bolt et al. (1976) measured radioactivity(representing mostly VC metabolites) in different organs immediatelyafter exposure of male rats to 14C-VC (initial concentration 130mg/m3) for 5 h. Highest levels were detected in the kidney (2.13%;expressed as % of incorporated VC per g tissue) and liver (1.86%),followed by spleen (0.73%), muscle (0.32%), adipose tissue (0.22%)and brain (0.17%).
Distribution pattern changed with longer post-exposure obser-vation periods. Watanabe et al. (1976b) reported the followingpercentages of 14C activity (mostly VC metabolites) in rats per gramtissue 72 h after inhalation exposure to 26 or 2600 mg/m3 14C-labelledVC, respectively, for 6 h: liver (0.139; 0.145), kidney (0.079; 0.057),skin (0.072; 0.115); carcass (0.048; 0.049), plasma (0.051; notdetected), muscle (0.052; 0.038), lung (0.065; 0.046), fat (0.026; notdetected). There was no significant difference between low and highdose. 72 h after the exposure period most of radioactivity had beenexcreted; 13.8% (low dose), 14.5% (high dose) of total recoveredradioactivity remained in carcass and tissues (Table 25). A similardistribution pattern were presented by Watanabe et al. (1978b) usingthe same experimental design but rats exposed once or repeatedly to13 000 mg/m3. Furthermore, the authors detected no significantdifference between single and repeated exposure.
Ungváry et al. (1978) presented evidence for the permeability ofthe placenta to VC. After exposure of pregnant rats to 5500, 18 000or 33 000 mg VC/m3 for 2.5 h on day 18 of gestation, VC wasdetected in fetal (13, 23 and 31 :g/ml, respectively) and maternalblood (19, 32 and 49 :g/ml), as well as in amniotic fluid (4, 5 and 14:g/ml).
Toxicokinetic experiments on humans (self-experiments) werereported by Buchter et al. (1978). Using an open system with aconcentration of 6.5 mg VC/m3 inspired air, the concentration in the
EHC 215: Vinyl Chloride______________________________________________________
116
expired air reached a constant concentration after about 5 minexposure in subject A and 7 min in subject B, indicating the end of thedistribution phase.
6.2.3 Partition coefficients in vitro
In vitro studies using the vial equilibration method (3 hincubation, blood and tissue homogenates from male Sprague-Dawleyrats) revealed the following VC partition coefficients for male rats:blood/air 2.4; fat/blood 10.0; muscle/blood 0.4; liver/blood 0.7; andkidney/blood 0.7 (Barton et al., 1995). In similar experimentstissue/air partition coefficients were obtained for different rodentspecies (Gargas et al., 1989; Clement International Corporation,1990; Table 24). These data suggested that the concentration of VCin adipose tissue is higher than in other tissues. Furthermore, in allspecies in which both sexes were tested, partition coefficients forfat/air were greater in females than in males (Table 24).
6.3 Metabolic transformation
The main route of metabolism of VC in the liver into non-volatilecompounds after inhalative or oral uptake involves 3 steps: a) theoxidation by cytochrome P-450 to form chloroethylene oxide (CEO,also known as 2-chlorooxirane), a highly reactive, short-lived epoxidethat rapidly rearranges to form chloroacetaldehyde (CAA); b) thedetoxification of these two reactive metabolites as well as chloroaceticacid, the dehydrogenation product of CAA, through conjugation withglutathione catalysed by glutathione S-transferase; c) the modificationof the conjugation products to substituted cysteine derivatives, whichare excreted via urine. The main metabolic pathways are shown inFig. 2. At high dose levels the metabolism of VC is saturable.
The first step in VC metabolism requires microsomal mixed-function oxidases (cytochrome P-450 enzymes) together with oxygenand NADPH as cofactors. This was confirmed by studies in vitro(Barbin et al., 1975; Guengerich et al., 1979) and in vivo (Reynoldset al., 1975a,b; Guengerich & Watanabe, 1979; Bartsch et al., 1979;Guengerich et al., 1981). The major catalyst of the oxidation isCYP2E1 in humans. This has been demonstrated by in vitro systemsusing purified human CYP2E1 or by inhibition of catalytic activity in

Kinetics and Metabolism in Laboratory Animals and Humans______________________________________________________
117
Table 24. Tissue/air VC partition coefficients for rodent tissuesa
Species; strain Sex Blood/ Liver/ Muscle/ Fat/air air air air
Rat; F344 male 1.60 1.99 2.06 11.8female 1.55 2.05 2.39 21.1
Rat; CDBR male 1.79 3.0 2.18 14.6female 2.12 1.66 1.28 19.2
Rat; Wistar male 2.10 2.69 2.72 10.2female 1.62 1.48 1.06 22.3
Mouse; B6C3F1 male 2.83 n.g. n.g. n.g.female 2.56 n.g. n.g. n.g.
Mouse; CD-1 male 2.27 n.g. n.g. n.g.female 2.37 n.g. n.g. n.g.
Hamster; male 2.74 3.38 2.56 14.3 Syrian golden female 2.21 1.31 1.96 21.1
a Data from Clement International Corporation (1990); vial equilibration method(Gargas et al., 1989), blood or tissue homogenates incubated for 1–4 h untilequilibrium was achieved, as indicated by two consecutive time points withoutsignificant difference; n.g. = not given
Table 25. Percentage of 14C activity eliminated during 72 h following inhalationexposure to [14C]-vinyl chloride for 6 h in male ratsa
Exposure groups 26 mg/m3 2600 mg/m3 13 000 mg/m3
(number of animals) (4) (4) (2)
Expired as unchanged VC 1.6 12.3 54.5
Expired as CO2 12.1 12.3 8.0
Urine 68.0 56.3 27.1
Faeces 4.4 4.2 3.2
Carcass and tissues 13.8 14.5 7.3
a Expressed as percentage of the total 14C activity recovered (similar experi-mental design; Watanabe & Gehring, 1976; Watanabe et al., 1976b, 1978b)

EHC 215: Vinyl Chloride______________________________________________________
118
Fig. 2.
Fig 2. Proposed metabolic pathways for vinyl chloride (Plugge & Safe, 1977;Guengerich et al., 1979; Bolt et al., 1980; adapted from ATSDR, 1997).
a Detected in urine

Kinetics and Metabolism in Laboratory Animals and Humans______________________________________________________
119
human liver microsomes with rabbit anti-human CYP2E1. In livermicrosomes from uninduced rats, VC is activated solely by CYP2E1,at concentrations ranging from 1 to 106 ppm in the gas phase,according to Michaelis-Menten kinetics (El Ghissassi et al., 1998).The following kinetic constants were determined:
Km = 7.42 ± 0.37 :mol/litre;Vmax = 4674 ± 46 nmol.mg protein –1 min–1.
Comparison of the Vmax obtained in this study to the Vmax determinedin vivo in rats (Gehring et al., 1978; Filser & Bolt, 1979) shows thatvirtually all the metabolic activation of VC in vivo occurs in the liver.
Applying the pharmacokinetic model developed by Andersen etal. (1987) to describe the metabolism of inhaled gases and vapours,the uptake of VC by rats in vivo, as determined by Gehring et al.(1978) and by Filser & Bolt (1979), could be accurately predicted.
Using S9 extracts from human liver samples, Sabadie et al.(1980) observed a great interindividual variability in the capacity toactivate VC into mutagenic metabolites. This is in agreement with theobservation of Guengerich et al. (1991) who found that levels ofCYP2E1 varied considerably among individual humans. Sabadie etal. (1980) noted that the average activity of human samples is similarto that of rat samples.
Chloroethylene oxide (CEO) has a half-life of only 1.6 min at pH7.4 and 37 °C (Malaveille et al., 1975). It can spontaneouslyrearrange to CAA (Barbin et al., 1975) or hydrolyse to glycolaldehyde(Guengerich et al., 1979; Guengerich, 1992). The latter reaction canalso be catalysed by epoxide hydrolase (Fig. 2).
Evidence for the detoxification of reactive VC metabolitesthrough conjugation with hepatic glutathione catalysed by glutathioneS-transferase (GST) has been shown by measuring the decrease of thehepatic non-protein sulfhydryl content (primarily glutathione) and theexcretion of thiodiglycolic acid via urine in rats after inhalativeexposure to high levels (> 260 mg/m3) of VC (Watanabe & Gehring,1976; Watanabe et al., 1976c, 1978a; Jedrychowski et al., 1984).
The conjugation products S-carboxymethyl glutathione andS-formylmethyl glutathione are excreted in the urine of animals as

EHC 215: Vinyl Chloride______________________________________________________
120
substituted cysteine derivatives [N-acetyl-S-(2-hydroxyethyl)cysteine,S-carboxymethyl cysteine and thiodiglycolic acid] and the metaboliteCO2 in exhaled air (Green & Hathway, 1975, 1977; Watanabe et al.,1976a,b; Müller et al., 1976; Bolt et al., 1980). Thiodiglycolic acidhas been detected in the urine of workers occupationally exposed to0.36–18.2 mg/m3 (Müller et al., 1978).
An alternative pathway has been suggested from inhibitionstudies of VC metabolism with ethanol (Hefner et al., 1975c).Pretreatment of rats with ethanol (5 ml/kg body weight) significantlyreduced the depression of the concentration of non-protein sulfhydrylin the liver caused by exposure to 2780 mg VC/m3 for 105 min. Thisinhibition was less pronounced in rats exposed to # 260 mg/m3. It ispostulated that at low concentrations, a sequential oxidation to 2-chloroethanol, 2-chloroacetaldehyde and 2-chloroacetic acid,involving alcohol dehydrogenase, takes place. It is speculated thatethanol inhibits specific P-450 enzymes. However, this hypothesis hasnot been substantiated by further experimental data and this pathwayhas not been recognized as a direct pathway in recent physiologicallybased pharmacokinetic (PBPK) models and risk assessments based onthem (sections 6.6 and 10).
VC exposure does not result in enzyme induction but, on thecontrary, causes destruction of the cytochrome P-450 proteinresponsible for its biotransformation (Pessayre et al., 1979; Du et al.,1982). The impaired rate of oxidative metabolism associated withP-450 destruction may partly explain the phenomenon of saturationof the VC metabolism already at relatively low dosage levels and onthe other hand explain the tolerance to liver damage in experimentalanimals subjected to continuous intermittent exposure to high VCconcentrations (73 000 mg/m3, 7 h/day, 5 days/week for 6 weeks).
Enzymes metabolizing VC were shown to be saturated in rats ata concentration of 650 mg/m3 (rats exposed in a closed system; Boltet al., 1977; Filser & Bolt, 1979). In rhesus monkeys saturation ofmetabolic elimination of VC was observed at atmospheric concen-trations greater than 520 mg/m3 (closed system; Buchter et al., 1980).Saturation of metabolism occurred in rats at a single oral dose of20 mg/kg body weight by gavage (Watanabe & Gehring, 1976;Table 23). Saturation conditions were not reached in humans at aninhalation exposure to 60 mg/m3 for 6 h (Krajewski et al., 1980).

Kinetics and Metabolism in Laboratory Animals and Humans______________________________________________________
121
In closed systems, after the initial absorption of VC untilequilibrium between atmosphere and organism, the continuedabsorption is attributed to metabolism (Bolt et al., 1977). Rats exposedto VC concentrations that did not exceed the above-mentionedthreshold of saturation metabolized VC in accordance with first-orderkinetics with a half-time of 86 min. At concentrations abovesaturation, the elimination followed zero-order kinetics (Hefner et al.,1975a,c; Filser & Bolt, 1979).
Although VC is primarily metabolized in the hepatocyte(Ottenwälder & Bolt, 1980), the primary target cell forcarcinogenicity in the liver is the sinusoidal cell, as can be seen fromthe incidence of ASL in both animals and humans. Non-parenchymalcells have only 12% of the activity of hepatocytes in transforming VCinto reactive, alkylating metabolites (Ottenwälder & Bolt, 1980). VCdoes not induce DNA damage in isolated non-parenchymal liver cells,as measured by an alkaline comet assay (Kuchenmeister et al., 1996),whereas it does in isolated hepatocytes. However, the majority of theDNA adduct studies have been conducted or related to the hepatocyte.It can be postulated that the majority of reactive metabolites can leavethe intact hepatocyte to produce tumours in the sinusoidal cells (Laib& Bolt, 1980). The greater susceptibility of the sinusoidal cells to thecarcinogenic effects of VC may also result from the inability of thesinusoidal cells to repair one or more of the DNA adducts producedby VC as efficiently as the hepatocyte.
6.4 Elimination and excretion
After low doses, VC is metabolically eliminated and non-volatilemetabolites excreted mainly in the urine. At doses that saturate themetabolism, the major route of excretion is exhalation of unchangedVC. Independent of applied dose, the excretion of metabolites viafaeces is only a minor route. The metabolic clearance of VC is slowerin humans than in experimental animals, on a body weight basis.However, it is comparable in several mammalian species, includinghumans, when calculated on a body surface area basis.
6.4.1 Oral exposure
Male rats were gavaged with different doses of 14C-labelled VC,and the radioactivity excreted was determined during the following

EHC 215: Vinyl Chloride______________________________________________________
122
72 h (Green & Hathway, 1975; Watanabe & Gehring, 1976;Watanabe et al., 1976a). Results are presented in Table 23. With lowdoses radioactivity was mainly excreted as conjugated metabolites viathe urine or exhaled as 14C-labelled CO2 (section 6.3), but with dosesof 20 mg/kg body weight or more the main elimination route wasexhalation of unchanged VC (Table 23), suggesting saturatedmetabolism. A minor route of excretion at all doses tested is via thefaeces.
Measuring the elimination of radioactivity in the urine as afunction of time revealed biphasic elimination at dose levels up to100 mg/kg body weight with a half-life of approximately 4.6 h in theinitial rapid phase (first-order kinetics) (Watanabe et al., 1976a).
At low doses (1 mg/kg body weight) pulmonary elimination (asCO2) during the first 4 h was monophasic with a half-life of 58 min,but with a dose of 100 mg/kg body weight elimination of mainlyunchanged VC was biphasic with an initial rapid phase (half-life14.4 min) followed by a slow phase (half-life 41 min) (Watanabe etal., 1976a).
Most of the radioactivity excreted via urine or exhaled as themetabolite CO2 was eliminated during the first 24 h after gavaging of0.25 or 450 mg/kg body weight, whereas elimination of unchangedVC via the lung was complete within 3–4 h (Green & Hathway,1975).
Pretreatment of rats with unlabelled VC (up to 300 mg/kg bodyweight per day orally for 60 days) had no effect on the rate ofelimination of a single oral dose of 14C-VC (oral application on day 1and 60) (Green & Hathway, 1975), suggesting that VC did not induceits metabolism.
6.4.2 Inhalation exposure
Metabolic elimination of VC has been investigated in differentspecies, measuring the decline of VC in the gas phase of a closedsystem into which VC was initially injected (Buchter et al., 1978;Filser & Bolt, 1979; Buchter et al., 1980). Using VC concentrationsthat did not exceed the saturation threshold (section 6.3), thefollowing first-order metabolic clearance rates for VC (expressed in

Kinetics and Metabolism in Laboratory Animals and Humans______________________________________________________
123
litre/h per kg body weight; initial concentration in mg/m3 inparentheses) were determined: rat 11.0 (< 650), mouse 25.6 (130),gerbil 12.48 (130), rabbit 2.74 (130), rhesus monkey 3.55 (< 520),humans 2.08 (26). Because the metabolism of VC is perfusion-limited (Filser & Bolt, 1979), comparison of clearance rates should bemade on a body surface area basis rather than a body weight basis. Inthis case, these six mammalian species exhibit similar clearance rates.With exposure concentrations above the “saturation point”(> 650 mg/m3), the maximum velocity of metabolic elimination in ratswas 110 :mol/h per kg body weight (Filser & Bolt, 1979) or 3.6 mg/hper kg body weight (Barton et al., 1995).
Elimination and excretion of 14C in rats within 72 h after a 6-hexposure to 26, 2600 or 13 000 mg/m3 14C-labelled VC is shown inTable 25 (similar experimental design; Watanabe et al., 1976b,1978b; Watanabe & Gehring, 1976). The amount of expired VCincreased with the exposure concentration, whereas the relativeurinary excretion of metabolites decreased, indicating a saturation ofmetabolism. Minor decreases were seen in the proportion excreted viathe faeces or expired as CO2.
Measuring the time course of expiration in these experiments, thepattern of pulmonary elimination of unchanged VC was similar at allexposure concentrations, following first-order kinetics with half-livesof 20.4, 22.4 (Watanabe et al., 1976b) and 30 min (Watanabe et al.,1978b), respectively. After a 6-h exposure to 26 and 2600 mg/m3,elimination of the 14C-label via urine as a function of time revealed abiphasic excretion of radioactivity with estimated half-lives for thefirst (rapid) phase of 4.6 and 4.1 h (Watanabe et al., 1976b). Becauseof extremely variable excretion curves in the second phase, noattempts were made to estimate the half-lives of the slow phase, whichaccounted for less than 3% of the radioactivity excreted in the urine.Similar results were presented by Bolt et al. (1976). Rats exposed for5 h to 130 mg/m3 14C-VC excreted 70% of incorporated radioactivityduring the first 24 h after exposure in urine and less than 3% in thefollowing 3 days.
The rate of elimination of a single inhalative exposure to 14C-VCis not influenced by prior repeated exposure to the same concentration(13 000 mg/m3) of unlabelled VC 6 h/day, 5 days/week for 7 weeks(Watanabe et al., 1978b).

EHC 215: Vinyl Chloride______________________________________________________
124
In human volunteers, the mean concentration of VC in theexpired air up to 30 min after a 6-h exposure to 7.5–60 mg/m3 reachedno more than 5% of the inhaled concentration (Krajewski et al.,1980).
When male volunteers were exposed to 130 (n=6), 650 (n=4) or1300 mg/m3 (n=4) for 7.5 h, the VC concentration in expired air was2.6, 23 or 52 mg/m3, respectively, 1 h after exposure (Baretta et al.,1969).
6.5 Reaction with body components
6.5.1 Formation of DNA adducts
In vitro, both CEO and CAA can form etheno adducts withnucleic acid bases (Fig. 3; Bolt, 1986; Bartsch et al., 1994; Barbin,1998), but the former exhibits greater reactivity (Guengerich, 1992).In addition, 7-OEG has been characterized as a major reactionproduct of CEO with guanine (Scherer et al., 1981), whereas CAAdoes not yield this adduct (Oesch & Doerjer, 1982). 1,N6-Ethenoadenosine and 3,N4-ethenocytidine were characterized asreaction products of VC with ribonucleosides in the presence of amicrosomal activation system (Barbin et al., 1975; Laib & Bolt,1978). Analysis of DNA incubated in vitro with rat liver microsomes,an NADPH-regenerating system and [14C]-VC revealed the formationof 7-OEG, the major DNA adduct, and of 1,N6-etheno-2N-deoxyadenosine (,dA) and 3,N 4-etheno-2N-deoxycytidine (,dC) (Laibet al., 1981). More recently, Müller et al. (1997) quantified sixadducts in DNA treated with CEO, including 7-OEG, the fourethenobases and 5,6,7,9-tetrahydro-7-hydroxy-9-oxoimidazo[1,2-"]purine. The reactivity of CAA towards double-stranded B-DNA isvery low (Guengerich, 1992). CAA reacts with unpaired A and Cbases to yield ,A and ,C, respectively. Treatment of DNA with CAAhas also been reported to result in the formation of N2,3-,G and 1,N2-,G moieties (Oesch & Doerjer, 1982; Kusmierek & Singer, 1992;Guengerich, 1992).
The formation of ,dC and tentatively of ,dA in liver DNA fromrats exposed to VC in their drinking-water for 2 years was reported byGreen & Hathway (1978). In subsequent studies, ,A and ,C werefound in the nucleotides in hydrolysates of rat liver RNA and 7-OEGbut not ,A or ,C in DNA after exposure to [14C]-VC (Laib & Bolt,

125
Fig. 3.
Fi
g 3.
Vin
yl c
hlor
ide
reac
tive
met
abol
ites
and
nucl
eic
acid
add
ucts
form
ed fr
om th
em in
viv
o (a
dapt
ed fr
om C
irous
sel e
t al.,
100
9)

EHC 215: Vinyl Chloride______________________________________________________
126
1977, 1978; Laib et al., 1981). Similar results were found in mice(Osterman-Golkar et al., 1977). More recent studies, using analyticalmethods (HPLC and fluorescence spectrophotometry, monoclonalantibodies and negative-ion chemical ionization with massspectrometry using electrophore labelling; Fedtke et al., 1989, 1990a;Eberle et al., 1989) or experimental designs with greater sensitivity(young rats, short delay between exposure and analysis), have led toconclusive demonstration of ,dA and ,dC as DNA adducts indifferent rat organs after inhalation exposure to VC (Table 26). Theconcentration of DNA adducts was 3- to 8-fold higher in the liverthan in the lung and kidney, reflecting the higher capacity of the liverfor metabolic activation of VC (Fedtke et al., 1990b; Swenberg et al.,1992). Both etheno bases (,C and ,A) accumulated in rat liver DNAduring intermittent exposure to VC (1300 mg/m3). Only ,Caccumulated in rat lung and kidney, ,A appearing to accumulateprincipally in the target organ, the liver (Guichard et al., 1996).Subsequently, analysis of further tissues showed increased levels of,A in the testis, but not in the brain and spleen of rats exposedintermittently for 8 weeks; levels of ,C increased in the testis andspleen but not in the brain (Barbin, in press).
The rate of reaction of CAA with nucleic bases is slower thanwith CEO (Zajdela et al., 1980). In in vitro studies, CEO but not CAAwas shown to be the main entity giving rise to etheno adducts(Guengerich, 1992). Furthermore, as discussed in section 7.8, CEObut not CAA show similar toxicity/mutagenic profiles to VC in ametabolically competent human B-lymphoblastoid line (Chiang et al.,1997). These findings seem to corroborate the original suggestion thatit is CEO rather than CAA that is the main source of etheno adducts(Van Duuren, 1975; Guengerich et al., 1981; Gwinner et al., 1983).
In pre-weanling rats exposed to VC, 7-OEG had a half-life of~62 h, while the etheno adducts are highly persistent with a half-lifefor ,G of ~30 days (Swenberg et al., 1992). Studies on the persistenceof ,A and ,C in the liver of adult rats have shown that there is nosignificant decrease in adduct levels 2 months after termination of VCexposure (Guichard et al., 1996). This is in contrast with the knownrepair of etheno adducts in vitro (Dosanjh et al., 1994). The rat andhuman 3-methyladenine DNA glycosylases can excise ,A from DNA(Saparbaev et al., 1995). ,C can be released by the human mismatch-specific thymine-DNA glycosylase (Saparbaev & Laval, 1998).

Kinetics and Metabolism in Laboratory Animals and Humans______________________________________________________
127
DNA adduct formation seems to be age-dependent; about 5- to6-fold more DNA adducts were determined in young animalscompared to adults (Laib et al., 1989). Similar results were presentedby Fedtke et al. (1990b) who exposed adult and 10-day-old Sprague-Dawley rats (Table 26). Ciroussel et al. (1990) exposed 7-day-old and13-week-old rats (strain BD IV) for 2 weeks to VC and detected 6times more DNA adducts in the liver of young rats compared to adults(Table 26).
It should be noted that background levels of etheno bases havebeen found in various tissues in unexposed rodents (Guichard et al.,1996; Fernando et al., 1996; Barbin, in press) and humans (Nair etal., 1995, 1997). Lipid peroxidation products have been shown toreact with nucleic acid bases yielding etheno adducts (El Ghissassi etal., 1995a; Chung et al., 1996; Bartsch et al., 1997). The role of lipidperoxidation products in the endogenous formation of backgroundlevels of etheno bases is further supported by the finding of elevatedlevels of ,dA and ,dC in the liver from Long Evans Cinnamon rats(Nair et al., 1996) and from patients with Wilson’s disease or withprimary haemochromatosis (Nair et al., 1998).
Etheno adducts are also formed via substituted oxiranes formedfrom other vinyl monomers, e.g., vinyl bromide (Bolt, 1994) and vinyland ethyl carbamate (urethane) (Park et al., 1993).
6.5.2 Alkylation of proteins
Bolt et al. (1980) studied covalent binding of radiolabel toproteins in rats exposed to 14C-labelled VC. The target of alkylationis the free sulfhydryl group of proteins. The liver always showed thehighest binding rate. The fraction of VC that was irreversibly boundto proteins was independent of the VC dose applied, indicating nothreshold effect even at low doses. In vivo studies on rats (Guengerich& Watanabe, 1979) have shown that the amount of total VCmetabolites bound in the liver to proteins is twice that bound to DNA,RNA and lipids. Osterman-Golkar et al. (1977) reported thealkylation of cysteine (S-(2-hydroxyethyl)cysteine) and histidine ((N-1-and N-3) hydroxyethylhistidine) of the globin precipitate ofhaemoglobin and small amounts of the alkylated histidines in proteinsfrom testis in mice exposed to 1,2-14C-vinyl chloride.

Table 26. Detection of DNA adducts in vivo after VC inhalation in ratsa
Strain; sex; age Treatment; Investigated Alkylated bases in DNA (max. con- Comments Referencespost-exposure organs centration in pmol/:mol unmodifiedsurvival time base in specified organs)
BD IV; male & 1300 mg/m3, 7 h/day, liver, lung, ,dA (0.131, 0.105, 0.06, b.d.l.); higher sensitivity of young Ciroussel female; 7 days 7 days/week for brain, kidney ,dC (0.492, 0.246, 0.216, b.d.l.) rats compared with adults et al. (1990)
2 weeks; none (see section 7.7.4)
BD IV; male; 1300 mg/m3, 7 h/day, liver ,dA (0.019); ,dC (0.080) Ciroussel 13 weeks 7 days/week for et al. (1990)
2 weeks; none
S.-D.; male & 1560 mg/m3, 4 h/day liver, lung, 7-OEG (162, 20, 29, <10, <10); higher sensitivity of young Fedtke et female; 10 days for 5 days; kidney, N2,3-,G (1.81, 0.21, 0.31, <0.12, rats compared with adults al. (1990b)
0, 3, 7, 14 days brain, spleen <0.12); measured immediately a.e. (see section 7.7.4)concerning liver adducts
S.-D.; female; 1560 mg/m3, 4 h/day liver, lung, 7-OEG (43, 20, n.g.); N2,3-,G DNA adduct formation Fedtke et adult for 5 days; kidney (0.47, 0.27, <0.12); measured max. at the end of al. (1990b)
0, 3, 7, 14 days immediately a.e. exposure; most DNAadducts in the liver
S.-D.; male & 5200 mg/m3, 7 h/day liver, lung ,dA (0.05, 0.13) ,dC (0.16, 0.33) more DNA adducts in the Eberle et female; 11 days on days 1–9 and 24 h lung than in the liver al. (1989)
on day 10; none

Table 26 (contd).
S.-D.; male & 1560 mg/m3, 4 h/day liver, lung, 7-OEG (162, 20, 29); N2,3-,G (1.81, DNA adduct formation Swenberg female; 10 days for 5 days; kidney 0.21, 0.31); ,dC (0.98, 0.30, 0.29); max. at the end of et al. (1992)
0, 3, 7, 14 days ,dA (0.21, 0.065, 0.04); measured exposure; most DNAimmediately a.e. adducts in the liver
S.-D.; male; 1300 mg/m3, 4 h/day, liver, lung, ,dA (liver: background 0.0004, a.e. exposure-time-dependent Guichard 6 weeks 5 days/week for 1, kidney, up to 0.045; background lung and increase of adducts in et al. (1996)
2, 4, 8 weeks; none lymphocytes kidney up to 0.033, no liver (ca. 100-fold); noincrease a.e.); (lymphocytes) or slight,dC (liver: background 0.0007, a.e. increase (ca. 2-fold inup to 0.08; kidney: background kidney, ca. 5-fold in lung)0.086, a.e. up to 0.16; lung: of adducts in other organsbackground 0.072, a.e. up to 0.38) but higher background
levels8 weeks brain, testis, ,dA (increase in testis, not in Barbin
spleen brain or spleen) (in press),dC (increase in testis andspleen, but not in brain)
a a.e. = after exposure; b.d.l. = below detection limit; n.g. = not given; S.-D. = Sprague-Dawley; ,dA = 1,N6-ethenodeoxyadenosine;,dC = 3,N4-ethenodeoxycytidine; 7-OEG = 7-(2-oxoethyl)guanine; ,G = ethenoguanine

EHC 215: Vinyl Chloride______________________________________________________
130
In vitro studies have shown that incubation of rat livermicrosomes with 14C-labelled VC results in NADPH-dependentmicrosomal uptake and covalent binding to microsomal proteins(Kappus et al., 1975, 1976; Baker & Ronnenberg, 1993). It has beensuggested that VC metabolites might be involved in the destruction ofthe haem moiety of cytochrome P-450 in the liver (Guengerich &Strickland, 1977).
6.6 Modelling of pharmacokinetic data for vinyl chloride
There has been progress in recent years in the development ofphysiologically based toxicokinetic (PBTK) models describing thetoxicokinetics of chemicals. These theoretical models permitpredictions of the dose of active metabolites reaching target tissues indifferent species, including humans, and, therefore, have improvedthe toxicokinetic extrapolation in cancer risk assessments. PBTKmodels have also been used as a tool to examine the behaviour of VCin mammalian systems. The description of PBTK models for VC ispresented in Annex 2.