2 february 2006 global equity strategy - kellogg school of ... · 2 february 2006 global equity...
TRANSCRIPT
DrKW Macro research Global Equity | Strategy
2 February 2006
Global Equity Strategy Behaving badly
Online research: www.drkwresearch.com Bloomberg: DRKW<GO>
Please refer to the Disclosure Appendix for all relevant disclosures and our disclaimer. In respect of any compendium report covering six or morecompanies, all relevant disclosures are available on our website www.drkwresearch.com/disclosures or by contacting the DrKW Research Department at the address below. Dresdner Kleinwort Wasserstein Securities Limited, Authorised and regulated by the Financial Services Authority and a Member Firm of the London Stock Exchange PO Box 560, 20 Fenchurch Street, London EC3P 3DB. Telephone: +44 20 7623 8000 Telex: 916486 Registered in England No. 1767419 Registered Office: 20 Fenchurch Street, London EC3P 3DB. A Member of the Dresdner Bank Group.
James Montier +44 (0)20 7475 6821 [email protected]
Global Investment Strategy Research Analysts Global Asset Allocation Albert Edwards +44 (0)20 7475 2429 [email protected]
Global Equity Strategy James Montier +44 (0)20 7475 6821 [email protected]
Global Sector Strategy Philip Isherwood +44 (0)20 7475 2435 [email protected]
European & UK Strategy Karen Olney, CFA +44 (0)20 7475 2651 [email protected]
None of us are immune to behavioural biases. Those who have attended my teach-ins on the subject have had a short test inflicted upon them. This note provides both a copy of the test (for you to try) and an analysis of the results from our sample of 300 fund managers. I will say no more to avoid influencing your answers. But my faith in behavioural finance is stronger than ever!
Global Equity Strategy 2 February 2006
2
Behaving badly Before you go any further, if you haven’t already suffered at my hands, have a go at the 17 questions below. Spend no more than 10 minutes on them.
The test 1) Please write down the last four digits of your telephone number:
2) Is the number of physicians in London higher or lower than this number?
3) What is your best guess as to the number of physicians in London?
4) A bat and a ball together cost $1.10. The bat costs $1.00 more than the ball. How much does the ball cost?
5) A health survey was conducted in a sample of adult males in New Jersey, of all ages and occupations. Please give your best estimates of the following values:
What percentage of the men surveyed have had one or more heart attacks?
What percentage of the men surveyed are both over 55 and have had one or more heart attacks?
6) Are you above average at your job?
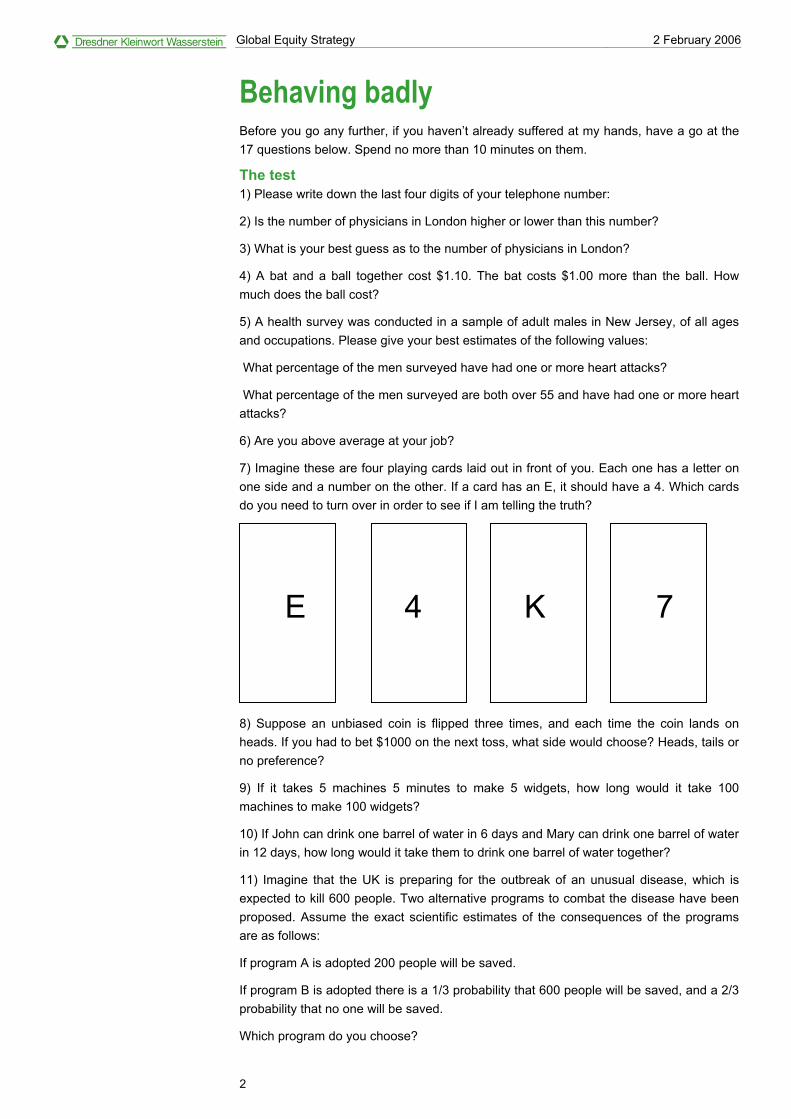
7) Imagine these are four playing cards laid out in front of you. Each one has a letter on one side and a number on the other. If a card has an E, it should have a 4. Which cards do you need to turn over in order to see if I am telling the truth?
8) Suppose an unbiased coin is flipped three times, and each time the coin lands on heads. If you had to bet $1000 on the next toss, what side would choose? Heads, tails or no preference?
9) If it takes 5 machines 5 minutes to make 5 widgets, how long would it take 100 machines to make 100 widgets?
10) If John can drink one barrel of water in 6 days and Mary can drink one barrel of water in 12 days, how long would it take them to drink one barrel of water together?
11) Imagine that the UK is preparing for the outbreak of an unusual disease, which is expected to kill 600 people. Two alternative programs to combat the disease have been proposed. Assume the exact scientific estimates of the consequences of the programs are as follows:
If program A is adopted 200 people will be saved.
If program B is adopted there is a 1/3 probability that 600 people will be saved, and a 2/3 probability that no one will be saved.
Which program do you choose?
E 4 K 7
Global Equity Strategy 2 February 2006
3
12) You are offered the following bet. On the toss of a fair coin, if you lose you must pay £100, what is the minimum amount that you need to win in order to make this bet attractive to you?
13) In a lake, there is a patch of lily pads. Everyday, the patch doubles in size. If it takes 48 days for the patch to cover the entire lake, how long would it take for the patch to cover half the lake?
14) The same disease from question 11 is back. Only this time the two programs now have the following payoffs:
If program C is adopted 400 people will die.
If program D is adopted there is a 1/3 probability that nobody will die, and a 2/3 probability that 600 people will die.
Which program do you support?
15) A student at a university has a Grade Point Average (GPA) of 3.8 in her first semester. The average GPA at the university is 3.1. What will be her GPA percentile when she graduates as a senior? (The better she does the higher the percentile...i.e. 100 would be the top people in the year).
16) You are on a game show. You are offered a choice of one of three doors. Behind two of the doors there is a goat. Behind one the doors there is a car. Upon you announcing which door you chose, the host of the show opens one of the two doors not selected by you, and reveals a goat. After he has done this, he offers you the opportunity to switch your choice. What should you stick or switch?
17) You are now going to play a game against the others sitting in this room. The game is simply this. Pick a number between 0 and 100. The winner of the game will be the person who guesses the number closest to two thirds of the average number picked. Your guess is:
The results Nearly 300 professional fund managers have submitted themselves to the unpleasant task of trying to answer these questions. My victims have come from all areas of the globe. I’ve had the opportunity to administer this test to investors from the UK, US, Asia and Europe. Interestingly, the results I’ve found don’t show any geographic distinguishing features; Americans were no more likely to be over-optimistic than the Brits, for instance. I have also been able to test managers at both large and small institutions, and across a variety of asset classes and investment styles. However, there were few discernable differences across different groups. So I will aggregate the answers to provide an overview of the most common biases displayed by professional fund managers.
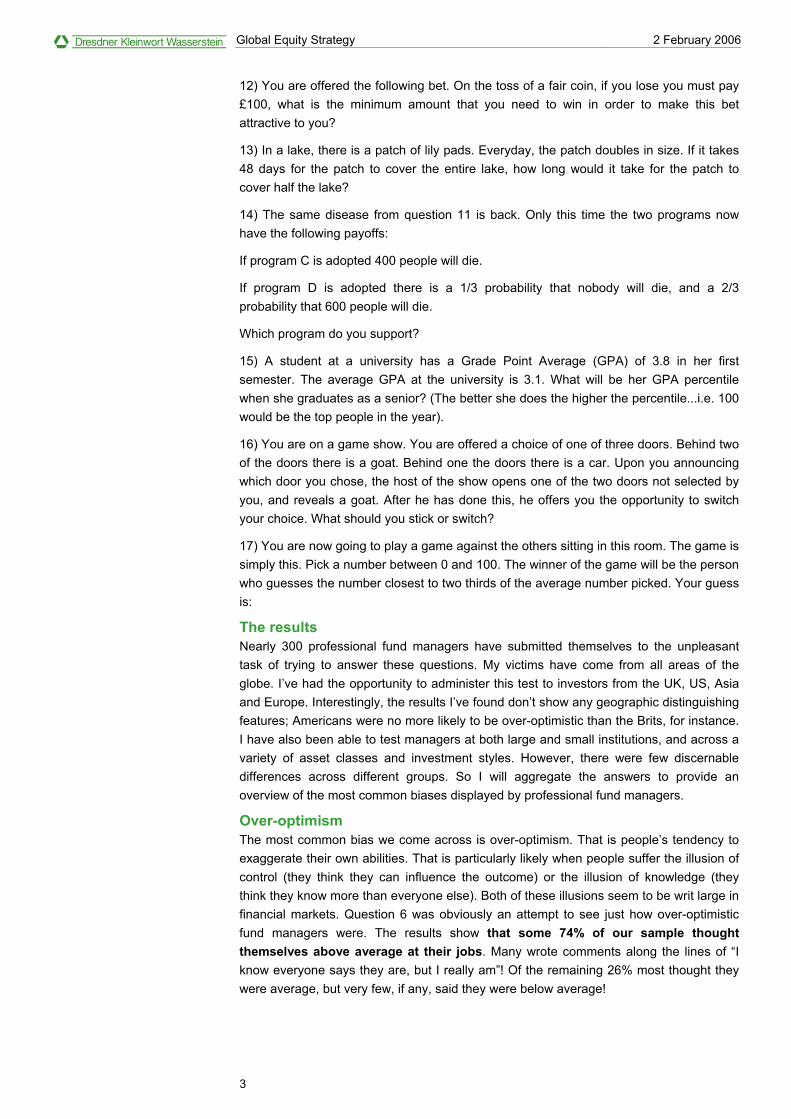
Over-optimism The most common bias we come across is over-optimism. That is people’s tendency to exaggerate their own abilities. That is particularly likely when people suffer the illusion of control (they think they can influence the outcome) or the illusion of knowledge (they think they know more than everyone else). Both of these illusions seem to be writ large in financial markets. Question 6 was obviously an attempt to see just how over-optimistic fund managers were. The results show that some 74% of our sample thought themselves above average at their jobs. Many wrote comments along the lines of “I know everyone says they are, but I really am”! Of the remaining 26% most thought they were average, but very few, if any, said they were below average!
Global Equity Strategy 2 February 2006
4
When presenting on behavioural finance I regularly ask the audience whether they are above average drivers. However, the best response rate comes from the question as to whether or not people are above average lovers. You can always count on one male member of the audience putting up both arms and jumping up and down. Indeed, so far I have found only one person who thinks he is a below average lover!
The illusion of control: the % of fund managers who believe they are...
0
10
20
30
40
50
60
70
80
Above average Equal to or Below average Source: DrKW Macro research
Confirmatory bias An amazing 95% of those who took the test failed one question. It was question 7, the four cards (E, 4, K, and 7) with each card having a number on one side and a letter on the other. You are told if the card has an E it should have a four on the reverse, so which card or cards do you need to turn over to see if you were told the truth or not?
The two most common answers are E and 4. However, the correct answer is that you need to turn over the E and 7. The E is pretty obvious, since if you turn it over and there isn’t a 4 on the reverse it is pretty obvious you were being told a lie. If you turn the 7 over and it has an E on the back you have also proved you were lied to. However, 4 can’t tell you anything. The rubric for the question states that an E should have a 4, not that a 4 should have an E. So turning the 4 over can’t tell you anything at all.
The habit of turning the 4 over is an example of confirmatory bias – the tendency to look for information that agrees with us. When Karl Popper wrote his philosophy of science he argued that the only way of testing a hypothesis was to form the view and then spend the rest of the day looking for the evidence that proves you to be wrong. But that isn’t the way we work, instead we form our views and then spend all the rest of the day finding all the information that agrees with our view.
So instead of having meetings with those who agree with us, we should actually sit down with those who disagree with us most. Not so we change our minds because the odds on changing a mind through straight conversation are essentially zero, but rather so we are aware of the opposite point of view. If we can’t identify the logical flaw in their argument then we shouldn’t be so sure about out own view at all.
Representativeness One of the other common heuristics (rules of thumb) is judging things by how they appear rather than how statistically likely they are. The classic example comes from the seminal paper by Tversky and Kahneman1. It concerns Linda, a 31 year old who is
1 Tversky and Kahneman (1983) Extension versus intuitive reasoning: the conjunction fallacy in probability judgement, Psychological Review, 90
Global Equity Strategy 2 February 2006
5
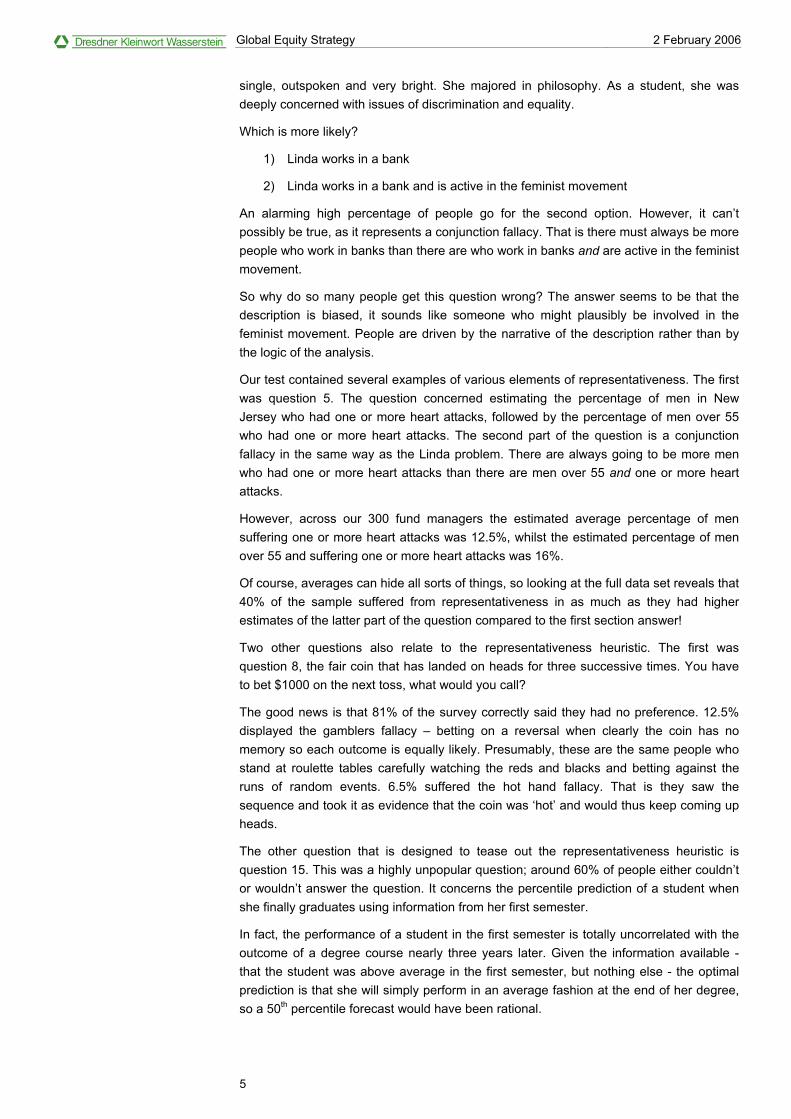
single, outspoken and very bright. She majored in philosophy. As a student, she was deeply concerned with issues of discrimination and equality.
Which is more likely?
1) Linda works in a bank
2) Linda works in a bank and is active in the feminist movement
An alarming high percentage of people go for the second option. However, it can’t possibly be true, as it represents a conjunction fallacy. That is there must always be more people who work in banks than there are who work in banks and are active in the feminist movement.
So why do so many people get this question wrong? The answer seems to be that the description is biased, it sounds like someone who might plausibly be involved in the feminist movement. People are driven by the narrative of the description rather than by the logic of the analysis.
Our test contained several examples of various elements of representativeness. The first was question 5. The question concerned estimating the percentage of men in New Jersey who had one or more heart attacks, followed by the percentage of men over 55 who had one or more heart attacks. The second part of the question is a conjunction fallacy in the same way as the Linda problem. There are always going to be more men who had one or more heart attacks than there are men over 55 and one or more heart attacks.
However, across our 300 fund managers the estimated average percentage of men suffering one or more heart attacks was 12.5%, whilst the estimated percentage of men over 55 and suffering one or more heart attacks was 16%.
Of course, averages can hide all sorts of things, so looking at the full data set reveals that 40% of the sample suffered from representativeness in as much as they had higher estimates of the latter part of the question compared to the first section answer!
Two other questions also relate to the representativeness heuristic. The first was question 8, the fair coin that has landed on heads for three successive times. You have to bet $1000 on the next toss, what would you call?
The good news is that 81% of the survey correctly said they had no preference. 12.5% displayed the gamblers fallacy – betting on a reversal when clearly the coin has no memory so each outcome is equally likely. Presumably, these are the same people who stand at roulette tables carefully watching the reds and blacks and betting against the runs of random events. 6.5% suffered the hot hand fallacy. That is they saw the sequence and took it as evidence that the coin was ‘hot’ and would thus keep coming up heads.
The other question that is designed to tease out the representativeness heuristic is question 15. This was a highly unpopular question; around 60% of people either couldn’t or wouldn’t answer the question. It concerns the percentile prediction of a student when she finally graduates using information from her first semester.
In fact, the performance of a student in the first semester is totally uncorrelated with the outcome of a degree course nearly three years later. Given the information available - that the student was above average in the first semester, but nothing else - the optimal prediction is that she will simply perform in an average fashion at the end of her degree, so a 50th percentile forecast would have been rational.
Global Equity Strategy 2 February 2006
6
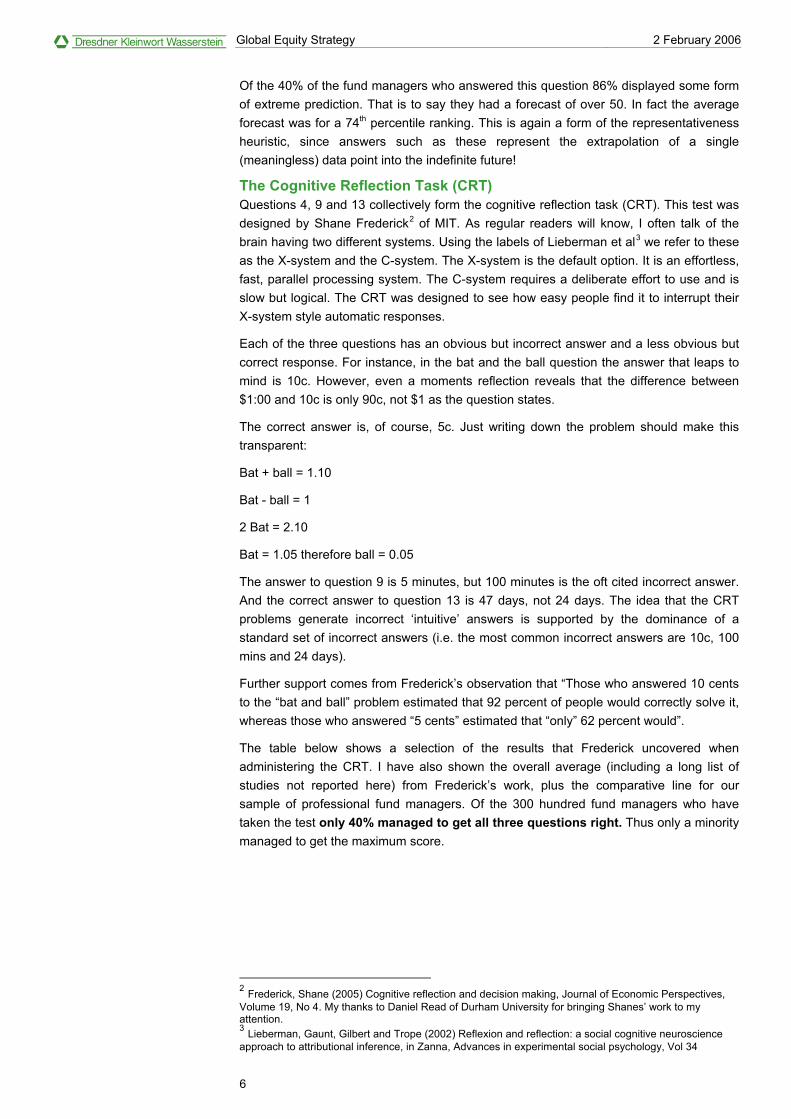
Of the 40% of the fund managers who answered this question 86% displayed some form of extreme prediction. That is to say they had a forecast of over 50. In fact the average forecast was for a 74th percentile ranking. This is again a form of the representativeness heuristic, since answers such as these represent the extrapolation of a single (meaningless) data point into the indefinite future!
The Cognitive Reflection Task (CRT) Questions 4, 9 and 13 collectively form the cognitive reflection task (CRT). This test was designed by Shane Frederick2 of MIT. As regular readers will know, I often talk of the brain having two different systems. Using the labels of Lieberman et al3 we refer to these as the X-system and the C-system. The X-system is the default option. It is an effortless, fast, parallel processing system. The C-system requires a deliberate effort to use and is slow but logical. The CRT was designed to see how easy people find it to interrupt their X-system style automatic responses.
Each of the three questions has an obvious but incorrect answer and a less obvious but correct response. For instance, in the bat and the ball question the answer that leaps to mind is 10c. However, even a moments reflection reveals that the difference between $1:00 and 10c is only 90c, not $1 as the question states.
The correct answer is, of course, 5c. Just writing down the problem should make this transparent:
Bat + ball = 1.10
Bat - ball = 1
2 Bat = 2.10
Bat = 1.05 therefore ball = 0.05
The answer to question 9 is 5 minutes, but 100 minutes is the oft cited incorrect answer. And the correct answer to question 13 is 47 days, not 24 days. The idea that the CRT problems generate incorrect ‘intuitive’ answers is supported by the dominance of a standard set of incorrect answers (i.e. the most common incorrect answers are 10c, 100 mins and 24 days).
Further support comes from Frederick’s observation that “Those who answered 10 cents to the “bat and ball” problem estimated that 92 percent of people would correctly solve it, whereas those who answered “5 cents” estimated that “only” 62 percent would”.
The table below shows a selection of the results that Frederick uncovered when administering the CRT. I have also shown the overall average (including a long list of studies not reported here) from Frederick’s work, plus the comparative line for our sample of professional fund managers. Of the 300 hundred fund managers who have taken the test only 40% managed to get all three questions right. Thus only a minority managed to get the maximum score.
2 Frederick, Shane (2005) Cognitive reflection and decision making, Journal of Economic Perspectives, Volume 19, No 4. My thanks to Daniel Read of Durham University for bringing Shanes’ work to my attention. 3 Lieberman, Gaunt, Gilbert and Trope (2002) Reflexion and reflection: a social cognitive neuroscience approach to attributional inference, in Zanna, Advances in experimental social psychology, Vol 34

Global Equity Strategy 2 February 2006
7
CRT scores Location/institution Mean CRT score 0 (%) 1 (%) 2 (%) 3 (%)
MIT 2.18 7 16 30 48Princeton 1.63 18 27 28 26Boston fireworks display 1.53 24 24 26 26Carnegie Mellon University 1.51 25 25 25 25Harvard University 1.43 20 37 24 20Overall 1.24 33 28 23 17Professional fund managers 1.99 10 21 29 40
Source: Frederick (2005), and DrKW Macro research
This performance puts professional fund managers above Princeton students, but below the best performing group – the MIT students. 10% of our sample didn’t manage to get any of the CRT questions right. In terms of the individual questions 58% got question 4 correct, 68% correctly answered question 9 and 74% managed to figure out question 14.
Frederick finds that the number of the CRT questions passed is highly correlated with several behavioural traits. Specifically he finds that those with a high CRT score are more patient. For example consider the following choice: you can either have $3400 this month or $3800 next month, which do you choose?
Of those who scored zero on the CRT, 65% went for the near term lower payout (which implies an annual discount rate of 280%!). In contrast, of those with the highest CRT score, 60% went for the further out higher payout.
A similar finding resulted from asking people how much they would be willing to pay for overnight shipping of a chosen book. Those with a zero CRT score were willing to pay an average $4.54, whilst those with the maximum score were willing to pay $2.18.
Frederick also found that the CRT was positively correlated with people’s attitudes to risk. The table below shows the results when people were presented with various gambles. When the gamble was framed in terms of gains, those with a high CRT score were far more likely to select the riskier option. However, when framed in terms of losses, the high CRT group were markedly less loss averse and selected to take the certain loss rather than gamble.
Risk attitudes and the CRT Percentage choosing riskier option
Gamble Low CRT Score High CRT Score
$100 for sure or a 75% chance of $250 19 38Lose $100 for sure or a 75% chance to lose $250 54 31$100 for sure or a 3% chance of $7000 8 21Lose $100 for sure or a 3% chance to lose $7000 63 28
Source: Frederick (2005)
In many of the behaviour patterns we observe there is a marked difference between the performance of those with high and low scores on the CRT. So in the sections below I will show the average/overall results and then show the results obtained for the various CRT groups.
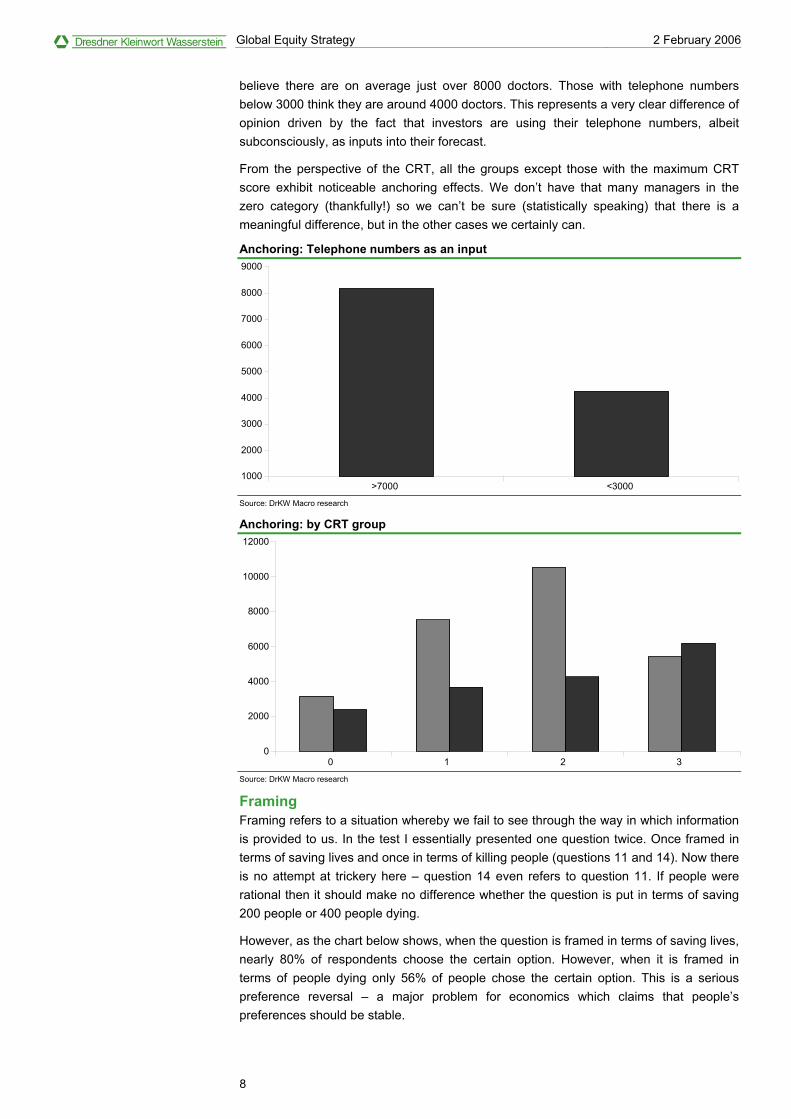
Anchoring The very first set of questions were designed to see if fund managers displayed any tendency towards anchoring. Remember that anchoring is our tendency to grab hold of irrelevant and often subliminal inputs in the face of uncertainty. The idea behind the question is to see if people use their phone numbers as an input when trying to estimate the number of Doctors in London.
Of course, if people were rational then there would be no difference between those who happened to have high telephone numbers and those with low telephone numbers. Unfortunately, as the chart below shows, those with telephone numbers above 7000
Global Equity Strategy 2 February 2006
8
believe there are on average just over 8000 doctors. Those with telephone numbers below 3000 think they are around 4000 doctors. This represents a very clear difference of opinion driven by the fact that investors are using their telephone numbers, albeit subconsciously, as inputs into their forecast.
From the perspective of the CRT, all the groups except those with the maximum CRT score exhibit noticeable anchoring effects. We don’t have that many managers in the zero category (thankfully!) so we can’t be sure (statistically speaking) that there is a meaningful difference, but in the other cases we certainly can.
Anchoring: Telephone numbers as an input
1000
2000
3000
4000
5000
6000
7000
8000
9000
>7000 <3000 Source: DrKW Macro research
Anchoring: by CRT group
0
2000
4000
6000
8000
10000
12000
0 1 2 3 Source: DrKW Macro research
Framing Framing refers to a situation whereby we fail to see through the way in which information is provided to us. In the test I essentially presented one question twice. Once framed in terms of saving lives and once in terms of killing people (questions 11 and 14). Now there is no attempt at trickery here – question 14 even refers to question 11. If people were rational then it should make no difference whether the question is put in terms of saving 200 people or 400 people dying.
However, as the chart below shows, when the question is framed in terms of saving lives, nearly 80% of respondents choose the certain option. However, when it is framed in terms of people dying only 56% of people chose the certain option. This is a serious preference reversal – a major problem for economics which claims that people’s preferences should be stable.

Global Equity Strategy 2 February 2006
9
Equally as worrying from our perspective 20% of the population were indifferent between options a and b or options c and d. This shows an alarming lack of understanding about risk. Option A results in 200 lives saved for sure, whereas option B only has an expected value of 200 lives saved. A certain value should always be preferred to an exactly equal expected payoff! After all it is only expected whereas the certain value is guaranteed. The indifference expressed means that the respondents fail to take into account the risk involved. This lack of understanding of risk is slightly unsettling given our industry is meant to be vaguely aware of the concept!
Framing: clear evidence of a preference reversal (%)
0
10
20
30
40
50
60
70
80
90
11 14
Certain
Risky
Source: DrKW Macro research
This represents a large preference reversal with 22% of people appearing to change their minds between the two presentations of the problem – a far cry from rationality.
The chart below shows the percentage of participants showing a preference reversal sorted into CRT groups. The scale of preference reversals is monotonically declining as the success at the CRT increases. So nearly 40% of those who didn’t get any of the CRT questions correct exhibited a preference switch. This drops to 16.5% by the time we work our way up to the group with the highest CRT score.
Framing effects drop as CRT score rises (%)
10
15
20
25
30
35
40
0 1 2 3 Source: DrKW Macro research
Loss aversion Loss aversion refers to our tendency to dislike losses far more than we like gains. Question 12 represents a quick and easy way of measuring the scale of loss aversion. On the toss of a fair coin, if you lose you have to pay me £100. What is the minimum you need to win to make that bet attractive?
Global Equity Strategy 2 February 2006
10
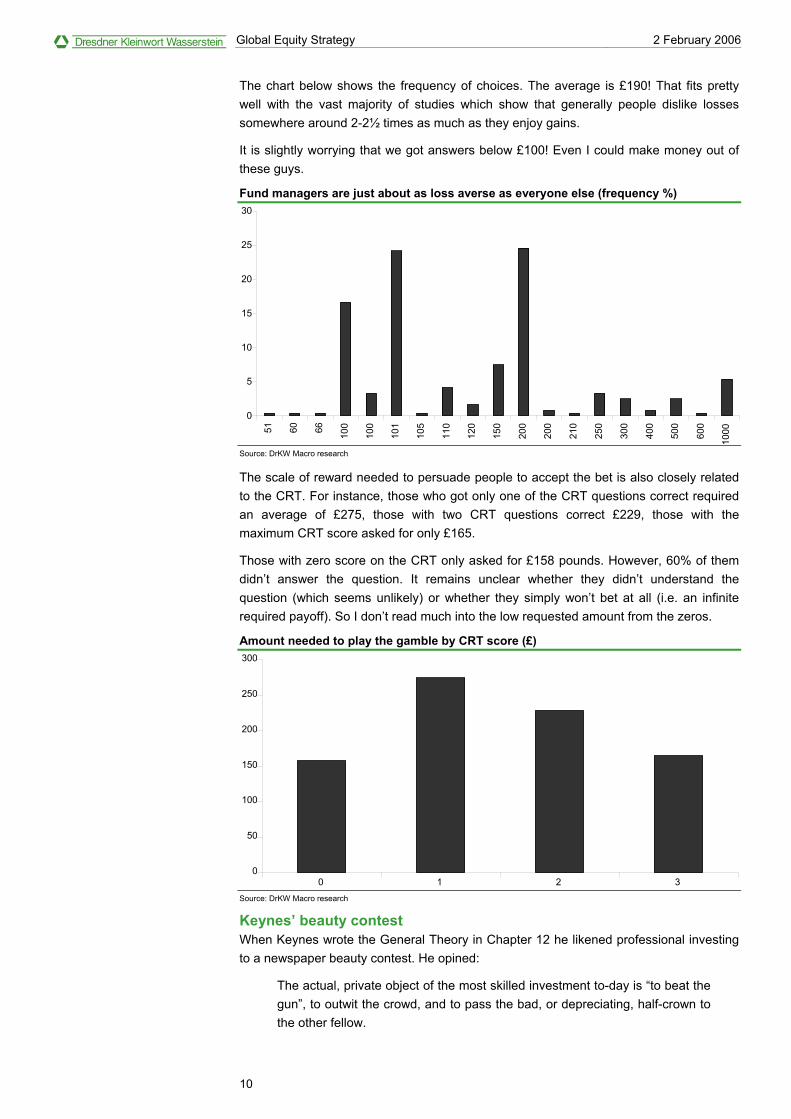
The chart below shows the frequency of choices. The average is £190! That fits pretty well with the vast majority of studies which show that generally people dislike losses somewhere around 2-2½ times as much as they enjoy gains.
It is slightly worrying that we got answers below £100! Even I could make money out of these guys.
Fund managers are just about as loss averse as everyone else (frequency %)
0
5
10
15
20
25
30
51 60 66 100
100
101
105
110
120
150
200
200
210
250
300
400
500
600
1000
Source: DrKW Macro research
The scale of reward needed to persuade people to accept the bet is also closely related to the CRT. For instance, those who got only one of the CRT questions correct required an average of £275, those with two CRT questions correct £229, those with the maximum CRT score asked for only £165.
Those with zero score on the CRT only asked for £158 pounds. However, 60% of them didn’t answer the question. It remains unclear whether they didn’t understand the question (which seems unlikely) or whether they simply won’t bet at all (i.e. an infinite required payoff). So I don’t read much into the low requested amount from the zeros.
Amount needed to play the gamble by CRT score (£)
0
50
100
150
200
250
300
0 1 2 3 Source: DrKW Macro research
Keynes’ beauty contest When Keynes wrote the General Theory in Chapter 12 he likened professional investing to a newspaper beauty contest. He opined:
The actual, private object of the most skilled investment to-day is “to beat the gun”, to outwit the crowd, and to pass the bad, or depreciating, half-crown to the other fellow.

Global Equity Strategy 2 February 2006
11
This battle of wits to anticipate the basis of conventional valuation a few months hence, rather than the prospective yield of an investment over a long term of years, does not even require gulls amongst the public to feed the maws of the professional; — it can be played by professionals amongst themselves. Nor is it necessary that anyone should keep his simple faith in the conventional basis of valuation having any genuine long-term validity. For it is, so to speak, a game of Snap, of Old Maid, of Musical Chairs — a pastime in which he is victor who says Snap neither too soon nor too late, who passes the Old Maid to his neighbour before the game is over, who secures a chair for himself when the music stops. These games can be played with zest and enjoyment, though all the players know that it is the Old Maid which is circulating, or that when the music stops some of the players will find themselves unseated.
Or, to change the metaphor slightly, professional investment may be likened to those newspaper competitions in which the competitors have to pick out the six prettiest faces from a hundred photographs, the prize being awarded to the competitor whose choice most nearly corresponds to the average preferences of the competitors as a whole; so that each competitor has to pick, not those faces which he himself finds prettiest, but those which he thinks likeliest to catch the fancy of the other competitors, all of whom are looking at the problem from the same point of view. It is not a case of choosing those which, to the best of one’s judgment, are really the prettiest, nor even those which average opinion genuinely thinks the prettiest. We have reached the third degree where we devote our intelligences to anticipating what average opinion expects the average opinion to be. And there are some, I believe, who practise the fourth, fifth and higher degrees.
John Maynard Keynes, General Theory of Employment, Interest and Money (1936) p155-156
I have played this game before. Indeed for an in-depth discussion on the subject see Global Equity Strategy, 17 February 2004. Question 17 represents a mathematical version of the game. The aim of the task is to pick a number between 0 and 100, the winner being the person who picks the number closest to 2/3rds of the average number picked.
The game itself should be a simple one under the standard assumptions of economics. i.e. rationality and common knowledge. Since all players want to choose 2/3rds of the average, there is only one number that satisfies the equation x = 2/3*x, zero. So the only equilibrium4 answer to this question is zero (as many of you pointed out).
The game can be solved by a process known as “iterated dominance”. A dominated strategy is one that yields a lower payoff than another, regardless of what other players are doing. For example, choosing a number greater than 67 is a dominated strategy because the highest possible solution to the game is 67 (i.e. if everyone else picks the maximum number 100). However, if no-one violates dominance by choosing a number above 67, then the highest outcome is 2/3rds of 67 and so on. Deleting dominated strategies in this fashion will eventually lead you to zero5.
Of course, this only works under the assumption that everyone you are playing against is rational, and they know that you are rational as well. As soon as we start to see that at
4 Technically, zero is the only fixed point Nash equilibrium 5 This process is also known as backward induction
Global Equity Strategy 2 February 2006
12
least some of the market is not fully rational then the problem becomes more and more complex.
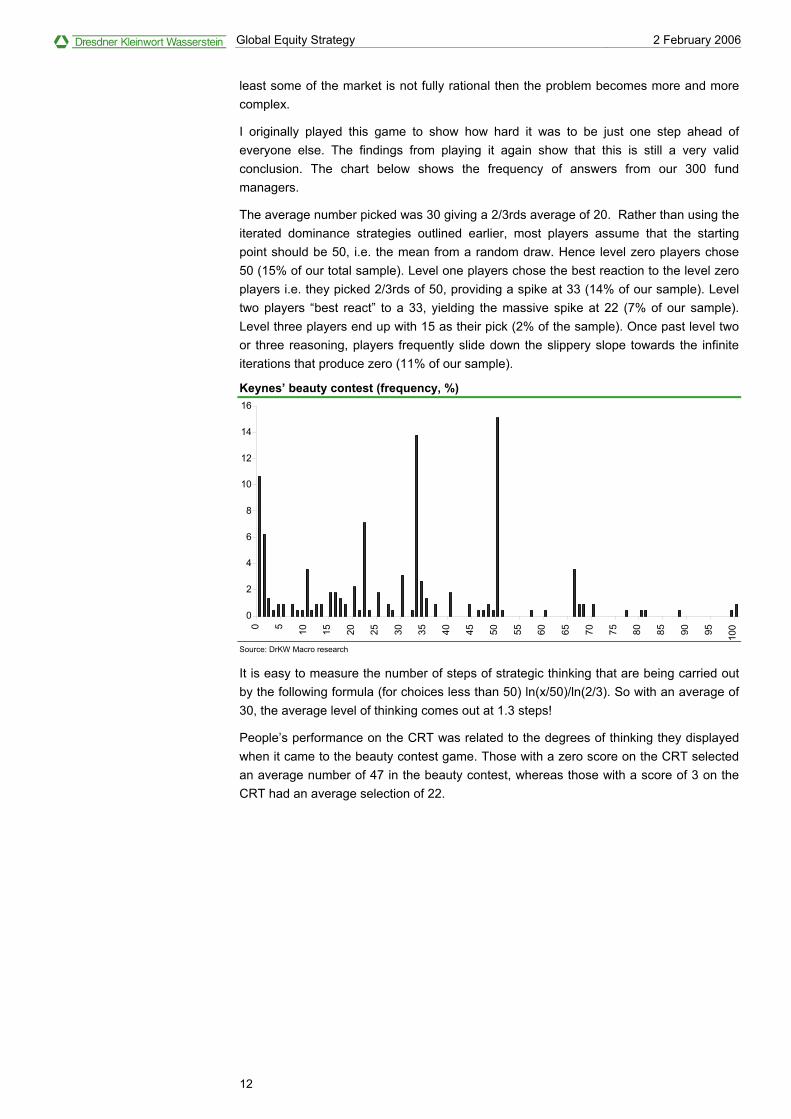
I originally played this game to show how hard it was to be just one step ahead of everyone else. The findings from playing it again show that this is still a very valid conclusion. The chart below shows the frequency of answers from our 300 fund managers.
The average number picked was 30 giving a 2/3rds average of 20. Rather than using the iterated dominance strategies outlined earlier, most players assume that the starting point should be 50, i.e. the mean from a random draw. Hence level zero players chose 50 (15% of our total sample). Level one players chose the best reaction to the level zero players i.e. they picked 2/3rds of 50, providing a spike at 33 (14% of our sample). Level two players “best react” to a 33, yielding the massive spike at 22 (7% of our sample). Level three players end up with 15 as their pick (2% of the sample). Once past level two or three reasoning, players frequently slide down the slippery slope towards the infinite iterations that produce zero (11% of our sample).
Keynes’ beauty contest (frequency, %)
0
2
4
6
8
10
12
14
16
0 5 10 15 20 25 30 35 40 45 50 55 60 65 70 75 80 85 90 95 100
Source: DrKW Macro research
It is easy to measure the number of steps of strategic thinking that are being carried out by the following formula (for choices less than 50) ln(x/50)/ln(2/3). So with an average of 30, the average level of thinking comes out at 1.3 steps!
People’s performance on the CRT was related to the degrees of thinking they displayed when it came to the beauty contest game. Those with a zero score on the CRT selected an average number of 47 in the beauty contest, whereas those with a score of 3 on the CRT had an average selection of 22.

Global Equity Strategy 2 February 2006
13
Keynes’ beauty contest average choice by CRT group
0
5
10
15
20
25
30
35
40
45
50
0 1 2 3 Source: DrKW Macro research
Monty Hall Problem The final element examined by our test is the Monty Hall problem. This is one of the most divisive problems that I have ever come across. It regularly leaves professors of maths purple in the face from arguing about it. It is question 16, the game show with the three doors, behind which are two goats and one car. I am assuming that you want to win the car, as I played this with one person who was Greek and said he wanted to win the goats!
You pick a door, then I will open one of the other doors and reveal a goat. I then offer you the chance to switch from the door you chose to the other unopened door. Should you switch?
% choosing each option in the Monty Hall problem
0
5
10
15
20
25
30
35
40
45
50
Stick Switch No preference Source: DrKW Macro research
47% said they would stick with the door they original chose. 43% said they would switch and 11% said they had no preference. The correct answer is that you should switch. Now why?
Well consider the pictures below. Each row represents a version of the game. Let us assume that you always choose door one (purely for pedagogical reasons). In the first row I can then open either door 2 or 3, and if you switch you lose. However, in the other two games switch is the optimal strategy. In row two you pick door one, and I will open door three, if you switch you win. In row three you pick door one, and I will open door two, if you switch you win. The hidden piece of information is that I am never going to reveal the car. So the only time you win by sticking is when you pick the car straight off – a one in three chance.

Global Equity Strategy 2 February 2006
14
An alternative way of thinking about it is to do the following. The door you pick obviously has a 1/3 chance of being the correct door. When I open the door it very clearly has a zero probability attached to it. Thus the other door must have a probability of 2/3. This can be proved via Bayes’ Theorem but I will omit the proof for the sake of readability.
Conclusions The purpose of this note was to illustrate that professional fund managers aren’t a breed apart. They are just as likely as everyone else to suffer behaviour biases. The objective is not to laugh at how foolish others are, but rather to show just how hard it is to avoid falling into cognitive pitfalls.
Even those with the maximum CRT score still appeared to generate exaggerated opinions of themselves, and to have a tendency to look for information that agreed with them.
The challenge facing all of us is to learn to be more reflective rather than reflexive. Of course, learning isn’t easy. So designing a framework that is relatively robust to behavioural biases may actually be the easy path – I started down that road with the Seven Sins of Fund Management (November 2005). Keep an eye out for more in this vein a little later in the year.
Global Equity Strategy 2 February 2006
15 [12064 : 110515]
Disclosure appendix Disclosures under US regulations The relevant research analyst(s), as named on the front cover of this report, certify that (a) all of the views expressed in this research report accurately reflect their personal views about the securities and companies mentioned in this report; and (b) no part of their compensation was, is, or will be directly or indirectly related to the specific recommendation(s) or views expressed by them contained in this report. Any forecasts or price targets shown for companies and/or securities discussed in this report may not be achieved due to multiple risk factors including without limitation market volatility, sector volatility, corporate actions, the unavailability of complete and accurate information and/or the subsequent transpiration that underlying assumptions made by DrKW or by other sources relied upon in the report were inapposite.
Recommendation history charts Past performance is not an indicator of future performance. Dresdner Kleinwort Wasserstein Research – Recommendation definition (Except as otherwise noted, expected performance over next 12 months) Buy: 10% or greater increase in share price Sell: 10% or more decrease in share price Add: 5-10% increase in share price Reduce: 5-10% decrease in share price Hold: +5%/-5% variation in share price
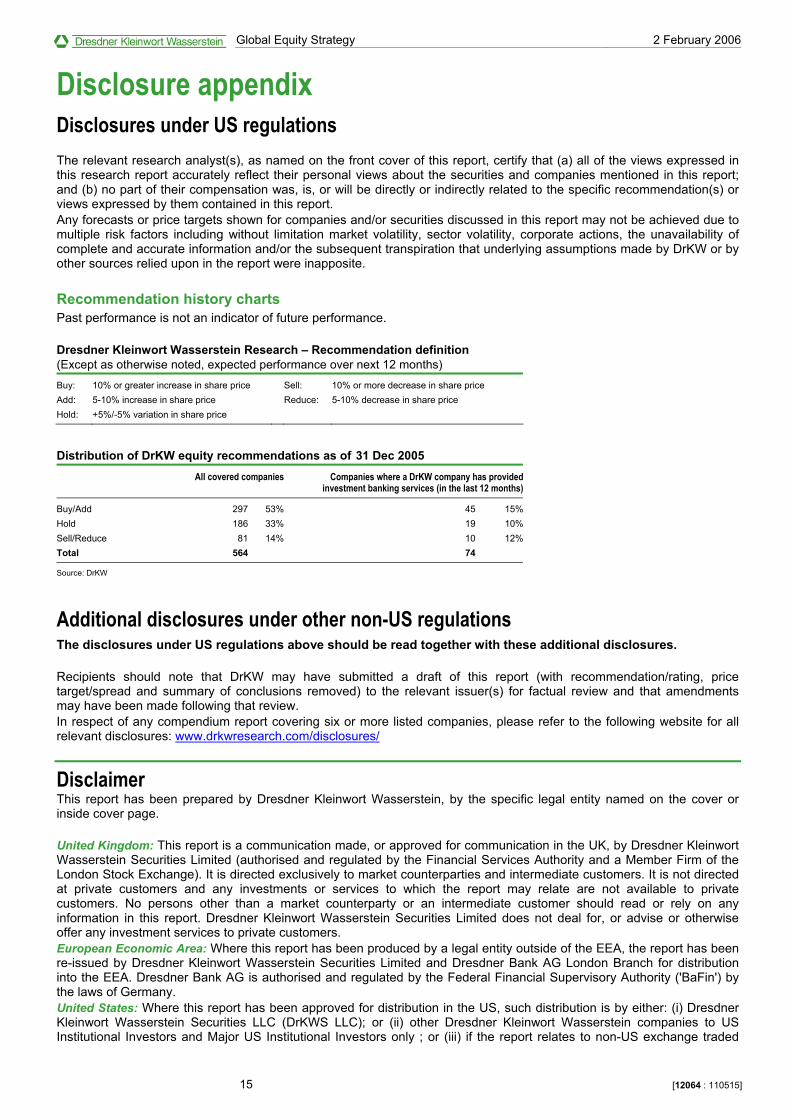
Distribution of DrKW equity recommendations as of 31 Dec 2005 All covered companies Companies where a DrKW company has provided
investment banking services (in the last 12 months)
Buy/Add 297 53% 45 15%Hold 186 33% 19 10%Sell/Reduce 81 14% 10 12%Total 564 74
Source: DrKW
Additional disclosures under other non-US regulations The disclosures under US regulations above should be read together with these additional disclosures. Recipients should note that DrKW may have submitted a draft of this report (with recommendation/rating, price target/spread and summary of conclusions removed) to the relevant issuer(s) for factual review and that amendments may have been made following that review. In respect of any compendium report covering six or more listed companies, please refer to the following website for all relevant disclosures: www.drkwresearch.com/disclosures/
Disclaimer This report has been prepared by Dresdner Kleinwort Wasserstein, by the specific legal entity named on the cover or inside cover page. United Kingdom: This report is a communication made, or approved for communication in the UK, by Dresdner Kleinwort Wasserstein Securities Limited (authorised and regulated by the Financial Services Authority and a Member Firm of the London Stock Exchange). It is directed exclusively to market counterparties and intermediate customers. It is not directed at private customers and any investments or services to which the report may relate are not available to private customers. No persons other than a market counterparty or an intermediate customer should read or rely on any information in this report. Dresdner Kleinwort Wasserstein Securities Limited does not deal for, or advise or otherwise offer any investment services to private customers. European Economic Area: Where this report has been produced by a legal entity outside of the EEA, the report has been re-issued by Dresdner Kleinwort Wasserstein Securities Limited and Dresdner Bank AG London Branch for distribution into the EEA. Dresdner Bank AG is authorised and regulated by the Federal Financial Supervisory Authority ('BaFin') by the laws of Germany. United States: Where this report has been approved for distribution in the US, such distribution is by either: (i) Dresdner Kleinwort Wasserstein Securities LLC (DrKWS LLC); or (ii) other Dresdner Kleinwort Wasserstein companies to US Institutional Investors and Major US Institutional Investors only ; or (iii) if the report relates to non-US exchange traded

Global Equity Strategy 2 February 2006
16 [12064 : 110515]
futures, Dresdner Kleinwort Wasserstein Limited (DrKWL). DrKWS LLC, or in case (iii) DrKWL, accepts responsibility for this report in the US. Any US persons wishing to effect a transaction through Dresdner Kleinwort Wasserstein (a) in any security mentioned in this report may only do so through DrKWS LLC, telephone: (+1 212) 429 2000; or (b) in a non-US exchange traded future may only do so through DrKWL, telephone: (+ 11 44) 20 7623 8000; or (c) in a banking product may only do so through Dresdner Bank AG New York Branch, telephone (+1 212) 969 2700. Singapore: This research report is being distributed for Dresdner Kleinwort Wasserstein ("DrKW") in Singapore by Dresdner Bank AG, Singapore Branch, purely as a resource and for general informational purposes only, and is intended for general circulation. Accordingly, this research report does not take into account the specific investment objectives, financial situation, or needs of any particular person and is exempted from the same by Regulation 34 of the Financial Advisers Regulations ("FAR") (as required under Section 27 of the Financial Advisers Act (Cap. 110) of Singapore ("FAA")). Hong Kong: This report is being distributed for Dresdner Kleinwort Wasserstein in Hong Kong by Dresdner Kleinwort Wasserstein Securities Limited. Unless permitted to do so by the securities laws of Hong Kong, no person may issue or have in its possession for the purposes of issue this report, whether in Hong Kong or elsewhere, which is directed at, or the contents of which are likely to be accessed or read by, the public in Hong Kong, other than with respect to the securities referred to in this report which are or are intended to be disposed of only to persons outside Hong Kong or only to "professional investors" within the meaning of the Securities and Futures Ordinance (Cap.571) of Hong Kong and any rules made thereunder, and to persons whose ordinary business is to buy and sell shares or debentures. Japan: Where this report is being distributed in Japan, such distribution is by either (i) Dresdner Kleinwort Wasserstein (Japan) Limited Tokyo Branch (DrKWJ, registered and regulated by the Financial Services Agency and General Trading Participant of TSE, Regular Transaction Participant and Transaction Participant in Futures Transaction of OSE, Participant of JASDAQ) to Japanese investors excluding private customers or (ii) other Dresdner Kleinwort Wasserstein companies, to entities falling within Article 2, Paragraph 1 of the Enforcement Order for Law Concerning Foreign Securities Firms act. Any Japanese persons not falling within (ii) wishing to effect a transaction through Dresdner Kleinwort Wasserstein in any security mentioned in this report may only do so through DrKWJ, telephone: (+ 813) 6230 6000. Australia: Neither Dresdner Bank AG ("DBAG") nor Dresdner Kleinwort Wasserstein Securities Limited ("DrKWSL") holds an Australian financial services licence. This report is being distributed in Australia to wholesale customers pursuant to an Australian financial services licence exemption for DBAG under Class Order 04/1313 or for DrKWSL under Class Order 03/1099. DBAG is regulated by BaFin under the laws of Germany and DrKWSL is regulated by the Financial Services Authority under the laws of the United Kingdom, both of which differ from Australian laws. This report contains general information only, does not take account of the specific circumstances of any recipient and should not be relied upon as authoritative or taken in substitution for the exercise of judgment by any recipient. Each recipient should consider the appropriateness of any investment decision having regard to their own circumstances, the full range of information available and appropriate professional advice. The information and opinions in this report constitute judgment as at the date of this report, have been compiled or arrived at from sources believed to be reliable and in good faith (but no representation or warranty, express or implied, is made as to their accuracy, completeness or correctness) and are subject to change without notice. DrKW may amend, supplement or update the contents of this report in such form and in such timescales as DrKW deems appropriate. Recommendations and opinions herein reflect DrKW's expectations over the 12 month period following publication from the perspective of long-only investment clients. DrKW reserves the right to express different or contrary recommendations and opinions for different timescales or for other types of investment client. This report does not constitute or form part of, and should not be construed as, any offer for sale or subscription of, or any invitation to offer to buy or subscribe for, any securities, nor should it or any part of it form the basis of, or be relied on in any connection with, any contract or commitment whatsoever. DrKW accepts no liability whatsoever for any loss or damage arising from any use of this report or its contents. Whilst DrKW may provide hyperlinks to websites of entities mentioned in this report, the inclusion of a link does not imply that DrKW endorses, recommends or approves any material on the linked page or accessible from it. DrKW accepts no responsibility whatsoever for any such material, nor for any consequences of its use. This report is for the use of the addressees only, is supplied to you solely in your capacity as an investment professional or knowledgeable and experienced investor for your information and may not be reproduced, redistributed or passed on to any other person or published, in whole or in part, for any purpose, without the prior, written consent of DrKW. DrKW may distribute reports such as this in hard copy, electronically or by Voiceblast. DrKW and/or any of its clients may undertake or have undertaken transactions for their own account in the securities mentioned in this report or any related investments prior to your receipt of it. DrKW specifically draws recipients attention to the disclosures contained in the Disclosure Appendix but notes that, excluding (i) DrKWS LLC and (ii) the research analyst(s) responsible for this report unless specifically addressed in the "Disclosures under US regulations": (a) DrKW and its directors, officers, representatives and employees may have positions in or options on the securities mentioned in this report or any related investments or may buy, sell or offer to buy or sell such securities or any related investments as principal or agent on the open market or otherwise; and (b) DrKW may conduct, solicit and/or engage in other investment and/or commercial banking business (including without limitation loans, debt securities and/or derivative, currency and commodity transactions) with the issuers or relating to the securities mentioned in this report. Accordingly, information may be available to DrKW, which is not reflected in this report or the disclosures. In this notice “DrKW” means Dresdner Bank AG and/or Dresdner Kleinwort Wasserstein Securities Limited and any of their affiliated or associated companies and their directors, officers, representatives or employees and/or any persons connected with them. Additional information on the contents of this report is available at www.drkwresearch.com and on request.
© Dresdner Kleinwort Wasserstein Securities Limited 2006