2 determination of the miscibility - uni-halle.de2 determination of the miscibility 2.1 from glass...
TRANSCRIPT
2
Determination of the miscibility
2.1 From glass temperature transitionThe glass transition temperature is the main characteristic temperature of the transition
an amorphous solid to liquid state (low molecular substances) and to rubber elastic state (high
molecular polymers). The properties of the glass transition are given in terms of the step
heights and the width of the transition. The glass transition temperature (Tg) depends on the
cohesive energy and packing density of the polymer. The glass transition temperature depends
on the thermal pre-history of the sample, and on the physical method according to which it
has been determined [66]. The glass transition temperature (Tg) can be determined using
different methods such as DSC, DMA and DES. Plasticizers are materials that are blended
into PHB to improve its processability and reduce the risk of thermal degradation during
processing. Plasticiziers affect PHB by lowering its melt viscosity and glass temperature. The
addition of plasticizers causes a decrease in the tensile modulus of PHB and an increase in
both the elongation at break [11] and impact strength. The effects of plasticizers on glass
transition have been investigated in [67]. Usually, on addition of a small amount of
plasticizers, the glass temperature decreases, because most of the plasticizers' molecules are
small and mobile, and have a very low glass temperature. It is well known that the polyamides
(PA) absorb a large amount of water; thus leads to lower the glass temperature [68], similar
crystalline thermoplastic polyvinyl alcohol [69,70]; the moisture acts like plasticizers.
Similar results from Lauzier et al. [72] have suggested that water may act as plasticizers for
PHB. Hobbs et al. [73] hat investigated, the effect of water on crystallization of PHB and
found the glass transation temperature decrease from 4°C to –3°C. The glass transition of
poly(vinyl chloride) PVC is 80°C and decreases on addition of plasticizers like
dioctylphthalate (DOP) [70], and Diisodecyl phthalate (DIDP). By adding plasticizers such as
tributyrin [67], glycerol, triacetin, acetyl triethyl citrate and acetyl tributyl citrate, the glass
temperature of PHB decreases (see Figure 2.1-2.14). All blends indicate one glass transition
temperature, whose value is dependent on the plasticizers' concentration. Single glass
transition suggests the presence of a single homogeneous amorphous phase. The aim of this
work is to investigate the miscibility of the blends, and the relaxation mechanisms (glass
relaxation and other relaxation processes).

12 Determination of the miscibility
2.1.1 Experimental methods
2.1.1.1 Differential scanning calorimetry (DSC)
DSC is an excellent method for the thermal analysis of polymers, and can be used to
measure the heat capacity of a sample as a function of temperature [74]. The glass transitions
and melting temperatures were recorded using a Mettler Toledo DSC 820 calorimeter in
nitrogen atmosphere. The sample films (about 10-12 mg) for thermal analysis were
encapsulated in aluminium pans and heated from -60 °C to 200 °C for PHB, and from –100 to
200°C for the blends- to determine the glass temperature at a heating rate of 10°C min-1. They
were then cooled to -60 °C and -100, at a cooling rate of 20 °C min-1. The glass temperature
was taken as the mid-point of heat capacity change. After crystallisation, the samples were
heated to melting point. The observed melting temperature was obtained from the maximum
of the second endothermic peak. The crystallinity of PHB and its blends was calculated from
(see page 55, series 3 in 3). The glass temperatures and melting temperatures of PHB and its
blends are shown in figure (2.1) and Table (2). By increasing the amount of additives
(plasticizers) the glass and melting temperatures change from 5 to – 45°C and from 175 to
158°C. The crystallinity decreases from 60% to 40% (DSC). The melting point of the blends
depends on many factors like, for instance, morphology, the kinetics of crystallization (see 3)
and blend composition. Figure (3.1) shows the second heating scan of PHB and its blends of a
DSC measurement. One glass temperature is observed and a melting temperature lower than
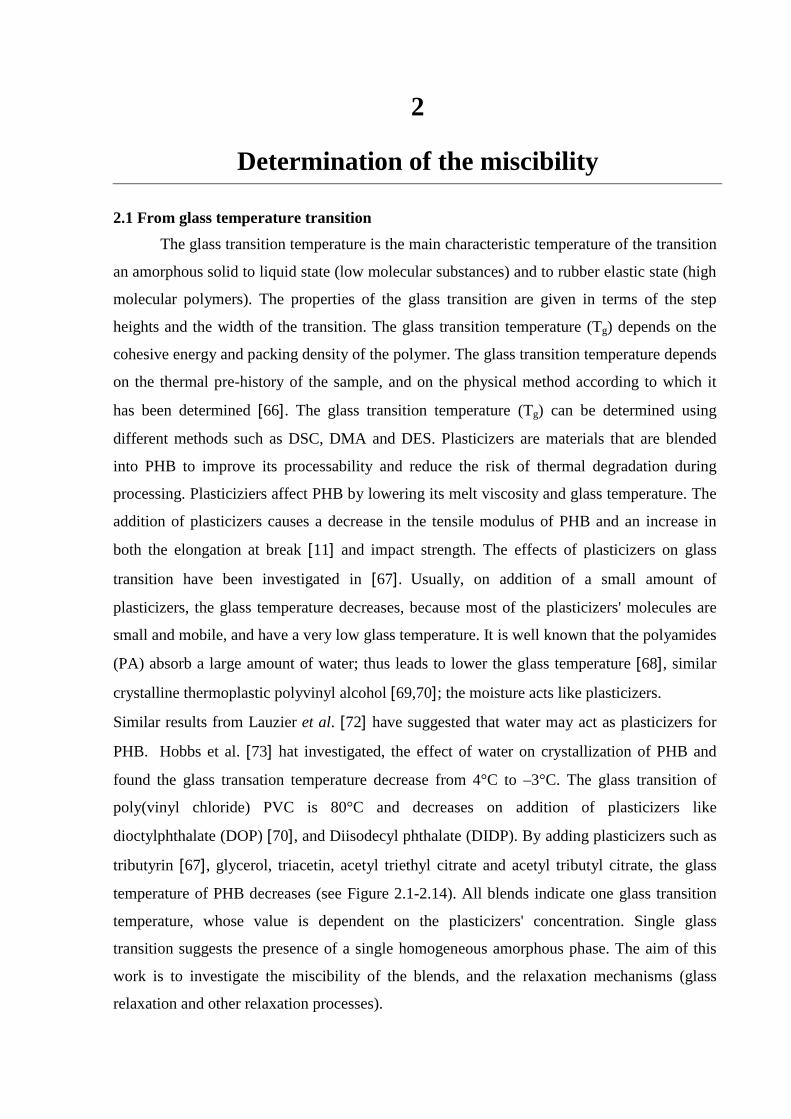
that of PHB. Figure (2.1) shows that with increasing plasticizer content from 5.5 to 13.5 wt %
in blends 1, 2, 3, 4 and 5, the glass transition (Tg) decreases and the heat capacity (∆ Cp)
increases. This is due to increasing plasticizer content, and reduction of the crystallinity.
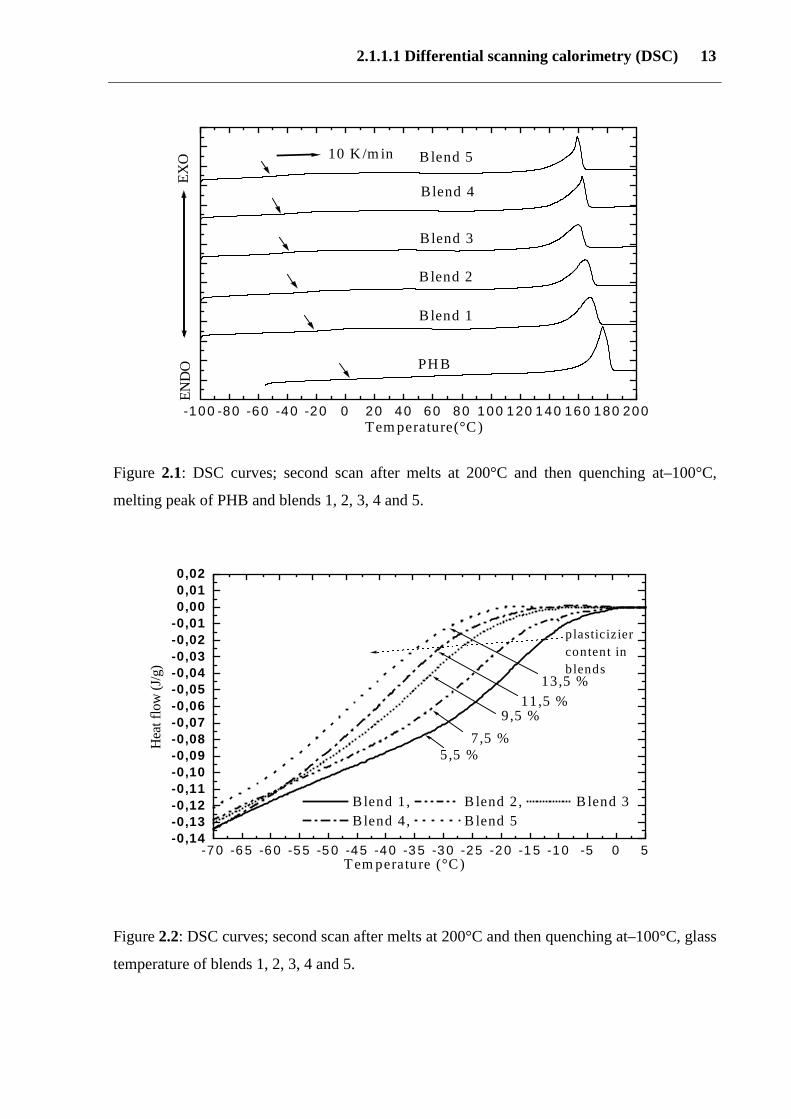
Figure (2.3) and (2.4) show that with increasing PVAc content from 4 to 20% in blends 6, 7,
8, 9 and 10, the glass transition temperature (Tg) increases. This is due to decreasing
plasticizer content; the heat capacity (∆ Cp) increases and the degree of crystallinity decreases.
This is connected to an increase in PVAc content. Increasing crystallinity decreases the
intensity of the glass transition heat capacity (∆ Cp) and broadens it. It was observed that with
an increase in the PVAc content in the blends, the cold crystallization peak increases and
shifts to a higher re-crystallisation temperature, because, during quenching, polymer chains
are frozen and re-crystallisation temperatures occur above glass temperature. The cold
crystallization temperature increases with increasing amounts of additives, i.e., the
crystallization of blend is greatly hindered.
2.1.1.1 Differential scanning calorimetry (DSC) 13
Figure 2.1: DSC curves; second scan after melts at 200°C and then quenching at–100°C,
melting peak of PHB and blends 1, 2, 3, 4 and 5.
Figure 2.2: DSC curves; second scan after melts at 200°C and then quenching at–100°C, glass
temperature of blends 1, 2, 3, 4 and 5.
-100 -80 -60 -40 -20 0 20 40 60 80 100 120 140 160 180 200
10 K /m in
END
OEX
O
Tem perature(°C )
PH B
B lend 5
Blend 4
Blend 3
B lend 2
B lend 1
-70 -6 5 -60 -55 -5 0 -45 -40 -3 5 -30 -25 -20 -1 5 -10 -5 0 5-0,14-0,13-0,12-0,11-0,10-0,09-0,08-0,07-0,06-0,05-0,04-0,03-0,02-0,010,000,010,02
13,5 %11,5 %
9,5 %7,5 %
5,5 %
plasticiziercontent in blends
B lend 1 , B lend 2 , B lend 3 B lend 4 , B lend 5
Hea
t flo
w (J
/g)
T em perature (°C )
14 Determination of the miscibility
Figure 2.3: DSC curves for PHB and its blends; second scan after melts at 200°C and then
quenching at –100°C, melting peak of blends 6, 7, 8, 9 and 10.
Figure 2.4: DSC curves for PHB and its blends; second scan after melts at 200°C and then
quenching at–100°C, glass temperature of blends 6, 7, 8, 9 and 10.
-7 0 -6 5 -6 0 -5 5 -5 0 -4 5 -4 0 -3 5 -3 0 -2 5 -2 0 -1 5 -1 0 -5 0 5 1 0 1 5 2 0-0 ,2 0
-0 ,1 8
-0 ,1 6
-0 ,1 4
-0 ,1 2
-0 ,1 0
-0 ,0 8
-0 ,0 6
-0 ,0 4
-0 ,0 2
0 ,0 0
20 %
16 %12 %8 %
4 %
B lend 6 , B lend 7 , B lend 8 B lend 9 , B lend 10 , PH B
Hea
t flo
w (J
/g)
T em pera ture (°C )
P V A c conten tin b lends
-80 -60 -40 -20 0 20 40 60 80 100 120 140 160 180
EXO
PHB
Blend 10
Blend 9
Blend 8
Blend 7
Blend 6
END
O
Temperature (°C)
10 k/min

2.1.1.2 Dielectric spectroscopy (DES) 15
Table 2: The thermal properties of PHB and its blends
Glass
temperature
Tg
°C
Heat
capacity
∆ Cp
J/g deg
Melting
temperature
Tm
°C
Melting
enthalpy
∆ Hm
J/g
Crystallinity
(%)
Cold
crystallization
Tcc
°C
PHB 5 0.435 174 88 60 44
Blend 1 -9 0.372 167 65 48 -------------
Blend 2 -20 0.350 164 60 45 -------------
Blend 3 -37 0.417 159 55 42 -------------
Blend 4 -40 0.448 162 58 45 ------------
Blend 5 -45 0.483 158 57 46 -------------
Blend 6 -28 0.326 161 60 50 30
Blend 7 -22 0.474 161 55 47 33
Blend 8 -18 0.508 162 53 47 37
Blend 9 -16 0.530 163 52 46 39
Blend 10 -7 0.573 165 50 45 46
2.1.1.2 Dielectric spectroscopy (DES)
Energy in a polymer can be dispersed not only by periodic mechanical deformation but
also via electric interaction, i.e., molecular mechanisms of electrical relaxation depend on
dipoles. The electric field has an effect on materials' polarisation such as:
• Electron polarisation (PE): the interaction leads to a shift in the electron orbital with
respect to the centre of the atom.
• Atom polarisation (PA): the interaction leads to a shift in the position of bonded atoms
in response to the electric field.
• Dipole polarisation (P0): reorientation of permanent dipoles in the materials under the
influence of the electric field.
Dielectric relaxation is the decay of the polarisation after removal of the electric field applied
to the material. The dielectric constant εr is given by εr = C/C0, where C, C0 are the capacities
of the empty and full condenser. Chemical structure and polarity are the basic factors
controlling dielectric response in polymers. It is necessary to take into account the
conformation, packing and interaction of molecules because these factors determine the
ability of dipoles to respond to the field. Dielectric properties of polar materials are described

16 Determination of the miscibility
by the relaxation mechanism of dipoles, and quantities related to molecular structure. DES
measures the dielectric constant of a polymer with a sinusoidal-voltage attached to the
electrodes. The complex dielectric constant (ε*) is represented by the following equation:
)1/()()1/()(```* 220
220 τωωτεετωεεεεεε +−−+−+=−= ∞∞∞ ii
Where ε`, ε`` are dielectric constants and loss, ω is the angular frequency, τ is the relaxation
time, ε0 is the low frequency limiting value of the dielectric constant, and ε∞ is the high-
frequency limiting value of the dielectric constant. The dielectric relaxation was measured
using a broadband dielectric spectrometer, Novocontrol BDS 4000, (based an a Schlumberger
1260 frequency response analyser). Isothermal frequency scans in the range of 1 to 106 Hz
were performed for PHB and its blends of films; 2 mm in diameter and 0.3 mm thick. The
dielectric measurement was taken in a constant temperature range of between –30 to 80°C
with temperatures at 5 K steps. Considerable changes in dielectric response occur during
transitions such as the glass transition. In the bulk, polymer chains and the dipoles attached to
them, do not move with a single relaxation time, but with a range of relaxation times
dependent on the inter- and intramolecular interaction present.
Figures 2.5 and 2.6 show dielectric loss and the loss factor of blends 8 and 9 as a function of
frequency at various temperatures. Three main dielectric relaxation processes, the α, β and γ-
relaxation, were observed in blends 8 and 9. The β relaxation is a shoulder at lower
temperatures of - 40°C (10 Hz) and -30°C (100 Hz). It shifts to a higher temperature with
increasing frequency. The α process (main glass process) takes place at -5°C (15 Hz) and 0°C
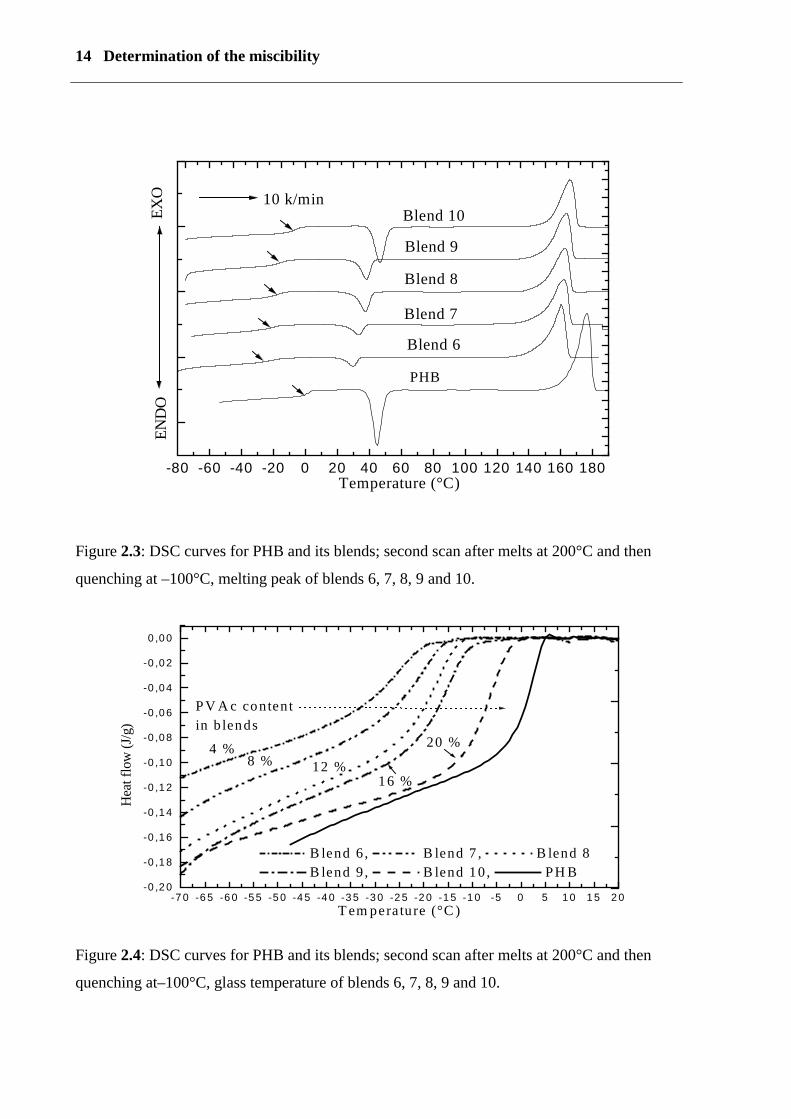
(7 Hz) and γ-relaxation occurs between 100 and 130 °C. Figure (2.6) shows the frequency
dependence of the dielectric constant for blend 9. It shows a process, which is called as the
main glass temperature, which shifts to higher value with increasing the frequency. The
dielectric loss factor of PHB was investigated as a function of temperature at various
frequencies, and three dielectric relaxations of PHB were found, the α, β and γ relaxation
(results not shown here). The β relaxation occurs at a lower temperature of -50°C (3 kHz) and
shifts to a higher temperature by increasing the frequency. The α-main glass transition is at
33°C (1 kHz) and the γ-relaxation is at 130 °C. Our results show that PHB and its blends have
three relaxation processes: α, β and γ-relaxation. Similarly, three relaxations have been
studied by DES measurements, carried out by Mitomo et al. [9], Ando et al. [75]. Nogales et
al. [76] and Pratt et al. [77].

2.1.1.2 Dielectric spectroscopy (DES) 17
Figure 2.5: (A, B) Isothermal dielectric loss scans of blend 9 at various temperatures
0,1 1 10 100 1000 10000 100000 10000000,04
0,050,060,070,080,09
0,1
0,2
0,3
0,4
(B)
β process
α process
-5°C, 0°C 5°C, 10°C 15°C
log
ε´´
log f (Hz)
0,01 0,1 1 10 100 1000 10000 100000 1000000
0,02
0,03
0,040,050,060,070,080,090,1
0,2
0,3
0,40,5
(A)
β process
α process
log
ε´´
-30°C, -25°c -20°C, -15°C -10°C, -5°C
log f (Hz)

18 Determination of the miscibility
Figure 2.6: (A, B) Isothermal dielectric loss scans of blend 8 at various temperatures.
1 10 100 1000 10000 100000 10000000,01
0,02
0,03
0,04
0,050,060,070,080,09
0,1
0,2
(A)
β process
α process
-40°C, -35°C -30°C, -25°C -20°C, -15°C
log
ε``
log f (Hz)
1 10 100 1000 10000 100000 10000000,04
0,05
0,06
0,07
0,08
0,090,1
0,2
(B)
β process
α process
-10°C -5°C 0°C 5°C 10°C
log
ε''
log f (Hz)
2.1.1.2 Dielectric spectroscopy (DES) 19
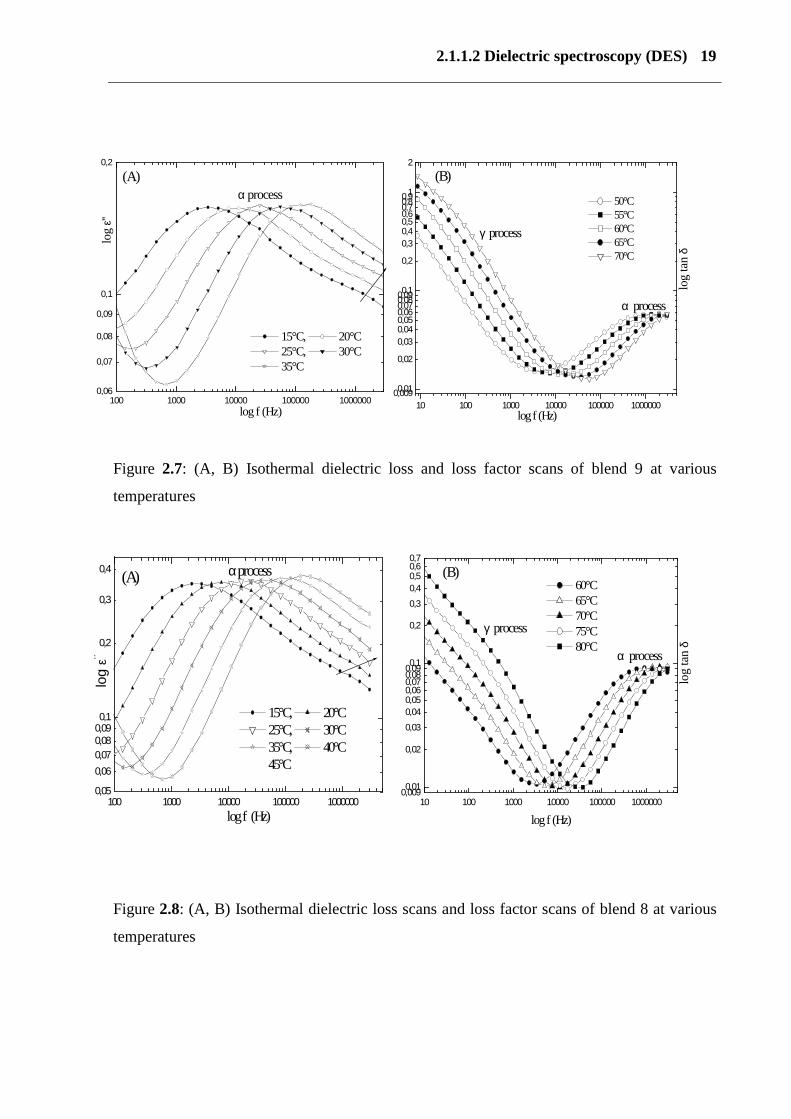
Figure 2.7: (A, B) Isothermal dielectric loss and loss factor scans of blend 9 at various
temperatures
Figure 2.8: (A, B) Isothermal dielectric loss scans and loss factor scans of blend 8 at various
temperatures
100 1000 10000 100000 10000000,06
0,07
0,08
0,09
0,1
0,2
α process
15°C, 20°C 25°C, 30°C 35°C
log
ε''
log f (Hz)
(A)
10 100 1000 10000 100000 1000000
0,0090,01
0,02
0,030,040,050,060,070,080,090,1
0,2
0,30,40,50,60,70,80,91
2
log
tan
δ
50°C 55°C 60°C 65°C 70°C
(B)
α process
γ process
log f (Hz)
100 1000 10000 100000 10000000,05
0,060,070,080,090,1
0,2
0,3
0,4
15°C, 20°C 25°C, 30°C 35°C, 40°C 45°C
log f (Hz)
(A) α process
log
ε´´
10 100 1000 10000 100000 10000000,0090,01
0,02
0,030,040,050,060,070,080,090,1
0,2
0,30,40,50,60,7
log
tan
δ
(B)
α process
γ process
60°C 65°C 70°C 75°C 80°C
log f (Hz)
20 Determination of the miscibility
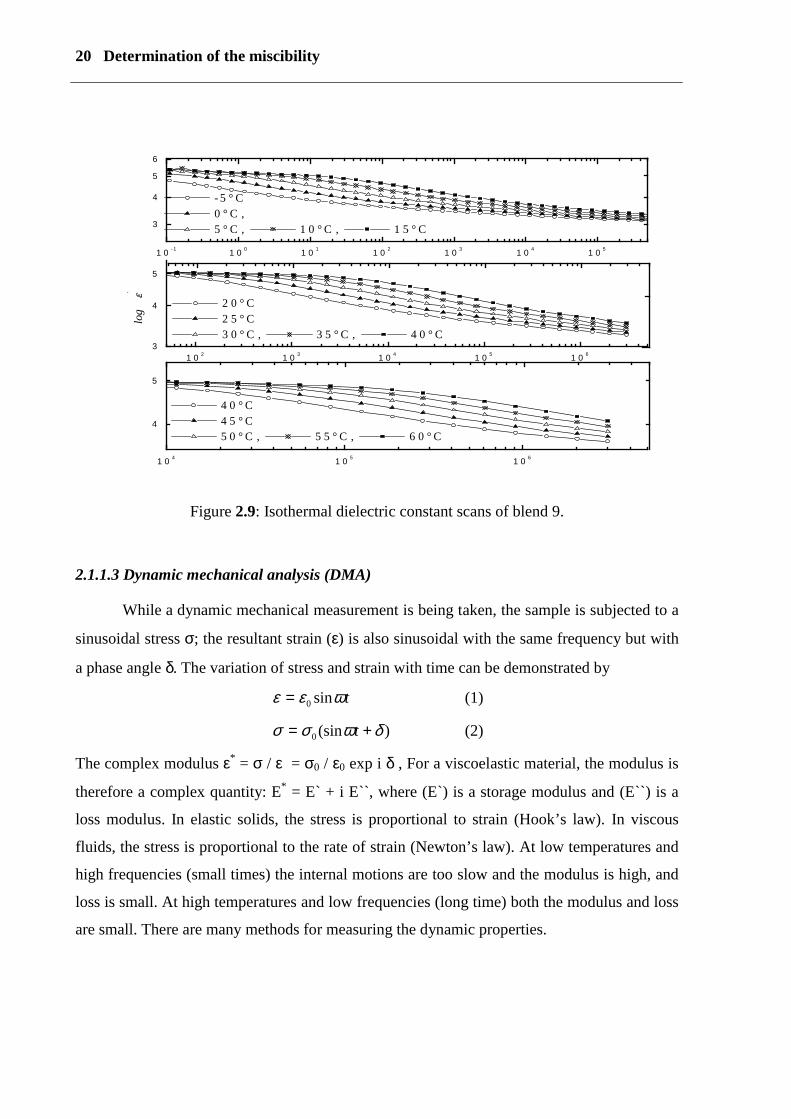
Figure 2.9: Isothermal dielectric constant scans of blend 9.
2.1.1.3 Dynamic mechanical analysis (DMA)
While a dynamic mechanical measurement is being taken, the sample is subjected to a
sinusoidal stress σ; the resultant strain (ε) is also sinusoidal with the same frequency but with
a phase angle δ. The variation of stress and strain with time can be demonstrated by
tϖεε sin0= (1)
)(sin0 δϖσσ += t (2)
The complex modulus ε* = σ / ε = σ0 / ε0 exp i δ , For a viscoelastic material, the modulus is
therefore a complex quantity: E* = E` + i E``, where (E`) is a storage modulus and (E``) is a
loss modulus. In elastic solids, the stress is proportional to strain (Hook’s law). In viscous
fluids, the stress is proportional to the rate of strain (Newton’s law). At low temperatures and
high frequencies (small times) the internal motions are too slow and the modulus is high, and
loss is small. At high temperatures and low frequencies (long time) both the modulus and loss
are small. There are many methods for measuring the dynamic properties.
1 0 4 1 0 5 1 0 6
4
5
4 0 ° C 4 5 ° C 5 0 ° C , 5 5 ° C , 6 0 ° C
1 0 2 1 0 3 1 0 4 1 0 5 1 0 63
4
5
2 0 ° C 2 5 ° C 3 0 ° C , 3 5 ° C , 4 0 ° C
log
ε`
1 0 -1 1 0 0 1 0 1 1 0 2 1 0 3 1 0 4 1 0 5
3
4
5
6
- 5 ° C 0 ° C , 5 ° C , 1 0 ° C , 1 5 ° C
2.1.1.3 Dynamic mechanical analysis (DMA) 21
1. Free vibration methods
2. Forced vibration methods (non resonance), (resonance)
3. Propagation method (continuous wave)
The damping of the oscillation depends on the storage modulus and loss modulus E`, E``
of the samples. The glass transition (Tg ) is defined as the maximum value of the loss modulus
E`` or tan δ. The value of the glass temperature determined by E`` is lower than by tan δ. The
storage modulus E` (real part) measures the rigidity of a material, and E`` (imaginary part)
measures the dissipated energy. The dynamic mechanical spectra were measured from
``Rheometer Scientific`` as torsion system using a frequency from 0.3 to 66 Hz and
temperatures from -100°C to 170°C. Samples were prepared in the form of small injection
moulded bars (30x10x4 mm3).
We obtained information on the damping loss factor, loss modulus and storage modulus
using DMA. Figure (2.10 A) shows loss factor tan δ for PHB; the loss factor decreases when
the storage time is prolonged. The small volume or level of loss factor tan δ corresponds to
the higher crystallinity of PHB. The crystallinity of PHB increases at room temperature
consequently, its density and crystallinity increases, thus the material become harder, and
more brittle [93,94]. Figure (2.10 B) shows loss factor tan δ of the blend 10 with a different
storage time at room temperature. No change in the loss factor tan δ at room temperature after
preparation over 10 and 230 days was observed, i.e., the blends do not crystallise at ageing
time. PHB has two processes but the blends have 3 processes. The α-peak is the main glass
transition and reflects the motions in connection with the chains in the amorphous regions.
The β peak is caused by the local mode relaxation or motions involved in methyl or ester
groups [78], and the γ peak reflects the chain mobility between the crystalline melting and
amorphous process; it is depends on the thickness of the lamellae [79]. Figure (2.10 C, D)
shows loss factor tan δ, and the loss modulus and storage modulus of blend 9. Three
relaxations were found. A β peak at – 60 °C, a α-peak at – 20°C and a γ peak at 100°C.
Scandola et al. [78], Mitomo et al [9] and Ando et al. [80] reported also that PHB possesses
three relaxations at –50°C, 20°C and 100-150°C.

22 Determination of the miscibility
Figure 2.10: (A) Dynamic mechanic analysis of PHB, temperature dependence of loss tangent
factor tan δ with storage time, (B). Dynamic mechanic analysis of blend 9, temperature
dependence of loss tangent factor tan δ with storage time, (C) Dynamic mechanic analysis of
blend 9, temperature dependence of the loss and storage module, (D) Dynamic mechanic
analysis of blend 9, temperature dependence of loss tangent factor tan δ.
-100 -80 -60 -40 -20 0 20 40 60 80 100 120 140 160
0,01
0,1
log
tan
δ
Temperature (°C)
(D)
62.2 rad/sec6.2 rad/sec0.6 rad/sec
γ process
α process
β proc
ess
-100 -75 -50 -25 0 25 50 75 100 125 150 175
0,01
0,1
β
αγ process
log
tan
δ
Temperature (°C)
(B)
Blend 9 10 days after preparation 230 days after preparation
-100 -80 -60 -40 -20 0 20 40 60 80 100 120 140 160 180 200
1E7
1E8
1E9
1E10
log
E`, E
`` (P
a)
α processβ process
(C)
62.2 rad/sec6.2 rad/sec
0.6 rad/sec
Temperature (°C)
-80 -60 -40 -20 0 20 40 60 80 100 120 140 160 180
0,01
0,1
1 days after preparation 30 days after preparation
log
tan
δ
Temperature (°C)
(A)α process γ process
2.1.1.3 Dynamic mechanical analysis (DMA) 23
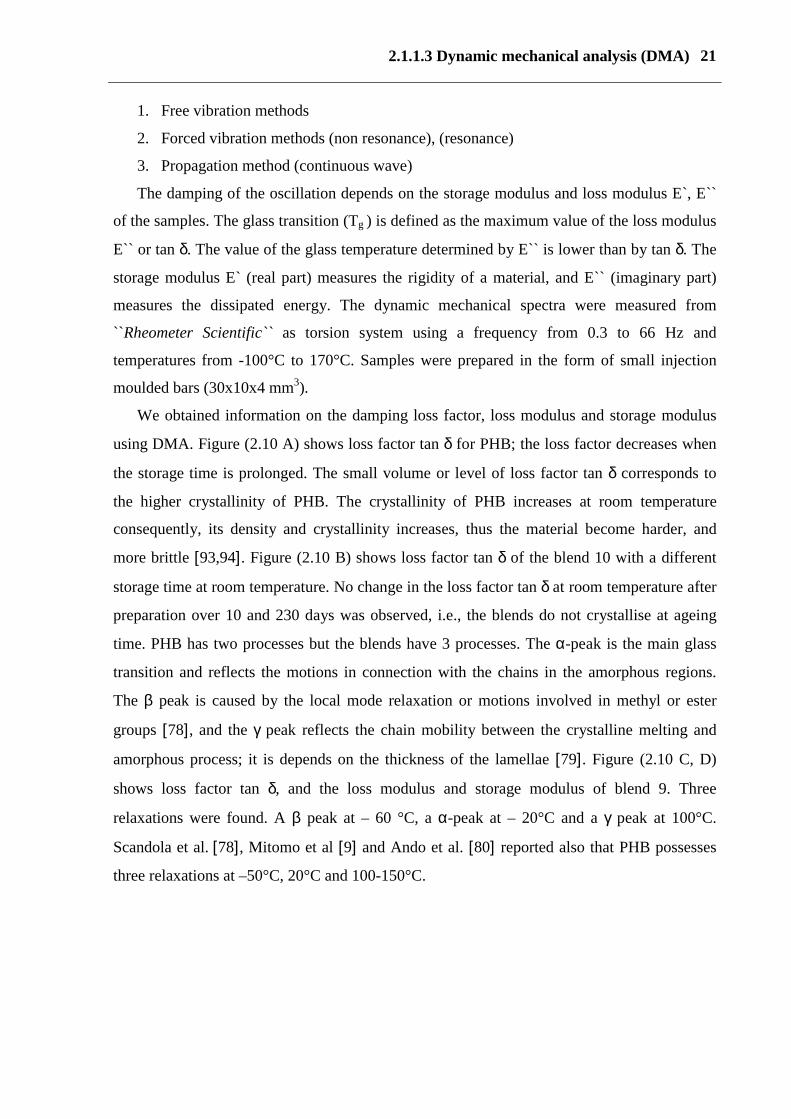
Figure 2.11: (A) Dynamic mechanic analysis, temperature dependence of the storage
modulus, the loss modulus of PHB and its blends 1, 2, 3, 4 and 5; (B) Dynamic mechanic
analysis, temperature dependence of blends 6, 7, 8, 9 and 10.
Figure (2.11 A, B) shows the storage modulus and the loss modulus of the blends with various
additives, i.e., increasing the plasticizers content shifts the α-process to lower temperatures.
Figure (2.11 B) shows that the E-modulus of the blends decreases with increasing PVAc
content, and with decreasing plasticizer content. The peak of loss modulus becomes larger and
the storage modulus decreases to lower values. The intensity of the α-process increases and α
-100 -80 -60 -40 -20 0 20 40 60 80 100 120 140 160101
102
103
104
(B)
log
E`, E
`` (M
Pa)
Temperature (°C)
Blend 6, Blend 7 Blend 8, Blend 9 Blend 10
- 1 0 0 - 8 0 - 6 0 - 4 0 - 2 0 0 2 0 4 0 6 0 8 0 1 0 0 1 2 0 1 4 0 1 6 0 1 8 0
1 0 1
1 0 2
1 0 3
P H B , B le n d 1 B le n d 2 , B l e n d 3 B le n d 4 , B l e n d 5
log
E', E
'' (M
Pa)
T e m p e r a tu r e ( ° C )
( A )
24 Determination of the miscibility
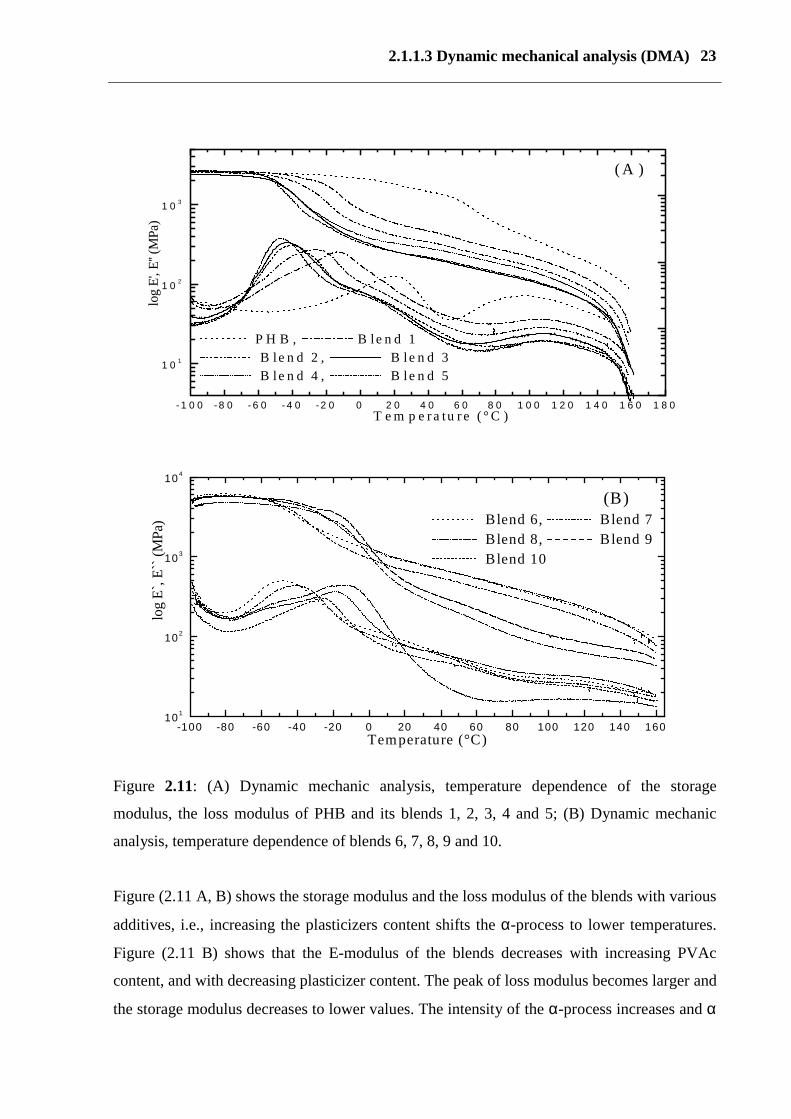
peak and β peak are exchanged, but the γ process decreases in comparison to PHB. Figure
(2.12 A) shows the loss factor (tan δ) for blends 6, 7, 8, 9 and 10. They shift to a lower glass
transition from –12°C to –45°C and the shoulder at 0°C remains constant and the loss factor
increases by increasing the plasticizers’ content. Figure (2.12A) shows the loss factor (tan δ)
for blends 2, 3, 4 and 5. They shift to higher glass transition and the loss factor increases with
increasing the PVAc’ content in the blends, because the amorphous part increases.
Figure 2.12: (A, B) Dynamic mechanic analysis, temperature dependence of loss factor (tan δ)
of PHB, blends 1-5 (A), and blend 6-10.
-1 0 0 -8 0 -6 0 -4 0 -2 0 0 2 0 4 0 6 0 8 0 1 0 0 1 2 0 1 4 0 1 6 0
0 ,0 2
0 ,0 4
0 ,0 6
0 ,0 8
0 ,1 0
0 ,1 2
0 ,1 4
0 ,1 6
0 ,1 8
tan
δ
T e m p e ra tu re (°C )
(A ) P H B , B le n d 1 B le n d 2 , B le n d 3 B le n d 4 , B le n d 5
-100 -80 -60 -40 -20 0 20 40 60 80 100 120 140 160
0,03
0,06
0,09
0,12
0,15
0,18
0,21
0,24
0,27
0,30
tan
δ
Temperature (°C)
(B)
Blend 6, Blend 7 Blend 8, Blend 9, Blend 10

2.1.2 Discussion 25
2.1.2 Discussion
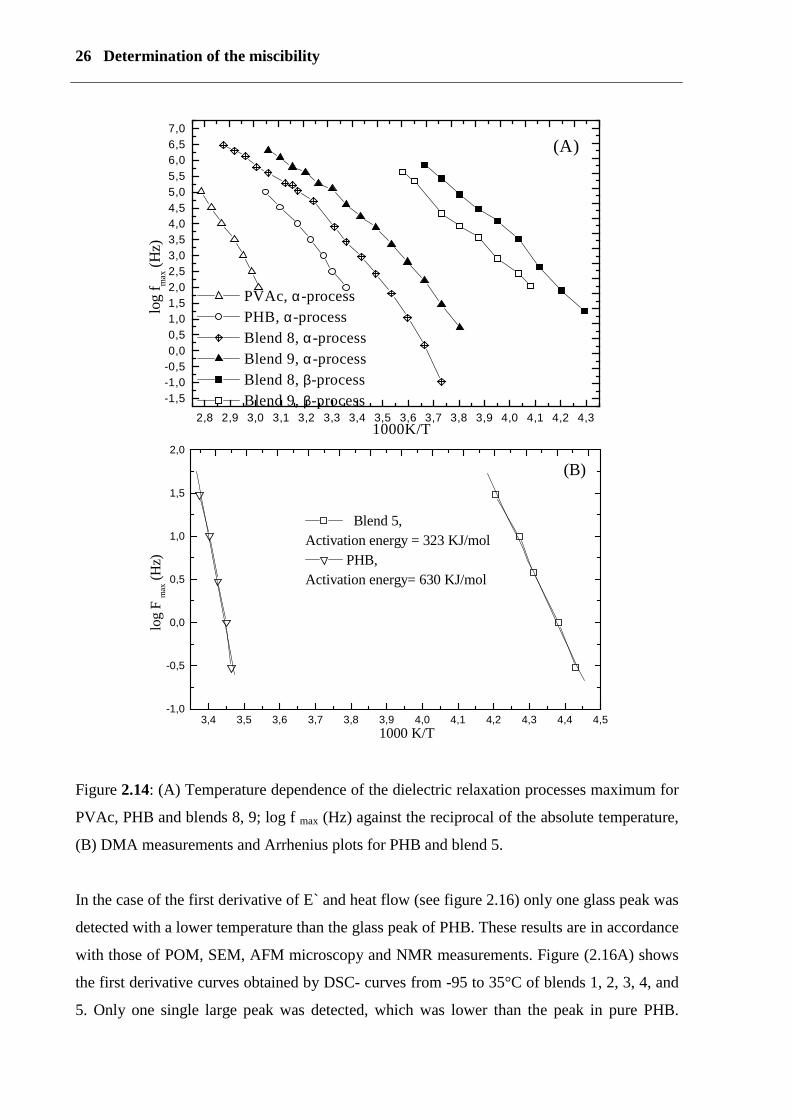
Figure (2.14 A) shows plots of log fmax values for α and β relaxation as a function of
the reciprocal absolute temperature, and the activation energy is calculated using the
Arrhenius equation
���
� −=RT
Eff aexp0max
where Ea is the activation energy in kJ/mol, the latter is calculated from the slope of the line
of the best fit through the log fmax curve. The activation energy for PHB is 359 kJ/mol, and for
blends 8 and 9 it is 250 and 243 kJ/mol. Figure (2.13A) shows the multi-frequency dynamic
mechanical loss modulus E`` for blend 5; one peak is at –50 °C (frequency-dependent) and a
shoulder, which is slightly frequency-dependent, is at a 0 °C. Using DMA, figure (2.14 B)
shows fmax values for the α relaxation as a function of the reciprocal temperature with an
activation energy of 630 kJ/mol for PHB and a blend of 327 kJ/mol.
Figure 2.13: (A, B) Dynamic mechanic analysis; temperature dependence and multi-
frequency of the storage modulus and the loss modulus of blend 5 (A) and PHB (B).
- 1 0 0 -8 0 - 6 0 - 4 0 - 2 0 0 2 0 4 0 6 0 8 0 1 0 0 1 2 0 1 4 0 1 6 0 1 8 0
1 0 1
1 0 2
1 0 3
log
E',E
`` (M
Pa)
T e m p e r a u r e ( ° C )
P H B (B )
3 0 H z1 0 H z
3 H z1 H z
0 .3 H z
- 9 0 - 6 0 - 3 0 0 3 0 6 0 9 0 1 2 0 1 5 0 1 8 0
1 0 1
1 0 2
1 0 3
Log
E',E
'' (M
Pa)
T e m p e r a tu re ( ° C )
B le n d 5 (A ) 0 ,3 H z , 1 H Z 3 H Z , 1 0 H z , 3 0 H z
26 Determination of the miscibility
Figure 2.14: (A) Temperature dependence of the dielectric relaxation processes maximum for
PVAc, PHB and blends 8, 9; log f max (Hz) against the reciprocal of the absolute temperature,
(B) DMA measurements and Arrhenius plots for PHB and blend 5.
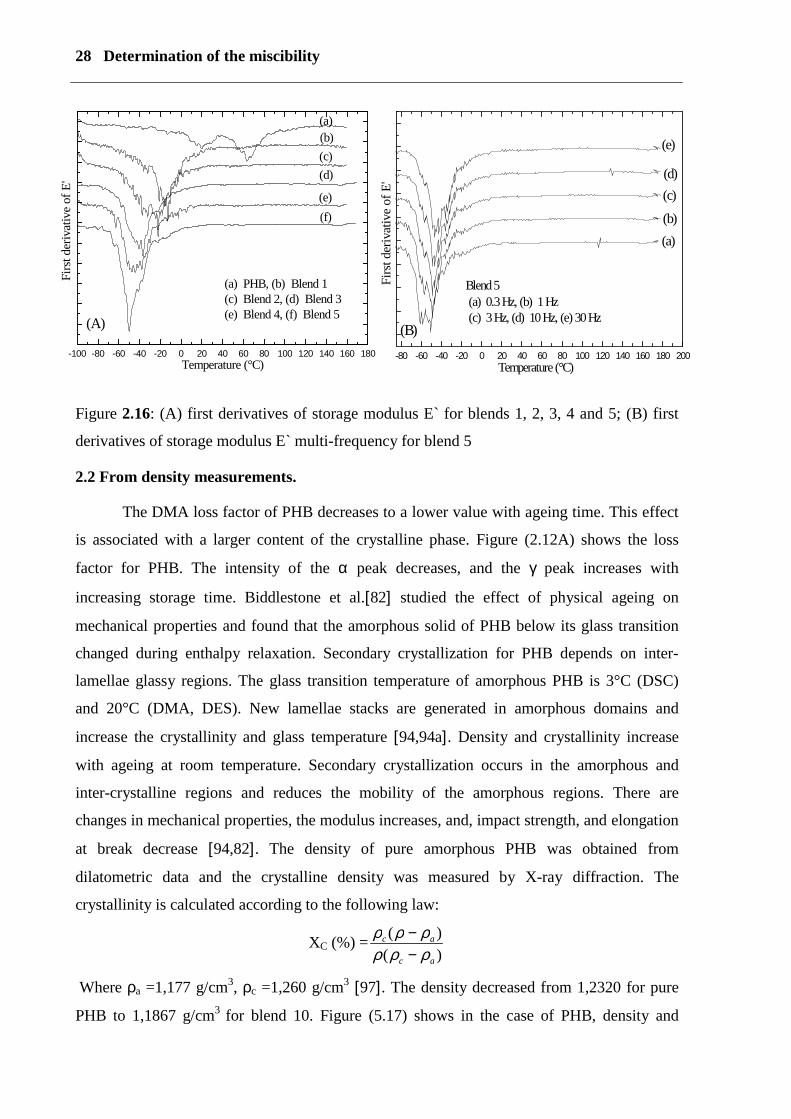
In the case of the first derivative of E` and heat flow (see figure 2.16) only one glass peak was
detected with a lower temperature than the glass peak of PHB. These results are in accordance
with those of POM, SEM, AFM microscopy and NMR measurements. Figure (2.16A) shows
the first derivative curves obtained by DSC- curves from -95 to 35°C of blends 1, 2, 3, 4, and
5. Only one single large peak was detected, which was lower than the peak in pure PHB.
2,8 2,9 3,0 3,1 3,2 3,3 3,4 3,5 3,6 3,7 3,8 3,9 4,0 4,1 4,2 4,3-1,5-1,0-0,50,00,51,01,52,02,53,03,54,04,55,05,56,06,57,0
PVAc, α-process PHB, α-process Blend 8, α-process Blend 9, α-process Blend 8, β-process Blend 9, β-process
log
f max
(Hz)
1000K/T
(A)
3,4 3,5 3,6 3,7 3,8 3,9 4,0 4,1 4,2 4,3 4,4 4,5-1,0
-0,5
0,0
0,5
1,0
1,5
2,0
Blend 5,Activation energy = 323 KJ/mol
PHB,Activation energy= 630 KJ/mol
log
F m
ax (H
z)
1000 K/T
(B)
2.1.2 Discussion 27
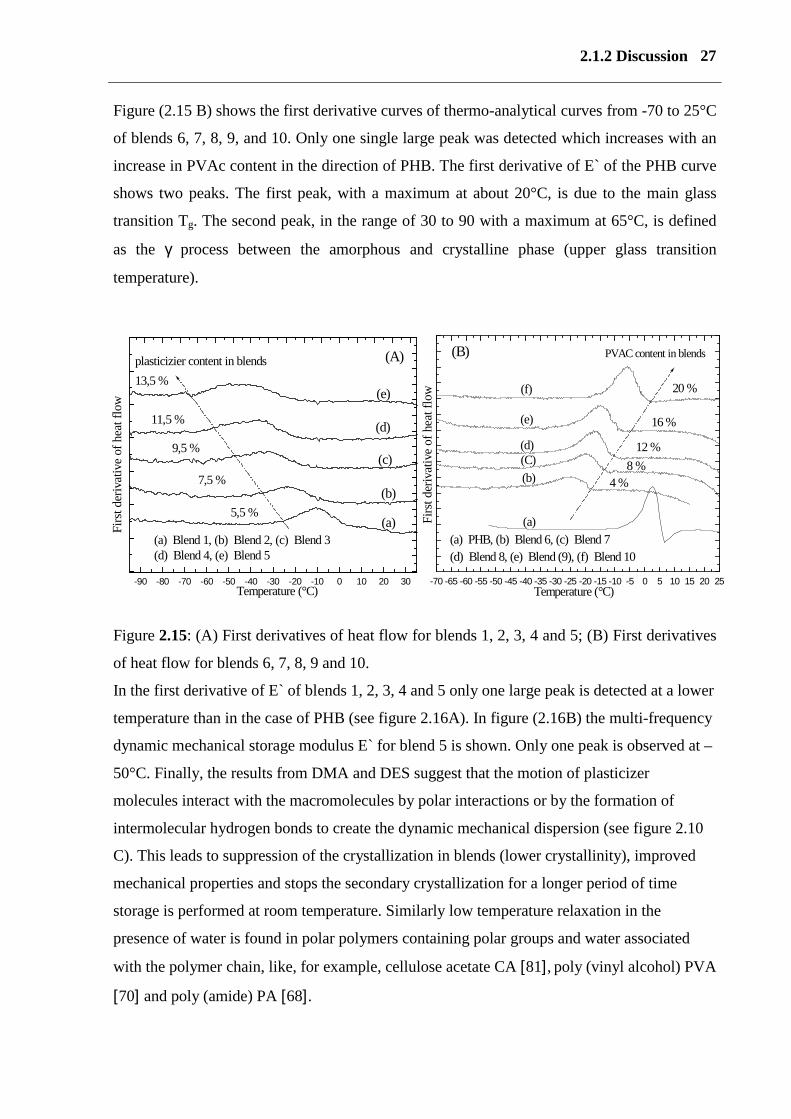
Figure (2.15 B) shows the first derivative curves of thermo-analytical curves from -70 to 25°C
of blends 6, 7, 8, 9, and 10. Only one single large peak was detected which increases with an
increase in PVAc content in the direction of PHB. The first derivative of E` of the PHB curve
shows two peaks. The first peak, with a maximum at about 20°C, is due to the main glass
transition Tg. The second peak, in the range of 30 to 90 with a maximum at 65°C, is defined
as the γ process between the amorphous and crystalline phase (upper glass transition
temperature).
Figure 2.15: (A) First derivatives of heat flow for blends 1, 2, 3, 4 and 5; (B) First derivatives
of heat flow for blends 6, 7, 8, 9 and 10.
In the first derivative of E` of blends 1, 2, 3, 4 and 5 only one large peak is detected at a lower
temperature than in the case of PHB (see figure 2.16A). In figure (2.16B) the multi-frequency
dynamic mechanical storage modulus E` for blend 5 is shown. Only one peak is observed at –
50°C. Finally, the results from DMA and DES suggest that the motion of plasticizer
molecules interact with the macromolecules by polar interactions or by the formation of
intermolecular hydrogen bonds to create the dynamic mechanical dispersion (see figure 2.10
C). This leads to suppression of the crystallization in blends (lower crystallinity), improved
mechanical properties and stops the secondary crystallization for a longer period of time
storage is performed at room temperature. Similarly low temperature relaxation in the
presence of water is found in polar polymers containing polar groups and water associated
with the polymer chain, like, for example, cellulose acetate CA [81], poly (vinyl alcohol) PVA
[70] and poly (amide) PA [68].
-70 -65 -60 -55 -50 -45 -40 -35 -30 -25 -20 -15 -10 -5 0 5 10 15 20 25
20 %
16 %
12 %8 %
4 %
(f)
(e)
(d)(C)(b)
(a)(a) PHB, (b) Blend 6, (c) Blend 7(d) Blend 8, (e) Blend (9), (f) Blend 10
Firs
t der
ivat
ive
of h
eat f
low
Temperature (°C)
PVAC content in blends(B)
-90 -80 -70 -60 -50 -40 -30 -20 -10 0 10 20 30
13,5 %
11,5 %
9,5 %
7,5 %
5,5 %
(A)
(a) Blend 1, (b) Blend 2, (c) Blend 3(d) Blend 4, (e) Blend 5
(e)
(d)
(c)
(b)
(a)Firs
t der
ivat
ive
of h
eat f
low
Temperature (°C)
plasticizier content in blends
28 Determination of the miscibility
Figure 2.16: (A) first derivatives of storage modulus E` for blends 1, 2, 3, 4 and 5; (B) first
derivatives of storage modulus E` multi-frequency for blend 5
2.2 From density measurements.
The DMA loss factor of PHB decreases to a lower value with ageing time. This effect
is associated with a larger content of the crystalline phase. Figure (2.12A) shows the loss
factor for PHB. The intensity of the α peak decreases, and the γ peak increases with
increasing storage time. Biddlestone et al.[82] studied the effect of physical ageing on
mechanical properties and found that the amorphous solid of PHB below its glass transition
changed during enthalpy relaxation. Secondary crystallization for PHB depends on inter-
lamellae glassy regions. The glass transition temperature of amorphous PHB is 3°C (DSC)
and 20°C (DMA, DES). New lamellae stacks are generated in amorphous domains and
increase the crystallinity and glass temperature [94,94a]. Density and crystallinity increase
with ageing at room temperature. Secondary crystallization occurs in the amorphous and
inter-crystalline regions and reduces the mobility of the amorphous regions. There are
changes in mechanical properties, the modulus increases, and, impact strength, and elongation
at break decrease [94,82]. The density of pure amorphous PHB was obtained from
dilatometric data and the crystalline density was measured by X-ray diffraction. The
crystallinity is calculated according to the following law:
XC (%) =)()(
ac
ac
ρρρρρρ
−−
Where ρa =1,177 g/cm3, ρc =1,260 g/cm3 [97]. The density decreased from 1,2320 for pure
PHB to 1,1867 g/cm3 for blend 10. Figure (5.17) shows in the case of PHB, density and
-100 -80 -60 -40 -20 0 20 40 60 80 100 120 140 160 180
(a) PHB, (b) Blend 1(c) Blend 2, (d) Blend 3(e) Blend 4, (f) Blend 5
(f)(e)
(d)(c)(b)(a)
Firs
t der
ivat
ive
of E
'
Temperature (°C)
(A)
-80 -60 -40 -20 0 20 40 60 80 100 120 140 160 180 200
(e)
(d)(c)
(b)(a)
(a) 0.3 Hz, (b) 1 Hz(c) 3 Hz, (d) 10 Hz, (e) 30 Hz
Firs
t der
ivat
ive
of E
' Temperature (°C)
(B)
Blend 5

2.2 From density measurements 29
crystallinity as functions of storage time. These increase with storage time, i.e., the material
crystallised after preparation. Blends do not change density with storage time at room
temperature.
Figure 2.17: density and crystallinity as a function of storage time for PHB and its blends.
2.3 From solid-state nuclear magnetic resonance spectroscopy (NMR)
The measurements of the Proton T1 relaxation time were performed using a Varian
INOVA 400 (400 MHz Proton-Larmor frequency) at room temperature. The proton (T1)
measurements were taken in an indirect way via 1H-13C-cross polarisation (CP) after an
Inversion Recovery experiment on the Proton channel. The MAS spinning speed of the
sample was 4 kHz. The contact time for (CP) is given in seconds. CH3 means the protons
within a CH3 group.
In this part of the study, the use of solid state NMR is reported. NMR is an important and very
sensitive method for determining the domain size and miscibility, which is not easy to
identify using conventional microscopic or thermal analysis. Figure (2.18) shows solid-state13C spectra for PHB, PVAc and blends 1-8. All of the additives are very well mixed with the
PHB matrix. In a blend, mixed closely together at a molecular level, domains should have the
same relaxation time. This is proof of good miscibility on a molecular level. If the size of the
two domains, in contact with each other, is small enough for effective spin diffusion, these
domains have the same 1H-T1 values. All peaks of PVAc, PHB and its blends show the same
chemical shift, becouce PHB and PVAc have the same isomer in chemical reapaet unit.
0,01 0,1 1 10 100
1,188
1,189
1,190
1,191
1,192
1,204
1,208
1,212
1,216
1,220
pure PHB based molasse Blend 10
Crys
talli
nity
(%
)
dens
ity (g
/cm
3
)
times ( days)29
30
31
32
51
54
57
60
30 Determination of the miscibility
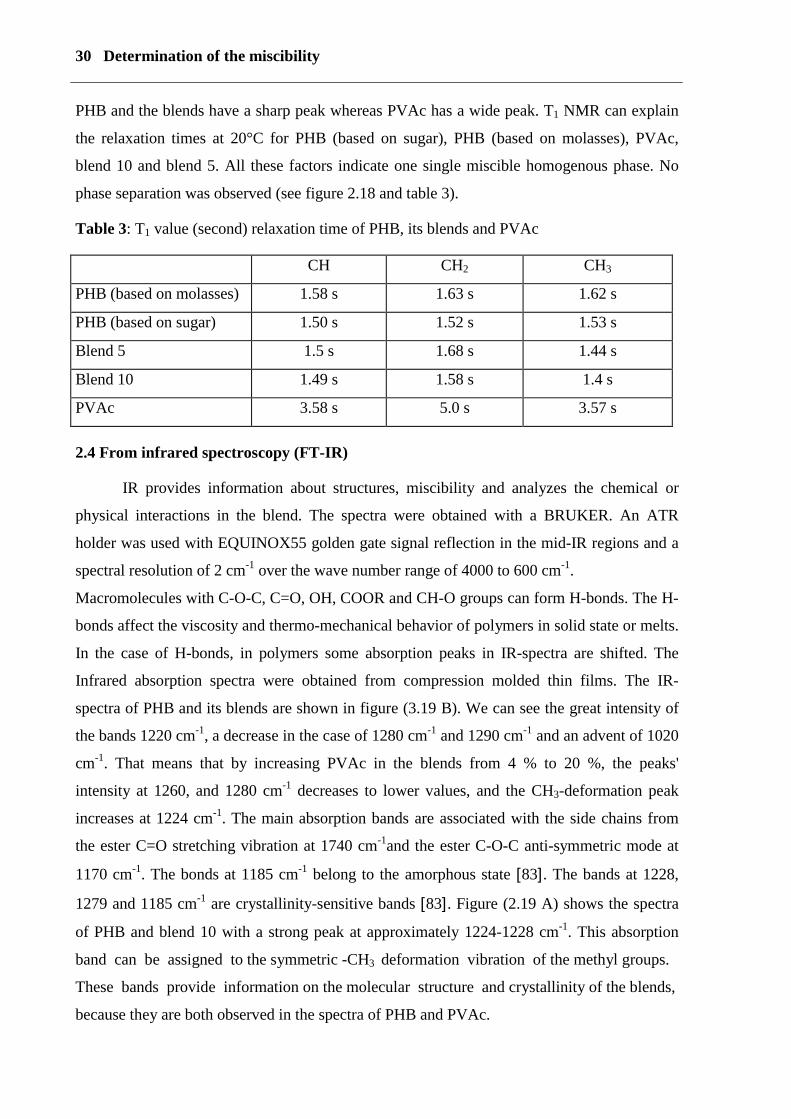
PHB and the blends have a sharp peak whereas PVAc has a wide peak. T1 NMR can explain
the relaxation times at 20°C for PHB (based on sugar), PHB (based on molasses), PVAc,
blend 10 and blend 5. All these factors indicate one single miscible homogenous phase. No
phase separation was observed (see figure 2.18 and table 3).
Table 3: T1 value (second) relaxation time of PHB, its blends and PVAc
CH CH2 CH3
PHB (based on molasses) 1.58 s 1.63 s 1.62 s
PHB (based on sugar) 1.50 s 1.52 s 1.53 s
Blend 5 1.5 s 1.68 s 1.44 s
Blend 10 1.49 s 1.58 s 1.4 s
PVAc 3.58 s 5.0 s 3.57 s
2.4 From infrared spectroscopy (FT-IR)
IR provides information about structures, miscibility and analyzes the chemical or
physical interactions in the blend. The spectra were obtained with a BRUKER. An ATR
holder was used with EQUINOX55 golden gate signal reflection in the mid-IR regions and a
spectral resolution of 2 cm-1 over the wave number range of 4000 to 600 cm-1.
Macromolecules with C-O-C, C=O, OH, COOR and CH-O groups can form H-bonds. The H-
bonds affect the viscosity and thermo-mechanical behavior of polymers in solid state or melts.
In the case of H-bonds, in polymers some absorption peaks in IR-spectra are shifted. The
Infrared absorption spectra were obtained from compression molded thin films. The IR-
spectra of PHB and its blends are shown in figure (3.19 B). We can see the great intensity of
the bands 1220 cm-1, a decrease in the case of 1280 cm-1 and 1290 cm-1 and an advent of 1020
cm-1. That means that by increasing PVAc in the blends from 4 % to 20 %, the peaks'
intensity at 1260, and 1280 cm-1 decreases to lower values, and the CH3-deformation peak
increases at 1224 cm-1. The main absorption bands are associated with the side chains from
the ester C=O stretching vibration at 1740 cm-1and the ester C-O-C anti-symmetric mode at
1170 cm-1. The bonds at 1185 cm-1 belong to the amorphous state [83]. The bands at 1228,
1279 and 1185 cm-1 are crystallinity-sensitive bands [83]. Figure (2.19 A) shows the spectra
of PHB and blend 10 with a strong peak at approximately 1224-1228 cm-1. This absorption
band can be assigned to the symmetric -CH3 deformation vibration of the methyl groups.
These bands provide information on the molecular structure and crystallinity of the blends,
because they are both observed in the spectra of PHB and PVAc.

2.3 From solid-state NMR measurements 31
Figure 2.18: 13 C NMR spectra for blends, PHB and PVAc.
ppm20406080100120140160180
PVAc
Blend 1
Blend 2
Blend 5
Blend 7
Blend 8
C=O CH CH2CH3
PHB

32 Determination of the miscibility
Figure 2.19: (A) FTIR spectra of PHB and blend 10.
Figure 2.19: (B) FTIR spectra PHB, the blends between 6-10 and PVAc
The intensity of carbonyl band (C=O) of PHB is at 1719 cm-1 with low shoulder at 1745 cm-1.
1140 1160 1180 1200 1220 1240 1260 1280 1300 13200,1
0,2
0,3
0,4
0,5
0,6
0,7
0,8
0,9
1,0
CH3 deformation
υ sC-O-C
υ asC-O-C
PHB Blend 6 Blend 7 Blend 8 Blend 9 Blend 10 PVAc
Abs
orba
nce
Uni
ts
Wavenumber cm -1
(B)
6 0 0 7 0 0 8 0 0 9 0 0 1 0 0 0 1 1 0 0 1 2 0 0 1 3 0 0 1 4 0 0 1 5 0 00 ,0
0 ,2
0 ,4
0 ,6
0 ,8C H 3 d e fo rm atio n
p u re P H B B len d 1 0
1 6 8 0 1 6 9 2 1 7 0 4 1 7 1 6 1 7 2 8 1 7 4 0 1 7 5 2 1 7 6 4 1 7 7 6 1 7 8 8 1 8 0 0
0 ,0
0 ,2
0 ,4
0 ,6
0 ,8
1 ,0
1 ,2C = O
2850 2900 2950 3000 30500,00
0,01
0,02
0,03
0,04
0,05
0,06
0,07
0,08
C H (a lp h a tic )
3300 3400 3500 3600 3700 3800 3900 40000,000
0,002
0,004
0,006
0,008
0,010
0,012
0,014
0,016
0,018
0,020
9 0 0 1 2 0 0 1 5 0 0 1 8 0 0 2 1 0 0 2 4 0 0 2 7 0 0 3 0 0 0 3 3 0 0 3 6 0 0 3 9 0 0
0 ,0
0 ,2
0 ,4
0 ,6
0 ,8
1 ,0
1 ,2
(A )
Abs
orba
nce
Uni
ts
C H (a lp h a tic ) O H
C = O
O H
Abs
orba
nce
Uni
ts
W av e n u m b er cm -1

2.5 From contact angle 33
Therefore PHB has broadband and the crystalline becomes large. The intensity of carbonyl
band (C=O) of blend 10 is at 1723 cm-1 with low shoulder at 1740 cm-1, which leads to the
crystalline of blend 10 becomes lower than PHB.
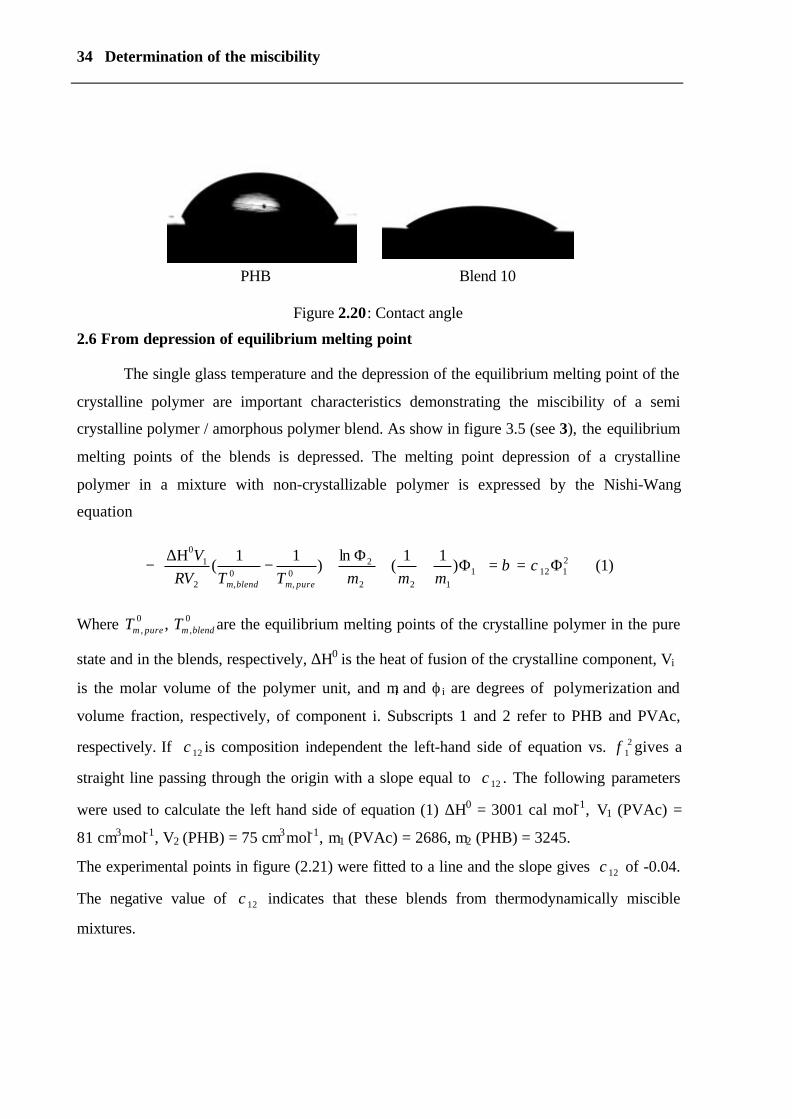
2.5 From contact angle
PHB and its blends were investigated at 20 °C by the sessile drop method, using an
optical contact angle measuring system. Bidistilled water was deposited on the film surface
with a micro-syringe. The value of each contact angle was calculated from 10 measurements
and finally the average values were calculated. The surface tension was calculated using the
geometric mean methods of Neumann [84-87].
The contact angle of liquid on solid is expressed by Young’s equation lssvlv γγθγ −=cos ,
where γsv and γlv are the surface tensions of solid and liquid, respectively. Good-Girifalko’s
equation expressed the relation between φ and interfacial tension γsl as
( )( ) 5.02 lvsv
sllvsv
γγγγγφ −+
= (1)
When γsv equals γlv the interfacial tension γsl between solid and liquid is at a minimum. Using
Neumann’s equation [84-87] [ ]2)(exp svlv γγβφ −−= , with β = 0.0001247 m2/mJ2 and yields
))(exp()(2)1(
)( 25.05.0
svlvlv
lvsv
casγγβγ
θγγ−−
+= (2)
This equation is solved by the iteration for γsv. In Table (4) and figure 2.20 the relationship
between water contact angle for PHB and its blends is shown. With increasing the content of
additives in the blends, the contact angle decreases and the polarity increases.
Table 4: Contact angle for PHB and its blends.
Sample Contact
angles
[°]
θcos Iteration Neumann=γ
[mN/m]
PHB 64.73 0.5365 44.94
Blend 6 57.55 0.4650 49.31
Blend 7 62.29 0.5937 46.45
Blend 8 53.58 0.7294 51.67
Blend 9 43.16 0.7375 57.64
Blend 10 42.47 0.7375 58.02
34 Determination of the miscibility
PHB Blend 10
Figure 2.20: Contact angle
2.6 From depression of equilibrium melting point
The single glass temperature and the depression of the equilibrium melting point of the
crystalline polymer are important characteristics demonstrating the miscibility of a semi
crystalline polymer / amorphous polymer blend. As show in figure 3.5 (see 3), the equilibrium
melting points of the blends is depressed. The melting point depression of a crystalline
polymer in a mixture with non-crystallizable polymer is expressed by the Nishi-Wang
equation
21121
122
20,
0,2
10
)11
(ln
)11
( Φ==
Φ++
Φ+−
∆Η− χβ
mmmTTRVV
puremblendm
(1)
Where 0, puremT , 0
,blendmT are the equilibrium melting points of the crystalline polymer in the pure
state and in the blends, respectively, ∆H0 is the heat of fusion of the crystalline component, Vi
is the molar volume of the polymer unit, and mi and ϕi are degrees of polymerization and
volume fraction, respectively, of component i. Subscripts 1 and 2 refer to PHB and PVAc,
respectively. If 12χ is composition independent the left-hand side of equation vs. 21φ gives a
straight line passing through the origin with a slope equal to 12χ . The following parameters
were used to calculate the left hand side of equation (1) ∆H0 = 3001 cal mol-1, V1 (PVAc) =
81 cm3mol-1, V2 (PHB) = 75 cm3mol-1, m1 (PVAc) = 2686, m2 (PHB) = 3245.
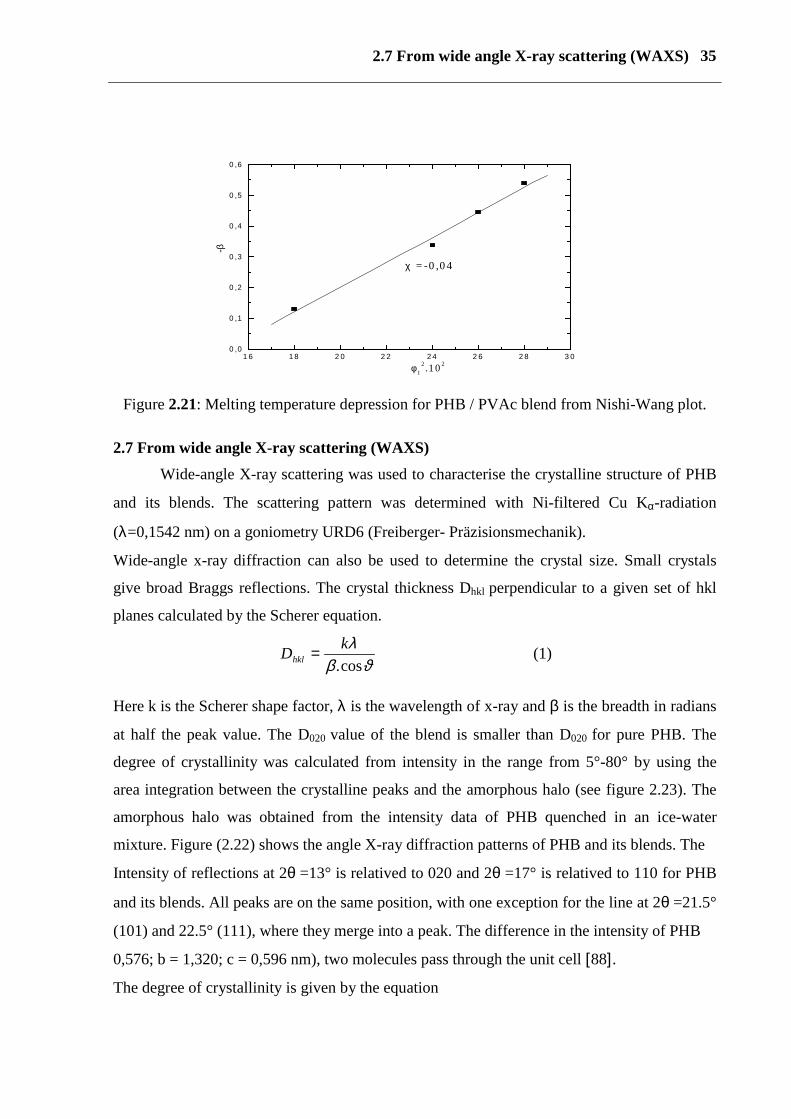
The experimental points in figure (2.21) were fitted to a line and the slope gives 12χ of -0.04.
The negative value of 12χ indicates that these blends from thermodynamically miscible
mixtures.
2.7 From wide angle X-ray scattering (WAXS) 35
Figure 2.21: Melting temperature depression for PHB / PVAc blend from Nishi-Wang plot.
2.7 From wide angle X-ray scattering (WAXS)Wide-angle X-ray scattering was used to characterise the crystalline structure of PHB
and its blends. The scattering pattern was determined with Ni-filtered Cu Kα-radiation
(λ=0,1542 nm) on a goniometry URD6 (Freiberger- Präzisionsmechanik).
Wide-angle x-ray diffraction can also be used to determine the crystal size. Small crystals
give broad Braggs reflections. The crystal thickness Dhkl perpendicular to a given set of hkl
planes calculated by the Scherer equation.
ϑβλ
cos.kDhkl = (1)
Here k is the Scherer shape factor, λ is the wavelength of x-ray and β is the breadth in radians
at half the peak value. The D020 value of the blend is smaller than D020 for pure PHB. The
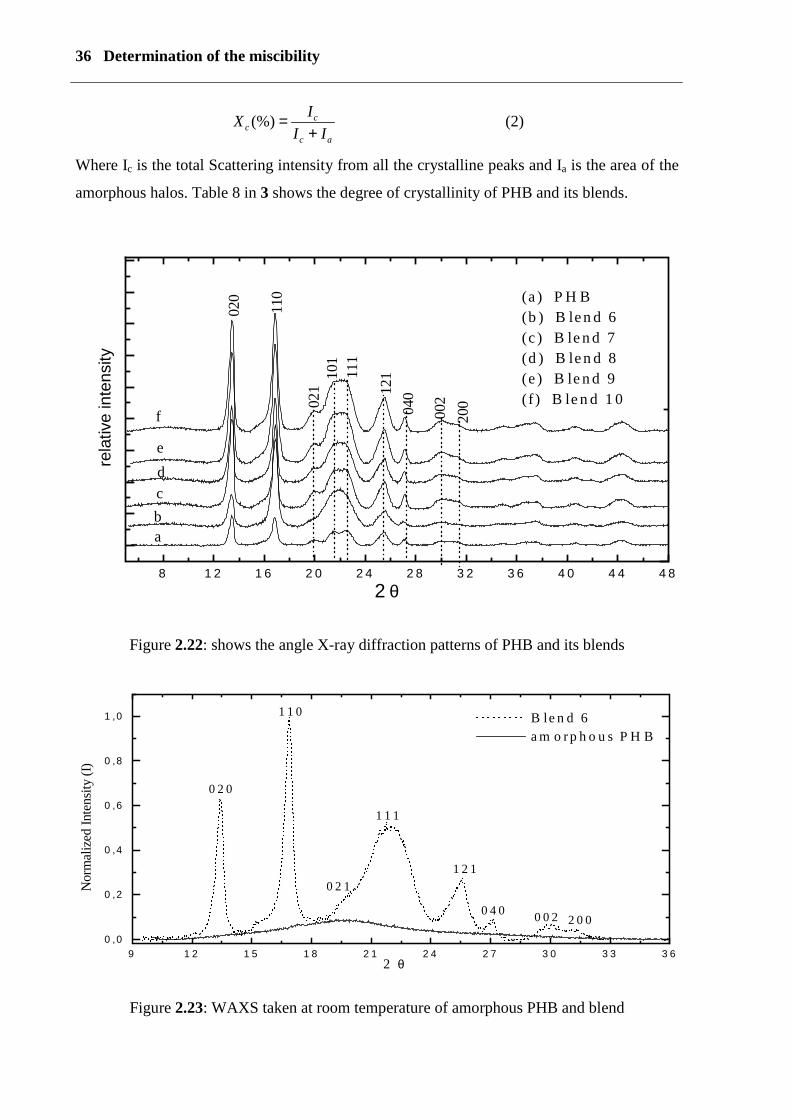
degree of crystallinity was calculated from intensity in the range from 5°-80° by using the
area integration between the crystalline peaks and the amorphous halo (see figure 2.23). The
amorphous halo was obtained from the intensity data of PHB quenched in an ice-water
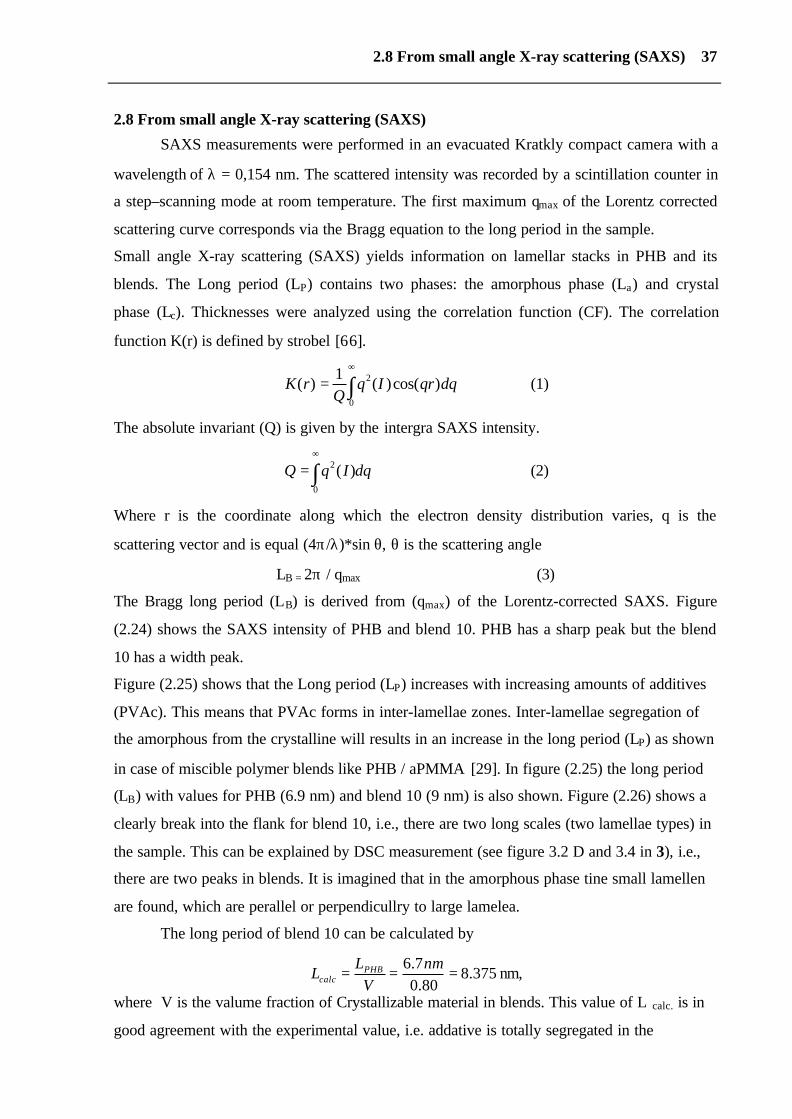
mixture. Figure (2.22) shows the angle X-ray diffraction patterns of PHB and its blends. The
Intensity of reflections at 2θ =13° is relatived to 020 and 2θ =17° is relatived to 110 for PHB
and its blends. All peaks are on the same position, with one exception for the line at 2θ =21.5°
(101) and 22.5° (111), where they merge into a peak. The difference in the intensity of PHB
0,576; b = 1,320; c = 0,596 nm), two molecules pass through the unit cell [88].
The degree of crystallinity is given by the equation
1 6 1 8 2 0 2 2 2 4 2 6 2 8 3 00 ,0
0 ,1
0 ,2
0 ,3
0 ,4
0 ,5
0 ,6
-β
φ12 .1 0 2
χ = -0 ,0 4
36 Determination of the miscibility
ac
cc II
IX+
=(%) (2)
Where Ic is the total Scattering intensity from all the crystalline peaks and Ia is the area of the
amorphous halos. Table 8 in 3 shows the degree of crystallinity of PHB and its blends.
Figure 2.22: shows the angle X-ray diffraction patterns of PHB and its blends
Figure 2.23: WAXS taken at room temperature of amorphous PHB and blend
9 1 2 1 5 1 8 2 1 2 4 2 7 3 0 3 3 3 60 ,0
0 ,2
0 ,4
0 ,6
0 ,8
1 ,0
2 0 00 0 20 4 0
1 2 10 2 1
1 1 1
1 1 0
0 2 0
B le n d 6 a m o r p h o u s P H B
Nor
mal
ized
Inte
nsity
(I)
2 θ
8 1 2 1 6 2 0 2 4 2 8 3 2 3 6 4 0 4 4 4 8
101
( a ) P H B(b ) B le n d 6(c ) B le n d 7(d ) B le n d 8(e ) B le n d 9(f ) B le n d 1 0
2 θ
dcba
04012
1111
021
110
020
rela
tive
inte
nsity
200
002
f
e
2.8 From small angle X-ray scattering (SAXS) 37
2.8 From small angle X-ray scattering (SAXS)
SAXS measurements were performed in an evacuated Kratkly compact camera with a
wavelength of λ = 0,154 nm. The scattered intensity was recorded by a scintillation counter in
a step–scanning mode at room temperature. The first maximum qmax of the Lorentz corrected
scattering curve corresponds via the Bragg equation to the long period in the sample.
Small angle X-ray scattering (SAXS) yields information on lamellar stacks in PHB and its
blends. The Long period (LP) contains two phases: the amorphous phase (La) and crystal
phase (Lc). Thicknesses were analyzed using the correlation function (CF). The correlation
function K(r) is defined by strobel [66].
dqqrIqQ
rK )cos()(1
)(0
2∫∞
= (1)
The absolute invariant (Q) is given by the intergra SAXS intensity.
dqIqQ )(0
2∫∞
= (2)
Where r is the coordinate along which the electron density distribution varies, q is the
scattering vector and is equal (4π/λ)*sin θ, θ is the scattering angle
LB = 2π / qmax (3)
The Bragg long period (LB) is derived from (qmax) of the Lorentz-corrected SAXS. Figure
(2.24) shows the SAXS intensity of PHB and blend 10. PHB has a sharp peak but the blend
10 has a width peak.
Figure (2.25) shows that the Long period (LP) increases with increasing amounts of additives
(PVAc). This means that PVAc forms in inter-lamellae zones. Inter-lamellae segregation of
the amorphous from the crystalline will results in an increase in the long period (LP) as shown
in case of miscible polymer blends like PHB / aPMMA [29]. In figure (2.25) the long period
(LB) with values for PHB (6.9 nm) and blend 10 (9 nm) is also shown. Figure (2.26) shows a
clearly break into the flank for blend 10, i.e., there are two long scales (two lamellae types) in
the sample. This can be explained by DSC measurement (see figure 3.2 D and 3.4 in 3), i.e.,
there are two peaks in blends. It is imagined that in the amorphous phase tine small lamellen
are found, which are perallel or perpendicullry to large lamelea.
The long period of blend 10 can be calculated by
375.880.0
7.6===
nmV
LL PHB
calc nm,
where V is the valume fraction of Crystallizable material in blends. This value of L calc. is in
good agreement with the experimental value, i.e. addative is totally segregated in the

38 Determination of the miscibility
amorphous PHB interlameller regions. The amorhous component in the blend has lower glas
transition than the crystallizing polymer.
Figure 2.24: Small angle X-ray scattering of PHB and blend 10.
Figure 2.25: Lorentz-corrected scattering curve for PHB and blend 10
0,1 1
PH B B lend 10
Log
I(Q)[a
.u.]
q [nm -1]
0 ,0 0,3 0,6 0,9 1,2 1,5 1,8 2,1 2,4
PHB
q = 0.91 nm -1, L B=6.9 nm B lend 10
q = 0.7 nm -1, L B=9 nm
I*q2 [a
.u.]
q [nm -1]

2.8 From small angle X-ray scattering (SAXS) 39
Figure 2.26: one dimensional correlation function of SAXS profiles for PHB and blend 10 at
room temperature.
2.9 From morphology
The morphology of PHB and its blends can be assessed using microscopic methods
like, for instance, POM, SEM, AFM and TEM. Static and dynamic studies of the structure
and the crystallization of semi-crystalline polymers play an important role in the
understanding of the solid-state properties of polymers. The mechanical properties of the
blends are connected with the morphology that develops during cooling from the melt
(crystallization condition). PHB and its blends are crystallized from the melt after cooling as
spherulites. The spherulites' size depends on the cooling rate, nucleation density and
crystallization temperature. The spherulites consist of an aggregate of ribbon-like chain folded
crystallites (lamellae). Fibrils are 10-20 µm thick, and radiate outwards from its center. A tie-
chain molecule acts as a connection between the lamellae. The spherulites are formed by
nucleation at different points in the sample and grow as spherical entities. The growth of the
spherulites is stopped when impingement of adjacent spherulites occurs. The non-oriented
crystalline polymer is obtained by quenching from the isotropic melt. The lamellae can be
seen by electron microscopy. The crystallization starts on the surface where the melt is cooler.
0 1 2 3 4 5 6 7 8 9 10 11 12 13 14 15
-2
0
2
4
6
Lc
Break
Lac
Blend 10Lp : 7.9 nm, Lc : 2.9 nm, Lac : 2.2 nm,
PHBLp : 6.7 nm, Lc : 2.0 nm, Lac : 1.45 nm
LP
LP
Lac
Lc
corre
latio
n fu
nctio
n
L [nm]

40 Determination of the miscibility
PHB is 80-70% crystalline and, therefore, the amorphous chains cannot move, because the
amorphous layer between crystals is thin. The crystals' size depends on the crystallization
temperature and molecular weight. The crystal’ thickness can be determined by small angle
X-ray scattering (SAXS). The spherulites are viewed between crossed polarizes. The cross
arises from the coincidence of the principal axis of the crystal indicatory with the extinction
direction of the polarizer or analyzer. It is very easy to demonstrate that the chains are
arranged circumferentially within the spherulites. Therefore, the lamellae are arranged
radially, i.e., there are regular twists in the radiating lamellae. Many other types of crystalline
aggregates are related to the spherulites. Spherulites are nucleated by the presence of foreign
linear nuclei.
2.9.1 Experimental methods
2.9.1.1 Polarization optical microscopy (POM)
Optical microscopy is used to study microstructure and morphology. Using POM,
sample preparation is easy and information about morpholog is quickly obtained in a
micrometer-scale. Using POM, crystal, spherulite, and nucleation density can be estimated.
The morphology of PHB and its blends was observed on thin films using an optical
microscope (type Jenapol) with an automatic hot stage Mettler model FP 84, controlled by a
Mettler FP 90 control process. The samples placed between two glass covers were heated, at
195°C (for 2 min.) at a heating rate of 2°C min-1, from room temperature to 195°C, and
cooled at 10°C min-1 to crystallization temperature.
2.9.1.2 Scanning electron microscopy (SEM)
SEM provides information on the microstructure of the blends from the scale of a few
molecules. SEM requires special sample preparation. JEOL 6300 Scanning electron
microscopy was used to investigate the morphology, and fractured surfaces of the blends. The
specimens were sputter coated with gold.
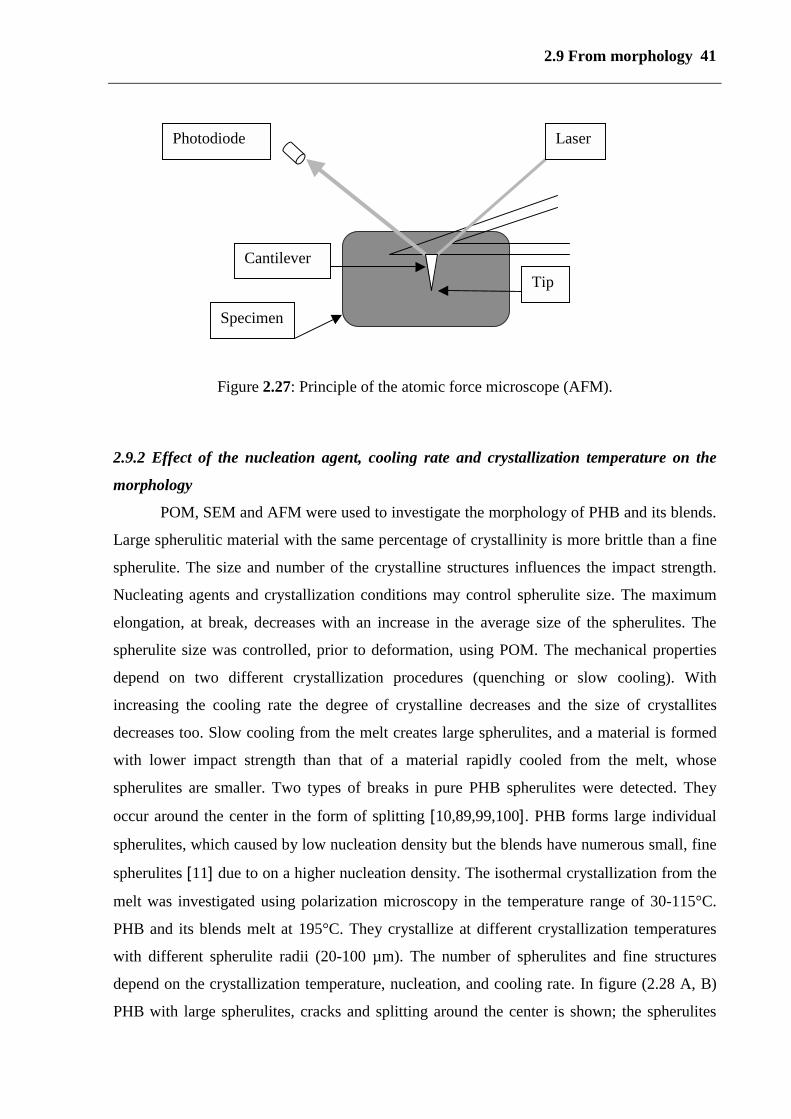
2.9.1.3 Atomic force microscopy (AFM)
The surface morphology was investigated by AFM using Digital Instruments Nano
Scope III a multimode operated with a silicon cantilever in the tapping mode at room
temperature. The scanning direction was horizontal or parallel to the long axis of the
cantilever (see figure 2.27). Samples were prepared by solution casting of thin films (100-120
nm) on freshly cleaved mica. As a solvent, chloroform was used at 60°C, the solution cast
films were heated to 200°C and held for 2 min and quenched at room temperature.
2.9 From morphology 41
Figure 2.27: Principle of the atomic force microscope (AFM).
2.9.2 Effect of the nucleation agent, cooling rate and crystallization temperature on the
morphology
POM, SEM and AFM were used to investigate the morphology of PHB and its blends.
Large spherulitic material with the same percentage of crystallinity is more brittle than a fine
spherulite. The size and number of the crystalline structures influences the impact strength.
Nucleating agents and crystallization conditions may control spherulite size. The maximum
elongation, at break, decreases with an increase in the average size of the spherulites. The
spherulite size was controlled, prior to deformation, using POM. The mechanical properties
depend on two different crystallization procedures (quenching or slow cooling). With
increasing the cooling rate the degree of crystalline decreases and the size of crystallites
decreases too. Slow cooling from the melt creates large spherulites, and a material is formed
with lower impact strength than that of a material rapidly cooled from the melt, whose
spherulites are smaller. Two types of breaks in pure PHB spherulites were detected. They
occur around the center in the form of splitting [10,89,99,100]. PHB forms large individual
spherulites, which caused by low nucleation density but the blends have numerous small, fine
spherulites [11] due to on a higher nucleation density. The isothermal crystallization from the
melt was investigated using polarization microscopy in the temperature range of 30-115°C.
PHB and its blends melt at 195°C. They crystallize at different crystallization temperatures
with different spherulite radii (20-100 µm). The number of spherulites and fine structures
depend on the crystallization temperature, nucleation, and cooling rate. In figure (2.28 A, B)
PHB with large spherulites, cracks and splitting around the center is shown; the spherulites
Laser
TipCantilever
Photodiode
Specimen
42 Determination of the miscibility
growth as radial band. These large spherulites of PHB weaken the mechanical properties
[10,100]. Figure (2.28 C, D) shows the isothermal crystallization at 80°C of blends 6 and 7.
Figure (2.28 E) shows polarized optical micrographs of blend 9 during cooling at 10 Kmin-1
with fine grain spherulitic structures. In the slowly cooled specimens, it was observed that the
degree of crystallinity is higher than in the samples rapidly cooled from the melt (see table 7,
in 3). By means of nucleation, crystallization is accelerated and the size of the spherulites is
reduced. By increasing the crystallization temperature, the number of spherulites was
lowered, and the size of the spherulites increased. PHB-spherulites grow with radial bands,
and are large (see figure 2.28 A). However, the blends form numerous smaller, non-banded
spherulites. Figure (2.28 F) shows blend 9 at 40°C isothermal crystallization, and
transcrystalline growth around a cellulose fibre. It can to be seen clearly that the spherulites
grow transverse to the direction of the fibre. The mechanical properties of blends are greatly
influenced by crystallization conditions (morphological factors) such as crystalline, lamellar
structure, spherulitic macrostructure and melting behaviors. Figure (2.29 A, B, C) shows
polarized optical micrographs of the spherulitic macrostructure of blends 8, 9 and 10 for
various blend compositions during isothermal crystallization at 80°C. The spherulitic
macrostructure in the blends is a non-banded spherulite. Figure (2.30 A) shows scanning
electron micrographs of blend 9 non-banded spherulites. Samples were prepared in the form
of small injection molded bars at a tool temperature of 80°C. Figure (2.29 D) shows polarized
optical micrographs of the spherulitic macrostructure of blend 10 at isothermal crystallization
at 100°C; the spherulitic macrostructure is a banded spherulite The transition from 90°C to
100°C is as the circular spherulites, but the sharp rings are not clearly. In figure (2.30 C) is
shown by isothermal crystallization of blend 5, the large spherulites grow during 115 °C and
the transition between large spherulite to small spherulite (110°C-90°C) as banded spherulite
and small spherulites between 80°C-30°C as non-banded spherulite. In figure (2.30 C) shows
the large spherulites as bright areas, that clearly to see in the figure (2.29 F) with other
birefringence than the small spherulites, i.e., at low crystallization temperatures the lamellae
grow in a direction and in the large spherulites the lamellae are twisting. At 120°C very sharp
circular spherulite are to be seen. Figure (2.29 E) shows polarized optical micrographs of the
blend 10. At first the spherulites grow at 100°C to develop into large spherulite. The
remainder of the sample, i.e., those not directly next to the large spherulite, cool down fast
and produce fine grain spherulitic structures, which are good for mechanical properties. A
material is certainly brittle if the sample has larger spherulites and same crystallinity degrees
as fine spherulites. It has been found in the slowly cooled specimens that the degree of

2.9 From morphology 43
crystallinity is higher in the samples rapidly cooled after the melts (see table 7, in 3). Figure
(2.29 F) shows that blend 5 spherulites grow banded spherulites above 100°C as a spiral with
twisting lamellae, as do PE, PPO, and PVDF. Figure (2.29 C) shows that blend 5 spherulites
grow non-banded spherulites under 90°C. These spherulites have a fibrous texture like PP and
PEO. The fine structure depends on the crystallization temperature and nucleation density.
Keith et al. [90] and Singfield et al. [91] reported that the lamellae twist in PHB, because PHB
has a biaxial crystal. The reason for this spiral is the tilting of the lamellae with respect to the
plane of the film. Initially the spherulite is grown as a crystal-sheaf and becomes twisted
around the long axis. This twist on the sheaf leads to the formation of a spiral. Spirals can be
observed in helicoidally twisted crystallites, with a perfect spherulite around them (circle
circumference) and thickness of the film. There is a difference between banded spherulites, of
which two locked spirals exist. Singfield et al. [91a] reported that poly(R-epichlorohydrin)
(PRECH) and poly(S-epichlorohydrin) (PSECH) formed banded spherulite but their blend
(equimolar) formed nan-banded spherulite.
The blends grow banded spherulites at above 100°C. Fibrous texture (non-banded spherulites)
forms by lowering the crystallization temperature to less than 90°C, as in the case of
polypropylene PP. Figure (2.30 B) shows the thin cross-microtomed section granulates of
blend 5 in a solid state with homogenous surfaces without the presence of any domain or
particles. Owen et al. [92] reported that the twist banding in PHB spherulites is due to elastic
banding of radial- oriented lamellae ribbons, where the folding directions, on the opposite
face of the lamellae, are orthogonal and inclined to the radial direction.
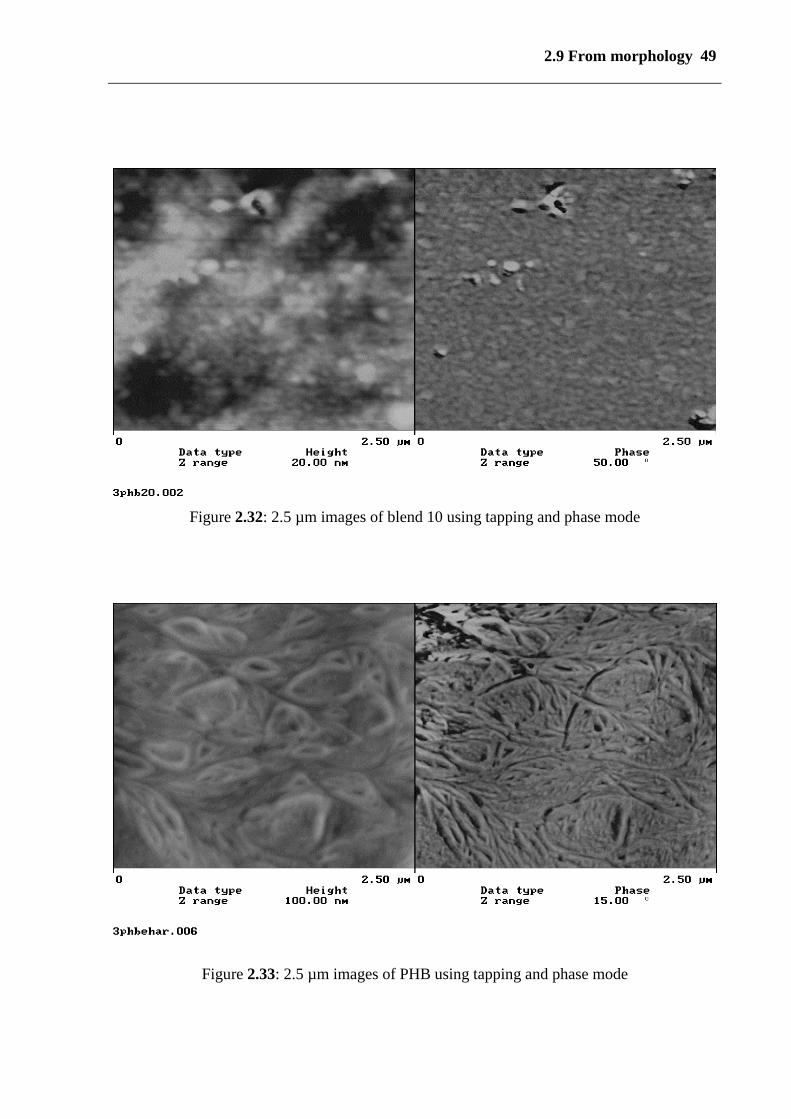
High-resolution images of surface morphology of solution cast films were obtained by AFM.
AFM requires no sample preparation procedure and provides information on the sample
surface. In Figures (2.32 and 3.33) tapping mode images of PHB, blend 9 and blend 10 are
given with scan widths of 2.5 µm and 1.35 µm, respectively. Whereas ``height images``
display the height profile topography of samples surface ``phase images`` allow us to
distinguish softer and harder components of the material, as there are crystallic and
amorphous portions in semi-crystalline polymers, i.e., the contrast between the amorphous
(soft) and crystalline phase (hart) is bigger near the surface. In the case of blends 9 and 10 no
heterogeneous structures on the length scale 1.35 and 2.5 µm were found in either topographic
and phase images (see figure 2.34 and 2.32), i.e., no micro domains were detected, i.e., it can
be noted that the components are very good when mixed on a molecular level. Figure (2.33)
shows for PHB, a mainly even surface structure. Figure (2.34) shows a 1.35 µm tapping mode

44 Determination of the miscibility
AFM height image of blend 9. The phase contrast between bright and dark phase regions was
found to be around 10 nm.
Figure (2.35) shows a 2.5 µm tapping mode AFM height image of the surface of blend 5. In
blend 5, micro-domains are to be found in the range of 10-100 nm. This is connected to the
increasing plasticizer content or it could not be mixed to this place correct, because the
measurements from DMA, DSC and NMR show more only one-phase system. The bright
crystalline phase are built in the dark amorphous phase. DSC measurement shows, that both
the Tm and Tg of the blends are much smaller than that of PHB, i.e., the blends are miscible.
This miscibility is clear from AFM images, POM, SEM, DSC, DMA, DES and NMR.
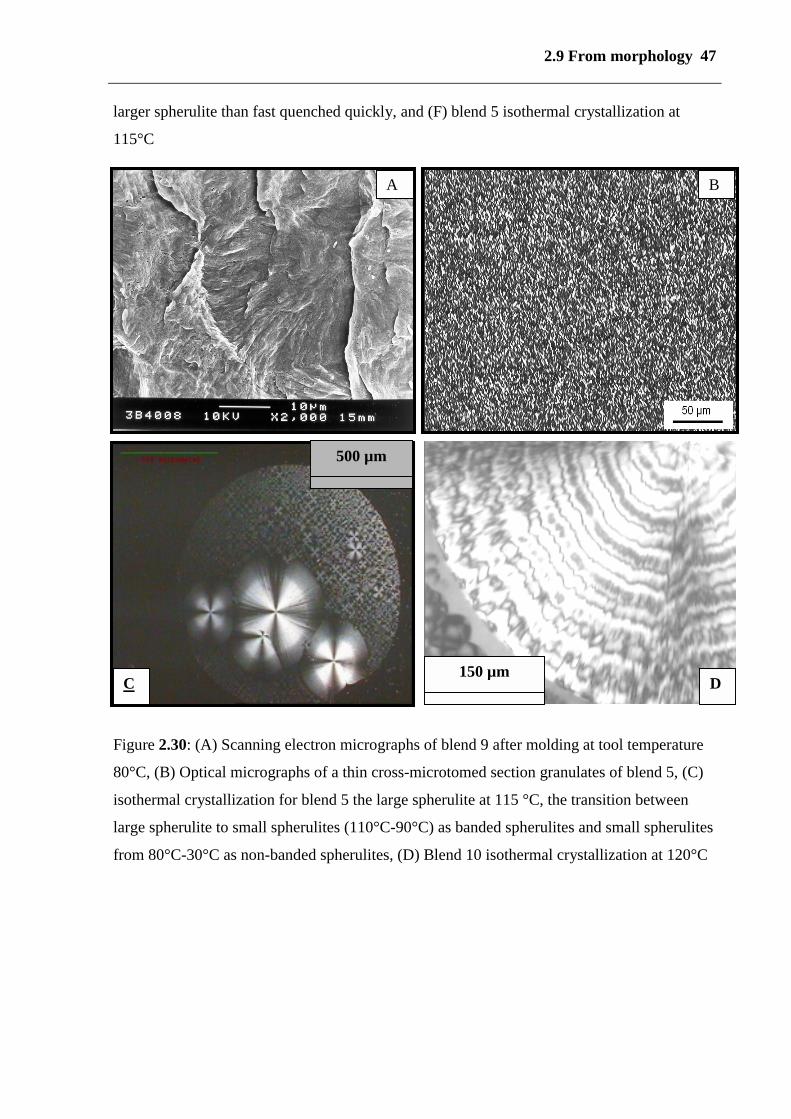
2.9.3 Growth rate of spherulites
The linear crystal growth rates of PHB and its blends at different crystallization
temperatures were measured by POM with a CCD camera and TV. The rates were calibrated
using a commercial standard micro-scale. Figure (2.28 F) shows that the spherulitic
morphologies of its blends were small and fine at room temperature, and that it was difficult
to observe the spherulitic morphology. All blends exhibited spherulitic morphologies and no
domains were found in the spherulites. All blends having spherulitic morphologies showed a
maltese cross when the crystallization temperature Tc > = 100°C (banded spherulites) was
increased and the band spacing of the blends spherulites increased with an increase in (Tc).
The banded spherulitic structures originated from the twisted lamellae in the blends (see page
48), and the band spacing usually decreases by decreasing the Tc. With a decrease in the
crystal growth rate, it was observed that the band spacing increases. The diameter (L) of
isothermally crystallized spherulites increased linear to crystallization time. The growth rate
(G) was calculated as G = dL/dt for various crystallization temperatures (Tc). The results for
PHB and its blends are shown in Figure (2.31). The value of G was independent of the size of
the spherulites. The growth rate G of PHB is 3.5 µm/s and the blends decrease with increasing
additive content.

2.9 From morphology 45
Figure 2.28: shows polarizing optical micrographs of PHB and its blends, (A) PHB isothermal
crystallization at 100 °C, (B) PHB isothermal crystallization at 80°C, (C) blend 6 isothermal
crystallization at 80°C, (D) blend 7 isothermal crystallization at 80°C, (E) blend 9 fast cooling
(quenched), and (F) blend 9 isothermal crystallization at 40°C with cellulose fibre.
E F
A B
100 µm 100 µm
50 µm
50 µm 50 µm
C D
50 µm

46 Determination of the miscibility
Figure (2.29) (A) blend 8 isothermal crystallization at 80°C, (B) Blend 9 isothermal
crystallization at 80°C, (C) blend 10 isothermal crystallization at 80°C, (D) blend 10
isothermal crystallization at 80°C (E) blend 10 isothermal crystallization at 100°C to develop
50 µm
A
50 µm
B
50 µm
50 µm
50 µm
FE
C D
2.9 From morphology 47
larger spherulite than fast quenched quickly, and (F) blend 5 isothermal crystallization at
115°C
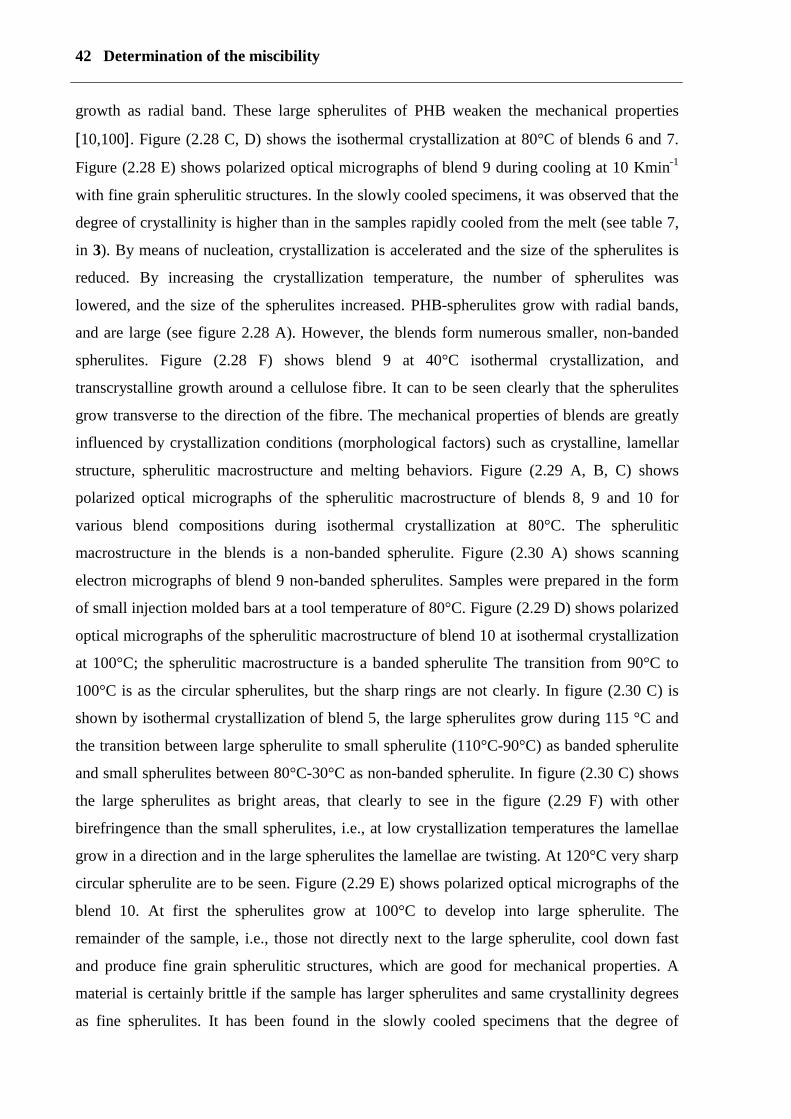
Figure 2.30: (A) Scanning electron micrographs of blend 9 after molding at tool temperature
80°C, (B) Optical micrographs of a thin cross-microtomed section granulates of blend 5, (C)
isothermal crystallization for blend 5 the large spherulite at 115 °C, the transition between
large spherulite to small spherulites (110°C-90°C) as banded spherulites and small spherulites
from 80°C-30°C as non-banded spherulites, (D) Blend 10 isothermal crystallization at 120°C
500 µm
A B
150 µmC D
48 Determination of the miscibility
Figure 2.31: spherulitic growth rate (G) of PHB and its blends versus crystallization
temperature.
2.9.4 BirefringenceBirefringence measurements can be mode in a polarized light microscopy using
analyser and polarizer (crossed angle 45°). The sample lies between Analyser and polarizer.
The compensator lies between analyser and sample and makes change in the optical
retardation of the vertically and herizontically polarized light components. The change in
optical retardation is achieved by rotation of the plate (refractive index). The birefringence ∆n
=n3-n1 is calculated from measured the optical retardation (R31) as follows.
∆n = R31λ / d,
where λ is the wavelength of the light and d is the sample thickness.
The birefringence (∆n) of blend 10 is shown in figures 2.28, 2.29 and 2.30. The birefringence
(∆n) of blend 10 is smaller at 80°C (0.00088 nm) than at 40°C (0.0025nm). The value of
birefringence (∆n) at 120°C is obtained at a higher crystallization temperature (Tc) (see Figure
2.30 D) with larger spherulites. In the large spherulite there are two bands: the bright band is
optically positive and ∆n is equal 0.0054 nm but the dark band is optically negative and ∆n is
equal 0.0065 nm. PHB has a biaxial optical crystal, but the blends have uniaxial optical
crystals, therefore PHB is a brittle polymer, beside the other causes, which are written (see
page 90-94 in 5) and its blend are elastic and ductile polymers
40 60 80 100 120
0,0
0,5
1,0
1,5
2,0
2,5
3,0
3,5 PHB Blend 6 Blend 7 Blend 8 Blend 9
Gro
wth
rate
(µm
/s)
Temperature (°C)
2.9 From morphology 49
Figure 2.32: 2.5 µm images of blend 10 using tapping and phase mode
Figure 2.33: 2.5 µm images of PHB using tapping and phase mode

50 Determination of the miscibility
Figure (4.7B) 1.35 µm images of blend 9 using tapping and phase modeFigure (4.7C) 2.5 µm images of blend 10 using tapping and phase mode
Figure (2.34) 1.35 µm images of blend 9 using tapping and phase mode
Figure 2.34: 2.5 µm images of blend 9 using tapping and phase mode.

2.9 From morphology 51
Figure 2.35: 2.5 µm images of blend 5 using tapping and phase mode.
2.10 Conclusions to 2
1. The damping loss tangent factor of PHB decreases and the density or the crystallinity
increases with storage time at ambient temperature, reasons PHB crystallises
(secondary crystallisation) in the amorphous phase. The blends do not crystallise at
room temperature and remain stable, i.e., there is no change in the mechanical
properties after preparation (see 5).
2. As a result of DSC, DMA, DES, the first derivative of E` and the first derivative of the
heat flow show that PHB with additives is miscible with low molecular weight
additives. But blends 2, 3, 4, 5, 6, 7 and 8 having a higher additive and plasticizer
content, respectively (7.5, 9.5, 11.5 and 13.5 wt %) show from loss modulus E`` one
peak at a low temperature (frequency-dependent) and a shoulder at 0 °C. However,
this is very weak (not frequency-dependent). DES measurements in blends 8 and 9
showed that by increasing the plasticizer concentration, the β process shifts to a low
temperature - 40°C (10 Hz) and – 30 (100 Hz) and showed large peaks (glass
temperature) at –5 °C (11 Hz) and 0 °C (1 Hz). In the blends with higher additives,
and plasticizer content, respectively (7.5-13.5) the α-process exchange together with β
process is shown using DMA. This depends on the plasticizer content and new advent
as a shoulder at 0 °C. Using DMA three relaxation processes were detected in blends

52 Determination of the miscibility
1, 9 and 10; the local process being at -50 the main glass temperature at between -
20°C and -10°C, and the crystalline phase process at 120°C. However, in pure PHB,
only two processes were observed. The main glass temperature was 20 °C and the
crystalline phase occurred at 120°C. Only one phase was observed for blends. DSC,
DMA and DES yielded one glass temperature. Finally, three relaxation processes for
blends were found in both DES and DMA.
3. The fractured surfaces of the blends were homogenous, and POM, SEM and AFM
measurement did not detect phase separation. All peaks from NMR in PVAc, PHB,
and blends exhibited chemical shift. With increasing PVAc from 4 % to 20 %in blends
6, 7, 8, 9 and 10, the peaks’ intensity from FT-IR at 1260 cm-1, 1280 cm-1 decreased to
lower values and the CH3 deformation peak increases to 1224 cm-1. All additive were
very well mixed with the PHB matrix.
4. All peaks are in same position line only with exception of the line at 2θ =21.5° (101)
and 22.5° (111). They merge together into a peak. The difference of the intensity of
PHB and its blend depends on the peak intensity and the different degrees of
orientation of the crystalline lamellae. The peak intensity at 2θ =13° and 2θ = 17° in
blends is as large as that in PHB. There are two long scales (two lamellae type) from
SAXS in the blends. This can be explained by DSC measurement, that there are two
peaks in blends.
5. The addition of the nucleation agents increases the number of spherulites with a
smaller diameter. Nucleation affects the texture of the spherulite. The crystallinity and
size of the crystals depends on the cooling rate from the melt and the crystallization
temperatures. Fast cooling from the melt created numerous, small spherulites. This
means that mechanical properties are improved [see page 90-94 in 5].
6. It was discovered that the blends form non-banded spherulites at a lower
crystallization temperature, and banded spherulites (spirals) at a higher crystallization
temperature. The spherulites of PHB and its blends grow linearly with crystallization
time, and the growth rate decreases with a rise in the additive and crystallization
temperature.
7. The birefringence (∆n) of blend 10 is smaller at 80°C (0.00088 nm) than at 40°C
(0.0025nm). The value of birefringence (∆n) at 115°C is obtained at higher
crystallization temperatures (Tc) with larger spherulites. In the large spherulites two
bands are found: the bright band is optically positive and ∆n has the value 0.0054 nm
but the dark band is optically negative and ∆n has the value 0.0065 nm.