2 annual report 2010
TRANSCRIPT


AccEss This REPORT ONLiNEWintec is one of the first organisations in the country
to utilise QR codes – a type of barcode that gives quick
and easy access to information via mobile. Our emerging
technologies centre is championing the use of QR codes
as part of our mobile learning strategy.
Wintec
Private Bag 3086, Waikato Mail Centre, Hamilton 3240
07 834 8800, www.wintec.ac.nz
2 Annual Report 2010

OVERViEW OF WiNTEc 5
sTRATEGic DiREcTiON 8
MEMBERs OF cOUNciL 10
chAiR’s & chiEF ExEcUTiVE’s REPORT 11
hiGhLiGhTs 17
EQUAL OPPORTUNiTiEs 25
FiNANciAL PERFORMANcE 29
– sTATEMENT OF REsPONsiBiLiTy 30
– AUDiT REPORT 31
AcKNOWLEDGEMENTs 88
cONTENTs
3www.wintec.ac.nz

tO Build A stROngeR COMMunity tHROugH eduCAtiOn, ReseARCH And CAReeR develOPMent.
Ma te matauranga, te rangahau, me te whai mahi e ora ai te iwi.
OUR MissiON
4 Annual Report 2010

OVERViEW
5www.wintec.ac.nz

1924 Hamilton technical College is founded to provide technical and trades training in the Waikato region.
1992 First degree (Bachelor of Business) is offered.
1990 satellite campuses opened in te Kuiti and thames.
1968 name changes to Waikato technical institute, with a wide range of programmes in engineering, science, accountancy, business management and building trades.
1985 Horticulture teaching begins at Hamilton gardens.
1987 name changes to the Waikato Polytechnic to reflect the widening scope of our educational activities.
1990s Following government tertiary reforms, the institute becomes a body corporate with a Chief executive and Council. A range of degrees in nursing, midwifery, business, sport and exercise science, information technology and media arts are developed in response to changing employment needs.
As an award-winning institute of technology with more than 80 years experience providing quality education and training, we are proud to be an integral part of the region, serving the needs of students, employers and the wider community.
1994 innovative Artechmobile is built and hits the road to provide mobile computer education to regional communities.
86 yEARs OF iNNOVATiON AND GROWTh
6 Annual Report 2010

2001name changes to the Waikato institute of technology and two years later, the Wintec brand is adopted.
2003Wintec opens Beijing office.
1995land is purchased on Avalon drive to establish a campus with ample space for trades, sports and hospitality training.
2007Award-winning gallagher Hub opens and is swiftly adopted by students as their space for studying and recreation.
2000First postgraduate qualification is offered (Postgraduate diploma in nursing).
2009Wintec wins three national tertiary education awards for its global role (particularly its partnerships in China), innovative support services (for its creative industries business incubator sOdA inc.) and relevant learning (for its employer partnership groups).
Wintec receives government funding to develop an agritechnology educational centre in Waikato, in partnership with world-renowned AgResearch, AgitO, innovation Waikato and the Coalition of 21st Century schools.
2010Wintec opens a hub at its Avalon campus and this quickly becomes a central studying and social space for students, staff and visitors.
Wintec House, the historical corner brick building on the city campus is re-opened after a $17 million refurbishment. Wintec House boasts educational facilities, quality events spaces and a business hub, opening up Wintec to the heart of Hamilton’s CBd.
7www.wintec.ac.nz

sTRATEGic DiREcTiON
OuR stRAtegiC diReCtiOn is Best desCRiBed tHROugH OuR stRAtegiC PRiORities. tHe PRiORities PAint tHe PiCtuRe OF WHO We ARe And WHAt We WAnt tO Be. OuR CHAnge PROgRAMMe, PROjeCt COnneCt, is AlsO A Key stRAtegiC dRiveR FOR OuR ORgAnisAtiOn.
Our strategic priorities underpin our planning process and guide our direction and decision making. they are:
QUALiTy AND sTUDENT OUTcOMEs
Our aim is regional, national and international recognition of the quality of our graduates, educational products, and related services.
MODERNisATiON, cAPABiLiTy AND sUsTAiNABiLiTy
Our aim is to modernise our facilities, infrastructure, business processes and work practices to reflect an efficient, effective, and modern organisation with a level of technological capability appropriate to a leading institute of technology.
FLExiBLE DELiVERy AND LEARNiNG TEchNOLOGiEs
Our aim is to have flexibility for student learning, utilising a range of delivery options. We will increasingly adopt new learning technologies to enhance the effectiveness, and students’ experience, of study. this increased flexibility will also be a major contributor to our goal of meeting employer requirements for flexible, on and off-job training opportunities.
TERTiARy sEcTOR cOLLABORATiON
Our aim is to develop relationships within the tertiary sector to improve outcomes, create efficiencies, and improve performance.
EMPLOyER AND cOMMUNiTy ENGAGEMENT
Our aim is to have effective engagement with employers, industry and communities across the region. this is central to ensuring that our provision of education and services is driven by the needs of employers and the region.
MAORi AchiEVEMENT
Our aim is to maintain a focus on providing teaching, learning and social environments, facilities, and student support services that address Maori students’ needs and aspirations.
iNTERNATiONALisATiON
Our aim is to ensure we are a key part of new Zealand’s diverse, globally-connected education system, and further strengthen our capability in, and capacity for, export education.
REsEARch, DEVELOPMENT, TRANsFER (RDT) AND cOMMERciALisATiON
Our aim is to promote a strong alignment between our applied research activity and the needs of industry for practical solutions to their ‘real-world’ problems. the aim is to help drive productivity and development and encourage greater technology transfer between ourselves and industry.
sTRATEGic DiREcTiON
“OuR AiM is tO HAve eFFeCtive engAgeMent WitH eMPlOyeRs, industRy And COMMunities ACROss tHe RegiOn.”
8 Annual Report 2010

sTRATEGic DiREcTiON
PROjEcT cONNEcT - DRiViNG ThE chANGEs
Wintec is a complex organisation, and we have ambitious objectives. they will present challenges to us, and a great deal of organisational change is required to achieve them. to succeed we will continue to use the project management concepts and disciplines developed through Project Connect - our integrated change programme which began in 2003.
this is a mechanism for translating our strategic intent into practice.
using a project management methodology, our change programme is as much about how we work together as it is about what we are working on.
Project Connect currently comprises some 16 key projects and 60 work streams. these are organised around our major change areas: continuous quality improvement; flexible work practice; effective utilisation of leading edge technology; building relationships and connections; increasing research development and transfer capability; increased commercialisation activity; and embedding internationalisation.
the projects ensure that we bring the right people from across the organisation together with the focus and resources required to implement the step changes we seek.
the disciplines of good project management ensure the projects operate on time, on budget, and with the appropriate risk management, communication and coordination to deliver the best outcomes to the organisation.
Project Connect initiatives are strategically relevant, institution-wide and cross-disciplinary projects designed to improve our business and education practices and introduce positive changes in organisational behaviour.
“using A PROjeCt MAnAgeMent MetHOdOlOgy, OuR CHAnge PROgRAMMe is As MuCH ABOut hOW We WORK tOgetHeR As it is ABOut WhAT We ARe WORKing On.”
9www.wintec.ac.nz

MEMBERs OF cOUNciL
MEMBERs OF cOUNciL
APPOiNTED By: cURRENT TERM ENDs:
Members of Waikato institute of Technology council as at 31 December 2010:
gordon Chesterman Chairperson Minister for tertiary education 30/04/2012
Clint Baddeley Chair – Building and Assets Committee
Wintec Council 30/04/2012
Mary Cave-Palmer deputy Chairperson, Chair – Finance and Audit Committee
Minister for tertiary education 30/04/2012
Bryce Cooper Wintec Council 30/04/2015
Rahui Papa Minister for tertiary education 30/04/2013
Aaron Rink Wintec Council 30/04/2014
steve tucker Minister for tertiary education 30/04/2014
dianne yates Wintec Council 30/04/2013
APPOiNTED/ELEcTED By:
Members who left council during the year:
james Bennett Minister of education
Kristi Bernards general staff, Waikato institute of technology
Mark Flowers*
sam Mackenzie students’ Association of Waikato institute of technology
deniss yeung Academic staff, Waikato institute of technology
*Prior to 2010 the education Act 1989 required that Councils of an institution should include the Chief executive of the institution but this was repealed in March and the Chief executive is no longer required to be a member of the Council.
10 Annual Report 2010

chAiR’s AND chiEF ExEcUTiVE’s REPORT
11www.wintec.ac.nz

tHe PROgRess OF ReCent yeARs in Building tHe PROFile And RePutAtiOn OF OuR ORgAnisAtiOn COntinued in 2010 Resulting in AnOtHeR HigHly PROduCtive And suCCessFul yeAR.
despite operating in an economic recession we pushed ahead with our change programme; celebrated positive academic performance; enjoyed the benefits of more new and refurbished buildings and improved infrastructure on our campuses; embedded our strategic direction into all that we do with our student, staff and industry interactions; and, for the third consecutive year, posted a strong and improved financial result.
OUR sTUDENTs
Once again our domestic student numbers increased, with our mainstream provision in the region growing an impressive 12%. Much of this was in sectors of importance to the region, including engineering, midwifery, nursing, early childhood education and information technology. While the current recession no doubt contributed to this rise in numbers, we have experienced similar increases each year since 2007 as a result of our growing reputation and presence in the region.
the total growth in students we teach on campus has increased by over 30% since 2007. At the same time we have moved more provision to higher
levels of study (level 4 and above), to over 75% in 2010. this means, for example, that in 2010 over 1100 more, predominantly young, students from this region were actively engaged in higher levels of study at Wintec than in 2007. that is a valuable lift in the overall contribution we are making to this region and its people. We are now offering ten degree programmes and nine postgraduate qualifications.
importantly, all of this growth has been managed within the overall cap agreed with tertiary education Commission (teC). this has been achieved by reducing some programmes (for example some lower-level programmes, or those where other providers may also deliver in that particular discipline) and closing our campus in Auckland. to date we have grown this provision within the region without having to turn students away. it is a great demonstration of our commitment, and ability to deliver even greater benefit to the region and its economy without requiring additional funding in difficult economic times.
late in 2009, the government announced that it would fund 12 polytechnics and institutes of technology to provide up to 700 additional student places in 2010. We were one of these institutes, and this meant we were able to teach an additional 200 eFts this year, which helped us cater for growth in programmes such as our certificate in university preparation, engineering, nursing, midwifery and early childhood education.
AN iNTERNATiONAL FOcUs
Our relationships with leading institutions around the world continue to develop. We have increased our partnerships in China, adding a further three institutions to our guangdong-based cluster, as well as starting joint programmes with Chengdu university. in india we enhanced our strong presence with the appointment of a liaison person with the indian institutes of technology, resulting in increased numbers and promoting better relations.
We actively developed and investigated new international markets in the Middle east, south east Asia, and europe. during 2010 we made great progress in implementing one of the key strategies of our internationalisation Plan: diversification of the source countries of our international students. We started work on a range of new market developments, particularly in Africa, south and Central America, and southeast Asia. Of particular note was the significant increase in enrolments and interest we have begun to receive from saudi Arabia.
Our commercial international activity continued with many “train the trainer” packages creating interest, mainly with groups in thailand and Malaysia. A record 44 international delegations visited us this year.
As a result of this focus on international initiatives we increased our international student numbers despite strong international competition.
chAiR’s & chiEF ExEcUTiVE’s REPORT
chAiR’s & chiEF ExEcUTiVE’s REPORT
12 Annual Report 2010

Overall our international numbers increased 5% and our total associated revenues grew by 11.5%. the revenue these students generate is important, but equally important to Wintec, the region and the nation, are the benefits that come with a diverse and multicultural student body.
sOUND FiNANciAL PERFORMANcE
As a result of improved enrolments and our continuing efforts to operate more efficiently, we ended the year with a surplus of $4.8 million (or 5.7%) before abnormal items such as land sales and adjustments to some of our asset valuations. the surplus is $2.5 million after these items, which achieves the 3% threshold set by our monitoring agencies.
We implemented a procurement strategy which resulted in approximately $400,000 in savings. the strategy includes rationalisation of suppliers and where appropriate, opting into “all of government” procurement initiatives. As the procurement strategy progresses we aim to make annual savings of around $1m.
these savings and our overall financial result will form part of our continuous drive to ensure value for money on all activities and enable us to redirect funding into improving student outcomes, without requiring additional revenue or negatively affecting our bottom line. this is a solid position heading into 2011, and it is coupled with positive academic performance.
PERFORMANcE iN ThE sEcTOR
this year the government introduced educational Performance indicators (ePis), designed to give a snapshot of how tertiary organisations are performing in key areas. We were extremely pleased with our results and rankings within our sector and sub-sector, which compared us with other institutes of technology. We were consistently in the top half of the sector. For two indicators that we believe most reflect underlying performance, course and qualification completion rates, we were rated fourth and first in the sector. Of particular note, the outcomes we achieved for course completions at degree level were comparable to those achieved across the university sector. Our ability to successfully deliver high quality education at degree level and above is reinforced with this outcome.
the results were favourable for us and we thank all staff for playing an important role in ensuring we remain a quality, leading-edge institute of technology. there is always room for improvement and while we expect the 2010 ePis to show further gains we will continue to seek advancement in all areas.
this year we expanded distance delivery of our degrees. in addition to the entire Bachelor of Applied social
science (social Work) degree being delivered at Witt and tairawhiti Polytechnic, we also offered the Bachelor of Midwifery degree using teaching facilities at tairawhiti Polytechnic, eastern institute of technology and Bay of Plenty Polytechnic. Our on-line “recognition of prior learning” system, elevate, also progressed well during the year with more than 30 people gaining qualifications through this programme.
itP Quality panellists conducted our external evaluation and Review (eeR) this year, resulting in a positive report which highlighted our good engagement with industry and employers and gave a rating of “highly confident” in regard to our educational performance. the results of the review are pleasing as they reinforce our commitment to produce confident graduates, who are taught well in programmes relevant to industry.
Key points from this report included effectiveness of teaching rated excellent, a high standard of teaching, employers commending Wintec for an emphasis on practical vocational skills in programmes, and programmes matching the needs of stakeholders.
the report also highlighted areas of improvement which we will take into account for future planning in quality throughout the whole of our organisation.
chAiR’s & chiEF ExEcUTiVE’s REPORT
“tHe Results WeRe FAvOuRABle FOR us And We tHAnK All stAFF FOR PlAying An iMPORtAnt ROle in ensuRing We ReMAin A QuAlity, leAding-edge institute OF teCHnOlOgy.”
13www.wintec.ac.nz

We continued investment in our staff this year with our management development programme for all senior, middle and team managers involving specially designed training to improve the overall capability of our management team. this is key to ensuring that momentum of our integrated change programme, Project Connect, continues to further enhance our performance. examples of progress this year within Project Connect include improved workforce planning; embedding literacy and numeracy programmes into all level 1 to 3 programmes; implementing lean manufacturing methodologies; further development of flexible delivery solutions across a number of our programmes; and introduction of student experience and retention initiatives including an attendance monitoring programme. in addition we have adopted a regional strategy and a three year iCt technology plan.
AN iNTEGRAL PART OF ThE REGiON AND ThE sEcTOR
We were chosen by government as one of a limited number of institutions to deliver two of their new youth initiatives, the trades Academy and youth guarantee scheme. the inaugural Waikato trades Academy will be up and running in March 2011 and will see 48 students from 12 secondary schools represented in the first intake.
every three years we are required to submit an investment plan to the tertiary education Commission. this document sets out our high-level plans and directions for the next three years, with a focus on government-funded activities. Our investment plan for 2011 to 2013 was approved by the teC. One of the highlights of this plan was the identification of new priority sector groups, on which we will be focusing our planning in the coming year. these are agritechnology; trades, engineering and manufacturing; energy; health and social services; creative, digital and design; business and finance; and logistics and supply chain management.
We also focused on other revenue streams, in particular industry training Organisation (itO) revenue. the itO sector was hit hard by the recession, nonetheless itO revenue was above $3m. itOs are expecting major funding restrictions for 2011 and will seek to rationalise their training to reduce costs and lift their outcomes, and we will be looking at opportunities and ways to continue our strong links with the itO sector.
As part of the teC financial monitoring framework in 2009, we received a reassuring risk assessment, given our commitment to on-going modernisation of our campuses and infrastructure. With our strong level of performance this year, coupled with the teC’s high level of comfort in our ability to govern and manage the institute to the benefit of our stakeholders, we expect a further improvement in our risk rating.
MODERNisATiON AND iNNOVATiON
Modernisation and innovation gained momentum this year with a number of significant achievements in these areas.
Our long-term capital project to modernise our campuses is well under way. We embarked on this back in 2003 with the aim of continuing to meet the changing needs of students and our community for many years to come. this project is expected to continue strongly for at least another three years.
earlier in the year the Avalon Hub became fully operational and was officially opened by the Minister of tertiary education, steven joyce. this modern building, with its suite of computers, open-plan social space, café, kitchen, study rooms, library and video-conference room, has significantly improved the Avalon campus.
in september Wintec House, the historical brick corner building on our city campus, was opened. this $17 million refurbishment is the most significant we have undertaken, resulting in a stunning heritage building enhanced with modern architecture.
chAiR & chiEF ExEcUTiVE’s REPORT(cONTiNUED)
chAiR’s & chiEF ExEcUTiVE’s REPORT
14 Annual Report 2010

Wintec House links into the heart of Hamilton. it is a unique facility combining educational facilities, quality event spaces and a business hub that includes the Waikato Chamber of Commerce and Opportunity Hamilton as tenants. in its first three months of operation Wintec House immediately captured the attention of our students, staff, business people and community representatives who can now all enjoy and reap the benefits of our campus opening up to the public.
Alongside Wintec House, construction started on our multi-storey car park building which, when completed, will have 257 car parks available to staff, students and visitors. Planning is also well under way for the design and construction of a wharenui at our city campus which will be located beside the Bill gallagher Hub on the top of the hill.
We entered into the second year of our Research development and transfer (Rdt) strategy focusing on quality Performance Based Revenue Funding, more applied industry research, and collaborative research with employers through our industry research voucher scheme.
As shareholders with the Hamilton City Council in sOdA inc., we played a key role in accelerating the region’s economy with a particular focus on the digital and creative industries economy. sOdA inc is a creative industries business incubator based in Hamilton, and the only one in new Zealand.
We are also shareholders in vital english, which this year partnered with Cambridge university to take english language online and blended courses to market.
Our other commercial entities, learning Works and Prima group, under the umbrella of the Wintec Foundation, continued to explore opportunities to commercialise our organisational “know how” and develop tailor-made training solutions for industry. this is assisted by our specialist facility, the Curriculum Factory, which develops on-line and distance training materials.
Our research initiatives, commercialisation and commercial activities all help to drive and assist regional and national economic performance. We are doing comparatively well in the institutes of technology and polytechnics (itPs) sector and are receiving more government interest and support in these areas.
OUR cOUNciL
this was the first year our Council operated with eight members, instead of 14 members as in previous years. this was as a result of the government’s legislation around the governance of all itPs.
We adapted well to the changes and our Council continued to run efficiently and effectively. despite there being no allocated places for student or staff representatives on Council, we continued to receive input from these groups through other forums.
the ministerial appointments for Wintec are gordon Chesterman (chair), Mary Cave-Palmer (deputy chair), Rahui Papa and steve tucker. the remaining four appointees elected by the existing Wintec council are Clint Baddeley, Bryce Cooper, Aaron Rink and dianne yates.
We would like to take this opportunity to thank all our current Council members, as well as Margot Carthy for her wonderful administrative support.
Our Council has a great mix of skills and we all are committed to seeing this organisation thrive, develop and continue on its journey. We continued with our programme of “Council dinners” throughout the year and guests included representatives from the not-for-profit sector and ethnic organisations from the greater Waikato area. Profile and reputation are key to Wintec’s success and such events enable key people in our wider community to connect, interact and hear about some of the many projects and initiatives our organisation engages in.
PARTNERshiPs OF ThE FUTURE
We continued to engage with a number of stakeholders both regionally and nationally in 2010.
Our role in the partnership between new Zealand’s six largest institutes of technology, known as the Metros group, has positioned us well for the future. this year the partnership has strengthened and helped keep us focused on key issues such as research and development, productivity and internationalisation.
chAiR’s & chiEF ExEcUTiVE’s REPORT
15www.wintec.ac.nz

We continue to work with all itPs on a range of projects as part of our desire to be a major contributor to our, and the government’s, tertiary sector collaboration strategy.
Our positive working relationship with the university of Waikato developed, with increased growth and interest in the Certificate of university Preparation that we offer to students wanting to gain the skills to enter into university study. We are also embarking on a joint project to assess current and likely future regional demand for tertiary education. this is an important project being overseen by ourselves, the university and Hamilton City Council as we work together on further strengthening the economy and communities of the region.
We also enjoyed on-going, productive relationships with Opportunity Hamilton, the city’s economic development Agency, and the Waikato Chamber of Commerce.
new Zealand’s first agri-technology educational centre opened this year. the purpose-built learning facility at AgResearch’s dairy research and development farm at tokanui was the result of a partnership led by Wintec along with Agriculture itO, Waikato innovation Park and the Coalition of 21st Century schools.
the centre will use resources and data from AgResearch’s farm to deliver science, technology, environmental and farming education to secondary and tertiary students, farmers and agricultural workers.
OUR siNcERE ThANKs
Overall, the work undertaken in 2010 has put us in a solid position for 2011 and beyond.
this will enable to us to continue to invest in our modernisation and change programme, including developing our campuses and technology, and raising the level of educational outcomes attained by all our students.
Our success in 2010 is a result of the immense range of skills and expertise, coupled with the passion of our Council members, our staff, our employer partnership group members and our students.
to all of you, thank you for making Wintec what it is today – a quality organisation, which is modern, innovative and leading-edge. We look forward to working together with you all in 2011.
chAiR & chiEF ExEcUTiVE’s REPORT(cONTiNUED)
MARK FLOWERs Chief executive
GORDON chEsTERMAN Chairperson
“OuR suCCess in 2010 is A Result OF tHe iMMense RAnge OF sKills And exPeRtise COuPled WitH tHe PAssiOn OF OuR COunCil MeMBeRs, OuR stAFF, OuR eMPlOyeR PARtneRsHiP gROuP MeMBeRs And OuR students.”
chAiR’s & chiEF ExEcUTiVE’s REPORT
16 Annual Report 2010

hiGhLiGhTs
17www.wintec.ac.nz

WiNTEc hOUsE – A UNiQUE FAciLiTy iN ThE hEART OF hAMiLTON
in september, a $17 million refurbishment of our historical brick corner building, Wintec House, was completed.
this iconic building combines educational facilities, quality event spaces, and commercial offices all under the same roof.
Wintec House is home to state-of–the-art training and retail salons for our hairdressing and beauty students, as well as two exciting event spaces for Wintec and public-use: the Atrium and the long Room. On the top floor is the Business Hub housing the offices of key Waikato business organisations: Waikato Chamber of Commerce; Opportunity Hamilton; and the Hamilton Central Business Association.
Wintec House, complemented by the surrounding boulevard-style steps, has opened up our city campus to the heart of Hamilton’s CBd. it is already proving to be a prestigious venue for conferences, gala dinners and exhibitions in the region.
A cENTRAL PLAcE TO MEET, sTUDy AND sOciALisE
students studying at our Avalon campus in north Hamilton now have access to a hub similar to the award-winning gallagher Hub on our city campus.
the $4.5 million technologically-advanced complex, which opened its doors in March, houses a library, health centre, computers, video conference room, café ,student support services and social spaces.
the Avalon hub opening was a significant milestone towards the modernisation of the Avalon campus. it has given a “heart” to the campus being a place for students, staff and our partners in industry to meet, socialise and work.
AGRiTEc cENTRE – TEAchiNG FARMiNG OF ThE FUTURE
the country’s first dedicated agritechnology educational centre opened in April at AgResearch’s state-of-the-art dairy research and development farm at tokanui near te Awamutu.
the purpose-built learning facility is the result of a unique partnership led by Wintec that will see secondary and tertiary students nationwide, as well as farmers and agricultural workers, experience the latest in agritechnology using innovative learning technologies.
hiGhLiGhTs
hiGhLiGhTs
18 Annual Report 2010

StudentS get beSt of both worldS
An exciting government initiative will see Wintec partner with 12 Waikato secondary schools in 2011, encouraging students to stay at school for longer by engaging them in hands-on learning.
The Waikato Trades Academy enables year 11-13 students who are interested in a career in trades or technology to combine practical, tertiary-based study with studies towards their National Certificate of Educational Achievement (NCEA).
During the first year of the Waikato Trades Academy, students will build a motorbike using scooter parts. This project-driven teaching by Wintec tutors will give the students automotive, electrical and engineering skills and the relevant NCEA unit standards, whilst also improving literacy and numeracy levels.
Staff inSpired at profeSSional development feStival
INSPIRE was our inaugural professional development festival for staff. This was a one day event to challenge the way we work, enable staff to learn something new, delve into new technology, encourage the exchange of ideas and motivate staff.
Through professional development INSPIRE improves the service we deliver to students, employers and the community and is also an opportunity to showcase and celebrate our staff’s achievements and expertise.
Presented by inspirational speakers from Wintec and around the world, all seminars and workshops were aligned to our strategic priorities. The success of INSPIRE 2010 means it will be an annual event.
Standing out from the crowd
Our new brand and logo reflects Wintec’s positioning as an education partner for a range of stakeholders both regionally and throughout the world.
The logo shows four bands making a globe to demonstrate connectivity and energy. Red, yellow and black are the Waikato region’s distinctive colours, with blue representing the river.
highlightS
19www.wintec.ac.nz
KEEPiNG OUR sTUDENTs ON TRAcK AND hAPPy
this year saw the first stage of our student retention campaign. We implemented a student attendance monitoring programme for students who weren’t attending class and were deemed to be at risk of dropping out. Our student contact centre contacted each student to identify the issues and worked with the student to provide early interventions.
the student retention campaign was run across 10 schools covering about 8500 students. early data suggests particularly positive outcomes for Maori, international and first year students.
Another highlight was our student survey results. students enrolling at Wintec had an overall satisfaction rating of 90%, our highest satisfaction rating achieved to date.
VisiT FROM chENGDU UNiVERsiTy sTAFF
We hosted 16 academic staff from Chengdu university (Cdu), one of our main partners in China.
this is the second time we’ve hosted staff from Cdu as part of our executive education programme.
One of the main goals of these visits is to enable Cdu’s academic staff to become familiar with western ways of teaching so that they can help prepare students in China for studying at Wintec. it also enables us to further develop opportunities for transfer of credit frameworks and joint programmes for students to transition from Cdu to Wintec.
these visits are also an opportunity for our staff to learn more about the Chinese culture and its education system; insights which can be invaluable when teaching and supporting our international students from China.
MAORi PARTiciPATiON RATEs
Maori participation for 2010 was just under 24%, a high percentage in proportion to our region’s Maori population. it was strongly skewed towards the higher end of the qualifications framework with over 70% of Maori enrolments occurring at level four and above.
Both the overall participation rate and the proportion of enrolments at the higher levels were high compared to the sector as a whole.
hiGhLiGhTs (cONTiNUED)
hiGhLiGhTs
20 Annual Report 2010

REsEARch VOUchERs hELP LOcAL ORGANisATiONs
since it was first piloted in late 2009, Wintec’s Research development and transfer (Rdt) voucher scheme has proven to be very successful with five projects completed and a further 15 in progress. small and medium sized enterprises (sMes) and not-for-profit organisations can apply for the vouchers, which carry a value or credit for a certain dollar amount of research time and resource from Wintec. A Wintec staff member with the appropriate skills and knowledge works alongside the organisation to reach the desired outcome. the Rdt vouchers aim to improve the alignment between our research capability and the needs of employers and industry.
sTAFF AchiEVEMENTs PUT WiNTEc ON ThE WORLD sTAGE
every year our staff’s talent and expertise helps put Wintec on the world stage and this year was no exception.
Media Art’s xavier Meades poster research project Purakau was exhibited at the Museu valencià de la il-lustració i de la Modernitat, MuviM.
gareth Williams’ sculpture Airport Road, ladder with Axe was chosen for the $3,000 annual Harkness Henry Award.
Allyson davys, Head of school of social development, co-authored a book: Best Practice in Professional Supervision: A Guide for the Helping Professions.
Barnaby Pace authored two books; Developing a model of mental health support work practice: A holistic approach to mental health support work and Exploring support work: Examining the role of mental health support workers in New Zealand.
john Clayton from our Centre for emerging technologies was chair of the national e-learning conference, shar-e-Fest 2010, held at Wintec.
BAchELOR OF MiDWiFERy TAUGhT ONLiNE
Our Bachelor of Midwifery degree is now taught through video conference and Moodle, using teaching facilities at tairawhiti Polytechnic, eastern institute of technology and Bay of Plenty Polytechnic.
this is the first comprehensive use by Wintec of live teaching through video conferencing to four cohorts of students at the same time.
hiGhLiGhTs
21www.wintec.ac.nz

hiGhLiGhTs (cONTiNUED)
TEAchiNG QUALiTy PROjEcT
Our teaching Quality project introduced this year aims to support staff’s passion for teaching, since the quality of their teaching and the learning relationship that they develop with the student are such an important factor in the students’ success.
the project fosters these relationships and qualities by providing staff development opportunities, establishing communities of practice and supporting on-going reflective practice. the project has been well received and will continue in years to come.
hONORARy AWARDs
We conferred honorary awards on two of new Zealand’s top entertainers, two international sporting stars, a Hamilton businessman and a regional Mayor.
One of the world’s most celebrated cricketers, Black Caps captain daniel vettori, who was educated and lived in Hamilton until recently, was awarded an honorary Master of science (sport and exercise). World class netballer irene van dyk also received an honorary Master of science (sport and exercise) for her role in the silver Ferns and the Waikato BOP Magic team.
lynda and jools topp, otherwise known as the topp twins, each recieved an Honorary Master of Arts (Music).
Hamilton businessman Bernie Crosby, founder and owner of Prolife Foods, received an honorary Bachelor of Business studies, and Mayor of Otorohanga, dale Williams, received the Wintec Medal recognising his role with the task force for jobs, his involvement in seeking training for youth and his contribution to the Otorohanga trade training Centre – one of our satellite campuses.
More than 1600 students graduated in 2010.
EMPLOyER OF ThE yEAR
Our commitment to a more inclusive community was recognised at the Association for supported employment in new Zealand’s (AsenZ) gala dinner, where Wintec was awarded ‘employer of the year’.
the national award recognises the excellent work we’ve undertaken over the last four years in placing people with severe disabilities in meaningful employment.
in 2007, Wintec won the state services Commission’s ‘Mainstream employer of the year’ award, so this is the second time we have been recognised for our role in facilitating supported employment.
hiGhLiGhTs
22 Annual Report 2010

sPORTiNG sUccEss
three of our students won silver medals in the delhi Commonwealth games.
nikki Hamblin, a journalism student, won a silver medal in the 1500 and 800 metres. sport and exercise science student stuart Farquhar threw 78.15 metres to win a silver medal in the javelin final. Hockey player Clarissa eshuis, another of our sport and exercise science students, was part of the Black sticks squad who also won a silver medal.
ON TOP OF ThE WORLD
Hospitality student Phillip Maultsaid won one of 20 international scholarships from london-based educational provider, City & guilds; while Advanced diploma in international tourism student Melissa Haakma was awarded the City & guilds international Medal for excellence as the top student in the world.
sTUDENTs REVVED UP FOR V8 ExPERiENcE
Motorsport, journalism, photography and event management students all gained valuable experience working at the Hamilton itM400 v8 supercars.
this was the second year Wintec has partnered with the itM400, but the first time students were directly involved in this significant Hamilton event.
hiGhLiGhTs
23www.wintec.ac.nz

hiGhLiGhTs (cONTiNUED)
icT sTRATEGy
A three year iCt (information communications and technology) strategy has been developed which will see Wintec spend $14.7 million to improve our it services for staff and students.
Most of the iCt strategy projects are being undertaken as part of our commitment to modernisation and flexible delivery, as well as a number of “business as usual” activities such as our it helpdesk, support and maintenance. tangible benefits including cost savings from moving to cloud computing will also be realised.
Our student email service has been migrated to Microsoft live@edu. this free hosted service gives our students an email account for life, large email storage, cloud based collaboration spaces and other services. Furthermore, we will no longer be required to store and manage student email. this service has already been adopted worldwide across hundreds of colleges and universities and is becoming the preferred platform in the tertiary sector.
WiNTEc FORMs PARTNERshiP WiTh cOMMUNiTy LiViNG TRUsT
As part of Wintec’s strategic alliance with Community living trust, a leading provider of services to people with intellectual disabilities in the Waikato, our horticulture students designed and created landscaped gardens for intellectually disabled people.
We have been working with Community living trust for more than a year and signed an alliance document in 2010 to formalise the arrangement.
the strategic alliance benefits Community living trust, Wintec and our local community. By sharing our knowledge and resources, we can better serve people with intellectual disabilities and provide our students and staff with more opportunities.
Wintec also has a successful partnership with Habitat for Humanity, so the alliance with Community living trust is Wintec’s second not-for-profit partnership.
cOLLABORATiNG WiTh ThE UNiVERsiTy OF WAiKATO
together with the university of Waikato we jointly delivered the Certificate in university Preparation (CuP) to 295 Wintec students.
ninety five per cent of CuP students were under 25 and the successful course completion rate for the programme was 74%. CuP allows students without a university entrance qualification to progress to degree-level study.
Our partnership with the university ensured access to higher-level tertiary education for members of our regional community who might otherwise not have had the opportunity.
hiGhLiGhTs
24 Annual Report 2010

EQUALOPPORTUNiTiEs
25www.wintec.ac.nz

EQUAL OPPORTUNiTiEs
EQUAL EMPLOyMENT OPPORTUNiTiEs
Wintec continues to maintain a strong focus on the review and continuous improvement of our equal employment Opportunities (eeO) and equal education Opportunities (eedO) activities and performance. in 2010 our eeO vision was progressed through a range of initiatives that included:
• An ongoing commitment to supported employment for people with disabilities, which was recognised by the Association for supported employment in new Zealand (AsenZ) who awarded Wintec the “employer of the year” award in september.
• Continuing our participation in the Mainstream employment programme, whereby we work with community agencies to facilitate employment at Wintec for people with significant disabilities. We currently have mainstream employees in Human Resources, student support services, Hairdressing and Beauty and in our trades administration office.
• Promoting cultural events and support for Maori and Pasifika staff and students, including powhiri, Matariki, Maori language Week, Kingitanga Koroneihana, international Week celebrations, diwali celebration, Whanau day, regional Kapa Haka event and Waka Ama national competitions.
EThNiciTy OF EMPLOyEEs - 2010
Ethnicity Number Percent Male Female
nZ european/Pakeha 401 53.5% 153 248
nZ Maori 71 9.5% 24 47
Other european 31 4.1% 10 21
indian 13 1.8% 8 5
Chinese 11 1.4% 7 4
Fijian 7 0.9% 6 1
Other Asian 7 0.9% 3 4
Other 112 14.9% 59 53
no data provided 97 13.0% 44 53
EQUAL OPPORTUNiTiEs
26 Annual Report 2010

EQUAL EDUcATiON OPPORTUNiTiEs
student learning services contributes to Wintec’s level of high student achievement through quality and timely student-centred learning and disability support services.
student learning services continued to offer a high level of advocacy, information and support to students who disclosed an impairment. thirty-four staff provided 7772 hours of note-taker and reader/writer services intended to improve participation, retention, completion and progression of learners within targeted groups such as Maori and Pasifika.
the quality and effectiveness of disability services attributed to a 26% increase in student access on 2009.
te Kete Konae, our Maori and Pasifika support centre, continued to provide support based on whanaungatanga, inclusiveness and sharing. services included academic and learning support, pastoral care, cultural support, counselling, marketing and recruitment activities, scholarship information and information and advice related to studying at Wintec. Our staff and students also participated in a number of Maori and Pasifika community events.
EQUAL OPPORTUNiTiEs
27www.wintec.ac.nz

EQUAL OPPORTUNiTiEs
EQUAL OPPORTUNiTiEs (cONTiNUED)
Learning support in 2010 a high level of service was provided in areas such as individual, small group, workshop, in-class and course delivery modes to over 1868 students. this showed a 17% increase on 2009. student learning services also provided targeted support to groups of Maori and Pasifika as well as a high number of international students.
165 students also attended writing and study skills courses. this is an increase of 100% on 2009 and with a 95% student satisfaction rate, indicates a high level of student centeredness. A peer tutoring service was also provided where senior students work alongside other students on course content. there is strong evidence that peer tutoring improves student outcomes in terms of retention, completion and academic performance.
the provision of 1138 hours of peer tutoring suggests student learning services is committed to contributing to successful student outcomes. Academic learning assessments were provided to students identifying with a learning difficulty. Follow up support included individual intensive learning, specialised equipment and support from staff such as note takers and reader/writers.
“tHeRe is stROng evidenCe tHAt PeeR tutORing iMPROves student OutCOMes in teRMs OF RetentiOn, COMPletiOn And ACAdeMiC PeRFORMAnCe.”
28 Annual Report 2010
FiNANciALPERFORMANcE
29www.wintec.ac.nz
sTATEMENT OF REsPONsiBiLiTy
the Council and management are responsible for the preparation of the Waikato institute of technology and group’s financial statements and statement of service performance, and for the judgements made in them.
the Council and management of the Waikato institute of technology have the responsibility for establishing and maintaining a system of internal control designed to provide reasonable assurance as to the integrity and reliability of financial reporting.
in the Council’s and management’s opinion, these financial statements and statement of service performance fairly reflect the financial position and operations of the Waikato institute of technology and group for the year ended 31 december 2010.
signed by:
FiNANciAL PERFORMANcE
MARK FLOWERs Chief executive
date: 19/04/2011
GORDON chEsTERMAN Chairperson
date: 19/04/2011
PAUL hOLLOWAy Chief Financial Officer
date: 19/04/2011
30 Annual Report 2010

FiNANciAL PERFORMANcE
Independent Auditor’s Report
To the readers of Waikato Institute of Technology and group’s
financial statements and statement of service performance for the year ended 31 December 2010
The Auditor-General is the auditor of Waikato Institute of Technology (the Institute) and group.
The Auditor-General has appointed me, Clarence Susan, using the staff and resources of Audit
New Zealand, to carry out the audit of the financial statements and statement of service
performance of the Institute and group on her behalf.
We have audited:
• the financial statements of the Institute and group on pages 33 to 81, that comprise the
statement of financial position as at 31 December 2010, the statement of comprehensive
income, statement of changes in equity and statement of cash flows for the year ended on
that date and the notes to the financial statements that include accounting policies and other
explanatory information; and
• the statement of service performance of the Institute and group on pages 82 to 87.
Opinion
In our opinion:
• the financial statements of the Institute and group on pages 33 to 81:
comply with generally accepted accounting practice in New Zealand; and
fairly reflect the Institute and group’s:
• financial position as at 31 December 2010; and
• financial performance and cash flows for the year ended on that date;
• the statement of service performance of the Institute and group on pages 82 to 87:
complies with generally accepted accounting practice in New Zealand; and
fairly reflects the Institute and group’s service performance achievements measured
against the performance targets adopted for the year ended 31 December 2010.
Our audit was completed on 28 April 2011. This is the date at which our opinion is expressed.
The basis of our opinion is explained below. In addition, we outline the responsibilities of the
Council and our responsibilities, and we explain our independence.
Basis of opinion
We carried out our audit in accordance with the Auditor-General’s Auditing Standards, which
incorporate the International Standards on Auditing (New Zealand). Those standards require that
we comply with ethical requirements and plan and carry out our audit to obtain reasonable
assurance about whether the financial statements and statement of service performance are free
from material misstatement.
Material misstatements are differences or omissions of amounts and disclosures that would affect a
reader’s overall understanding of the financial statements and statement of service performance.
If we had found material misstatements that were not corrected, we would have referred to them
in our opinion.
An audit involves carrying out procedures to obtain audit evidence about the amounts and disclosures in
the financial statements and statement of service performance. The procedures selected depend on our
31www.wintec.ac.nz

FiNANciAL PERFORMANcE
judgement, including our assessment of risks of material misstatement of the financial statements and
statement of service performance, whether due to fraud or error. In making those risk assessments, we
consider internal control relevant to the Institute and group’s preparation of the financial statements
and statement of service performance that fairly reflect the matters to which they relate. We consider
internal control in order to design audit procedures that are appropriate in the circumstances but not
for the purpose of expressing an opinion on the effectiveness of the Institute and group’s internal
control.
An audit also involves evaluating:
• the appropriateness of accounting policies used and whether they have been consistently
applied;
• the reasonableness of the significant accounting estimates and judgements made by the
Council;
• the adequacy of all disclosures in the financial statements and statement of service
performance; and
• the overall presentation of the financial statements and statement of service performance.
We did not examine every transaction, nor do we guarantee complete accuracy of the financial
statements and statement of service performance. We have obtained all the information and
explanations we have required and we believe we have obtained sufficient and appropriate audit
evidence to provide a basis for our audit opinion.
Responsibilities of the Council
The Council is responsible for preparing financial statements and a statement of service performance
that:
• comply with generally accepted accounting practice in New Zealand;
• fairly reflect the Institute and group’s financial position, financial performance and cash flows;
and
• fairly reflect the Institute and group’s service performance achievements.
The Council is also responsible for such internal control as it determines is necessary to enable the
preparation of financial statements and a statement of service performance that are free from
material misstatement, whether due to fraud or error.
The Council’s responsibilities arise from the Education Act 1989 and the Crown Entities Act 2004.
Responsibilities of the Auditor
We are responsible for expressing an independent opinion on the financial statements and statement
of service performance and reporting that opinion to you based on our audit. Our responsibility arises
from section 15 of the Public Audit Act 2001 and the Crown Entities Act 2004.
Independence
When carrying out the audit, we followed the independence requirements of the Auditor-General,
which incorporate the independence requirements of the New Zealand Institute of Chartered
Accountants.
Other than the audit, we have no relationship with or interests in the Institute or any of its subsidiaries.
Clarence Susan
Audit New Zealand
On behalf of the Auditor-General
Tauranga, New Zealand
32 Annual Report 2010

FiNANciAL PERFORMANcE
sTATEMENT OF cOMPREhENsiVE iNcOME FOR ThE yEAR ENDED 31 DEcEMBER 2010
cONsOLiDATED PARENT
Notes Actual2010$’000
Budget2010$’000
Actual2009$’000
Actual2010$’000
Budget2010$’000
Actual2009$’000
government grants 3(a) 46,139 45,890 42,576 46,139 45,890 42,576
student tuition fees 3(b) 24,765 22,697 21,036 24,765 22,697 21,036
Other income 3(c) 11,701 11,202 9,254 11,468 11,202 9,030
Finance income 3(d) 267 119 213 267 119 213
Total income 82,872 79,908 73,079 82,639 79,908 72,855
Expenditure
employee benefit expenses 3(e) (44,113) (40,638) (39,521) (43,567) (40,411) (39,258)
depreciation expense 9 (5,230) (7,528) (6,654) (5,230) (7,528) (6,654)
Amortisation of intangible assets expense 10 (1,080) (600) (768) (1,080) (600) (768)
Materials and consumables 3(g) (23,829) (23,168) (23,577) (24,108) (22,734) (23,310)
Other expenses 3(f) (1,192) (1,403) (653) (1,192) (1,334) (653)
Finance costs 3(d) (282) (607) (245) (282) (507) (245)
impairment of fixed assets (1,613) - - (1,613) - -
Fair value impairment (2,814) - - (3,032) - -
Total expenditure (80,153) (73,944) (71,418) (80,104) (73,114) (70,888)
- - (219) - - -share of associates surplus/(deficit)
Net surplus/(deficit) for the period 2,719 5,964 1,442 2,535 6,794 1,967
Total comprehensive income 2,719 5,964 1,442 2,535 6,794 1,967
Total comprehensive income attributable to:
the Waikato institute of technology 2,781 5,964 1,442 2,535 6,794 1,967
non-controlling interest (62) - - - - -
The accompanying notes form part of these financial statements.
33www.wintec.ac.nz

sTATEMENT OF FiNANciAL POsiTiON As AT 31 DEcEMBER 2010
FiNANciAL PERFORMANcE
cONsOLiDATED PARENT
Notes Actual2010$’000
Budget2010$’000
Actual2009$’000
Actual2010$’000
Budget2010$’000
Actual2009$’000
AssETs
current Assets
Cash and cash equivalents 4 2,626 7,645 1,142 664 7,645 761
debtors and other receivables 6 626 6,534 1,615 2,230 4,343 1,590
inventories 7 11 251 400 11 251 400
Prepayments 138 360 105 138 360 105
3,401 14,790 3,262 3,043 12,599 2,856
Assets classified as held for sale 11 1,933 - 2,986 1,933 - 2,986
Total current Assets 5,334 14,790 6,248 4,976 12,599 5,842
Non-current Assets
Financial assets 8 901 5,200 1,047 901 5,200 1,047
investment in associates 15 - 3,609 2,604 - 3,609 2,823
Property 9 119,773 101,742 101,960 119,773 101,742 101,960
Plant and equipment (excl land and buildings) 9 5,202 2,850 6,478 5,202 2,850 6,478
Assets classified as held for sale 11 1,247 1,287 1,247 1,247 1,287 1,247
intangible assets 10 3,091 3,800 4,639 3,091 3,800 4,639
Total Non-current Assets 130,214 118,488 117,975 130,214 118,488 118,194
TOTAL AssETs 135,548 133,278 124,223 135,190 131,087 124,036
LiABiLiTiEs
current Liabilities
trade and other payables 12 5,711 1,574 5,280 4,748 3,579 4,304
employee entitlements 13 2,353 2,428 1,709 2,353 2,428 1,709
Revenue received in advance 14 3,348 2,796 2,975 3,348 2,796 2,975
Total current Liabilities 11,412 6,798 9,964 10,449 8,803 8,988
34 Annual Report 2010

FiNANciAL PERFORMANcE
cONsOLiDATED PARENT
Notes Actual2010$’000
Budget2010$’000
Actual2009$’000
Actual2010$’000
Budget2010$’000
Actual2009$’000
Non-current Liabilities
interest-bearing loans and borrowings 16 10,400 8,314 3,300 10,400 8,500 3,300
employee entitlements 13 478 - 423 478 - 423
Total Non-current Liabilities 10,878 8,314 3,723 10,878 8,500 3,723
TOTAL LiABiLiTiEs 22,290 15,112 13,687 21,327 17,303 12,711
NET AssETs 113,258 118,166 110,536 113,863 113,784 111,325
EQUiTy
general funds 96,294 101,126 93,513 96,837 96,744 94,302
Restricted reserves 126 140 123 126 140 123
Asset revaluation reserve 16,900 16,900 16,900 16,900 16,900 16,900
Total equity attributable to the Institute 113,320 118,166 110,536 113,863 113,784 111,325
non-controlling interest (62) - - - - -
TOTAL EQUiTy 17 113,258 118,166 110,536 113,863 113,784 111,325
The accompanying notes form part of these financial statements.
these financial statements were approved for signing by the Council on 19/04/2011.
M Flowers P Holloway
Chief executive Chief Financial Officer
35www.wintec.ac.nz

cONsOLiDATED PARENT
Notes Actual2010$’000
Budget2010$’000
Actual2009$’000
Actual2010$’000
Budget2010$’000
Actual2009$’000
cash flows from operating activities
Receipt of government grants 46,512 44,390 45,687 46,512 44,390 45,687
Receipt of student tuition fees 24,125 22,812 20,815 24,125 22,812 20,815
interest income received 267 119 277 267 119 277
Receipt of research income - - - - - -
dividend income - - - - - -
Receipt of other income 9,303 8,024 8,667 9,070 8,024 8,700
Payments to employees (43,762) (40,411) (38,855) (43,764) (40,411) (38,592)
Payments to suppliers (21,962) (24,068) (23,426) (23,398) (24,068) (24,103)
interest paid (282) (507) - (282) (507) -
goods and services tax 184 - - 274 - -
Net cash flows from operating activities 5 14,385 10,359 13,165 12,804 10,359 12,784
cash flows from investing activities
Purchase of property, plant and equipment (22,878) (17,529) (11,913) (22,878) (17,529) (11,913)
Purchase of intangible assets (641) (4,000) - (641) (4,000) -
Acquisition of investments - - - - - -
Receipts from sale of investments - - - - - -
Proceeds from sale of property, plant and equipment
3,518 8,165 3 3,518 8,165 3
Net cash flows used in investing activities (20,001) (13,364) (11,910) (20,001) (13,364) (11,910)
FiNANciAL PERFORMANcE
sTATEMENT OF cAsh FLOWs As AT 31 DEcEMBER 2010
36 Annual Report 2010

FiNANciAL PERFORMANcE
cONsOLiDATED PARENT
Notes Actual2010$’000
Budget2010$’000
Actual2009$’000
Actual2010$’000
Budget2010$’000
Actual2009$’000
cash flows from financing activities
Capital contributions received from the Crown - - - - - -
suspensory loans from the Crown - - - - - -
Proceeds from borrowings 10,400 4,800 - 10,400 4,800 -
Repayment of borrowings (3,300) (3,300) - (3,300) (3,300) -
Payment finance leases - - - - - -
Net cash flows from financing activities 7,100 1,500 - 7,100 1,500 -
net increase / (decrease) in cash and cash equivalents
1,484 (1,505) 1,255 (97) (1,505) 874
Cash and cash equivalents at the beginning of the period
1,142 1,286 (113) 761 1,286 (113)
cash and cash equivalents at the end of the period
4 2,626 (219) 1,142 664 (219) 761
the gst (net) component of operating activities reflects the net gst paid to and received from the inland Revenue department.
the gst (net) component has been presented on a net basis, as the gross amounts do not provide meaningful information for Financial statement purposes. this also maintains consistency with the presentation basis of the other primary financial statements.
The accompanying notes form part of these financial statements.
37www.wintec.ac.nz

FiNANciAL PERFORMANcE
PARENT
Public Equity$’000
Retained Earnings $’000
TrustFunds$’000
RevaluationReserve$’000
Total$’000
At 1 january 2010 53,558 40,744 123 16,900 111,325Movement in trust Funds - - 3 - 3Crown contribution - - - - -
total comprehensive income - 2,535 - - 2,535
31 December 2010 53,558 43,279 126 16,900 113,863
At 1 january 2009 53,558 38,777 140 16,900 109,375
Movement in trust Funds - - (17) - (17)
Crown contribution - - - - -
total comprehensive income - 1,967 - - 1,967
31 December 2009 53,558 40,744 123 16,900 111,325
The accompanying notes form part of these financial statements.
sTATEMENT OF chANGEs iN EQUiTy FOR ThE yEAR ENDED 31 DEcEMBER 2010
38 Annual Report 2010

FiNANciAL PERFORMANcE
cONsOLiDATED
Public Equity$’000
Retained Earnings $’000
TrustFunds$’000
RevaluationReserve$’000
Total$’000
At 1 january 2010 53,558 39,955 123 16,900 110,536
Movement in trust Funds - - 3 - 3
Crown contribution - - - - -
total comprehensive income - 2,719 - - 2,719
31 December 2010 53,558 42,674 126 16,900 113,258
Total comprehensive income attributable to:
the Waikato institute of technology - 2,781 - - 2,781
non-controlling interest - (62) - - (62)
Total comprehensive income - 2,719 - - 2,719
At 1 january 2009 53,558 38,513 140 16,900 109,111
Movement in trust Funds - - (17) - (17)
Crown contribution - - - - -
total comprehensive income - 1,442 - - 1,442
31 December 2009 53,558 39,955 123 16,900 110,536
The accompanying notes form part of these financial statements.
39www.wintec.ac.nz

FiNANciAL PERFORMANcE
NOTEs TO ThE FiNANciAL sTATEMENTs FOR ThE yEAR ENDED 31 DEcEMBER 2010
1 REPORTiNG ENTiTy
the Waikato institute of technology (the institute) is a tertiary education institution (tei) and is governed by the Crown entities Act 2004 and the education Act 1989. it provides full-time and part-time tertiary education in new Zealand.
the financial statements of the institute for the year ended 31 december 2010 were authorised for issue in accordance with a resolution of the Councillors on 19 April 2011. Council does not have the power to amend the statements after issue.
the consolidated financial statements include the following subsidiaries: sOdA inc limited, the Wintec Foundation and associates in vital english ltd and the Hamilton Fibre networks ltd (HFnl). these entities are all incorporated in new Zealand. Refer to note 26 for further details of all entities included in the group.
the primary objective of the institute and group is to provide tertiary education services for the benefit of the community rather than making a financial return. Accordingly, the institute has designated itself and the group as public benefit entities for the purposes of new Zealand equivalents to international Financial Reporting standards (nZiFRs).
2 sUMMARy OF siGNiFicANT AccOUNTiNG POLiciEs
statement of compliancethe financial statements of the institute and group have been prepared in accordance with the requirements of generally accepted accounting practice in new Zealand and the requirements of the Crown entities Act 2004 and the education Act 1989.
the Waikato institute of technology is a public benefit entity for the purpose of complying with generally accepted accounting practice in new Zealand and nZ iFRs.
Measurement basisthe financial statements have also been prepared on a historical cost basis, except for investment properties, assets classified as held for sale, land and buildings that have been measured at fair value.
Functional and presentation currencythe financial statements are presented in new Zealand dollars and all values are rounded to the nearest thousand dollars ($’000). the functional currency of the institute and its subsidaries is new Zealand dollars (nZ$)
changes in accounting policiesthere have been no changes in accounting policies during the financial year.
standards, amendments, and interpretations issued that are not yet effective and have not been early adoptedstandards, amendments, and interpretations issued but not yet effective that have not been early adopted, and are relevant to the institute and group are:
• nZ iAs 24 Related Party disclosures (Revised 2009) replaces nZ iAs 24 Related Party disclosures (issued 2004) and will be applied for the first-time in the institute and group’s 31 december 2011 financial statements. the revised standard:
i) Removes the previous disclosure concessions applied by the institute for arms-length transactions between the institute and entities controlled or significantly influenced by the Crown. the effect of the revised standard is that more information is required to be disclosed about transactions between the institute and entities controlled or significantly influenced by the Crown.
ii) Clarifies that related party transactions include commitments with related parties.
• nZ iFRs 9 Financial instruments will eventually replace nZ iAs 39 Financial instruments: Recognition and Measurement. nZ iAs 39 is being replaced through the following 3 main phases: Phase 1 Classification and Measurement, Phase 2 impairment Methodology,
40 Annual Report 2010

FiNANciAL PERFORMANcE
and Phase 3 Hedge Accounting. Phase 1 on the classification and measurement of financial assets has been completed and has been published in the new financial instrument standard nZ iFRs 9. nZ iFRs 9 uses a single approach to determine whether a financial asset is measured at amortised cost or fair value, replacing the many different rules in nZ iAs 39. the approach in nZ iFRs 9 is based on how an entity manages its financial instruments (its business model) and the contractual cash flow characteristics of the financial assets. the new standard also requires a single impairment method to be used, replacing the many different impairment methods in nZ iAs 39. the new standard is required to be adopted for the year ended 31 december 2013. the institute and group has not yet assessed the impact of the new standard and expects it will not be early adopted.
Basis of consolidationthe purchase method is used to prepare group financial statements, which involves adding together items of assets, liabilities, equity, income and expenses on a line by line basis. All significant intergroup balances, transactions, income and expenses are eliminated on consolidation. Wintec’s investments in its subsidiaries are carried at cost in Wintec’s own ‘parent entity’ financial statements.
the consolidated financial statements incorporate the assets and liabilities of all subsidiaries of the institute as at balance date and the results of all subsidiaries for the year then ended.
subsidiaries are all those entities over which the group has power to govern the financial and operating policies of the entity, generally a company with a shareholding of more than one half of the voting rights. the existence and effect of potential voting rights that are currently exercisable or convertible are considered when assessing when the group controls another entity.
inter-company transactions, balances and unrealised gains on transactions between group companies are eliminated. unrealised losses are also eliminated unless the transaction provides evidence of the impairment of the asset transferred. Accounting policies of subsidiaries have been changed where necessary to ensure consistency with the policies adopted by the group.
the institute’s investments in associates are carried at fair value in the institute’s parent financial statements and accounted for on an equity basis in the consolidated accounts. An associate is an entity over which the institute has significant influence and that is neither a subsidiary nor an interest in a joint venture. the investment in an associate is initially recognised at cost and the carrying amount is
increased or decreased to recognise the group’s share of the surplus or deficit of the associate after the date of acquisition. the group’s share of the surplus or deficit of the associate is recognised in the group surplus or deficit. distributions received from an associate reduce the carrying amount of the investment in the group financial statements.
Where the group transacts with an associate, the surplus or deficit is eliminated to the extent of the group’s interest in the relevant associate.
dilution gains or losses arising from investments in associates are recognised in the surplus or deficit.
joint Venturethe institute’s jointly controlled entity interest is accounted for by proportionate consolidation in the group financial statements. the group combines its share of the joint venture’s individual income and expenses, assets and liabilities, and cash flows on a line-by-line basis with similar items in the institute and group’s financial statements.
the group recognises the portion of gains or losses on the sale of assets by the group to the joint venture that is attributable to the other venturers.
investments in jointly controlled entities are carried at cost in the institute’s parent entity financial statements.
41www.wintec.ac.nz

FiNANciAL PERFORMANcE
NOTEs TO ThE FiNANciAL sTATEMENTs (cONTiNUED) FOR ThE yEAR ENDED 31 DEcEMBER 2010
Property, plant and equipmentthe measurement basis used for determining the gross carrying amount for each class of assets is as follows:
• land and buildings are measured at fair value less subsequent accumulated depreciation and subsequent accumulated impairment losses.
• Plant and equipment, motor vehicles, library and computer hardware are stated at cost less accumulated depreciation and any accumulated impairment in value.
RevaluationsFollowing initial recognition at cost, land and buildings are carried at a revalued amount which is the fair value at the date of the revaluation less any subsequent accumulated depreciation on buildings and accumulated impairment loss.
Fair value is determined by reference to market-based evidence, which is the amount for which the assets could be exchanged between a knowledgeable willing buyer and a knowledgeable willing seller in an arm’s-length transaction as at the valuation date.
Revaluation of property, plant and equipment is carried out on a class of asset basis.
the net revaluation results are credited or debited to other comprehensive income and are accumulated to an asset
revaluation reserve in equity for that class of asset. Where this would result in a debit balance in the asset revaluation reserve, this balance is not recognised in other comprehensive income but is recognised in the surplus or deficit. Any subsequent increase on revaluation that off-sets a previous decrease in value recognised in the surplus or deficit will be recognised first in the surplus or deficit up to the amount previously expensed, and then recognised in other comprehensive income.
Any accumulated depreciation as at revaluation date is eliminated against the gross carrying amount of the asset and the net amount is restated to the revalued amount of the asset.
Additionsthe cost of an item of property, plant and equipment is recognised as an asset if, and only if, it is probable that future economic benefits or service potential associated with the item will flow to the institute and group and the cost of the item can be measured reliably.
independent valuations are performed with sufficient regularity (at least once every three years) to ensure that the carrying amount does not differ materially from the assets’ fair value at the balance sheet date.
Work in progress is recognised at cost less impairment and is not depreciated.
Disposalsgains and losses on disposals are determined by comparing the disposal proceeds with the carrying amount of the asset. gains and losses on disposals are reported net in the surplus or deficit. When revalued assets are sold, the amounts included in property revaluation reserves in respect of those assets are transferred to general funds.
An item of property, plant and equipment is de-recognised upon disposal or when no future economic benefits are expected to arise from the continued use of the asset.
Any gain or loss arising on de-recognition of the asset (calculated as the difference between the net disposal proceeds and the carrying amount of the item) is included in the statement of Financial Performance in the year the item is de-recognised.
depreciation is calculated on a straight-line basis over the estimated useful life of the asset as follows:
class of assets Rate (pa)
land 0%
Plant & equipment 5% - 33.33%
Motor vehicles 20%
library 20%
Computer hardware 25% - 33.33%
Buildings
structure 1-84 years
Fitout 1-19 years
services 1-22 years
42 Annual Report 2010

FiNANciAL PERFORMANcE
Impairmentthe carrying values of plant and equipment other than those whose future economic benefits are not directly related to their ability to generate net cash are reviewed for impairment when events or changes in circumstances indicate that the carrying value may not be recoverable.
value in use is depreciated replacement cost for an asset where the future economic benefits or service potential of the asset are not primarily dependent on the asset’s ability to generate net cash inflows and where the institute and group would, if deprived of the asset, replace its remaining future economic benefits or service potential.
For an asset that does not generate largely independent cash inflows, the recoverable amount is determined for the cash-generating unit to which the asset belongs.
if any such indication exists and where the carrying values exceed the estimated recoverable amount, the assets or cash-generating units are written down to their recoverable amount.
the recoverable amount of plant and equipment is the greater of fair value less costs to sell and value in use. in assessing value in use, the estimated future cash flows are discounted to their present value using a discount rate that reflects current market assessments of the time value of money and the risks specific to the asset.
if an asset’s carrying amount exceeds its recoverable amount, the asset is impaired and the carrying amount is written-down to the recoverable amount. For revalued assets the impairment loss is recognised in other comprehensive income to the extent the impairment loss does not exceed the amount in the revaluation reserve in equity for that same class of asset. Where that results in a debit balance in the revaluation reserve, the balance is recognised in the surplus or deficit.
Assets held for educational and related matters and related activities are assessed for impairment by considering the assets for obsolescence, changes in useful life assessments, optimisation and other related matters.
Held for saleProperty, plant and equipment is re-classified as a non-current asset held for sale when its carrying amount will be recovered principally through a sale transaction rather than through continuing use. the re-classification takes place when the asset is considered to be available for immediate sale in its present condition subject only to the usual and customary terms for sales of such assets and the sale is considered highly probable.
intangible assetsComputer softwareAcquired computer software licences are capitalised on the basis of the costs incurred to acquire and bring to use the specific software.
Costs that are directly associated with the development of software for internal use, are recognised as an intangible asset. direct costs include the software development employee costs and an appropriate portion of relevant overheads. After initial recognition, separately acquired intangible assets are carried at cost less accumulated amortisation and accumulated impairment losses.
A summary of the policies applied to the institute’s intangible assets is as follows:
Amortisationthe amortisation period and amortisation method for each class of intangible asset having a finite life is reviewed at each financial year-end. if the expected useful life or expected pattern of consumption is different from the previous assessment, changes are made accordingly. the carrying value of an intangible asset with a finite life is amortised on a straight-line basis over its useful life.
computer software
Method
useful lives Finite - 5 years
Method used straight line method
internally generated / Acquired
separately acquired
43www.wintec.ac.nz

FiNANciAL PERFORMANcE
NOTEs TO ThE FiNANciAL sTATEMENTs (cONTiNUED) FOR ThE yEAR ENDED 31 DEcEMBER 2010
intangible assets that have an indefinite useful life, or are not yet available for use, are not subject to amortisation and are tested annually for impairment. Assets that have a finite useful life are reviewed for indicators of impairment at each balance date. When there is an indicator of impairment the asset’s recoverable amount is estimated. An impairment loss is recognised for the amount by which the asset’s carrying amount exceeds its recoverable amount. the recoverable amount is the higher of an asset’s fair value less costs to sell and value in use.
gains or losses arising from de-recognition of an intangible asset are measured as the difference between the net disposal proceeds and the carrying amount of the asset and are recognised in the comprehensive income statement when the asset is de-recognised.
staff training costs are recognised as an expense when incurred.
Costs associated with maintaining computer software are recognised as an expense when incurred.
Course development costsCourse development costs are recognised as an expense in the statement of Comprehensive income in the year in which they are incurred.
Research costResearch costs are recognised as an expense in the surplus or deficit in the year in which they are incurred.
investment propertiesProperties leased to third parties under operating leases are classified as investment property unless the property is held to meet service delivery objectives, rather than to earn rentals or for capital appreciation. Property held to meet service delivery objectives is classified as property, plant, and equipment.
An investment property is initially measured at its cost including transaction cost. Where an investment property is acquired at no cost or nominal cost, its cost is deemed to be its fair value as at the date of acquisition.
subsequent to initial recognition investment properties are stated at fair value as at each balance sheet date.
gains or losses arising from changes in the fair values of investment properties are recognised in the surplus or deficit.
investment properties are de-recognised when they have either been disposed of or when the investment property is permanently withdrawn from use and no future benefit is expected from its disposal.
Any gains or losses on de-recognition of an investment property are recognised in the surplus or deficit.
inventoriesinventories are valued at the lower of cost and net realisable value. inventories held for distribution or consumption in the provision of services that are not supplied on a commercial basis are measured at cost (using the FiFO method), adjusted when applicable, for any loss of service potential. Where inventories are acquired at no cost or for nominal consideration, the cost is the current replacement cost at the date of acquisition.
Costs incurred in bringing each product to its present location and condition are accounted for as follows:
• inventories held for resale-purchase cost on a first-in, first-out basis.
• Materials and consumables to be utilised for rendering of services- purchase cost on a first-in, first-out basis.
net realisable value is the estimated selling price in the ordinary course of activities less the estimated costs necessary to make the sale.
student fees and other receivablesstudent fees and other receivables are recognised and carried at original receivable amount less an allowance for any uncollectible amounts.
Bad debts are written off when identified.
44 Annual Report 2010

FiNANciAL PERFORMANcE
cash and equivalentsCash in the balance sheet comprises cash at bank and in hand and short-term deposits with an original maturity of three months or less.
For the purpose of the statement of Cash Flows, cash and cash equivalents consist of cash and cash equivalents as defined above, net of outstanding bank overdrafts.
creditors and other payablesCreditors and other payables are initially measured at fair value and subsequently measured at amortised cost using the effective interest method.
interest-bearing loans and borrowingAll loans and borrowings are initially recognised at cost, being the fair value of the consideration received net of transaction costs associated with the borrowing.
After initial recognition, interest-bearing loans and borrowings are measured at amortised cost using the effective interest method. Amortised cost is calculated by taking into account any transaction costs and any discount or premium on settlement.
Borrowings are classified as current liabilities unless the institute or group has an unconditional right to defer settlement of the liability for at least 12 months after the balance date or if the borrowings are expected to be settled within 12 months of the balance date.
LeasesFinance leasesA finance lease is a lease that transfers to the institute substantially all the risks and benefits incidental to ownership of the leased item. these are capitalised at the inception of the lease at the fair value of the leased property or, if lower, at the present value of the minimum lease payments. the institute has received ministerial approval for all such leases.
lease payments are apportioned between the finance charges and reduction of the lease liability so as to achieve a constant rate of interest on the remaining balance of the liability. Finance charges are included in the statement of Comprehensive income as finance costs.
Capitalised leased assets are depreciated over the shorter of the estimated useful life of the asset and the lease term.
Operating leasesleases where the lessor retains substantially all the risks and benefits of ownership of the asset are classified as operating leases. initial direct costs incurred in negotiating an operating lease are added to the carrying amount of the leased asset and recognised over the lease term on the same basis as the lease income.
Operating lease payments are recognised as an expense in the statement of Comprehensive income on a straight-line basis over the lease term.
Employee entitlementsShort-term employee entitlementsemployee benefits that are due to be settled within 12 months after the end of the period in which the employee renders the related service are measured at nominal values based on accrued entitlements at current rates of pay. these include salaries and wages accrued up to balance date, annual leave earned to but not yet taken at balance date, and sick leave. A liability for sick leave is recognised to the extent that absences in the coming year are expected to be greater than the sick leave entitlements earned in the coming year. the amount is calculated based on the unused sick leave entitlement that can be carried forward at balance date, to the extent it will be used by staff to cover those future absences. A liability and an expense is recognised for bonuses where contractually obliged or where there is a past practice that has created a constructive obligation.
Long-term employee entitlementsemployee benefits that are due to be settled beyond 12 months after the end of the period in which the employee renders the related service, such as long service leave and retirement gratuities, have been calculated on an actuarial basis. the calculations are based on:
• likely future entitlements accruing to staff, based on years of service, years to entitlement, the likelihood that staff will reach the point of entitlement, and contractual entitlement information; and
45www.wintec.ac.nz
FiNANciAL PERFORMANcE
NOTEs TO ThE FiNANciAL sTATEMENTs (cONTiNUED) FOR ThE yEAR ENDED 31 DEcEMBER 2010
• the present value of the estimated future cash flows.
sick leave, annual leave, vested long service leave, non-vested long service leave and retirement gratuities expected to be settled within 12 months of the balance date, are classified as a current liability. All other employee entitlements are classified as a non-current liability.
superannuation schemesDefined contribution schemesObligations for contributions to Kiwisaver, the government superannuation Fund, and other defined contribution superannuation schemes are recognised as an expense in the surplus or deficit as incurred.
ProvisionsProvisions are recognised when the institute has a present obligation (legal or constructive) as a result of a past event, it is probable that an outflow of resources embodying economic benefits will be required to settle the obligation, and a reliable estimate can be made of the amount of the obligation.
if the effect of the time value of money is material, provisions are determined by discounting the expected future cash flows at a pre-tax rate that reflects current market assessments of the time value of money and, where appropriate, the risks specific to the liability.
Provisions are reviewed at each balance sheet date and adjusted to reflect the current best estimate. Where it is no longer probable that an outflow of resources embodying economic benefits will be required to settle the obligation, the provision shall be reversed.
Where discounting is used, the increase in the provision due to the passage of time is recognised as a finance cost.
Borrowing coststhe institute and group have elected to defer the adoption of the revised nZ iAs 23 Borrowing Costs (Revised 2007) in accordance with the transitional provisions of nZ iAs 23 that are applicable to public benefit entities.
Consequently, all borrowing costs are recognised as an expense in the period in which they are incurred.
RevenueRevenue is recognised to the extent that it is probable that the economic benefits will flow to the institute and the revenue can be reliably measured. the following specific recognition criteria must also be met before revenue is recognised:
Government grantsgovernment grants are recognised as revenue upon entitlement.
Student tuition feesstudent tuition fees are recognised as revenue. stage of completion
is measured by reference to the days of course completed as a percentage of total days for each course.
Research IncomeFunding received for research which will provide reciprocal benefits to the research funding provider is recognised as revenue on a percentage completion basis. the percentage of completion is measured by reference to the research expenditure incurred as a proportion of the total expected to be incurred.
Funding received which provides no reciprocal benefit to the research funding provider is recognised as revenue when the funding is received.
Sale of materials Revenue is recognised when the significant risks and rewards of ownership have passed to the buyer and can be reliably measured.
Interest and dividendsinterest income is recognised using the effective interest method.
dividends are recognised when the right to receive payment has been established.
Equityequity is measured as the difference between total assets and total liabilities. equity is disaggregated and classified into a number of components. the components of equity are:
46 Annual Report 2010

FiNANciAL PERFORMANcE
• general funds;• Property revaluation reserves; • Fair value through other
comprehensive income reserves; and
• Restricted reserves.
Restrictive reservesRestricted reserves are a component of equity generally representing a particular use to which various parts of equity have been assigned. Reserves may be legally restricted or created by the institute. transfers from these Reserves may be made only for certain specified purposes or when certain specified conditions are met.
Property revaluation reservesthis reserve relates to the revaluation of property, plant, and equipment to fair value. Fair value through other comprehensive income reservesthis reserve comprises the cumulative net change in the fair value of fair value through other comprehensive income instruments. Goods and services taxRevenues, expenses and assets are recognised net of the amount of goods and services tax (gst) except:
• Where the gst incurred on a purchase of goods and services is not recoverable from the taxation authority, in which case the gst is recognised as part of the cost of acquisition of the asset or as part of the expense item as applicable; and
• Receivables and payables are stated with the amount of gst included.
the net amount of gst recoverable from, or payable to, the taxation authority is included as part of receivables or payables in the statement of Financial Position.
Cash flows are included in the Cash Flow statement on a gross basis and the gst component of cash flows arising from investing and financing activities, which is recoverable from, or payable to, the taxation authority, is classified as operating cash flows.
Commitments and contingencies are disclosed net of the amount of gst recoverable from, or payable to, the taxation authority.
investments and other financial assetsRecognition and measurementinvestments and financial assets in the scope of nZ iAs 39 Financial Instruments are categorised as either financial assets at fair value through surplus of deficit, loans and receivables or fair value through other comprehensive income. the classification depends on the purpose for which the investments were acquired. designation is re-evaluated at each financial year end, but there are restrictions on reclassifying to other categories.
Financial assets are initially recognised at fair value plus transaction costs unless they
are carried at fair value through surplus or deficit in which case the transaction costs are de-recognised in the surplus or deficit.
Recognition and de-recognition Financial assets are de-recognised when the rights to receive cash flows from the financial assets have expired or have been transferred and the institute and group has transferred substantially all the risks and rewards of ownership.
Financial assets are classified into the following categories for the purposes of measurement.• Fair value through surplus
or deficit;• loans and receivables; and• Fair value through other
comprehensive income. Classification of the financial asset depends on the purpose for which the instruments were acquired.
Financial assets at fair value through surplus or deficit Financial assets at fair value through surplus or deficit include financial assets held for trading. A financial asset is classified in this category if acquired principally for the purpose of selling in the short-term or is part of a portfolio that are managed together and for which there is evidence of short-term profit taking. derivatives are also categorised as held for trading unless they are designated into a hedge accounting relationship for which hedge accounting is applied.
47www.wintec.ac.nz
FiNANciAL PERFORMANcE
NOTEs TO ThE FiNANciAL sTATEMENTs (cONTiNUED) FOR ThE yEAR ENDED 31 DEcEMBER 2010
Financial assets acquired principally for the purpose of selling in the short-term or part of a portfolio classified as held for trading are classified as a current asset. the current/non-current classification of derivatives is explained in the derivatives accounting policy above. the initial recognition of financial assets in this category is measured at their fair values with gains or losses on re-measurement recognised in the surplus or deficit.
Loans and receivables (including cash and cash equivalents and debtors and other receivables)loans and receivables including loan notes and loans to key management personnel are non-derivative financial assets with fixed or determinable payments that are not quoted in an active market. they are included in current assets, except for maturities greater than 12 months after the balance date, which are included in non-current assets. Related party receivables that are repayable on demand are classified as non-current assets because repayment of the receivable is not expected within 12 months of balance date.
After initial recognition, loans and receivables are measured at amortised cost using the effective interest method less any provision for impairment. gains and losses when the asset is impaired or de-recognised are recognised in the surplus or deficit.
Financial assets at fair value through other comprehensive incomeFinancial assets at fair value through other comprehensive income are those that are designated as fair value through other comprehensive income or are not classified in any of the other categories above. they are included in non-current assets unless management intends to dispose of the investment within 12 months of balance date. the institute and group designates in this category:
• investments that it intends to hold long-term but which may be realised before maturity; and
• shareholdings that it holds for strategic purposes.
After initial recognition these investments are measured at their fair value, with gains and losses recognised in other comprehensive income, except for impairment losses, which are recognised in the surplus or deficit.
On de-recognition the cumulative gain or loss previously recognised in other comprehensive income is reclassified from equity to the surplus or deficit.
Available-for-sale securitiesAvailable-for-sale investments are those non-derivative financial assets, principally equity securities, designated as available-for-sale or, not classified as any of the three preceding categories. After initial recognition, available-for-sale securities are measured at fair value with gains or losses being
recognised in other comprehensive income until the investment is de-recognised or until the investment is determined to be impaired, at which time the cumulative gain or loss previously reported in equity is recognised in surplus or deficit.
the fair values of investments that are actively traded in organised financial markets are determined by reference to quoted market bid prices at the close of business on the balance sheet date. For investments with no active market, fair values are determined using valuation techniques. such techniques include: using recent arm’s-length market transactions; reference to the current market value of another instrument that is substantially the same; discounted cash flow analysis; and option pricing models making as much use of available and supportable market data as possible and keeping judgemental inputs to a minimum.
impairment of financial assetsAt each balance date, the institute and group assesses whether there is any objective evidence that a financial asset or group of financial assets is impaired. Any impairment losses are recognised in surplus or deficit.
Loans and receivables (including cash and cash equivalents and debtors and other receivables)impairment of a loan or a receivable is established when there is objective evidence that the institute and group will not be able to collect amounts due according to the original terms of the debt.
48 Annual Report 2010

FiNANciAL PERFORMANcE
significant financial difficulties of the debtor, probability that the debtor will enter into bankruptcy, and default in payments are considered indicators that the asset is impaired. the amount of the impairment is the difference between the asset’s carrying amount and the present value of estimated future cash flows, discounted using the original effective interest rate. For debtors and other receivables, the carrying amount of the asset is reduced through the use of an allowance account, and the amount of the loss is recognised in the surplus or deficit. When the receivable is uncollectible, it is written-off against the allowance account. Overdue receivables that have been renegotiated are reclassified as current (i.e. not past due). For other financial assets, impairment losses are recognised directly against the instruments carrying amount.
Financial assets at fair value through other comprehensive incomeFor equity investments, a significant or prolonged decline in the fair value of the investment below its cost is considered objective evidence of impairment. For debt investments, significant financial difficulties of the debtor, probability that the debtor will enter into bankruptcy, and default in payments are considered objective indicators that the asset is impaired.
equity instrument impairment losses recognised in the surplus or deficit are not reversed through the surplus or deficit.
if impairment evidence exists for investments at fair value through other comprehensive income, the cumulative loss (measured as the difference between the acquisition cost and the current fair value, less any impairment loss on that financial asset previously recognised in the surplus or deficit) recognised in other comprehensive income is reclassified from equity to the surplus or deficit.
if in a subsequent period the fair value of a debt instrument increases and the increase can be objectively related to an event occurring after the impairment loss was recognised, the impairment loss is reversed in the surplus or deficit.
income taxthe institute is exempt from income tax and, therefore, the financial statements do not contain any provision for income tax.
De-recognition of financial instrumentsthe de-recognition of a financial instrument takes place when the institute no longer controls the contractual rights that comprise the financial instrument, which is normally the case when the instrument is sold, or all the cash flows attributable to the instrument are passed through to an independent third party.
changes in accounting estimatesthere have been no changes in accounting estimates during the period.
Financial risk management objectives and policiesthe institute’s principal financial instruments comprise receivables, payables, bank loans and overdrafts, available for sale investments, cash and short-term deposits. the institute manages its exposure to key financial risks, including interest rate and currency risk in accordance with the institute’s financial risk management policy. the objective of the policy is to support the delivery of the institute’s financial targets whilst protecting future financial security.
the main risks arising from the institute’s financial instruments are interest rate risk, foreign currency risk, credit risk and liquidity risk. the institute uses different methods to measure and manage different types of risks to which it is exposed. these include monitoring levels of exposure to interest rate and foreign exchange risk and assessments of market forecasts for interest rate, foreign exchange and commodity prices. Ageing analyses and monitoring of specific credit allowances are undertaken to manage credit risk. liquidity risk is monitored through the development of future rolling cash flow forecasts.
Council reviews and agrees policies for managing each of these risks as summarised on next page.
49www.wintec.ac.nz

FiNANciAL PERFORMANcE
NOTEs TO ThE FiNANciAL sTATEMENTs (cONTiNUED) FOR ThE yEAR ENDED 31 DEcEMBER 2010
Primary responsibility for identification and control of financial risks rests with the Finance and Audit Committee under the authority of Council. Council reviews and agrees policies for managing each of the risks identified below, including the setting of limits for trading in derivatives, hedging cover of foreign currency and interest rate risk, credit allowances, and future cash flow forecast projections.
Risk exposures and responses Interest rate risk the institute’s exposure to market interest rates relates primarily to the institute’s long-term debt obligations. the level of debt is disclosed in the notes to the financial statements.
the institute constantly analyses its interest rate exposure. Within this analysis consideration is given to potential renewals of existing positions, alternative financing, alternative hedging positions and the mix of fixed and variable interest rates.
Foreign currency risk the institute only has limited exposure to foreign currency risk. All fees are denominated in nZ dollars to diminish risks associated with revenue streams. Where transactions in foreign currencies are forecast that are material to the institute, forward exchange contracts are entered into to diminish the risk of the group to fluctuations in exchange rates.
Credit riskCredit risk arises from the financial assets of the institute, which comprise cash and cash equivalents, trade and other receivables, available-for-sale financial assets and derivative instruments.
the institute’s exposure to credit risk arises from potential default of the counter party, with a maximum exposure equal to the carrying amount of these instruments. exposure at balance date is addressed in each applicable note. the institute does not hold any credit derivatives to offset its credit exposure. the institute trades only with recognised, creditworthy third parties, and as such collateral is not requested nor is it the institute’s policy to securitise its trade and other receivables.
in addition, receivable balances are monitored on an ongoing basis with the result that the institute’s exposure to bad debts is not significant. there are no significant concentrations of credit risk within the institute and financial instruments are spread amongst a number of financial institutions to minimise the risk of default of counterparties.
Liquidity riskthe institute’s objective is to maintain a balance between continuity of funding and flexibility through the use of bank loans. the institute’s policy is that total borrowings will not exceed
25% of the value of total assets. At 31 december 2010, borrowings were equal to 7.7% of the institute’s total assets (2009: 2.7%).
Key judgements, estimates and assumptionsin preparing these financial statements, the institute and group has made estimates and assumptions concerning the future. these estimates and assumptions may differ from the subsequent actual results. estimates and assumptions are continually evaluated and are based on historical experience and other factors, including expectations or future events that are believed to be reasonable under the circumstances.
the estimates and assumptions that have a significant risk of causing a material adjustment to the carrying amounts of assets and liabilities within the next financial year are discussed below: the following items have been included in the financial statements as a result of key judgements or estimates.
changes to the prior year statement of comprehensive incomeReclassification changes were made to the 2009 year-end figures for itO income classified as teC grants and moved to other income. employee expenses classified as material and consumable expenses were transferred to employee expenses to assist the readers with comparability. these items have been reclassified to reflect the nature of the expenditure and
50 Annual Report 2010

FiNANciAL PERFORMANcE
revenue. the overall changes had no affect on the total surplus for that year.
Impairment of non-financial assets other than goodwill the institute assesses impairment of all assets at each reporting date by evaluating conditions specific to the institute and to the particular asset that may lead to impairment. these include programme performance,technology, economic and political environments and future programmeexpectations. if an impairment trigger exists the recoverable amount of the asset is determined. Management do not consider that the triggers forimpairment testing have been significant enough and therefore no provision has been made during the financial year.
Classification of assets and liabilities as held for sale the institute classifies assets and liabilities as held for sale when its carrying amount will be recovered through a sale transaction. the assets and liabilities must be available for immediate sale and the institute must be committed to selling the asset either through the entering into a contractual sale agreement or the activation and commitment to a programme to locate a buyer and dispose of the assets and liabilities.
Estimation of useful lives of assets the estimation of the useful lives of assets has been based on historical experience as well as manufacturers’ warranties
(for plant and equipment), lease terms (for leased equipment) and turnover policies (for motor vehicles). in addition, the condition of the assets is assessed at least once per year and considered against the remaining useful life. Adjustments to useful lives are made when considered necessary.
Property revaluationsnote 9 provides information about the estimates and assumptions exercised in the measurement of revalued land, buildings and infrastructure.
Employee entitlementsnote 13 provides information about the estimates and assumptions exercised in the measurement of long service leave and retirement gratuities.
capital managementthe institute and group’s capital is its equity, which comprises general funds, and property valuation and fair value through comprehensive income reserves. equity is represented by net assets.
the institute is subject to the financial management and accountability provisions of the education Act 1989, which includes restrictions in relation to: disposing of assets or interests in assets, ability to mortgage or otherwise charge assets or interests in assets, granting leases of land or buildings or parts of buildings, and borrowing.
the institute manages its revenues, expenses, assets, liabilities, investments and general financial dealings prudently and in a manner that promotes the current and future interests of the community. the institute’s equity is largely managed as a by-product of managing revenues, expenses, assets, liabilities, investments and general financial dealings.
the objective of managing the institute’s equity is to ensure that it effectively and efficiently achieves the goals and objectives for which it has been established, while remaining a going concern.
Budget figuresthe budget figures are those given final approval by the Council on 7 december 2009. the budget figures have been prepared in accordance with nZ gAAP, using accounting policies that consistent with those adopted by the Council in preparing these financial statements.
51www.wintec.ac.nz

FiNANciAL PERFORMANcE
NOTEs TO ThE FiNANciAL sTATEMENTs (cONTiNUED) FOR ThE yEAR ENDED 31 DEcEMBER 2010
3 REVENUEs AND ExPENsEs
cONsOLiDATED PARENT
2010$’000
2009$’000
2010$'000
2009$'000
(a) Government grants
student Achievement Component (sAC) funding 32,032 29,635 32,032 29,635
tertiary education Organisational Capability (teOC) funding 11,257 10,109 11,257 10,109
Other tertiary education Commission funding PPBg 1,500 1,229 1,500 1,229
early childhood education facility grant - - - -
Other grants 1,350 1,603 1,350 1,603
Total 46,139 42,576 46,139 42,576
in 2009 & 2010 the institute did not receive an early childhood education facility grant. For other government grants recognised as revenue, there are no unfulfilled conditions nor other contingencies attached to the grants (2009 $nil).
(b) Tuition fees
Fees from domestic students 17,277 14,319 17,277 14,319
Fees from international students 7,488 6,717 7,488 6,717
Total 24,765 21,036 24,765 21,036
(c) Other income
Revenue from childcare operations 789 769 789 769
Revenue from other operating activities 8,514 8,564 8,281 8,340
subtotal 9,303 9,333 9,070 9,109
gain/(loss) on disposal of property, plant and equipment 2,398 (79) 2,398 (79)
Total 11,701 9,254 11,468 9,030
included in revenue from other operating activities of $8.514m (group) and $8.281m (parent) is $0.96m which relates to operating lease receivables (2009: $0.40m).
52 Annual Report 2010

FiNANciAL PERFORMANcE
cONsOLiDATED PARENT
2010$’000
2009$’000
2010$'000
2009$'000
(d) Finance (costs)/income
Bank loans and overdrafts (275) (245) (275) (245)
debt collection fees (7) - (7) -
Total finance costs (282) (245) (282) (245)
interest earned on bank deposits 267 213 267 213
Total finance income 267 213 267 213
(e) Employee benefits expense
Wages and salaries (43,407) (39,572) (42,868) (39,309)
defined contribution plan employer contributions (62) (67) (55) (67)
increase/(decrease) in employee entitlements (644) 118 (644) 118
Total (44,113) (39,521) (43,567) (39,258)
employer contributions to defined contribution plans include contributions to Kiwisaver, the defined Benefit Plan Contributors scheme, and the government superannuation Fund.
(f) Other expenses
Bad debts (495) (15) (495) (15)
Childcare expenses (680) (619) (680) (619)
Hardship grants (17) (19) (17) (19)
Total (1,192) (653) (1,192) (653)
(g) Materials and consumables
included in the materials and consumables expenses of $23.829m (group) and $24.108m (parent) is $0.598m which relates to operating lease payments (2009: $1.156m).
(h) Aggregate research and development costs recognised in the income statement
Research costs charged directly to the income statement and included in Materials and Consumables.
(262) (228) (262) (228)
53www.wintec.ac.nz

FiNANciAL PERFORMANcE
NOTEs TO ThE FiNANciAL sTATEMENTs (cONTiNUED) FOR ThE yEAR ENDED 31 DEcEMBER 2010
4 cAsh AND cAsh EQUiVALENTs
cONsOLiDATED PARENT
2010$’000
2009$’000
2010$'000
2009$'000
Cash at bank and in hand 2,626 1,142 664 761
short-term deposits - - - -
Total 2,626 1,142 664 761
Cash at bank and in hand earns interest at floating rates based on daily bank deposit rates.
short-term deposits are made for varying periods of between one day and three months depending on the immediate cash requirements of the institute, and earn interest at the respective short-term deposit rates.
the carrying value of Cash and Cash equivalents recorded in the financial statements is approximately their fair value.
Reconciliation of cash for the purpose of the cash flow statementFor the purpose of the cash flow statement, cash and cash equivalents comprise the following as at 31 december.
cONsOLiDATED PARENT
2010$’000
2009$’000
2010$'000
2009$'000
Cash at bank and in hand 2,626 1,142 664 761
short-term deposits - - - -
Bank overdrafts - - - -
Total 2,626 1,142 664 761
54 Annual Report 2010

FiNANciAL PERFORMANcE
5 REcONciLiATiON OF NET sURPLUs/(DEFiciT) TO ThE NET cAsh FLOW FROM OPERATiNG AcTiViTiEs
cONsOLiDATED PARENT
2010$’000
2009$’000
2010$'000
2009$'000
surplus / (deficit) from the statement of comprehensive income 2,719 1,442 2,535 1,967
Add/(less) non-cash items
depreciation 5,230 6,654 5,230 6,654
Amortisation 1,080 768 1,080 768
Bad debts 495 - 495 -
impairment of fixed assets 1,613 - 1,613 -
Fair value impairment 2,814 - 3,032 -
Add/(less) items classified as investing or financing activities
(gains)/losses on disposal of property, plant and equipment (2,398) 79 (2,398) 79
investing/financing (282) (759) (282) (978)
interest received 267 - 267 -
Add/(less) movements in working capital items
(increase) / decrease in inventories 389 (149) 389 (149)
(increase) / decrease in trade and other receivables 989 2,948 (640) 2,971
(increase) / decrease in prepayments (33) 641 (33) 641
increase / (decrease) in trade and other payables 1,129 1,337 1,143 627
increase / (decrease) in revenue received in advance 373 221 373 221
increase / (decrease) in Finance leases - - - -
increase / (decrease) in trust Funds - (17) - (17)
Net cash from operating activities 14,385 13,165 12,804 12,784
55www.wintec.ac.nz

FiNANciAL PERFORMANcE
NOTEs TO ThE FiNANciAL sTATEMENTs (cONTiNUED) FOR ThE yEAR ENDED 31 DEcEMBER 2010
6 DEBTORs AND OThER REcEiVABLEs
cONsOLiDATED PARENT
2010$’000
2009$’000
2010$'000
2009$'000
student fees receivables 98 (303) 98 (303)
Related party receivables 44 791 1,648 791
Other receivables 1,009 1,177 1,009 1,152
less provision for impairment (525) (50) (525) (50)
Total 626 1,615 2,230 1,590
Fair valuestudent fees are due before a course commences or are due upon enrolment if the course has already begun. student fee receivables are non-interest bearing and are generally paid in full by course commencement date. therefore, their carrying value approximates their fair value.
Other receivables are non-interest bearing and are generally settled on 30-day terms. therefore, the carrying value of other receivables approximates their fair value.
the ageing profile of receivables as at 31 december 2010 and 2009 are detailed below:
2010 2009Gross$’000
Impairment$’000
Net$’000
Gross$’000
Impairment$’000
Net$’000
not past due 813 - 813 1,131 - 1,131
Past due 1-30 days - - - - - -
Past due 31 –60 days 94 - 94 236 - 236
Past due 61 –90 days 8 - 8 82 - 82
Past due over 90 days 1,840 525 1,315 191 50 141
Total 2,755 525 2,230 1,640 50 1,590
All receivables greater than 30 days in age are considered to be past due.
there are provisions for impairment on receivables with overdue amounts.due to the large number of student fee receivables, the impairment assessment is performed on a collective basis, based on an analysis of past collection history and debt write-offs.
56 Annual Report 2010

FiNANciAL PERFORMANcE
Movements in the provision for impairment of receivables are as follows:
PARENT AND GROUP
2010$’000
2009$’000
At 1 january 50 50
Additional provisions made during the year 475 0
Provisions reversed during the year 0 0
Receivables written-off during the year 0 0
At 31 December 525 50
7 iNVENTORiEs
cONsOLiDATED PARENT
2010$’000
2009$’000
2010$'000
2009$'000
Held for resale 11 396 11 396
Materials and consumables - 4 - 4
Total 11 400 11 400
57www.wintec.ac.nz

FiNANciAL PERFORMANcE
NOTEs TO ThE FiNANciAL sTATEMENTs (cONTiNUED) FOR ThE yEAR ENDED 31 DEcEMBER 2010
8 FiNANciAL AssETs
cONsOLiDATED PARENT
2010$’000
2009$’000
2010$'000
2009$'000
Non-current portion
(i) unlisted shares:- shares in PinZ (at Cost) 38 38 38 38
(ii) loans to associates:-Hamilton Fibre network ltd 741 892 741 892
(iii) special funds investments (term deposits) 122 117 122 117
Total 901 1,047 901 1,047
Fair valueLoans to related partiesloans to related parties are unsecured, non-interest bearing, and are repayable on demand. the fair value of the on demand loans cannot be less than the amount repayable on demand. therefore, the carrying value of the loans on demand reflects their fair value.
Unlisted sharesunlisted shares are held in non-commercial entities and are carried at cost less impairment because either the fair value of the investment cannot be reliably determined using a standardised valuation technique or due to cost not being materially different to fair value.
Special Trust Fundsspecial trust Funds are restricted equity reserves held specifically in trust for the purpose of generating interest for students to access, upon application and meeting specified conditions.
58 Annual Report 2010
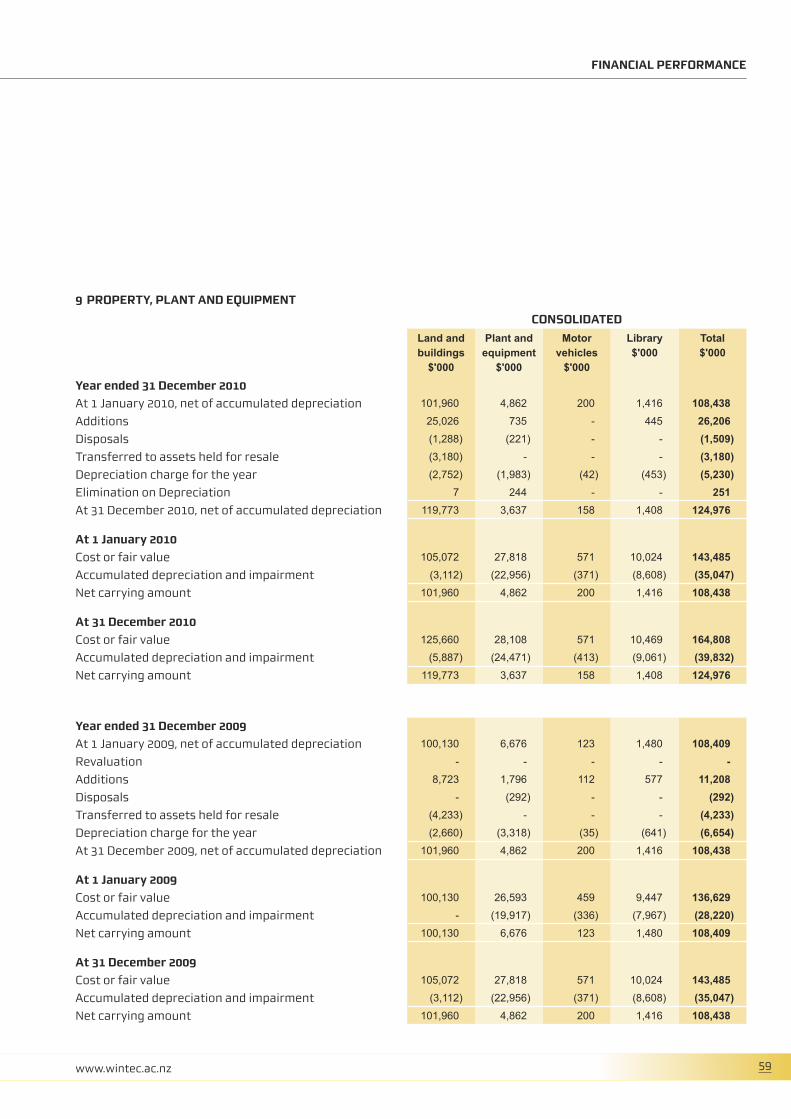
FiNANciAL PERFORMANcE
9 PROPERTy, PLANT AND EQUiPMENT
cONsOLiDATED
Land and buildings$'000
Plant and equipment
$'000
Motor vehicles$'000
Library$'000
Total$'000
year ended 31 December 2010
At 1 january 2010, net of accumulated depreciation 101,960 4,862 200 1,416 108,438Additions 25,026 735 - 445 26,206disposals (1,288) (221) - - (1,509)transferred to assets held for resale (3,180) - - - (3,180)depreciation charge for the year (2,752) (1,983) (42) (453) (5,230)elimination on depreciation 7 244 - - 251At 31 december 2010, net of accumulated depreciation 119,773 3,637 158 1,408 124,976
At 1 january 2010
Cost or fair value 105,072 27,818 571 10,024 143,485Accumulated depreciation and impairment (3,112) (22,956) (371) (8,608) (35,047)net carrying amount 101,960 4,862 200 1,416 108,438
At 31 December 2010
Cost or fair value 125,660 28,108 571 10,469 164,808Accumulated depreciation and impairment (5,887) (24,471) (413) (9,061) (39,832)net carrying amount 119,773 3,637 158 1,408 124,976
year ended 31 December 2009
At 1 january 2009, net of accumulated depreciation 100,130 6,676 123 1,480 108,409Revaluation - - - - -Additions 8,723 1,796 112 577 11,208disposals - (292) - - (292)transferred to assets held for resale (4,233) - - - (4,233)depreciation charge for the year (2,660) (3,318) (35) (641) (6,654)At 31 december 2009, net of accumulated depreciation 101,960 4,862 200 1,416 108,438
At 1 january 2009
Cost or fair value 100,130 26,593 459 9,447 136,629Accumulated depreciation and impairment - (19,917) (336) (7,967) (28,220)net carrying amount 100,130 6,676 123 1,480 108,409
At 31 December 2009
Cost or fair value 105,072 27,818 571 10,024 143,485Accumulated depreciation and impairment (3,112) (22,956) (371) (8,608) (35,047)net carrying amount 101,960 4,862 200 1,416 108,438
59www.wintec.ac.nz

FiNANciAL PERFORMANcE
NOTEs TO ThE FiNANciAL sTATEMENTs (cONTiNUED) FOR ThE yEAR ENDED 31 DEcEMBER 2010
9 PROPERTy, PLANT AND EQUiPMENT
PARENTLand and buildings$'000
Plant and equipment
$'000
Motor vehicles$'000
Library$'000
Total$'000
year ended 31 December 2010At 1 january 2010, net of accumulated depreciation 101,960 4,862 200 1,416 108,438Additions 25,026 735 - 445 26,206disposals (1,288) (221) - - (1,509)transferred to assets held for resale (3,180) - - - (3,180)depreciation charge for the year (2,752) (1,983) (42) (453) (5,230)elimination on depreciation 7 244 - - 251At 31 december 2010, net of accumulated deprecation 119,773 3,637 158 1,408 124,976
At 1 january 2010Cost or fair value 105,072 27,818 571 10,024 143,485Accumulated depreciation and impairment (3,112) (22,956) (371) (8,608) (35,047)net carrying amount 101,960 4,862 200 1,416 108,438
At 31 December 2010Cost or fair value 125,660 28,108 571 10,469 164,808Accumulated depreciation and impairment (5,887) (24,471) (413) (9,061) (39,832)net carrying amount 119,773 3,637 158 1,408 124,976
year ended 31 December 2009
At 1 january 2009, net of accumulated depreciation 100,130 6,676 123 1,480 108,409Revaluation - - - - -Additions 8,723 1,796 112 577 11,208disposals - (292) - - (292)transferred to assets held for resale (4,233) - - - (4,233)depreciation charge for the year (2,660) (3,318) (35) (641) (6,654)At 31 december 2009, net of accumulated depreciation 101,960 4,862 200 1,416 108,438
At 1 january 2009Cost or fair value 100,130 26,593 459 9,447 136,629Accumulated depreciation and impairment - (19,917) (336) (7,967) (28,220)net carrying amount 100,130 6,676 123 1,480 108,409
At 31 December 2009
Cost or fair value 105,072 27,818 571 10,024 143,485Accumulated depreciation and impairment (3,112) (22,956) (371) (8,608) (35,047)net carrying amount 101,960 4,862 200 1,416 108,438
60 Annual Report 2010

FiNANciAL PERFORMANcE
RevaluationsAn independent valuation was obtained to determine fair value of land and buildings. Fair value is determined by reference to an open market basis, being the amount for which the assets could be exchanged between a knowledgeable willing buyer and a knowledgeable willing seller in an arm’s-length transaction at the valuation date for land and buildings of a non-educationally specific nature. Where buildings have been designed specifically for educational purposes they are valued at depreciated replacement cost which is considered to reflect fair value for such assets.
land and buildings were valued by doug saunders, independent registered valuer of the firm telfer young (Waikato) ltd.
the effective date of the revaluation was 31 december 2008.
land and buildings with a carrying amount of $47,251,037 (2009: $31,753,582) included in the property, plant and equipment are owned by the Crown. Although legal title has not been transferred, the institute has assumed all normal risks and rewards of ownership.
Restrictions on titleunder the education Act 1989, the institute and group is required to obtain the consent from the Ministry of education to dispose or sell of property where the value of the property exceeds an amount determined by the Minister.
there are also various restrictions in the form of historic designations, reserve, and endowment encumbrances attached to land. the institute and group does not consider it practical to disclose in detail the value of land subject to these restrictions.
Work in progressthe total amount of property, plant, and equipment in the course of construction is $3,445,947 (2009 $5,782,884).
61www.wintec.ac.nz

FiNANciAL PERFORMANcE
NOTEs TO ThE FiNANciAL sTATEMENTs (cONTiNUED) FOR ThE yEAR ENDED 31 DEcEMBER 2010
10 iNTANGiBLE AssETs
cONsOLiDATED PARENT
ComputerSoftware$’000
Total$’000
Computer Software$'000
Total$'000
year ended 31 December 2010
At 1 january 2010, net of accumulated amortisation 4,639 4,639 4,639 4,639
Additions 641 641 641 641
disposals (1,108) (1,108) (1,108) (1,108)
Amortisation (1,080) (1,080) (1,080) (1,080)
At 31 december 2010, net of accumulated amortisation 3,091 3,091 3,091 3,091
At 1 january 2010
Cost (gross carrying amount) 9,949 9,949 9,949 9,949
Accumulated amortisation (5,310) (5,310) (5,310) (5,310)
net carrying amount 4,639 4,639 4,639 4,639
At 31 December 2010
Cost (gross carrying amount) 9,481 9,481 9,481 9,481
Accumulated amortisation (6,390) (6,390) (6,390) (6,390)
net Carrying amount 3,091 3,091 3,091 3,091
year ended 31 December 2009
At 1 january 2009, net of accumulated amortisation 4,489 4,489 4,489 4,489
Additions 980 980 980 980
disposals (62) (62) (62) (62)
Amortisation (768) (768) (768) (768)
At 31 december 2009, net of accumulated amortisation 4,639 4,639 4,639 4,639
At 1 january 2009
Cost (gross carrying amount) 9,087 9,087 9,087 9,087
Accumulated amortisation (4,598) (4,598) (4,598) (4,598)
net carrying amount 4,489 4,489 4,489 4,489
At 31 December 2009
Cost (gross carrying amount) 9,949 9,949 9,949 9,949
Accumulated amortisation (5,310) (5,310) (5,310) (5,310)
net carrying amount 4,639 4,639 4,639 4,639
there are no restrictions over the title of the institute and group’s intangible assets, nor are any intangible assets pledged as security for liabilities.
62 Annual Report 2010

FiNANciAL PERFORMANcE
11 AssETs hELD FOR sALE
Assets held for sale in 2010 included 1.648 hectares of the Avalon campus and the animal handling building. the anticipated purchase agreement between the institute and the society for the Prevention of Cruelty to Animals (sPCA) did not eventuate in a land sale. the purchase agreement between the institute and the Hamilton City Council was amended from 10.7245ha to 6.4399ha and was finalised in May, 2010. the institute will continue to actively market the land held for sale under current assets in 2011.
Assets held for sale under non-current assets includes 7.6275ha of the Avalon campus which the Council has identified as surplus and available for sale. it is not expected that this land will be sold within the next 12 months.
2010$’000
2009$’000
Assets held for sale
Current Assets 1,933 2,986
non Current Assets 1,247 1,247
Total Assets held for sale 3,180 4,273
12 TRADE AND OThER PAyABLEs
cONsOLiDATED PARENT
2010 $’000
2009 $’000
2010 $’000
2009$’000
trade payables 2,640 3,477 2,640 2,533
Other payables 3,071 1,803 2,108 1,771
interest payable - - - -
Total 5,711 5,280 4,748 4,304
63www.wintec.ac.nz

FiNANciAL PERFORMANcE
NOTEs TO ThE FiNANciAL sTATEMENTs (cONTiNUED) FOR ThE yEAR ENDED 31 DEcEMBER 2010
13 EMPLOyEE ENTiTLEMENTs
cONsOLiDATED PARENT
2010 $’000
2009 $’000
2010 $’000
2009$’000
Employee Entitlements
At 1 january 2,132 2,014 2,132 2,014
Additions during the year 3,571 1,765 3,571 1,765
utilised during the year (2,872) (1,647) (2,872) (1,647)
At 31 December 2,831 2,132 2,831 2,132
Current portion 2,353 1,709 2,353 1,709
non-current portion 478 423 478 423
Total 2,831 2,132 2,831 2,132
14 REVENUE REcEiVED iN ADVANcE
cONsOLiDATED PARENT
2010$’000
2009$’000
2010$'000
2009$'000
student fees 3,348 2,975 3,348 2,975
3,348 2,975 3,348 2,975
Current portion 3,348 2,975 3,348 2,975
non-current portion - - - -
Total 3,348 2,975 3,348 2,975
64 Annual Report 2010
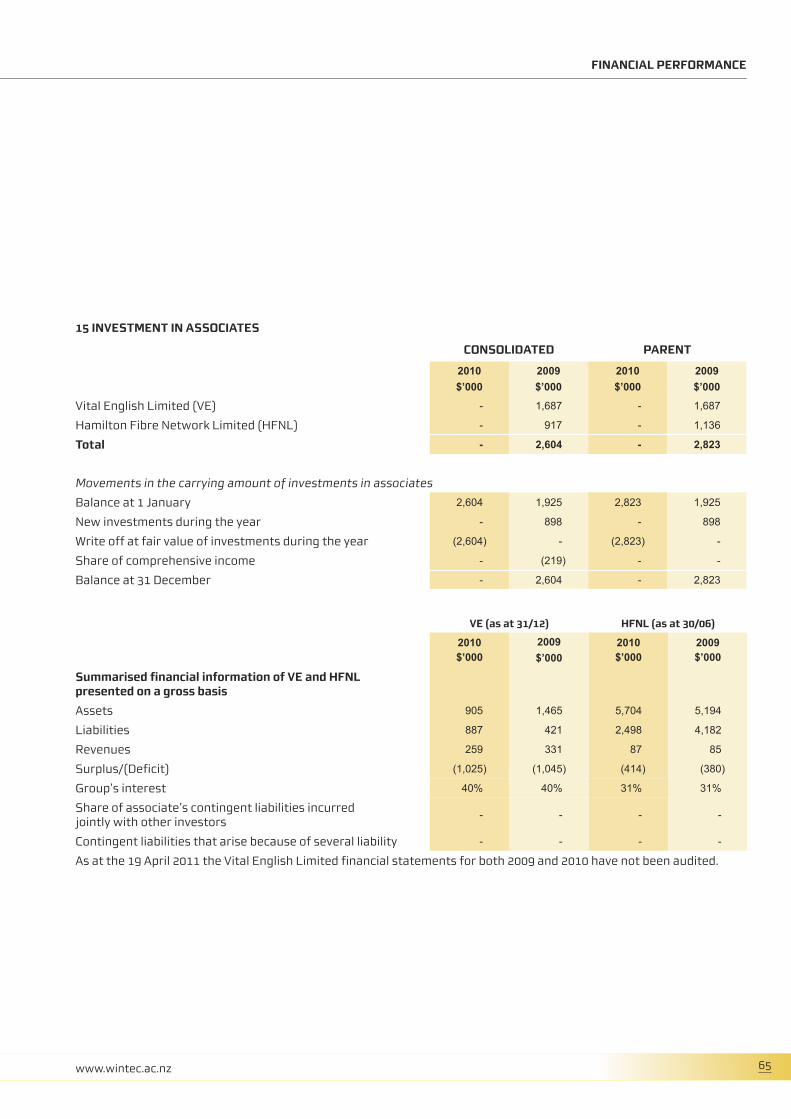
FiNANciAL PERFORMANcE
15 iNVEsTMENT iN AssOciATEs
cONsOLiDATED PARENT
2010$’000
2009$’000
2010$’000
2009$’000
vital english limited (ve) - 1,687 - 1,687
Hamilton Fibre network limited (HFnl) - 917 - 1,136
Total - 2,604 - 2,823
Movements in the carrying amount of investments in associates
Balance at 1 january 2,604 1,925 2,823 1,925
new investments during the year - 898 - 898
Write off at fair value of investments during the year (2,604) - (2,823) -
share of comprehensive income - (219) - -
Balance at 31 december - 2,604 - 2,823
VE (as at 31/12) hFNL (as at 30/06)
2010$’000
2009$’000
2010$’000
2009$’000
summarised financial information of VE and hFNL presented on a gross basis
Assets 905 1,465 5,704 5,194
liabilities 887 421 2,498 4,182
Revenues 259 331 87 85
surplus/(deficit) (1,025) (1,045) (414) (380)
group’s interest 40% 40% 31% 31%
share of associate’s contingent liabilities incurred jointly with other investors
- - - -
Contingent liabilities that arise because of several liability - - - -
As at the 19 April 2011 the vital english limited financial statements for both 2009 and 2010 have not been audited.
65www.wintec.ac.nz

FiNANciAL PERFORMANcE
NOTEs TO ThE FiNANciAL sTATEMENTs (cONTiNUED) FOR ThE yEAR ENDED 31 DEcEMBER 2010
16 BORROWiNGs
cONsOLiDATED PARENT
2010$’000
2009$’000
2010$’000
2009$’000
non-current
secured loans 10,400 3,300 10,400 3,300
Finance leases - - - -
total non-current portion 10,400 3,300 10,400 3,300
Total borrowings 10,400 3,300 10,400 3,300
secured loanssecured loans are issued using a customised average rate loan (CARl) facility which has portions of its principal drawn down at floating, capped, range, and/or fixed rates of interest. interest rates are weighted and reset monthly, based according to the principal outstanding for each portion.
the institute has no current borrowings as at 31 december 2010.
securitythe overdraft and secured loans are secured by a negative pledge agreement between the Bank of new Zealand and the institute. the maximum amount that can be drawn down against the overdraft facility is $5,000,000.
secured loan covenantsthe institute is required to ensure that the following financial covenant ratios for secured loans are achieved during the year:
• net surplus ratio of 3.0%.• Cash ratio of at least 111%.• interest cover ratio of no less than 3 times.• debt cover ratio of no more than 1.8 times.• Maintain access to $7.5m of liquidity for at least 275 days in any continuous 365 day period.• Maintain a liquidity ratio of 12%.
secured loans become repayable on demand in the event these covenants are breached or if the institute fails to make interest and principal payments when they fall due. the institute has complied with all covenants and loan repayment obligations during 2010.
the institute and group have no finance leases.
66 Annual Report 2010

FiNANciAL PERFORMANcE
17 EQUiTy
cONsOLiDATED PARENT
2010$’000
2009$’000
2010$’000
2009$’000
General funds
Balance at 1 january 93,513 92,071 94,302 92,335
Property revaluation reserve transfer on disposal - - - -
surplus / (deficit) for the year 2,781 1,442 2,535 1,967
Capital contributions from the Crown - - - -
suspensory loans from the Crown - - - -
transfers to restricted reserves - - - -
Balance at 31 december 96,294 93,513 96,837 94,302
Property revaluation reserves
Balance at 1 january 16,900 16,900 16,900 16,900
- - - -
land net revaluation gains - - - -
Buildings net revaluation gains - - - -
infrastructure net revaluation gains - - - -
Balance at 31 december 16,900 16,900 16,900 16,900
Restricted reserves
Balance 1 january 123 123 123 123
Appropriation of net surplus - - - -
Application of trusts and bequests 3 - 3 -
Balance at 31 december 126 123 126 123
Total equity 113,320 110,536 113,863 111,325
Non-controlling interest
Balance at 1 january - - - -
surplus / (deficit) (62) - - -
Balance at 31 december (62) - - -
TOTAL EQUiTy 113,258 110,536 113,863 111,325
67www.wintec.ac.nz

FiNANciAL PERFORMANcE
NOTEs TO ThE FiNANciAL sTATEMENTs (cONTiNUED) FOR ThE yEAR ENDED 31 DEcEMBER 2010
18 cOMMiTMENTs AND cONTiNGENciEs
Operating lease commitments
institute as lesseethe institute has entered into commercial leases on campus leases. the institute is able to exit leases with a right of renewal at renewal date, and the disclosure has been made with the assumption that all rights of renewal will be exercised - as such the commitment has been disclosed for the entire term of the lease.
the institute has entered into commercial leases on certain motor vehicles and items of small machinery where it is not in the best interest of the institute to purchase these assets.
these leases have an average life of between 4 and 10 years with renewal terms included in the contracts.
Renewals are at the option of the specific entity that holds the lease.
there are no restrictions placed upon the lessee by entering into these leases.
Future minimum rentals payable under non-cancellable operating leases as at 31 december are as follows:
these commitments include the perpetually renewable lease with tainui for the city campus land. the term of the lease is 20 years with further rights of renewal of 20 years.
cONsOLiDATED PARENT
2010$’000
2009$’000
2010$'000
2009$'000
Within one year 1,324 1,439 1,324 1,439
After one year but not more than five years 5,083 1,381 5,083 1,381
More than five years 21,969 21,970 21,969 21,970
Total non-cancellable operating leases 28,376 24,790 28,376 24,790
68 Annual Report 2010

FiNANciAL PERFORMANcE
cONsOLiDATED PARENT
2010$’000
2009$’000
2010$'000
2009$'000
Within one year 40 - 40 -
After one year but not more than five years 83 27 83 27
More than five years 12 12 12 12
Total non-cancellable operating leases 135 39 135 39
no contingent rents have been recognised in the statement of comprehensive income during the year.
Finance lease and hire purchase commitmentsthe institute has no finance leases or hire purchase contracts.
institute as lessorinvestment property is leased under operating leases. the majority of these leases have a non-cancellable term of 36 months, with the exception of two leases that have a non-cancellable term of 72 months. the future aggregate minimum lease payments to be collected under non-cancellable operating leases are as follows:
capital commitmentsAt 31 december 2010 the institute has commitments of $2.31million (2009: $19.534million). this consists of contracts for the city campus car park $1.71m and eRP system $0.6m. the work related to the capital commitments may be ceased or varied by Wintec at any time in the event that something unforeseen happens to Wintec’s position.
in April 2008, the institute entered into an agreement with sport Waikato whereby it has the right to buy the building that sport Waikato has built on the Wintec campus. sport Waikato also has the right to require the institute to buy the building. these rights are exercisable in April 2013. the purchase price at the time will be the market value of the building with a minimum purchase price of the certified construction cost.
contingent assetsthe institute and group has no contingent assets (2009: nil).
contingent liabilitiesthe institute and group has no contingent liabilities (2009: nil).
69www.wintec.ac.nz

FiNANciAL PERFORMANcE
NOTEs TO ThE FiNANciAL sTATEMENTs (cONTiNUED) FOR ThE yEAR ENDED 31 DEcEMBER 2010
19 RELATED PARTy DiscLOsURE
the institute is the parent of the group and controls seven entities and has significant influence over two others (refer note 26)
the institute and group enters into transactions with government departments, state-owned enterprises and Crown entities. those transactions that occur within a normal supplier or client relationship on terms and conditions no more or less favourable than those which it is reasonable to expect the institute and group would have adopted if dealing with that entity at arm’s-length in the same circumstances have not been disclosed.
Related party transactions with subsidiaries and associates
sUBsiDiARiEs2010$'000
2009$’000
Wintec Foundation
no related party transactions were entered into during the year - 27
Soda Inc Limited
services provided to the institute - 1
services provided by the institute 7 7
debtor services provided by the institute - 192
Prima Group Limited
services provided to the institute 90 119
debtor for services provided by the institute - 187
Prima Limited
services provided to the institute 10 -
Learning Works Limited
debtor for services provided by the institute - 385
Wintec Education and Training Associates Limited
no related party transactions were entered into during the year - -
Waikato International Limited
no related party transactions were entered into during the year - -
AssOciATEs
Vital English Limited
services provided to the institute 10 6
services provided by the institute 106 304
debtor for services provided by the institute 106 230
Hamilton Fibre Network Limited
share of income recognised - 1,057
share of loss recognised 1,347 219
unsecured loans payable to the institute 741 892
70 Annual Report 2010

FiNANciAL PERFORMANcE
during the year, the institute and group purchased services from Hamilton City Council on which Council Chairperson, gordon Chesterman is a Councillor. these services cost $211,539 (2009 $230,667) and were supplied on normal commercial terms. there is a balance owing to Hamilton City Council at 31 december 2010 of $1,533 (2009 $6,153).
during the year, the institute and group provided services to the value of $142,903 to the students Residence trust of which Councillor Aaron Rink is a trustee.
Wintec provided accommodation and other services to the value of $32,987 to the Waikato Chamber of Commerce in Wintec House. lynnette Flowers was a board member during the year.
Terms and conditions of transactions with related partiesProviding of ancillary services to and purchases from related parties are made in arm's-length transactions at both normal market prices and normal commercial terms.
Outstanding balances at 31 december 2010 and 2009 are unsecured and settlement occurs in cash.
there have been no guarantees provided or received for any related party receivables.
For the year end 31 december 2010, the institute raised a provision for doubtful debts relating to amounts owed by vital english for $205,000.
cONsOLiDATED PARENT
2010$’000
2009$’000
2010$'000
2009$'000
Key management personnel compensation
short term benefits (salary) 1,502 1,502 1,502 1,502
employee welfare expenses - - - -
Post employment benefits - - - -
Total 1,502 1,502 1,502 1,502
Key management personnel includes all members of the senior executive.
71www.wintec.ac.nz

FiNANciAL PERFORMANcE
NOTEs TO ThE FiNANciAL sTATEMENTs (cONTiNUED) FOR ThE yEAR ENDED 31 DEcEMBER 2010
20 chiLDcARE sUMMARy
ACTUAL2010$’000
BUDGET2010$'000
ACTUAL2009$'000
income
government grants (children under two) 187 190 195
government grants (children over two) 91 85 89
government grants (free early Childhood education) 217 191 242
government grants (provisionally registered teachers) - - 3
government grants (free subsidy) 33 25 -
incentive grant 9 4 4
Fees Work and income new Zealand (WinZ) 160 124 137
Other fees 92 90 99
Total Trading income 789 709 769
Expenses
staffing 605 568 546
Other Costs 75 10 96
Total Trading Expenses 680 578 642
Trading surplus 109 131 127
Provisionally registered teachers (PRT) support grant there were no PRt grants received in 2010.2009 grants were received for three provisionally registered teachers and were spent in the following way:
ACTUAL2009$
Paid teacher release time -
Professional development 178
subscriptions -
stationery/ink/Art supplies -
Resources/Books 1,063
equipment 3,332
Total 4,573
72 Annual Report 2010

FiNANciAL PERFORMANcE
21 EVENTs AFTER ThE BALANcE shEET DATE
the sale of land to the new Zealand transport Agency (nZtA) included in current assets available for sale occurred after balance date.
22 FiNANciAL iNsTRUMENT cATEGORiEs
the accounting policies for financial instruments have been applied to the line items below.
cONsOLiDATED PARENT
2010$'000
2009$'000
2010$'000
2009$'000
FiNANciAL AssETs
Loans and receivables
Cash and cash equivalents 2,626 1,142 664 761
debtors and other receivables 626 1,615 2,230 1,590
Other financial assets
- term deposits - 117 - 117
- loans to related parties 741 892 741 892
Total 3,393 3,766 3,635 3,360
Fair value through other comprehensive income
Other financial assets
- government bonds - - - -
- unlisted shares 38 38 38 38
- listed shares - - - -
Total 38 38 38 38
FiNANciAL LiABiLiTiEs
Financial liabilities at amortised cost
Creditors and other payables 5,711 5,280 4,748 4,304
secured loans 10,400 3,300 10,400 3,300
Total 16,111 8,580 15,148 7,604
73www.wintec.ac.nz

FiNANciAL PERFORMANcE
NOTEs TO ThE FiNANciAL sTATEMENTs (cONTiNUED) FOR ThE yEAR ENDED 31 DEcEMBER 2010
the institute and group do not have government bonds, derivatives, or managed funds.
FiNANciAL iNsTRUMENT RisKsthe institute and group has a series of policies to manage the risks associated with financial instruments. it is risk averse and seeks to minimise exposure from its treasury activities. these policies do not allow any transactions that are speculative in nature to be entered into.
Market riskPrice riskPrice risk is the risk that the fair value or future cash flows of a financial instrument will fluctuate as a result of changes in market prices. the institute and group do not hold any financial instruments which are exposed to price risk.
Currency riskCurrency risk is the risk that the fair value or future cash flows of a financial instrument will fluctuate due to changes in foreign exchange rates. the institute is not exposed to any significant currency risk.
Fair value interest rate riskFair value interest rate risk is the risk that the value of a financial instrument will fluctuate due to changes in market interest rates. Borrowings and investments issued at fixed rates of interest create exposure to fair value interest rate risk. the institute and group does not actively manage its exposure to fair value interest rate risk.
Cash flow interest rate riskCash flow interest rate risk is the risk that the cash flows from a financial instrument will fluctuate because of changes in market interest rates. Borrowings and investments issued at variable interest rates create exposure to cash flow interest rate risk. the institute does not generally enter in to borrowing or investments with variable interest rates.
credit riskCredit risk is the risk that a third party will default on its obligation to the institute and group, causing it to incur a loss. due to the timing of its cash inflows and outflows, surplus cash is invested into term deposits which give rise to credit risk.
the institute and group limits the amount of credit exposure to any one financial institution for term deposits to no more than 40% of total investments held. the group invests funds only with registered banks that have a standard and Poor’s credit rating of at least A2 for short term and A – for long-term investments.
the institute and group holds no collateral or other credit enhancements for financial instruments that give rise to credit risk.
74 Annual Report 2010

FiNANciAL PERFORMANcE
the credit quality of financial assets that are neither past due nor impaired can be assessed by reference to standard and Poor's credit ratings (if available) or to historical information about counterparty default rates:
cONsOLiDATED PARENT
2010$'000
2009$'000
2010$'000
2009$'000
cOUNTERPARTiEs WiTh cREDiT RATiNGs
Cash at bank and term deposits
AA 2,626 1,142 664 761
AA- - - - -
Total cash at bank and term deposits 2,626 1,142 664 761
cOUNTERPARTiEs WiThOUT cREDiT RATiNGs
Loans to related parties
existing counterparty with no defaults in the past 741 892 741 892
existing counterparty with defaults in the past - - - -
Total loans to related parties 741 892 741 892
Debtors and other receivables
existing counterparty with no defaults in the past 626 1,615 2,230 1,590
existing counterparty with defaults in the past - - - -
Total debtors and other receivables 626 1,615 2,230 1,590
Liquidity riskManagement of liquidity riskliquidity risk is the risk that the institute and group will encounter difficulty raising liquid funds to meet commitments as they fall due. Prudent liquidity risk management implies maintaining sufficient cash, the availability of funding through an adequate amount of committed credit facilities, and the ability to close out market positions. Flexibility in funding is maintained by keeping committed credit lines available.
the institute and group has a maximum amount that can be drawn down against its overdraft facility of $5,000,000 (2009 $4,000,000). this facility can be used for a maximum period of 90 days in any twelve month period. the institute and group manages liquidity risk by continuously monitoring forecast and actual cash flow requirements and matching the maturity profiles of financial assets and liabilities.
75www.wintec.ac.nz

FiNANciAL PERFORMANcE
NOTEs TO ThE FiNANciAL sTATEMENTs (cONTiNUED) FOR ThE yEAR ENDED 31 DEcEMBER 2010
Contractual maturity analysis of financial liabilities, excluding derivativesthe table below analyses financial liabilities (excluding derivatives) into relevant maturity groupings based on the remaining period at the balance date to the contractual maturity date. Future interest payments on floating rate debt are based on the floating rate on the instrument at the balance date. the amounts disclosed are the contractual undiscounted cash flows.
Carrying amount$’000
Contractual cashflows$’000
<6 months$’000
6-12 months$’000
1-2 years$’000
2-3 years$’000
>3 years$’000
institute 2010
Creditors and other payables 4,748 4,748 4,748 - - - -
Accrued pay 620 620 620 - - - -
secured loans 10,400 10,400 - - - - 10,400
Total 15,768 15,768 5,368 - - - 10,400
Group 2010
Creditors and other payables 5,711 5,711 5,711 - - - -
Accrued pay 620 620 620 - - - -
secured loans 10,400 10,400 - - - - 10,400
Total 16,731 16,731 6,331 - - - 10,400
institute 2009
Creditors and other payables 4,304 4,304 4,304 - - - -
Accrued pay 1,709 1,709 1,709 - - - -
secured loans 3,300 3,300 - - - - 3,300
Total 9,313 9,313 6,013 - - - 3,300
Group 2009
Creditors and other payables 5,280 5,280 5,280 - - - -
Accrued pay 1,709 1,709 1,709 - - - -
secured loans 3,300 3,300 - - - - 3,300
Total 10,289 10,289 6,989 - - - 3,300
Contractual maturity analysis of derivative financial liabilitiesthe institute and group do not have derivative financial liabilities.
76 Annual Report 2010

FiNANciAL PERFORMANcE
Contractual maturity analysis of financial assetsthe table below analyses financial assets into relevant maturity groupings based on the remaining period at the balance date to the contractual maturity date:
Carrying amount$’000
Contractual cashflows$’000
<6 months$’000
6-12 months$’000
1-2 years$’000
2-3 years$’000
>3 years$’000
institute 2010
Cash and cash equivalents 664 664 664 - - - -
debtors and other receivables 2,379 2,379 1,867 111 401 - -
government bonds - - - - - - -
term deposits - - - - - - -
Total 3,043 3,043 2,531 111 401 - -
Group 2010
Cash and cash equivalents 2,626 2,626 2,265 - - - -
debtors and other receivables 626 626 114 111 401 - -
government bonds - - - - - - -
term deposits - - - - - - -
Total 3,252 3,252 2,379 111 401 - -
institute 2009
Cash and cash equivalents 761 761 761 - - - -
debtors and other receivables 1,640 1,640 1,640 - - - -
government bonds - - - - - - -
term deposits 117 117 117 - - - -
Total 2,518 2,518 2,518 - - - -
Group 2009
Cash and cash equivalents 1,142 1,142 1,142 - - - -
debtors and other receivables 1,665 1,665 1,665 - - - -
government bonds - - - - - - -
term deposits 117 117 117 - - - -
Total 2,924 2,924 2,924 - - - -
77www.wintec.ac.nz

FiNANciAL PERFORMANcE
NOTEs TO ThE FiNANciAL sTATEMENTs (cONTiNUED) FOR ThE yEAR ENDED 31 DEcEMBER 2010
sensitivity analysisthe tables below illustrate the potential surplus or deficit and equity (excluding general funds) impact for reasonably possible market movements, with all other variables held constant, based on financial instrument exposures at the balance date.
Explanation of interest rate risk sensitivitythe interest rate sensitivity is based on a reasonable possible movement in interest rates, with all other variables held constant, measured as a basis points (bps) movement. For example a decrease in 50bps is equivalent to a decrease in interest rates of 0.5%.
interest on financial instruments, classified as floating rate, is re-priced at intervals of less than one year. interest on financial instruments classified as fixed rate until maturity of the instrument.
the other financial instruments of the institute that are not included in the above tables are non-interest bearing.
2010$’000
2009$’000
iNTEREsT RATE RisKinstitute
Surplus -50bps Other equity
Surplus +50bps Other equity
Surplus -100bps Other equity
Surplus +100bps Other equity
Financial assets
Cash and cash equivalents - - (4) 11
Financial liabilities
secured loans 50 (50) 17 (50)
Total sensitivity 50 (50) 13 (39)
iNTEREsT RATE RisKGroup
Financial assets
Cash and cash equivalents (7) 7 (6) 17
Financial liabilities
secured loans 50 (50) 17 (50)
Total sensitivity 43 (43) 11 (33)
78 Annual Report 2010

FiNANciAL PERFORMANcE
23 AUDiTORs' REMUNERATiON cONsOLiDATED PARENT
2010$’000
2009$’000
2010$'000
2009$'000
Audit of financial statement 107 88 107 88
Prior year audit costs 23 23 23 23
internal audit services not provided by Audit nZ 38 104 38 104
Other services - - - -
Total 168 215 168 215
24 PERFORMANcE AGAiNsT BUDGET
Revenue was above budget by $2.7m. teC funding was higher due to replacing contracted eFts with higher value core eFts. domestic and international tuition fees were higher than budgeted due to the achievement of higher than expected eFts in all areas. investment income was also higher than budget due to higher than expected cash balances being held.
Costs have exceeded budget by $7.0m, primarily due to the impairment of assets and increased operating costs associated with the achievement of the additional revenue such as additional costs associated with delivering increased eFts and payment of overseas commission.
there were also increased salary costs associated with servicing the additional eFts as well as higher than expected restructuring costs.
79www.wintec.ac.nz
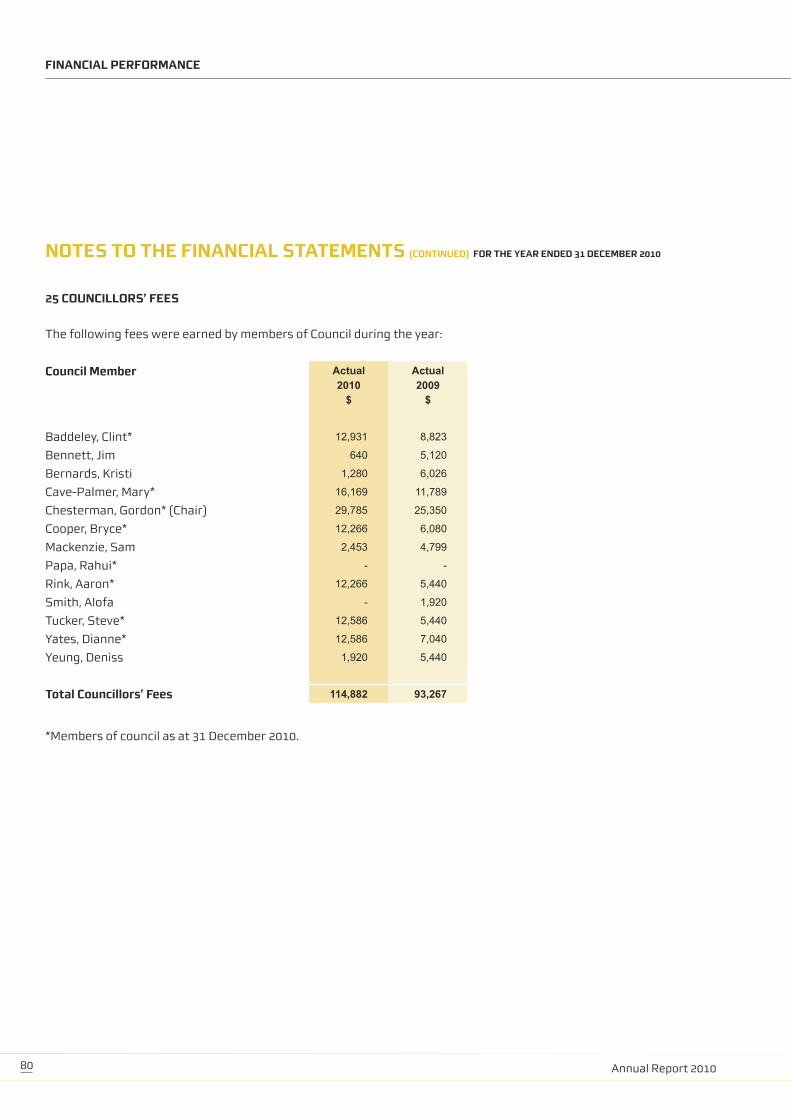
FiNANciAL PERFORMANcE
NOTEs TO ThE FiNANciAL sTATEMENTs (cONTiNUED) FOR ThE yEAR ENDED 31 DEcEMBER 2010
25 cOUNciLLORs’ FEEs
the following fees were earned by members of Council during the year:
council Member Actual2010$
Actual2009$
Baddeley, Clint* 12,931 8,823
Bennett, jim 640 5,120
Bernards, Kristi 1,280 6,026
Cave-Palmer, Mary* 16,169 11,789
Chesterman, gordon* (Chair) 29,785 25,350
Cooper, Bryce* 12,266 6,080
Mackenzie, sam 2,453 4,799
Papa, Rahui* - -
Rink, Aaron* 12,266 5,440
smith, Alofa - 1,920
tucker, steve* 12,586 5,440
yates, dianne* 12,586 7,040
yeung, deniss 1,920 5,440
Total councillors’ Fees 114,882 93,267
*Members of council as at 31 december 2010.
80 Annual Report 2010

FiNANciAL PERFORMANcE
26 DETAiLs OF hOLDiNGs iN sUBsiDiARiEs AND AssOciATEs ARE shOWN BELOW:
subsidiary/Associate/joint Venture Percentage % Ownership
Balance Date
Business Activity
Wintec
soda inc ltd 60% 31/12 Creative industries business incubator
vital english limited** 40% 31/12 designing and distributing english language teaching and learning solutions
Hamilton Fibre network ltd 31% 30/6 High-speed urban broadband network
Motortrain limited (joint venture) 25% 31/12 developing training materials for motor industry training
Wintec Foundation
Wintec Foundation 100% 31/12 Charitable trust
Prima group ltd*** 100% 31/12 investment holding company
Prima ltd* 100% 31/12 identifying and commercialising intellectual property
learning Works ltd* 100% 31/12 developing and delivering training to industry
Wintec education and training Associates* ltd 100% 31/12 investment holding company
Waikato international ltd* 100% 31/12 investment holding company
*100% owned by Prima group ltd**40% owned by Wintec*** 100% owned by Wintec Foundation
Hamilton Fibre network ltd’s balance date is 30 june. the controlling entity is Hamilton City Council, which has a balance date of 30 june.
81www.wintec.ac.nz

FiNANciAL PERFORMANcE
2010 sTATEMENT OF sERVicE PERFORMANcE
WiNTEc’s iNVEsTMENT PLAN KEy PERFORMANcE iNDicATORs (KPis)
The Investment Plan is Wintec’s funding agreement with the Tertiary Education Commission (TEC) and contains a series of key performance indicators (KPIs). These KPIs were set in 2007 to measure Wintec’s overall performance including compliance under the capped funding regime. These were established to ensure provision was relevant to the needs of the region’s learners, communities, industry and business, and to improve educational performance and the efficiency of the organisation. This was the first Investment Plan for the sector and base targets were set and extrapolated out for the entire period of the Investment Plan (2008-2010). In some cases stretch targets were set to ensure alignment with Wintec’s strategic direction.
KPi TARGET OUTcOME cOMMENT
Proportion of teC eFts enrolled at level 4 and above
total ≥66% 77%this result reflects a focus on increasing provision at level 4 and above, offset by a complementary reduction in lower level provision.
Maori ≥66% 70% As above.
Pasifika ≥66% 73% As above.
under 25s ≥66% 76% As above.
Proportion of teC eFts enrolled in national and industry qualifications
n/a indicator discontinued.
Percentage of teC eFts enrolled in foundation studies
n/a indicator discontinued.
Progression rate (teC eFts) from study at levels 1-3 to level 4 and above
total ≥24% 9% the outcome was primarily driven by two programmes that do not provide a pathway to higher level qualifications. if these programmes were excluded the outcome would be 17%.
Maori ≥22% 7% As above, with both programmes excluded the target was narrowly missed with a revised outcome of 21%.
Pasifika ≥24% 14% As above, with both programmes excluded the outcome would be 30%.
under 25s ≥25% 13% With both programmes excluded, the revised outcome improves to 19%.
teC course retention rate - level 4 and above
total ≥85% 88% the outcome is a result of student retention initiatives implemented in 2010.
Maori ≥85% 81% this target was set to drive an increase in Maori and Pasifika retention to equal that of overall retention.
Pasifika ≥85% 84% As above.
teC course completion rate – level 4 and above
total ≥80% 78% the result reflects a slight decline in completion rates across a number of programmes.
Maori ≥80% 68% this target was set to drive Maori course completion rates equal to overall course completion rates. the cumulative effect of slightly reduced completion rates across a range of programmes have impacted this result.
Pasifika ≥80% 69% As above, however it should be noted this indicator is volatile due to the small numbers of Pasifika students involved.
82 Annual Report 2010
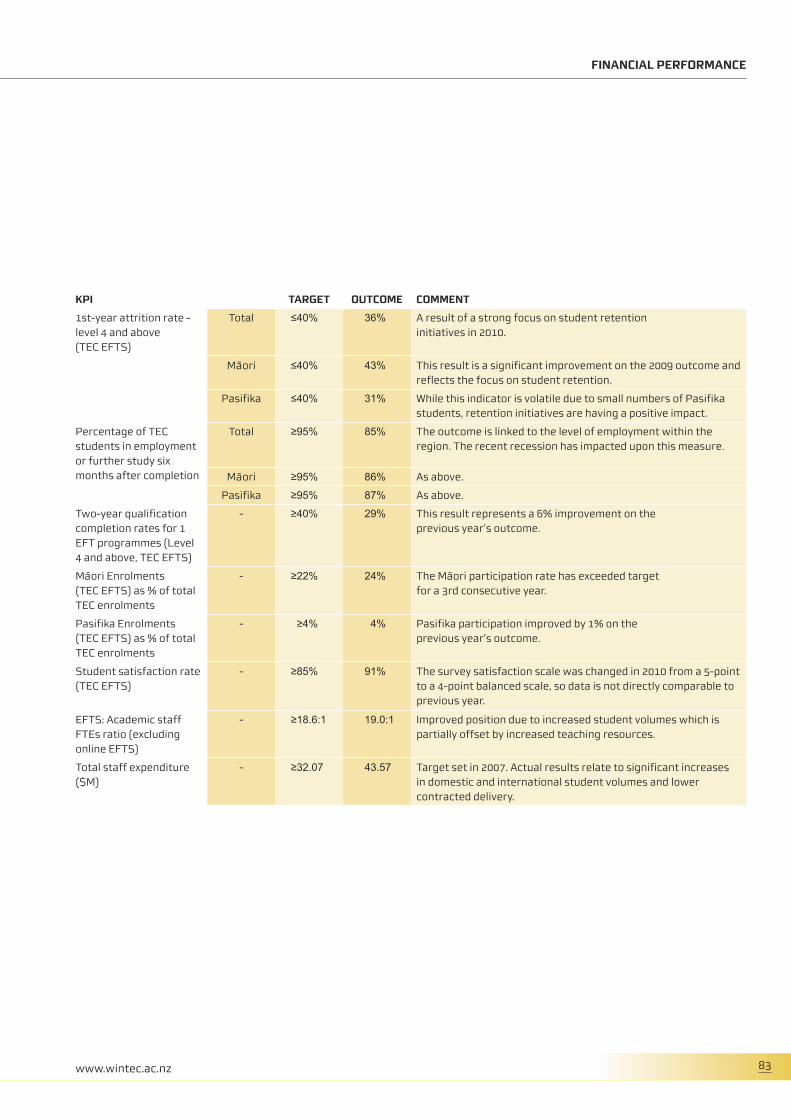
FiNANciAL PERFORMANcE
KPi TARGET OUTcOME cOMMENT
1st-year attrition rate - level 4 and above (teC eFts)
total ≤40% 36% A result of a strong focus on student retention initiatives in 2010.
Maori ≤40% 43% this result is a significant improvement on the 2009 outcome and reflects the focus on student retention.
Pasifika ≤40% 31% While this indicator is volatile due to small numbers of Pasifika students, retention initiatives are having a positive impact.
Percentage of teC students in employment or further study six months after completion
total ≥95% 85% the outcome is linked to the level of employment within the region. the recent recession has impacted upon this measure.
Maori ≥95% 86% As above.
Pasifika ≥95% 87% As above.
two-year qualification completion rates for 1 eFt programmes (level 4 and above, teC eFts)
- ≥40% 29% this result represents a 6% improvement on the previous year’s outcome.
Maori enrolments (teC eFts) as % of total teC enrolments
- ≥22% 24% the Maori participation rate has exceeded target for a 3rd consecutive year.
Pasifika enrolments (teC eFts) as % of total teC enrolments
- ≥4% 4% Pasifika participation improved by 1% on the previous year’s outcome.
student satisfaction rate (teC eFts)
- ≥85% 91% the survey satisfaction scale was changed in 2010 from a 5-point to a 4-point balanced scale, so data is not directly comparable to previous year.
eFts: Academic staff Ftes ratio (excluding online eFts)
- ≥18.6:1 19.0:1 improved position due to increased student volumes which is partially offset by increased teaching resources.
total staff expenditure ($M)
- ≥32.07 43.57 target set in 2007. Actual results relate to significant increases in domestic and international student volumes and lower contracted delivery.
83www.wintec.ac.nz

FiNANciAL PERFORMANcE
2010 sTATEMENT OF sERVicE PERFORMANcE (cONTiNUED)
KPi TARGET OUTcOME cOMMENT
total staff expenditure as % of revenue - ≤48.2% 52.7% Reduced level of contracted provision and subsequent delivery of in-house resources.
total teC (sAC and teOC) revenue ($M) (including agreed 2009 and 2010 additional support of $0.9M p.a.)
- 39.86 46.14 Higher teC revenue due increased volumes as negotiated with teC.
total revenue ($M) - 66.52 82.64 increased volumes from teC coupled with higher mix of fee payers and increased international student volumes.
total expenditure ($M)(excluding impairment of assets)
- 65.89 75.46 increased costs associated with the achievement of higher revenue.
surplus ($M) (excluding impairment of assets)
- ≥0.63 4.78 A direct result of an improved operating performance associated with increased revenue.
surplus as % of revenue - ≥0.9% 5.7% A direct result of an improved operating performance associated with increased revenue.
eBitdQ (earnings before interest, tax, depreciation, impairment and QRP) ($M)
- ≥9.38 11.00 A direct result of an improved operating performance associated with increased revenue.
Percent of planned teC eFts achieved - 97% - 103% 98.40% Within the budgeted range.
84 Annual Report 2010

FiNANciAL PERFORMANcE
WiNTEc’s BUsiNEss PLAN KEy PERFORMANcE iNDicATORs (KPis)
Wintec develops a business plan on an annual basis to ensure activities are carried out to support its strategic direction. Within the plan, there is a broad range of key performance indicators that are used to measure success in delivering these activities.
customers and stakeholders
Our aim is for regional, national and international recognition of the quality of our graduates, educational products, and related services. effective engagement with employers, industry and our community ensures our provision of education and services is driven by the needs of the region, and helps deliver employer-preferred, work-ready graduates.
KPi TARGET OUTcOME cOMMENT
international
international course completion rate ≥80% 86% the outcome reflects the positive impact of student retention
initiatives in 2010
1st-year international attrition rate ≤30% 23% Performance reflects a year on year improvement.
international student satisfaction rate ≥85% 92% the survey satisfaction scale was changed in 2010 from a 5-point to a 4-point balanced scale, so data is not directly comparable to previous year.
stakeholder satisfaction
graduate satisfaction ≥82% 92% the survey satisfaction scale was changed in 2010 from a 5-point to a 4-point balanced scale, so data is not directly comparable to previous year.
itO satisfaction ≥85% 92% satisfaction levels have increased by 14% on the 2009 outcome.
employer and industry satisfaction ≥85% 91% satisfaction levels have improved on the 2009 outcome by 2%.
employer Partnership group (ePg) satisfaction
≥85% 95% satisfaction levels show a 1% improvement on 2009 outcomes.
school leaver's market
% of region's school leavers from preceding year attending Wintec in preceding or current year
≥14% 19%Reflects a continued focus on marketing initiatives directed at the school leaver’s market, however the recession has also positively impacted this indicator.
Outlying region market
% of region's outlying school leavers from previous year attending Wintec in preceding or current year
≥12% 12% As above.
number and % of total enrolments originating from within region, outside of core region
Target to be set
N/A data not captured for 2010.
85www.wintec.ac.nz

FiNANciAL PERFORMANcE
2010 sTATEMENT OF sERVicE PERFORMANcE
Finance
We intend to achieve a position of financial viability and ongoing sustainability to support our reputation as an efficient, effective and modern organisation.
KPi TARGET OUTcOME cOMMENT
international Fees revenue ($M) ≥7.03 7.49 Higher student volumes.
domestic Fees Revenue ($M)≥15.66 17.28 Change in mix in provision as a result of students entering into areas
of study that have a higher fee component.
itO Revenue ($M) ≥3.30 3.1 decrease in industry training students.
Commercial and Other Related Revenue ($M)
≥3.16 6.12 increased commercial activity.
debt/equity 4.1% 9.1% Higher debt due to decision not to enter into a finance lease.
Operating cash inflow/operating cash outflow
1.16:1 1.17:1 A direct result of an improved bottom line resulting in improved operational cash flows.
Working capital ratio0.275:1 0.47:1 improved operating performance and associated increase in
current assets.
Public equity to total Assets 0.86:1 0.92:1 On target.
international Fees revenue as % of total revenue
9.3% 9.2% Although international revenue was higher than budget, total revenue was also higher resulting in a lower % of revenue figure.
% staff above ttH (or workload) target
Target to be set
NA data not captured for 2010.
total staff expenditure as % of total expenditure (excluding impairment of assets)
48.7% 57.7% Reduced level of contracted out provision resulting in provision being delivered in house coupled with other lower non personnel expenditure.
domestic tuition fees (teC):eFts ($ per eFts)
≥2,705 3,668 Primarily driven by reduced fee free courses.
international tuition fees:eFts ($ per eFts)
≥14,700 13,371 driven by changes in international student mix.
itO eFts revenue fees:eFts ($ per eFts)
≥3,900 3,110 lower student volumes.
Commercial and Other eFts related revenue as % of total revenue
≥7.7% 7.7% Although total revenue has increased compared to investment plan the proportion of other revenue has remained constant.
86 Annual Report 2010

FiNANciAL PERFORMANcE
Research
We intend to strengthen research outcomes and undertake applied research to support vocational learning and technology transfer. Our aim is to maintain our reputation for quality research-informed teaching and develop collaborative arrangements and applied research projects that meet the needs of industry.
KPi TARGET OUTcOME cOMMENT
PBRF Research revenue ($) $611,420 $611,420 As contracted with teC.
% of total research funded in collaboration with industry to facilitate technology transfer
≥20% 30% this outcome is a direct result of the focus on industry-related research and reflects real growth in the number of applications funded in collaboration with industry.
value of external research contracts gained ($)
≥$250,000 $11,500 external research income was not a focus for researchers in 2010 given the decision to prioritise industry-related research activity. A strategy to re-build external income from 2011 is in place.
Absolute number of research outputs
≥430 505 Reflects a gradual increase in research activity.
Quality weighted score of research outputs
≥1400 1270 this reflects the impact of the restructuring of research activity in 2009/2010. total research output was greater than 2009 levels and further growth is planned for 2011-2013.
systems and processes
Our quality approach is articulated in the WinQual excellence Framework. Our aim is to embed a culture of continuous improvement across the organisation to ensure high standards of quality in all that we do.
KPi TARGET OUTcOME cOMMENT
% QRP revenue received N/A N/A no QRP funds were received in 2010.
Facility utilisation 60%+ 59% Actual result close to target.
Process performance
Conversion rate - Offer of place: Accepted: Paid (teC eFts)
Target to be set
N/A data not captured for 2010.
87www.wintec.ac.nz

AcKNOWLEDGEMENTs
WinteC gRAteFully ACKnOWledges tHe suPPORt OF:
– Our 300 employer Partnership group members for all of their industry and community expertise and support, enabling us to ensure our qualifications and training are current and meet the needs of employers in the region.
– the gallagher group for its ongoing support of our activities.
– gordon Hassett from Klu’dup for his contribution to the Wintec House development.
– Our international partners in China including Chengdu university, Hebei normal university, Peking university third Hospital, sanjiang university, shandong university of technology, shenzhen no 1 vocational College, Bolun vocational & technical school, Changsha university, nanhai information technology school, shandong institute of Commerce & technology, shanghai urban Construction engineering school and sichuan Conservatory of Music.
– Our international partners at the indian institute of technology, Kharagpur.
– Our international partners at Open university Malaysia and the deans Council for thailand.
– Our international partners in Korea, Canada, France and denmark who provided student exchange opportunities.
– enterprise new Zealand and innovation Waikato.
– AgResearch, Waikato innovation Park, Agriculture itO and the Coalition for 21st Century schools, our partners in the Agritec Centre in tokanui, for their continuing support and cooperation.
– Opportunity Hamilton and Waikato Chamber of Commerce for their support and partnership in the innovative Business Floor located at Wintec House.
– department of Corrections (springhill Prison), Hauraki Coromandel development group, Aquaculture nZ, seafood itO, Otorohanga district Council & Otorohanga district development Board for their support of our business development and regional engagement initiatives.
– Hamilton City Council, for its participation in a range of projects including campus developments, sOdA inc., and a range of other planning and development activities.
– the Otorohanga, Waitomo and thames Coromandel district Councils for their support of our satellite campuses.
– Habitat for Humanity and Community living trust as our strategic not-for-profit partners for their ongoing engagement with Wintec.
– department of labour, Ministry of social development, new Zealand trade and enterprise for their support with a host of regional initiatives and planning and development advice.
– Fairfax ltd, for enabling our students to complete journalism internships.
– Our Metro itP partners: unitec institute of technology, Manukau institute of technology, Christchurch Polytechnic institute of technology, Wellington institute of technology and Otago Polytechnic.
88 Annual Report 2010

– Our MeCA itP partners: northtec, unitec institute of technology, Western institute of technology at taranaki, Whitireia Polytechnic and Bay of Plenty Polytechnic.
– Our other itP and tertiary partners: tairawhiti Polytechnic, nelson Marlborough institute of technology, university of Waikato, te Wananga o Aotearoa.
– Waikato district Health Board, Hawkes Bay district Health Board and Bay of Plenty district Health Board for their assistance in delivery of education relating to heath/nursing/midwifery in their regions.
– Waikato-tainui and tainui group Holdings for their support with awards, scholarships and grants, their sponsorship of spark – Wintec’s annual international festival of media arts and design – and their invaluable advice and collaboration on our Maori trade training initiative.
– the many sponsors of our various events, scholarships and awards.
– the many suppliers of goods and services to Wintec.
– te Puni Kokiri for advising on government policies on Maori and Pasifika development and its sponsorship of our Matariki Wearable Arts events.
– the many Pasifika community groups in the region for their support of Pasifika initiatives and Pasifika students in general.
– the many social service agencies and organisations who support our programmes and offer fieldwork practicum and work experience to our students.
– All the partners in the trades Academy project: Cambridge High school, Huntly College, ngaruawahia High school, Fairfield College, Hillcrest High school, Hamilton girls’ High school, Melville High school, te Kauwhata College, te Awamutu College, Matamata College, Morrinsville College, and Hamilton’s Fraser High school.
– Agriculture industry training Organisation (AgitO), Competenz industry training, electrical technology industry training Organisation (etitO), electrical supply industry training Organisation (esitO), Hospitality standards institute, Motor industry training Organisation (MitO) and Plumbing, gasfitting, drainlaying, Roofing industry training Organisation (PgdRitO).
– Mighty River Power and Contact energy for their support and engagement in teaching a new electrical apprentice intake.
– energy efficiency and Conservation Authority (eeCA), Wel networks and Mighty River Power for their support in the establishment of the student village at the Avalon campus.
89www.wintec.ac.nz
