2-4_2005_jun_a
TRANSCRIPT

8/3/2019 2-4_2005_jun_a
http://slidepdf.com/reader/full/2-42005juna 1/15
Answers

8/3/2019 2-4_2005_jun_a
http://slidepdf.com/reader/full/2-42005juna 2/15

8/3/2019 2-4_2005_jun_a
http://slidepdf.com/reader/full/2-42005juna 3/15
13
Part 2 Examination – Paper 2.4
Financial Management and Control June 2005 Answers
1 (a) NPV calculation for Alpha and Beta
Year 1 2 3 4
£ £ £ £
Sales revenue 3,585,000 6,769,675 6,339,000 1,958,775Material cost (1,395,000) (2,634,225) (2,466,750) (761,925)Fixed costs (1,000,000) (1,050,000) (1,102,500) (1,157,625)Advertising (500,000) (200,000) (200,000)
–––––––––– –––––––––– –––––––––– ––––––––––Taxable profit 690,000 2,885,450 2,569,750 39,225Taxation (172,500) (721,362) (642,438) (9,806)WDA tax benefit 250,000Fixed asset sale 1,200,000WC recovery 1,000,000
–––––––––– –––––––––– –––––––––– ––––––––––Net cash flow 767,500 2,164,088 1,927,312 2,229,419Discount factors 0·885 0·783 0·693 0·613
–––––––––– –––––––––– –––––––––– ––––––––––Present values 679,237 1,694,481 1,335,626 1,366,634
£
Sum of present values 5,075,978Initial investment 3,000,000
–––––––––––Net present value 2,075,978
–––––––––––
The positive NPV indicates that the investment is financially acceptable.
Workings
Alpha sales revenue
Year 1 2 3 4
Selling price (£/unit) 31·00 31·93 32·89 33·88Sales (units/yr) 60,000 110,000 100,000 30,000Sales revenue (£/yr) 1,860,000 3,512,300 3,289,000 1,016,400
Beta sales revenue
Year 1 2 3 4Selling price (£/unit) 23·00 23·69 24·40 25·13Sales (units/yr) 75,000 137,500 125,000 37,500Sales revenue (£/yr) 1,725,000 3,257,375 3,050,000 942,375
Year 1 2 3 4
Sales revenue (£/yr) 3,585,000 6,769,675 6,339,000 1,958,775
Alpha direct material cost
Year 1 2 3 4
Material cost (£/unit) 12·00 12·36 12·73 13·11Sales (units/yr) 60,000 110,000 100,000 30,000Material cost (£/yr) 720,000 1,359,600 1,273,000 393,300
Beta direct material cost
Year 1 2 3 4Material cost (£/unit) 9·00 9·27 9·55 9·83Sales (units/yr) 75,000 137,500 125,000 37,500Material cost (£/yr) 675,000 1,274,625 1,193,750 368,625
Year 1 2 3 4
Material cost (£/yr) 1,395,000 2,634,225 2,466,750 761,925
(b) The evaluation assumes that several key variables will remain constant, such as the discount rate, inflation rates and thetaxation rate. In practice this is unlikely. The taxation rate is a matter of government policy and so may change due to politicalor economic necessity.
Specific inflation rates are difficult to predict for more than a short distance into the future and in practice are found to beconstantly changing. The range of inflation rates used in the evaluation is questionable, since over time one would expect therates to converge. Given the uncertainty of future inflation rates, using a single average inflation rate might well be preferable
to using specific inflation rates.
8/3/2019 2-4_2005_jun_a
http://slidepdf.com/reader/full/2-42005juna 4/15
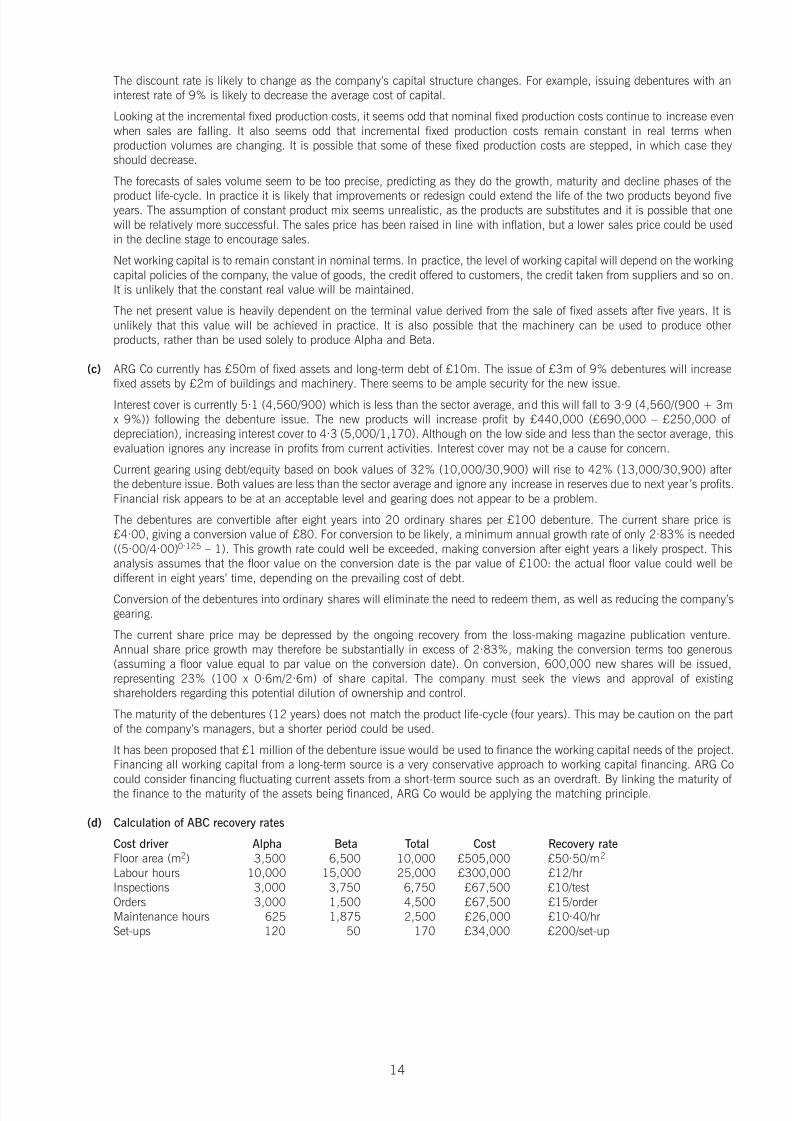
The discount rate is likely to change as the company’s capital structure changes. For example, issuing debentures with aninterest rate of 9% is likely to decrease the average cost of capital.
Looking at the incremental fixed production costs, it seems odd that nominal fixed production costs continue to increase evenwhen sales are falling. It also seems odd that incremental fixed production costs remain constant in real terms whenproduction volumes are changing. It is possible that some of these fixed production costs are stepped, in which case theyshould decrease.
The forecasts of sales volume seem to be too precise, predicting as they do the growth, maturity and decline phases of the
product life-cycle. In practice it is likely that improvements or redesign could extend the life of the two products beyond fiveyears. The assumption of constant product mix seems unrealistic, as the products are substitutes and it is possible that onewill be relatively more successful. The sales price has been raised in line with inflation, but a lower sales price could be usedin the decline stage to encourage sales.
Net working capital is to remain constant in nominal terms. In practice, the level of working capital will depend on the workingcapital policies of the company, the value of goods, the credit offered to customers, the credit taken from suppliers and so on.It is unlikely that the constant real value will be maintained.
The net present value is heavily dependent on the terminal value derived from the sale of fixed assets after five years. It isunlikely that this value will be achieved in practice. It is also possible that the machinery can be used to produce otherproducts, rather than be used solely to produce Alpha and Beta.
(c) ARG Co currently has £50m of fixed assets and long-term debt of £10m. The issue of £3m of 9% debentures will increasefixed assets by £2m of buildings and machinery. There seems to be ample security for the new issue.
Interest cover is currently 5·1 (4,560/900) which is less than the sector average, and this will fall to 3·9 (4,560/(900 + 3mx 9%)) following the debenture issue. The new products will increase profit by £440,000 (£690,000 – £250,000 of depreciation), increasing interest cover to 4·3 (5,000/1,170). Although on the low side and less than the sector average, thisevaluation ignores any increase in profits from current activities. Interest cover may not be a cause for concern.
Current gearing using debt/equity based on book values of 32% (10,000/30,900) will rise to 42% (13,000/30,900) afterthe debenture issue. Both values are less than the sector average and ignore any increase in reserves due to next year ’s profits.Financial risk appears to be at an acceptable level and gearing does not appear to be a problem.
The debentures are convertible after eight years into 20 ordinary shares per £100 debenture. The current share price is£4·00, giving a conversion value of £80. For conversion to be likely, a minimum annual growth rate of only 2·83% is needed((5·00/4·00)0·125 – 1). This growth rate could well be exceeded, making conversion after eight years a likely prospect. Thisanalysis assumes that the floor value on the conversion date is the par value of £100: the actual floor value could well bedifferent in eight years’ time, depending on the prevailing cost of debt.
Conversion of the debentures into ordinary shares will eliminate the need to redeem them, as well as reducing the company’sgearing.
The current share price may be depressed by the ongoing recovery from the loss-making magazine publication venture.Annual share price growth may therefore be substantially in excess of 2·83%, making the conversion terms too generous(assuming a floor value equal to par value on the conversion date). On conversion, 600,000 new shares will be issued,representing 23% (100 x 0·6m/2·6m) of share capital. The company must seek the views and approval of existingshareholders regarding this potential dilution of ownership and control.
The maturity of the debentures (12 years) does not match the product life-cycle (four years). This may be caution on the partof the company’s managers, but a shorter period could be used.
It has been proposed that £1 million of the debenture issue would be used to finance the working capital needs of the project.Financing all working capital from a long-term source is a very conservative approach to working capital financing. ARG Cocould consider financing fluctuating current assets from a short-term source such as an overdraft. By linking the maturity of the finance to the maturity of the assets being financed, ARG Co would be applying the matching principle.
(d) Calculation of ABC recovery rates
Cost driver Alpha Beta Total Cost Recovery rate
Floor area (m2) 3,500 6,500 10,000 £505,000 £50·50/m2
Labour hours 10,000 15,000 25,000 £300,000 £12/hrInspections 3,000 3,750 6,750 £67,500 £10/testOrders 3,000 1,500 4,500 £67,500 £15/orderMaintenance hours 625 1,875 2,500 £26,000 £10·40/hrSet-ups 120 50 170 £34,000 £200/set-up
14
8/3/2019 2-4_2005_jun_a
http://slidepdf.com/reader/full/2-42005juna 5/15
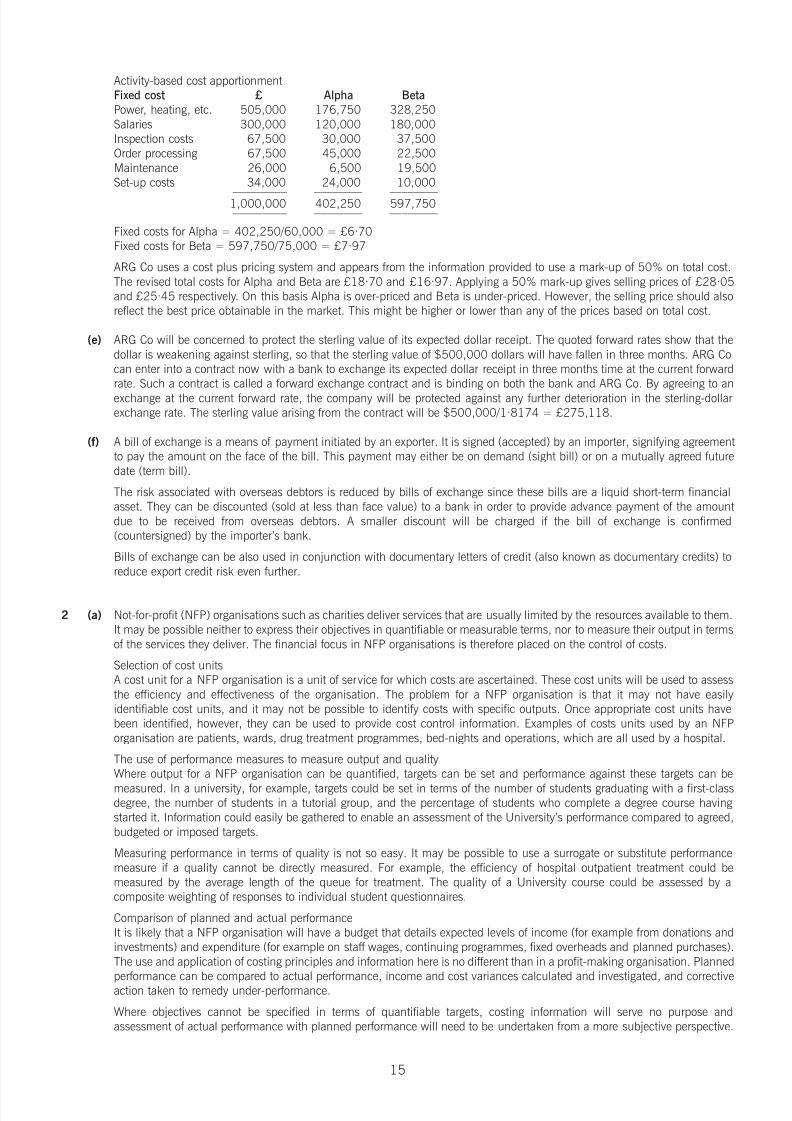
Activity-based cost apportionmentFixed cost £ Alpha Beta
Power, heating, etc. 505,000 176,750 328,250Salaries 300,000 120,000 180,000Inspection costs 67,500 30,000 37,500Order processing 67,500 45,000 22,500Maintenance 26,000 6,500 19,500Set-up costs 34,000 24,000 10,000
––––––––– –––––––– ––––––––1,000,000 402,250 597,750––––––––– –––––––– ––––––––
Fixed costs for Alpha = 402,250/60,000 = £6·70Fixed costs for Beta = 597,750/75,000 = £7·97
ARG Co uses a cost plus pricing system and appears from the information provided to use a mark-up of 50% on total cost.The revised total costs for Alpha and Beta are £18·70 and £16·97. Applying a 50% mark-up gives selling prices of £28·05and £25·45 respectively. On this basis Alpha is over-priced and Beta is under-priced. However, the selling price should alsoreflect the best price obtainable in the market. This might be higher or lower than any of the prices based on total cost.
(e) ARG Co will be concerned to protect the sterling value of its expected dollar receipt. The quoted forward rates show that thedollar is weakening against sterling, so that the sterling value of $500,000 dollars will have fallen in three months. ARG Cocan enter into a contract now with a bank to exchange its expected dollar receipt in three months time at the current forwardrate. Such a contract is called a forward exchange contract and is binding on both the bank and ARG Co. By agreeing to an
exchange at the current forward rate, the company will be protected against any further deterioration in the sterling-dollarexchange rate. The sterling value arising from the contract will be $500,000/1·8174 = £275,118.
(f) A bill of exchange is a means of payment initiated by an exporter. It is signed (accepted) by an importer, signifying agreementto pay the amount on the face of the bill. This payment may either be on demand (sight bill) or on a mutually agreed futuredate (term bill).
The risk associated with overseas debtors is reduced by bills of exchange since these bills are a liquid short-term financialasset. They can be discounted (sold at less than face value) to a bank in order to provide advance payment of the amountdue to be received from overseas debtors. A smaller discount will be charged if the bill of exchange is confirmed(countersigned) by the importer’s bank.
Bills of exchange can be also used in conjunction with documentary letters of credit (also known as documentary credits) toreduce export credit risk even further.
2 (a) Not-for-profit (NFP) organisations such as charities deliver services that are usually limited by the resources available to them.It may be possible neither to express their objectives in quantifiable or measurable terms, nor to measure their output in termsof the services they deliver. The financial focus in NFP organisations is therefore placed on the control of costs.
Selection of cost unitsA cost unit for a NFP organisation is a unit of service for which costs are ascertained. These cost units will be used to assessthe efficiency and effectiveness of the organisation. The problem for a NFP organisation is that it may not have easilyidentifiable cost units, and it may not be possible to identify costs with specific outputs. Once appropriate cost units havebeen identified, however, they can be used to provide cost control information. Examples of costs units used by an NFPorganisation are patients, wards, drug treatment programmes, bed-nights and operations, which are all used by a hospital.
The use of performance measures to measure output and qualityWhere output for a NFP organisation can be quantified, targets can be set and performance against these targets can be
measured. In a university, for example, targets could be set in terms of the number of students graduating with a first-classdegree, the number of students in a tutorial group, and the percentage of students who complete a degree course havingstarted it. Information could easily be gathered to enable an assessment of the University’s performance compared to agreed,budgeted or imposed targets.
Measuring performance in terms of quality is not so easy. It may be possible to use a surrogate or substitute performancemeasure if a quality cannot be directly measured. For example, the efficiency of hospital outpatient treatment could bemeasured by the average length of the queue for treatment. The quality of a University course could be assessed by acomposite weighting of responses to individual student questionnaires.
Comparison of planned and actual performanceIt is likely that a NFP organisation will have a budget that details expected levels of income (for example from donations andinvestments) and expenditure (for example on staff wages, continuing programmes, fixed overheads and planned purchases).The use and application of costing principles and information here is no different than in a profit-making organisation. Planned
performance can be compared to actual performance, income and cost variances calculated and investigated, and correctiveaction taken to remedy under-performance.
Where objectives cannot be specified in terms of quantifiable targets, costing information will serve no purpose andassessment of actual performance with planned performance will need to be undertaken from a more subjective perspective.
15

8/3/2019 2-4_2005_jun_a
http://slidepdf.com/reader/full/2-42005juna 6/15
(b) Zero-based budgeting requires that activities be re-evaluated as part of the budget process so that each activity, and eachlevel of activity, can justify its consumption of the economic resources available. This is in contrast to incremental budgeting,where the current budget is increased to allow for expected future conditions. Zero-based budgeting prevents the carryingforward of past inefficiencies that can be a feature of incremental budgeting and focuses on activities rather than departmentsor programmes. Each activity is treated as though it was being undertaken for the first time and is required to justify itsinclusion in the budget in terms of the benefit expected to be derived from its adoption.
The first step in zero-based budgeting is the formulation of decision packages. These are documents which identify anddescribe a given activity or group of activities in detail. The base package represents the minimum level of activity that isconsistent with the achievement of organisational objectives. Incremental packages describe higher levels of activity whichmay be delivered if they are acceptable from a cost-benefit perspective.
Following the formulation of decision packages, they are evaluated by senior management and ranked by decreasing benefitto the budgeting organisation. Resources should then be allocated, theoretically at least, to decision packages in order of decreasing marginal utility until all resources have been allocated.
Advantages claimed for zero-based budgeting are that it eliminates the inefficiencies that can arise with incrementalbudgeting, that it fosters a questioning attitude towards current activities and that it focuses attention on the need to obtainvalue for money from the consumption of organisational resources.
Value for money is important in not-for-profit (NFP) organisations, where the profit motive found in the private sector isreplaced by the need to derive the maximum benefits from limited resources available. Providers of funds to NFP organisationsexpect to see their cash being used wisely, with as much as possible being devoted to the achievement of organisational aims.For this reason, NFP organisations emphasise cost control and the need for economy in the selection of resources, efficiencyin the consumption of resources and effectiveness in the use of resources to achieve organisational objectives (i.e. value formoney).
Zero-based budgeting can therefore be applied in a NFP organisation to analyse its activities and the services it provides intodecision packages, with a view to ranking them on a cost-benefit basis relative to organisational aims and objectives. In hasbeen noted that zero-based budgeting can be applied more effectively in service-based rather than manufacturingorganisations and so it may be ideally suited to a NFP organisation such as a charity.
(c) Activity-based budgeting (ABB) would need a detailed analysis of costs and cost drivers so as to determine which cost driversand cost pools were to be used in the activity-based costing system. However, whereas activity-based costing uses activity-based recovery rates to assign costs to cost objects, ABB begins with budgeted cost-objects and works back to the resourcesneeded to achieve the budget.
Once the budgeted activity levels have been determined, the demand for resource-consuming activities is assessed from an
organisational perspective. The resources needed to provide for these activities are then assessed and action taken to ensurethat these resources are available when needed in the budget period.
The budgeted activity levels are determined in the same way as for conventional budgeting in that a sales budget and aproduction budget are drawn up. ABB then determines the quantity of activity cost drivers (e.g. number of purchase orders,number of set-ups) needed to support the planned sales and production. Standard cost data would be compiled that includeddetails of the activity cost drivers required to produce a product or number of products.
The resources needed to support the budgeted quantity of activity cost drivers would then be determined (e.g. number of labour hours to process purchase orders, number of maintenance hours needed to complete set-ups). This resource needwould then be matched against the available capacity (i.e. number of purchase clerks to process purchase orders) to seewhether any capacity adjustment were needed.
One advantage suggested for ABB is that organisational resources are allocated more efficiently due to the detailed cost andactivity information obtained by implementing an ABB system. Another advantage of ABB is that it avoids the pitfalls of
incremental budgeting due to its detailed assessment of the activities and resources needed to support planned sales andproduction. In ABB the costs of support activities are not seen as fixed costs to be increased by annual increments, but asdepending to a large extent on the planned level of activity.
3 (a) Calculation of standard profit
Budgeted machine hours = (10,000 x 0·3) + (13,000 x 0·6) + (9,000 x 0·8) = 18,000 hoursOverhead absorption rate = 81,000/18,000 = £4·50 per machine hour
Product B(£) R(£) K(£)
Direct material 5·40 (3 x 1·80) 4·10 (1·25 x 3·28) 4·85 (1·94 x 2·50)Direct labour 3·25 (0·5 x 6·50) 5·20 (0·8 x 6·50) 4·55 (0·7 x 6·50)Fixed production overhead 1·35 (0·3 x 4·50) 2·70 (0·6 x 4·50) 3·60 (0·8 x 4·50)
–––––– –––––– ––––––Standard cost 10·00 12·00 13·00Selling price 14·00 15·00 18·00
–––––– –––––– ––––––Standard profit 4·00 3·00 5·00
–––––– –––––– ––––––
16

8/3/2019 2-4_2005_jun_a
http://slidepdf.com/reader/full/2-42005juna 7/15
17
Budgeted sales quantity in standard mix at standard profit:Product Quantity Standard profit £
B 10,000 £4 40,000R 13,000 £3 39,000K 9,000 £5 45,000
––––––– ––––––––32,000 124,000––––––– ––––––––
Average standard profit per unit = 124,000/32,000 = £3·875 per unit
Actual sales quantity in actual mix at actual selling price less standard cost:Actual selling price
Product Quantity less standard cost £
B 9,500 (14·5 – 10·0) 42,750R 13,500 (15·5 – 12·0) 47,250K 8,500 (19·0 – 13·0) 51,000
––––––– ––––––––31,500 141,000––––––– ––––––––
Actual sales quantity in actual mix at standard profit:Product Quantity Standard profit £
B 9,500 £4 38,000R 13,500 £3 40,500
K 8,500 £5 42,500––––––– ––––––––31,500 121,000––––––– ––––––––
Actual sales quantity in standard mix at standard profit:Using the average standard profit per unit calculated earlier: 31,500 x 3·875 = £122,062
Sales price variance = 141,000 – 121,000 = £20,000 (F)Sales volume profit variance = 121,000 – 124,000 = £3,000 (A)Sales mix profit variance = 121,000 – 122,062 = £1,062 (A)Sales quantity profit variance = 122,062 – 124,000 = £1,938 (A)
Reconciliation £ £ £
Budgeted sales at standard profit 124,000Sales price variance 20,000 (F)Sales mix profit variance 1,062 (A)Sales quantity profit variance 1,938 (A)
––––––Sales volume profit variance 3,000 (A)
–––––––17,000 (F)
––––––––Actual sales at actual price less standard cost 141,000
––––––––
(b) The sales mix profit variance explains how the change in sales mix contributed to the sales volume profit variance. It comparesthe actual sales quantity in the actual mix with the actual sales quantity in the standard mix, valued at the standard profit perunit.
The adverse variance calculated in part (a) using the average standard profit per unit was £1,062, indicating that the actualsales mix contained more lower-margin products and fewer higher-margin products. The changes in the sales mix can beshown in tabular form, as follows.
Product Standard mix Actual mix Difference Standard profit £
B 9,844 9,500 (344) £4 1,376(A)R 12,797 13,500 703 £3 2,109(F)K 8,859 8,500 (359) £5 1,795(A)
––––––– ––––––– ––––––31,500 31,500 1,062(A)––––––– ––––––– ––––––
The difference column shows that more of Product R, with the lowest standard profit of £3 per unit, was sold than wasbudgeted for. Less of Products B and K, with the higher standard profits per unit, were sold than budgeted for. Calculation of the individual mix variances for Products B, R and K does not offer information which is any more useful than that containedin the ‘difference’ column.
Sales mix profit variance has significance only when products are inter-related and these relationships are taken into accountat the planning stage. If the products sold are not inter-related, the mix variance offers no useful information, since it
incorrectly implies that a possible cause of the sales volume profit variance is a change in the mix 1. In fact, only deviationsfrom the planned volumes for individual products need to be investigated if products are not inter-related. In this case theproducts are substitutes and so are inter-related. The individual sales mix profit variances may therefore be useful.
–––––––––––––––––––––1 Drury, C. (2000), Management and Cost Accounting, 5th edition, Thomson Learning, pp.734–8
8/3/2019 2-4_2005_jun_a
http://slidepdf.com/reader/full/2-42005juna 8/15
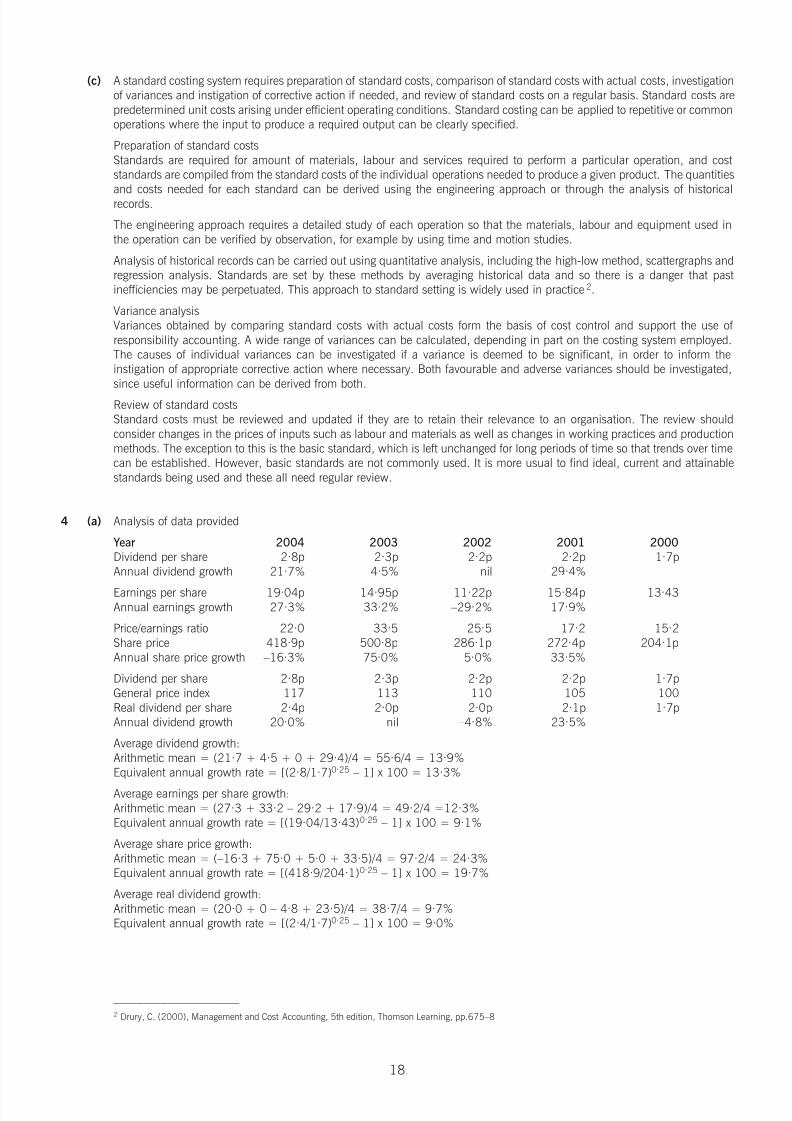
(c) A standard costing system requires preparation of standard costs, comparison of standard costs with actual costs, investigationof variances and instigation of corrective action if needed, and review of standard costs on a regular basis. Standard costs arepredetermined unit costs arising under efficient operating conditions. Standard costing can be applied to repetitive or commonoperations where the input to produce a required output can be clearly specified.
Preparation of standard costsStandards are required for amount of materials, labour and services required to perform a particular operation, and coststandards are compiled from the standard costs of the individual operations needed to produce a given product. The quantitiesand costs needed for each standard can be derived using the engineering approach or through the analysis of historicalrecords.
The engineering approach requires a detailed study of each operation so that the materials, labour and equipment used inthe operation can be verified by observation, for example by using time and motion studies.
Analysis of historical records can be carried out using quantitative analysis, including the high-low method, scattergraphs andregression analysis. Standards are set by these methods by averaging historical data and so there is a danger that pastinefficiencies may be perpetuated. This approach to standard setting is widely used in practice2.
Variance analysisVariances obtained by comparing standard costs with actual costs form the basis of cost control and support the use of responsibility accounting. A wide range of variances can be calculated, depending in part on the costing system employed.The causes of individual variances can be investigated if a variance is deemed to be significant, in order to inform theinstigation of appropriate corrective action where necessary. Both favourable and adverse variances should be investigated,since useful information can be derived from both.
Review of standard costsStandard costs must be reviewed and updated if they are to retain their relevance to an organisation. The review shouldconsider changes in the prices of inputs such as labour and materials as well as changes in working practices and productionmethods. The exception to this is the basic standard, which is left unchanged for long periods of time so that trends over timecan be established. However, basic standards are not commonly used. It is more usual to find ideal, current and attainablestandards being used and these all need regular review.
4 (a) Analysis of data provided
Year 2004 2003 2002 2001 2000
Dividend per share 2·8p 2·3p 2·2p 2·2p 1·7pAnnual dividend growth 21·7% 4·5% nil 29·4%
Earnings per share 19·04p 14·95p 11·22p 15·84p 13·43Annual earnings growth 27·3% 33·2% –29·2% 17·9%
Price/earnings ratio 22·0 33·5 25·5 17·2 15·2Share price 418·9p 500·8p 286·1p 272·4p 204·1pAnnual share price growth –16·3% 75·0% 5·0% 33·5%
Dividend per share 2·8p 2·3p 2·2p 2·2p 1·7pGeneral price index 117 113 110 105 100Real dividend per share 2·4p 2·0p 2·0p 2·1p 1·7pAnnual dividend growth 20·0% nil –4·8% 23·5%
Average dividend growth:Arithmetic mean = (21·7 + 4·5 + 0 + 29·4)/4 = 55·6/4 = 13·9%Equivalent annual growth rate = [(2·8/1·7)0·25 – 1] x 100 = 13·3%
Average earnings per share growth:Arithmetic mean = (27·3 + 33·2 – 29·2 + 17·9)/4 = 49·2/4 =12·3%Equivalent annual growth rate = [(19·04/13·43)0·25 – 1] x 100 = 9·1%
Average share price growth:Arithmetic mean = (–16·3 + 75·0 + 5·0 + 33·5)/4 = 97·2/4 = 24·3%Equivalent annual growth rate = [(418·9/204·1)0·25 – 1] x 100 = 19·7%
Average real dividend growth:Arithmetic mean = (20·0 + 0 – 4·8 + 23·5)/4 = 38·7/4 = 9·7%Equivalent annual growth rate = [(2·4/1·7)0·25 – 1] x 100 = 9·0%
–––––––––––––––––––––2 Drury, C. (2000), Management and Cost Accounting, 5th edition, Thomson Learning, pp.675–8
18
8/3/2019 2-4_2005_jun_a
http://slidepdf.com/reader/full/2-42005juna 9/15
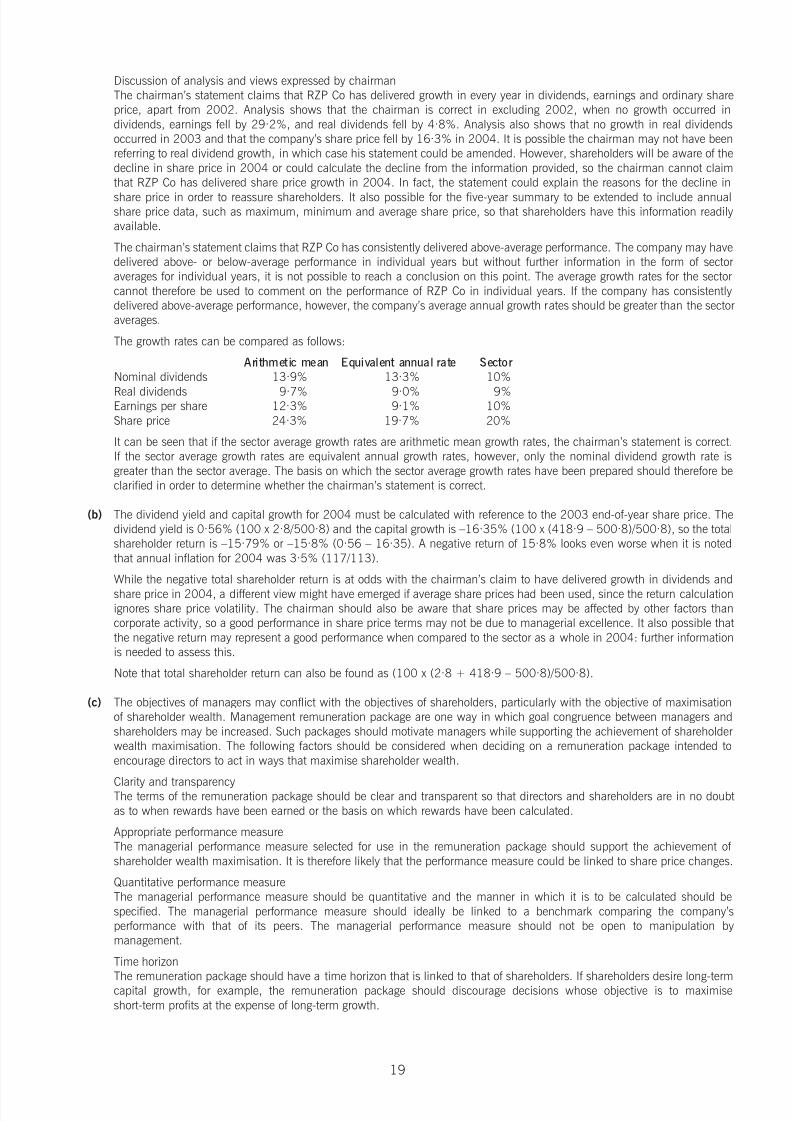
Discussion of analysis and views expressed by chairmanThe chairman’s statement claims that RZP Co has delivered growth in every year in dividends, earnings and ordinary shareprice, apart from 2002. Analysis shows that the chairman is correct in excluding 2002, when no growth occurred individends, earnings fell by 29·2%, and real dividends fell by 4·8%. Analysis also shows that no growth in real dividendsoccurred in 2003 and that the company’s share price fell by 16·3% in 2004. It is possible the chairman may not have beenreferring to real dividend growth, in which case his statement could be amended. However, shareholders will be aware of thedecline in share price in 2004 or could calculate the decline from the information provided, so the chairman cannot claimthat RZP Co has delivered share price growth in 2004. In fact, the statement could explain the reasons for the decline in
share price in order to reassure shareholders. It also possible for the five-year summary to be extended to include annualshare price data, such as maximum, minimum and average share price, so that shareholders have this information readilyavailable.
The chairman’s statement claims that RZP Co has consistently delivered above-average performance. The company may havedelivered above- or below-average performance in individual years but without further information in the form of sectoraverages for individual years, it is not possible to reach a conclusion on this point. The average growth rates for the sectorcannot therefore be used to comment on the performance of RZP Co in individual years. If the company has consistentlydelivered above-average performance, however, the company’s average annual growth rates should be greater than the sectoraverages.
The growth rates can be compared as follows:
Arithmetic mean Equivalent annual rate Sector
Nominal dividends 13·9% 13·3% 10%
Real dividends 9·7% 9·0% 9%Earnings per share 12·3% 9·1% 10%Share price 24·3% 19·7% 20%
It can be seen that if the sector average growth rates are arithmetic mean growth rates, the chairman’s statement is correct.If the sector average growth rates are equivalent annual growth rates, however, only the nominal dividend growth rate isgreater than the sector average. The basis on which the sector average growth rates have been prepared should therefore beclarified in order to determine whether the chairman’s statement is correct.
(b) The dividend yield and capital growth for 2004 must be calculated with reference to the 2003 end-of-year share price. Thedividend yield is 0·56% (100 x 2·8/500·8) and the capital growth is –16·35% (100 x (418·9 – 500·8)/500·8), so the totalshareholder return is –15·79% or –15·8% (0·56 – 16·35). A negative return of 15·8% looks even worse when it is notedthat annual inflation for 2004 was 3·5% (117/113).
While the negative total shareholder return is at odds with the chairman’s claim to have delivered growth in dividends and
share price in 2004, a different view might have emerged if average share prices had been used, since the return calculationignores share price volatility. The chairman should also be aware that share prices may be affected by other factors thancorporate activity, so a good performance in share price terms may not be due to managerial excellence. It also possible thatthe negative return may represent a good performance when compared to the sector as a whole in 2004: further informationis needed to assess this.
Note that total shareholder return can also be found as (100 x (2·8 + 418·9 – 500·8)/500·8).
(c) The objectives of managers may conflict with the objectives of shareholders, particularly with the objective of maximisationof shareholder wealth. Management remuneration package are one way in which goal congruence between managers andshareholders may be increased. Such packages should motivate managers while supporting the achievement of shareholderwealth maximisation. The following factors should be considered when deciding on a remuneration package intended toencourage directors to act in ways that maximise shareholder wealth.
Clarity and transparencyThe terms of the remuneration package should be clear and transparent so that directors and shareholders are in no doubtas to when rewards have been earned or the basis on which rewards have been calculated.
Appropriate performance measureThe managerial performance measure selected for use in the remuneration package should support the achievement of shareholder wealth maximisation. It is therefore likely that the performance measure could be linked to share price changes.
Quantitative performance measureThe managerial performance measure should be quantitative and the manner in which it is to be calculated should bespecified. The managerial performance measure should ideally be linked to a benchmark comparing the company’sperformance with that of its peers. The managerial performance measure should not be open to manipulation bymanagement.
Time horizon
The remuneration package should have a time horizon that is linked to that of shareholders. If shareholders desire long-termcapital growth, for example, the remuneration package should discourage decisions whose objective is to maximiseshort-term profits at the expense of long-term growth.
19
8/3/2019 2-4_2005_jun_a
http://slidepdf.com/reader/full/2-42005juna 10/15
20
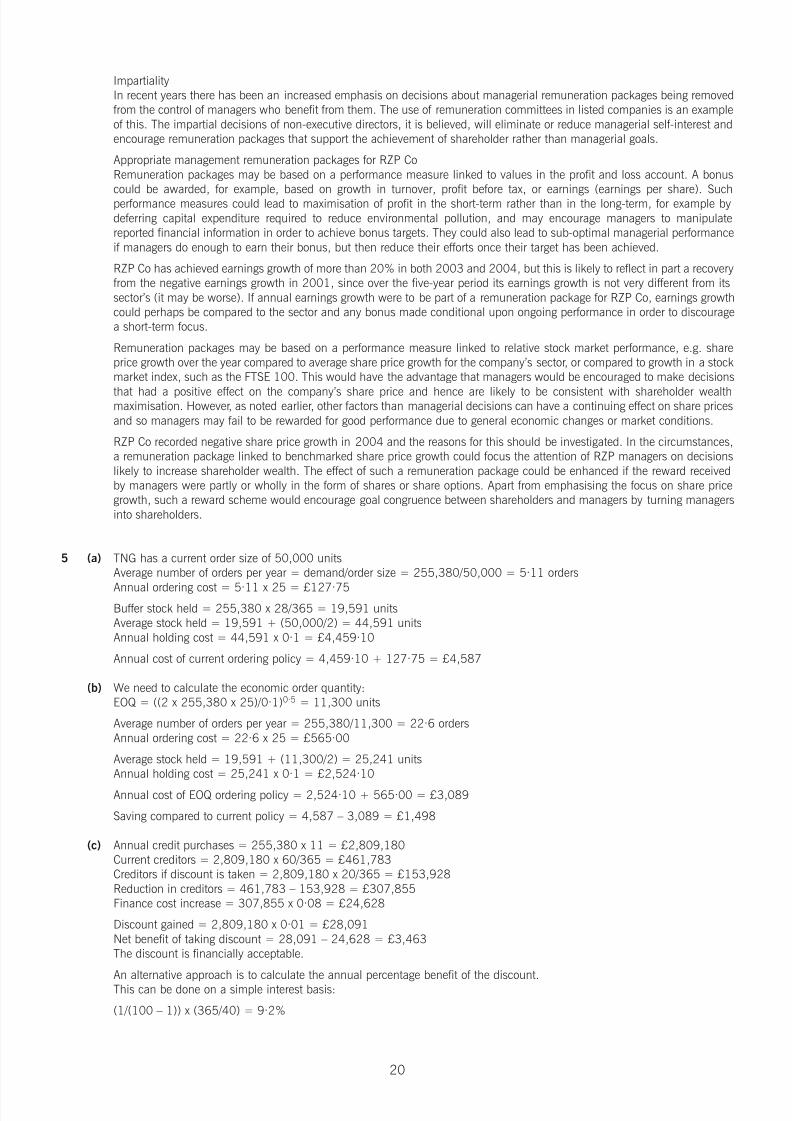
ImpartialityIn recent years there has been an increased emphasis on decisions about managerial remuneration packages being removedfrom the control of managers who benefit from them. The use of remuneration committees in listed companies is an exampleof this. The impartial decisions of non-executive directors, it is believed, will eliminate or reduce managerial self-interest andencourage remuneration packages that support the achievement of shareholder rather than managerial goals.
Appropriate management remuneration packages for RZP CoRemuneration packages may be based on a performance measure linked to values in the profit and loss account. A bonuscould be awarded, for example, based on growth in turnover, profit before tax, or earnings (earnings per share). Suchperformance measures could lead to maximisation of profit in the short-term rather than in the long-term, for example bydeferring capital expenditure required to reduce environmental pollution, and may encourage managers to manipulatereported financial information in order to achieve bonus targets. They could also lead to sub-optimal managerial performanceif managers do enough to earn their bonus, but then reduce their efforts once their target has been achieved.
RZP Co has achieved earnings growth of more than 20% in both 2003 and 2004, but this is likely to reflect in part a recoveryfrom the negative earnings growth in 2001, since over the five-year period its earnings growth is not very different from itssector’s (it may be worse). If annual earnings growth were to be part of a remuneration package for RZP Co, earnings growthcould perhaps be compared to the sector and any bonus made conditional upon ongoing performance in order to discouragea short-term focus.
Remuneration packages may be based on a performance measure linked to relative stock market performance, e.g. shareprice growth over the year compared to average share price growth for the company’s sector, or compared to growth in a stockmarket index, such as the FTSE 100. This would have the advantage that managers would be encouraged to make decisions
that had a positive effect on the company’s share price and hence are likely to be consistent with shareholder wealthmaximisation. However, as noted earlier, other factors than managerial decisions can have a continuing effect on share pricesand so managers may fail to be rewarded for good performance due to general economic changes or market conditions.
RZP Co recorded negative share price growth in 2004 and the reasons for this should be investigated. In the circumstances,a remuneration package linked to benchmarked share price growth could focus the attention of RZP managers on decisionslikely to increase shareholder wealth. The effect of such a remuneration package could be enhanced if the reward receivedby managers were partly or wholly in the form of shares or share options. Apart from emphasising the focus on share pricegrowth, such a reward scheme would encourage goal congruence between shareholders and managers by turning managersinto shareholders.
5 (a) TNG has a current order size of 50,000 unitsAverage number of orders per year = demand/order size = 255,380/50,000 = 5·11 orders
Annual ordering cost = 5·11 x 25 = £127·75Buffer stock held = 255,380 x 28/365 = 19,591 unitsAverage stock held = 19,591 + (50,000/2) = 44,591 unitsAnnual holding cost = 44,591 x 0·1 = £4,459·10
Annual cost of current ordering policy = 4,459·10 + 127·75 = £4,587
(b) We need to calculate the economic order quantity:EOQ = ((2 x 255,380 x 25)/0·1)0·5 = 11,300 units
Average number of orders per year = 255,380/11,300 = 22·6 ordersAnnual ordering cost = 22·6 x 25 = £565·00
Average stock held = 19,591 + (11,300/2) = 25,241 unitsAnnual holding cost = 25,241 x 0·1 = £2,524·10
Annual cost of EOQ ordering policy = 2,524·10 + 565·00 = £3,089
Saving compared to current policy = 4,587 – 3,089 = £1,498
(c) Annual credit purchases = 255,380 x 11 = £2,809,180Current creditors = 2,809,180 x 60/365 = £461,783Creditors if discount is taken = 2,809,180 x 20/365 = £153,928Reduction in creditors = 461,783 – 153,928 = £307,855Finance cost increase = 307,855 x 0·08 = £24,628
Discount gained = 2,809,180 x 0·01 = £28,091Net benefit of taking discount = 28,091 – 24,628 = £3,463The discount is financially acceptable.
An alternative approach is to calculate the annual percentage benefit of the discount.This can be done on a simple interest basis:
(1/(100 – 1)) x (365/40) = 9·2%

8/3/2019 2-4_2005_jun_a
http://slidepdf.com/reader/full/2-42005juna 11/15
21
Alternatively, the equivalent annual rate can be calculated:
(100/(100 – 1))365/40 – 1 = 9·6%
Both methods indicate that the annual percentage benefit is greater than the current cost of short-term debt (8%) of TNGand hence can be recommended on financial grounds.
(d) The economic order quantity (EOQ) model is based on a cost function for holding stock which has two terms: holding costsand ordering costs. With the EOQ, the total cost of having stock is minimised when holding cost is equal to ordering cost.
The EOQ model assumes certain knowledge of the variables on which it depends and for this reason is called a deterministicmodel. Demand for stock, holding cost per unit per year and order cost are assumed to be certain and constant for the periodunder consideration. In practice, demand is likely to be variable or irregular and costs will not remain constant. The EOQmodel also ignores the cost of running out of stock (stockouts). This has caused some to suggest that the EOQ model haslittle to recommend it as a practical model for the management of stock.
The model was developed on the basis of zero lead time and no buffer stock, but these are not difficulties that prevent thepractical application of the EOQ model. As our earlier analysis has shown, the EOQ model can be used in circumstanceswhere buffer stock exists and provided that lead time is known with certainty it can be ignored.
The EOQ model also serves a useful purpose in directing attention towards the costs that arise from holding stock. If thesecosts can be reduced, working capital tied up in stock can be reduced and overall profitability can be increased.
If uncertainty exists in terms of demand or lead time, a more complex stock management model using probabilities (astochastic model) such as the Miller-Orr model can be used. This model calculates control limits that give guidance as to
when an order should be placed.
(e) Just-in-time (JIT) stock management methods seek to eliminate any waste that arises in the manufacturing process as a resultof using stock. JIT purchasing methods apply the JIT principle to deliveries of material from suppliers. With JIT productionmethods, stock levels of raw materials, work-in-progress and finished goods are reduced to a minimum or eliminatedaltogether by improved work-flow planning and closer relationships with suppliers.
AdvantagesJIT stock management methods seek to eliminate waste at all stages of the manufacturing process by minimising oreliminating stock, defects, breakdowns and production delays3. This is achieved by improved workflow planning, anemphasis on quality control and firm contracts between buyer and supplier.
One advantage of JIT stock management methods is a stronger relationship between buyer and supplier. This offers securityto the supplier, who benefits from regular orders, continuing future business and more certain production planning. The buyerbenefits from lower stock holding costs, lower investment in stock and work in progress, and the transfer of stock management
problems to the supplier. The buyer may also benefit from bulk purchase discounts or lower purchase costs.
The emphasis on quality control in the production process reduces scrap, reworking and set-up costs, while improvedproduction design can reduce or even eliminate unnecessary material movements. The result is a smooth flow of materialand work through the production system, with no queues or idle time.
DisadvantagesA JIT stock management system may not run as smoothly in practice as theory may predict, since there may be little roomfor manoeuvre in the event of unforeseen delays. There is little room for error, for example, on delivery times.
The buyer is also dependent on the supplier for maintaining the quality of delivered materials and components. If deliveredquality is not up to the required standard, expensive downtime or a production standstill may arise, although the buyer canprotect against this eventuality by including guarantees and penalties in to the supplier’s contract. If the supplier increasesprices, the buyer may find that it is not easy to find an alternative supplier who is able, at short notice, to meet his needs.
–––––––––––––––––––––3 Drury, C. (2000), Management and Cost Accounting, 5th edition, Thomson Learning, pp.908–11

8/3/2019 2-4_2005_jun_a
http://slidepdf.com/reader/full/2-42005juna 12/15
22
8/3/2019 2-4_2005_jun_a
http://slidepdf.com/reader/full/2-42005juna 13/15
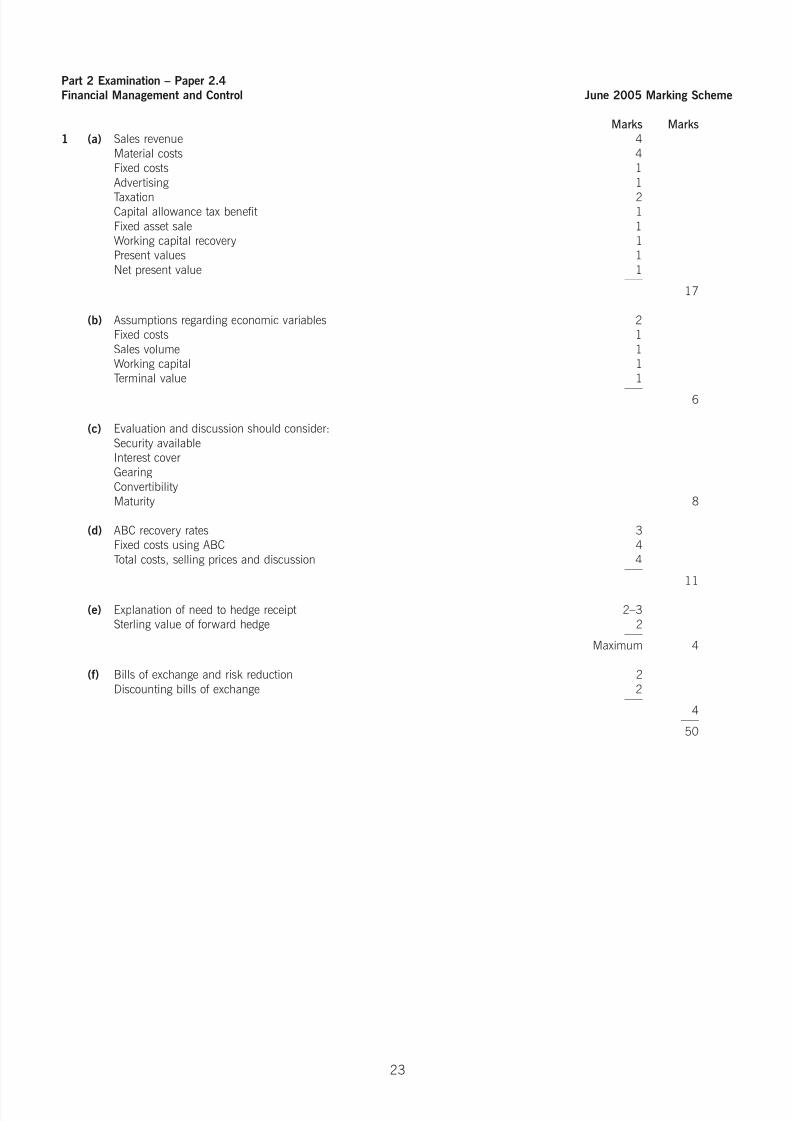
Part 2 Examination – Paper 2.4
Financial Management and Control June 2005 Marking Scheme
Marks Marks
1 (a) Sales revenue 4Material costs 4Fixed costs 1Advertising 1
Taxation 2Capital allowance tax benefit 1Fixed asset sale 1Working capital recovery 1Present values 1Net present value 1
–––17
(b) Assumptions regarding economic variables 2Fixed costs 1Sales volume 1Working capital 1Terminal value 1
––– 6
(c) Evaluation and discussion should consider:Security availableInterest coverGearingConvertibilityMaturity 8
(d) ABC recovery rates 3Fixed costs using ABC 4Total costs, selling prices and discussion 4
–––11
(e) Explanation of need to hedge receipt 2–3Sterling value of forward hedge 2
–––Maximum 4
(f) Bills of exchange and risk reduction 2Discounting bills of exchange 2
–––4
–––50
23

8/3/2019 2-4_2005_jun_a
http://slidepdf.com/reader/full/2-42005juna 14/15
Marks Marks
2 (a) Features of a not-for-profit organisation 1Selection of cost units 3–4Use of performance measures 3–4Comparison of planned and actual performance 3–4
–––Maximum 10
(b) Zero-based budgeting and incremental budgeting 1Decision packages 2Ranking decision packages 2Allocating resources 1Zero-based budgeting and NFP organisations 2
–––8
(c) Explanation of activity-based budgeting 2Need for detailed analysis of costs and activities 1Stages in activity-based budgeting 2–3Advantages of activity-based budgeting 2–3
–––Maximum 7
–––25
3 (a) Overhead absorption rate 1Standard costs and standard profits 3Sales price variance 2Sales volume profit variance 2Sales mix profit variance 2Sales quantity profit variance 2Profit reconciliation 1
–––13
(b) Significance of sales mix profit variance 3Comment on individual mix variances 1
––– 4
(c) Elements of a standard costing system 2–3Quantitative analysis and preparation of standard costs 2–3Variance analysis 2–3Review of standards 2–3
–––Maximum 8
–––25
4 (a) Growth in dividends per share: analysis/discussion 4–5Share price growth: analysis/discussion 4–5
Growth in earnings per share: analysis/discussion 4–5–––
Maximum 13
(b) Calculation of total shareholder return 2Comment 1
–––3
(c) Discussion of factors 5–6Examples of appropriate remuneration packages 4–5
–––Maximum 9
–––25
24

8/3/2019 2-4_2005_jun_a
http://slidepdf.com/reader/full/2-42005juna 15/15
Marks Marks
5 (a) Annual ordering cost 1Annual holding cost 2Annual cost of current policy 1
–––4
(b) Calculation of economic order quantity 1Annual ordering cost 1Annual holding cost 1Annual cost of EOQ policy 1Saving from using EOQ policy or discussion 1
–––5
(c) Analysis 2–3Discussion 1–2
–––Maximum 4
(d) Discussion of limitations of EOQ model 4
(e) Advantages of JIT stock management methods 4–5
Disadvantages of JIT stock management methods 4–5–––Maximum 8
–––25