2 0 18 a kids michigan where count all kids in michigan … · kendra moyses, acting co-director,...
TRANSCRIPT

KIDSC O U N TIN MICHIGAN
Data Book
A Michigan Where All Kids Thrive
2018

CHAIRMike Foley, Executive Director, Michigan Children’s Trust Fund
2018 KIDS COUNT IN MICHIGAN ADVISORY COMMITTEE
Jan Amsterburg, Ph.D., Superintendent, Gratiot-Isabella Intermediate School DistrictCasey Anbender, J.D., Senior Management Analyst, Child Welfare Services, Michigan Supreme CourtStacie Bladen, L.M.S.W., Deputy Director, Children’s Services Administration, Michigan Department of Health and Human ServicesAnnette Chapman, Vice President, Grantmaking and Scholarships, Battle Creek Community FoundationRobert S. Collier, President and CEO, Council of Michigan FoundationsMichele Corey, Vice President for Programs, Michigan's ChildrenDavid Coulter, Senior Program Officer, Children’s Hospital of Michigan FoundationGhida Dagher, Director of Government and Community Relations, United Way for Southeastern MichiganEric Guthrie, Michigan’s State Demographer, Department of Technology, Management & Budget, Bureau of Labor Market Information and Strategic InitiativesOrlene Hawks, Director, Office of Children’s OmbudsmanPaula Herbart, President, Michigan Education AssociationWendy Lewis Jackson, Managing Director, Detroit Program, The Kresge FoundationGilda Z. Jacobs, President and CEO, Michigan League for Public PolicyJerry D. Johnson, Assistant Superintendent, Calhoun Intermediate School DistrictAmy E. Krug, Managing Director, Ele’s PlaceJodi Latuszek, Juvenile Management Analyst, Trial Court Services, State Court Administrative OfficeNancy Lindman, Director of Public Policy and Partnerships, Michigan Association of United WaysRuben Martinez, Ph.D., Director, Julian Samora Research Institute, Michigan State UniversityDavid R. McGhee, Program Director, The Skillman FoundationSummer Minnick, Director, Policy Initiatives and Federal Affairs, Michigan Municipal LeagueKendra Moyses, Acting Co-Director, Senior Extension Educator, Michigan State University Extension Erica Raleigh, Director, Data Driven DetroitAlex Rossman, Communications Director, Michigan League for Public PolicyDenise Sloan, Executive Director, Michigan Chapter American Academy of PediatricsAnn Michele Stacks, Ph.D.,Director, Infant Mental Health Program, Merrill Palmer Skillman InstituteMichele Strasz, Executive Director, Capital Area College Access NetworkStacey Tadgerson, M.P.A., Director, Native American AffairsMaxine Thome, Executive Director, National Association of Social Workers/Michigan ChapterJohn Tramontana, Director, Community and Public Relations, Michigan Association of School BoardsMichelle Weemhoff, M.S.W., Senior Policy Advisor, Michigan Council on Crime and DelinquencyHolly Wingard, Training and Technical Assistance Systems Manager, Early Childhood Investment CorporationAmy Zaagman, Executive Director, Michigan Council for Maternal and Child Health
EX-OFFICIOAlicia Guevara Warren, M.P. Aff., Kids Count in Michigan Project Director, Michigan League for Public Policy

The 2018 Kids Count in Michigan Data Book was written and developed by Alicia Guevara Warren of the Michigan League for Public Policy with the assistance of League and project staff. Many thanks to Harriet McTigue and, now retired, Paul Diefenbach, who collected and compiled the data. Thank you to Tillie Kucharek, who designed the book and developed the profiles and maps. Also appreciated are staff members Alex Rossman and Laura Ross for reviewing and editing the data book and other League staff for fact checking.
Thank you to the members of the Kids Count in Michigan AdvisoryCommittee, who have given their time and expertise to help shape thedata book and other project activities throughout the year. We are gratefulfor your thoughtful review of the data book.
Many thanks to the families who submitted pictures of their kids and families to be featured in this year’s data book!
Kids Count in Michigan is part of a broad nationaleffort to measure the well-being of children at the state and local levels and use that information to shape efforts toimprove the lives ofchildren.
The project is housed at theMichigan League for PublicPolicy, a research and advocacyorganization whose mission is to advance economic security, racial equity, health and well-being for all people in every part of Michigan through policy change.
Acknowledgements
Generous Supporters of the 2018 Kids Count inMichigan Data Book
Annie E. Casey Foundation The Max M. and Marjorie S. Fisher Foundation The Skillman FoundationRuth Mott FoundationSteelcase FoundationMichigan Education AssociationAmerican Federation of Teachers MichiganBlue Cross Blue Shield of Michigan FoundationUnited Way for Southeastern MichiganDTE Energy FoundationFord Motor Company FundBattle Creek Community Foundation
The findings and conclusions presented herein do not necessarily reflect the opinions of our funders.
● Center for Educational Performance and Information ● Early Childhood Investment Corporation● Michigan Department of Health and Human Services ● Michigan Department of Education ● Office of the State Demographer
Data Provided by:
Copyright: Michigan League for Public Policy 2018
Any part of this book may be duplicated and distributed for nonprofit educational purposes provided the source is credited.
Suggested citation: Guevara Warren, Alicia S. 2018 Kids Count in Michigan Data Book: A Michigan Where All Kids Thrive. Revised. Lansing, Michigan: Michigan League for Public Policy.
www.mlpp.org

4
9
Table of Contents
Introduction
1
Introduction
2
Introduction
About the Kids Count Indicators
2Using the Data Book
3Data into Action
4Michigan Trends in Child Well-Being
6Overall Child Well-Being: County Rankings
8
MichiganBackground Information
7Child Population
9Indicators Data Definitions
and Endnotes
26Economic Security Health & Safety Family & Community 18Education
1014
22

In 2016, more than 1 in 5 children in Michigan still lived in poverty. That is an improvement from 23% in 2010 when our state was beginning to recover from the Great Recession. However, that means that 444,100 children lived in poverty. And while unemployment levels are down to their lowest in decades and median income has slowly risen, jobs in Michigan have been disproportionately low wage1 and when adjusted for inflation, income levels are still below pre-recession levels.2 Even when families are working—two-thirds of young children have both parents in the workforce—it is a struggle to make ends meet. Families need access to jobs that provide family-supporting wages and benefits.
Levels of children living in high-poverty neighborhoods have also remained steady at 17%, with ranges up to over 43% in Schoolcraft and Wayne counties. Children of color are much more likely to live in poverty and in concentrated poverty: 55% of African-American and 29% of Latinx children live in high-poverty neighborhoods where the poverty rate is 30% or higher. Neighborhoods with high levels of poverty are less likely to offer opportunities that improve outcomes—schools without ade-quate resources, fewer jobs for parents and higher rates of crime and violence are generally found instead.3 The chronic stress that can occur when living in poverty and high-poverty neighborhoods can also negatively impact child development and overall health and well-being.4
Poverty remains one of the best predictors of outcomes for kids. It is connected to homelessness, which results in instability and trauma for children. It appears in the child welfare system, where there is a greater risk of neglect causing adverse effects for kids. Educational outcomes vary greatly based on income and the availability, or lack of, resources to support learning. Children’s health is affected by poverty whether through environmental issues, such as high levels of lead in older housing, or hunger and poor nutrition.
The racial and ethnic disparities that exist in poverty and other indicators of well-being for children in Michigan are unaccept-able. The 2017 Race for Results report by the national KIDS COUNT project revealed that African-American kids in Michigan fare worse than their peers in any other state and no state is doing particularly well in outcomes for Latinx children.5 Systems and institutions have historically worked against people of color, which has led to deep differences in opportunity. As a state and a country, we need to develop policies using a racial equity lens and that includes prioritizing the collection and availability of data disaggregated by race and ethnicity.
Recent reforms to the state’s zero-tolerance school discipline law, which disproportionately impacts kids of color, are an exam-ple of how policy can begin to tackle disparities in the school-to-prison pipeline. Another opportunity for lawmakers to make a significant impact would be to raise the age of juvenile jurisdiction from 17 to 18 years old. Youth of color are overrepresented in the number of 17-year-olds entering the state’s adult criminal justice system, strapping them with an adult criminal record and denying them of future economic and educational opportunities.
The 2018 Kids Count in Michigan Data Book continues to demonstrate that race and income are critical factors to beaddressed if we are to create a Michigan where all children have opportunities to reach their potential. While there have been some significant wins and investments in programs for children, such as increased funding for the At-Risk School Aid program and improvements in the state’s child care subsidy program, these come after more than a decade of disinvestments and the erosion of safety net programs meant to assist families experiencing poverty and financial difficulties. The research is clear: money matters for child well-being. Increasing financial resources to families through policies like the state’s Earned Income Tax Credit (EITC) and cash assistance programs improves outcomes, including education attainment.6 There is much more work ahead.
Introduction
2018 Kids Count in Michigan Data Book | 1

About the Kids Count Indicators
Children in Poverty (Ages 0-17)-U.S. Census Bureau, SAIPE-
Children growing up in poverty ($24,339 for a family of four) are much more likely than their peers to experience stress and deprivation that hinders development and readiness for school, health and other developmental outcomes.
Young Children Eligible forSNAP (Ages 0-5)
-MI Dept. of Health & Human Services-
The Michigan Food AssistanceProgram (FAP), known as SNAP nationally, provides financial assis-tance to families with low incomes to buy groceries, striving to reduce food insecurity.
Students Eligible for Free/Reduced-Price Lunches
-Center for Education Performance Information-
K-12 students from families with incomes below 130% of the federal poverty level are eligible for a fully subsidized lunch. Those from families with incomes between 130% and 185% of poverty are eligible for reduced-price lunch. This is commonly used as a proxy for poverty.
Less Than Adequate Prenatal Care-MI Dept. of Health & Human Services-
Prenatal care increases the chances of a healthy pregnancy and birth. Adequacy of prenatal care is based on the Kessner Index, which measures adequacy by the month it began, number of prenatal visits and length of the pregnancy. Prenatal care is adequate when it begins in the first trimester and includes, on average, at least one or two additional prenatal visits per month, depending on length of gestation.
Economic Security
Health and Safety
Low-Birthweight Babies
-MI Dept. of Health & Human Services-
Infants born with low birthweight (less than 5 lbs., 8 oz.) are at a higher risk for physical and developmental de-lays that hinder growth, school readiness and long-term health out-comes.
Infant Mortality-MI Dept. of Health & Human Services-
Infants who die before their first birthday is a child out-come, but also an indicator of population health. There are several main causes of infant deaths, some of which are genetic and others are environmental factors.
Child/Teen Deaths(Ages 1-19)
-MI Dept. of Health & Human Services-
Child and teen death rates from all causes, such as accidents, illnesses, homi-cide and suicide, can reveal underlying issues and inequities within communi-ties, such as neighborhood safety, access to healthcare or exposure to environmen-tal toxins.
Family and Community
Births to Teens (Ages 15-19)-MI Dept. of Health & Human Services-
Teen moms often struggle to complete high school, live in poverty, and raise a child alone, making it more difficult for them to create good early learning environments to ensure their children are ready and prepared for school. Babies born to teen mothers are more likely to be born too early and/or too small.
Children in FamiliesInvestigated for Abuse/
Neglect-MI Dept. of Health & Human Services-
Each reported case of abuse or neglect is investigated and categorized based on the evidence collected and the safety risk for recurrence of abuse or neglect.
Children Confirmed As Victims of Abuse/Neglect-MI Dept. of Health & Human Services-
Experiencing abuse or neglect as a child is one adverse child-hood experience (ACE) that hinders healthy development and outcomes into adulthood.
Children Placed in Out-of-Home Care Due to Abuse/
Neglect-MI Dept. of Health & Human Services-
Children are removed from their families and placed in a foster home, relative care, residen-tial care or shelter following substantiated abuse or neglect. This also has an adverse effect on health, development and outcomes into adulthood.
Education3- and 4-Year-Olds
in Preschool-U.S. Census Bureau, SAIPE-
Children who partic-ipate in high-quality preschool programs are more likely to be socially and cognitively ready for kindergarten.
Students NOT Grad-uating From High School On Time-MI Dept. of Education-
Students who gradu-ate with their cohort within four years are more likely to be better prepared for postsecondary educa-tion or training.
Third-Graders NOTProficient in English
Language Arts-MI Dept. of Education-
After third grade, students read to learn rather than learn to read, making third-grade reading proficiency an important benchmark of future academic outcomes, such as high school graduation and long-term economic security.
Eighth-Graders NOTProficient in Math
-MI Dept. of Education-
Proficiency in math by the end of middle school prepares students for high school math cours-es, increasing chances of graduation and develop-ment of basic math skills for adulthood.
Students NOT College Ready
-MI Dept. of Education-
Students who meet the col-lege readiness benchmarks are more likely to successfully complete entry-level college requirements without remedi-ation courses. Being college ready at the start of college increases the likelihood of postsecondary graduation.
2 | 2018 Kids Count in Michigan Data Book

39 The Annie E. Casey Foundation | www.aecf.orgSTATE TRENDS IN CHILD WELL-BEING
Hundreds of child well-being indicators at your fingertips to encourage policies and support smart decisions for children and families.
datacenter.kidscount.org
Create custom profiles
Create line graphs
Create maps
Create bar charts
Enter any location, topic or keyword into the powerful search engine to find the statistics most relevant to your community. Post data visualizations
on Facebook, add custom graphics to Tumblr and tweet about how the well-being of your state's children compares with the region and nation.
1
3
2
Since 1992, the Michigan League for Public Policy has produced the annual Kids Count in Michigan Data Book. The book reviews background and trend data to evaluate the well-being of children throughout communities in Michigan while identifying policy strategies that could be implemented to improve outcomes. The base period for the 2018 book is 2010 compared to 2016, unless otherwise noted. The report analyzes 16 key indicators across four domains: 1) economic security, 2) health and safety, 3) family and community, and 4) education. The overall child well-being rank is based on a county’s rank in 14 of the 16 measures; infant mortality and child and teen deaths are excluded as many counties do not have sufficient data on these two indicators. With several changes to the data this year, rankings from previous years cannot be compared.
New to the 2018 data book is the trend indicator on college readiness. Beginning with the 2016-2017 school year, the SAT with essay was administered to 11th-grade students during the Michigan Merit Examination (MME) in the spring. The college readiness data are based on total scores in all subjects, including evidence-based reading and writing and mathematics.
There are also several data limitations to note in this year’s report:
Children hospitalized for asthma: In 2015, there were changes in the coding making previous and future years incomparable. With this change, the data is only avail-able in a single year, which means that almost all counties do not have data available since this data is generally reported in three-year averages.
Childhood lead testing and poisoning: Reliable local data from the Michigan Department of Health and Human Services was unavailable beyond 2015.
Virtual schools: Due to the methodology and available data, virtual schools are included in county data accord-ing to the location of the virtual school authorizer.
Additionally, prior years have combined data for Missaukee and Wexford counties and Grand Traverse and Leelanau counties for children living in families investigated for child abuse or neglect and children confirmed as victims of abuse or neglect. The 2018 data book reports separate numbers for each of these counties, including the base year and most recent year of data.
With the help of the Michigan Department of Health and Hu-mans Services (MDHHS) Children’s Services Administration,
children confirmed as victims of abuse or neglect and children placed in out-of-home care due to abuse or neglect data are now reliably available by race and ethnicity. The data provides a detailed breakdown of race and ethnicity, which are then categorized and calculated by the League. All children witha race code that includes Hispanic are categorized as “His-panic,” while children with multiple race codes are categorized as “Multiracial.” Children with single race codes are catego-rized accordingly. The MDHHS also includes race codes“Unable to Determine” and “No Match Found,” which the League categorizes as “Unable to Determine.” Due to these changes, data from prior years cannot be compared.
Finally, caution should be taken when reviewing rates (e.g., per 1,000 or 100,000), percentages and numbers. Small population numbers in some areas of the state often result in data being suppressed, and small numbers may cause per-cent changes in a rate to appear more significant. Also, keep in mind that some data are based on different time frames (e.g., school years, fiscal years, and three-year and five-year averages).
•
•
•
Using the Data Book
2018 Kids Count in Michigan Data Book | 3
Economic Security KEY FINDINGS: RECOMMENDATIONS:
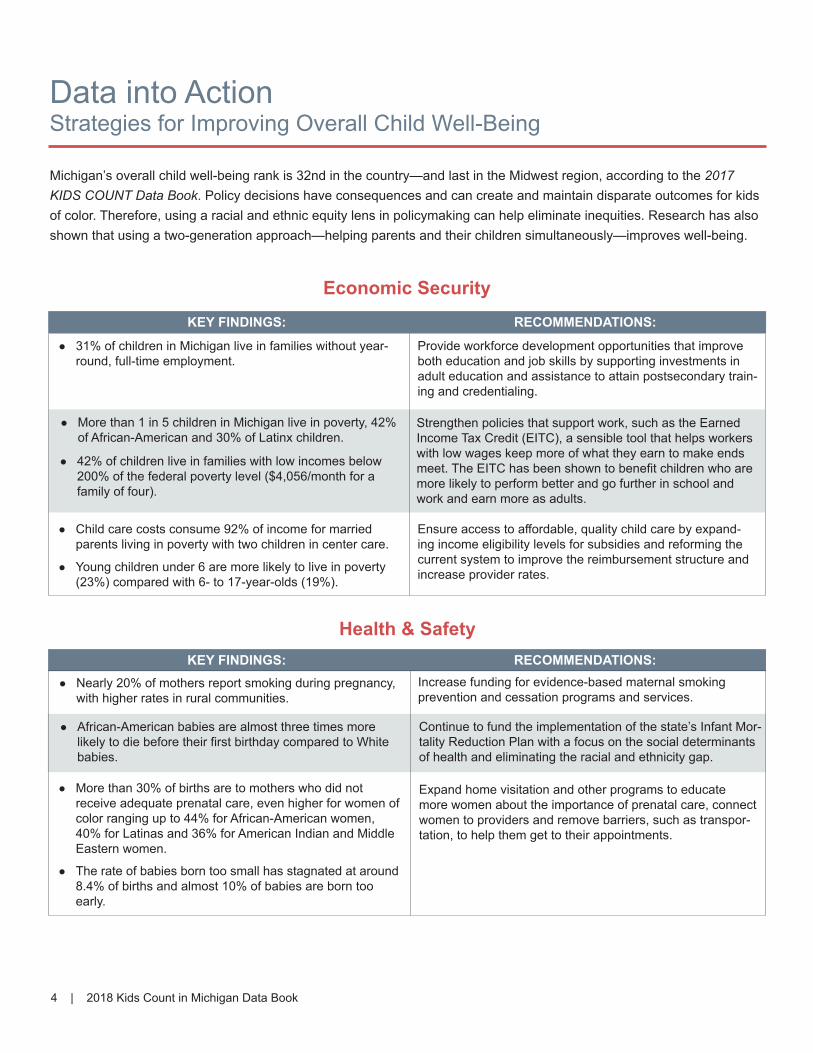
● 31% of children in Michigan live in families without year- round, full-time employment.
Provide workforce development opportunities that improve both education and job skills by supporting investments in adult education and assistance to attain postsecondary train-ing and credentialing.
● Child care costs consume 92% of income for married parents living in poverty with two children in center care.
Strengthen policies that support work, such as the Earned Income Tax Credit (EITC), a sensible tool that helps workers with low wages keep more of what they earn to make ends meet. The EITC has been shown to benefit children who are more likely to perform better and go further in school and work and earn more as adults.
Ensure access to affordable, quality child care by expand-ing income eligibility levels for subsidies and reforming the current system to improve the reimbursement structure and increase provider rates.
Health & Safety
● Nearly 20% of mothers report smoking during pregnancy, with higher rates in rural communities.
Increase funding for evidence-based maternal smokingprevention and cessation programs and services.
● African-American babies are almost three times more likely to die before their first birthday compared to White babies.
Continue to fund the implementation of the state’s Infant Mor-tality Reduction Plan with a focus on the social determinants of health and eliminating the racial and ethnicity gap.
Expand home visitation and other programs to educate more women about the importance of prenatal care, connect women to providers and remove barriers, such as transpor-tation, to help them get to their appointments.
KEY FINDINGS: RECOMMENDATIONS:
Michigan’s overall child well-being rank is 32nd in the country—and last in the Midwest region, according to the 2017 KIDS COUNT Data Book. Policy decisions have consequences and can create and maintain disparate outcomes for kids of color. Therefore, using a racial and ethnic equity lens in policymaking can help eliminate inequities. Research has also shown that using a two-generation approach—helping parents and their children simultaneously—improves well-being.
Data into ActionStrategies for Improving Overall Child Well-Being
● More than 1 in 5 children in Michigan live in poverty, 42% of African-American and 30% of Latinx children.
● 42% of children live in families with low incomes below 200% of the federal poverty level ($4,056/month for a family of four).
● Young children under 6 are more likely to live in poverty (23%) compared with 6- to 17-year-olds (19%).
● More than 30% of births are to mothers who did not receive adequate prenatal care, even higher for women of color ranging up to 44% for African-American women, 40% for Latinas and 36% for American Indian and Middle Eastern women.
● The rate of babies born too small has stagnated at around 8.4% of births and almost 10% of babies are born too early.
4 | 2018 Kids Count in Michigan Data Book

2018 Kids Count in Michigan Data Book | 5
Family & Community
Raise the age of juvenile jurisdiction from 17 to 18 years old and fully fund its implementation.
Education
Establish a state-funded 3-year-old preschool program.
Adequately fund public schools, targeting resources in high-need areas and fully funding the At-Risk program, a state program that provides funds to schools to serve students who are at risk of failing academically or who are chronically absent.
KEY FINDINGS: RECOMMENDATIONS:
KEY FINDINGS: RECOMMENDATIONS:
● Michigan is one of five states to still automatically treat 17-year-old children as adults in the criminal justice system.● 682 educational hours are lost each year when 17-year- olds are sent to the adult criminal justice system.
● 65% of Michigan students are not career and college ready. Significant differences exist by race/ethnicity and family income, including 84% of economically disadvan- taged students who do not meet the benchmarks, com- pared to 16% of those from families with higher incomes.
● Nationally, youth exiting the adult justice system are 34% more likely to reoffend, reoffend sooner and escalate to more violent crimes than their counterparts in the juvenile justice system.
Promote comprehensive strategies to prevent child abuse and neglect, including positive parenting education, such as home visitation programs.
Address disparities in the child welfare system through appropriate data collection by race and ethnicity and cultural competency training for workers.
● The rate of children confirmed as victims of abuse or neglect increased by 30% from 2010 to 2016.
● Children of color are overrepresented in the child welfare system; over a quarter of confirmed victims are African- American children, who only make up 18% of the 0-17 population in Michigan.
● Young children between ages 0-8 are at higher risk for living in families investigated for abuse or neglect, being confirmed as a victim and placed in out-of-home care.
● 52.7% of 3- and 4-year-olds are not in preschool, and the rate has remained flat over the trend period.
● 55.9% of all third-graders are not proficient in English Language Arts. About 7 in 10 students of color, compared to 48% of White students, are not proficient in the state’s third-grade reading test.
Provide sufficient funding for early interventions to improve third-grade reading using a birth-to-8 framework, including maternal and child health programs, Early On, and affordable, high-quality child care and education.
● Data collection by race and ethnicity is inconsistent with federal standards in several state systems, especially in the adult justice system. In general, data collection statewide in juvenile justice is also inadequate.
To make informed policy decisions and increase transpar-ency, robust data must be collected and publicly dissemi-nated, including data by race and ethnicity.
Data Collection KEY FINDINGS: RECOMMENDATIONS:
● It is becoming increasingly difficult in some instances to access data regarding public programs and outcomes.
The state should increase access to and transparency of data, especially in relation to publicly funded programs and outcomes.
ECONOMIC SECURITY 2010 2016 Children in poverty, ages 0–17 Young children, ages 0–5, in the Food Assistance Program1
Students receiving free/reduced- 2009–10 (SY) 2016–17 (SY) price school lunches2
HEALTH 2008–10 (avg.) 2013–15 (avg.) Less than adequate prenatal care Low-birthweight babies Infant mortality (per 1,000)
Child/Teen deaths, ages 1–19 (per 100,000)
FAMILY AND COMMUNITY (per 1,000) 2008–10 (avg.) 2013–15 (avg.) Births to teens, ages 15–19 Child abuse/neglect 2010 2016 Children in investigated families Confirmed victims Children in out-of-home care
EDUCATION 2006–10 (avg.) 2012–16 (avg.) 3- and 4-year-olds not in preschool 2010 2016 Students not graduating on time
2016 2017 Students not college ready
Not proficient (M-STEP) 2014–15 (SY) 2016–17 (SY)
Third-graders (English Language Arts) Eighth-graders (Math)
BASE YEAR CURRENT YEAR NUMBER RATE NUMBER RATE RATE CHANGE
1 Supplemental Nutrition Assistance Program.2 Family income is below 185% of poverty level.* Sometimes a rate could not be calculated because of low incidence of events or unavailable data.N/A - not available. | SY - School Year. | M-STEP - Michigan Student Test of Educational Progress was first administered in 2015.
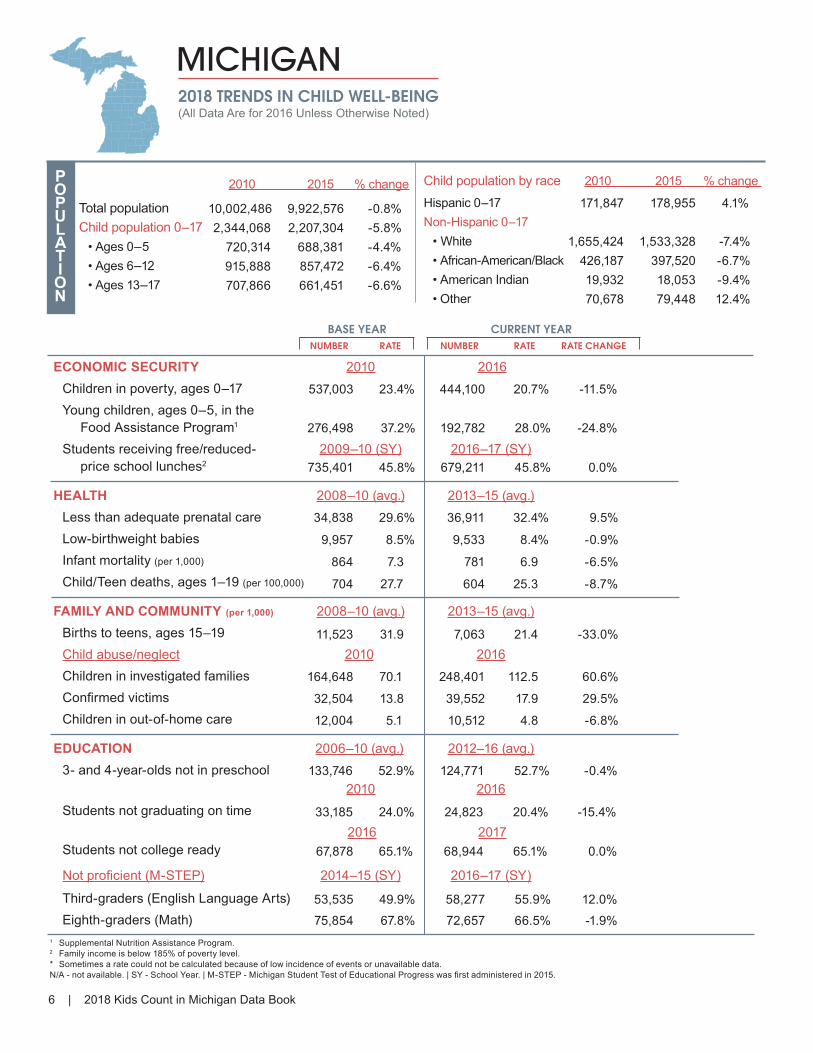
537,003 23.4% 444,100 20.7% -11.5%
276,498 37.2% 192,782 28.0% -24.8%
735,401 45.8% 679,211 45.8% 0.0%
Child population by race 2010 2015 % change
Hispanic 0–17Non-Hispanic 0–17 • White • African-American/Black • American Indian • Other
10,002,486 9,922,576 -0.8% 2,344,068 2,207,304 -5.8% 720,314 688,381 -4.4% 915,888 857,472 -6.4% 707,866 661,451 -6.6%
171,847 178,955 4.1%
1,655,424 1,533,328 -7.4% 426,187 397,520 -6.7% 19,932 18,053 -9.4% 70,678 79,448 12.4%
Total populationChild population 0–17 • Ages 0–5 • Ages 6–12 • Ages 13–17
POPULATION
2010 2015 % change
(All Data Are for 2016 Unless Otherwise Noted)
11,523 31.9 7,063 21.4 -33.0%
133,746 52.9% 124,771 52.7% -0.4%
33,185 24.0% 24,823 20.4% -15.4%
34,838 29.6% 36,911 32.4% 9.5%
9,957 8.5% 9,533 8.4% -0.9%
864 7.3 781 6.9 -6.5%
704 27.7 604 25.3 -8.7%
164,648 70.1 248,401 112.5 60.6%
32,504 13.8 39,552 17.9 29.5%
12,004 5.1 10,512 4.8 -6.8%
53,535 49.9% 58,277 55.9% 12.0% 75,854 67.8% 72,657 66.5% -1.9%
2018 TRENDS IN CHILD WELL-BEING
MICHIGAN
67,878 65.1% 68,944 65.1% 0.0%
6 | 2018 Kids Count in Michigan Data Book

2018 Kids Count in Michigan Data Book | 7
2018 BACKGROUND INFORMATION
2,208,934 96.8%
973,458 41.5% 45,968 2.0%
125,993 74.9%
86,470 37.9% 1,439 1.7% 2,560 14.3
Children with health insurance (2015)Children, ages 0–18, insured by... • Medicaid1
• MIChildFully immunized toddlers, ages 19–35 months (for the series 4:3:1:3:3:1:4)1
Lead poisoning in children, ages 1–2 (2015) • Tested • Poisoned (% of tested) (EBL confirmed by venous)Children, ages 1–14, hospitalized for asthma (rate per 10,000) (2015)
Children with special needs • Students in Special Education1
• Children receiving Supplemental Security Income (rate per 1,000)1
• Children, ages 0–2, receiving Early On services (ISD totals)
ACCESS TO HEALTHCARE NUMBER MI RATE
206,317 13.9% 42,753 19.4 9,835 2.9%
1 As of December 2016.2 Family Independence Program.3 State name for the federal Supplemental Nutrition Assistance Program, formerly called “food stamps.” Note: Percentages reflect percent of population unless otherwise noted.* Sometimes a rate could not be calculated because of low incidence of events or unavailable data.N/A - not available.See Data Definitions and Notes for details.
ECONOMIC CLIMATEUnemploymentMedian household incomeAverage cost of full-time child care/month (2017) • Percent of full-time minimum wage (2017)Percent of young children ages 0–5 in Michigan families (2012–16 avg.) where all parents work
4.9% $52,436
$575
37.3%
MICHIGAN
66.4%
Births to moms without high school diploma or GED (2013–15)High-poverty neighborhoods, ages 0–17 (2012–16)Household structure, ages 0–17 • Two-parent family • One-parent familyPoverty by household structure, ages 0–17 (2012–16) • Two-parent family • One-parent familyEnglish not spoken at home, ages 5–17 (2012–16)
FAMILY AND COMMUNITY NUMBER MI RATE
FAMILY SUPPORT PROGRAMS NUMBER MI RATE
Children receiving... • Subsidized child care, ages 0–121
• FIP cash assistance1,2
• Food Assistance Program1,3
• Women, Infants, and Children (WIC)
Children with support owed • Receiving none (% of those owed) • Receiving less than 70% of amount • Average amount received (month)
14,262 12.5% 369,445 16.9%
1,436,296 66.1% 736,723 33.9%
151,815 10.6% 335,485 45.5% 170,402 10.3%
31,322 2.0% 39,649 1.7% 547,117 23.3% 280,554 49.1%
517,318 20.9% 122,412 23.7% 300,607 58.1% $216 $216
MICHIGAN

Overall Child Well-Being Ranked
8 | 2018 Kids Count in Michigan Data Book
61-82Wexford
Clare
Isabella
Montcalm GratiotSaginaw
Clinton
Eaton Ingham
Jackson Washtenaw Wayne
MonroeLenaweeBranchBerrien
Van Buren
Genesee
Tuscola
Huron
Sanilac
Bay
Oakland MacombShia
wassee
Ottawa
Allegan
41-60
21-40
Newaygo Midland
Ionia
Barry
Cass St. Joseph
St. Clair
Muskegon
Kent
Kalamazoo
Lapeer
Livingston
Hillsdale
Mecosta
GladwinOsceolaLakeMason
Manistee
Benzie GrandTraverse
Kalkaska
Arenac
IoscoOgemaw
Crawford Oscoda Alcona
AlpenaOtsegoAntrim
Presque Isle
Emmet
Missau
keeRosc
ommon
Montmore
ncy
Chebo
ygan
Leelan
au
Charlevoix
Oceana
Menomine
eMackinac
ChippewaLuce
Schoolcraft
Dickinson
AlgerIron
Baraga
Delta
MarquetteGogebic
Ontonagon
Houghton
Keweenaw
1-20
Calhoun
Counties Ranked
No Data
1. Livingston 2. Clinton 2. Ottawa 4. Oakland 5. Washtenaw 6. Emmet 7. Leelanau 8. Midland 9. Houghton 10. Grand Traverse
21. Eaton 22. Ionia 23. Otsego 24. Lenawee 25. Sanilac 26. Isabella 27. St. Clair 28. Shiawassee 29. Ontonagon 30. Menominee
31. Benzie 32. Antrim 33. Chippewa 34. Alger 35. Tusola 36. Bay 37. Missaukee 38. Kalamazoo 39. Mackinac 40. Ingham
41. Gratiot 42. Mason 43. Presque Isle 44. Montcalm 45. Saginaw 46. Baraga 47. Arenac 48. Cass 49. Delta 50. Alpena
51. Mecosta 52. Newaygo 53. Branch 54. Gogebic 55. Van Buren 56. Montmorency 57. Gladwin 58. Jackson 59. Crawford 60. Ogemaw
72. Luce 73. Kalkaska 74. Alcona 75. Iosco 76. Manistee 77. Iron 78. Oceana 79. Calhoun 80. Muskegon 81. Clare 82. Lake
11. Charlevoix 12. Marquette 13. Lapeer 14. Monroe 15. Macomb 16. Barry 17. Allegan 18. Huron 18. Kent 20. Dickinson
61. Cheboygan 62. Oscoda 63. Berrien 64. Wayne 65. Osceola 66. Hillsdale 67. Roscommon 68. Wexford 69. St. Joseph 70. Schoolcraft 71. Genesee

More than 1 in 4
Michiganders are kids
under 18.
Source: U.S. Census Bureau, 2010-2015 Source: U.S. Census Bureau, 2015
African-American/Black, Non-Hispanic
18%
American Indian, Non-Hispanic
1%Other Race,
Non-Hispanic4%
Latinx/Hispanic8%
Almost 1 in 3 kids are children of color.
Source: U.S. Census Bureau, 2015; Ages 0-17 Years
Michigan child population is mostly distributed evenly across age groups; however, younger
children make up a smaller share.
Source: U.S. Census Bureau, 2015; Ages 0-19 Years
10-14 Years26%
5-9 Years24%
0-4 Years23%15-19 Years
27%
Child Population
White,Non-Hispanic
69%
2018 Kids Count in Michigan Data Book | 9
2,344,068
2,207,304
2010 2011 2012 2013 2014 2015
Num
ber o
f Chi
ldre
n,Ag
es 0
-17
Child population in Michigan continues to decline.

It is without a doubt that family income has a direct impact on outcomes for kids. When families are challenged with constant worry about how to pay their bills—rent, utilities, child care, medical expenses and more—that can turn into toxic stress, which affects brain development, school read-iness, mental health and other factors of child well-being.1
Helping families achieve financial security improves health, families, communities, education and the state economy. When parents have better opportunities, they can do more for their children.
It is important to recognize that barriers to achieving eco-nomic security are compounded by race and ethnicity. In nearly every factor, whether it’s rates of poverty, post-secondary education access and completion, median income or unemployment, families of color fare worse. Strategies must be targeted to address existing disparities.
Economic Security
The federal poverty level does not adequately capture all struggling families.
In 2016:
More than 2 in 5 (42%) children lived in families at 200% of the federal poverty level, or $48,678 (two adults working a combined wage of $23.40/hour) for a family of four
Almost one-third (32%) of children lived in families at 150% of the federal poverty level, or $36,509 (two adults working a combined wage of $17.55/hour) for a family of four
Around 1 in 10 (9%) children lived in families at 50% of the federal poverty level, or $12,170 (two adults work-ing a combined wage of $5.85/hour) for a family of four
Note: Hourly wages based on 52 weeks of pay for 40 hours per weekSource: National KIDS COUNT project
10 | 2018 Kids Count in Michigan Data Book

2016: Child poverty, ages 0-17
Michigan: 20.7% 5 Best Counties Rate 5 Worst Counties Rate
Livingston 6.4% Lake 40.2%
Ottawa 8.9% Crawford 34.6%
Clinton 9.9% Clare 34.1%
Oakland 10.8% Wayne 33.8%
Allegan 11.8% Roscommon 32.9%
Number of Counties: 2010 vs. 2016 Ranked Changed Improved
83 83 73
2016: Young children eligible for food aid (SNAP)
Michigan: 28% 5 Best Counties Rate 5 Worst Counties Rate
Livingston 8.8% Lake 55.9%
Ottawa 9.8% Wayne 45.6%
Leelanau 12.9% Roscommon 41.9%
Clinton 13.9% Ogemaw 40.3%
Oakland 14.2% Gogebic 40.2%
2016-2017: Students eligible for free/ reduced-price lunch
Michigan: 45.8% 5 Best Counties Rate 5 Worst Counties Rate
Livingston 17.0% Lake 91.8%
Washtenaw 27.7% Oceana 71.4%
Clinton 27.8% Iosco 67.4%
Oakland 30.3% Alcona 67.3%
Midland 32.4% Roscommon 65.9%
Ottawa 32.4%
County Summary & Rankings
Number of Counties: 2010 vs. 2017 Ranked Changed Improved
82 81 41
Number of Counties: 2010 vs. 2016 Ranked Changed Improved
83 83 83
2018 Kids Count in Michigan Data Book | 11

0
20,000
40,000
60,000
0.0%
1.0%
2.0%
3.0%
4.0%
2010 2011 2012 2013 2014 2015 2016
October 1, 2010-2015
Child Care Eligibility Levels
October 1, 2016
October 1, 2017
120% 125% 130%
Child poverty (0-17) isexperienced differently by race/
ethnicity in Michigan:
42% of African-American children
30% of Latinx children
15% of Asian and Pacific Islander children
26% of children identifying with two or more races
Compared to 15% of White children
Source: National KIDS COUNT Project, 2012-2016
After dropping dramatically, expansions in eligibility result in slight increases in children receiving child
care subsidies.
Source: Michigan Department of Health and Human Services, December 2016
Perc
ent o
f Chi
ldre
n, A
ges
0-12
Num
ber o
f Chi
ldre
n, A
ges
0-12
Percent of the federal poverty level
$333average monthly
subsidy payment per child (December 2016)
Source: National KIDS COUNT Project, 2016
All but 11 counties improved from 2010, but more than 1 in 5 kids in Michigan still lived in poverty in 2016
12 | 2018 Kids Count in Michigan Data Book
Compounding poverty rates...
54%of African-American children lived in
high-poverty neighborhoods,
30%of Latinx children.
More than 28%
Wexford
Clare
Isabella
Montcalm GratiotSaginaw
Clinton
Eaton Ingham
Jackson Washtenaw Wayne
MonroeLenaweeBranchBerrien
Van Buren
Genesee
Tuscola
Huron
Sanilac
Bay
Oakland MacombShia
wassee
Ottawa
Allegan
24% to 28%17% to 23%
Newaygo Midland
Ionia
Barry
Cass St. Joseph
St. Clair
Muskegon
Kent
Kalamazoo
Lapeer
Livingston
Hillsdale
Mecosta
GladwinOsceolaLakeMason
Manistee
Benzie GrandTraverse
Kalkaska
Arenac
IoscoOgemaw
Crawford Oscoda Alcona
AlpenaOtsegoAntrim
Presque Isle
Emmet
Missau
keeRosc
ommon
Montmore
ncy
Chebo
ygan
Leelan
au
Charlevoix
Oceana
Menomine
e
Mackinac
ChippewaLuce
Schoolcraft
Dickinson
AlgerIron
Baraga
Delta
MarquetteGogebic
Ontonagon
Houghton
Keweenaw
Less than 17%
Calhoun
Source: U.S. Census Bureau, Small Area Income and Poverty Estimates (SAIPE)
Michigan Poverty Rate: 20.7%
Median Poverty Rate: 22.7%
Source: Michigan Department of Health and Human Services, December 2016

45.8% 46.5% 48.1% 48.2% 48.4% 46.7% 46.1% 45.8%
SY 09-10 SY 10-11 SY 11-12 SY 12-13 SY 13-14 SY 14-15 SY 15-16 SY 16-17
Fewer than3 in 10
young children ages 0-5 received food assistance, down from 37%
in 2010.
Source: Michigan Department of Health and Human Services, 2016
Source: National KIDS COUNT Project, 2016
Under 6 Years Old
Between 6 and 17 Years Old
Percent in Poverty
19%
23%
While the number of children receiving free or reduced-price lunch has declined, the share of students in need has remained relatively flat.
Source: MI School Data, SY 2009-SY 2016
Num
ber o
f K-1
2St
uden
ts
Perc
ent o
f K-1
2 St
uden
ts
More than 1 in 5 kids in Michigan live in poverty while 2 in 5 live in a family struggling to make ends meet. Despite the state’s economic recovery, parents are challenged with finding secure employment: 31% of kids live in families without year-round, full-time employment, and it’s higher for African-American (54%) and Latinx (39%) children.2 The lack of resources can lead to food insecurity, homelessness and neglect in child welfare, all of which have long-term effects on child and adult well-being. In neighborhoods with high levels of poverty, it becomes even more difficult for families to access needed support—regardless of whether a family itself lives in poverty. Government safety net programs and other policies that support work, like the federal and state Earned Income Tax Credit (EITC), are critical for families. The supplemental poverty measure shows the importance of these programs; child poverty is reduced to 15% when we account for many government programs.3 Unfortunately, many of these have been eliminated or severely reduced.
What does this mean for kids in Michigan?
28%
72%
735,401 730,991 747,630 740,296 737,094702,737 679,211687,937
Young children are more likely to live in poverty.
2018 Kids Count in Michigan Data Book | 13

14 | 2018 Kids Count in Michigan Data Book
The health of a child begins long before he or she is born; a woman’s preconception and prenatal care are critical to birth outcomes. In addition to access to health- care, factors such as poverty, nutrition, housing, mental health and others affect not only a woman’s health,but that of her child. Even more important is the quality of care received. Maternal and child health are good indicators of the priorities of a state or country.
Health is inextricably connected to educationaloutcomes, stronger families and communities, andeconomic security. With the impact of institutionalracism and sexism across their life span, women of color, particularly African-American women, experience poorer health outcomes than White women. Adding to this is an unequal healthcare system and lack ofprovider training in racial and ethnic equity.1 Thesemust be addressed to improve the health of all.
About 63,000 children, or 3%, are uninsured inMichigan. Facing additional barriers to access,
Latinx children are more likely to be uninsured at 5%.TYPE OF COVERAGE
Source: National KIDS COUNT Data Center
Employer-based only
52%
Direct-purchase only4%
Other private coverage
1%Public only
34%
Both public and private
coverage5%
Uninsured3%
Health & Safety
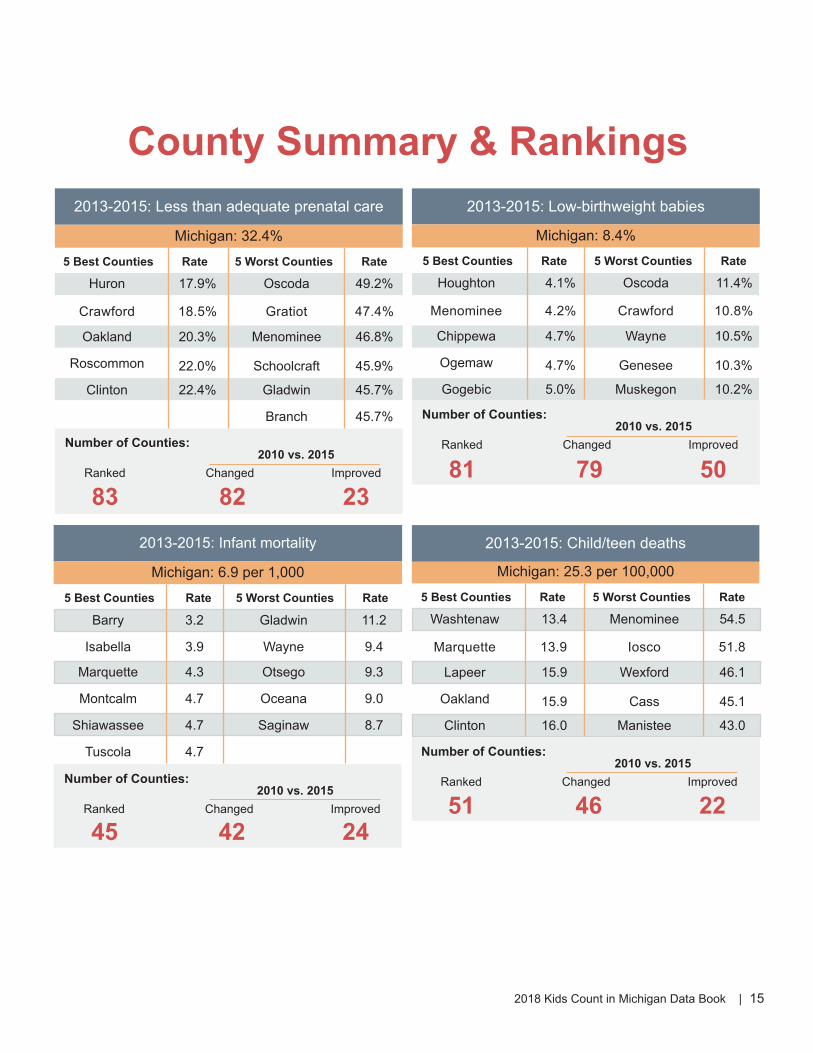
2013-2015: Less than adequate prenatal care
Michigan: 32.4% 5 Best Counties Rate 5 Worst Counties Rate
Huron 17.9% Oscoda 49.2%
Crawford 18.5% Gratiot 47.4%
Oakland 20.3% Menominee 46.8%
Roscommon 22.0% Schoolcraft 45.9%
Clinton 22.4% Gladwin 45.7%
Branch 45.7%
Number of Counties: 2010 vs. 2015 Ranked Changed Improved
83 82 23
2013-2015: Low-birthweight babies
Michigan: 8.4% 5 Best Counties Rate 5 Worst Counties Rate
Houghton 4.1% Oscoda 11.4%
Menominee 4.2% Crawford 10.8%
Chippewa 4.7% Wayne 10.5%
Ogemaw 4.7% Genesee 10.3%
Gogebic 5.0% Muskegon 10.2%
2013-2015: Infant mortality
Michigan: 6.9 per 1,000 5 Best Counties Rate 5 Worst Counties Rate
Barry 3.2 Gladwin 11.2
Isabella 3.9 Wayne 9.4
Marquette 4.3 Otsego 9.3
Montcalm 4.7 Oceana 9.0
Shiawassee 4.7 Saginaw 8.7
Tuscola 4.7
Number of Counties: 2010 vs. 2015 Ranked Changed Improved
45 42 24
Number of Counties: 2010 vs. 2015 Ranked Changed Improved
81 79 50
Michigan: 25.3 per 100,000 5 Best Counties Rate 5 Worst Counties Rate
Washtenaw 13.4 Menominee 54.5
Marquette 13.9 Iosco 51.8
Lapeer 15.9 Wexford 46.1
Oakland 15.9 Cass 45.1
Clinton 16.0 Manistee 43.0
Number of Counties: 2010 vs. 2015 Ranked Changed Improved
51 46 22
County Summary & Rankings
2013-2015: Child/teen deaths
2018 Kids Count in Michigan Data Book | 15

Above 8%
Wexford
Clare
Isabella
Montcalm GratiotSaginaw
Clinton
Eaton Ingham
Jackson Washtenaw Wayne
MonroeLenaweeBranchBerrien
Van Buren
Genesee
Tuscola
Huron
Sanilac
Bay
Oakland MacombShia
wassee
Ottawa
Allegan
7% to 8%
6% to 7% Newaygo Midland
Ionia
Barry
Cass St. Joseph
St. Clair
Muskegon
Kent
Kalamazoo
Lapeer
Livingston
Hillsdale
Mecosta
GladwinOsceolaLakeMason
Manistee
Benzie GrandTraverse
Kalkaska
Arenac
IoscoOgemaw
Crawford Oscoda Alcona
AlpenaOtsegoAntrim
Presque Isle
EmmetMiss
aukee
Roscom
monMont
morency
Chebo
ygan
Leelan
au
Charlevoix
Oceana
Menomine
e
Mackinac
ChippewaLuce
Schoolcraft
Dickinson
AlgerIron
Baraga
Delta
MarquetteGogebic
Ontonagon
Houghton
Keweenaw
Below 6%
Calhoun
No Data
Michigan Rate 8.4%
Median Rate: 6.9%
more likely to be born too small compared to White, Latinx, Middle Eastern and American Indian babies.
2 XHigher rates than the state average are seen for Asian and Pacific Islander babies:
Women of color experience additional barriers to accessingadequate prenatal care.
More than 2 in 5 low birthweights are to mothers living in communities withconcentrated poverty.
Source: Michigan Department of Health and Human Services, 2013-2015
41%
59%
8.9% of births
compared to 8.4%.
Perc
ent o
f Birt
hsLe
ss th
an A
dequ
ate
Pren
atal
Car
e
Source: Michigan Department of Health and Human Services, 2013-2015
The share of babies born too small has remainedmostly the same since 2010 without improvement.
Source: Michigan Department of Health and Human Services
African-American babies are
32.5%29.0%
43.9%36.0%
30.3%
41.8% 40.3%35.5%
All Races White Black AmericanIndian
Asian &Pacific
Islander
All OtherRaces
HispanicAncestry
ArabAncestry
Low-birthweight Babies, 2013-2015 Average
16 | 2018 Kids Count in Michigan Data Book

Significant stress experienced by expecting mothers whether due to discrimination, inadequate housing, foodinsecurity, poverty, neighborhood safety or other factors can impact birth outcomes and child development.2 The rate of babies born too small has remained relatively flat without improvements—or worsening—since 2010. Still about 1 in 10 babies are born too early. Additionally, unequal access to adequate prenatal care remains unacceptably high for all women in Michigan, particularly for women of color. Tackling existing health disparities, especially for African-Amer-ican women and their babies, must be a priority for our state. When systems and policies take care of all women, then children and families do better. Healthy kids make better learners and this begins with a healthy mom and birth. This includes taking a comprehensive approach to addressing poverty, inadequate or unsafe housing, food insecurity and access to prenatal care. Finally, the rate of African-American youth deaths, particularly by homicide, is unacceptable. Policies must be targeted in ways to improve safety for youth.
What does this mean for kids in Michigan?
Infa
nt D
eath
Rat
espe
r 1,0
00
Source: Michigan Department of Health and Human Services
While teen deaths are declining, African-American youth are much morelikely to die young, and by homicide.
Source: Michigan Department of Health and Human Services, 2015
0.8
11.518.8
12.9
44.0
33.1
7.8
20.913.9
75.7
0.0 2.2
17.323.8
43.3
0.06.7
23.3 20.0
50.0
Homicide Suicide Accident Disease Total
White, Non-Hispanic
African-American/Black, Non-Hispanic
Latinx/Hispanic
Other, Non-Hispanic
Rat
es p
er 1
00,0
00,
Age
s 15
-19
2018 Kids Count in Michigan Data Book | 17
2008-2010 2013-2015
Infant death rate rising for Hispanics, more than double for African-Americans compared to Whites.
7.35.4
14.7
9.8
3.7
8.26.76.9
5.1
13.5
9.8
4.1
9.15.8
Michigan Total White, Non-Hispanic
Black, Non-Hispanic
AmericanIndian, Non-
Hispanic
Asian/PacificIslander, Non-
Hispanic
Hispanic Middle Eastern(All Races)
2008-2010 2013-2015
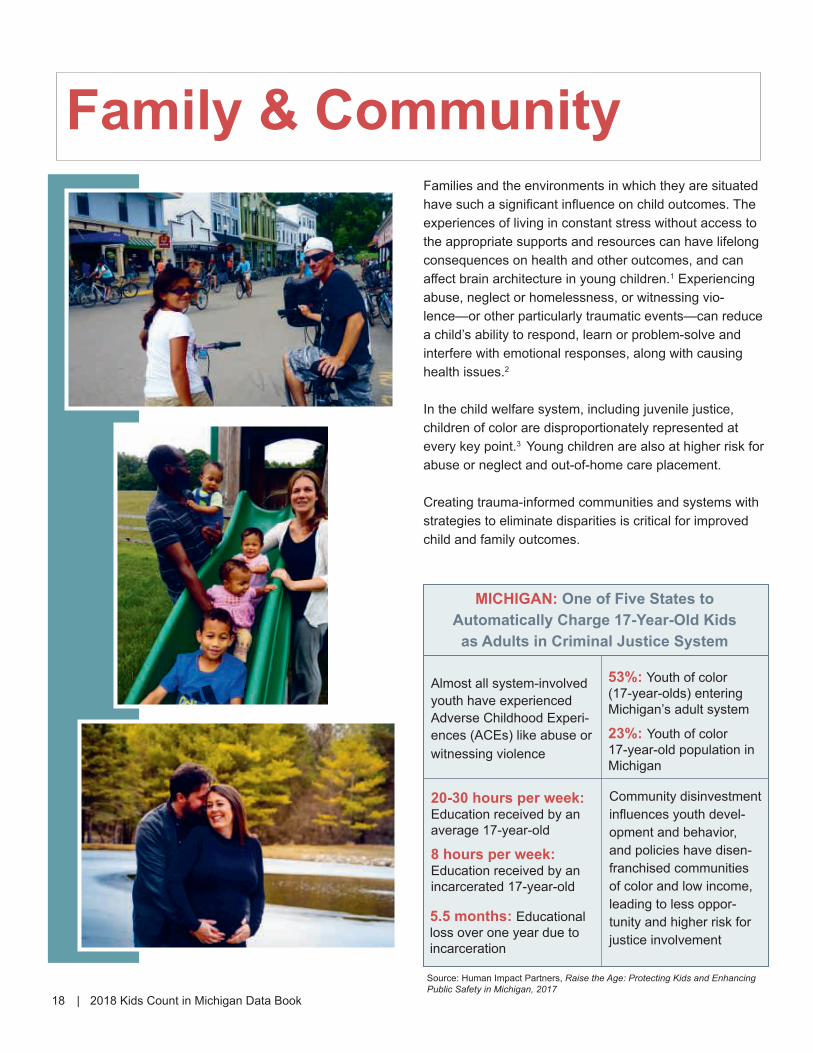
Families and the environments in which they are situated have such a significant influence on child outcomes. The experiences of living in constant stress without access to the appropriate supports and resources can have lifelong consequences on health and other outcomes, and can affect brain architecture in young children.1 Experiencing abuse, neglect or homelessness, or witnessing vio-lence—or other particularly traumatic events—can reduce a child’s ability to respond, learn or problem-solve and interfere with emotional responses, along with causing health issues.2
In the child welfare system, including juvenile justice, children of color are disproportionately represented at every key point.3 Young children are also at higher risk for abuse or neglect and out-of-home care placement.
Creating trauma-informed communities and systems with strategies to eliminate disparities is critical for improved child and family outcomes.
Family & Community
53%: Youth of color (17-year-olds) entering Michigan’s adult system
23%: Youth of color 17-year-old population in Michigan
MICHIGAN: One of Five States to Automatically Charge 17-Year-Old Kidsas Adults in Criminal Justice System
Almost all system-involved youth have experiencedAdverse Childhood Experi-ences (ACEs) like abuse or witnessing violence
20-30 hours per week: Education received by anaverage 17-year-old
8 hours per week:Education received by anincarcerated 17-year-old
Community disinvestment influences youth devel-opment and behavior, and policies have disen-franchised communities of color and low income, leading to less oppor-tunity and higher risk for justice involvement
5.5 months: Educational loss over one year due to incarceration
Source: Human Impact Partners, Raise the Age: Protecting Kids and Enhancing Public Safety in Michigan, 2017
18 | 2018 Kids Count in Michigan Data Book

2013-2015: Teen births
Michigan: 21.4 per 1,000 5 Best Counties Rate 5 Worst Counties Rate
Washtenaw 6.6 St. Joseph 39.4
Livingston 7.7 Oceana 39.3
Houghton 8.6 Clare 39.2
Isabella 9.6 Oscoda 39.1
Clinton 10.3 Wexford 38.6
Number of Counties: 2010 vs. 2015 Ranked Changed Improved
82 82 74
2016: Children in investigated families
Michigan: 112.5 per 1,000 5 Best Counties Rate 5 Worst Counties Rate
Livingston 50.7 Roscommon 236.6
Leelanau 52.3 Lake 230.5
Oakland 54.4 Iosco 219.5
Clinton 64.0 Wexford 207.4
Macomb 65.2 Montcalm 206.6
2016: Confirmed victims of abuse/neglect
Michigan: 17.9 per 1,000 5 Best Counties Rate 5 Worst Counties Rate
Macomb 8.0 47.4
Oakland 8.1 Wexford 46.3
Clinton 9.3 Gogebic 39.9 Ottawa 9.9 Antrim 38.9
Houghton 10.1 Cheboygan 37.2
Number of Counties: 2010 vs. 2016 Ranked Changed Improved
82 80 17
Number of Counties: 2010 vs. 2016 Ranked Changed Improved
83 83 1
2016: Children in out-of-home care
Michigan: 4.8 per 1,000 5 Best Counties Rate 5 Worst Counties Rate
Charlevoix 1.5 Luce 21.3
Houghton 1.5 Gogebic 19.9
Gratiot 1.8 Crawford 14.7
Washtenaw 1.8 Cass 14.2
Ottawa 1.9 Arenac 13.3
Number of Counties: 2010 vs. 2016 Ranked Changed Improved
80 76 32
County Summary & Rankings
2018 Kids Count in Michigan Data Book | 19
Lake

Above 30 per 1,000 teens
Wexford
Clare
Isabella
Montcalm GratiotSaginaw
Clinton
Eaton Ingham
Jackson Washtenaw Wayne
MonroeLenaweeBranchBerrien
Van Buren
Genesee
Tuscola
Huron
Sanilac
Bay
Oakland MacombShia
wassee
Ottawa
Allegan
25-30 per 1,000 teens
20-25 per 1,000 teensNewaygo Midland
Ionia
Barry
Cass St. Joseph
St. Clair
Muskegon
Kent
Kalamazoo
Lapeer
Livingston
Hillsdale
Mecosta
GladwinOsceolaLakeMason
Manistee
Benzie GrandTraverse
Kalkaska
Arenac
IoscoOgemaw
Crawford Oscoda Alcona
AlpenaOtsegoAntrim
Presque Isle
Emmet
Missau
keeRosc
ommon
Montmore
ncy
Chebo
ygan
Leelan
au
Charlevoix
Oceana
Menomine
e
Mackinac
ChippewaLuce
Schoolcraft
Dickinson
AlgerIron
Baraga
Delta
MarquetteGogebic
Ontonagon
Houghton
Keweenaw
Below 20 per 1,000 teens
Median Rate per 1,000 Births: 24.6
Calhoun
Michigan Rate per 1,000 Births: 21.4
No Data
0
25
50
75
100
125
0
50,000
100,000
150,000
200,000
250,000
300,000
2010 2011 2012 2013 2014 2015 2016
Young children at higher risk:
Source: Michigan Department of Health and Human Services, 2016
Children living in families investigated for abuse or neglect has increasedsince the implementation of Centralized Intake in 2012.
Num
ber o
f Chi
ldre
n(A
ges
0-17
)
Source: Michigan Department of Health and Human Services, 2010-2016
57% of children involved in investigations for suspected abuse or neglect were between 0-8 years old
2 in 3 victims of confirmed abuse or neglect were children ages 0-8
Kids ages 0-8 were 1.5 X morelikely than all kids 0-17 to be in out-of-home care due to abuse and neglect
Middle Eastern Ancestry
Hispanic Ancestry
Asian & Pacific Islander
American Indian
Black
White
Total, Ages 15-19
13.4
21.4
16.3
41.3
19.4
4.4
34.9
Rate of Births per 1,000Females Ages 15-19 years old
Source: Michigan Department of Health and Human Services, 2013-2015
Although declining for all, teenbirth rates vary by race/ethnicity.
With many improvements across the state, more than half of counties have a higher teen birth rate than
the state average.
Rat
e pe
r 1,0
00 C
hild
ren
(Age
s 0-
17)
112.5
90.1
70.1
Source: Michigan Department of Health and Human Services
164,648 206,896 248,401
Live Births to Teens Ages 15-19, 2013-2015 Average
20 | 2018 Kids Count in Michigan Data Book

In Michigan, 22% of children have had two or more adverse experiences impacting their development and outcomes.4
Youth who are incarcerated and in the adult corrections system are also experiencing trauma. Additionally, continued increases in the rates of children confirmed as victims of abuse and neglect point to the need for comprehensive sys-tem changes. Children and families have proven to be resilient; however, it is imperative that communities can provide resources and supports that are needed. This requires investments in families and communities, including early inter-ventions as identified by child-serving practitioners and access to high-quality early care and education to help strug-gling families manage and overcome toxic stress. Poverty is also a factor that must be addressed. With high rates of concentrated poverty in Michigan, many children and families are exposed to greater risks of negative outcomes. Finally, Michigan must raise the age of juvenile jurisdiction from 17 to 18 years old. This will improve kids’ health, economic and educational opportunities while also strengthening communities.
What does this mean for kids in Michigan?
2010 2016
13.8
17.9
Source: Michigan Department of Health and Human Services, 2010 and 2016
Rate of children confirmed as victims of abuse/neglect
increased 30% from 2010.R
ate
per 1
,000
Chi
ldre
n,
Ages
0-1
7
African-American/
Black25.2%
American Indian/Alaska Native
0.4%Asian0.3%
Hispanic7.3%
Children of color are overrepresented in the share of confirmed victims of abuse or neglect.
White53.4%
Native Hawaiian/Other Pacific Islander
0.1%
Unknown4.8%
Multiracial8.5%
Source: Michigan Department of Health and Human Services, 2016
0.7% 0.1%
29.4%
0.0%
49.8%
7.1%12.5%
1.0% 3.0%
16.0%
0.0%
68.0%
8.0%5.0%
African-American and multiracial children are overrepresented in the share of children placed in out-of-home care due to abuse or neglect
compared to the population numbers.
American Indian/ Asian Black/ Native White Hispanic/ Multiracial Alaska Native African- Hawaiian/ Latinx American Other Pacific Islander
Out-of-Home Care (FY 2016)Population (2015)
Perc
ent o
f Chi
ldre
n(A
ges
0-17
)
Source: Michigan Department of Health and Human Services and National KIDS COUNT Data Center
2018 Kids Count in Michigan Data Book | 21

Education remains one of the most critical tools that children and people have to reaching financial security. Higher levels of edu-cation also tend to lead to better health outcomes. And the more educated workforce a state has, the stronger the economy and ability to create jobs and increase wages. All of these contribute to thriving communities.
While Michigan was once a national leader in education for its residents, the outcomes for the state’s children rank it in the bot-tom 10 nationally.1 More disturbing are the significant disparities that exist by race and ethnicity and income. These gaps must be addressed, and leaders should recognize the importance that health, families and communities have in shaping development from a young age and throughout a child’s life.
Education
While Michigan has a state-funded 4-year-old program,opportunities exist to expand access to preschool
to 3-year-olds.
Above 60%Wexford
Clare
Isabella
Montcalm GratiotSaginaw
Clinton
Eaton Ingham
Jackson Washtenaw Wayne
MonroeLenaweeBranchBerrien
Van Buren
Genesee
Tuscola
Huron
Sanilac
Bay
Oakland MacombShia
wassee
Ottawa
Allegan
55% to 60%
50% to 55%
Newaygo Midland
Ionia
Barry
Cass St. Joseph
St. Clair
Muskegon
Kent
Kalamazoo
Lapeer
Livingston
Hillsdale
Mecosta
GladwinOsceolaLakeMason
Manistee
Benzie GrandTraverse
Kalkaska
Arenac
IoscoOgemaw
Crawford Oscoda Alcona
AlpenaOtsegoAntrim
Presque Isle
Emmet
Missau
keeRosc
ommon
Montmore
ncy
Chebo
ygan
Leelan
au
Charlevoix
Oceana
Menomine
e
Mackinac
ChippewaLuce
Schoolcraft
Dickinson
AlgerIron
Baraga
Delta
MarquetteGogebic
Ontonagon
Houghton
Keweenaw
Below 50%
Calhoun
Michigan Rate 52.7%
Median Rate: 57.7%
Source: American Community Survey, year 2012-2016
22 | 2018 Kids Count in Michigan Data Book
3- and 4-Year-Olds NOT in Preschool

2012-2016: 3- and 4-year-olds not in preschool
Michigan: 52.7% 5 Best Counties Rate 5 Worst Counties Rate
Oakland 41.2% Houghton 76.7%
Leelanau 42.9% Benzie 74.5%
Grand Traverse 43.2% Alpena 69.5%
Otsego 43.2% Cass 66.5%
Ontonagon 43.3% Oscoda 66.5%
Number of Counties: 2010 vs. 2016 Ranked Changed Improved
83 81 43
County Summary & Rankings2017: Third-graders not proficient in English
Language ArtsMichigan: 55.9%
5 Best Counties Rate 5 Worst Counties Rate
Ottawa 37.1% Lake 72.0%
Livingston 39.3% Oceana 71.7%
Ontonagon 40.0% Schoolcraft 68.6%
Houghton 41.0% Manistee 68.5%
Dickinson 41.8% Newaygo 67.4%
Number of Counties: 2015 vs. 2017 Ranked Changed Improved
82 82 112017: Eighth-graders not proficient in math
Michigan: 66.5%
Number of Counties: 2015 vs. 2017 Ranked Changed Improved
82 82 52
2016: Students not graduating on time
Michigan: 20.4% 5 Best Counties Rate 5 Worst Counties Rate
Alcona 8.7% Manistee 54.0%
Iron 9.5% Lake 38.5%
Antrim 10.1% Berrien 34.3%
Huron 10.1% Roscommon 33.5%
Shiawassee 10.3% Montmorency 33.3%
Number of Counties: 2010 vs. 2016 Ranked Changed Improved
80 80 52
2017: Students not college or career ready
5 Best Counties Rate 5 Worst Counties Rate
Washtenaw 43.3% Lake 100.0%
Midland 47.9% Schoolcraft 87.0%
Oakland 52.5% Alcona 84.9%
Houghton 53.1% Mackinac 84.6%
Clinton 54.0% Ontonagon 80.8%
Number of Counties: 2016 vs. 2017 Ranked Changed Improved
82 80 32
Note: Districts within Manistee and Berrien counties are authorizers for virtual schools, which are included in totals for the county.
Michigan: 65.1%
5 Best Counties Rate 5 Worst Counties Rate
Ottawa 47.7% Lake 100.0%
Washtenaw 49.7% Ontonagon 90.3%
Emmet 52.3% Kalkaska 87.3%
Crawford 53.8% Alger 85.1%
Ogemaw 53.8% Baraga 82.0%
Gogebic 82.0%
2018 Kids Count in Michigan Data Book | 23

Econ
omically DisadvantagedSource: MI School Data, SY 2016-17
Kids of color are more likely to attend underresourced schools compared totheir White peers, resulting in disparate outcomes in third-grade reading.
Students experiencing homelessness and students with disabilitiesstruggle the most to graduate on time.
Perc
ent N
OT
Gra
duat
ing
on T
ime
Source: MI School Data, 2016
All Students 55.9%
White Students 48.3%
Students of Color 70.2%
Third-Graders NOT Proficient in English Language Arts (M-STEP)
Econ
omically Advantaged
29%71%
60%
40%
Third-grade reading differs
significantly by family
income: 71% of students
from families with low
incomes are not proficient
compared to 40% of those
in families with higher
incomes.
More than 2 in 3 eighth-graders
were notproficient in
math.
Not Proficient Proficient
24 | 2018 Kids Count in Michigan Data Book
20.4
33.4
9.8
32.6
22.316.6
27.4 26.332.9
27.933.8
46.5 44.7
All Students American Indian AsianAfrican-American Native Hawaiian WhiteHispanic (Any Race) Two or More Races Economically DisadvantagedEnglish Learners Migrant HomelessStudents with Disabilities
Source: MI School Data, SY 2016-17

All Michigan students struggle to meet college readiness benchmarks. Nearly 2 in 3 students in Michigan are not ready for their next step in postsecondary education. These rates vary significantly for students based on income and race and ethnicity. Disparities in educational access and outcomes show up early in preschool attendance, third-grade reading and eighth-grade math proficiency rates. Improving the state’s national standing in education will require state investments and coordination addressing many factors that impact outcomes, such as prenatal care, support to families with young children under the age of 4 and changes to juvenile justice to reduce disparities. Business leaders must also be engaged to help develop the future workforce that our state needs to thrive both economically and in quality of life.
What does this mean for kids in Michigan?
Source: MI School Data, SY 2016-17
Students from families with low incomes are more likely to attend schoolswith fewer resources to prepare for postsecondary training and education.
All Students Not EconomicallyDisadvantaged
EconomicallyDisadvantaged
46.2%
16.0%
65.1%
34.9%
53.8%84.0% Did Not Meet College
Readiness Benchmarks
Met or Exceeded CollegeReadiness Benchmarks
Students of color face additional barriers to reaching college readiness.Did Not Meet CollegeReadiness Benchmarks
Met or Exceeded CollegeReadiness Benchmarks
White
Two or More Races
Native Hawaiian or Other Pacific Islander
Hispanic of Any Race
Black or African-American
All Race/Ethnicity
American Indian or Alaska Native
Asian
Source: MI School Data, SY 2016-17
34.9%
20.9%
63.3%
9.1%
18.8%
39.4%
31.7%
40.9%
65.1%
79.1%
36.7%
90.9%
81.2%
60.6%
68.3%
59.1%
2018 Kids Count in Michigan Data Book | 25
Data Definitions and Notes
TREND INDICATORS (in order of their appearance on state/county profiles)
POPULATIONEstimated populations for 2010 and 2015 are for all people and of children ages 0-5, 6-12, 13-17 and 0-17. The 0-17 populations are broken down by race and ethnicity. The estimates use a model that incorporates information on natural changes such as births and deaths and net migration. Source: U.S. Census Bureau, State and County Population Estimates; Detroit estimates from the Office of the State Demographer
ECONOMIC SECURITYChildren in PovertyThe number reflects children living in families whose income was below the poverty level in 2010 and 2016. The percentage is based on the total number of children ages 0-17 during that period. Source: U.S. Census Bureau, Small Area Income and Poverty Estimates
Young Children in the Food Assistance ProgramThe number includes children in families eligible for the Food Assistance Program (FAP), also known as the federal Supplemental Nutrition Assistance Program (SNAP), in December 2010 and December 2016. Families qualify with incomes below 130 percent of the poverty level. The percent is based on the estimated populations of children ages 0-5 in 2009 and 2015. Source: Michigan Department of Health and Human Services, Assistance Payments Statistics, Table 68, December 2010 and December 2015 (for counties); special run for Detroit data
Students Eligible for Free or Reduced-Price School LunchesK-12 students from families with incomes below 130 percent of the federal poverty level are eligible for a fully subsidized lunch while children from families with incomes between 130 and 185 percent are eligible for reduced-price meals. The percentage is based on total enrollment of K-12 public school students for school years 2009-10 and 2016-17, including public school academies. Source: Center for Educational Performance Information
CHILD HEALTHLess Than Adequate Prenatal CareThe number represents the mothers who received less than adequate prenatal care as defined by the Kessner Index, which measures the adequacy of prenatal care by the month it began, the number of prenatal visits and the length of the pregnancy. The base year is an annual average for the three-year period of 2008-10. The current number is an annual average for the three-year period of 2013-15. The percent is based on total resident live births based on the mother’s county of residence. Data prior to 2008 are not comparable due to a change in the definition.Source: Michigan Department of Health and Human Services, Vital Records and Health Data Development Section
Low-Birthweight BabiesThe number, which includes those babies who weighed less than 2,500 grams (approximately 5 lb., 8 oz.) at birth, is an annual average for the three-year periods of 2008-10 and 2013-15. The percentage is based on total resident live births in the mother’s county of resi-dence. Data prior to 2008 are not comparable due to a change in the definition.Source: Michigan Department of Health and Human Services, Vital Records and Health Data Development Section
Infant MortalityThe number, which includes infants who died before their first birthday, is an annual average for the three-year periods of 2008-10 and 2013-15. The rate is the number of infant deaths per 1,000 births during the referenced periods based on the mother’s county of residence. Source: Michigan Department of Health and Human Services, Vital Records and Health Data Development Section
Child and Teen DeathsThe number includes deaths from all causes for children ages 1-19. It is an annual average for the three-year periods of 2008-10 and 2013-15. The rate is the number of child deaths per 100,000 children ages 1-19 during those periods based on the child’s county of residence.Source: Michigan Department of Health and Human Services, Vital Records and Health Data Development Section
FAMILY AND COMMUNITYBirths to TeensThe number of births to teens ages 15-19 is an annual average for the three-year periods of 2008-10 and 2013-15. The rate of teen births is based on the number of live births per 1,000 females, ages 15-19, for those periods by county of residence. Source: Michigan Department of Health and Human Services, Vital Records and Health Data Development Section
26 | 2018 Kids Count in Michigan Data Book

Children in Investigated FamiliesThese children reside in families where an investigation of child abuse or neglect was conducted by Children’s Protective Services in fiscal years 2010 and 2016. Families may be investigated more than once in a given year and their children would be counted each time. The number reflects the total for the year. Rates are calculated per 1,000 children ages 0-17 in their county of residence for 2009 and 2015. Data is no longer combined for two sets of counties: Missaukee-Wexford and Grand Traverse-Leelanau.Source: Michigan Department of Health and Human Services, Health and Welfare Data Center, Children’s Protective Services Management Special Report
Confirmed Victims of Abuse or NeglectThe number reflects a count of children ages 0-17 confirmed to be victims of abuse or neglect following an investigation in fiscal years 2010 and 2016. Children may be counted twice if there was evidence of two separate cases of abuse found. The rate is calculated per 1,000 children ages 0-17 in their county of residence for 2009 and 2015. Data is no longer combined for two sets of counties: Missau-kee-Wexford and Grand Traverse-Leelanau.Source: Michigan Department of Health and Human Services, Health and Welfare Data Center, Children’s Protective Services Special Report
Children in Out-of-Home CareThe number represents child victims of abuse or neglect placed in active out-of-home placements, such as a foster or relative home, court-ordered fictive kin, residential or shelter care supervised by the Department of Health and Human Services, its agents or the courts. The county represents the location of the court rather than the child’s residence. The data are from a single month (Septem-ber) in the reference years. The rate is calculated per 1,000 children ages 0-17 for 2009 and 2015. Data is no longer combined for two sets of counties: Missaukee-Wexford and Grand Traverse-Leelanau.Source: Michigan Department of Health and Human Services, Children’s Services Management Information System, Special Report
EDUCATIONChildren Ages 3-4 in PreschoolThe count represents the average number of children ages 3-4 who were not enrolled in preschool during 2012-16. The percent is based on the population for ages 3-4 during that period.Source: American Community Survey, Table S1401
Students Not Graduating On TimeThe count includes students who entered Grade 9 in 2006 or 2012 and did not graduate four years later as expected, or five years if enrolled in an Early Middle College program. The percent is based on the cohort of students entering Grade 9 in those years. Several county totals include virtual schools operated by Intermediate School Districts or school districts within the county, whose students may reside in other counties, impacting on-time graduation rates. The counties most affected are Manistee, Leelanau and Berrien. Source: Michigan Department of Education
Third-Grade English Language Arts (M-STEP)The number reflects third-graders whose performance on the 2017 M-STEP English Language Arts (ELA) test did not meet the standard of proficiency. The percentage is based on the number of third-graders whose ELA test scores were included in the report. M-STEP is a state standardized test for selected subjects in selected grades administered for the first time in 2015 to public school students. Several county totals include virtual schools operated by Intermediate School Districts or school districts within the county, whose students may reside in other counties, impacting rates. The counties most affected are Manistee, Leelanau and Berrien.Source: Michigan Department of Education
Eighth-Grade Math (M-STEP)The number reflects eighth-graders whose performance on the 2017 M-STEP math test did not meet the standard of proficiency. The percentage is based on the number of eighth-graders whose math test scores were included in the report. Several county totals include virtual schools operated by Intermediate School Districts or school districts within the county, whose students may reside in other counties, impacting rates. The counties most affected are Manistee, Leelanau and Berrien.Source: Michigan Department of Education
College ReadinessThe number reflects 11th-graders whose performance on the 2017 College Board SAT in the subjects of Evidence-Based Reading and Writing and Mathematics that did not meet the college readiness benchmarks in one or both of the subjects. The percentage is based on the number of 11th-graders whose SAT test scores were included in the report. The SAT College Readiness data are based on the SAT with essay administration completed during the Michigan Merit Examination in the spring of Grade 11. Prior to the 2015-16 school year the ACT College Readiness examination was used to measure the proficiency of high school students in English, mathematics, reading and science.Source: Michigan Department of Education
2018 Kids Count in Michigan Data Book | 27

FAMILY SUPPORT PROGRAMSChildren Receiving:
Subsidized child care: This number reflects children ages 0-12 in child care whose parents received a subsidy payment from the state in December 2016. Most families qualify with earned income below 121 percent of the poverty level. The percentage is based on the estimated population of children ages 0-12 in 2015. Source: Michigan Department of Health and Human Services, Child Development and Care Program, Assistance Payments Statistics, Table 69, December 2016
Family Independence Program cash assistance: The number reflects child recipients age 0-18 in the Family Independence Program (FIP) in a single month (December 2016). Families with minor children qualify with assets less than $3,000 and gross monthly income below $814. Children in families receiving extended FIP are not included. The percentage is based on the estimated 2015 population of children ages 0-18. Source: Michigan Department of Health and Human Services, Assistance Payments Statistics, Table 4, December 2016 (for counties); special run for Detroit data
Food Assistance Program: The number reflects child recipients ages 0-18 in the Food Assistance Program (FAP), also known as the Supplemental Nutrition Assistance Program, in a single month (December 2016), whose families qualify with incomes below 130 percent of the poverty level. The percentage is based on the estimated population of children ages 0-18 in 2015. Source: Michigan Department of Health and Human Services, Assistance Payments Statistics, Table 68, December 2016 (for counties); special run for Detroit data
Women, Infants, and Children (WIC) program: The number reflects children ages 0-4 who were enrolled in the Women, Infants, and Children (WIC) program during calendar year 2016. The percentage is based on the estimated population of children ages 0-4 in 2015. Source: Michigan Department of Health and Human Services, Michigan WIC Program
Children With Support OwedThe number reflects children ages 0-19 who had a child support order and should have received child support for at least one month during fiscal year 2016. The percent is based on the estimated population of all children ages 0-19 in 2015. The county represents the location of the court rather than the child’s residence.
Receiving none: The number reflects children who received none of the support payments that were owed during fiscal year 2016. The percent is based on the number of children with support owed for at least one month during fiscal year 2016.
Receiving less than 70% of court-ordered amount: The number reflects children who received less than 70 percent of the total support amount owed for fiscal year 2016 (including those who received none). The percent is based on the number of children with support owed for at least one month during fiscal year 2016.
Average amount per child: The number reflects the average monthly amount (per child) of support received in fiscal year 2016 for children who received some child support.
Source: Michigan Department of Health and Human Services, Child Support Enforcement System Special Run
ECONOMIC CLIMATE UnemploymentThe 2016 annual rate (not seasonally adjusted) is based on the average monthly number of persons considered to be in the “workforce” because they are employed or unemployed but are looking and available for work as of April 2017. Source: U.S. Department of Labor, Bureau of Labor Statistics, Local Area Unemployment Statistics
Median Household IncomeThe median represents the midpoint of household income amounts in 2016.Source: U.S. Census Bureau, Small Area Income and Poverty Estimates
Average Cost of Full-Time Child CareThe number is the weighted average monthly cost for infants, toddlers, preschoolers and school-age children in day care centers, group homes and family homes in 2017. Source: Early Childhood Investment Corporation
Percent of Full-Time Minimum Wage The percent is the average child care cost divided by the monthly income from a full-time minimum wage job (based on 173 hours of work).
All Parents Work The number is an average for 2012-2016 of children ages 0-5 whose parents are in the labor force (i.e., either both parents work in a two-parent family or the parent works in a one-parent family). The percent is based on the average population ages 0-5 for 2012-16.Source: American Community Survey, Table B23008
BACKGROUND INDICATORS (in order of their appearance on state/county profiles)
28 | 2018 Kids Count in Michigan Data Book

FAMILY & COMMUNITYBirths to Mothers With No High School Diploma or GED The count is an average for 2013-15. The percent is based on average births for 2013-15.Source: Michigan Department of Health and Human Services, Vital Records and Health Data Development Section
Children 0-17 Living in High-Poverty NeighborhoodsThe count is an average for 2012-16 of children living in census tracts with poverty rates of 30 percent or higher. The percent is based on the 2012-16 average population of children ages 0-17.Source: American Community Survey, Table S1701
Family Structure for Children Ages 0-17: Two-Parent Household: The number reflects the 2012-16 average of children ages 0-17 in two-parent households. The percent is based on the average population of children ages 0-17 for that period.
One-Parent Household: The number reflects the 2012-16 average of children ages 0-17 in one-parent households. The percent is based on the average population of children ages 0-17 for that period. Source: American Community Survey Table B17006
Poverty Rate for Children Ages 0-17: Two-Parent Household: The number reflects the 2012-16 average of children ages 0-17 in two-parent households whose income was below the poverty level. The percent is based on the average population of children ages 0-17 in two-parent households for that period.
One-Parent Household: The number reflects the 2012-16 average of children ages 0-17 in one-parent households whose income was below the poverty level. The percent is based on the average population of children ages 0-17 in one-parent households for that period. Source: American Community Survey, Table B17006
Children Ages 5-17 in Households Not Speaking English at HomeThe count is an average for 2012-16 of children living in households where English is not spoken. The percent is based on the 2012-16 average population of children ages 5-17.Source: American Community Survey, Table B16008
ACCESS TO HEALTHCAREChildren With Health InsuranceThe annual number and percentage estimates are based on a three-year average (2013-15) number of children ages 0-18 insured through a public or private program at any point during the year based on the Current Population Survey. Detroit data is from the Ameri-can Community Survey.Source: Small Area Health Insurance Estimates (SAHIE)
Children Ages 0-18 Insured by:Medicaid: The number reflects the enrollment in Medicaid as of December 2016. The percentage is based on the estimated popu- lation of children ages 0-18 in 2015. Source: Michigan Department of Health and Human Services, special run for December 2016
MIChild: This program provides health insurance to children ages 0-18 in families with income between 150 to 200 percent of the federal poverty level. The number reflects the enrollment in MIChild as of December 2016. The percentage is based on the estimated population of children ages 0-18 in 2015. Source: Michigan Department of Health and Human Services, special run for December 2016
Fully Immunized ToddlersThe number reflects children ages 19-35 months who had completed the vaccination 4:3:1:3:3:1:4 Series Coverage as of December 2016, according to the Michigan Care Improvement Registry (MCIR). The percentage is based on the population of children ages 19-35 months who were born to mothers residing in Michigan at the time of the birth. Source: Michigan Care Improvement Registry
Lead Poisoning in Children, Ages 1-2 Tested: The number reflects children ages 1-2 who were tested for lead in 2015. The percent is based on the number of children ages 1-2 as of July 2015. Years beyond 2015 were not available at time of publication.
Poisoned (% of tested): This number reflects children ages 1-2 whose test showed 5 or more micrograms of lead per deciliter of blood (mcg/dL), with the results confirmed by venous testing. The percent is based on the number of children ages 1-2 who were tested. Years beyond 2015 were not available at time of publication.
Source: Michigan Department of Health and Human Services, Childhood Lead Poisoning Prevention Program, 2015
2018 Kids Count in Michigan Data Book | 29

Population Estimates: Rates for non-census years are based on population estimates from the Census Bureau.
Rates: Except where noted, rates are calculated when incidents total more than five. Three years of data are used to calculate an average annual rate for most health indicators because they are less likely to be distorted than rates based on single-year numbers; this three-year averaging also allows rates to be calculated for many counties with small populations. Rates based on small numbers of events and small populations can vary dramatically and are not statistically reliable for projecting trends or understanding local impact.
Percentage Change: Change is calculated by dividing the difference between the recent and base-year rates by the base-year rate, (recent rate-base rate) / base rate. Rising rates indicate worsening conditions for children on measures in this report. Changes on some indicators, such as victims of abuse or neglect, may reflect state or local policies or staffing levels. The calculation is based on unround-ed rates; calculations using rounded rates may not produce identical results.
Rank is assigned to a county indicator based on the rounded rate of the most recent year reported or annual average. A rank of No. 1 is the “best” rate on the measure. Only counties with a rate in the most recent year are ranked on a given indicator. Ranks do not include infant mortality or child and teen deaths due to the lack of available data in many counties.
DEFINITIONS
Children Hospitalized for Asthma:This number represents Michigan hospital discharges of children ages 1-14 with asthma recorded as the primary diagnosis. The num-ber reflects the annual average and rate per 10,000 children ages 1-14 in 2015. Due to a change in hospital reporting after 2014, only 2015 is available for the state and should not be compared to prior years. Three-year averages will be available for the years 2016-2018 in 2020.Source: Michigan Department of Health and Human Services, Division of Epidemiology Services
CHILDREN WITH SPECIAL NEEDSStudents in Special EducationThe number includes all individuals ages 0 through 26 receiving special education services as of December 2016, except those in programs operated by state agencies. These students have been diagnosed with a mental or physical condition that qualified them for special education services. The percentage is based on the enrollments from the Free/Reduced Lunch data file. Source: Michigan Department of Education, Special Education Services and the Center for Educational Performance Information
Children Receiving Supplemental Security Income (SSI)The number reflects child recipients of Supplemental Security Income (SSI) as of December 2016. SSI is a Social Security Administra-tion program of cash and medical assistance for low-income elderly and individuals with disabilities, including children. The rate is per 1,000 children ages 0-17 in 2015. Source: Michigan Department of Health and Human Services, Special Run for December 2016
Children Served by Early OnThe number reflects children ages 0-2 who were enrolled in Early On in the fall of 2016. The percentage is based on the estimated population for ages 0-2 in 2015. These data are reported by Intermediate School District (ISD); 40 counties have county data, while 43 have their ISD total listed. Source: Michigan Department of Education
30 | 2018 Kids Count in Michigan Data Book

Endnotes
Introduction1. United Ways of Michigan. “2017 ALICE: Asset Limited, Income Constrained, Employed.” Accessed February 8, 2018: https://static1. squarespace.com/static/52fbd39ce4b060243dd722d8/t/58e2fc51bf629a13c2cf176d/1491270749317/16UW+ALICE+Report_MIUp date_3.24.17_Hires.pdf2. MLive. “Michigan's median income is up and poverty is down, new Census data shows.” September 14, 2017. Accessed February 8, 2018: http://www.mlive.com/news/index.ssf/2017/09/michigans_median_income_is_up.html3. First Focus. “Reducing Child Poverty in the U.S.” National Academy of Sciences, Board on Children, Youth and Families, Division of Behavioral and Social Sciences and Education, Committee on Building an Agenda to Reduce Child Poverty by Half in 10 Years. Information Gathering Session: June 20, 2017. 4. Ibid. 5. Annie E. Casey Foundation. “Race for Results: Building a Path to Opportunity for All Children.” October 2017. 6. Baldari, Cara and Rricha Mathur. “Increasing Minimum Wage is Good for Child Well-Being.” First Focus: August 31, 2017.
Economic Security1. “Brain Architecture.” Center on the Developing Child, Harvard University. Accessed January 28, 2018: https://developingchild.harvard. edu/science/key-concepts/brain-architecture/2. National KIDS COUNT Data Center. http://datacenter.kidscount.org/data/tables/5064-children-living-in-families-where-no-parent-has-full- time-year-round-employment-by-race?loc=24&loct=2#detailed/2/24/false/870,573,869,36,868/10,11,9,12,1,185,13/11486,114873. “Supplemental Poverty Measure.” U.S. Census Bureau. Accessed January 29, 2018: https://www.census.gov/topics/income-poverty/ supplemental-poverty-measure.html
Health & Safety1. Novoa, Cristina and Jamila Taylor. “Exploring African Americans’ High Maternal and Infant Death Rates.” Center for American Progress, February 1, 2018.2. Schetter, Christine Dunkel and Lynlee Tanner. “Anxiety, depression and stress in pregnancy: implications for mothers, children, research and practice.” Department of Psychology, University of California. Los Angeles, CA: March 2012.
Family & Community1. “Excessive Stress Disrupts the Architecture of the Developing Brain: Working Paper 3.” National Scientific Council on the Developing Child. 2005/2014. Updated Edition. Accessed February 6, 2018: http://www.developingchild.harvard.edu2. “Your Child: How Stress Impacts Brain Growth, Development & Behavior.” Washtenaw Trauma Informed Collaborative (WTIC) of Washtenaw County, MI. Accessed February 6, 2018: http://www.michigan.gov/documents/mdhhs/Your_Child_Brain_Growth_600973_7. pdf 3. “Key Findings and Recommendations of the Michigan Race Equity Coalition.” Michigan Race Equity Coalition on Child Welfare and Juvenile Justice. May 21, 2014: http://www.mlpp.org/wp-content/uploads/2014/05/REC-Report-FINAL.pdf4. National KIDS COUNT Data Center: http://datacenter.kidscount.org/data/tables/9709-children-who-have-experienced-two-or-more- adverse-experiences?loc=24&loct=2#detailed/2/any/false/1539/any/18961,18962
Education1. “2017 KIDS COUNT Data Book: State Trends in Child Well-Being.” The Annie E. Casey Foundation. June 13, 2017.
2018 Kids Count in Michigan Data Book | 31

Michigan League for Public Policy
1223 Turner Street, Suite G-1Lansing, MI 48906
Phone: 517.487.5436 or 800.837.5436Fax: 517.371.4546www.mlpp.org