1st year m&v report review: - lawrence berkeley...
TRANSCRIPT

APPENDICES For
Evaluation of Super ESPCPerformance Reports
September 13, 2004
Federal Energy Management Program (FEMP)
Office of Energy Efficiency and Renewable Energy
U.S. Department of Energy
Prepared by
1401 Walnut Street
Boulder, Colorado 80302
303-402-2480
www.nexant.com
This document was developed for the U.S. Department of Energy’s Federal Energy Management Program and Lawrence Berkeley National Laboratory.

TABLE OF CONTENTS FOR APPENDICES:
APPENDIX A: POST-INSTALLATION M&V REPORT REVIEWS...................................1
South Texas Veterans Health Care System..............................................................................2
Indian Health Services Aberdeen Area..................................................................................18
Department of Veterans Affairs, CT & MA...........................................................................28
DOE Nevada Operations Office............................................................................................42
NASA Ames Project 2............................................................................................................48
APPENDIX B: ANNUAL M&V REPORT REVIEWS...........................................................1
National Agricultural Library.................................................................................................2
Sherman Indian School..........................................................................................................11
NASA Ames Research Center Project 1.................................................................................21
National Gallery of Art..........................................................................................................30
INEEL Idaho Research Center..............................................................................................37
GSA Edith Green/Wendall Wyatt Federal Building..............................................................43
VA Medical Center, RI..........................................................................................................50

Appendix A: Post-Installation M&V Report Reviews
Evaluation of Super ESPC Performance Reports 2004 Appendix A - Page 1

Post-Installation M&V Report Review:
South Texas Veterans Health Care SystemSan Antonio, Texas
Report Date: May 2003
Projected Savings Period: Year 1: October 1, 2002 to September 30, 2003
ESCo: Johnson controls
Utility Providers: (electric & gas):
Documents Available:
Entire Delivery
Order
ECM Description
s
M&V Plan
DO Schedules
Technical Appendices
Post Installation
M&V Report
1st Year M&V Report
2nd Year M&V Report
Other (note)
X X X X X
Reviewer: Ed Jerome, Nexant, Inc. – [email protected]
Review Date: October 8, 2003
Revised by Mark Stetz 20 April 2004
Summary of ResultsThis review addresses Johnson Controls Post-Installation Measurement and Verification Report for the South Texas Veterans Health Care System (STVHCS).
The M&V plan does not require rigorous M&V activity as the savings of most measures are stipulated. It appears that Johnson Controls performed the M&V activities required for the post-installation phase of the M&V plan, although did not provide adequate supporting documentation to allow validation of the ECM’s potential to save energy.
Evaluation of Super ESPC Performance Reports 2004 Appendix A - Page 2

Table 1: Savings SummaryElectric Energy (kWh)
Electric Demand
(kW)
Nat. Gas Therms
Steam,Therms
WaterGallons
O&MCost
Savings
Total Cost Savings
Estimated 1,234,515
3,038 kW-yr
253 kW-mo
-464,792 595,425 13,087,570 $192,132 $754,913*
Guaranteed $682,220
Projected 1,059,624
4,746 kW-yr
395 kW-mo
-451,657 595,425 15,526,570 $192,132 $778,755*
* Values escalated by a factor of 3.453%/yr taken for four years.
Construction period savings (not shown in Table 1) increased from an estimated amount of $441,353 to $465,661. This equates to a $24,308 variance due to early completion of the projects.
Recommendations1. Savings as reported in the Post-Installation report are escalated at 3.453% for four years.
The escalation rate and period are not consistent with those outlined in Schedule DO-IV. JCI needs to explain this discrepancy.
2. Baseline utility rates are based on information from 1997 or 1998 and escalated at 3.354% thereafter. There is no single list showing either the baseline utility rates or the contracted rates during the performance period.
3. For ECMs that verify savings based on Post-Installation M&V, Johnson Controls should include an Appendix detailing the specific site data gathered, observations made, the detailed savings calculations performed, and the unit values used to derive the results.
4. For ECMs where savings are based on calculations, Johnson Controls should provide an Appendix that includes installation and commissioning documentation to validate the complete and proper installation of the measures and their potential to generate savings.
5. Cost savings for ECM 11 (Solar DHW) appear to be based on gas rates that are excessively high. JCI should document the rates or re-calculate the savings.
6. Numerous comments where noted for ECMs 5.1, 5.2, and 7.3. See comments within the specific sections of this review.
Utility RatesThe following utility rates were used to calculate projected savings in the Post-Installation M&V Report. The reviewer could not find documentation within the Final Proposal of these rates; they were calculated from the reported results.
Evaluation of Super ESPC Performance Reports 2004 Appendix A - Page 3

Facility ElectricitykWh
ElectricitykW
(summer)
ElectricitykW
(winter)
Natural Gas
Therms
Steam, Therms
Water & Sewer
kGal
San Antonio $0.031 $8.25 $6.90 $0.3554 $0.553 $2.41
Kerrville n/a n/a n/a $0.3263 n/a $1.84
Corpus Christi $0.0107 $12.92 $12.92 $0.3240
n/a n/a
Average $0.0209 $10.24 $0.3352 $0.553 $2.12
Each of the utility costs carries a 3.354% annual escalation rate. The start of the escalation period appears to be 1997 or 1998 based on the notes contained in Schedule DO-IV which states that “since the base line utility data will be over three years old at the start of the contract period, three years of escalation was applied to the rates.” It appears that the used rate was 3.453%, not 3.354% and that four years were applied, not three.
ECM #1.1: New Steam Plant – San Antonio M&V Method: GVL-D-01 (Option D)
ECM Percent of Total Cost Savings: 24%
Item Estimated Savings Projected savings
KWh/year -733,597 -733,597
KW/year -1,100 -1,100
Therms/year (Nat. Gas) -683,542 -683,542
Therms/year (purchased steam) 595,425 595,425
O&M $46,400 $46,400
Total cost savings $ $157,140 $157,140
This ECM consists of implementing:
A new steam plant to replace the VA’s dependence on purchased steam.
The savings associated with this measure are based on a calibrated building simulation model. This is in accordance with the agreed upon M&V plan.
Stack temperature and CO2 will be trended to provide boiler efficiency diagnostics. The trending is for the benefit of the VA and will not affect the performance period savings.
CommentsDocumentation to validate complete installation and commissioning were not provided as part of the Post-Installation report for review.
Evaluation of Super ESPC Performance Reports 2004 Appendix A - Page 4

ECM #1.2: New Steam Plant - Kerrville M&V Method: GVL-D-01 (Option D)
ECM Percent of Total Cost Savings: 21%
Item Estimated Savings Projected savings
KWh/year -455,407 -455,407
KW/year -26 -26
Therms/year (Nat. Gas) 53,355 53,355
O&M $139,200 $139,200
Total cost savings $ $140,166 $140,166
This ECM consists of implementing:
A new high-efficiency steam plant to replace conventional boiler systems.
The savings associated with this measure are based on a calibrated building model. This is in accordance with the agreed upon M&V plan.
Stack temperature and CO2 will be trended to provide boiler efficiency diagnostics. The trending is for the benefit of the VA and will not affect the performance period savings.
CommentsDocumentation to validate complete installation and commissioning were not provided as part of the Post-Installation report for review.
ECM #3.1: Energy Management Controls - Kerrville M&V Methods: Presumably Option A – This measure was not included in the Final Proposal.
ECM Percent of Total Cost Savings: 1%
Item Estimated Savings Projected savings
KWh/year 225,652 225,652
Therms/year 0 0
O&M 0 0
Total cost savings $ $6,192 $6,192
This ECM consists of implementing energy management system upgrades to facilitate enhanced scheduling of HVAC equipment based on actual facility operating hours.
The Post-Installation report states that savings associated with this measure are stipulated based on calculations documented in the Final Proposal. The reviewer was unable to validate this, as ECM 3.1 was not included in the Final Proposal provided for review.
Evaluation of Super ESPC Performance Reports 2004 Appendix A - Page 5

CommentsNone.
ECM #4.2: HVAC Improvements – Corpus ChristiM&V Methods: LE-A-01 (Option A)
ECM Percent of Total Cost Savings: 1%
Item Estimated Savings Projected savings
KWh/year 55,947 55,947
KW/year 48 48
Therms/year 0 0
O&M 5,077 5,077
Total cost savings $ $7,346 $7,346
This ECM consists of implementing the following:
Replacement of existing rooftop air handling unit with new similar sized units
Installation of new programmable thermostats
The savings associated with this measure are stipulated based calculations documented in the Final Proposal. This is in accordance with the agreed upon M&V plan.
ECM #5.1: Lighting Retrofit – San Antonio M&V Methods: LE-A-02 (Option A)
ECM Percent of Total Cost Savings: 6%
Item Estimated Savings Projected savings
KWh/year 711,237 759,513
KW (summer / winter) 776 / 1,552 1,340 / 2,680
Therms/year -772 -1,296
Chilled Water [MMBtu] 206 259
O&M $1,170 $1,170
Total cost savings $ $41,177 $55,166
This ECM consisted of the installation of High Efficiency lighting retrofits.
The savings associated with this measure are derived from stipulated operating hours and pre/post measurements of fixture kW. Savings will be stipulated for the term of the agreement based on post-installation M&V results. This is in accordance with the agreed upon M&V plan.
Evaluation of Super ESPC Performance Reports 2004 Appendix A - Page 6

Comments1. Detailed calculations documenting the savings were not provided for review and
validation.
2. Savings increased by 34%, although there is no mention of or justification for the variance in either Section 5.1 or the Appendix. Johnson Controls should provide a detailed accounting of changes in fixture counts and a summary explanation of the cause for the variance.
3. Note: 89% of the dollar variance is due to demand charge savings.
4. STVHCS installed lighting fixture retrofits that were proposed by Johnson Controls and documented in the Final Proposal. Johnson Controls is claiming savings for the STVHCS installed fixtures.
5. The M&V plan calls for measuring fixture power (Watts) on a sample of fixtures. The summary tables presented in the Post-Installation M&V report suggest that 36% of the fixture groups utilized standard fixture tables as the verified value. Johnson Controls should provide an explanation for the use of a standard wattage table (which is unidentified) as this deviates from the M&V plan.
ECM #5.2: Lighting Retrofit – Corpus Christi M&V Methods: LE-A-02 (Option A)
ECM Percent of Total Cost Savings: 1%
Item Estimated Savings Projected savings
KWh/year 103,076 105,561
KW/month 324 339
Therms/year -277 -180
Chilled Water [MMBtu] 0 0
O&M $285 $285
Total cost savings $ $7,416 $7,695
This ECM consisted of the installation of High Efficiency lighting retrofits.
The savings associated with this measure are derived from stipulated operating hours and pre/post measurements of fixture kW. Savings will be stipulated for the term of the agreement based on post-installation M&V results. This is in accordance with the agreed upon M&V plan.
Comments1. Detailed calculations documenting the savings were not provided for review and
validation.
2. Savings increased by 4%, although there is no mention of or justification for the variance. Johnson Controls should provide a detailed accounting of changes in fixture counts and a summary explanation of the cause for the variance.
Evaluation of Super ESPC Performance Reports 2004 Appendix A - Page 7

6. The M&V plan calls for measured fixture wattage, although the summary tables presented in the Post-Installation M&V report suggest that 36% of the fixture groups utilized standard wattage tables as the verified value. Johnson Controls should provide an explanation for the use of a standard wattage table (unidentified) as this deviates from the M&V plan.
ECM #7.1: Steam Trap Replacement - Kerrville M&V Methods: Option A
ECM Percent of Total Cost Savings: 2%
Item Estimated Savings Projected savings
KWh/year 0 0
KW/month 0 0
Therms/year 44,667 44,667
O&M 0 0
Total cost savings $ $14,575 $14,575
This ECM consists of the replacing steam traps and modifying the condensate return system.
The savings associated with this measure are based on analysis documented in the Final Proposal. This is in accordance with the agreed upon M&V plan.
CommentsThe post-installation M&V report states “…Post-Installation inspections that verified proper operation of the steam trap system…” These inspections should be summarized and presented to demonstrate that the system has the potential to save energy. In addition, sensors were installed to alert facility staff to leaking steam traps. Measurements from the system should be documented in the Post-Installation M&V report.
ECM #7.2: Chilled Water Pump VFD – San Antonio M&V Methods: GVL-D-01 (Option D)
ECM Percent of Total Cost Savings: 3%
Item Estimated Savings Projected savings
KWh/year 620,135 620,135
KW/month (summer / winter) -26 / 539 -26 / 539
Therms/year 0 0
O&M 0 0
Total cost savings $ $22,729 $22,729
Evaluation of Super ESPC Performance Reports 2004 Appendix A - Page 8

This ECM consists of converting the constant volume tertiary chilled water distribution system to a variable volume system.
The savings associated with this measure are based on a calibrated model. This is in accordance with the agreed upon M&V plan.
Comments:Commissioning documents should be provided to validate installed system performance.
ECM #7.3: Install Foot Pedal Valve – San Antonio & Kerrville M&V Methods: WCM-B-01 (Option B)
ECM Percent of Total Cost Savings: 6%
Item Estimated Savings Projected savings
KWh/year 0 0
KW/month 0 0
Therms/year 37,736 51,298
kGallons Water/year 13,087 15,526
O&M 0 0
Total cost savings $ $41,112 $47,658
This ECM consists of the installation of foot-operated valves at selected water fixtures where cycle time reductions will be significant. The installations are in both the San Antonio and Kerrville facilities.
The savings associated with this measure are based on pre/post measurements of water usage. This is in accordance with the agreed upon M&V plan. Water rates are shown in Tables 36 & 37 of the report.
Comments1. Savings for both facilities were based on measurement results in one area
within one facility. Johnson Controls should provide a detailed explanation for the validity of this action and for the validity of discarding the monitored data from the other areas. In addition, if monitored data was suspect, a valid reason for not gathering additional monitored data is required.
2. As mentioned in comment #1, Johnson Controls should address the question: Is it valid to assume the usage characteristics of a small nursing area are applicable to the entire facility and also applicable to all areas of a different facility?
Evaluation of Super ESPC Performance Reports 2004 Appendix A - Page 9

3. An increase in savings is claimed, although no mention or adjustment is made for the conditions during monitoring. The number of staff and the number of patients within the area will significantly impact the usage within the space. These should be noted and accounted for in the calculations.
4. It appears that the energy savings are calculated based on the average reduction of cold and hot water. Since the measured cold water savings are greater than the measured hot water savings, the calculated energy savings are overstated. The energy savings should be derived from the measured reduction in hot water usage only.
ECM #11.1: Solar Domestic/Heating HW – San Antonio (main) M&V Methods: REN-01 (Option B)
ECM Percent of Total Cost Savings: 2%
Item Estimated Savings Projected savings
KWh/year 0 0
KW/month 0 0
Therms/year 24,445 24,445
O&M 0 0
Total cost savings $ $15,243 $15,243
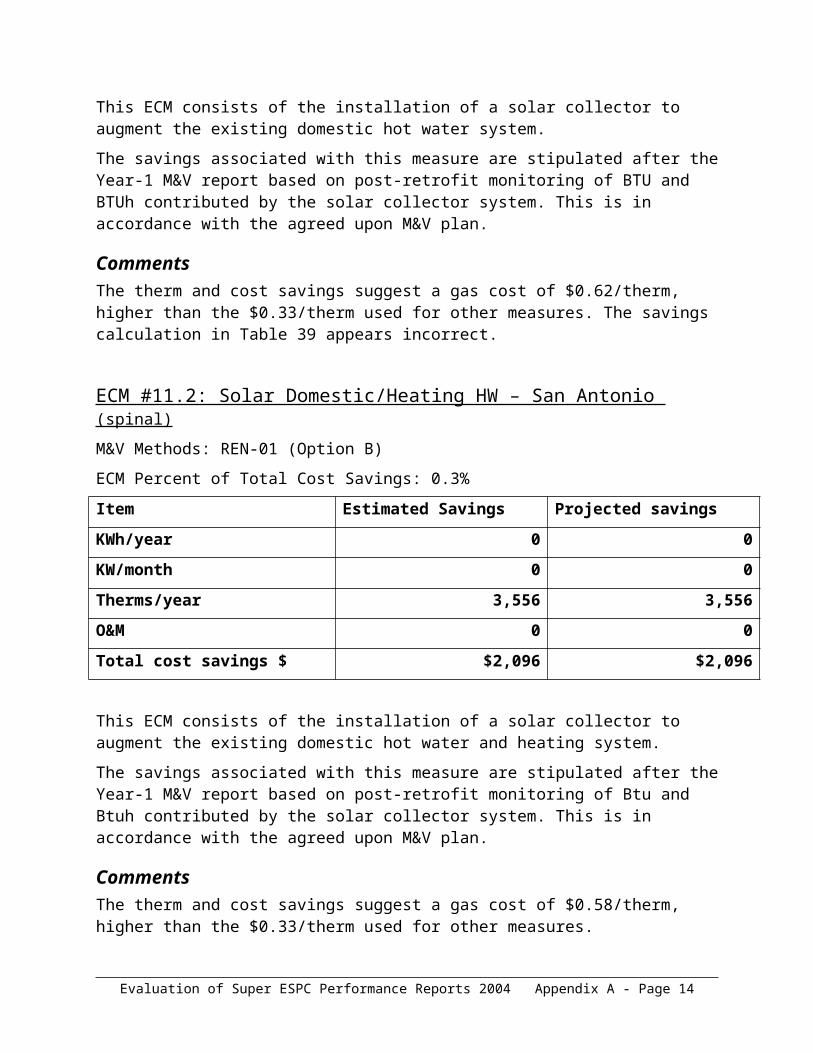
This ECM consists of the installation of a solar collector to augment the existing domestic hot water system.
The savings associated with this measure are stipulated after the Year-1 M&V report based on post-retrofit monitoring of BTU and BTUh contributed by the solar collector system. This is in accordance with the agreed upon M&V plan.
CommentsThe therm and cost savings suggest a gas cost of $0.62/therm, higher than the $0.33/therm used for other measures. The savings calculation in Table 39 appears incorrect.
ECM #11.2: Solar Domestic/Heating HW – San Antonio (spinal) M&V Methods: REN-01 (Option B)
ECM Percent of Total Cost Savings: 0.3%
Evaluation of Super ESPC Performance Reports 2004 Appendix A - Page 10

Item Estimated Savings Projected savings
KWh/year 0 0
KW/month 0 0
Therms/year 3,556 3,556
O&M 0 0
Total cost savings $ $2,096 $2,096
This ECM consists of the installation of a solar collector to augment the existing domestic hot water and heating system.
The savings associated with this measure are stipulated after the Year-1 M&V report based on post-retrofit monitoring of Btu and Btuh contributed by the solar collector system. This is in accordance with the agreed upon M&V plan.
CommentsThe therm and cost savings suggest a gas cost of $0.58/therm, higher than the $0.33/therm used for other measures.
ECM #11.4: Solar HW - Kerrville M&V Methods: REN-01 (Option B)
ECM Percent of Total Cost Savings: 3%
Item Estimated Savings Projected savings
KWh/year 0 0
KW/month 0 0
Therms/year 18,519 18,519
O&M 0 0
Total cost savings $ $16,698 $16,698
This ECM consists of the installation of a solar collector to augment the existing laundry hot water heating system.
The savings associated with this measure are stipulated after the Year-1 M&V report based on post-retrofit monitoring of BTU and BTUh contributed by the solar collector system. This is in accordance with the agreed upon M&V plan.
CommentsThe therm and cost savings suggest a gas cost of $0.91/therm, higher than the $0.33/therm used for other measures.
Evaluation of Super ESPC Performance Reports 2004 Appendix A - Page 11

ECM #14.1: Linen System VFD – San Antonio M&V Methods: LE-A-01 (Option A)
ECM Percent of Total Cost Savings: 4%
Item Estimated Savings Projected savings
KWh/year 707,472 707,472
KW/month (summer / winter) 317 / 634 317 / 634
Therms/year 0 0
O&M 0 0
Total cost savings $ $28,926 $28,926
This ECM consists of the replacement of an existing fan motor with a new, properly sized, motor and the installation of a VFD on the Trans-Vac Systems linen conveying system.
The savings associated with this measure are stipulated based on calculations documented in the Final Proposal. This is in accordance with the agreed upon M&V plan.
CommentsCommissioning documents should be provided to validate installed system performance.
ECM #15.1: Medical Waste Management – San Antonio & Kerrville M&V Methods: OM-B-01
ECM Percent of Total Cost Savings: 24%
Item Estimated Savings Projected savings
Therms/year 37,521 37,521
General Waste/year [lbs.] -67,400 -67,400
Red Bags Hauled/year [lbs.] -63,600 -63,600
Cardboard [lbs.] -148,000 -148,000
Total cost savings $ $158,244 $158,244
This ECM consists of modifying the waste management process at VAMC San Antonio and VAMC Kerrville. In addition, the medical waste incinerator at VAMC San Antonio will be decommissioned and removed.
Evaluation of Super ESPC Performance Reports 2004 Appendix A - Page 12

The savings associated with this measure will be verified on an annual basis using the results of post-retrofit monitoring and the calculation method presented in the Final Proposal. This is in accordance with the agreed upon M&V plan.
CommentsAlthough savings from “Reusable Supplies” were not explicitly stated as a parameter to be monitored in the M&V plan, the reduction in “Reusable Supplies” is being monitored and accounts for 94% of the verified savings from this measure.
Evaluation of Super ESPC Performance Reports 2004 Appendix A - Page 13

Post-Installation Project Review ChecklistDO # 57
ESCO Johnson Controls
SiteSouth Texas Veteran Health
Care System
CitySan Antonio, Kerrville and
Corpus Christi
State TX
Region Central
Agency VA
Report type Post-Install Review
M&V Report Evaluation
1. Executive Summary
1.1 Project Background N
1.2 Brief project and ECM descriptions – what was done and how savings are generated. Note any changes in project scope.
Y
1.3 Projected energy and cost savings for the first year of the performance period:
Y
1.3.1Table showing the projected savings for the total project broken out by operations & maintenance (O&M) costs, energy units, energy cost, and other savings for this period. Compare to guaranteed cost savings for total project.
Y
1.3.2 Table showing the projected savings by ECM broken out by O&M savings, energy units, energy cost, and other savings values (as applicable) for this period
Y
1.3.3 Approximate % saved by energy source type for site (optional) N
1.4 Summary of any energy and/or cost savings adjustments required. Describe the impact in changes between the Final Proposal and as-built conditions.
Y- Construction period adjustments made.
1.5 Summary of Construction Period Savings Y- In Appendix
1.6 Issues Identified Construction period savings 1) Steam plant shut down, 2) Re-usables in waste stream.
2. Details for each ECM
2.1 Overview of ECM – where implemented and how cost savings are generated Y
2.2 Installation verification Y
2.2.1 Detail any changes between Final Proposal and as-built conditions. N
2.2.2 Describe construction period savings (if applicable). Include date ECM was in effect, and reference acceptance documentation.
Y
Evaluation of Super ESPC Performance Reports 2004 Appendix A - Page 14
2.2.3 Detail savings calculations for construction period savings Y
2.4 Overview of M&V plan for ECM
2.4.1 Intent of M&V plan – what is being verified Y
2.4.2 Description of analysis and equations used for savings calculations (include or refer to specific section of contract)
N
2.4.3 Stipulated values from contract (include or refer to specific section of contract)
N
2.5 Post-installation measurements and inspections conducted per the M&V plan. (include all that apply for each one).
N
2.5.1 Measurement equipment used N
2.5.2 Equipment calibration procedures (include details or refer to specific section of contract)
N
2.5.3 Dates/times of data collection or inspection, names of personnel, and evidence of government witnessing
N
2.5.4 Details to confirm adherence to sampling plan N
2.5.5 Include all post-installation measured values. Include periods of monitoring and durations and frequency of measurements. (Use appendix and electronic format as necessary). Include description of data format (headings, units, etc.).
N
2.5.6 Energy & cost savings impact from changes between Final Proposal and as-built conditions
Y- changes to lighting & water.
2.5.7 Describe how performance criteria have been met. Y
2.5.8 Detail any performance deficiencies that need to be addressed by ESCO or Government
Y
2.5.9 Note impact of performance deficiencies or enhancements on generation of savings
N
2.6 Details of O&M Savings (if applicable) N
2.6.1 Source of savings - describe Y- Labor reduction
2.6.2 Verification activities – describe N
2.6.3 Have operations and maintenance requirements been met? unknown
2.6.4 Who is responsible for performing operations & maintenance? unknown
2.6.5 List the major maintenance items completed unknown
2.6.6 Service calls or repair/replacement activities conducted this period by ESCO
unknown
2.6.7 Deficiencies needed to be addressed by owner unknown
2.6.8 Impact of deficiencies on generation of savings unknown
2.6.9 Impact of current O&M on capacity to save unknown
2.7 Details of other savings (if applicable) n/a
2.7.1 Source of savings - describe n/a
2.7.2 Verification activities – describe n/a
Evaluation of Super ESPC Performance Reports 2004 Appendix A - Page 15

2.8 Detail commodity (e.g. energy, water, etc.) rate(s) used in calculations. Y- at ECM level only.
2.8.1 Actual commodity rate(s) at site for same period (optional). N
2.9 Technical details of all calculations made (use Appendix if necessary) N
2.9.1 Analysis Methodology – describe any data manipulation or analysis that was conducted prior to applying savings calculations
N
2.9.2 Details of any baseline or savings adjustments made N
2.9.3 Projected savings for measure Y
2.10 Other comments It appears that M&V plan was followed, but is not exactly clear. Significant savings are due to changes in waste management handling and JCI will validate the process periodically.
Evaluation of Super ESPC Performance Reports 2004 Appendix A - Page 16

Post-Installation M&V Report Review:
Indian Health Services Aberdeen AreaNorth Dakota & South Dakota
Report Date: September 2003
Projected Savings Period: October 1, 2002 to September 30, 2003
ESCo: Johnson controls
Documents Available:
Entire Delivery Order
ECM Descriptions M&V Plan DO
SchedulesTechnical
Appendices
Post Installation
M&V Report
1st Year M&V
Report
2nd Year M&V
Report
Other (note)
X X X X X
Reviewer: Ed Jerome, Nexant, Inc. – [email protected]
Review Date: September 25, 2003
Revised by Mark Stetz 16 April 2004
Summary of ResultsThe Indian Health Services Aberdeen Area and Johnson Controls entered into an Energy Savings Performance Contract with a 15-year performance period. This agreement incorporated two ECM technologies at nine Indian Health Services sites located across two states.
This review addresses Johnson Controls Post-Installation Measurement and Verification Report for the Indian Health Services Aberdeen Area.
The M&V plan accepted by HHS does not require rigorous M&V activity as the savings of all measures are stipulated. With a stipulated savings arrangement, the basis of the contractual savings relies on assumptions and the actual quantity and type of measure installed. For this reason it is extremely important that Indian Health Services validates that the equipment installed matches the specifications of the final proposal, that any changes in quantity or deviations from design are recorded, and that these changes are reflected in the savings calculations.
Although Johnson Controls has addressed most of these items in paragraph form, sufficient documentation has not been provided to demonstrate that the adjustments and calculations were performed properly.
Evaluation of Super ESPC Performance Reports 2004 Appendix A - Page 17

Table 2: Savings SummaryElectric Energy (kWh)
Electric Demand
(kW)
Natural Gas,
Therms
#2
Fuel Oil[MMBtu]
O&M Cost
Savings
Total Cost Savings
Estimated 2,832,741 588 0 10,476 $127,664 $343,785
Guaranteed $334,703
Projected 2,795,161 634 0 10,476 $129,020 $348,045
RecommendationsJohnson Controls should include an Appendix detailing the specific site data gathered, observations made, the detailed savings calculations performed, and the utility rates used to derive the results.
Utility RatesUtility rates varied by site and was presented in the Final Proposal in Appendices 3.1-3.6 and Appendix 5.1. These appendices were not available for review.
The Post-Installation report included the current energy rates where savings were adjusted. Fuel oil rates have been adjusted upwards to $0.678/therm to reflect recent price increases (but prior to the submittal of the Final Proposal of 7/16/01). These prices were incorporated into the Final Proposal Schedule DO-4. Electricity rates were provided for Belcourt, Ft. Yates, Pine Ridge, and Rosebud but not Eagle Butte and Rapid City.
$/kWh $/kW-mo $/MegBTU Oil
Belcourt $0.03784 $6.80 $6.78
Eagle Butte $6.78
Ft. Yates $0.04920 $7.50 $6.78
Pine Ridge $0.02480 $7.45 $6.78
Rapid City $6.78
Rosebud $0.03600 $7.00 $6.78
Weighted Average $0.03545 $6.67 $7.02*
* includes the price of propane at one site.
Energy escalation rates were not provided in the Post-Installation report. From Schedule DO-1, they are 2.255% for electricity, 2.656% for gas, 3.046% for oil, and 3.280% for O&M.
ECM #3.x: EMCS ImprovementsM&V Method: Option A
Evaluation of Super ESPC Performance Reports 2004 Appendix A - Page 18

ECM Percent of Total Cost Savings: 71%
Item Estimated Savings Reported savings
KWh/year 1,346,190 1,190,265
KW/year 154 154
Fuel Oil [MMBtu]/year 10,476 10,476
O&M $112,761 $112,761
Total cost savings claimed $ $242,665 $237,422
This ECM consists of implementing:
EMCS improvements consisting of HVAC controls, recommissioning, and optimization at six sites.
The savings associated with these measures are stipulated based on projected saving derived from a calibrated temperature bin model. This is in accordance with the agreed upon M&V plan.
CommentsTrends to verify optimization strategies and documentation to validate complete installation and commissioning were not provided as part of the Post-Installation report for review.
ECM 3.1: EMCS Improvements - BelcourtThe following lists deviations from the Final Proposal:
o Cooling strategies had not been implemented as of December 2002, although they will be implemented before the next cooling season.
o Schedules and unoccupied setpoints are not being maintained. These are at the discretion of the Facility Manager, but will reduce the realized savings of the facility.
CommentsThe estimated and projected savings are shown in Table 2 and Table 3. Projected O&M savings were unchanged, while the projected energy savings have been reduced to reflect the inoperable cooling strategies. Total savings were reduced by $397.
ECM 3.2: EMCS Improvements – Eagle Butte Hospital and ClinicThe following lists deviations from the Final Proposal:
o The exhaust fans were not controlled by the EMCS as of December, 2002.
Evaluation of Super ESPC Performance Reports 2004 Appendix A - Page 19

o Schedules and unoccupied setpoints are not being maintained. These are at the discretion of the Facility Manager, but will reduce the realized savings of the facility.
CommentsThe estimated and projected savings are shown in Table 2 and Table 3. Projected savings for first year performance remained unchanged.
ECM 3.3: EMCS Improvements – Fort Yates HospitalThe following lists deviations from the Final Proposal:
o Only nine exhaust fans were connected to the EMCS as of December, 2002. According the Johnson Controls, nine fans were the basis of the savings calculation. Therefore, no adjustment to savings is anticipated.
o Schedules and unoccupied setpoints are not being maintained. These are at the discretion of the Facility Manager, but will reduce the realized savings of the facility.
o Night set-back capabilities were not installed on the 11 fan coil units. According to Johnson Controls, this capability is not required. The units will be turned off during unoccupied periods. The change should not affect current or future savings.
o Cooling strategies had not been implemented as of December 2002, although will be implemented before the next cooling season.
CommentsThe estimated and projected savings are shown in Table 2 and Table 3. Projected O&M savings were unchanged, while the projected energy savings have been reduced to reflect the inoperable cooling strategies. Total savings were reduced by $441.
ECM 3.4: EMCS Improvements – Pine Ridge HospitalThe following lists deviations from the Final Proposal:
o Cooling strategies had not been implemented as of December 2002, although will be implemented before the next cooling season.
o Automated chiller sequencing had not been implemented as of December 2002, although will be implemented within the first year performance period.
o Six units targeted for optimization of outside air were not optimized. The performance year savings are expected to be adjusted.
o Schedules and unoccupied setpoints are not being maintained. These are at the discretion of the Facility Manager, but will reduce the realized savings of the facility.
Evaluation of Super ESPC Performance Reports 2004 Appendix A - Page 20

CommentsThe estimated and projected savings are shown in Table 2 and Table 3. Projected O&M savings were unchanged, while the projected energy savings have been reduced to reflect the inoperable cooling strategies and chiller sequencing. Total savings were reduced by $1,125.
ECM 3.5: EMCS Improvements – Rosebud HospitalThe following lists deviations from the Final Proposal:
o Cooling strategies had not been implemented as of December 2002, although will be implemented before the next cooling season.
o Schedules and unoccupied set-points are not being maintained. These are at the discretion of the Facility Manager, but will reduce the realized savings of the facility.
CommentsThe estimated and projected savings are shown in Table 2 and Table 3. Projected O&M savings were unchanged, while the projected energy savings have been reduced to reflect the inoperable cooling strategies. Total savings were reduced by $3,280.
ECM 3.6: EMCS Improvements – Rapid City HospitalThe following lists deviations from the Final Proposal:
o Set-back controls were not being activated for the Lakota Lodge Radiation building. Johnson Controls was investigating and may adjust first year savings if necessary.
o Maintenance unit heater schedules are not being maintained. These are at the discretion of the Facility Manager, but will reduce the realized savings of the facility.
CommentsThe estimated and projected savings are shown in Table 2 and Table 3. Projected savings for first year performance remained unchanged.
Table 2. Estimated Annual savings from Final Proposal
ECM kW kWh/yr Fuel Oil/yr O&M Total3.1 23 273,473 (1,420) 26,600$ 29,223$ 3.2 7 49,156 835 12,800$ 22,411$ 3.3 8 95,448 1,034 6,900$ 19,352$ 3.4 36 221,106 4,227 38,072$ 75,460$ 3.5 75 563,311 4,419 28,389$ 84,883$ 3.6 5 143,696 1,381 -$ 11,336$
Totals 154 1,346,190 10,476 112,761$ 242,665$
Estimated Annual Savings
Evaluation of Super ESPC Performance Reports 2004 Appendix A - Page 21

Table 3. Projected Annual Savings from based on Post-Installation M&V
ECM kW kWh/yr Fuel Oil/yr O&M Total3.1 23 262,984 (1,420) 26,600$ 28,826$ 3.2 7 49,156 835 12,800$ 22,411$ 3.3 8 86,474 1,034 6,900$ 18,911$ 3.4 36 175,759 4,227 38,072$ 74,335$ 3.5 75 472,196 4,419 28,389$ 81,603$ 3.6 5 143,696 1,381 -$ 11,336$
Totals 154 1,190,265 10,476 112,761$ 237,422$
Projected Annual Savings
ECM #5: Lighting Improvements M&V Methods: LE-A-01 (Option A)
ECM Percent of Total Cost Savings: 29%
Item Estimated Savings Reported savings
KWh/year 1,486,551 1,604,896
KW/year 434 480
Fuel Oil/year 0 0
O&M $14,903 $16,259
Total cost savings claimed $ $101,120 $110,623
These ECM’s consist of lighting improvements at nine Indian Health Services sites.
The savings associated with these measures are based on a spreadsheet calculation with stipulated operating hours, stipulated fixture wattage, and verified counts of installed fixtures. This is in accordance with the agreed upon M&V plan
CommentsThe M&V method only requires monitoring of the installation status, e.g. – the true quantity and type of fixture installed.
Adequate information was not provided for the reviewer to validate that the inventory as reported by Johnson Controls is correct and that it forms a valid basis for future year savings.
Savings calculations were not presented for validation.
The estimated and projected savings are shown in Table 4 and Table 5. Projected savings increased due to an increase in the number of fixtures installed. Similarly, there was an increase in O&M savings.
Table 4. Estimated Annual savings from Final Proposal
Evaluation of Super ESPC Performance Reports 2004 Appendix A - Page 22

5.1 53 190,899 - 2,672$ 14,184$ 5.2 35 121,700 - 1,097$ 6,086$ 5.3 35 125,041 - 1,310$ 10,574$ 5.4 92 345,487 - 3,229$ 19,979$ 5.5 84 308,879 - 3,079$ 21,223$ 5.6 56 150,151 - 1,315$ 11,593$ 5.7 19 51,406 - 522$ 5,683$ 5.8 31 103,119 - 853$ 6,061$ 5.9 29 89,869 - 826$ 5,737$
Totals 434 1,486,551 - 14,903$ 101,120$
Estimated Annual Savings
Table 5. Projected Annual Savings from on Post-Installation M&V
5.1 57 206,330 - 2,836$ 15,247$ 5.2 36 126,721 - 1,012$ 6,205$ 5.3 37 135,193 - 1,409$ 11,381$ 5.4 103 360,653 - 3,564$ 21,675$ 5.5 89 326,562 - 3,319$ 22,535$ 5.6 69 173,657 - 1,557$ 13,744$ 5.7 22 61,380 - 609$ 6,695$ 5.8 30 95,832 - 770$ 5,642$ 5.9 37 118,568 - 1,183$ 7,499$
Totals 480 1,604,896 - 16,259$ 110,623$
Projected Annual Savings
Evaluation of Super ESPC Performance Reports 2004 Appendix A - Page 23

Post-Installation Project Review ChecklistsDO # 58
ESCO Johnson Controls
Site Indian Health Services
City Aberdeen
State SD
Region Central
Agency HHS
Report type Post-Install Review
M&V Report Evaluation
1. Executive Summary
1.1 Project Background N
1.2 Brief project and ECM descriptions – what was done and how savings are generated. Note any changes in project scope.
Y
1.3 Projected energy and cost savings for the first year of the performance period:
Y
1.3.1Table showing the projected savings for the total project broken out by operations & maintenance (O&M) costs, energy units, energy cost, and other savings for this period. Compare to guaranteed cost savings for total project.
Y
1.3.2 Table showing the projected savings by ECM broken out by O&M savings, energy units, energy cost, and other savings values (as applicable) for this period
Y
1.3.3 Approximate % saved by energy source type for site (optional) N
1.4 Summary of any energy and/or cost savings adjustments required. Describe the impact in changes between the Final Proposal and as-built conditions.
Y- Adjustments made to reflect that EMCS measure not fully
commissioned.
1.5 Summary of Construction Period Savings Y
1.6 Issues Identified EMCS not fully commissioned, setpoints not being maintained.
2. Details for each ECM
2.1 Overview of ECM – where implemented and how cost savings are generated Y
2.2 Installation verification Y
2.2.1 Detail any changes between Final Proposal and as-built conditions. Y
2.2.2 Describe construction period savings (if applicable). Include date ECM was in effect, and reference acceptance documentation.
Y
2.2.3 Detail savings calculations for construction period savings Y
Evaluation of Super ESPC Performance Reports 2004 Appendix A - Page 24

2.4 Overview of M&V plan for ECM
2.4.1 Intent of M&V plan – what is being verified N
2.4.2 Description of analysis and equations used for savings calculations (include or refer to specific section of contract)
N
2.4.3 Stipulated values from contract (include or refer to specific section of contract)
N
2.5 Post-installation measurements and inspections conducted per the M&V plan. (include all that apply for each one).
N
2.5.1 Measurement equipment used N
2.5.2 Equipment calibration procedures (include details or refer to specific section of contract)
N
2.5.3 Dates/times of data collection or inspection, names of personnel, and evidence of government witnessing
N
2.5.4 Details to confirm adherence to sampling plan N
2.5.5 Include all post-installation measured values. Include periods of monitoring and durations and frequency of measurements. (Use appendix and electronic format as necessary). Include description of data format (headings, units, etc.).
N
2.5.6 Energy & cost savings impact from changes between Final Proposal and as-built conditions
Y
2.5.7 Describe how performance criteria have been met. N
2.5.8 Detail any performance deficiencies that need to be addressed by ESCO or Government
Y- only where deviations exist.
2.5.9 Note impact of performance deficiencies or enhancements on generation of savings
Y
2.6 Details of O&M Savings (if applicable) N
2.6.1 Source of savings - describe Y- Lighting service contractor being eliminated.
2.6.2 Verification activities – describe N
2.6.3 Have operations and maintenance requirements been met? N- HIS is responsible for maintaining temperature schedules and setpoints, which they are not doing.
2.6.4 Who is responsible for performing operations & maintenance? IHS
2.6.5 List the major maintenance items completed Unknown
2.6.6 Service calls or repair/replacement activities conducted this period by ESCO
Commissioning cooling strategies.
2.6.7 Deficiencies needed to be addressed by owner Temperature setpoints and schedules.
2.6.8 Impact of deficiencies on generation of savings Y- Failure to achieve stipulated savings.
2.6.9 Impact of current O&M on capacity to save N
Evaluation of Super ESPC Performance Reports 2004 Appendix A - Page 25

2.7 Details of other savings (if applicable) n/a
2.7.1 Source of savings - describe n/a
2.7.2 Verification activities – describe n/a
2.8 Detail commodity (e.g. energy, water, etc.) rate(s) used in calculations. Y
2.8.1 Actual commodity rate(s) at site for same period (optional). N
2.9 Technical details of all calculations made (use Appendix if necessary) N
2.9.1 Analysis Methodology – describe any data manipulation or analysis that was conducted prior to applying savings calculations
Y- Adjust O&M for lighting quantity.
2.9.2 Details of any baseline or savings adjustments made Y- Savings adjusted for lack of cooling strategies.
2.9.3 Projected savings for measure Y
2.10 Other comments Significant reliance on stipulations (bin-hour models). IHS not maintaining setpoints and schedules on which savings are based.
Evaluation of Super ESPC Performance Reports 2004 Appendix A - Page 26

Post Installation M&V Report Review:
Department of Veterans Affairs, CT & MAWest Haven and Newington Campus
Report Date: September 2003
Performance Period Covered: Installation
ESCo: Select Energy (Formerly HEC)
Documents Available:
Entire Delivery Order
ECM Descriptions M&V Plan DO
SchedulesTechnical
Appendices
Post Installation
M&V Report
1st Year M&V
Report
2nd Year M&V
Report
Other (note)
X X X X X
Reviewer: Kurt Nemer, Nexant, Inc. – [email protected]
Review Date: October 8, 2003
Revised by Mark Stetz 16 March 2004
Summary of ResultsThis review addresses the post-installation report for the energy conservation work performed at the Newington and West Haven Veteran’s Medical facilities. This Phase 1 report compares the proposed and as-built energy savings for some- but not all- of the installed measures. The project was split into two phases in order to take credit for the completed measures. Therefore, the reported savings are less than the guaranteed savings. This does not represent a savings shortfall but an incomplete project.
Table 3: Savings SummaryElectric Energy
(kWh)Electric Demand
(kW)MMBTU Operations &
Maintenance Cost Savings
Total Cost Savings
Estimated 1,504,342 307 65,331 $52,879 $550,128
Guaranteed $751,501
Reported 1,537,016 21 80,734 $52,034 $593,810
Evaluation of Super ESPC Performance Reports 2004 Appendix A - Page 27

General RecommendationsThis project does not cover all of the measures originally proposed, only the ones completed to date. In general, the savings calculations and assumptions are detailed and documented, although finding the relevant information may be challenging.
Option A is used exclusively for all measures. Typically, baseline and post-retrofit measurements were made to validate the performance of an installed measure. Adjustments were made to the estimated savings to reflect measured performance when it differed from assumed values. For measures where the savings were based exclusively on calculations (e.g. steam line insulation), the method, assumptions, and differences from estimated conditions were documented.
Future M&V activities will primarily consist of visual inspection to verify proper operation. Steam traps will be tested in situ, sampling 20% every year so that all traps will be tested every five years.
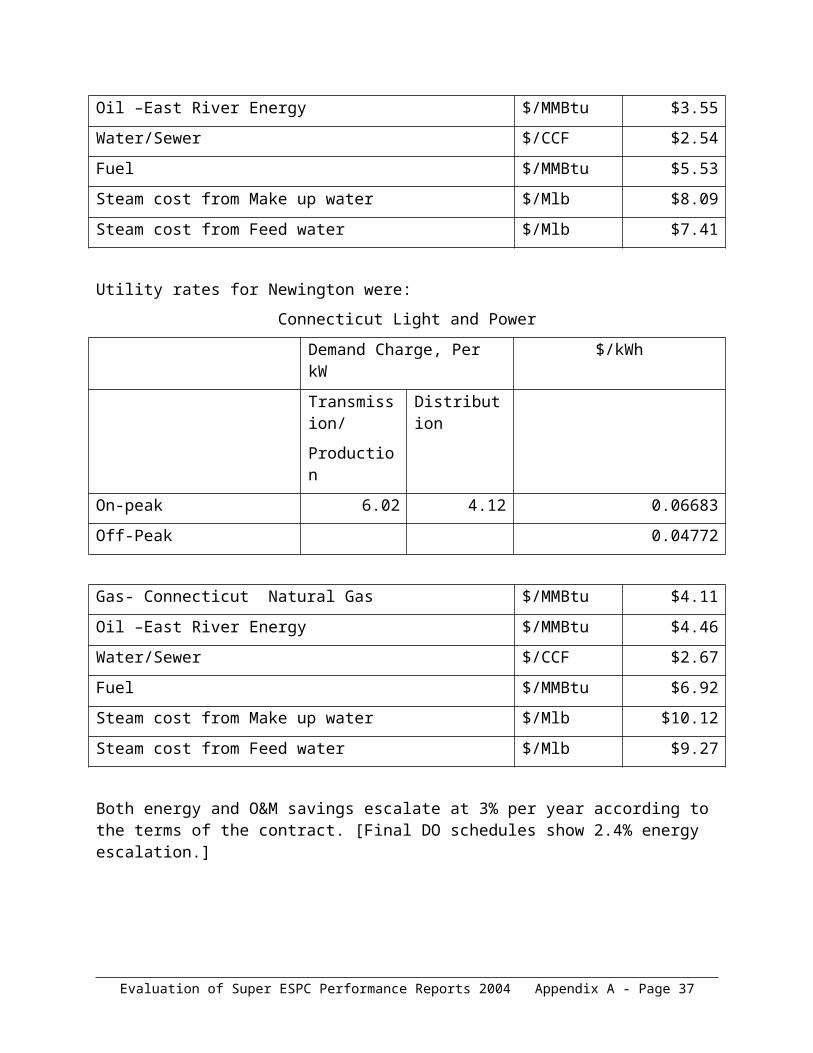
Utility RatesThe utility rates used in the proposal were for West Haven:
United Illuminating Co.
Demand Charge, $/kW $/kWh
Summer Winter Summer Winter
On-peak 18.00 14.00 0.0890 0.0750
Shoulder Excess 9.50 7.50 0.0710 0.0599
Off-Peak Excess 4.00 4.00 0.0446 0.0446
Gas-Southern Connecticut Gas $/MMBtu $3.28
Oil –East River Energy $/MMBtu $3.55
Water/Sewer $/CCF $2.54
Fuel $/MMBtu $5.53
Steam cost from Make up water $/Mlb $8.09
Steam cost from Feed water $/Mlb $7.41
Utility rates for Newington were:
Connecticut Light and Power
Evaluation of Super ESPC Performance Reports 2004 Appendix A - Page 28

Demand Charge, Per kW $/kWh
Transmission/
Production
Distribution
On-peak 6.02 4.12 0.06683
Off-Peak 0.04772
Gas- Connecticut Natural Gas $/MMBtu $4.11
Oil –East River Energy $/MMBtu $4.46
Water/Sewer $/CCF $2.67
Fuel $/MMBtu $6.92
Steam cost from Make up water $/Mlb $10.12
Steam cost from Feed water $/Mlb $9.27
Both energy and O&M savings escalate at 3% per year according to the terms of the contract. [Final DO schedules show 2.4% energy escalation.]
ECM WH-1 West Haven Building 35 AHU Fan ModificationM&V Methods: A
ECM Percent of Total Cost Savings: 3.08%
Item Projected Savings Reported Savings
KWh/year 246,664 216,849
MMBtu/year -1,804 -1,804
Total cost savings $ $20,008 $18,291
O & M savings, $ $0 $0
Total Savings, $ $20,008 $18,291
This ECM consists of reducing heating costs by replacing heat-pump roof top HVAC units with gas fired rooftop units. This measure originally included installation of variable frequency drives on two air handling units but during the design phase it was discovered that the air handler’s discharge flow could not be reduced further and the VFDs were deleted. Funds for the VFDs were used to purchase additional occupancy sensors under measure NE-3.
CommentsEnergy savings associated with this measure were stipulated based on bin weather data and assuming that the roof top unit switched from heat pump to resistance heat mode at 40 degrees. The M&V approach for this measure consists of inspected and verifying that the correct
Evaluation of Super ESPC Performance Reports 2004 Appendix A - Page 29

equipment has been installed. No measurements were required by the accepted M&V plan. The variations reported are attributable to the deletion of the VFDs.
ECM EWH-2 West Haven Building. 24 Water Heaters: M&V Methods: A
ECM Percent of Total Cost Savings: 0.51%
Item Projected Savings Reported Savings
KWh/year -56 -3,937
MMBtu/year 602 602
O & M savings, $ 0 0
Total cost savings $ $3,321 $3,011
This measure consists of replacing a steam heated hot water system with a smaller electrically heated system. The steam-heated system had been sized for a laundry operation that has since been outsourced and hot water needs are now minimal in this building.
CommentsEnergy savings for this measure were based on estimated heat loss from the hot water tanks and piping, and the estimated usage for the remaining occupants of the building.
The electrical use for the new water heater was underestimated in the original proposal. This appears related to an error in the original savings equation1, which is also shown on page 4-11 of the Post-Installation report. The savings are correctly calculated in Appendix B.
The M&V approach for this measure consists of inspected and verifying that the correct equipment has been installed. No measurements were required by the accepted M&V plan.
ECM WH-3: West Haven- Energy Efficient Motors M&V Methods: A
ECM Percent of Total Cost Savings: 0.22 %
Item Projected Savings Reported Savings
KWh/year 24,453 15,832
kW 5 3.4
O & M savings $0 $0
Total Savings $ $1,929 $1,300
1 Gallons were divided by 8.33 lb/g instead of multiplied.
Evaluation of Super ESPC Performance Reports 2004 Appendix A - Page 30

This ECM consists of replacing standard efficiency electric motors with premium efficiency electric motors. The as-built energy savings for this measure are less than the proposed. Four of the ten motors proposed for retrofit were not changed since they were either unsuitable or were part of equipment slated for replacement.
CommentsEnergy savings for this measure were calculated using measured kW for the base case motors and stipulated hours. The stipulated operating hours for each motor are listed on page 4-16. Detailed savings calculations are presented in Appendix C.
The long-term M&V approach for this measure consists of verifying that the equipment is operating as designed and thus delivering the projected savings.
ECM WH-4: West Haven Lighting Retrofits M&V Methods: A
ECM Percent of Total Cost Savings: 8.85%
Item Projected Savings Reported Savings
KWh/year 892,574 807,479
kW 14.0 8.1
Therms/year -282 -255
O & M savings $106 $3,186
Total cost savings $ $55,860 $52,537
This ECM consists of retrofitting light fixtures with electronic ballasts and T8 lamps, and installation of occupancy sensors. Fewer than expected standard fixtures were found during installation, which reduced the savings available from this measure. Also, patient areas were not retrofit with occupancy sensors, which also reduced savings. The changes to savings are adequately documented.
CommentsSavings were calculated by using manufacturer’s specifications input wattages for the base case and post-installation fixture. Operating hours were estimated by monitoring a sample of fixture with data loggers. Eleven usage groups were defined, with 6 of the groups actually sampled for operating hours. The other groups used estimates and comparisons to similar sites.
The M&V approach for this measure consists of verifying that the equipment is operating as designed and thus delivering the projected savings.
Evaluation of Super ESPC Performance Reports 2004 Appendix A - Page 31

The increase in O&M savings reported is a one-time savings attributable to the value of spare ballasts, lamps and occupancy sensors left with the VA to handle premature failures.
ECM: WH-5 Steam System ImprovementsM&V Methods: A
ECM Percent of Total Cost Savings: 61.6%
Item Projected Savings Reported Savings
MMBtu/year 51,034 62,207
O & M savings $19,084 $21,784
Total cost savings $ $301,304 $365,790
This measure consists of reducing losses in the steam heating system at West Haven. It includes replacement of steam traps, reducing heat loss on piping through additional insulation and installation of control valves on unit heaters and other steam system modifications.
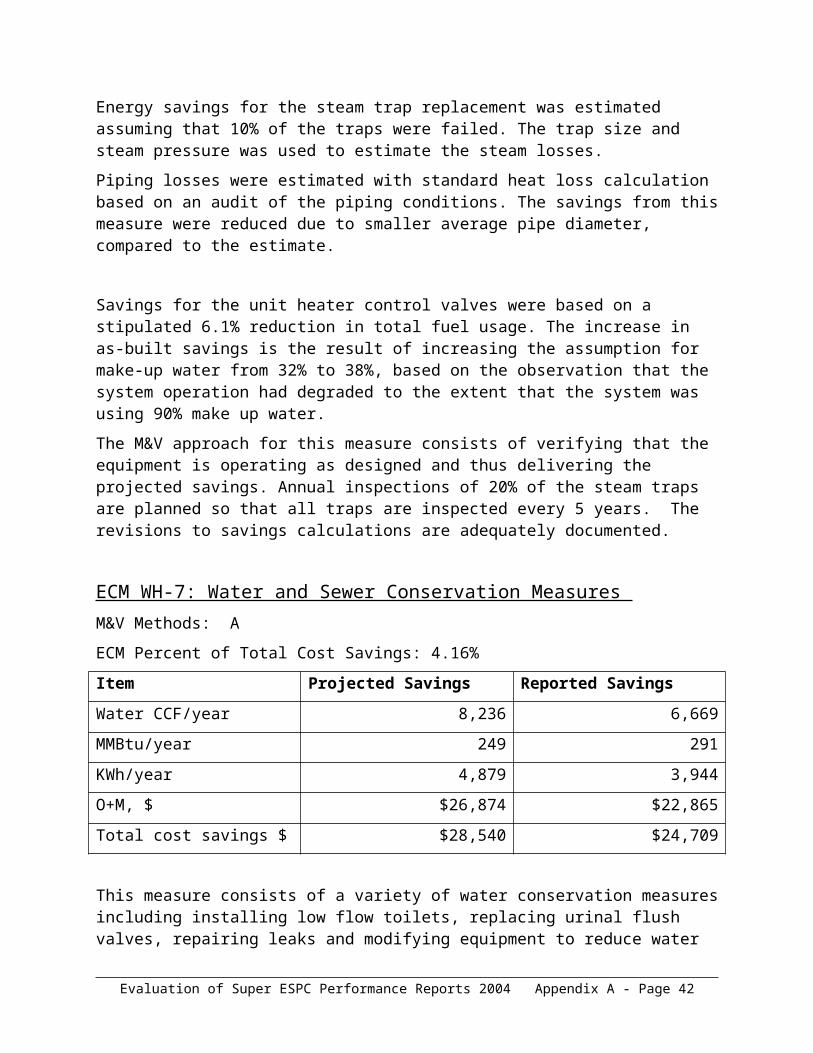
CommentsEnergy savings for the steam trap replacement was estimated assuming that 10% of the traps were failed. The trap size and steam pressure was used to estimate the steam losses.
Piping losses were estimated with standard heat loss calculation based on an audit of the piping conditions. The savings from this measure were reduced due to smaller average pipe diameter, compared to the estimate.
Savings for the unit heater control valves were based on a stipulated 6.1% reduction in total fuel usage. The increase in as-built savings is the result of increasing the assumption for make-up water from 32% to 38%, based on the observation that the system operation had degraded to the extent that the system was using 90% make up water.
The M&V approach for this measure consists of verifying that the equipment is operating as designed and thus delivering the projected savings. Annual inspections of 20% of the steam traps are planned so that all traps are inspected every 5 years. The revisions to savings calculations are adequately documented.
Evaluation of Super ESPC Performance Reports 2004 Appendix A - Page 32

ECM WH-7: Water and Sewer Conservation Measures M&V Methods: A
ECM Percent of Total Cost Savings: 4.16%
Item Projected Savings Reported Savings
Water CCF/year 8,236 6,669
MMBtu/year 249 291
KWh/year 4,879 3,944
O+M, $ $26,874 $22,865
Total cost savings $ $28,540 $24,709
This measure consists of a variety of water conservation measures including installing low flow toilets, replacing urinal flush valves, repairing leaks and modifying equipment to reduce water usage. Sewer charges were reduced by metering the cooling tower water and excluding this flow from sewer charges, since it doesn’t return to the sewer system for treatment.
Savings also were claimed for reduced water pumping energy and demand, as well as reduced water heating energy requirements for hot water flow reductions.
CommentsThe water savings were based primarily on actual flow measurements made before and after installation and stipulated usage data. These measurements were made with ultrasonic flow meters.
The variations in projected and as-built reported values are due to reducing the number of toilet replacements by 70. The increase in water heating energy savings is attributable to the difference between the originally estimated and the measured baseline values.
ECM NE-2: Newington Lighting Retrofits M&V Methods: A
ECM Percent of Total Cost Savings: 2.73%
Item Projected Savings Reported Savings
KWh/year 345,380 272,520
kW 288 0
Therms/year -414 -326
O & M savings $211 $1,915
Total cost savings $ $20,983 $16,218
Evaluation of Super ESPC Performance Reports 2004 Appendix A - Page 33

This ECM consists of installation of occupancy sensors. None of the fixture retrofits were performed and the as-built energy savings reflects this reduction in savings. Some additional occupancy sensors were installed and the savings shown reflect this.
CommentsSavings were calculated by using generally accepted input wattages for the base case and post-installation fixture. Operating hours were estimated by monitoring a sample of fixture with data loggers. Eleven usage groups were defined, with 3 of the groups actually sampled for operating hours. The sampled size was stated as “1.65 % of the affected connected lighting demand”.
The M&V approach for this measure consists of verifying that the equipment is operating as designed and thus delivering the projected savings.
The increase in O&M savings reported is a one-time savings attributable to the value of spare occupancy sensors left with the VA to handle premature failures.
ECM NE-3: Newington Steam System ImprovementsM&V Methods: A
ECM Percent of Total Cost Savings: 17.68%
Item Projected Savings Reported Savings
MMBtu/year 15,421 14,371
O & M savings $5,458 $5,589
Total cost savings $ $112,157 $105,015
This measure consists of improvements to the steam heating system at Newington. It includes replacement of steam traps, reducing heat loss on piping through additional insulation, installation of zone control valves and thermostatic radiator valves. This measure also included repairs to steam leaks and other miscellaneous steam system improvements.
CommentsEnergy savings for the steam trap replacement was estimated assuming that 10% of the traps were failed. The trap size and steam pressure was used to estimate the steam losses.
Piping losses were estimated with standard heat loss calculation based on an audit of the piping conditions. Savings from this measure increased by 1,106 MMBtu/year due to an increase in the amount of pipe insulated.
The as-built savings reported is 1,050 MMBtu less than the proposed figure. This was related to changes in the scope of work, including the removal of 27 unit heater modifications and adding more pipe insulation than originally estimated.
Evaluation of Super ESPC Performance Reports 2004 Appendix A - Page 34

The M&V approach for this measure consists of verifying that the equipment is operating as designed and thus delivering the projected savings. Annual inspections of 20% of the steam traps are planned so that all traps are inspected every 5 years. The revisions to savings calculations are adequately documented.
ECM NE-4: Water and Sewer Conservation Measures M&V Methods: A
ECM Percent of Total Cost Savings: 0.30%
Item Projected Savings Reported Savings
Water CCF/year 0 125
Water cost savings 0 $334
O+M, $ $1,462 $1,462
Total cost savings $ $1,462 $1,796
This measure consists of reducing sewer charges were by sub-metering the cooling tower make-up water and excluding this flow from sewer charges. Water savings were based on boiler make-up water records and a stipulated blowdown rate of 10%.
CommentsThe additional water savings reported in the as-built savings resulted from modifying sterilizers for reduced water usage.
ECM NE-5: Newington Energy Efficient Motors M&V Methods: A
ECM Percent of Total Cost Savings: 0.07 %
Item Projected Savings Reported Savings
KWh/year 2,385 4,718
kW 0.41 1.1
O & M savings 0 0
Total Savings $ $180 $393
This ECM consists of replacing standard efficiency electric motors with premium efficiency electric motors. Energy savings for this measure were calculated using measured kW for the base case motors and stipulated hours.
Comments
Evaluation of Super ESPC Performance Reports 2004 Appendix A - Page 35

The as-built savings for this motor was calculated based on pre and post-installation power measurements. The power measurements show a reduction in kW much greater than can be attributed to motor replacement alone and suggest that the load on the motor was less during the post-installation measurement. Because the motor drives a fan, it is possible that a smaller drive pulley was installed during the motor replacement and the fan is running at a lower speed, thus lowering the required mechanical load.
Demand reduction attributed to this measure is listed as 13.2 kW/ months, which is inconsistent with other tables in the report and not a generally recognized measurement. The demand reduction should have been listed as 1.1 kW.
ECM NE-6: Newington Hot Water Pump Control M&V Methods: A
ECM Percent of Total Cost Savings: 0.10%
Item Projected Savings Reported Savings
KWh/year 2,481 9,798
kW 0 0
O & M savings
Total Savings $ $159 $608
CommentsThis measure as proposed would have added timer controls to a hot water circulating pump that operating continuously. Changes to the heating system allowed for the elimination of the circulating pump and the increased savings are reported.
ECM NE-7: Air Handler replacement for Building 1 and 2M&V Methods: A
ECM Percent of Total Cost Savings: 0.7%
Item Projected Savings Reported Savings
KWh/year 10,035 8,796
MMBtu/year 525 525
Total cost savings $ $4,225 $4,142
O & M savings, $ $0 $0
Total Savings, $ $4,225 $4,142
Evaluation of Super ESPC Performance Reports 2004 Appendix A - Page 36

This measure consists of replacing two oversized air-handling units and replacing outdated pneumatic controls. The new air-handling units will be connected to the existing building control unit.
CommentsEnergy savings associated with this measure were estimated based on bin weather data, stipulated setpoints and unit efficiency.
The M&V approach for this measure consists of inspected and verifying that the correct equipment has been installed. No measurements were required by the accepted M&V plan.
Evaluation of Super ESPC Performance Reports 2004 Appendix A - Page 37
Post-Installation Project Review ChecklistsDO # 61
ESCO Select Energy Services
Site VA Medical Centers
CityNewington and West Haven,
Northampton
State CT, MA
Region Northeast
Agency VA
Report type Post-Install Review
M&V Report Evaluation
1. Executive Summary
1.1 Project Background Y
1.2 Brief project and ECM descriptions – what was done and how savings are generated. Note any changes in project scope.
Y- but weak
1.3 Projected energy and cost savings for the first year of the performance period:
Y
1.3.1Table showing the projected savings for the total project broken out by operations & maintenance (O&M) costs, energy units, energy cost, and other savings for this period. Compare to guaranteed cost savings for total project.
N- Guaranteed savings not mentioned.
1.3.2 Table showing the projected savings by ECM broken out by O&M savings, energy units, energy cost, and other savings values (as applicable) for this period
Y
1.3.3 Approximate % saved by energy source type for site (optional) N
1.4 Summary of any energy and/or cost savings adjustments required. Describe the impact in changes between the Final Proposal and as-built conditions.
Y- Adjustments made to reflect that project is incomplete.
1.5 Summary of Construction Period Savings N
1.6 Issues Identified Utility incentives available significantly less than anticipated due to CT state budget cuts.
2. Details for each ECM
2.1 Overview of ECM – where implemented and how cost savings are generated Y
2.2 Installation verification Y
2.2.1 Detail any changes between Final Proposal and as-built conditions. Y- Not all ECMs complete.
2.2.2 Describe construction period savings (if applicable). Include date ECM was in effect, and reference acceptance documentation.
N
Evaluation of Super ESPC Performance Reports 2004 Appendix A - Page 38

2.2.3 Detail savings calculations for construction period savings N
2.4 Overview of M&V plan for ECM
2.4.1 Intent of M&V plan – what is being verified N
2.4.2 Description of analysis and equations used for savings calculations (include or refer to specific section of contract)
N
2.4.3 Stipulated values from contract (include or refer to specific section of contract)
Y
2.5 Post-installation measurements and inspections conducted per the M&V plan. (include all that apply for each one).
Y
2.5.1 Measurement equipment used N
2.5.2 Equipment calibration procedures (include details or refer to specific section of contract)
N
2.5.3 Dates/times of data collection or inspection, names of personnel, and evidence of government witnessing
N
2.5.4 Details to confirm adherence to sampling plan N
2.5.5 Include all post-installation measured values. Include periods of monitoring and durations and frequency of measurements. (Use appendix and electronic format as necessary). Include description of data format (headings, units, etc.).
N
2.5.6 Energy & cost savings impact from changes between Final Proposal and as-built conditions
Y
2.5.7 Describe how performance criteria have been met. Y
2.5.8 Detail any performance deficiencies that need to be addressed by ESCO or Government
Y
2.5.9 Note impact of performance deficiencies or enhancements on generation of savings
Y
2.6 Details of O&M Savings (if applicable) N
2.6.1 Source of savings - describe N
2.6.2 Verification activities – describe N
2.6.3 Have operations and maintenance requirements been met? unknown
2.6.4 Who is responsible for performing operations & maintenance? unknown
2.6.5 List the major maintenance items completed unknown
2.6.6 Service calls or repair/replacement activities conducted this period by ESCO
unknown
2.6.7 Deficiencies needed to be addressed by owner unknown
2.6.8 Impact of deficiencies on generation of savings unknown
2.6.9 Impact of current O&M on capacity to save unknown
2.7 Details of other savings (if applicable) n/a
2.7.1 Source of savings - describe n/a
2.7.2 Verification activities – describe n/a
Evaluation of Super ESPC Performance Reports 2004 Appendix A - Page 39

2.8 Detail commodity (e.g. energy, water, etc.) rate(s) used in calculations. Y
2.8.1 Actual commodity rate(s) at site for same period (optional). N
2.9 Technical details of all calculations made (use Appendix if necessary) Y
2.9.1 Analysis Methodology – describe any data manipulation or analysis that was conducted prior to applying savings calculations
N
2.9.2 Details of any baseline or savings adjustments made N
2.9.3 Projected savings for measure Y
2.10 Other comments This is an interim report that covers some (but not all) of the measures installed (or to be installed). There are also problems following project and savings changes, the use of questionable assumptions, and significant emphasis on stipulations.
Evaluation of Super ESPC Performance Reports 2004 Appendix A - Page 40

Post-Installation M&V Report Review:
DOE Nevada Operations OfficeLas Vegas, NevadaReport Date: July, 2002
Projected Savings Period: Year 1: June 1, 2002 to May 31, 2003
ESCo: Johnson controls
Documents Available:
Entire Delivery Order
ECM Descriptions M&V Plan DO
SchedulesTechnical
Appendices
Post Installation
M&V Report
1st Year M&V
Report
2nd Year M&V
Report
Other (note)
X X X X X
Reviewer: Ed Jerome, Nexant, Inc. – [email protected]
Review Date: October 8, 20036 April 2004
Revised 6 April 04 Mark Stetz
Summary of ResultsThis review addresses Johnson Controls Post-Installation Measurement and Verification Report for the DOE Nevada Operations Office.
The accepted M&V plan relies heavily on stipulated values. It appears that Johnson Controls followed the M&V plan for the post-installation phase but supporting documentation was insufficient to independently to trace or validate the claimed savings.
Table 4: Savings SummaryElectric Energy (kWh)
Electric Demand (kW)
Nat. Gas Therms
O&MCost Savings
Total Cost Savings
Estimated 1,659,6255,604 kW-yr
467 kW-mo0 $14,684 $144,465
Guaranteed $14,684 $134,342
Projected 1,554,049*5,232 kW-yr*
436 kW-mo0 $14,684 $143,676
* Estimated by reviewer.
Construction period savings (not shown in Table 1) were stated as stipulated at the guaranteed value of $42,256. No mention of the installation date was made in the Post-Installation report.
Evaluation of Super ESPC Performance Reports 2004 Appendix A - Page 41

RecommendationsSee comments under ECM 5
Utility RatesThe energy savings calculations were not provided for review; therefore, the following rates could not be verified as properly applied.
Summer Non-Summer
Peak Off-Peak All
Energy, $/kWh $0.07853 $0.06103 $0.05982
Demand, $/kW $8.87 $1.35 $1.08
Each of the utility costs is escalated annually based on a schedule documented in the Final Proposal. Energy rates escalate at ‘NIST values’ but were not provided; O&M savings escalate at 2.7%.
ECM #5: Lighting Retrofit M&V Methods: LE-A-02 (Option A)
ECM Percent of Total Cost Savings: 100%
Item Estimated Savings Reported Savings
KW-year
kW-mo
5,604
467
5,232*
436
KWh/year 1,659,625 1,554,049*
Therms/year 0 0
O&M $14,684 $14,684
Total cost savings $ $144,465 $143,676* Calculated by the reviewer. Not provided by Johnson Controls.
This ECM consists of energy efficient lighting fixture retrofits, improved general quality of lighting, and reduced lighting system maintenance costs.
The savings associated with this measure are based on stipulated hours of operation and measured post installation fixture Wattage. This follows the accepted M&V plan.
Four operating schedules are listed in the M&V report (OF, OB, 24, ES) but it is not clear how these schedules are applied to the lighting inventory and the TOU rate structure.
The names of government witnesses were provided but not the measurement dates.
Comments
Evaluation of Super ESPC Performance Reports 2004 Appendix A - Page 42
Detailed calculations documenting the savings were noted as attached in Appendix B, but were not included for review and validation. Therefore, it is unclear how the deviations in installed quantities are accounted for in the final calculations and how the TOU utility rates are applied.
Installation sign-off sheets should be included to validate complete fixture installation.
Construction period savings are based on the installation of components by a certain date. Johnson Controls should provide the date of completed installation and provide an assurance that the construction period savings were realized.
Evaluation of Super ESPC Performance Reports 2004 Appendix A - Page 43

Post-Installation Project Review ChecklistsDO # 74
ESCO Johnson Controls
Site NNSA/NV Facilities
City Las Vegas
State NV
Region Western
Agency DOE
Report type Post-Install Review
M&V Report Evaluation
1. Executive Summary
1.1 Project Background N
1.2 Brief project and ECM descriptions – what was done and how savings are generated. Note any changes in project scope.
Y
1.3 Projected energy and cost savings for the first year of the performance period:
Y- costs only
1.3.1Table showing the projected savings for the total project broken out by operations & maintenance (O&M) costs, energy units, energy cost, and other savings for this period. Compare to guaranteed cost savings for total project.
Y- costs only
1.3.2 Table showing the projected savings by ECM broken out by O&M savings, energy units, energy cost, and other savings values (as applicable) for this period
Y- costs only
1.3.3 Approximate % saved by energy source type for site (optional) N
1.4 Summary of any energy and/or cost savings adjustments required. Describe the impact in changes between the Final Proposal and as-built conditions.
N
1.5 Summary of Construction Period Savings Y
1.6 Issues Identified N
2. Details for each ECM
2.1 Overview of ECM – where implemented and how cost savings are generated Y
2.2 Installation verification Y
2.2.1 Detail any changes between Final Proposal and as-built conditions. Y- Fixture count changes.
2.2.2 Describe construction period savings (if applicable). Include date ECM was in effect, and reference acceptance documentation.
Y
2.2.3 Detail savings calculations for construction period savings N- stipulated value
2.4 Overview of M&V plan for ECM
2.4.1 Intent of M&V plan – what is being verified Y
Evaluation of Super ESPC Performance Reports 2004 Appendix A - Page 44

2.4.2 Description of analysis and equations used for savings calculations (include or refer to specific section of contract)
N
2.4.3 Stipulated values from contract (include or refer to specific section of contract)
Y
2.5 Post-installation measurements and inspections conducted per the M&V plan. (include all that apply for each one).
Y
2.5.1 Measurement equipment used Y
2.5.2 Equipment calibration procedures (include details or refer to specific section of contract)
Y
2.5.3 Dates/times of data collection or inspection, names of personnel, and evidence of government witnessing
Y- Names of personnel only, no date(s).
2.5.4 Details to confirm adherence to sampling plan Y
2.5.5 Include all post-installation measured values. Include periods of monitoring and durations and frequency of measurements. (Use appendix and electronic format as necessary). Include description of data format (headings, units, etc.).
Y
2.5.6 Energy & cost savings impact from changes between Final Proposal and as-built conditions
Y- costs only
2.5.7 Describe how performance criteria have been met. Y
2.5.8 Detail any performance deficiencies that need to be addressed by ESCO or Government
N
2.5.9 Note impact of performance deficiencies or enhancements on generation of savings
N
2.6 Details of O&M Savings (if applicable) N
2.6.1 Source of savings - describe N
2.6.2 Verification activities – describe N
2.6.3 Have operations and maintenance requirements been met? unknown
2.6.4 Who is responsible for performing operations & maintenance? unknown
2.6.5 List the major maintenance items completed unknown
2.6.6 Service calls or repair/replacement activities conducted this period by ESCO
unknown
2.6.7 Deficiencies needed to be addressed by owner unknown
2.6.8 Impact of deficiencies on generation of savings unknown
2.6.9 Impact of current O&M on capacity to save unknown
2.7 Details of other savings (if applicable) n/a
2.7.1 Source of savings - describe n/a
2.7.2 Verification activities – describe n/a
2.8 Detail commodity (e.g. energy, water, etc.) rate(s) used in calculations. N - In proposal
2.8.1 Actual commodity rate(s) at site for same period (optional). N
2.9 Technical details of all calculations made (use Appendix if necessary) N- In proposal
Evaluation of Super ESPC Performance Reports 2004 Appendix A - Page 45

2.9.1 Analysis Methodology – describe any data manipulation or analysis that was conducted prior to applying savings calculations
N
2.9.2 Details of any baseline or savings adjustments made Y- Fixture count changes.
2.9.3 Projected savings for measure Y- costs only. Energy savings may be in Appendix B, which
was not provided.
2.10 Other comments Executive summary lacking savings by kW/kWh, construction completion date not provided, calculation details not in report body (in App B, not available).
Evaluation of Super ESPC Performance Reports 2004 Appendix A - Page 46

Post-Installation M&V Report Review:
NASA Ames Project 2Moffet Field, CA
Report Date: October 2003
Performance Period Covered: October 1, 2002 through September 31, 2003
ESCo: Johnson Controls
Documents Available:
Entire Delivery Order
ECM Descriptions M&V Plan DO
SchedulesTechnical
Appendices
Post Installation
M&V Report
1st Year M&V
Report
2nd Year M&V
Report
Other (note)
X X X X X X
Reviewer: Kurt Nemer, Nexant, Inc. – [email protected])
Review Date: October 8, 200320 April 2004
Summary of ResultsThis review addresses Johnson Controls, Post-Installation Report for its performance contract with NASA Ames, Moffet Field, CA, Delivery Order # A61372D (B.A.D).
In general, the report supported that measures had been installed and are operating correctly. However the data supplied was not sufficient to verify that the savings predicted will occur. It should be noted the M&V plan accepted by NASA Ames does not require rigorous M&V activity and that Johnson Controls did perform the M&V activities required.
Table 5: Savings SummaryElectric Energy (kWh)
Electric Demand
(kW)
Therms Operations & Maintenance Cost Savings
Total Cost Savings
Estimated 3,790,348 1,202 0 $0 $231,211
Guaranteed $231,211
Reported 3,867,243 1,216 0 $0 $235,902
General RecommendationsIt appears that more care should be taken in explaining variations in savings and in the calculation of the HVAC interactive effects. (see below for additional comments). The
Evaluation of Super ESPC Performance Reports 2004 Appendix A - Page 47

appendices containing the lighting inventory and interactive savings calculations were not included in the electronic (Acrobat) document and were not available for review.
Utility RatesThe utility rates used in the proposal were:
$0.061/kWh
This is a blended rate based on historical consumption at this facility. Electricity cost escalates at 2.0038 % per year.
ECM #1: Lighting UpgradesM&V Methods: LE-A-01
ECM Percent of Total Cost Savings: 100%
Item Estimated Savings Reported savings
KWh/year 3,790,348 3,867,243
MMBtu/year
Total cost savings $ $231,211 $235,902
O & M savings, $ 0 0
Total Savings, $ $231,211 $235,902
This ECM consists of various high-efficiency lighting retrofits across several different building. Light retrofits include:
Replacement of T12 lamps and magnetic ballasts with T8 lamps and electronic ballasts
Replacement of incandescent lamps with compact fluorescent lamps
Replacement of incandescent exit signs with LED exit signs
Installation of occupancy sensors where appropriate.
CommentsSavings associated with this measure were estimated using manufacturer’s specifications, PG&E’s lighting table, or ANSI power values. Operating hours were stipulated based on interviews with NASA staff. The increase in projected savings relative to the estimated values are a result of installing more fixtures than originally estimated. The projected savings are based on the as-built inventory, although that inventory was not provided.
Evaluation of Super ESPC Performance Reports 2004 Appendix A - Page 48

Post-Installation Project Review ChecklistsDO # 76
ESCO Johnson Controls
SiteAmes Research Center #2,
Moffet Field Bldgs.
City Moffet Field
State CA
Region Western
Agency NASA
Report type Post-Install Review
M&V Report Evaluation
1. Executive Summary
1.1 Project Background N
1.2 Brief project and ECM descriptions – what was done and how savings are generated. Note any changes in project scope.
N
1.3 Projected energy and cost savings for the first year of the performance period:
Y
1.3.1Table showing the projected savings for the total project broken out by operations & maintenance (O&M) costs, energy units, energy cost, and other savings for this period. Compare to guaranteed cost savings for total project.
Y
1.3.2 Table showing the projected savings by ECM broken out by O&M savings, energy units, energy cost, and other savings values (as applicable) for this period
Y
1.3.3 Approximate % saved by energy source type for site (optional) N
1.4 Summary of any energy and/or cost savings adjustments required. Describe the impact in changes between the Final Proposal and as-built conditions.
N
1.5 Summary of Construction Period Savings N
1.6 Issues Identified N
2. Details for each ECM
2.1 Overview of ECM – where implemented and how cost savings are generated Y
2.2 Installation verification Y
2.2.1 Detail any changes between Final Proposal and as-built conditions. Y- Fixture count changes.
2.2.2 Describe construction period savings (if applicable). Include date ECM was in effect, and reference acceptance documentation.
n/a
2.2.3 Detail savings calculations for construction period savings n/a
2.4 Overview of M&V plan for ECM
Evaluation of Super ESPC Performance Reports 2004 Appendix A - Page 49

2.4.1 Intent of M&V plan – what is being verified Y
2.4.2 Description of analysis and equations used for savings calculations (include or refer to specific section of contract)
N
2.4.3 Stipulated values from contract (include or refer to specific section of contract)
Y
2.5 Post-installation measurements and inspections conducted per the M&V plan. (include all that apply for each one).
N
2.5.1 Measurement equipment used N
2.5.2 Equipment calibration procedures (include details or refer to specific section of contract)
N
2.5.3 Dates/times of data collection or inspection, names of personnel, and evidence of government witnessing
N
2.5.4 Details to confirm adherence to sampling plan N
2.5.5 Include all post-installation measured values. Include periods of monitoring and durations and frequency of measurements. (Use appendix and electronic format as necessary). Include description of data format (headings, units, etc.).
N
2.5.6 Energy & cost savings impact from changes between Final Proposal and as-built conditions
Y
2.5.7 Describe how performance criteria have been met. Y
2.5.8 Detail any performance deficiencies that need to be addressed by ESCO or Government
N
2.5.9 Note impact of performance deficiencies or enhancements on generation of savings
N
2.6 Details of O&M Savings (if applicable) N
2.6.1 Source of savings - describe N
2.6.2 Verification activities – describe N
2.6.3 Have operations and maintenance requirements been met? N
2.6.4 Who is responsible for performing operations & maintenance? unknown
2.6.5 List the major maintenance items completed unknown
2.6.6 Service calls or repair/replacement activities conducted this period by ESCO
unknown
2.6.7 Deficiencies needed to be addressed by owner unknown
2.6.8 Impact of deficiencies on generation of savings unknown
2.6.9 Impact of current O&M on capacity to save unknown
2.7 Details of other savings (if applicable) n/a
2.7.1 Source of savings - describe n/a
2.7.2 Verification activities – describe n/a
2.8 Detail commodity (e.g. energy, water, etc.) rate(s) used in calculations. Y
2.8.1 Actual commodity rate(s) at site for same period (optional). N
Evaluation of Super ESPC Performance Reports 2004 Appendix A - Page 50

2.9 Technical details of all calculations made (use Appendix if necessary) Y
2.9.1 Analysis Methodology – describe any data manipulation or analysis that was conducted prior to applying savings calculations
N
2.9.2 Details of any baseline or savings adjustments made Y- Fixture count changes.
2.9.3 Projected savings for measure Y
2.10 Other comments Lighting-only measure uses blended rates and LE-A-01. Changes from estimated to as-built are small (<2%) but not explained. Appendices are hard-copy and were not available for review.
Evaluation of Super ESPC Performance Reports 2004 Appendix A - Page 51

Appendix B: Annual M&V Report Reviews
Evaluation of Super ESPC Performance Reports 2004 Appendix B – Page 1

1st Year M&V Report Review:
National Agricultural Library Beltsville, Maryland
Report Date: September 20, 2002Performance Period Covered: April 2001 – April 2002ESCo: NORESCOOther Documents Available:
Entire Delivery Order
ECM Descriptions M&V Plan DO
SchedulesTechnical
Appendices
Post Installation
M&V Report
1st Year M&V
Report
2nd Year M&V
Report
Other (note)
X X X X XO&M/As-
Built
Reviewer: Nexant, Inc. – Doug Hargrave ([email protected])
Review Date: March 24, 2003
Revised by Mark Stetz 18 March 2004
Document Purpose The annual measurement and verification (M&V) report documents the annual savings of the Super ESPC project partnership between the USDA Agricultural Library, Beltsville, MD, and NORESCO. This review has been performed to answer the following:
Was all of the necessary information included in the submittal?
Does the M&V report provide useful feedback information on the installed ECM’s?
Did the annual measurement and verification activities follow the approved M&V Plan?
Did the project yield the guaranteed savings?
General CommentsThe Executive Summary does not concisely summarize the project results. Reported savings for the as-built scope of work are $138,193, which exceeds the guaranteed amount of $124,373 by a significant margin. The presented results are not transparent; it is difficult to trace the reported savings values from measurements and assumptions to the cost savings presented. Table 1 lists the estimated, guaranteed, and year 1 reported savings for the project. Note that the guaranteed
Evaluation of Super ESPC Performance Reports 2004 Appendix B – Page 2

amount is taken from Schedule H-1. The AVR reports the estimated amounts as “guaranteed” even though this is not the case. Table 6: Guaranteed Cost Savings Summary for Year One
Electric Energy (kWh)
Electric Demand,
kW
Natural Gas,
therms
Oil, gallons
Net therm savings
Operations & Maintenance Cost Savings
Total Cost Savings
Estimated 1,316,226 144.0 56,850 $18,947 $138,192
Guaranteed $124,373
Reported 1,315,424 143.2 -131,469 139,530 56,850* $18,947 $138,193
* Not reported, calculated as difference between oil savings and natural gas increase at ~1.35 therms/gal.
Additional savings documentation is needed for all four of the ECMs. Specifically, each ECM requires a complete account of reported savings (broken out into kW, kWh, therms, O&M, etc.) as well as measurements and calculations to reach those savings for the entire performance period. Additionally, energy and demand savings for the lighting controls measure was not adequately documented or reported. Table 2 lists the energy and cost savings by ECM with the control savings added. Table 7: Detailed Cost Savings Summary
kWh kW Therms O&M Total Option Comment
Lighting 269,386 118 0 $15,947 $38,305 A
Lighting Controls
170,252 36.2 $10,481 Derived values, not reported.
Burners 0 0 0 $3,000 $29,562 A fuel switching, no net energy
savings
Chiller Automation
506,663 20 0 0 $21,375 D projected
EMCS 540,177 6 56,850 0 $38,437 D projected
Total 1,486,478 180 56,850 $18,947 $138,160
Note that the savings from the chiller automation and EMCS measure are not being realized due to another contractor’s software upgrade that overwrote Noresco’s EMCS programming. Noresco is claiming full credit for these measures since the re-programming was beyond their control. NAL and Noresco are working on restoring the original programming so that the measure functions as intended.
The Estimated Annual Cost Savings from Schedule H-6 and recorded on Schedule H-1 of the DES were calculated correctly, accounting for an escalation rate (here, called a Savings Adjustment Factor) of 3.0% for O&M savings and 0.0% for all other savings (demand, kWh).
Evaluation of Super ESPC Performance Reports 2004 Appendix B – Page 3

Utility RatesTable 8: Utility Rate Summary
Contracted Utility Rates – Year 1
Notes
Energy ($/kWh) 0.04237 / 0.03800 Note 1
Demand ($/kW) 13.57 / 3.96 Note 1 and 2
Gas ($/therms) 0.30351
Fuel Oil ($/gal) 0.70
Note 1: Electric rates shown with a forward slash (“/”) are for summer and winter, respectively. Summer is defined as starting June 1 and ending October 31. Winter is from November 1 to May 31. Net adjustments including all surcharges and discounts have been applied.
Note 2: Assumes that the maximum demand happens during the on-peak period.
Electricity is supplied by Potomac Electric Power Company under the GT-3A tariff. NORESCO reports including on-peak, shoulder, and off-peak energy charges in the electricity rate structure as applied to savings calculations. Natural gas is supplied by a third-party gas supplier. The total rate of $0.30351/therm at the burner tip was used in the proposed savings estimates. The library has purchased #2 fuel oil from a variety of suppliers in the recent past. For the proposed savings, NORESCO reports that the agreed average unit cost of $0.70/gal would be used as a reasonable expectation of long-term average cost.
Energy rates are not escalated during the contract term.
ECM #1: Lighting Retrofits M&V Methods: Option A
ECM Percent of Total Cost Savings: 35.3%Table 9: ECM Savings SummaryItem Estimated Savings Reported Savings
Efficiency
Controls Total Efficienc
yControls Total
kWh 268,584 171,844* 440,698* 269,386 170,252
* 439,638*
kW 117.4 36.2* 154* 117.7 36.2* 154*
Cost Savings ($) $22,276 $10,595 $32,871 $22,358 $10,481 $32,839
Operations & Maintenance ($) $15,947 $15,947
Total Cost Savings ($) $48,819 $48,818 $48,786
* values obtained or derived from proposal and other sources, not from AVR.
Evaluation of Super ESPC Performance Reports 2004 Appendix B – Page 4

Lighting Retrofits comprise two measures: a lighting efficiency upgrade and a controls upgrade. The Annual Report does not clearly differentiate between the two measures, sometimes reporting only the efficiency measure, other times combining the two. Using the Proposal and other sources, Table 4 lists the efficiency and controls savings separately. Including the control energy saving sin the total savings raises the total kWh that can and should have been claimed.
Comments The annual inspection is the only annual verification requirement for this measure, which
was conducted after the one-year performance period. The hours of operation are stipulated.
NOERSCO reports there were no variations in fixture counts from the original proposal or the as-built report. A dramatic difference in the proposed and reported energy savings exists (kW and kWh) yet there is no difference in the monetary savings. This discrepancy is due to the lighting controls not being adequately documented in the reported savings. (This was determined from conversations with Noresco.) Additionally, a small change in the number of timers (8 fewer were installed than in the proposal) did occur, was documented, and NORESCO is accounting for the $33 reduction on the delivered savings. However, since the total project savings exceed the guarantee, this is of no consequence.
While various measurements appeared to have been taken for this ECM, there was not sufficient documentation to verify the energy nor monetary reported savings.
ECM #2: Burner Replacement M&V Methods: Option A
ECM Percent of Total Cost Savings: 21.3%Table 5: ECM Savings Summary
Item Estimated Projected Savings Reported Savings
kWh/Year (electric) - -
Therms/Year (gas) (188,319) (188,319)
Gallons/Year (oil) 139,530 139,530
Energy Cost Savings ($) $26,562 $26,562
Operations & Maintenance ($) $3,000 Not reported
Total Cost Savings ($) $29,562 $29,562
Comments Savings for this measure are reported as ‘Guaranteed Savings’ in the Executive
Summary, which is a misnomer as the only ‘guaranteed savings’ is the total cost savings.
This measure requires tests to verify proper operation and combustion efficiencies of the burners after annual maintenance has been conducted. The annual maintenance and
Evaluation of Super ESPC Performance Reports 2004 Appendix B – Page 5

overhaul of the boilers was reported to have been performed in the summer of 2001, but no documentation was provided to annotate what the efficiencies were nor what the fuel consumption was for the boilers during or after the summer of 2001. Scheduling conflicts prevented Noresco from obtaining current efficiency tests, so measurements from summer 2000 were used.
From December 2000 and October 2001 the boiler plant was operated mostly on fuel oil due to high natural gas prices. Proposed savings for this ECM were based on exclusive use of natural gas. While it is likely oil operation adversely affected maintenance savings during this period, NAL might have benefited from reduced fuel costs. Regardless, the ability of the dual fuel burners to operate using the both natural gas and fuel oil was verified. This will allow NAL to operate on the lowest-cost fuel.
ECM #3: Chiller Plant AutomationM&V Methods: Option D
ECM Percent of Total Cost Savings: 15.5%Table 6: ECM Savings Summary
Item Estimated Projected Savings (from DO)
Reported Savings (from M&V report)
kWh/Year (electric) 506,663 506,663
Demand Reduction (kW) 19.8 19.8
Therms/Year (gas) - -
Energy Cost Savings ($) $21,375 $21,375
Operations & Maintenance ($) - -
Total Cost Savings ($) $21,375 $21,375
Comments Savings for this measure are reported as ‘Guaranteed Savings’ in the Executive
Summary, which is a misnomer as the only ‘guaranteed savings’ is the total cost savings.
The annual inspection of the chiller plant automation controls and their programming is the only annual verification requirement for this measure. In general, NORESCO appears to be following the M&V plan for this ECM; however, the limited amount of data documentation provided is insufficient to verify the reported year one savings.
The only savings reported for this ECM in the body of the report were the 21.9 kW demand savings. The purpose of this claim is to validate the results from the DOE2 models. The demand and energy savings calculations from the DOE2 models are shown in Attachment B of the ECM-03 appendix, which shows an average monthly demand reduction of 19.8 kW.
Due to an air handler upgrade (Tower Building AHU-2 during the summer of 2001) and a software upgrade (to APOGEE) for the entire building controls system, NORESCO was
Evaluation of Super ESPC Performance Reports 2004 Appendix B – Page 6

unable to verify what – if any – kWh and monetary savings occurred. NORESCO reports that NAL is in the process of correcting the software upgrade problem.
ECM #4: Building Automation System M&V Methods: Option D
ECM Percent of Total Cost Savings: 27.8%Table 7: ECM Savings Summary
Item Estimated Projected Savings (from DO)
Reported Savings (from M&V report)
kWh/Year (electric) 540,177 540,177
Demand Reduction (kW) 6.0 6.0
Therms/Year (gas) 56,850 56,850
Energy Cost Savings ($) $38,437 $38,437
Operations & Maintenance ($) - -
Total Cost Savings ($) $38,437 $38,437
Comments Savings for this measure are reported as ‘Guaranteed Savings’ in the Executive
Summary, which is a misnomer as the only ‘guaranteed savings’ is the total cost savings.
No savings were reported or documented in the report body. Attachment B of the ECM-04 Appendix shows the DOE2 model results and the savings. These values were not adjusted for actual conditions.
This measure requires an annual inspection of the controls and their programming to verify proper operation of the BAS. The BAS and related system performance was monitored after installation and reported to be operating properly until the NAL installation of new software upgrade (to APOGEE) in January/February of 2002. After that time, the BAS and certain portions of the control system no longer operated properly (e.g. unoccupied setback). As a result, savings for the year one performance period cannot be verified. NORESCO reports that NAL is in the process of correcting the software upgrade problem.
The outside air dampers are not working properly and have been set to a closed position (i.e. except for air leakage around the damper, no outside air is mixed in with the supply air). This action reduces economizer savings and, conversely, increases savings for reduced outside air cooling and heating.
Savings were also less than the verified amount during the summer of 2001 when the Tower Building AHU-2 was being upgraded by NAL.
Evaluation of Super ESPC Performance Reports 2004 Appendix B – Page 7

Annual M&V Report Project Review ChecklistsDO # 27
ESCO NORESCO (ERI)
SiteNational Agricultural
Library
City Beltsville
State MD
Region Mid-Atlantic
Agency USDA
Report type M&V Review
M&V Report Evaluation
1. Executive Summary
1.1 Project Background Y
1.2 Short project and ECM descriptions – what was done and how it saves Y
1.3 Summary of energy and cost savings / results from this performance period: Y
1.3.1 Estimated and verified savings broken out by operations & maintenance (O&M) costs, energy units, energy cost, and other savings for this period. Compare to guaranteed cost savings for total project.
N- O&M costs not shown; energy rates not
provided.
1.3.2 Verified savings by ECM broken out by O&M savings, energy units, energy cost, and other savings values (as applicable) for this period
N- O&M costs not shown; energy rates not
provided.
1.3.3 Approximate % Saved by Utility for entire site (optional) N
1.4 Summary of any energy and/or cost savings adjustments required Y- for lighting
1.5 Summary of O&M activities N
1.6 Performance and O&M issues identified. Lighting as-built differs from design; boiler tests not conducted in 2001; software upgrade has cause problem with chiller and EMCS
measures.
2. Summary of contractor payments and verified savings. N
2.1 Payment schedule for duration of contract – invoiced and verified dollar amounts to date and scheduled cost savings
N
2.2 Verified savings for project to date in energy units Y
Evaluation of Super ESPC Performance Reports 2004 Appendix B – Page 8

3. Details for each ECM
3.1 Overview of ECM – where implemented and how cost savings are generated Y
3.2 Overview of M&V plan for ECM
3.2.1 Intent of M&V plan – what is being verified Y
3.2.2 Description of analysis and equations used for savings calculations (include or refer to specific section of contract)
N
3.2.3 Stipulated values from contract (include or refer to specific section of contract)
Y- in appendix
3.2.4 Changes in scope / results recorded in post-install M&V report Y- lighting as-built
3.3 Measurements and inspections conducted this reporting period per the M&V plan. (include all that apply for each one)
Y, but boiler efficiency not measured
3.3.1 Measurement equipment used Y
3.3.2 Equipment calibration documentation. Y- lightingN- boiler
3.3.3 Dates/times of data collection or inspection, names of personnel, and evidence of government witnessing
Y
3.3.4 Details to confirm adherence to the sampling plan. Y
3.3.5 Include all measured values for this period. Include all periods of monitoring and measurement duration / frequency. (use Appendix if necessary)
Y
3.3.6 Describe how performance criteria have been met. Y
3.3.7 Detail any performance deficiencies that need to be addressed by the ESCO or Government.
Y- EMCS needs attention.
3.3.8 Note effect of performance deficiencies or enhancements on generation of savings.
Y- No chiller or EMCS savings.
3.4 Details of O&M Savings (if applicable) N
3.4.1 Describe source of savings. N
3.4.2 Describe verification activities. N
3.5 Details of other savings (if applicable) n/a
3.5.1 Describe source of savings. n/a
3.5.2 Describe verification activities. n/a
Evaluation of Super ESPC Performance Reports 2004 Appendix B – Page 9

3.6 O&M activities
3.6.1 Operating requirements:
3.6.1.1 State organization(s) responsible for equipment operations. If appropriate, detail how responsibilities are shared.
Y- NAL
3.6.1.2 Summarize key operating procedures and any related verification activities.
Y
3.6.1.3 Detail any deficiencies needed to be addressed by ESCO or Government Y- EMCS needs attention.
3.6.1.4 Note impact of operating deficiencies or enhancements on generation of savings
Y- No chiller or EMCS savings.
3.6.2 Maintenance requirements:
3.6.2.1 State organization(s) responsible for performing maintenance. If appropriate, detail how responsibilities are shared.
Y- NAL
3.6.2.2 Verification of scheduled maintenance items completed by ESCO or Government
N
3.6.2.3 Summary of unscheduled maintenance activities conducted this period by ESCO or Government
N
3.6.2.4 Detail any deficiencies needed to be addressed by ESCO or Government Y- Fix EMCS problems relating to software
upgrade.
3.6.2.5 Note impact of maintenance deficiencies on generation of savings Y- EMCS problems reducing savings.
3.7 Detail commodity rate(s) used in calculations N
3.7.1 Actual utility rates at site for same period (optional) N
3.8 Technical details of all calculations made (use Appendix if necessary) Y
3.8.1 Analysis Methodology – describe any data manipulation or analysis that was conducted prior to applying savings calculations
None
3.8.2 Details of any baseline or savings adjustments made Y- Lighting fixture count
3.8.3 Verified savings for each measure Y
3.9 Other comments Lots of stipulation; performance being verified through inspections.
Evaluation of Super ESPC Performance Reports 2004 Appendix B – Page 10

1st Year M&V Report Review:
Sherman Indian SchoolRiverside, CA
Report Date: September 2003
Performance Period Covered: Year 1: March 1, 2001 to February 28, 2002
ESCo: Sempra Energy Solutions
Documents Available:
Entire Delivery Order
ECM Descriptions M&V Plan DO
SchedulesTechnical
Appendices
Post Installation
M&V Report
1st Year M&V
Report
2nd Year M&V
Report
Other (note)
X X X X X X
Reviewer: Kurt Nemer, Nexant, Inc. – [email protected]
Review Date: September 16, 2003
Revised by Mark Stetz 18 March 2004
Summary of ResultsThis review addresses Sempra Energy Services’ first year Annual Verification Report (AVR) for its performance contract with the Bureau of Indian Affairs, Sherman Indian School.
In general the data supplied supported that measures had been installed and are operating correctly, or at least have the potential to generate savings.
Table 10: Savings SummaryElectric Energy (kWh)
Electric Demand
(kW)
Therms Operations & Maintenance Cost Savings
Total Cost Savings
Estimated 1,584253 101 55,225 $29,760 $209,045
Guaranteed $29,760 $179,385
Reported 1,557,724 98.98 55,225 $29,760 $203,865
In addition to the recurring energy and O&M savings, $390,000 in one-time O&M savings are being claimed for eliminating one-time maintenance expenses on the rooftop units. Since payments are being made in Year 1 for these savings, the source of these savings should have been explained in the Annual Report.
Evaluation of Super ESPC Performance Reports 2004 Appendix B – Page 11

General RecommendationsThe reported savings are based on stipulated values and verified equipment operation. In two cases (ECM4, and ECM5), the Annual Savings Report indicates that the equipment is no longer in operation, yet the reported savings are as originally estimated since they are related to changes beyond Sempra’s control. Pool pump project (ECM 6) savings have been reduced due to changes that BIA made in the pool pumping system. These have been reflected in the M&V report.
The photovoltaic system is generating less than half of the expected electricity. Sempra should investigate why and recommend changes to the system.
It appears that the primary reasons for most savings shortfalls are operation changes that are not directly under Sempra’s control. In general, the equipment installed appears to be capable of delivering the savings estimated if operated properly.
BIA should take the following steps to ensure that the claimed savings are being realized:
Perform required maintenance on the air handlers (ECM 3)
Restore pins in the weight room timeclock (ECM 4)
Cover the pool when not in use (ECM 5)
Sempra should provide supporting documentation for the Year 1 O&M savings of $390,000.
Utility RatesThe utility rates used in the proposal were:
$0.0671/kWh
$6.0 /kW on-peak
$2.40/kW mid-peak
$1.15/kW off-peak
$0.51/ Therm (average)
Both energy and O&M savings escalate at 3% per year.
ECM #1M&V Methods: LE-A-02
ECM Percent of Total Cost Savings: 44%
Item Estimated Savings Reported savings
KWh/year 1,929,186 1,929,186
Therms/year
Total energy savings, $ $88,040 $88,040
O & M savings, $ $4,760 $4,760
Total Savings, $ $92,800 $92,800
Evaluation of Super ESPC Performance Reports 2004 Appendix B – Page 12
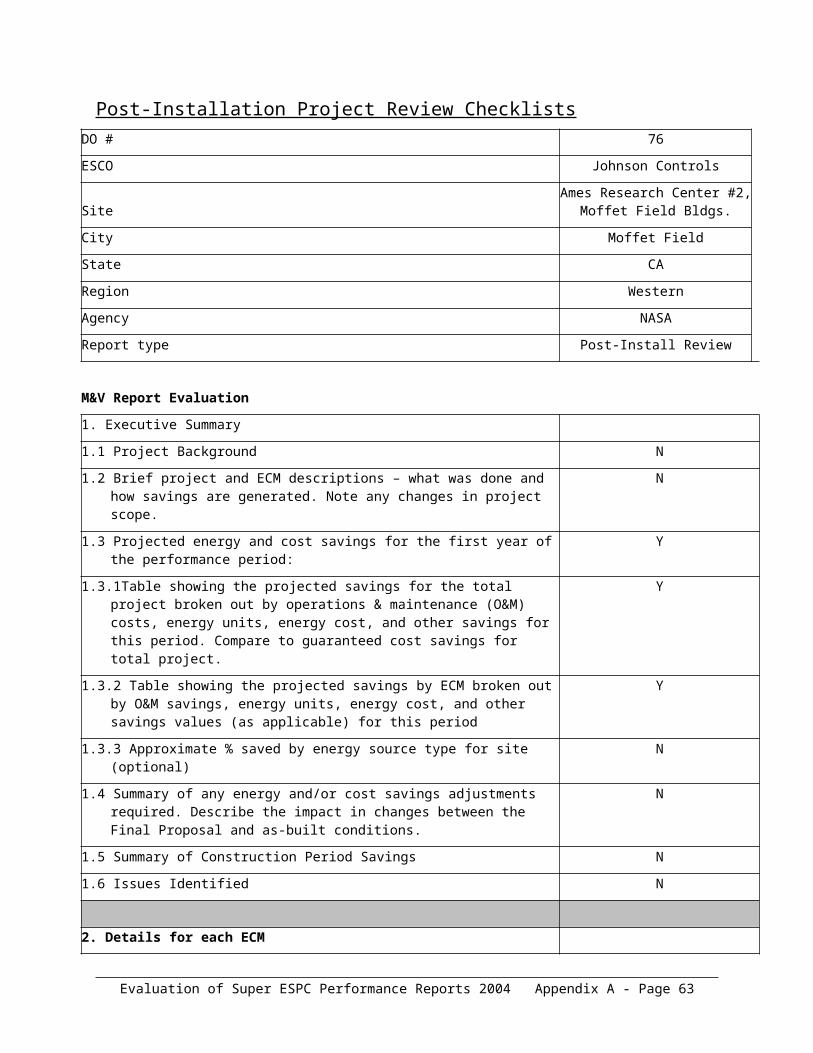
This ECM consists of various high-efficiency lighting retrofits across several different building. Light retrofits include:
Replacement of T12 lamps and magnetic ballasts with T8 lamps and electronic ballasts
Replacement of incandescent lamps with compact fluorescent, halogen, or energy efficient incandescent lamps
Replacement of exit signs
Savings associated with this measure for non-measured fixtures were estimated using industry standard values for fixture input wattage for both the base case and post-installation. Fixture type and quantity was not available to the reviewer. Also, the industry standard input wattage numbers were not supplied and could not be reviewed.
CommentsTwo lighting panels were equipped with data recorder to capture 15 kW data both prior to retrofit and after. This data was used to establish an average load shape and operating hour data. The data recorded shows a definite reduction in demand for these panels but because no kW reduction data was available to the reviewer it was not possible to compare this to the estimated performance.
In addition, spot measurements on a sample of fixtures were made. A total of 9 fixtures in 4 buildings were sampled. The input power measured compares favorably with the estimated values.
ECM #2: Photovoltaic System: M&V Methods: GVL-B-01
ECM Percent of Total Cost Savings: 0.5%
Item Estimated Savings Reported savings
KWh/year 13,803 6,197
Therms/year
Total cost savings $ $1,047 $416
This ECM consists of installing a photovoltaic power system that is connected to the electrical distribution system and thus displaces utility-generated electrical energy.
CommentsThe data monitoring system recorded the kW output of the system, which was used to calculate the kWh displaced by the system during the first year of operation. The data for the month of January was not recorded and was estimated instead. It should be noted that data recorded and
Evaluation of Super ESPC Performance Reports 2004 Appendix B – Page 13

reported suffered from a fairly high level of missing data. Only three of the months reported show 100% data. The Photovoltaic system produced only about half of the savings predicted. Based on the data presented, the demand savings averaged 2.98 kW.
No investigation was made as to why the savings are less than originally estimated, nor are any potential corrective actions suggested. While the savings are not large in absolute terms, the performance of this measure is less than half of what was proposed. The report should make some recommendations about what action Sempra or the BIA should take.
ECM #3: HVAC Upgrades for Administration and Classroom BuildingsM&V Methods: GVL-A-02
ECM Percent of Total Cost Savings: 47%
Item Estimated Savings Reported savings
KWh/year 558,451 558,451
Therms/year 41,602 41,602
Total energy savings, $ $72,944 $72,944
O & M savings $25,000 $25,000
Total Savings $ $97,944 $97,944
This ECM consists of replacing the administration building’s roof top packaged HVAC units with Lennox Pulse Multizone Systems that combine a high efficiency condensing furnace and high efficiency air conditioning system.
The existing boiler and hot water heating system in one dormitory will be replaced with 8 high efficiency forced air systems located above the ceilings.
CommentsEnergy savings associated with this measure were estimated using a DOE2 simulation, which makes this an Option D approach (Method GVL-D-01. FEMP does not define method GVL-A-02, although the intent of this designation is clear.) The verification activity consisted of making spot measurements of heating and cooling efficiency on a sample of the installed units. Efficiency measurements are used to verify performance.
The cooling unit efficiency measurements consisted of measuring the input power to the compressor and fan of the unit, along with the supply and mixed air temperatures. This data was used to calculate EER. Sempra makes the assumption that since the measured EER (12.3) is higher than the value used for the savings calculation (11) that the ECM is performing well. (The proposal called for installing units with a EER of 13 or better, so using 11 represents a conservative savings estimate.) The measured EER was based on an assumed airflow of 400 CFM/nominal ton rather than a measured value as called for in the M&V plan. The measured EER also neglected dehumidification and airflow changes due to VAV operation.
Evaluation of Super ESPC Performance Reports 2004 Appendix B – Page 14

These assumptions introduce considerable uncertainty into the measured EER value. Further, the M&V plan does not specify what an acceptable measured EER value is. However, if the installed units have an EER of 13, the expected measured EER value should be 13 or better when adjusted to ARI conditions. Because of the large amount of uncertainty in the EER measurement, there is a high probability that the units are performing as expected, but the reported value of 12.3 does not inspire confidence.
The efficiency of a sample of furnaces was measured using a combustion analyzer. These measurements showed the efficiency to be slightly less than the manufacturer’s specification (measured value of 89%, about 3% below the rated 92%). The M&V plan does not specify an acceptable measured efficiency value or the precision of the combustion analyzer. The furnace is likely operating at or near its rated performance, but lack of uncertainty discussion does not explain whether the measured value is consistent with the rated value or not.
ECM #4: Timeclock Control For Weight Room HVAC and Water Well Pump M&V Methods: CLM-A-01
ECM Percent of Total Cost Savings: 1%
Item Estimated Savings Reported savings
KWh/year 41,617 41,617
Therms/year 700 700
Total cost savings $ $1,894 $1,894
This ECM consists of installing time clocks to control the HVAC system in the school weight training room and to control the well pump supplying the irrigation system.
CommentsM&V activities consisted of making spot measurements of the HVAC unit and well pump input power. Three of the four affected units were measured and their values reported. (One fan was not functioning.)
The Annual savings report states that the both the weight room time clock and the well pump time clock were rendered inoperable by the removal of all the programming trippers (pins). Thus it is unlikely that this ECM in its present state provides any savings, although the stipulated savings (Sempra’s words) are being claimed. Sempra recommended re-installation of the pins to restore timeclock operation.
ECM #5: Pool Cover and Ventilation ControlsM&V Methods: CLM-A-01
ECM Percent of Total Cost Savings: 5%
Item Estimated Savings Reported savings
KWh/year 57,893 57,893
Evaluation of Super ESPC Performance Reports 2004 Appendix B – Page 15

Therms/year 12,923 12,923
Total cost savings $ $10,517 $10,517
This measure consists of installing a cover over the surface of the swimming pool to reduce heat loss and evaporation, and the installation of humidistat control for the swimming pool ventilation fans to reduce fan run time. In addition, some modification to the ventilation fan ductwork was implemented.
CommentsThe method used to calculate the base case energy use and savings was not available.
M&V activities for this measure consisted of spot measurements of the ventilation fan input power and an inspection of the humidistat set points. Only one of the ventilation fans was in service at the time of inspection.
The first year inspection report indicated that the pool covers were not being used, making it unlikely that the stipulated savings (Sempra’s words) will be achieved.
Sempra recommends that the pool cover be used to realize savings.
ECM #6: Pool Pump VFD Control M&V Methods: VSD-B-01 (now CLM-A-01)
ECM Percent of Total Cost Savings: 2%
Item Estimated Savings Reported savings
KWh/year 23,303 4,380
Therms/year
Total cost savings $ $4,843 $294
This ECM consists of installing a variable frequency drive on the pool pump, premium efficiency pump motor and controls to reduce the energy consumed by the pool pumping system.
CommentsFlow sensors will be used to match pump output to the filtration needs and time clock controls will reduce pumping when the pool is not in use.
The Annual Savings report states that shortly after installation BIA replaced the pool pumping system with a new system that did not allow for modulating operation. The drive was used to reduce the pump output somewhat to match the new system requirements but none of the flow or time controls can be utilized. Therefore, the reported savings are based on the operation of new system with a VFD reducing the speed slightly.
Evaluation of Super ESPC Performance Reports 2004 Appendix B – Page 16

The original M&V approach for this measure consists of verifying that the equipment is operating as designed and thus delivering savings. The M&V plan mentions that a data logger would have been installed.
The M&V approach was modified to the new situation. The revised energy savings were calculated using the measured demand reduction of 0.5 kW for 8,760 hours/year.
Evaluation of Super ESPC Performance Reports 2004 Appendix B – Page 17

Annual M&V Report Project Review ChecklistsDO # 32
ESCO Sempra
SiteBureau of Indian Affairs - Sherman Indian School
City Riverside
State CA
Region Western
Agency DOI
Report type M&V Review
M&V Report Evaluation
1. Executive Summary
1.1 Project Background Y
1.2 Short project and ECM descriptions – what was done and how it saves Y
1.3 Summary of energy and cost savings / results from this performance period: Y
1.3.1 Estimated and verified savings broken out by operations & maintenance (O&M) costs, energy units, energy cost, and other savings for this period. Compare to guaranteed cost savings for total project.
Y
1.3.2 Verified savings by ECM broken out by O&M savings, energy units, energy cost, and other savings values (as applicable) for this period
Y
1.3.3 Approximate % Saved by Utility for entire site (optional) N
1.4 Summary of any energy and/or cost savings adjustments required Y- For pool pump and PV system
1.5 Summary of O&M activities N
1.6 Performance and O&M issues identified. PV output low, pool filter system changed, HVAC units need maintenance,
pool cover not being used, timeclock pins
removed.
2. Summary of contractor payments and verified savings. N
2.1 Payment schedule for duration of contract – invoiced and verified dollar amounts to date and scheduled cost savings
N
2.2 Verified savings for project to date in energy units Y
Evaluation of Super ESPC Performance Reports 2004 Appendix B – Page 18

3. Details for each ECM
3.1 Overview of ECM – where implemented and how cost savings are generated Y
3.2 Overview of M&V plan for ECM
3.2.1 Intent of M&V plan – what is being verified Y
3.2.2 Description of analysis and equations used for savings calculations (include or refer to specific section of contract)
Y
3.2.3 Stipulated values from contract (include or refer to specific section of contract) Y
3.2.4 Changes in scope / results recorded in post-install M&V report Y- Savings adjusted where performance is less than expected.
Stipulated values are not adjusted.
3.3 Measurements and inspections conducted this reporting period per the M&V plan. (include all that apply for each one)
Y
3.3.1 Measurement equipment used Y
3.3.2 Equipment calibration documentation. N - Information may be in printed report only.
3.3.3 Dates/times of data collection or inspection, names of personnel, and evidence of government witnessing
N
3.3.4 Details to confirm adherence to the sampling plan. Y
3.3.5 Include all measured values for this period. Include all periods of monitoring and measurement duration / frequency. (use Appendix if necessary)
Lighting load profiles and HVAC measurements
shown.
3.3.6 Describe how performance criteria have been met. Y
3.3.7 Detail any performance deficiencies that need to be addressed by the ESCO or Government.
Y- Pool cover and timeclock pins.
3.3.8 Note effect of performance deficiencies or enhancements on generation of savings.
Y- No pool or timeclock savings
3.4 Details of O&M Savings (if applicable) N
3.4.1 Describe source of savings. N
3.4.2 Describe verification activities. N
3.5 Details of other savings (if applicable) n/a
3.5.1 Describe source of savings. n/a
3.5.2 Describe verification activities. n/a
Evaluation of Super ESPC Performance Reports 2004 Appendix B – Page 19

3.6 O&M activities
3.6.1 Operating requirements:
3.6.1.1 State organization(s) responsible for equipment operations. If appropriate, detail how responsibilities are shared.
Y- IHS
3.6.1.2 Summarize key operating procedures and any related verification activities. Y
3.6.1.3 Detail any deficiencies needed to be addressed by ESCO or Government Y- Pool cover and timeclock pins.
3.6.1.4 Note impact of operating deficiencies or enhancements on generation of savings
Y- No pool or timeclock savings
3.6.2 Maintenance requirements:
3.6.2.1 State organization(s) responsible for performing maintenance. If appropriate, detail how responsibilities are shared.
Y- BIA
3.6.2.2 Verification of scheduled maintenance items completed by ESCO or Government
N
3.6.2.3 Summary of unscheduled maintenance activities conducted this period by ESCO or Government
N
3.6.2.4 Detail any deficiencies needed to be addressed by ESCO or Government Y- HVAC maintenance, pool covers, timeclock
pins, PV system.
3.6.2.5 Note impact of maintenance deficiencies on generation of savings Y- failure to achieve stipulated values.
3.7 Detail commodity rate(s) used in calculations N
3.7.1 Actual utility rates at site for same period (optional) N
3.8 Technical details of all calculations made (use Appendix if necessary) Y
3.8.1 Analysis Methodology – describe any data manipulation or analysis that was conducted prior to applying savings calculations
None
3.8.2 Details of any baseline or savings adjustments made Y - PV and pool pump adjustments.
3.8.3 Verified savings for each measure Y
3.9 Other comments Savings for some measures stipulated and claimed despite lack of performance. PV system needs attention.
Evaluation of Super ESPC Performance Reports 2004 Appendix B – Page 20

1st Year M&V Report Review:
NASA Ames Research Center Project 1San Francisco, CA
Report Date: September 2003
Performance Period Covered: Year 1: October 1, 2002 to September 30, 2002
ESCo: Johnson controls
Documents Available:
Entire Delivery Order
ECM Descriptions M&V Plan DO
SchedulesTechnical
Appendices
Post Installation
M&V Report
1st Year M&V
Report
2nd Year M&V
Report
Other (note)
X X X X X X
Reviewer: Kurt Nemer, Nexant, Inc. – [email protected]
Review Date: September 1, 200319 April 2004
Revised 19 April 2004 by Mark Stetz
Summary of ResultsThis review addresses Johnson Controls first year Annual Verification Report (AVR) for its performance contract with the NASA Ames Research Center, Delivery Order #A61372D.
In general the data supplied supported that measures had been installed and are operating correctly. It should be noted the M&V plan accepted by NASA does not require rigorous M&V activity and that Johnson Controls did perform the M&V activities required.
Table 11: Savings Summary for Year 1Electric Energy
(kWh)Electric Demand
(kW)
Natural gas, Therms
Operations & Maintenance Cost
Savings
Total Cost Savings
Estimated 4,104,366 n/a 106,258 $1,970 $209,956
Guaranteed $197,358
Reported 3,931,541 n/a 82,258 $1,970 $197,809
General RecommendationsThe savings associated with changes in operation of the HVAC system are based on modeling of the base case and post installation conditions. In one instance metering was used to validate the model and correct for actual savings. In another instance, metering was apparently installed but
Evaluation of Super ESPC Performance Reports 2004 Appendix B – Page 21

was not used to correct the model. We recommend that wherever practical, actual metering data should be used to correct the energy savings model and expected savings.
The lighting measure energy savings is dependent on stipulated input power data and stipulated operating hours. Verifying the input power data for specific fixture types in relatively straightforward but no description of the specific fixture types was available. The PG&E lighting table was used to determine fixture input powers.
In addition, the operating hours were stipulated but no data showing the hours and types of fixture groups were available. We recommend that this data be made available and a sample of fixture groups monitored for operating hours.
Utility RatesThe utility rates were stated in the performance contract as $0.045 per kWh and $0.23 per therm. The electric rate is a blended rate that includes demand savings, which are not being claimed explicitly. Energy and O&M savings escalate at 3.5%.
O&M savings are stipulated and are based on eliminated labor for maintaining an electric well pump.
ECM #3.1: Enhance and Expand Facilities Management Control system-Building N200M&V Methods: GLV-B-01 (see text)
ECM Percent of Total Cost Savings: 2%
Item Estimated Savings Reported savings
KWh/year 21,123 21,123
Therms/year 21,976 21,976
O&M
Total cost savings $ $6,005 $6,005
This ECM consists of implementing:
Outside air lockout for the boiler
Supply air reset for fan systems AHU-1, AHU-2 and AHU-3.
The savings associated with this measure are based on simulations performed Johnson Controls and in accordance to the agreed upon M&V plan, if the operating strategies associated with the ECM are operating correctly, the savings for the ECM will be equal to those predicted by the model
The Boiler lockout measure consists of shutting down the boiler when outside air temperature rises above 75 degrees. Outdoor air temperature and boiler operation status trend data was collected by the FMCS (facilities management and control system). The data was collected once every four hours for one week per month. The trend data supports that the boiler was off when the outside temperature was 75 degrees or greater.
Evaluation of Super ESPC Performance Reports 2004 Appendix B – Page 22

The air handler measure consists of modifying the supply air temperature set point based on outside air temperature. The supply air temperature set point range is 55 degrees to 65 degrees for outside air temperature of 75 degrees to 40 degrees. Outdoor air temperature and supply air temperature set point trend data was collected by the FMCS. The data was collected once every four hours for one week per month. The trend data supports that the supply air set point varies in accordance with the design intent.
CommentsWhile the data supplied supports the measures are operating as designed, the actual energy savings are based on a Market Manager model. This model was used to determine both the baseline and post retrofit energy use. The model and its inputs (weather, building construction, etc.) were not available for review and their accuracy is not known. Since metered data is not used as an input to the savings estimates but only to demonstrate performance, the method is not GVL-B-01 but Option D (simulation).
In some cases (ECM 3.9) measured data was used to correct the model savings data, but for other measures (ECM3.15) even though submetering was installed no correction of the modeled savings was performed.
ECM #3.9: M&V Methods: GVL-B-01 (see text)
ECM Percent of Total Cost Savings: 15%
Item Estimated Savings Reported savings
KWh/year 528,056 417,164
Therms/year 32,430 25,620
O&M
Total cost savings $ $31,221 $24,665
This ECM consists of implementing the following HVAC control strategies in building N227:
Supply air reset for fan systems AHU-1 and S-1,
Outdoor air economizer on AHU-1 and S-1
Night setback for fan system S-1
Hot water temperature reset.
CommentsThe savings associated with this measure are based on simulations performed Johnson Controls and in accordance to the agreed upon M&V plan. The plan stipulates that if the operating strategies associated with the ECM are operating correctly, the savings for the ECM will be equal to those predicted by the model. Proper operation of the control strategies is verified by recording data from the building management and control system. The data supplied supports
Evaluation of Super ESPC Performance Reports 2004 Appendix B – Page 23

that the HVAC control measures have been implemented and are operating as designed. Since metered data is not used as an input to the savings estimates but only to demonstrate performance, the method is not GVL-B-01 but Option D (simulation).
In addition to the recording of data from the Building management and control system, building N227 was equipped with electrical energy submetering. The submetering data was collected for five months. The actual metered electrical energy use averaged 21% higher than the energy use projected by the Johnson Controls model. The reported energy savings for this ECM was reduced by 21% to reflect this correction of the model. Applying this correction factor to gas consumption is questionable, since it is based solely on measured electrical consumption.
ECM #3.15: M&V Methods: GVL-B-01 (see text)
ECM Percent of Total Cost Savings: 6%
Item Estimated Savings Reported savings
KWh/year 160,466 98,533
Therms/year 20,808 8,618
O&M
Total cost savings $ $12,007 $6,416
This ECM consists of implementing the following HVAC control strategies in building N258:
Supply air reset for fan systems AHU-1,AHU-2 and AHU-3
Night setback for fan system AHU-1, AHU-2 and AHU-3
CommentsThe savings associated with this measure are based on simulations performed Johnson Controls and in accordance to the agreed upon M&V plan. The plan states that if the operating strategies associated with the ECM are operating correctly, the savings for the ECM will be equal to those predicted by the model. Proper operation of the control strategies is verified by recording data from the building management and control system. The data supplied supports that the HVAC control measures have been implemented and are operating as designed. . Since metered data is not used as an input to the savings estimates but only to demonstrate performance, the method is not GVL-B-01 but Option D (simulation).
The variation in the reported savings was due to a change in operation of the HVAC system. After occupants complained of being uncomfortable, the night setback on AHU-1, AHU-2 and AHU-3 was discontinued. The Change in reported savings is an estimate from the Johnson Controls model.
In addition to the recording of data from the Building management and control system, building N258 was equipped with electrical energy submetering. No data associated with the submetering is reported in the M&V report and the reported savings were not corrected with measured data.
Evaluation of Super ESPC Performance Reports 2004 Appendix B – Page 24

ECM #5.1 Lighting UpgradesM&V Methods: LE-A-01
ECM Percent of Total Cost Savings: 68%
Item Estimated Savings Reported savings
KWh/year 3,205,036 3,205,036
Therms/year
O&M
Total cost savings $ $144,227 $144,227
CommentsThis ECM consists of various high-efficiency lighting retrofits across 22 different building. Light retrofits include:
Replacement of T12 lamps and magnetic ballasts with T8 lamps and electronic ballasts
Replacement of incandescent lamps with compact fluorescent, halogen, or energy efficient incandescent lamps
Improvement of existing fluorescent fixtures to higher efficiency using a reflector or reflector kit
Replacement of existing fixtures with new higher efficiency fixtures
Replacement of existing incandescent and fluorescent exit signs with LED exit signs
Installation of occupancy sensors for lighting controls
Savings associated with this measure were estimated based on manufacturer’s values, the PG&E lighting table, or published ANSI power values. Fixture type and quantity was not provided. Operating hours for each group of fixture were determined by observation and discussion with NASA personnel and are stipulated for the term of the contract. It is not clear if there were fixture groups with similar operating hours were established or if a single average operating hour figure was used for each building.
ECM #11.1: M&V Methods: GVL-A-01
ECM Percent of Total Cost Savings: ~0%
Evaluation of Super ESPC Performance Reports 2004 Appendix B – Page 25

Item Estimated Savings Reported savings
KWh/year 192 192
Therms/year
O&M $1,970 $1,970
Total cost savings $ $1,979 $1,979
This ECM consists of replacing an electric well pump with a mechanical wind powered pump. Savings have been stipulated (JCI’s words) to be 192 kWh ($9) and $1,970 in O&M for the contract duration.
Evaluation of Super ESPC Performance Reports 2004 Appendix B – Page 26

Annual M&V Report Project Review ChecklistsDO # 35
ESCO Johnson Controls
Site Ames Research Center D0-
1
City San Francisco
State CA
Region Western
Agency NASA
Report type M&V Review
M&V Report Evaluation
1. Executive Summary
1.1 Project Background Y
1.2 Short project and ECM descriptions – what was done and how it saves Y
1.3 Summary of energy and cost savings / results from this performance period: Y
1.3.1 Estimated and verified savings broken out by operations & maintenance (O&M) costs, energy units, energy cost, and other savings for this period. Compare to guaranteed cost savings for total project.
Y
1.3.2 Verified savings by ECM broken out by O&M savings, energy units, energy cost, and other savings values (as applicable) for this period
Y
1.3.3 Approximate % Saved by Utility for entire site (optional) Y - in Appendix D as part of Market Manager output.
1.4 Summary of any energy and/or cost savings adjustments required N
1.5 Summary of O&M activities N
1.6 Performance and O&M issues identified. None.
2. Summary of contractor payments and verified savings. N
2.1 Payment schedule for duration of contract – invoiced and verified dollar amounts to date and scheduled cost savings
N
2.2 Verified savings for project to date in energy units Y
3. Details for each ECM
3.1 Overview of ECM – where implemented and how cost savings are generated Y
3.2 Overview of M&V plan for ECM
3.2.1 Intent of M&V plan – what is being verified Y
3.2.2 Description of analysis and equations used for savings calculations (include or refer to specific section of contract)
N
Evaluation of Super ESPC Performance Reports 2004 Appendix B – Page 27

3.2.3 Stipulated values from contract (include or refer to specific section of contract)
N
3.2.4 Changes in scope / results recorded in post-install M&V report N
3.3 Measurements and inspections conducted this reporting period per the M&V plan. (include all that apply for each one)
Y
3.3.1 Measurement equipment used Y
3.3.2 Equipment calibration documentation. Y
3.3.3 Dates/times of data collection or inspection, names of personnel, and evidence of government witnessing
N
3.3.4 Details to confirm adherence to the sampling plan. N
3.3.5 Include all measured values for this period. Include all periods of monitoring and measurement duration / frequency. (use Appendix if necessary)
Hourly data from EMCS to verify proper sequence
operation. This data is not used for savings
calculations.
3.3.6 Describe how performance criteria have been met. Y
3.3.7 Detail any performance deficiencies that need to be addressed by the ESCO or Government.
N
3.3.8 Note effect of performance deficiencies or enhancements on generation of savings.
N
3.4 Details of O&M Savings (if applicable) N
3.4.1 Describe source of savings. Y- Replacement of electric pump.
3.4.2 Describe verification activities. N
3.5 Details of other savings (if applicable) n/a
3.5.1 Describe source of savings. n/a
3.5.2 Describe verification activities. n/a
Evaluation of Super ESPC Performance Reports 2004 Appendix B – Page 28

3.6 O&M activities
3.6.1 Operating requirements:
3.6.1.1 State organization(s) responsible for equipment operations. If appropriate, detail how responsibilities are shared.
Y- NASA & contractor
3.6.1.2 Summarize key operating procedures and any related verification activities.
Y
3.6.1.3 Detail any deficiencies needed to be addressed by ESCO or Government N
3.6.1.4 Note impact of operating deficiencies or enhancements on generation of savings
N
3.6.2 Maintenance requirements:
3.6.2.1 State organization(s) responsible for performing maintenance. If appropriate, detail how responsibilities are shared.
Y- NASA & their contractor
3.6.2.2 Verification of scheduled maintenance items completed by ESCO or Government
Y
3.6.2.3 Summary of unscheduled maintenance activities conducted this period by ESCO or Government
N
3.6.2.4 Detail any deficiencies needed to be addressed by ESCO or Government n/a
3.6.2.5 Note impact of maintenance deficiencies on generation of savings n/a
3.7 Detail commodity rate(s) used in calculations Y
3.7.1 Actual utility rates at site for same period (optional) N
3.8 Technical details of all calculations made (use Appendix if necessary) N- Narrative only- Market Manager simulation
3.8.1 Analysis Methodology – describe any data manipulation or analysis that was conducted prior to applying savings calculations
None
3.8.2 Details of any baseline or savings adjustments made 3.9: Sub-metered electrical data used in place of Market Manager resulted in a 17%
decrease in savings. 3.15: Temperature setback
eliminated and savings adjusted downward.
3.8.3 Verified savings for each measure Y
3.9 Other comments EMCS data is available but is not used in the savings estimates in preference to Market Manager model.
Evaluation of Super ESPC Performance Reports 2004 Appendix B – Page 29

1st Year M&V Report Review:
National Gallery of ArtWashington, DC
Report Date: September 2003
Performance Period Covered: Year 1: October 31, 2001 – October 30, 2002
ESCo: NORESCO
Documents Available:
Entire Delivery Order
ECM Descriptions M&V Plan DO
SchedulesTechnical
Appendices
Post Installation
M&V Report
1st Year M&V
Report
2nd Year M&V
Report
Other (note)
X X X X X
Reviewer: Kurt Nemer, Nexant, Inc. – knemer @nexant.com)
Review Date: September 1, 200317 March 2004
Revised by Mark Stetz 17 March 2004
Summary of ResultsThis review addresses NORESCO’s 2/28/03 first year (October 31, 2001 to October 30, 2002) Annual Verification Report (AVR) for its performance contract with the National Gallery of Art, Delivery Order # 1 in the Mid-Atlantic Region of FEMP’s Super ESPC program. In general, we found that the measurement and verification protocol followed the plan that NORESCO had proposed in the project’s final delivery order. The AVR has two weaknesses that stand out: 1) its numerical savings conclusions are not retraceable, and 2) utility rates stipulated in the contract are not stated. Table 12: Savings Summary
Electric Energy (kWh)
Electric Demand
(kW-mo)
Steam
klb
Operations & Maintenance Cost
Savings
Total Cost Savings
Estimated 4,442,461 230.0 7,588 $14,690 $365,719
Guaranteed $342,313
Reported 4,607,472 232.8 7,588 $14,165 $377,319
General RecommendationsThe savings proposed by NORESCO for the VFDs and bypass installations were based entirely on stipulated values. Verification at the one-year inspection took the form of making sure that
Evaluation of Super ESPC Performance Reports 2004 Appendix B – Page 30

the measures were performing as expected (verify potential to perform). Specific post-installation measurements were not specified in the M&V plan. Savings for the lighting upgrade were based on pre- and post-installation measured wattages of representative samples.
The savings calculations for all three measures presented in the attachments are presented in the DES, which was not available for review. This left the savings values as having a “black box” feel and we could not retrace them to validate the savings claims. Contracted rates should also be included.
Utility RatesThe utility rates are fixed (no escalation) for the duration of the contract. They were not reported in the Post-Installation report or the Year 1 report. Using the reported energy and cost savings, the average utility rates are $0.0326/kWh, $15.1/kW-mo ($181.2/kW-yr), and $1.495/therm for steam. The electric rates are seasonal and have higher energy and demand charges in the summer. The actual rate schedule could not be determined but it is presented in the Final Proposal (which was not available). O&M savings escalate at 3% per year.
ECM #1: VFD Replacement ProgramM&V Methods: VSD-A-01
ECM Percent of Total Cost Savings: 47%
Item Estimated Savings Reported savings
KWh/year 3,131,949 3,131,949
kW/yr 2,450 2,450
Therms/year 25,960 25,960
O&M
Total cost savings $ $178,065 $178,065
CommentsNORESCO verified variable speed operation of motors by observing fan speeds and power, noting that there were inadequacies in the displays of four of the 99 VFDs installed (one of which was totally inoperable) and requesting that NGA perform the needed equipment repairs.
Concurrent measures of power and fan speed, or power and flow (in the case of pumping systems) were not part of the M&V plan. AHU load profiles, established from direct measurements, trend logs, and consultation with building operations staff in the detailed energy survey, were assumed to be identical during the performance period to the baseline conditions. Pump power was determined from modified cube laws based on measured flow rates, while motor and drive power were determined from manufacturers’ data.
Attachment A1 of the report shows the same savings figures as shown in NORESCO’s original proposal, though without the support for the calculations. Essentially, savings are based on entirely stipulated values, but these are based on a fairly rigorous study performed as part of the DES. Though no follow-up measurements were performed as part of the one-year inspection,
Evaluation of Super ESPC Performance Reports 2004 Appendix B – Page 31

the installed drives were all observed and where there are obvious problems, NORESCO has alerted NGA.
ECM #2: Install east Wing BypassesM&V Methods: GVL-D-01
ECM Percent of Total Cost Savings: 20%
Item Estimated Savings Reported savings
KWh/year
kW/yr
Therms/year 49,920 49,920
O&M
Total cost savings $ $74,628 $74,628
Comments
NORESCO verified that the dampers and actuators were working properly on three of the six units to which they had installed bypasses. They did this by changing system set-points and then observing the actuator/damper responses. Three other units that supply areas where art hangs were not manipulated, but were inspected and found to be operational and problem-free.
Savings were based on a model developed from DES measurements of air conditions entering (70F/50%RH) and leaving (50F/100%RH) the air washer along with airflow rates from a FEMP SAVEnergy audit conducted in 1997. Reheat coil leaving temperatures for summer (65F) and winter (70F) were based on expected average temperatures and were fixed in the model.
ECM #3: Energy Efficient Lighting UpgradesM&V Methods: LE-A-02
ECM Percent of Total Cost Savings: 33%
Item Estimated Savings Reported savings
KWh/year 1,290,512 1,475,523
kW/yr 309 343
Therms/year
O&M $14,690 $14,165
Total cost savings $ $113,026 $124,626
CommentsNORESCO sampled a representative group of pre- and post-installation fixtures for their power draw in order to develop their savings claim. Hours of operation were studied during the DES and stipulated as constant for the replaced fixtures; however, the operating hours of four of the
Evaluation of Super ESPC Performance Reports 2004 Appendix B – Page 32

twenty groups in their “Hours Group Summary” (Attachment C1) were not calculable using their own descriptions of these groups. Savings figures cannot be checked since the lighting inventory and operating hours groups for different fixtures is provided in the DES but no this report.
NORESCO claims some cooling savings based on the reduction in wattage of the replaced fixtures, mostly at the conservative assumption that only 75% of the heat from the luminaires is contributed to the cooling load; no heating penalty is ascribed since this is a reheat system.
Evaluation of Super ESPC Performance Reports 2004 Appendix B – Page 33

Annual M&V Report Project Review ChecklistsDO # 41
ESCO NORESCO (ERI)
Site National Gallery of Art
City Washington
State DC
Region Mid-Atlantic
Agency NGA
Report type M&V Review
M&V Report Evaluation
1. Executive Summary
1.1 Project Background N
1.2 Short project and ECM descriptions – what was done and how it saves Y
1.3 Summary of energy and cost savings / results from this performance period: Y
1.3.1 Estimated and verified savings broken out by operations & maintenance (O&M) costs, energy units, energy cost, and other savings for this period. Compare to guaranteed cost savings for total project.
Y
1.3.2 Verified savings by ECM broken out by O&M savings, energy units, energy cost, and other savings values (as applicable) for this period
Y
1.3.3 Approximate % Saved by Utility for entire site (optional) N
1.4 Summary of any energy and/or cost savings adjustments required Y- for as-built lighting.
1.5 Summary of O&M activities Y
1.6 Performance and O&M issues identified. Small problem identified with VSDs; lighting savings adjusted
to reflect as-built conditions.
2. Summary of contractor payments and verified savings. N
2.1 Payment schedule for duration of contract – invoiced and verified dollar amounts to date and scheduled cost savings
N
2.2 Verified savings for project to date in energy units Y
3. Details for each ECM
3.1 Overview of ECM – where implemented and how cost savings are generated Y
3.2 Overview of M&V plan for ECM
3.2.1 Intent of M&V plan – what is being verified Y
3.2.2 Description of analysis and equations used for savings calculations (include or refer to specific section of contract)
N
Evaluation of Super ESPC Performance Reports 2004 Appendix B – Page 34

3.2.3 Stipulated values from contract (include or refer to specific section of contract)
Y
3.2.4 Changes in scope / results recorded in post-install M&V report Y
3.3 Measurements and inspections conducted this reporting period per the M&V plan. (include all that apply for each one)
Y
3.3.1 Measurement equipment used Y
3.3.2 Equipment calibration documentation. N
3.3.3 Dates/times of data collection or inspection, names of personnel, and evidence of government witnessing
Only the date
3.3.4 Details to confirm adherence to the sampling plan. Y
3.3.5 Include all measured values for this period. Include all periods of monitoring and measurement duration / frequency. (use Appendix if necessary)
Y
3.3.6 Describe how performance criteria have been met. Y
3.3.7 Detail any performance deficiencies that need to be addressed by the ESCO or Government.
Y- VFD EAC-20 not working.
3.3.8 Note effect of performance deficiencies or enhancements on generation of savings.
Y- No savings from EAC-20
3.4 Details of O&M Savings (if applicable) N
3.4.1 Describe source of savings. Y
3.4.2 Describe verification activities. Y
3.5 Details of other savings (if applicable) n/a
3.5.1 Describe source of savings. n/a
3.5.2 Describe verification activities. n/a
Evaluation of Super ESPC Performance Reports 2004 Appendix B – Page 35

3.6 O&M activities
3.6.1 Operating requirements:
3.6.1.1 State organization(s) responsible for equipment operations. If appropriate, detail how responsibilities are shared.
Y- NGA
3.6.1.2 Summarize key operating procedures and any related verification activities.
N
3.6.1.3 Detail any deficiencies needed to be addressed by ESCO or Government Y- VFD EAC-20 not working.
3.6.1.4 Note impact of operating deficiencies or enhancements on generation of savings
Y- No savings from EAC-20
3.6.2 Maintenance requirements:
3.6.2.1 State organization(s) responsible for performing maintenance. If appropriate, detail how responsibilities are shared.
Y- NGA
3.6.2.2 Verification of scheduled maintenance items completed by ESCO or Government
N
3.6.2.3 Summary of unscheduled maintenance activities conducted this period by ESCO or Government
N
3.6.2.4 Detail any deficiencies needed to be addressed by ESCO or Government VFD controls
3.6.2.5 Note impact of maintenance deficiencies on generation of savings minimal
3.7 Detail commodity rate(s) used in calculations N
3.7.1 Actual utility rates at site for same period (optional) N
3.8 Technical details of all calculations made (use Appendix if necessary) Y for energy, N for cost
3.8.1 Analysis Methodology – describe any data manipulation or analysis that was conducted prior to applying savings calculations
None
3.8.2 Details of any baseline or savings adjustments made Adjusted lighting for as-built conditions.
3.8.3 Verified savings for each measure Y
3.9 Other comments Primary deficiencies were lack of utility rate information and equations used. VFD EAC-20 needs attention.
Evaluation of Super ESPC Performance Reports 2004 Appendix B – Page 36

1st Year M&V Report Review:
INEEL Idaho Research CenterIdaho Falls, Idaho
Report Date: September 2003
Performance Period Covered: Year 1: March 1, 2002 to February 28, 2003
ESCo: Johnson controls
Documents Available:
Entire Delivery Order
ECM Descriptions M&V Plan DO
SchedulesTechnical
Appendices
Post Installation
M&V Report
1st Year M&V
Report
2nd Year M&V
Report
Other (note)
X X X X X X
Reviewer: Ed Jerome, Nexant, Inc. – [email protected]
Review Date: September 22, 2003
Revised by Mark Stetz 19 April 2004
Summary of ResultsThis review addresses Johnson Controls Year-1 Measurement and Verification Report for the INEEL Idaho Research Center located in Idaho Falls, Idaho.
The M&V plan accepted by INEEL does not require rigorous M&V activity. Two-thirds of the savings are effectively stipulated; the balance requires only one set of post-installation measurements. It appears that Johnson Controls performed the M&V activities required in the M&V plan, although did not provide adequate supporting documentation to allow validation and crosschecks of the savings.
Table 13: Savings SummaryElectric
Energy (kWh)Electric
Demand (kW)Natural gas,
thermsO&M
Cost Savings
Total Cost Savings
Estimated 780,563 1,492 0 $11,177 $91,827
Guaranteed $89,811
Reported 782,127 1,663 0 $11,177 $92,383
Evaluation of Super ESPC Performance Reports 2004 Appendix B – Page 37

Double counting of savings are avoided by calculating the transformer savings first and valuing the lighting savings at the new rate. These calculations are performed correctly by Johnson Controls with the exception that lighting demand is valued at the old tariff rate.
Recommendations1. The actual calculation spreadsheet used to derive the savings should be presented for
review and validation.
2. For ECM 5.1, the M&V plan calls for stipulated HVAC interactive savings. However, the savings have been adjusted upward in the Year-1 M&V Report. This is not appropriate and should be revised and/or explained.
3. For ECM 5.1, demand savings are valued at the pre-installation rate of $3/kW. These calculations should be modified to use the post-installation rate of $4.5/kW.
4. Johnson Controls states in the Year-1 report that guaranteed annual cost savings are $89,811. The Final Proposal states that first year guaranteed savings should be $107,730, based upon Year-1 savings and stipulated energy savings accrued during the construction phase valued at $17,919. The Year-1 report should be revised to include the correct guarantee amount and additional savings.
Utility RatesThe utility rates used for calculations were noted in the performance contract as follows:
Energy $0.0365/kWh (pre installation) $0.0275/kWh (post installation)
Demand $3.00/kW (pre installation)$4.50/kW (post installation)
Each of the post-installation utility costs carries a 2.7% annual escalation rate.
O&M costs and savings escalate at 3.1%.
ECM #5.1: Lighting RetrofitM&V Method: LE-A-01
ECM Percent of Total Cost Savings: 37%
Item Estimated Savings Reported savings
KWh/year 662,538 664,089
KW/year 1,492 1,663
Therms/year 0 0
O&M $11,177 $11,177
Total cost savings $ $33,873 $34,429
Evaluation of Super ESPC Performance Reports 2004 Appendix B – Page 38

This ECM consists of implementing:
Lighting retrofits and occupancy sensors in eight buildings.
The savings associated with this measure are based upon stipulated hours of operation and kW measurements performed both pre-installation and after 1-year of operation. In addition, stipulated O&M and HVAC interactive saving are added to the savings total. This is in accordance with the agreed upon M&V plan.
CommentsOn average the kW measurement taken by Johnson Controls varied within a fixture group by 30%. This appears to be a fairly wide variance considering the good power quality in most buildings.
Based upon Year-1 M&V activities, the lighting fixture savings increased by 1,385 kWh and 171 kW/year.
Per section 5.1 of the “Energy Baseline and ECM Performance Measurement” section in the Final Proposal, HVAC interactive savings are stipulated at 70,986 kWh. However, the savings have been adjusted upward in the Year-1 M&V Report based on a reported increase in lighting savings. Per the M&V plan, this increase in HVAC interactive savings is not appropriate.
ECM #12.1: Electric Distribution System Improvements M&V Methods: GVL-A-01 (Option A)
ECM Percent of Total Cost Savings: 63%
Item Estimated Savings Reported savings
kWh/year 118,038 118,038
KW/year 0 0
Therms/year 0 0
O&M 0 0
Total cost savings $ $57,954 $57,954
This ECM consists of:
Rate reduction for electrical consumption
Reduced energy consumption from new, energy efficient transformers
The savings associated with this measure are based upon engineering calculations. This is in accordance with the agreed upon M&V plan.
CommentsThe savings are derived from three years of utility billing history, stipulated load factors, and incremental transformer efficiency gains.
There is no FEMP method defined as GVL-A-01; however, the intent of this designation is clear.
Evaluation of Super ESPC Performance Reports 2004 Appendix B – Page 39

Annual M&V Report Project Review ChecklistsDO # 44
ESCO Johnson Controls
Site Idaho Engineering Lab
City Idaho Falls
State ID
Region Western
Agency DOE
Report type M&V Review
M&V Report Evaluation
1. Executive Summary
1.1 Project Background N
1.2 Short project and ECM descriptions – what was done and how it saves N
1.3 Summary of energy and cost savings / results from this performance period: Y
1.3.1 Estimated and verified savings broken out by operations & maintenance (O&M) costs, energy units, energy cost, and other savings for this period. Compare to guaranteed cost savings for total project.
Y
1.3.2 Verified savings by ECM broken out by O&M savings, energy units, energy cost, and other savings values (as applicable) for this period
Y
1.3.3 Approximate % Saved by Utility for entire site (optional) N
1.4 Summary of any energy and/or cost savings adjustments required N
1.5 Summary of O&M activities N
1.6 Performance and O&M issues identified. None
2. Summary of contractor payments and verified savings. N
2.1 Payment schedule for duration of contract – invoiced and verified dollar amounts to date and scheduled cost savings
N
2.2 Verified savings for project to date in energy units Y
3. Details for each ECM
3.1 Overview of ECM – where implemented and how cost savings are generated N
3.2 Overview of M&V plan for ECM
3.2.1 Intent of M&V plan – what is being verified Y
3.2.2 Description of analysis and equations used for savings calculations (include or refer to specific section of contract)
N
Evaluation of Super ESPC Performance Reports 2004 Appendix B – Page 40

3.2.3 Stipulated values from contract (include or refer to specific section of contract)
Y
3.2.4 Changes in scope / results recorded in post-install M&V report N
3.3 Measurements and inspections conducted this reporting period per the M&V plan. (include all that apply for each one)
Y- lighting power and PQ measurements.
3.3.1 Measurement equipment used Y
3.3.2 Equipment calibration documentation. N
3.3.3 Dates/times of data collection or inspection, names of personnel, and evidence of government witnessing
Y
3.3.4 Details to confirm adherence to the sampling plan. Y
3.3.5 Include all measured values for this period. Include all periods of monitoring and measurement duration / frequency. (use Appendix if necessary)
Y
3.3.6 Describe how performance criteria have been met. Y
3.3.7 Detail any performance deficiencies that need to be addressed by the ESCO or Government.
N
3.3.8 Note effect of performance deficiencies or enhancements on generation of savings.
N
3.4 Details of O&M Savings (if applicable) N
3.4.1 Describe source of savings. N
3.4.2 Describe verification activities. N
3.5 Details of other savings (if applicable) Y
3.5.1 Describe source of savings. HVAC interaction
3.5.2 Describe verification activities. Rundquist method
Evaluation of Super ESPC Performance Reports 2004 Appendix B – Page 41

3.6 O&M activities
3.6.1 Operating requirements:
3.6.1.1 State organization(s) responsible for equipment operations. If appropriate, detail how responsibilities are shared.
N
3.6.1.2 Summarize key operating procedures and any related verification activities.
N
3.6.1.3 Detail any deficiencies needed to be addressed by ESCO or Government N
3.6.1.4 Note impact of operating deficiencies or enhancements on generation of savings
N
3.6.2 Maintenance requirements:
3.6.2.1 State organization(s) responsible for performing maintenance. If appropriate, detail how responsibilities are shared.
n/a
3.6.2.2 Verification of scheduled maintenance items completed by ESCO or Government
n/a
3.6.2.3 Summary of unscheduled maintenance activities conducted this period by ESCO or Government
Y- Replaced failed lighting components
under warranty.
3.6.2.4 Detail any deficiencies needed to be addressed by ESCO or Government n/a
3.6.2.5 Note impact of maintenance deficiencies on generation of savings n/a
3.7 Detail commodity rate(s) used in calculations Y
3.7.1 Actual utility rates at site for same period (optional) N
3.8 Technical details of all calculations made (use Appendix if necessary) N
3.8.1 Analysis Methodology – describe any data manipulation or analysis that was conducted prior to applying savings calculations
N
3.8.2 Details of any baseline or savings adjustments made N
3.8.3 Verified savings for each measure Y
3.9 Other comments Two-thirds of the savings are due to a rate change. Lighting savings are valued at the baseline rate when they should be valued at the new rate. HVAC interactions increased over stipulated values; construction period savings included without explanation.
Evaluation of Super ESPC Performance Reports 2004 Appendix B – Page 42

1st & 2nd Year M&V Report Review:
GSA Edith Green/Wendall Wyatt Federal Building Portland, OR
Report Date: February 14 2003, March 15, 2004, March 9 2004Performance Period Covered: December 2001 – November 2002
ESCo: Johnson Controls, IncOther Documents Available:
Entire Delivery Order
ECM Descriptions M&V Plan DO
SchedulesTechnical
Appendices
Post Installation
M&V Report
1st Year M&V
Report
2nd Year M&V
Report
Other (note)
X X X X X X
Reviewer: Nexant, Inc. – Michael Marr ([email protected])
Review Date: October 29, 2003
Revised by Mark Stetz 28 April 2004
Executive SummaryThe annual measurement and verification (M&V) report documents the annual savings of the Super ESPC project partnership between the Edith Green/Wendall Wyatt Federal Building, Portland, OR (EG/WW) and Johnson Controls, Inc. (JCI). This review has been performed to address the following issues:
Was all of the necessary information included in the submittal?
Does the M&V report provide useful feedback information on the installed ECM’s?
Did the annual measurement and verification activities follow the approved M&V Plan?
Did the project yield the guaranteed savings?
The original 1st Year Performance Report prepared by JCI (2/14/03) demonstrated that cost savings for “ECM 3 – EMCS2 Improvements” have been achieved at 2002 utility rates. What was not stated was that energy savings were not at the expected levels. The reason for this discrepancy was that the 2002 energy rates used calculate cost savings (and show that the
2 EMCS: Energy Management & Control System, the system that controls the building’s heating & cooling equipment.
Evaluation of Super ESPC Performance Reports 2004 Appendix B – Page 43

guarantee was met) were nearly twice what they were in 1999 when the savings estimates and guarantee were established.
To address this issue, JCI issued a revised Year 1 report on March 15, 2004 with revised savings estimates based on the 1999 rates. Under these rates, the project still met the savings guarantee, but did not significantly exceed the guarantee as originally stated. The Year 2 report used the 1999 rates escalated by one year at 3.213%, again meeting the escalated guaranteed savings amount. The Year 2 report was made available at about the same time as the revised Year 1 report, so both were reviewed together.
Almost all of the savings are from one measure- the EMCS- which is being verified with an Option C approach. Energy savings resulting from the second measure, “ECM 9 – Refrigeration Improvements” were not verified because the savings were stipulated (JCI’s words) in the original contract. Additional Operational and Maintenance cost savings were identified for both measures in the original contract were also stipulated. The revised savings estimates and reported savings (based on 1999 rates) are summarized in Table 1. Estimated, guaranteed, and reported savings for Year 2 (based on 1999 rates + 3.213%) are reported in Table 2.
Table 14: Savings Summary for Year 1
Electric Energy (kWh)
Demand (kW-yr)
Natural Gas (therms)
Water (CCF)
Operations & Maintenance Cost Savings
Total Cost Savings
Estimated 1,324,251 2,937 75,520 201 $5,383 $100,872
Guaranteed $5,383 $87,649
Reported 1,779,091 1,333 23,490 201 $5,383 $89,361
Table 15: Savings Summary for Year 2
Electric Energy (kWh)
Demand (kW-yr)
Natural Gas (therms)
Water (CCF)
Operations & Maintenance Cost Savings
Total Cost Savings
Estimated 1,324,251 2,937 75,520 201 $5,556 $100,872
Guaranteed $5,556 $90,464
Reported 1,936,696 2,409 33,900 201 $5,556 $108,556
General CommentsAlthough JCI issued a revised report to the GSA, FEMP was not aware of its existence until very recently. This is the only project review so far that is using an Option C M&V approach. This approach is appropriate as the energy savings are more than 20% of the total energy use and the facility use is stable.
Evaluation of Super ESPC Performance Reports 2004 Appendix B – Page 44
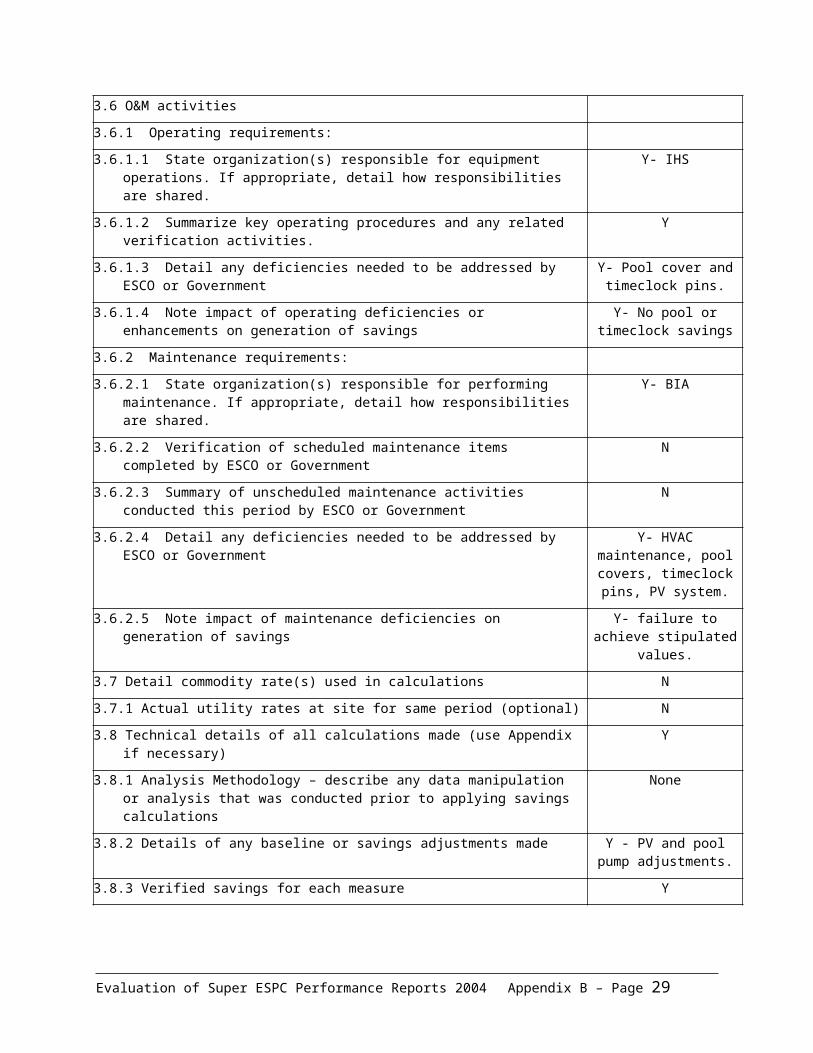
Utility RatesThe revised Year 1 and the Year 2 reports use the 1999 rates, escalating Years 2 and beyond at the contracted escalation rate of 3.213% (both energy and O&M). Further, the revised report uses discrete values for energy and demand instead of a blended energy (kWh) rate as originally submitted. Based on this information, the following utility rate table can be constructed. (JCI did not provide this information.)Table 16: Utility Rate Summary with escalation
Year Ending M&V Year Increase kWh kW therm
2002 1 0% $0.03424 $6.98 $0.461
2003 2 3% $0.03534 $7.20 $0.476
2004 3 7% $0.03647 $7.44 $0.491
2005 4 10% $0.03765 $7.67 $0.507
2006 5 13% $0.03886 $7.92 $0.523
2007 6 17% $0.04010 $8.18 $0.540
2008 7 21% $0.04139 $8.44 $0.557
2009 8 25% $0.04272 $8.71 $0.575
2010 9 29% $0.04409 $8.99 $0.594
2011 10 33% $0.04551 $9.28 $0.613
2012 11 37% $0.04697 $9.58 $0.632
2013 12 42% $0.04848 $9.88 $0.653
2014 13 46% $0.05004 $10.20 $0.674
2015 14 51% $0.05164 $10.53 $0.695
2016 15 56% $0.05330 $10.87 $0.718
ECM #3: EMCS Improvements M&V Methods: “Utility Billing Analysis” – FEMP #GVL-C-01
ECM Percent of Total Cost Savings: 99.9%Table 4: ECM Savings Summary
ItemEstimated
Savings (from Final Proposal)
Reported Savings, Year 1
Reported Savings, Year 2
kWh/Year (electric) 1,323,598 1,779,658 1,936,043
Demand Reduction (kW-Yr) 2,937 1,500 2,409
Therms/Year (gas) 7,552 21,237 33,900
Energy Cost Savings ($) $94,441 $82,930 $101,918
Evaluation of Super ESPC Performance Reports 2004 Appendix B – Page 45

Operations & Maintenance ($) $5,383 $5,383 $5,556
Total Cost Savings ($) $99,824 $88,313 $107,474
Comments Utility bill analysis (Option C) is subject to significant uncertainty in the savings
estimate. Cost savings vary significantly between the original estimate and the cost savings reported in Years 1 & 2. Even though the savings have been adjusted for weather and other conditions, this level of variation in reported savings is common in this type of analysis and is likely not the result of errors on JCI’s part. For Super ESPC, the critical result is that the cost savings (adjusting for escalation) exceed the guarantee each year.
The Final Proposal estimated total annual first-year savings for this measure of $99,824. The guaranteed amount of $87,649 provides a significant “cushion” given the level of uncertainty with the M&V approach used.
The “whole building analysis” process appears to verify the energy savings claimed for this measure. Adjustment to baseline was made to account for the fact that AHU-12, now under control of the Metasys system, was not in operation during the baseline period of April 1999 to March 2000.
A description of the inputs to the Market Manager3 analysis is critical to understanding how the actual savings were calculated.
ECM #9: Refrigeration ImprovementsM&V Methods: None
ECM Percent of Total Cost Savings: 0.1%Table 5: ECM Savings Summary
Item
Estimated Projected
Savings (from Final Proposal)
Reported Savings, Year 1
Reported Savings, Year 2
kWh/Year (electric) 653 653 653
Demand Reduction (kW-Yr)
Therms/Year (gas)
Energy Cost Savings ($) $36 $36 $37
Operations & Maintenance ($) $1,012 $1,012 $1,045
Total Cost Savings ($) $1,048 $1,048 $1,082
Comments Both energy savings and maintenance savings were stipulated in the original proposal.
3 Market Manager is the software that adjusts utility usage for weather conditions.
Evaluation of Super ESPC Performance Reports 2004 Appendix B – Page 46

Annual M&V Report Project Review Checklists
DO # 48
ESCO Johnson Controls
SiteEdith Green/ Wendal Wyatt
Federal Building
City Portland
State OR
Region Western
Agency GSA
Report type M&V Review
M&V Report Evaluation
1. Executive Summary
1.1 Project Background Y
1.2 Short project and ECM descriptions – what was done and how it saves Y- but weak
1.3 Summary of energy and cost savings / results from this performance period: Y
1.3.1 Estimated and verified savings broken out by operations & maintenance (O&M) costs, energy units, energy cost, and other savings for this period. Compare to guaranteed cost savings for total project.
Y- since EMCS is almost all of the savings.
1.3.2 Verified savings by ECM broken out by O&M savings, energy units, energy cost, and other savings values (as applicable) for this period
Y- since EMCS is almost all of the savings.
1.3.3 Approximate % Saved by Utility for entire site (optional) N, but mentioned in PI report.
1.4 Summary of any energy and/or cost savings adjustments required Y- Air handler adjustment.
1.5 Summary of O&M activities N
1.6 Performance and O&M issues identified. Y- Savings exceed guarantee by 87% but no explanation is
provided.
2. Summary of contractor payments and verified savings. N
2.1 Payment schedule for duration of contract – invoiced and verified dollar amounts to date and scheduled cost savings
Y
2.2 Verified savings for project to date in energy units N- since report includes Year 2
3. Details for each ECM
3.1 Overview of ECM – where implemented and how cost savings are generated Y- but weak
3.2 Overview of M&V plan for ECM
Evaluation of Super ESPC Performance Reports 2004 Appendix B – Page 47

3.2.1 Intent of M&V plan – what is being verified Y
3.2.2 Description of analysis and equations used for savings calculations (include or refer to specific section of contract)
N - Uses Metrix to implement Option C
3.2.3 Stipulated values from contract (include or refer to specific section of contract)
Y
3.2.4 Changes in scope / results recorded in post-install M&V report N
3.3 Measurements and inspections conducted this reporting period per the M&V plan. (include all that apply for each one)
N
3.3.1 Measurement equipment used N
3.3.2 Equipment calibration documentation. N
3.3.3 Dates/times of data collection or inspection, names of personnel, and evidence of government witnessing
N
3.3.4 Details to confirm adherence to the sampling plan. N
3.3.5 Include all measured values for this period. Include all periods of monitoring and measurement duration / frequency. (use Appendix if necessary)
N
3.3.6 Describe how performance criteria have been met. Y
3.3.7 Detail any performance deficiencies that need to be addressed by the ESCO or Government.
N
3.3.8 Note effect of performance deficiencies or enhancements on generation of savings.
N
3.4 Details of O&M Savings (if applicable) N
3.4.1 Describe source of savings. N
3.4.2 Describe verification activities. N
3.5 Details of other savings (if applicable) Y
3.5.1 Describe source of savings. Water reduction from elimination of once-through coolers.
3.5.2 Describe verification activities. N
Evaluation of Super ESPC Performance Reports 2004 Appendix B – Page 48

3.6 O&M activities
3.6.1 Operating requirements:
3.6.1.1 State organization(s) responsible for equipment operations. If appropriate, detail how responsibilities are shared.
N
3.6.1.2 Summarize key operating procedures and any related verification activities.
N
3.6.1.3 Detail any deficiencies needed to be addressed by ESCO or Government N
3.6.1.4 Note impact of operating deficiencies or enhancements on generation of savings
N
3.6.2 Maintenance requirements:
3.6.2.1 State organization(s) responsible for performing maintenance. If appropriate, detail how responsibilities are shared.
N
3.6.2.2 Verification of scheduled maintenance items completed by ESCO or Government
N
3.6.2.3 Summary of unscheduled maintenance activities conducted this period by ESCO or Government
N
3.6.2.4 Detail any deficiencies needed to be addressed by ESCO or Government N
3.6.2.5 Note impact of maintenance deficiencies on generation of savings N
3.7 Detail commodity rate(s) used in calculations N
3.7.1 Actual utility rates at site for same period (optional) Y
3.8 Technical details of all calculations made (use Appendix if necessary) N- Metrix using Option C
3.8.1 Analysis Methodology – describe any data manipulation or analysis that was conducted prior to applying savings calculations
N
3.8.2 Details of any baseline or savings adjustments made AHU baseline adjustment.
3.8.3 Verified savings for each measure Y
3.9 Other comments EMCS measure uses Option C with Metrix. Revised Y1 (& Y2) report uses 1999 rates with no escalation.
Evaluation of Super ESPC Performance Reports 2004 Appendix B – Page 49

1st Year M&V Report Review:
VA Medical Center, RIProvidence, Rhode Island
Report Date: March 2003
Performance Period Covered: Year 1: February 1, 2002 to January 31, 2003
ESCo: Johnson controls
Documents Available:
Entire Delivery Order
ECM Descriptions M&V Plan DO
SchedulesTechnical
Appendices
Post Installation
M&V Report
1st Year M&V
Report
2nd Year M&V
Report
Other (note)
X X X X X X X
Reviewer: Ed Jerome, Nexant, Inc. – [email protected]
Review Date: 27 April 2004
Revised by Mark Stetz 30 May 2004
Summary of ResultsThis review addresses Johnson Controls Year 1 Measurement and Verification Report for the Providence VA Medical Center located in Providence, Rhode Island.
The M&V plan accepted by the VA does not require rigorous M&V activity as the savings of all measures are stipulated, with the exception of measures 3.1-1 and 10.1. It appears that Johnson Controls performed the M&V activities required in the M&V plan (with the exception of ECM 10.1) which are reported in the Post-Installation report. The Year 1 report provides no supporting information from inspections but refers the reader back to the Post-Installation report.
Table 17: Savings SummaryElectric Energy (kWh)
Electric Demand
(kW)
Natural gas,
Therms
#2Fuel Oil,
Gallons
O&M Cost
Savings
Total Cost Savings
Estimated936,953
698 kW/yr
58 kW/mo 93,351 21,614 0 $111,947
Guaranteed $102,506
Reported 825,890 528 kW/yr 90,751 21,103 0 $102,772
Evaluation of Super ESPC Performance Reports 2004 Appendix B – Page 50

44 kW/mo
Recommendations1. Johnson Controls should include an Appendix detailing the specific site data gathered,
observations made, the calculations performed, and the unit values used to derive the results.
2. For Measure 1.1, Johnson should address the excessively high pressure drop across economizer #3. It is 125 PSI; the pressure drop across the other two economizers is 20 PSI.
3. The intended M&V protocol (Option A or Option B) for ECM 3.1-1 should be determined and clarified. If Option B is the intended protocol, the Year-1 M&V activities will need to be re-reported
4. For measure 10.1, Johnson Controls should provide the monitored data that was gathered, provide justification for extrapolating across periods where no data was gathered, provide the calculation spreadsheet to support the savings claims.
Utility RatesThe utility rates were listed in the performance contract as follows:
Energy $0.06115/kWh
Demand Not listed ($2.83/kW was used in calculations)
Natural Gas $0.365/therm
#2 Fuel Oil $0.55/gallon
Each of the utility costs carries a 2.98% annual escalation rate. The rates used to calculate the savings are not explicitly listed in the Year 1 report. O&M costs and savings are not considered.
ECM #1.1: Boiler ImprovementsM&V Method: Option A
ECM Percent of Total Cost Savings: 20%
Item Estimated Savings Reported savings
KWh/year 0 0
Therms/year 41,378 41,047
Gallons #2 Oil/year 9,580 9,504
O&M 0 0
Total cost savings $ $20,372 $20,211
Evaluation of Super ESPC Performance Reports 2004 Appendix B – Page 51

This ECM consists of implementing:
(3) Economizers (one per boiler) to recover heat energy and transfer it to the boiler feed water.
The savings associated with this measure are stipulated based on results from the post-installation measurement and verification report. This is in accordance with the agreed upon M&V plan.
CommentsThe M&V report states “An annual inspection of the boiler feedwater temperatures and the economizer operations were performed to ensure the proper operation of the systems.” However, the results from the inspections were not presented for review and validation that the economizers are operational. The initial performance measurements are presented in the Post-Installation Report.
The post-installation report shows a pressure drop of over 125 PSI (245 PSI to 120 PSI) on economizer #3. A pressure drop this high suggests that the economizer is plugged or another problem exists that should be investigated to ensure adequate performance. The pressure drop on the other two units is approximately of 20 PSI.
RecommendationsJCI or the VA should investigate the excess pressure drop across economizer #3 to verify that there is a problem as the measurements suggest.
ECM #3.1-1: Controls Improvements (AC Units) M&V Methods: Option B
ECM Percent of Total Cost Savings: 19%
Item Estimated Savings Reported savings
KWh/year 296,050 296,049
Therms/year 0 0
Gallons #2 Oil/year 0 0
O&M 0 0
Total cost savings $ $18,103 $18,103
This ECM consists of implementing the following hardware and control strategies:
DDC controllers to provide schedule control on 214 A/C units
CommentsThere seems to be confusion around the intended M&V protocol for this measure. The M&V plan calls for Option B and states that fan status, set-points, and outside
Evaluation of Super ESPC Performance Reports 2004 Appendix B – Page 52

air temperature will be monitored on a continuous basis and downloaded monthly. The plan then goes on to state “After the savings have been updated based upon the results of the post-installation survey, the savings of this ECM are stipulated for each of the remaining years of the contract. In addition, the Year-1 M&V report is detailing savings as stipulated based on the Post-Installation report and stipulated in subsequent years.In a November 16, 2000 response to comments on the Providence VA Final Proposal, Johnson Controls clarified the issues in the following statement:
Page 8 of the M&V document says that “this method allows continuous measurements of operating hours taken at the system level through Metasys” It also goes on to say that the “monitoring of this ECM will be continuous, since Metasys will provide trending capability”. The parameters monitored are not stipulated and consequently, option B is the most appropriate for this measure.
The VA should clarify the agreement and have Johnson Controls take corrective actions if necessary.
In addition, the Year-1 M&V report states “An annual inspection of the Metasys set-points to verify that the schedules are properly maintained and operating correctly was performed”. However, the results from the inspection were not presented for review and validation that the schedules are being properly maintained.
ECM #3.1-2: Controls Improvements (Bldg. #35 VFDs) M&V Methods: Option-A
ECM Percent of Total Cost Savings: 9%
Item Estimated Savings Reported savings
KWh/year 144,334 144,474
Therms/year 11,453 11,453
Gallons #2 Oil/year 3,713 3,713
O&M 0 0
Total cost savings $ $14,465 $14,474
This ECM consists of implementing the following hardware and control strategies:
Static pressure sensors to control the VFDs on fans in (2) AHUs
The savings associated with this measure are stipulated based on results from the post-installation measurement and verification report. This is in accordance with the agreed upon M&V plan.
Evaluation of Super ESPC Performance Reports 2004 Appendix B – Page 53

ECM #7.1 Steam Trap ReplacementM&V Methods: Option A
ECM Percent of Total Cost Savings: 27%
Item Estimated Savings Reported savings
KWh/year 0 0
Therms/year 44,247 40,053
Gallons #2 Oil/year 10,245 9,273
O&M 0 0
Total cost savings $ $29,119 $26,359
This ECM consists of implementing the following:
Replacement of 1,125 steam traps
The savings associated with this measure are stipulated based on results from the post-installation measurement and verification report. This is in accordance with the agreed upon M&V plan. The decrease in reported savings relative to the estimated values is the result of 36 steam traps being removed from the scope of work.
When the report was written, 129 steam traps had not yet been installed and were awaiting the VA to install them. JCI claimed savings from these traps since their installation is now the VA’s responsibility. The VA needs to complete their installation if they have not done so already.
ECM #10.1: Back Pressure Steam Turbine M&V Methods: GVL-B-01
ECM Percent of Total Cost Savings: 6%
Item Estimated Savings Reported savings
KWh/year 219,753 104,485
KW/mo 26.5 12.4
Therms/year -3,727 -1,802
Gallons #2 Oil/year -863 -417
O&M 0 0
Total cost savings $ $11,886 $5,625
This ECM consisted of the installation of a steam turbine and induction generator in place of pressure reducing valves. Annual therm and oil savings are listed as negative since this measure will increase fuel use slightly.
Comments
Evaluation of Super ESPC Performance Reports 2004 Appendix B – Page 54

The measure was operational on October 22, 2002, almost nine months later than anticipated. An adjustment to savings has been made for the period of non-operation. The calculation spreadsheet, the monitored data, and the application of the monitored data to the calculations need to be provided.
In addition, Johnson Controls is required to make monthly inspections to gather monitored kWh data and analyze performance. These visits were not performed until January 2003. Therefore only one data point was used to validate performance for the period from October 22, 2002 to January 31, 2003 and the intent of the M&V Plan was not satisfied. Savings details and supporting calculations were not presented for review.
Commissioning and additional M&V activities are being conducted. It is expected (but remains to be demonstrated) that full savings will be realized in Year 2.
ECM #12.1: Transformers M&V Methods: Option A
ECM Percent of Total Cost Savings: 19%
Item Estimated Savings Reported savings
KWh/year 276,816 280,882
KW/mo 31.6 31.6
Therms/year 0 0
Gallons #2 Oil/year 0 0
O&M 0 0
Total cost savings $ $18,000 $18,000
CommentsThis ECM consists of the installation of eight high efficiency transformers replacing lower efficiency units.
The savings associated with this measure are stipulated based on results from the post-installation measurement and verification report. This is in accordance with the agreed upon M&V plan.
The estimated savings of 276,816 kWh was taken from the Post-Installation report. The reported savings from the Year 1 report increased to 280,882 kWh with no explanation or supporting documentation. No increase in cost savings was claimed.
Evaluation of Super ESPC Performance Reports 2004 Appendix B – Page 55

Annual M&V Report Project Review ChecklistsDO # 50
ESCO Johnson Controls
Site VA Medical Center
City Providence
State RI
Region Northeast
Agency VA
Report type M&V Review
M&V Report Evaluation
1. Executive Summary
1.1 Project Background N
1.2 Short project and ECM descriptions – what was done and how it saves Y
1.3 Summary of energy and cost savings / results from this performance period: Y
1.3.1 Estimated and verified savings broken out by operations & maintenance (O&M) costs, energy units, energy cost, and other savings for this period. Compare to guaranteed cost savings for total project.
Y
1.3.2 Verified savings by ECM broken out by O&M savings, energy units, energy cost, and other savings values (as applicable) for this period
Y
1.3.3 Approximate % Saved by Utility for entire site (optional) N
1.4 Summary of any energy and/or cost savings adjustments required Y- for steam turbine
1.5 Summary of O&M activities N
1.6 Performance and O&M issues identified. Steam turbine only operated 3 months of the year.
2. Summary of contractor payments and verified savings. N
2.1 Payment schedule for duration of contract – invoiced and verified dollar amounts to date and scheduled cost savings
N
2.2 Verified savings for project to date in energy units Y
3. Details for each ECM
3.1 Overview of ECM – where implemented and how cost savings are generated Y
3.2 Overview of M&V plan for ECM
3.2.1 Intent of M&V plan – what is being verified Y
3.2.2 Description of analysis and equations used for savings calculations (include or refer to specific section of contract)
N
Evaluation of Super ESPC Performance Reports 2004 Appendix B – Page 56

3.2.3 Stipulated values from contract (include or refer to specific section of contract)
N
3.2.4 Changes in scope / results recorded in post-install M&V report Y
3.3 Measurements and inspections conducted this reporting period per the M&V plan. (include all that apply for each one)
N - all measurements located in the Post-Install report.
3.3.1 Measurement equipment used N
3.3.2 Equipment calibration documentation. N
3.3.3 Dates/times of data collection or inspection, names of personnel, and evidence of government witnessing
N
3.3.4 Details to confirm adherence to the sampling plan. N
3.3.5 Include all measured values for this period. Include all periods of monitoring and measurement duration / frequency. (use Appendix if necessary)
N - Measurements are in Post-Install report. Steam turbine
electrical production should be included.
3.3.6 Describe how performance criteria have been met. Y
3.3.7 Detail any performance deficiencies that need to be addressed by the ESCO or Government.
N - from PI report, one boiler economizer needs attention.
3.3.8 Note effect of performance deficiencies or enhancements on generation of savings.
N
3.4 Details of O&M Savings (if applicable) N
3.4.1 Describe source of savings. Y
3.4.2 Describe verification activities. Y
3.5 Details of other savings (if applicable) n/a
3.5.1 Describe source of savings. n/a
3.5.2 Describe verification activities. n/a
Evaluation of Super ESPC Performance Reports 2004 Appendix B – Page 57

3.6 O&M activities
3.6.1 Operating requirements:
3.6.1.1 State organization(s) responsible for equipment operations. If appropriate, detail how responsibilities are shared.
Y
3.6.1.2 Summarize key operating procedures and any related verification activities.
N
3.6.1.3 Detail any deficiencies needed to be addressed by ESCO or Government Y- VA to install 129 remaining steam traps.
3.6.1.4 Note impact of operating deficiencies or enhancements on generation of savings
Y- Actual steam trap savings not being realized.
3.6.2 Maintenance requirements:
3.6.2.1 State organization(s) responsible for performing maintenance. If appropriate, detail how responsibilities are shared.
n/a
3.6.2.2 Verification of scheduled maintenance items completed by ESCO or Government
n/a
3.6.2.3 Summary of unscheduled maintenance activities conducted this period by ESCO or Government
N
3.6.2.4 Detail any deficiencies needed to be addressed by ESCO or Government n/a
3.6.2.5 Note impact of maintenance deficiencies on generation of savings n/a
3.7 Detail commodity rate(s) used in calculations Y
3.7.1 Actual utility rates at site for same period (optional) N
3.8 Technical details of all calculations made (use Appendix if necessary) N - in Post Install Report
3.8.1 Analysis Methodology – describe any data manipulation or analysis that was conducted prior to applying savings calculations
N - in Post Install Report
3.8.2 Details of any baseline or savings adjustments made Y- Adjustment made for # of steam traps. VA still needs to
install 129 traps.
3.8.3 Verified savings for each measure Y
3.9 Other comments Savings equations and stipulated values should be provided. Data from steam turbine generator should be provided. Steam traps need to be installed.
Evaluation of Super ESPC Performance Reports 2004 Appendix B – Page 58