1st q u a r t e r r e p o r t 2 0 1 8-19 - psx
TRANSCRIPT

1st Q U A R T E R R E P O R T 2 0 1 8-19
1st QUARTER REPORT2018-19
01
Company Information 02
Directors’ Review 03
Directors’ Review in Urdu 04
Condensed Interim Statement of Financial Position 05
06
Condensed Interim Statement of Changes in Equity 07
Condensed Interim Statement of Cash Flows 08
Notes to the Condensed Interim Financial Statements 09
Condensed Interim Statement of Profit or Loss and Other Comprehensive Income

02
COMPANY INFORMATIONBoard of Directors Registrar & Share Registration OfficeMr. Ebrahim Qassim ChairmanMr. M. Haroon Qassim Chief Executive CDC House,Mr. Vali Muhammad A. Habib Director Shahrah-e-Faisal, Mr. Pir Muhammad Director KarachiMrs. Saadia Butt Naveed DirectorMr. Syed Imran Chishti Director Registered OfficeMr. Muhammad Salman Qassim Director 37-G, Block 6,
P.E.C.H.S.,Audit Committee KarachiMr. Pir Muhammad ChairmanMr. Vali Muhammad A. Habib Member FactoryMr. Syed Imran Chishti Member Plot No. 368/4 & 5
Landhi Industrial AreaHuman Resource & Remuneration Committee Baldia RoadMr. Syed Imran Chishti Chairman KarachiMr. M. Haroon Qassim MemberMr. Vali Muhammad A. Habib Member Email & URL
[email protected] Management Committee www.shield.com.pkMr. M. Haroon Qassim ChairmanMr. Vali Muhammad A. Habib MemberMr. Pir Muhammad Member
Company Secretary & CFOMr. M. Zaid Kaliya
Head of Internal AuditMr. M. Shakeel Dhanani
Legal AdvisorsM/s. Lubna Pervez & Associates
External AuditorsKPMG Taseer Hadi & Co.Chartered Accountants
Internal AuditorsA.F. Ferguson & Co.Chartered Accountants
BankersMeezan Bank LimitedBank Al-Habib Limited - Islamic BankingHabib Metropolitan Bank Limited - Islamic BankingHabib Metropolitan Bank Limited
Central Depository Company of Pakistan Limited

03
1st QUARTER REPORT2018-19
DIRECTORS’ REVIEW
Financial summary
Gross Sales 16.72%
Net Sales 11.30%
Gross Profit 7.63%
Gross Profit % (116 bps)
Selling and Distribution Expenses 1.50%
Administrative Expenses (5.77%)
Operating Profit 45.07%
Profit After Tax 104.89%
Earnings per Share 104.89%
On behalf of the Board of Directors, ended 30September 2018.
Your management is doing its best to aggressive and
Operating Results
The economy remained volatile during of thesechallenges, the Company performance over the sameperiod last year, from Rs. 353 million The Selling anddistribution expenses increased by Rs. 1.01 million. TheFinance cost of the Company of Running
DIRECTORS’ REVIEW
Financial Summary
Sep-18 Sep-17
(Rupees) (Rupees)
Gross Sales 440,491,735 377,385,347 16.72%
Net Sales 393,057,012 353,136,160 11.30%
Gross Profit 133,198,803 123,757,567 7.63%
Gross Profit % 33.89% 35.05% (116 bps)
Selling and Distribution Expenses 87,044,655 85,759,147 1.50%
Administrative Expenses 16,424,513 17,430,806 (5.77%)
Operating Profit 28,593,126 19,710,531 45.07%
Profit After Tax 16,362,622 7,986,217 104.89%
Earnings per Share 4.20 2.05 104.89%
M.Haroon Qassim Vali Muhammad A. Habib Chief Executive Director
Karachi: 30 October 2018
On behalf of the Board of Directors, it is our pleasure to present the un-audited financial statements for the period ended30 September 2018.
Your management is doing its best to achieve current year targets and sustainable growth in sales by execution ofaggressive and focused advertisement and promotion plans in next quarters.
The Board of Directors would like to express their gratitude to all employees for their committed efforts, loyalty anddedications.
On behalf of the Board
Operating Results Increase / (Decrease)
The economy remained volatile during the quarter. The State Bank of Pakistan increased bank rate by 15.38%. Despite ofthese challenges, the Company performance is satisfactory. Net Sales for the three months recorded an increase of11.30% over the same period last year, from Rs. 353 million to Rs. 393 million. The Gross Profit of the Company declinedby 116 bps. The Selling and distribution expenses increased by Rs. 1.23 million whereas there was a decrease inAdministrative expenses by Rs. 1.01 million. The Finance cost of the Company increased by Rs. 3.03 million due toincrease in bank rates and increase in utilization of Running Musharakah line. The Earnings per share increased to Rs. 4.20 per share from Rs. 2.05 per share of last year.

04
05
1st QUARTER REPORT2018-19
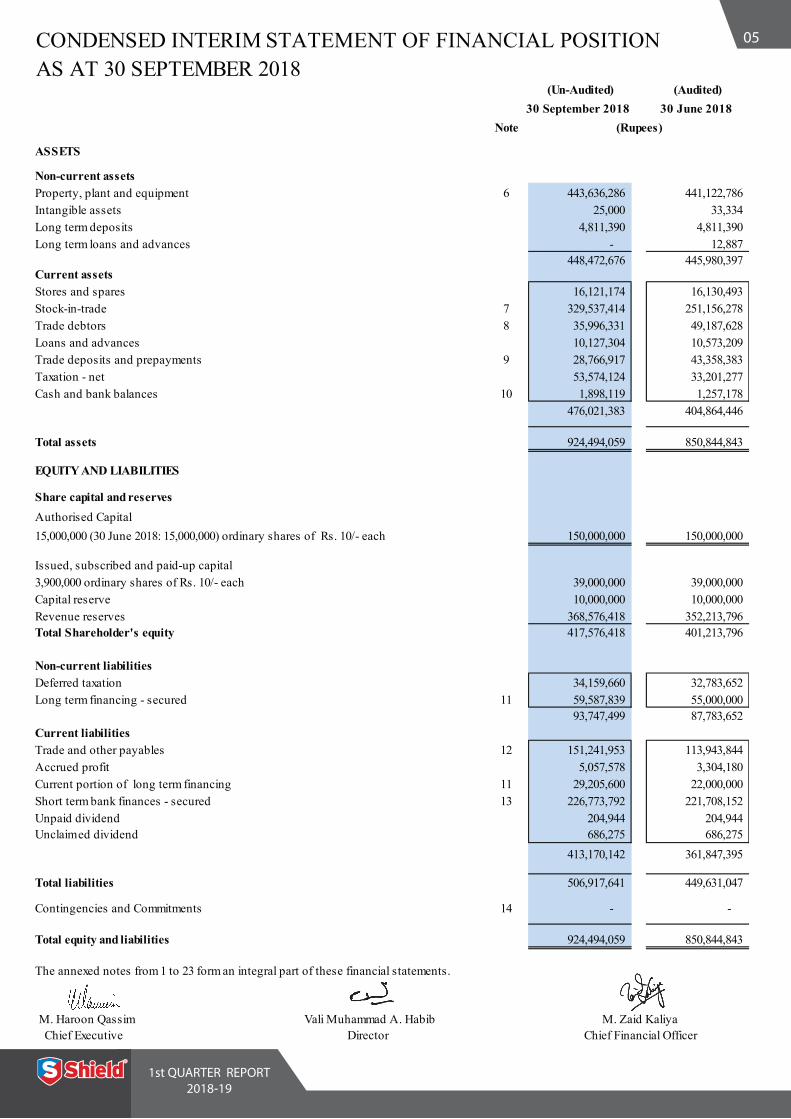
CONDENSED INTERIM STATEMENT OF FINANCIAL POSITIONAS AT 30 SEPTEMBER 2018
(Un-Audited) (Audited)30 September 2018 30 June 2018
Note
ASSETS
Non-current assetsProperty, plant and equipment 6 443,636,286 441,122,786 Intangible assets 25,000 33,334 Long term deposits 4,811,390 4,811,390 Long term loans and advances - 12,887
448,472,676 445,980,397 Current assetsStores and spares 16,121,174 16,130,493 Stock-in-trade 7 329,537,414 251,156,278 Trade debtors 8 35,996,331 49,187,628 Loans and advances 10,127,304 10,573,209 Trade deposits and prepayments 9 28,766,917 43,358,383 Taxation - net 53,574,124 33,201,277 Cash and bank balances 10 1,898,119 1,257,178
476,021,383 404,864,446
Total assets 924,494,059 850,844,843
EQUITY AND LIABILITIES
Share capital and reservesAuthorised Capital15,000,000 (30 June 2018: 15,000,000) ordinary shares of Rs. 10/- each 150,000,000 150,000,000
Issued, subscribed and paid-up capital3,900,000 ordinary shares of Rs. 10/- each 39,000,000 39,000,000 Capital reserve 10,000,000 10,000,000 Revenue reserves 368,576,418 352,213,796 Total Shareholder's equity 417,576,418 401,213,796
Non-current liabilitiesDeferred taxation 34,159,660 32,783,652 Long term financing - secured 11 59,587,839 55,000,000
93,747,499 87,783,652 Current liabilitiesTrade and other payables 12 151,241,953 113,943,844 Accrued profit 5,057,578 3,304,180 Current portion of long term financing 11 29,205,600 22,000,000 Short term bank finances - secured 13 226,773,792 221,708,152 Unpaid dividend 204,944 204,944 Unclaim ed dividend 686,275 686,275
413,170,142 361,847,395
Total liabilities 506,917,641 449,631,047
Contingencies and Commitments 14 - -
Total equity and liabilities 924,494,059 850,844,843
The annexed notes from 1 to 23 form an integral part of these financial statements.
M. Haroon Qassim Vali Muhammad A. Habib M. Zaid Kaliya Chief Executive Director Chief Financial Officer
(Rupees)

06
CONDENSED INTERIM STATEMENT OF PROFIT OR LOSS ANDOTHER COMPREHENSIVE INCOME (Unaudited)FOR THE PERIOD ENDED 30 SEPTEMBER 2018
September, 2018 September, 2017Note
Sales - net 15 393,057,012 353,136,160 Cost of sales (259,858,209) (229,378,593)
Gross profit 133,198,803 123,757,567
Selling and distribution expenses (87,044,655) (85,759,147) Administrative and general expenses (16,424,513) (17,430,806) Other operating expenses (1,730,113) (1,286,124)
(105,199,281) (104,476,077)
27,999,522 19,281,490 Other operating income 593,604 429,041
Operating profit before finance costs 28,593,126 19,710,531
Finance costs 16 (7,051,477) (4,019,628)
Profit before taxation 21,541,649 15,690,903
Taxation (5,179,027) (7,704,686)
Profit for the period 16,362,622 7,986,217
Other comprehensive income - -
Total comprehensive income for the period 16,362,622 7,986,217
Earnings per share - basic and diluted 17 4.20 2.05
The annexed notes from 1 to 23 form an integral part of these financial statements.
M. Haroon Qassim Vali Muhammad A. Habib M. Zaid Kaliya Chief Executive Director Chief Financial Officer
Three months period ended
(Rupees)

07
1st QUARTER REPORT2018-19
CONDENSED INTERIM STATEMENT OF CHANGES IN EQUITY (Unaudited)FOR THE PERIOD ENDED 30 SEPTEMBER 2018
Capital reserve
Balance as at 30 June 2017 39,000,000 10,000,000 55,000,000 248,810,363 352,810,363
Total comprehensive income for thep eriod end ed 30 Sep tember 2017
Profit for the period - - - 7,986,217 7,986,217
Other comprehensive income for the period - - - - -
Total comprehensive income for the period - - - 7,986,217 7,986,217
Balance as at 30 September 2017 39,000,000 10,000,000 55,000,000 256,796,580 360,796,580
Balance as at 30 June 2018 39,000,000 10,000,000 55,000,000 297,213,796 401,213,796
Total comprehensive income for thep eriod end ed 30 Sep tember 2018
Profit for the period - - - 16,362,622 16,362,622
Other comprehensive income for the period - - - - -
Total comprehensive income for the period - - - 16,362,622 16,362,622
Balance as at 30 Sep tember 2018 39,000,000 10,000,000 55,000,000 313,576,418 417,576,418
The annexed notes from 1 to 23 form an integral part of these financial statements.
M. Haroon Qassim Vali Muhammad A. Habib M. Zaid Kaliya Chief Executive Director Chief Financial Officer
-------------------------------------------------- (Rupees) --------------------------------------------------
Issued, sub scrib ed and paid-up capital
Revenue reservesTotal
Share Premium GeneralUnappropriated
Profit
08
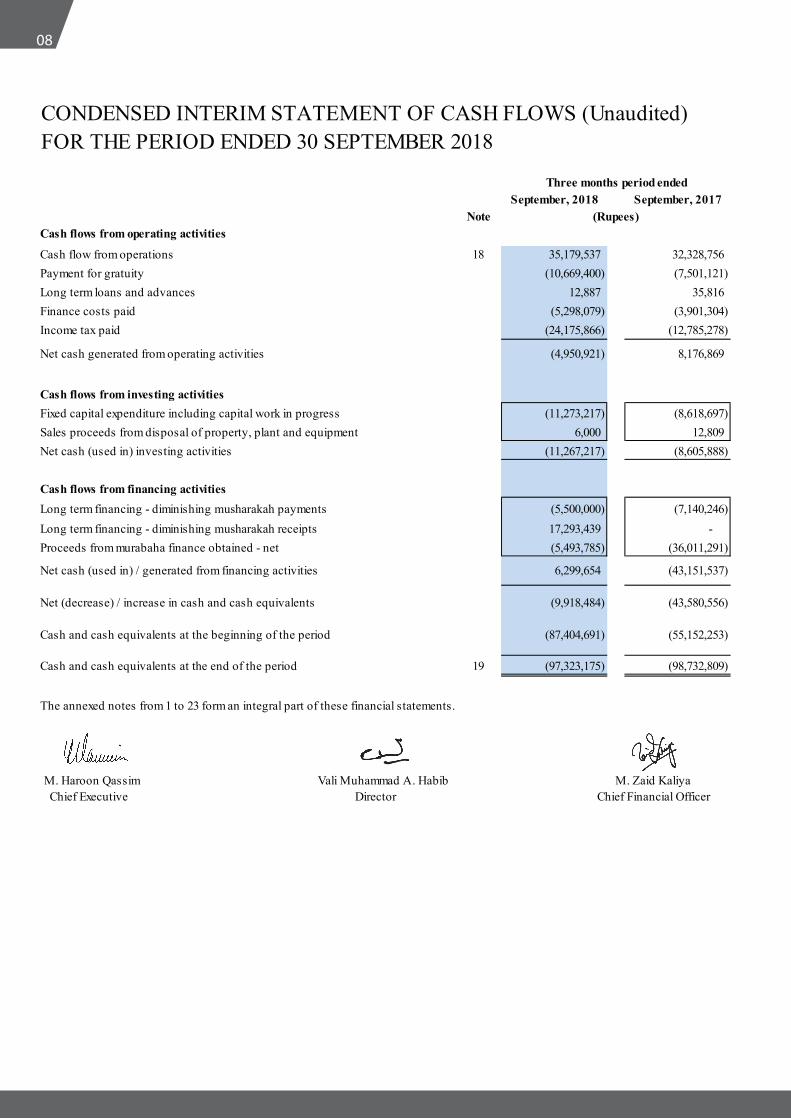
CONDENSED INTERIM STATEMENT OF CASH FLOWS (Unaudited)FOR THE PERIOD ENDED 30 SEPTEMBER 2018
September, 2018 September, 2017Note
Cash flows from operating activities
Cash flow from operations 18 35,179,537 32,328,756 Payment for gratuity (10,669,400) (7,501,121) Long term loans and advances 12,887 35,816 Finance costs paid (5,298,079) (3,901,304) Income tax paid (24,175,866) (12,785,278)
Net cash generated from operating activities (4,950,921) 8,176,869
Cash flows from investing activitiesFixed capital expenditure including capital work in progress (11,273,217) (8,618,697) Sales proceeds from disposal of property, plant and equipment 6,000 12,809 Net cash (used in) investing activities (11,267,217) (8,605,888)
Cash flows from financing activitiesLong term financing - diminishing musharakah payments (5,500,000) (7,140,246) Long term financing - diminishing musharakah receipts 17,293,439 - Proceeds from murabaha finance obtained - net (5,493,785) (36,011,291)
Net cash (used in) / generated from financing activities 6,299,654 (43,151,537)
Net (decrease) / increase in cash and cash equivalents (9,918,484) (43,580,556)
Cash and cash equivalents at the beginning of the period (87,404,691) (55,152,253)
Cash and cash equivalents at the end of the period 19 (97,323,175) (98,732,809)
The annexed notes from 1 to 23 form an integral part of these financial statements.
M. Haroon Qassim Vali Muhammad A. Habib M. Zaid Kaliya Chief Executive Director Chief Financial Officer
Three months period ended
(Rupees)

09
1st QUARTER REPORT2018-19
NOTES TO THE CONDENSED INTERIM FINANCIAL STATEMENTS (Unaudited)FOR THE THREE MONTHS PERIOD ENDED 30 SEPTEMBER, 20181 THE COMPANY AND ITS OPERATIONS
2 BASIS OF PREPARATION
2.1
2.2
2.3
2.4
3 ACCOUNTING POLICIES
4 NEW, AMENDED AND REVISED STANDARDS AND INTERPRETATIONS OF IFRSs
4.1 Amendments to published approved accounting standards that are effective in the current period
-
-
-
- IFRIC 22 ‘Foreign Currency Transactions and Advance Consideration’.
- IFRIC 23 ‘Uncertainty over Income Tax Treatments’.
- IFRS 15 ‘Revenue from contracts with customers’.
-
-
-
-
Classification and Measurement of Share-based Payment Transactions - amendments to IFRS 2.
Annual Improvements to IFRSs 2014-2016 Cycle [Amendments to IAS 28 ‘Investments in Associates and Joint Ventures’].
This condensed interim financial statements is presented in Pakistan Rupees which is also the Company’s functional currency.
The following International Financial Reporting Standards (IFRS) as notified under the Companies Act, 2017 and the amendments andinterpretations there to will be effective for accounting periods beginning on or after 1 July 2018 and are not likely to have an impact on theCompany's financial statements.
Shield Corporation Limited (the Company) was incorporated on 10 January 1975 as a public limited company in Pakistan under the CompaniesAct, 1913 (now Companies Act, 2017) and is quoted on Pakistan Stock Exchange. The registered office of the company is situated at 37-G,Block 6, P.E.C.H.S., Shahrah-e-Faisal, Karachi. The Company is Shariah Compliant Company and listed on Islamic Index.
Manufacturing facility of the Company is located at Landhi Industrial Area, Karachi. The Company started its commercial production on 26November 1975 and is mainly engaged in the manufacturing, trading and sales of oral care and baby care products.
These condensed interim financial statements have been prepared in accordance with the accounting and reporting standards as applicable inPakistan. The accounting and reporting standards applicable in Pakistan comprise of International Financial Reporting Standards (IFRS)issued by the International Accounting Standards Board (IASB) and Islamic Financial Accounting Standards (IFASs) issued by Institute ofChartered Accountant of Pakistan as are notified under the Companies Act, 2017 and provisions of and directives issued under the CompaniesAct, 2017. Where provisions of and directives issued under the Companies Act, 2017 differ from the IFRS Standards or IFASs, the provisionsof and directives issued under the Companies Act, 2017 have been followed.
This condensed interim financial statements does not include all the information and disclosures required in the annual financial statementsand should therefore be read in conjunction with the financial statements of the Company as at and for the year ended 30 June 2018. However,selected explanatory notes are included to explain events and transactions that are significant to an understanding of the changes in theCompany's financial position and performance since the last annual financial statements.
This condensed interim financial statements is being submitted to the shareholders as required by listing regulations of Pakistan StockExchange vide section 237 of the Companies Act, 2017.
The accounting policies and methods of computation adopted in the preparation of this condensed interim financial statements are same asthose applied in the preparation of annual financial statements of the Company as at and for the year ended 30 June 2018.
Amendments to IAS 19 ‘Employee Benefits’.
IFRS 9 ‘Financial Instruments’.
IFRS 16 ‘Leases’.
Transfers of Investment Property Amendments to IAS 40 ‘Investment Property’.
Amendment to IAS 28 ‘Investments in Associates and Joint Ventures’.

10
-
- IFRS 3 'Business Combinations' and IFRS 11 'Joint Arrangement'.
- IAS 12 'Income Taxes'.
- IAS 23 'Borrowing Costs'.
5 USE OF ESTIMATES AND JUDGEMENTS
Unaudited Audited30 September
201830 June
2018 Note (Rupees)
6 PROPERTY, PLANT & EQUIPMENT
Operating fixed assets 6.1 440,001,001 438,700,283 Capital work in progress 6.2 3,635,285 2,422,503
443,636,286 441,122,786
6.1 Following are the cost of operating fixed assets added and disposed off during the period ended:
Addition(at cost)
Disposals (at net book
value)
Addition(at cost)
Disposals (at net book
value)
Plant & machinery 6,799,166 - 8,048,612 - Furniture & fixtures 3,230,268 - - - Office equipments 31,000 14,283 240,260 103,410 Computer equipments - 13,262 130,000 16,597
10,060,434 27,545 8,418,872 120,007
6.2 Capital work in progress
Additions in Capital work-in-progress (net of transfers) during the period amounted to Rs. 3.64 million (2017: Rs. 4.23 million).
Unaudited Audited30 September 2018 30 June 2018
(Rupees)7 STOCK-IN-TRADE
Manufacturing:Raw and packing materials- in hand 107,368,402 147,487,967 - in transit 33,172,265 -
Work-in-process 23,315,724 12,282,326 Finished goods 69,972,903 32,384,370
Trading:- in hand 53,723,193 56,243,103 - in transit 41,984,927 2,758,512
329,537,414 251,156,278
8 TRADE DEBTORS - UNSECURED, CONSIDERED GOOD
Trade debts include Rs. 0.24 million (30 June 2018: 13.42 million) due from related parties.
Annual Improvements to IFRS Standards 2015–2017 Cycle - the improvements address amendments to followingapproved accounting standards, these amendments are effective from annual period beginning on or after 1 January 2019and are not likely to have an impact on the company's financial statements.
30 September 2018 30 September 2017
--------------------------------------- (Rupees) ---------------------------------------
The preparation of condensed interim financial statements requires management to make judgments, estimates andassumptions that affect the application of accounting policies and the reported amounts of assets and liabilities, income andexpenses. Actual results may differ from these estimates. In preparing these condensed interim financial statements, thesignificant judgments made by management in applying the Company’s accounting policies and the key sources of estimationuncertainty were the same as those that applied to the annual financial statements as at and for the year ended 30 June 2018.
Unaudited Unaudited

1st QUARTER REPORT2018-19
11
Unaudited Audited30 September
201830 June
2018Note (Rupees)
9 TRADE DEPOSITS AND PREPAYMENTS
LC margin 25,133,388 42,353,570 Security deposits 848,997 693,997 Prepayments 2,784,532 310,816
28,766,917 43,358,383
10 CASH AND BANK BALANCES
Cash in handLocal currency 191,341 124,851 Foreign currency 372,375 309,875
563,716 434,726
With banks - in current accounts 1,334,403 822,452
1,898,119 1,257,178
10.1 This includes balances amounting to Rs. 0.17 million (30 June 2018: 0.37 million) with Shariah compliant banks.
11 LONG TERM FINANCING - SECURED
Diminishing musharakah arrangements
Installment Repayment Profitpayable period rate
Bank Al-Habib Limited -Islamic banking Quarterly 2017-21 11.1 71,500,000 77,000,000
Meezan Bank Limited Quarterly 2018-20 11.2 17,293,439 -
Less: Current portion shown under current liabilitiesBank Al-Habib Limited - Islamic banking 11.1 (22,000,000) (22,000,000) Meezan Bank Limited 11.2 (7,205,600) -
(29,205,600) (22,000,000)
59,587,839 55,000,000
11.1
11.2
12 TRADE AND OTHER PAYABLES
Creditors 93,046,758 61,853,979 Accrued liabilities 51,835,476 24,868,111 Retention Money 24,382 24,382 Gratuity payable - 10,669,400 Sales tax payable 2,042,184 8,637,788 Workers' welfare fund 1,993,562 1,447,505 Workers' profit participation fund 1,385,222 5,240,671 Advance from customers - unsecured 2,696 1,012,408 Others 911,673 189,600
151,241,953 113,943,844
0.50% above 6 months KIBOR
Islamic finance under diminishing musharakah is secured by a mortgage of head office property.
1% above 3 months KIBOR
Islamic finance under diminishing musharakah is secured by a first exclusive charge over particular machinery of the company.

12
Unaudited Audited30 September
201830 June
2018Note (Rupees)
13 SHORT TERM BANK FINANCES - SECURED
Murabaha finance 13.1 127,552,499 133,046,283 Running Musharakah 13.2 99,221,293 88,661,869
226,773,792 221,708,152
13.1
13.2
14 CONTINGENCIES AND COMMITMENTS
14.1 Commitments
14.1.1
14.1.2
30 September2018
30 September 2017
(Rupees)15 SALES - NET
Sales - local 515,861,074 442,110,078 Sales tax (75,369,339) (64,724,731)
440,491,735 377,385,347 Discounts (49,286,029) (24,326,519)
391,205,706 353,058,828 Sales - export 1,851,306 77,332
393,057,012 353,136,160
16 FINANCE COSTS
Profit on short term borrowings - Shariah arrangements 4,142,943 2,026,345 Interest on WPPF 222,711 234,563 Rent on diminishing musharakah 2,523,554 1,650,455 Guarantee commission 11,519 - Bank charges 150,750 108,265
7,051,477 4,019,628
UnauditedThree months period ended
The status of contingencies as at 30 September 2018 is the same as reported in the annual financial statements for the yearended 30 June 2018.
This represent murabaha finance obtained under profit arrangements and are secured against hypothecation of moveablefixed assets and hypothecation of current assets of the Company. The Company enjoys a total facility of Rs. 300 million (30June 2018: Rs. 250 million) at a profit rate ranging from relevant KIBOR + 0.30% to 0.50% (30 June 2018: KIBOR + 0.30% to0.75%) per annum.
This represent running musharakah obtained under profit arrangements and are secured against hypothecation of moveablefixed assets and hypothecation of current assets of the Company. The Company enjoys a total facility of Rs. 250 million (30June 2018: Rs. 250 million) at a profit rate ranging from relevant KIBOR + 0.30% to 0.50% (30 June 2018: KIBOR + 0.30% to0.50%) per annum.
The Company has letter of credit and other commitments for capital expenditures amounting to Rs. 58 million (30 June 2018:Rs. 32.56 million).
The Company has letter of credit commitments for purchases amounting to Rs. 111 million (30 June 2018: Rs. 72.22 million).

13
1st QUARTER REPORT2018-19
30 September2018
30 September 2017
(Rupees)17 EARNINGS PER SHARE - BASIC AND DILUTED
Profit for the period 16,362,622 7,986,217
(Number of shares)Weighted average number of ordinaryshares in issue during the period 3,900,000 3,900,000
(Rupees)
Earnings per share - basic and diluted 4.20 2.05
18 CASH FLOW FROM OPERATIONS
Profit before taxation 21,541,649 15,690,903
Adjustments for:Depreciation 8,732,173 11,479,137 Amortization 8,333 8,333 Provision for gratuity - 2,844,184 Loss / (gain) on disposal of property, plant and equipment 21,545 107,198 Finance costs 7,051,477 4,019,628
Changes in:- Stores and spares 9,319 (81,049) - Stock-in-trade (78,381,136) (35,047,595) - Trade debts 13,191,297 (1,328,506) - Loans and advances 445,905 3,932,345 - Deposits and short term prepayments 14,591,466 (34,580,477) - Trade and other payables 47,967,509 65,284,655 Cash flows from operations 35,179,537 32,328,756
19 CASH AND CASH EQUIVALENTS
Running musharakah - secured (99,221,294) (100,107,865) Cash and bank balances 1,898,119 1,375,056
(97,323,175) (98,732,809)
20 FINANCIAL RISK MANAGEMENT
The Company has not disclosed the fair values of its financial assets and financial liabilities, as these are either short term innature or reprice periodically. Therefore, their carrying amounts are reasonable approximation of fair value.
UnauditedThree months period ended
The Company's financial risk management objectives and policies are consistent with those disclosed in annual financialstatements of the Company as at and the year ended 30 June 2018.
Fair value is defined as the price that would be received to sell an asset or paid to transfer a liability in an orderly transactionbetween market participants at the measurement date.
Level 1 : Fair value measurements using quoted (unadjusted) in active markets for identical asset or liability.
Level 2 : Fair value measurements using inputs other than quoted prices included within Level 1 that are observable for theasset or liability, either directly (i.e. as prices) or indirectly (i.e. derived from prices).
Level 3 : Fair value measurements using inputs for the asset or liability that are not based on observable market data (i.e.unobservable inputs).

14
21 TRANSACTIONS WITH RELATED PARTIES
30 September2018
30 September 2017
(Rupees)21.1 Transactions during the period:
Name Nature of Basis of Nature ofrelationship relationship transaction
Premier Agencies Associated Commonundertaking directorship
354,782,594 323,840,086
27,299,511 18,426,956
Memon Medical Institute
Employees Provident Fund Employees benefit fund
Key management personnel Executives 8,452,321 6,410,218
22 DATE OF AUTHORIZATION FOR ISSUE
23 GENERAL
Figures have been rounded off to the nearest rupee.
M. Haroon Qassim Vali Muhammad A. Habib M. Zaid Kaliya Chief Executive Director Chief Financial Officer
This condensed interim financial statements was authorized for issue in the Board of Directors meeting held on 30 October 2018.
Retirement benefit fund Contribution made 1,611,015 1,168,270
Related parties
Remuneration and benefits
The related parties comprise of associated undertakings, key management personnel and post employment benefit plan. TheCompany in the normal course of business carries out transactions with various related parties. Other significant transactionswith related parties are as follows:
Sale of goods - net off discount of Rs. 44.83 million (2017: Rs. 21.85 million)
Reimbursement of selling and distribution expenses
Associated undertaking
Common directorship 145,413 118,689 Sale of goods
UnauditedThree months period ended
