1q 2010 virginia real estate report
TRANSCRIPT

8/9/2019 1Q 2010 Virginia Real Estate Report
http://slidepdf.com/reader/full/1q-2010-virginia-real-estate-report 1/9
Highlights
First Quarter 2010
Trends in Virginia’sHousing Markets
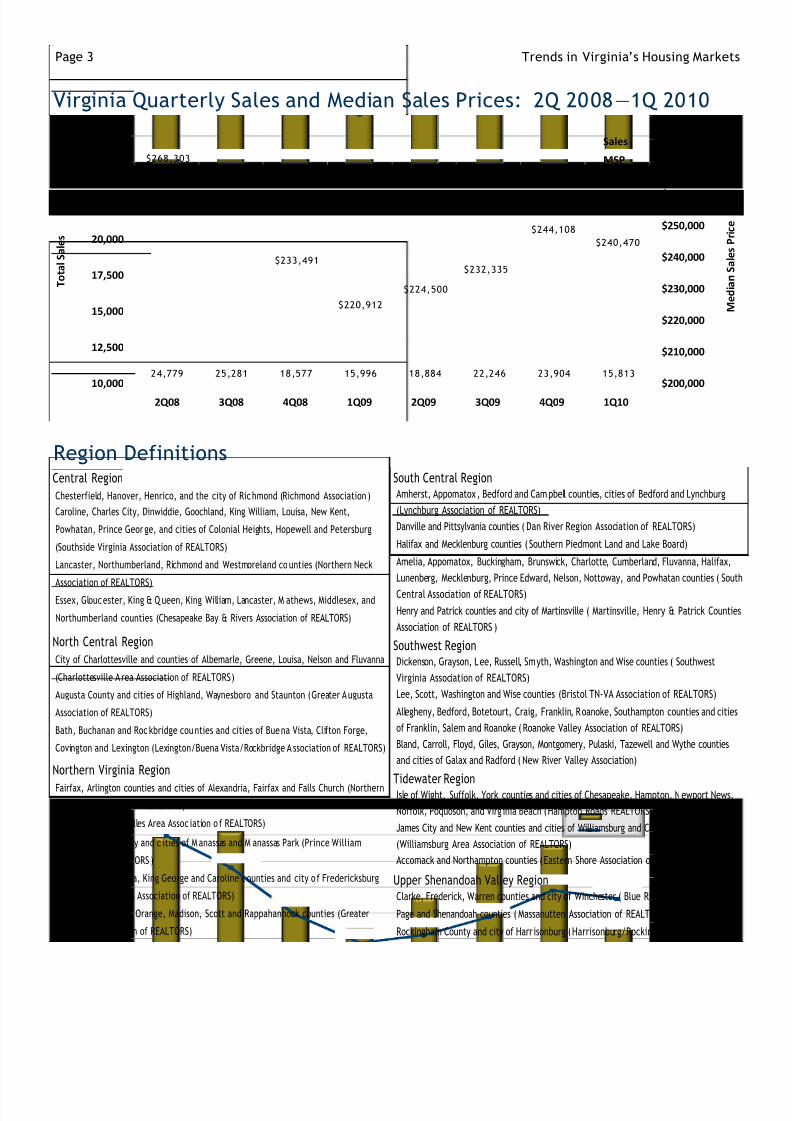
Compared to this time last year, six of Virginia’s seven regions posted sales increases. The highest annual percentageincrease in sales occurred in the Upper Shenandoah Valley region which had a 14.8 percent increase in sales compared to1Q 09. Overall though, the first quarter’s total existing home sales in Virginia declined by 33.8 percent vs. 4Q 09 but byonly 1.1 percent compared to 1Q 09.
The statewide median sales price advanced $19,558 from the median in the first quarter of 2009 (+8.9 percent) to$240,470. Compared to 1Q 09, the Northern Virginia region had the highest percentage increase in its median sales price,it was up 19.2 percent to $305,174.
Following three consecutive quarterly increases, the statewide median sales price decreased slightly (-1.5 percent) com-pared to the fourth quarter of 2009. However, median sales prices increased in two of the seven regions since last quar-ter. Increases amounted to 6.8 percent compared to the fourth quarter of 2009 in the Central region and 4.7 percent inthe Southwest region.
The number of foreclosures in Virginia decreased 2.4 percent from the first quarter of 2009 to the first quarter of 2010.
An especially good sign was the number of foreclosures in the Northern Virginia region. They declined for the second con-secutive quarter (-4.6 percent) and were down 21.5 percent vs. 1Q 09. Foreclosures did spike in the South Central regioncompared to last quarter (+43.3 percent).
While the quarter ended with a net loss of 42,200 jobs so far this year, jobs were actually added to Virginia’s payrolls inMarch. The largest percentage increase in new jobs was in the Federal Government sector (+4.5 percent) and the largestpercentage loss was in the Construction sector (-8.6 percent). Unemployment, at 7.4 percent, was the lowest among Vir-ginia’s neighbors in March and compares favorably to the national rate of 9.7 percent.
In national news, the $8,000 First Time Buyer’s Credit program contributed to March’s 7 percent surge in existing homesales and the general trend is a stabilization of median sales prices. Inventory has trended down for 20 consecutivemonths. Monthly mortgage rates started the quarter at 5.03 percent and declined to 4.97 percent by the end of March.
For Immediate Release:
April 30, 2010Contact: Lisa Noon, (804) 249-5716 or [email protected]
Led by low interest rate and first-time buyers, Virginia’s housing markets continue to show steady growth, according to the firstquarter 2010 home sales report released today by the Virginia Association of Realtors.
“It’s evident that the tax credit did its job in encouraging on-the-fence buyers to get into the market before the cutoff,” com-mented VAR President Cindy Stackhouse of Woodbridge, VA. Today, April 30, marks the last day to enter into a contract for the taxcredit.
"This is a buyers’ market, and there couldn’t be better incentives for prospective home buyers to make the move,” she added.“With the low rates we’re experiencing, plus a great selection at excellent prices, buying a home now offers huge advantages.”
“Sellers need to be patient, price their homes correctly, work with a professional who can market and showcase your home at itsbest, and be flexible,” Stackhouse added.
Most areas of the Commonwealth showed increases in sales in the first quarter over last year. The areas that led the state in closedsales include the Northern Virginia and Tidewater regions. The highest percentage increase was seen in the Upper Shenandoah Val-ley region with a 14.8 percent increase over the last year.
Also for the first quarter, median sales prices advanced 8.9 percent statewide compared to the same period last year. The North-ern Virginia region showed the greatest increase (19.2 percent) in median sales price for the quarter compared to the same time
last year. # # #

8/9/2019 1Q 2010 Virginia Real Estate Report
http://slidepdf.com/reader/full/1q-2010-virginia-real-estate-report 2/9
Page 2 Trends in Virginia’s Housing Markets
Unemployment Rate (VA and USA) The unemployment rate in the Commonwealth was 1.0 percentage point higher in March 2010 compared to March 2009; essen-
tially the same as the increase across the nation over the same time period (1.1 percent). Virginia’s March 2010 unemploy-
ment rate was tied for the fourteenth lowest in the country with Minnesota.
The highest statewide unemployment rate was again in Michigan (14.1 percent). The lowest was in North Dakota (4.0 per-
cent), a typical result.
Virginia Annual Job Change The quarter began with job losses in January and to a lesser extent in February but by March, the Commonwealth was adding
jobs. At the end of the first quarter, job losses so far this year totaled –42,200.
The largest gain (as of March 2010 compared to March 2009) was in the Education and Health Service sector (+15,200 jobs)
while the largest declines were in the Manufacturing and Mining/Logging sectors(-15,800 jobs each). The highest percentage
increase compared to last March was in the Federal Government sector (+4.5 percent). The largest percentage decline was in
the Construction sector (-8.6 percent)
Virginia’s percentage decline in
jobs since March 2009 was 1.4
percent.
This decline compares to
+1.6 percent in DC;
-.9 percent in Maryland;
-1.5 percent in North
Carolina
-1.9 percent in Tennes-
see; and
–1.9 percent in West Vir-
ginia.
Virginia continues to have
the lowest unemployment
rate among its neighbors—
MD = 7.7 percent;
WV = 7.4 percent;
TN = 10.6 percent;
NC = 11.1 percent; and DC = 11.6 percent.
As of February 2010, the
Danville MSA again had the
highest unemployment rate
in the state (12.9 percent)
and Northern Virginia had the
lowest (5.8 percent).
-60.4
-29.8
48.0
-80.0
-60.0
-40.0
-20.0
0.0
20.0
40.0
60.0
Jan Feb Mar
M o n t h - o v e r - t h
e - M o n t h
( 0 0 0 s )
Source; BLS, NSA
2.6
4.2 4.23.8 3.6
2.9 2.83.4
6.47.4
4.3
5.7 5.95.6
5.24.7
4.4
5.1
8.6
9.7
2.0
3.0
4.0
5.0
6.0
7.0
8.0
9.0
10.0
11.0
12.0
20 01 20 02 2 003 2 00 4 2 00 5 2 00 6 2 007 2 008 20 09 2 010
U n e m p l o y m e n t R a t e ( M
a r c h o f E a c h Y e a r )
VA
USA
Source: BLS, SA
8/9/2019 1Q 2010 Virginia Real Estate Report
http://slidepdf.com/reader/full/1q-2010-virginia-real-estate-report 3/9
Page 3 Trends in Virginia’s Housing Markets
Virginia Quarterly Sales and Median Sales Prices: 2Q 2008—1Q 2010
Region DefinitionsCentral Region
Chesterfield, Hanover, Henrico, and the city of Richmond (Richmond Association )
Caroline, Charles City, Dinwiddie, Goochland, King William, Louisa, New Kent,
Powhatan, Prince George, and cities of Colonial Heights, Hopewell and Petersburg
(Southside Virginia Association of REALTORS)
Lancaster, Northumberland, Richmond and Westmoreland co unties (Northern Neck
Association of REALTORS)
Essex, Gloucester, King & Q ueen, King William, Lancaster, M athews, Middlesex, and
Northumberland counties (Chesapeake Bay & Rivers Association of REALTORS)
North Central Region
City of Charlottesville and counties of Albemarle, Greene, Louisa, Nelson and Fluvanna
(Charlottesville A rea Association of REALTORS )
Augusta County and cities of Highland, Waynesboro and Staunton (Greater A ugusta
Association of REALTORS)
Bath, Buchanan and Roc kbridge cou nties and cities of Bue na Vista, Clifton Forge,
Covington and Lexington (Lexington/Buena Vista/Rockbridge A ssociation of REALTORS)
Northern Virginia Region
Fairfax, Arlington counties and cities of Alexandria, Fairfax and Falls Church (Northern
Virginia Association of REALTORS)
Loudoun County (Dulles Area Assoc iation o f REALTORS)
Prince William County and c ities of M anassas and M anassas Park (Prince William
Association of REALTORS )
Stafford, Spotsylvania, King George and Caroline counties and city o f Fredericksburg
(Fredericksburg A rea Association of REALTORS)
Fauquier, Culpeper, Orange, Madison, Scott and Rappahannock counties (Greater
Piedmont Association of REALTORS)
South Central RegionAmherst, Appomatox , Bedford and Campbell counties, cities of Bedford and Lynchburg
(Lynchburg Association of REALTORS)
Danville and Pittsylvania counties (Dan River Region Association of REALTORS)
Halifax and Mecklenburg counties (Southern Piedmont Land and Lake Board)
Amelia, Appomatox, Buckingham, Brunswick, Charlotte, Cumberland, Fluvanna, Halifax,
Lunenberg, Mecklenburg, Prince Edward, Nelson, Nottoway, and Powhatan counties (South
Central Association of REALTORS)
Henry and Patrick counties and city of Martinsville ( Martinsville, Henry & Patrick Counties
Association of REALTORS )
Southwest RegionDickenson, Grayson, Lee, Russell, Smyth, Washington and Wise counties (Southwest
Virginia Association of REALTORS)
Lee, Scott, Washington and Wise counties (Bristol TN-VA Association of REALTORS)
Allegheny, Bedford, Botetourt, Craig, Franklin, Roanoke, Southampton counties and cities
of Franklin, Salem and Roanoke (Roanoke Valley Association of REALTORS)
Bland, Carroll, Floyd, Giles, Grayson, Montgomery, Pulaski, Tazewell and Wythe counties
and cities of Galax and Radford (New River Valley Association)
Tidewater RegionIsle of Wight, Suffolk, York counties and cities of Chesapeake, Hampton, Newport News,
Norfolk, Poquoson, and Virg inia Beach (Hampton Roads REALTORS Association)
James City and New Kent counties and cities of Williamsburg and Charles City
(Williamsburg Area Association of REALTORS)
Accomack and Northampton counties (Eastern Shore Association of REALTORS)
Upper Shenandoah Valley RegionClarke, Frederick, Warren counties and city of Winchester (Blue Ridge Association)
Page and Shenandoah counties (Massanutten Association of REALTORS)
Rockingham County and city of Harr isonburg (Harrisonburg/Rockingham Association)
24,779 25,281 18,577 15,996 18,884 22,246 23,904 15,813
$268,303
$254,177
$233,491
$220,912
$224,500
$232,335
$244,108
$240,470
$200,000
$210,000
$220,000
$230,000
$240,000
$250,000
$260,000
$270,000
$280,000
10,000
12,500
15,000
17,500
20,000
22,500
25,000
27,500
2Q08 3Q08 4Q08 1Q09 2Q09 3Q09 4Q09 1Q10
M e d i a n S a l e s P r i c e
T o t a l S a l e s
Sales
MSP

8/9/2019 1Q 2010 Virginia Real Estate Report
http://slidepdf.com/reader/full/1q-2010-virginia-real-estate-report 4/9
Page 4Fourth Quarter 2009
1Q 10 Sales by Region
1Q 10 Median Sales Prices by Region
Foreclosures in Virginia and by Region The total number of foreclosures increased in Virginia from 14,668 last quarter to 15,563 in the first quarter of 2010 (+6.1 per-
cent). That followed a 19.1 percent decrease from the third to the fourth quarter.
An interesting phenomenon surfaced in the fourth quarter of 2009. Northern Virginia has historically preceded other regions in
the Commonwealth with regard to foreclosure activity. Again in the first quarter of 2010, Northern Virginia’s foreclosures
declined compared to the previous quarter (-4.5 percent). While it still led the state with the highest number of foreclosuresby a large margin, it actually posted the only percentage decrease this quarter.
The North Central region posted the lowest per-
centage quarterly increase in foreclosures last
quarter (+.8 percent) compared to 4Q 09.
For the second consecutive quarter, the number
of total foreclosures increased in the South Cen-
tral region, posting the highest percentage in-
crease in the state (+43.3 percent).
Foreclosures in the Southwest region had the
second highest percentage increase during the
first quarter, +20.9 percent.
Note: “Others” denotes counties outside the VAR
reporting area. Overall, the number of foreclosures
in these areas dropped from 21 to 19 in the first
quarter of 2010 for a 9.5 percent decline.
Region 1Q 10 vs. 4Q 09 vs. 1Q 09
Central 2,067 -30.4% 7.0%North Central 656 -34.5% 12.9%
Northern Virginia 7,064 -22.4% -10.7%
South Central 656 -23.5% 5.3%
Southwest Virginia 1,132 -29.3% 5.5%
Tidewater 3,610 -36.1% 8.4%
Upper Shenandoah Valley 628 -28.6% 14.8%
1Q10 2Q10 3Q10 4Q10
Central 2,699 0 0 0
North Central 267 0 0 0
Northern Virginia 7,220 0 0 0
South Central 397 0 0 0
Southwest 562 0 0 0
Tidewater 3,618 0 0 0
Upper Shenandoah Valley 781 0 0 0
Total 15,544 0 0 0
Others 19 0 0 0
15,563 0 0 0
Quarter Totals
Region
Virginia Total Source: Realt yTr ac
Region 1Q 10 vs. 4Q 09 vs. 1Q 09Central $209,016 6.8% 6.5%
North Central $210,526 -8.1% -16.3%
Northern Virginia $305,174 -0.8% 19.2%
South Central $118,706 -0.5% -3.6%
Southwest Virginia $141,524 4.7% 6.4%
Tidewater $206,957 -2.8% -3.9%
Upper Shenandoah Valley $158,516 -5.9% -6.6%
8/9/2019 1Q 2010 Virginia Real Estate Report
http://slidepdf.com/reader/full/1q-2010-virginia-real-estate-report 5/9
Page 5 Trends in Virginia’s Housing Markets
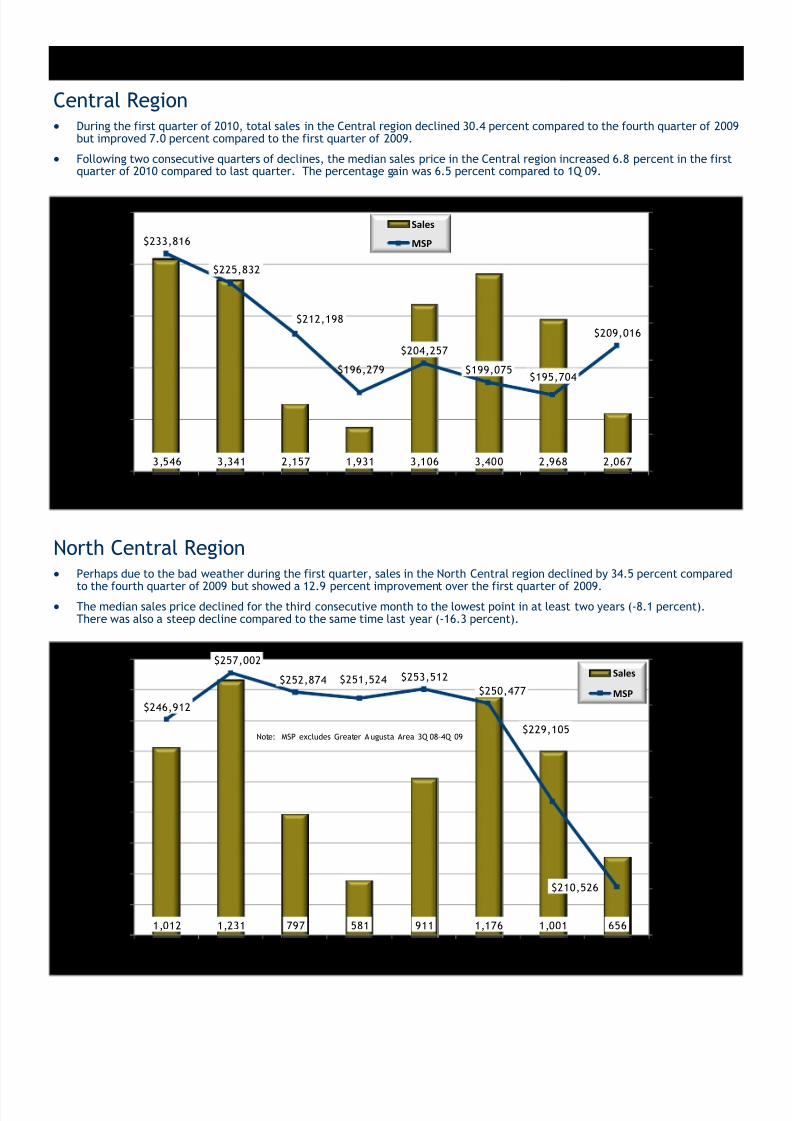
Central Region During the first quarter of 2010, total sales in the Central region declined 30.4 percent compared to the fourth quarter of 2009
but improved 7.0 percent compared to the first quarter of 2009.
Following two consecutive quarters of declines, the median sales price in the Central region increased 6.8 percent in the firstquarter of 2010 compared to last quarter. The percentage gain was 6.5 percent compared to 1Q 09.
North Central Region Perhaps due to the bad weather during the first quarter, sales in the North Central region declined by 34.5 percent compared
to the fourth quarter of 2009 but showed a 12.9 percent improvement over the first quarter of 2009. The median sales price declined for the third consecutive month to the lowest point in at least two years (-8.1 percent).
There was also a steep decline compared to the same time last year (-16.3 percent).
1,012 1,231 797 581 911 1,176 1,001 656
$246,912
$257,002
$252,874 $251,524 $253,512
$250,477
$229,105
$210,526
$200,000
$210,000
$220,000
$230,000
$240,000
$250,000
$260,000
400
500
600
700
800
900
1,000
1,100
1,200
1,300
2Q08 3Q08 4Q08 1Q09 2Q09 3Q09 4Q09 1Q10
M e d i a n S a l e s P r i c e
T o t a l S a l e s
Sales
MSP
Note: MSP excludes Greater Augusta Area 3Q 08-4Q 09
3,546 3,341 2,157 1,931 3,106 3,400 2,968 2,067
$233,816
$225,832
$212,198
$196,279
$204,257
$199,075$195,704
$209,016
$175,000
$185,000
$195,000
$205,000
$215,000
$225,000
$235,000
$245,000
1,500
2,000
2,500
3,000
3,500
4,000
2Q08 3Q08 4Q08 1Q09 2Q09 3Q09 4Q09 1Q10
M e d i a n S a l e s P r i c e
T o t a l S a l e s
Sales
MSP
8/9/2019 1Q 2010 Virginia Real Estate Report
http://slidepdf.com/reader/full/1q-2010-virginia-real-estate-report 6/9
Page 6Fourth Quarter 2009
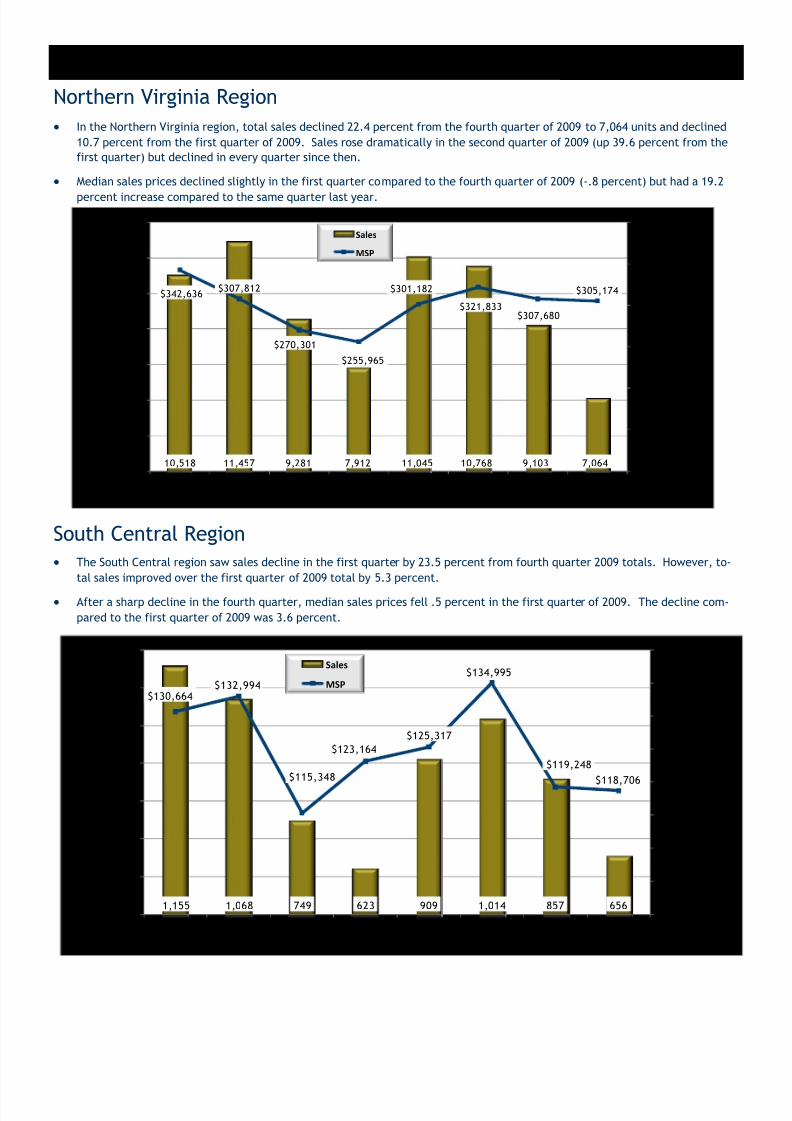
Northern Virginia Region
In the Northern Virginia region, total sales declined 22.4 percent from the fourth quarter of 2009 to 7,064 units and declined
10.7 percent from the first quarter of 2009. Sales rose dramatically in the second quarter of 2009 (up 39.6 percent from the
first quarter) but declined in every quarter since then.
Median sales prices declined slightly in the first quarter compared to the fourth quarter of 2009 (-.8 percent) but had a 19.2
percent increase compared to the same quarter last year.
South Central Region The South Central region saw sales decline in the first quarter by 23.5 percent from fourth quarter 2009 totals. However, to-
tal sales improved over the first quarter of 2009 total by 5.3 percent.
After a sharp decline in the fourth quarter, median sales prices fell .5 percent in the first quarter of 2009. The decline com-
pared to the first quarter of 2009 was 3.6 percent.
10,518 11,457 9,281 7,912 11,045 10,768 9,103 7,064
$342,636$307,812
$270,301
$255,965
$301,182
$321,833$307,680
$305,174
$100,000
$150,000
$200,000
$250,000
$300,000
$350,000
$400,000
5,000
6,000
7,000
8,000
9,000
10,000
11,000
12,000
2Q08 3Q08 4Q08 1Q09 2Q09 3Q09 4Q09 1Q10
M
e d i a n S a l e s P r i c e
T o t a l S a l e s
Sales
MSP
1,155 1,068 749 623 909 1,014 857 656
$130,664$132,994
$115,348
$123,164
$125,317
$134,995
$119,248
$118,706
$100,000
$105,000
$110,000
$115,000
$120,000
$125,000
$130,000
$135,000
$140,000
500
600
700
800
900
1,000
1,100
1,200
2Q08 3Q08 4Q08 1Q09 2Q09 3Q09 4Q09 1Q10
M e d i a n S a l e s P r i c e
T o t a l S
a l e s
Sales
MSP
8/9/2019 1Q 2010 Virginia Real Estate Report
http://slidepdf.com/reader/full/1q-2010-virginia-real-estate-report 7/9
Trends in Virginia’s Housing MarketsPage 7
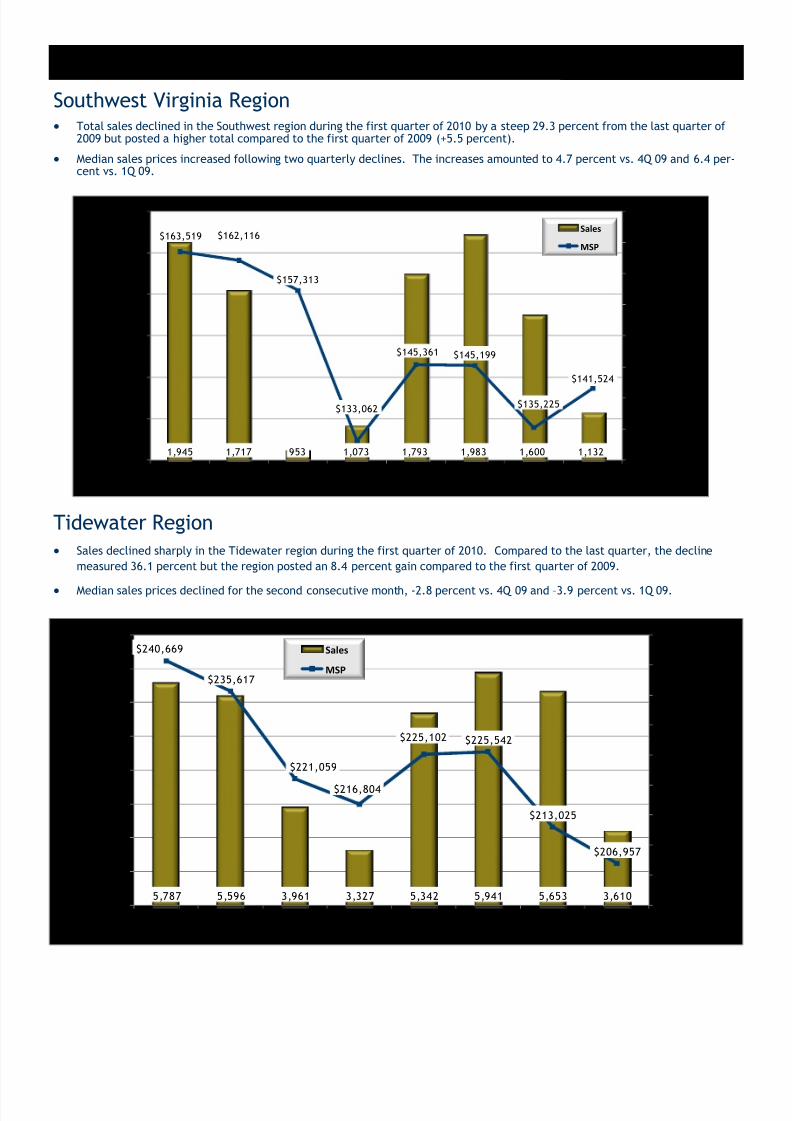
Southwest Virginia Region Total sales declined in the Southwest region during the first quarter of 2010 by a steep 29.3 percent from the last quarter of
2009 but posted a higher total compared to the first quarter of 2009 (+5.5 percent).
Median sales prices increased following two quarterly declines. The increases amounted to 4.7 percent vs. 4Q 09 and 6.4 per-cent vs. 1Q 09.
Tidewater Region Sales declined sharply in the Tidewater region during the first quarter of 2010. Compared to the last quarter, the decline
measured 36.1 percent but the region posted an 8.4 percent gain compared to the first quarter of 2009.
Median sales prices declined for the second consecutive month, -2.8 percent vs. 4Q 09 and –3.9 percent vs. 1Q 09.
5,787 5,596 3,961 3,327 5,342 5,941 5,653 3,610
$240,669
$235,617
$221,059
$216,804
$225,102 $225,542
$213,025
$206,957
$200,000
$205,000
$210,000
$215,000
$220,000
$225,000
$230,000
$235,000
$240,000
$245,000
2,500
3,000
3,500
4,000
4,500
5,000
5,500
6,000
6,500
2Q08 3Q08 4Q08 1Q09 2Q09 3Q09 4Q09 1Q10
M e d i a n S
a l e s P r i c e
T o t a l S a l e s
Sales
MSP
1,945 1,717 953 1,073 1,793 1,983 1,600 1,132
$163,519 $162,116
$157,313
$133,062
$145,361 $145,199
$135,225
$141,524
$130,000
$135,000
$140,000
$145,000
$150,000
$155,000
$160,000
$165,000
$170,000
900
1,100
1,300
1,500
1,700
1,900
2,100
2Q08 3Q08 4Q08 1Q09 2Q09 3Q09 4Q09 1Q10
M e d i a n S a l e s P r i c e
T o t a l S a l e s
Sales
MSP

8/9/2019 1Q 2010 Virginia Real Estate Report
http://slidepdf.com/reader/full/1q-2010-virginia-real-estate-report 8/9
Page 8Fourth Quarter 2009
Statewide Economic Backdrop Virginia’s construction starts are included in the Census Bureau’s “South Region” and the annualized total advanced 9.1 per-
cent compared to last quarter and was an impressive 23 percent ahead of first quarter figures in 2009—even with an espe-
cially harsh winter in the Commonwealth.
The total number of building permits issued in Virginia from January and February 2010 was 2,521 permits, 11.3 percent
fewer than at the same time in 2009 and 12.9 percent below the total in the first two months of 2009.
Foreclosures increased 6.1 percent in the
first quarter compared to the fourth quarter
of 2010. However, the 15,563 foreclosures
total for the quarter was 2.4 percent less
than the total this time last year.
Over 42,000 jobs were lost from Virginia’s
2009 payrolls in the first quarter, down 1.2
percent from the last quarter and also down
1.4 percent from the first quarter of 2009.
Unemployment in the state rose in March
resulting in an 8.8 percent increase quarter-
over-quarter. Compared to the rate at this
time last year of 6.4 percent, the increase
was 15.6 percent quarter-over-year.
Upper Shenandoah Valley Region Total sales declined sharply in the Upper Shenandoah Valley region during the first quarter (-28.6 percent) following two rela-
tively stable quarters. However, total sales increased 14.8 percent since the first quarter of 2009.
The median sales price declined for the third consecutive quarter (-5.9 percent vs. 4Q 09 and –6.5 percent vs. 1Q 09 to its low-est point in at least two years.
1Q10 vs. 4Q09 vs. 1Q09
Starts (South Region)1 337 9.1% 23.0%
YTD Building Permits2 2,521 -12.9% -11.3%
Foreclosures 15,563 6.1% -2.4%Non-Farm Employment
3 -42.2 -1.2% -1.4%
Unemployment Rate4 7.4 8.8% 15.6%
1 Seasonally Adjusted Annual Rate (000s); 3rd Month of Quarter2As of 2nd Month of Quarter3 Not Seasonally Adjusted (000s); 3rd Month of Quarter4 3rd Month of Quarter
Virginia Economic Indicators
816 871 679 547 798 886 880 628
$211,322
$199,088
$182,275
$169,785$170,600
$174,489
$168,405
$158,516
$150,000
$160,000
$170,000
$180,000
$190,000
$200,000
$210,000
$220,000
400
500
600
700
800
900
1,000
2Q08 3Q08 4Q08 1Q09 2Q09 3Q09 4Q09 1Q10
M e
d i a n S a l e s P r i c e
T o t a l S a l e s
Sales
MSP
8/9/2019 1Q 2010 Virginia Real Estate Report
http://slidepdf.com/reader/full/1q-2010-virginia-real-estate-report 9/9
Trends in Virginia’s Housing Markets
National Economic Backdrop
Page 9
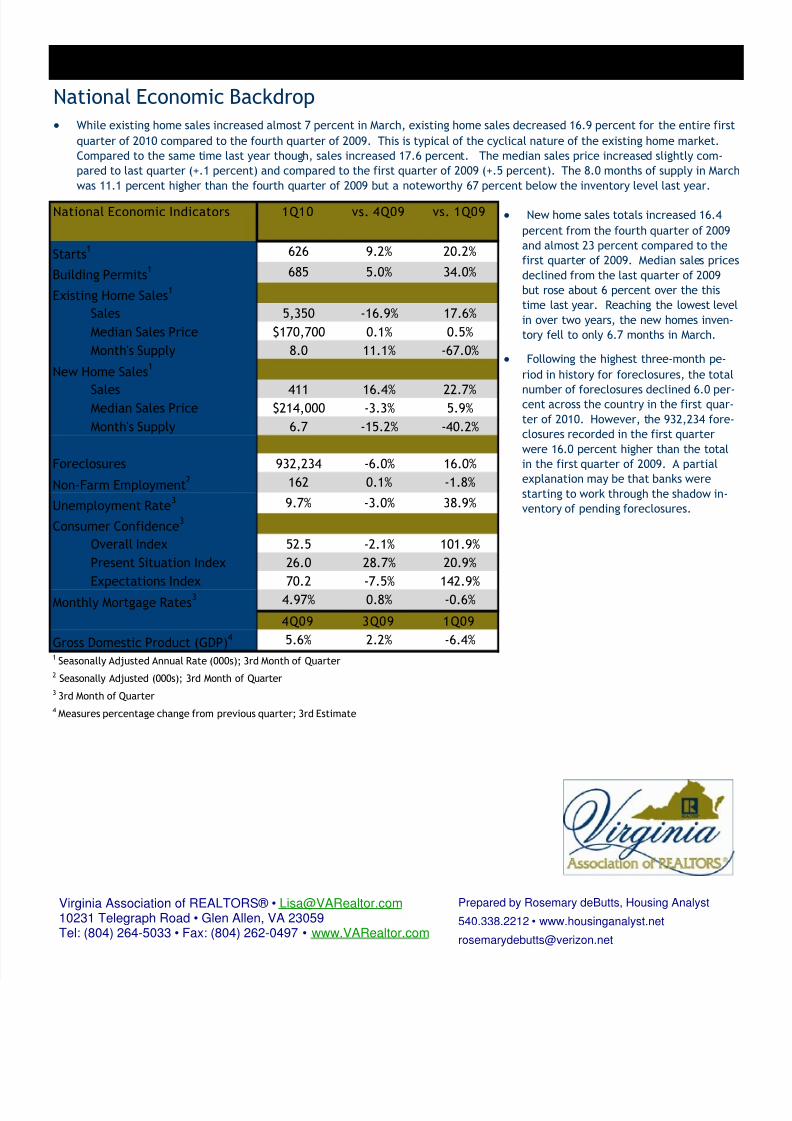
While existing home sales increased almost 7 percent in March, existing home sales decreased 16.9 percent for the entire first
quarter of 2010 compared to the fourth quarter of 2009. This is typical of the cyclical nature of the existing home market.
Compared to the same time last year though, sales increased 17.6 percent. The median sales price increased slightly com-
pared to last quarter (+.1 percent) and compared to the first quarter of 2009 (+.5 percent). The 8.0 months of supply in March
was 11.1 percent higher than the fourth quarter of 2009 but a noteworthy 67 percent below the inventory level last year.
New home sales totals increased 16.4
percent from the fourth quarter of 2009
and almost 23 percent compared to the
first quarter of 2009. Median sales prices
declined from the last quarter of 2009
but rose about 6 percent over the this
time last year. Reaching the lowest level
in over two years, the new homes inven-
tory fell to only 6.7 months in March.
Following the highest three-month pe-
riod in history for foreclosures, the total
number of foreclosures declined 6.0 per-cent across the country in the first quar-
ter of 2010. However, the 932,234 fore-
closures recorded in the first quarter
were 16.0 percent higher than the total
in the first quarter of 2009. A partial
explanation may be that banks were
starting to work through the shadow in-
ventory of pending foreclosures.
Virginia Association of REALTORS® • [email protected] 10231 Telegraph Road • Glen Allen, VA 23059Tel: (804) 264-5033 • Fax: (804) 262-0497 • www.VARealtor.com
Prepared by Rosemary deButts, Housing Analyst
540.338.2212 • www.housinganalyst.net
1Q10 vs. 4Q09 vs. 1Q09
Starts1 626 9.2% 20.2%
Building Permits1 685 5.0% 34.0%
Existing Home Sales1
Sales 5,350 -16.9% 17.6%
Median Sales Price $170,700 0.1% 0.5%
Month's Supply 8.0 11.1% -67.0%
New Home Sales1
Sales 411 16.4% 22.7%Median Sales Price $214,000 -3.3% 5.9%
Month's Supply 6.7 -15.2% -40.2%
Foreclosures 932,234 -6.0% 16.0%
Non-Farm Employment2 162 0.1% -1.8%
Unemployment Rate3 9.7% -3.0% 38.9%
Consumer Confidence3
Overall Index 52.5 -2.1% 101.9%
Present Situation Index 26.0 28.7% 20.9%
Expectations Index 70.2 -7.5% 142.9%
Monthly Mortgage Rates3 4.97% 0.8% -0.6%
4Q09 3Q09 1Q09
Gross Domestic Product (GDP)4 5.6% 2.2% -6.4%
1 Seasonally Adjusted Annual Rate (000s); 3rd Month of Quarter2 Seasonally Adjusted (000s); 3rd Month of Quarter
3 3rd Month of Quarter
4 Measures percentage change from previous quarter; 3rd Estimate
National Economic Indicators