1h nmr-based metabolic profiling of human rectal cancer tissue
TRANSCRIPT

Wang et al. Molecular Cancer 2013, 12:121http://www.molecular-cancer.com/content/12/1/121
RESEARCH Open Access
1H NMR-based metabolic profiling of humanrectal cancer tissueHuijuan Wang1, Liang Wang1, Hailong Zhang1, Pengchi Deng3, Jie Chen1, Bin Zhou2, Jing Hu1, Jun Zou1,Wenjie Lu1, Pu Xiang1, Tianming Wu1, Xiaoni Shao1, Yuan Li4, Zongguang Zhou2* and Ying-Lan Zhao1*
Abstract
Background: Rectal cancer is one of the most prevalent tumor types. Understanding the metabolic profile of rectalcancer is important for developing therapeutic approaches and molecular diagnosis.
Methods: Here, we report a metabonomics profiling of tissue samples on a large cohort of human rectal cancersubjects (n = 127) and normal controls (n = 43) using 1H nuclear magnetic resonance (1H NMR) basedmetabonomics assay, which is a highly sensitive and non-destructive method for the biomarker identification inbiological systems. Principal component analysis (PCA), partial least squares discriminant analysis (PLS-DA) andorthogonal projection to latent structure with discriminant analysis (OPLS-DA) were applied to analyze the 1H-NMRprofiling data to identify the distinguishing metabolites of rectal cancer.
Results: Excellent separation was obtained and distinguishing metabolites were observed among the differentstages of rectal cancer tissues (stage I = 35; stage II = 37; stage III = 37 and stage IV = 18) and normal controls. A totalof 38 differential metabolites were identified, 16 of which were closely correlated with the stage of rectal cancer.The up-regulation of 10 metabolites, including lactate, threonine, acetate, glutathione, uracil, succinate, serine,formate, lysine and tyrosine, were detected in the cancer tissues. On the other hand, 6 metabolites, including myo-inositol, taurine, phosphocreatine, creatine, betaine and dimethylglycine were decreased in cancer tissues. Thesemodified metabolites revealed disturbance of energy, amino acids, ketone body and choline metabolism, whichmay be correlated with the progression of human rectal cancer.
Conclusion: Our findings firstly identify the distinguishing metabolites in different stages of rectal cancer tissues,indicating possibility of the attribution of metabolites disturbance to the progression of rectal cancer. The alteredmetabolites may be as potential biomarkers, which would provide a promising molecular diagnostic approach forclinical diagnosis of human rectal cancer. The role and underlying mechanism of metabolites in rectal cancerprogression are worth being further investigated.
IntroductionColorectal cancer (CRC) is the third most frequent ma-lignancy and the fourth most common cause of cancermortality worldwide [1]. Among CRC, 65% of CRC arerectal cancer, which is located in the lower end of thecolon. Although advanced methods of diagnosis such ascomputed tomography (CT), ultrasonography (US), mag-netic resonance imaging (MRI), and treatments such as
* Correspondence: [email protected]; [email protected] of Gastrointestinal surgery, West China Hospital, West ChinaMedical School, Sichuan University, Chengdu 610041, China1State Key Laboratory of Biotherapy and Cancer Center, West China Hospital,West China Medical School, Sichuan University, 17#, 3rd Section, Ren minSouth Road, Chengdu 610041, China
© 2013 Wang et al.; licensee BioMed Central LCommons Attribution License (http://creativecreproduction in any medium, provided the or
surgery, neoadjuvant chemotherapy and radiation therapy,have been employed over the last few decades, the overallsurvival rate of patients with rectal cancer has not im-proved markedly. Tumor stage has a great influence onsurvival and is defined by UICC TNM (InternationalUnion against Cancer, Tumor Node Metastases) classifica-tion. Five-year survival rate of rectal cancer patients is93.5% for stage I, 87.4% for stage II, 58.2% for stage III,and 8.1% for stage IV [2]. The reasons that result in latediagnosis and therapy as well as disappointingly low sur-vival rate include ineffective screening tools and guide-lines, cancer detection at an advanced stage, limitedsurvival achieved with palliative chemotherapy alone forpatients with metastatic or unresectable disease. Therefore,
td. This is an open access article distributed under the terms of the Creativeommons.org/licenses/by/2.0), which permits unrestricted use, distribution, andiginal work is properly cited.
Wang et al. Molecular Cancer 2013, 12:121 Page 2 of 12http://www.molecular-cancer.com/content/12/1/121
early and accurate diagnosis of rectal cancer is critical forpatients’ survival and improving therapeutic options fordifferent stages of rectal cancer.Metabolomics is an emerging field of research down-
stream of transcriptomics, genomics, and proteomics,which mainly involves the multicomponent analysis ofbiological fluids, tissues and cell extracts. It is currentlyused as a model of research in many disciplines of medi-cine, including disease diagnosis [3,4], biomarker screening[5,6], nutritional intervention [7] and safety assessment ofchemical [8,9]. Three powerful analytical techniques arecommonly applied to assay and quantify metabolites, in-cluding liquid chromatography (LC) coupled with massspectrometry (MS), gas chromatography MS (GC/MS) andnuclear magnetic resonance (NMR) [10]. NMR has beenused extensively since 1970s. It has some advantages overMS in metabolic application, including non-destructiveanalysis, the relative ease of sample preparation, the poten-tial to identify a broad range of compounds and the cap-acity for the supply of structural information for unknowncompounds [11,12]. Until now, only several NMR-basedstudies using patient colorectal cancer tissues have beenreported [1,13]. However, the number of patient tissues inthese studies was limited, which cannot provide accurateand comprehensive information of CRC metabolites.Moreover, discriminating metabolites involved in the dif-ferent pathological stages of rectal cancer have not been in-vestigated. Therefore, it will be valuable to performmetabolic profiling of human rectal cancer tissues in aiding
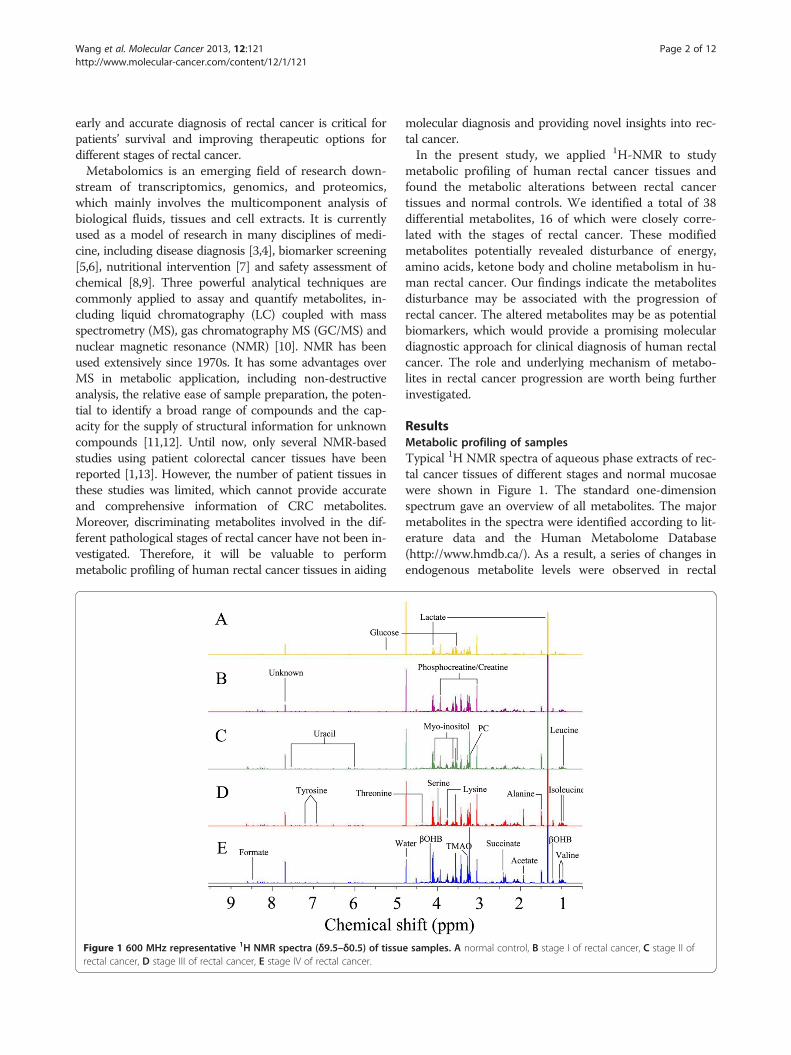
Figure 1 600 MHz representative 1H NMR spectra (δ9.5–δ0.5) of tissurectal cancer, D stage III of rectal cancer, E stage IV of rectal cancer.
molecular diagnosis and providing novel insights into rec-tal cancer.In the present study, we applied 1H-NMR to study
metabolic profiling of human rectal cancer tissues andfound the metabolic alterations between rectal cancertissues and normal controls. We identified a total of 38differential metabolites, 16 of which were closely corre-lated with the stages of rectal cancer. These modifiedmetabolites potentially revealed disturbance of energy,amino acids, ketone body and choline metabolism in hu-man rectal cancer. Our findings indicate the metabolitesdisturbance may be associated with the progression ofrectal cancer. The altered metabolites may be as potentialbiomarkers, which would provide a promising moleculardiagnostic approach for clinical diagnosis of human rectalcancer. The role and underlying mechanism of metabo-lites in rectal cancer progression are worth being furtherinvestigated.
ResultsMetabolic profiling of samplesTypical 1H NMR spectra of aqueous phase extracts of rec-tal cancer tissues of different stages and normal mucosaewere shown in Figure 1. The standard one-dimensionspectrum gave an overview of all metabolites. The majormetabolites in the spectra were identified according to lit-erature data and the Human Metabolome Database(http://www.hmdb.ca/). As a result, a series of changes inendogenous metabolite levels were observed in rectal
e samples. A normal control, B stage I of rectal cancer, C stage II of

Wang et al. Molecular Cancer 2013, 12:121 Page 3 of 12http://www.molecular-cancer.com/content/12/1/121
cancer when compared with the normal mucosa. Thesemetabolites included lactate, threonine, acetate, glutathi-one, uracil, succinate, serine, formate, lysine, tyrosine,myo-inositol, taurine, phosphocreatine, creatine, betaine,dimethylglycine, which are known to be involved in mul-tiple metabolic processes, especially in energy and aminoacid metabolism [14,15].
PR analysis of normal mucosae and rectal cancer tissuesTo determine the differences between the normal con-trols and rectal cancer tissues, we initially utilized thePCA to analyze 1H NMR data after data normalization.The results showed an apparent separation between rec-tal cancer tissues and normal controls on the scores plotof first two principal components (PC) (Figure 2A). Themajority of samples were located in 95% confidenceinterval. Therefore, all of samples were used in the fol-lowing analysis to ensure the maximum information.To optimize the separation between the rectal cancer
tissues and normal controls, of the two groups, we thenutilized the OPLS-DA to visualize the metabolic differ-ence. As shown in Figure 2B, good separation in thescores plot of PC1 and PC2 of OPLS-DA analysis wasobtained between rectal cancer tissues and normal con-trols. Moreover, model parameters in the permutation
Figure 2 Metabolite profiles between rectal cancer tissues and normarectal cancer tissues and normal controls using 1H NMR. B OPLS-DA scoresof metabolite variations between the two classes. Peaks in the positive direcomparison to normal control. Deceased metabolites in rectal cancer tissuevalidation of the corresponding PLS-DA model using permutation analysisof the model.
test for the explained variation (R2 = 0.89) and the pre-dictive capability (Q2 = 0.83) were significantly high, in-dicating a satisfactory predictive ability (Figure 2D). Toidentify the main metabolites responsible for the separ-ation between cancer tissues and normal controls, theirscores and loadings plots with correlation coefficientswere obtained from OPLS-DA analysis based on theNMR data of tissue samples (Figure 2C). The loadingswere colored according to the UV model variable weightsand showed the significant class-discriminating metabo-lites responsible for the clustering patterns. The positivesignals indicated the up-regulated metabolites in the can-cer tissues in comparison with normal controls, includinglactate, threonine, acetate, glutathione, uracil, succinate,serine, formate, lysine and tyrosine. On the other hand,the signals in the negative direction indicated the down-regulated metabolites in rectal cancer tissues, includingmyo-inositol, taurine, phosphocreatine, creatine, betaineand dimethylglycine. The significantly distinguishingmetabolites were summarized according to VIP > 1 andp < 0.05 (Table 1). According to metabolic pathway onthe Kyoto Encyclopedia of Genes and Genomes(KEGG) database (http://www.genome.jp/kegg/), weoutlined the main metabolic pathways, which areclosely related to rectal cancer morbidity. These metabolic
l controls. A PCA scores plot discriminates metabolites from theplot based on same samples. C The color map shows the significancection indicated the increased metabolites in rectal cancer tissues ins were presented as peaks in the negative direction. D Statistical(200 times). R2 is the explained variance, and Q2 is the predictive ability

Table 1 Differential Metabolites derived from OPLS-DAmodel of 1H NMR analysis between rectal cancer patientsand normal controls
Metabolites chemicalshift
Mutiplicitya Rectal cancer vs.normal control
(ppm) VIPb P-valuec FCd
1 Myo-inositol 4.06 t 4.32 <0.001 −2.00
3.55 dd 4.21 <0.001 −2.05
3.63 t 3.91 <0.001 −2.16
2 Taurine 3.27 t 4.25 <0.001 −2.10
3 α-Glucose 3.55 dd 4.21 <0.001 −2.05
5.23 dd 3.42 <0.001 −4.94
4 Phosphocreatine 3.93 s 3.56 <0.001 −2.13
3.04 s 3.30 <0.001 −2.11
5 Creatine 3.94 s 3.56 <0.001 −2.13
3.04 s 3.30 <0.001 −2.11
6 Betaine 3.89 s 2.70 <0.001 −1.89
7 Dimethylglycine 3.71 s 2.64 <0.001 −2.38
8 Glyceryl 4.3 m 2.51 <0.001 −1.45
9 Lactate 1.33 d 2.34 <0.001 1.24
4.11 q 1.55 <0.001 1.80
10 Threonine 1.33 d 2.34 <0.001 1.24
4.24 m 0.77 0.296 1.04
11 Acetate 1.93 s 2.27 0.004 2.97
12 Glutathione 2.56 m 2.19 <0.001 1.60
2.96 m 1.79 0.012 1.23
13 Uracil 7.54 d 2.16 <0.001 3.12
5.8 d 2.09 <0.001 3.27
14 Succinate 2.41 s 2.14 <0.001 1.84
15 O-acetylglycoprotein
2.07 s 1.96 <0.001 1.77
16 Dimethylamine 2.73 s 1.94 0.029 1.28
17 Leucine 0.96 t 1.73 <0.001 1.17
18 Valine 1.05 d 1.72 0.166 1.48
0.99 d 1.66 0.016 1.36
19 β-hydroxybutyrate 1.2 d 1.69 <0.001 2.05
4.16 m 0.57 0.565 1.04
20 Formate 8.45 s 1.67 0.001 1.43
21 Glutamine 2.14 m 1.63 0.001 1.45
3.77 m 1.09 <0.001 1.35
22 Acetoacetate 2.28 s 1.55 0.008 1.21
23 Sarcosine 2.75 s 1.48 <0.001 1.02
24 Tyrosine 7.2 d 1.42 <0.001 −1.42
6.9 d 1.32 0.029 −1.30
25 Alanine 1.48 d 1.38 0.054 1.70
26 Acetoacetic acid 2.31 s 1.36 0.051 1.19
27 Serine 3.98 m 1.29 <0.001 1.45
Table 1 Differential Metabolites derived from OPLS-DAmodel of 1H NMR analysis between rectal cancer patientsand normal controls (Continued)
28 Isoleucine 1.01 d 1.22 0.301 1.13
0.95 t 1.20 0.002 1.16
29 Methylamine 2.59 s 1.19 0.001 1.30
30 Trimethylamine-N-oxide
3.27 s 1.11 <0.001 2.96
31 Lysine 3.77 m 1.09 <0.001 1.35
32 Acetone 2.23 s 1.06 0.445 1.08
33 PC(phosphochline) 3.21 s 1.05 <0.001 1.22aMultiplicity: s singlet, d doublet, t triplet, q quartet, dd doublet of doublets,m multiplet.bVariable importance in the projection was obtained from OPLS-DA model with athreshold of 1.0.cp-value obtained from Student’s t-test.dFold change(FC) between rectal cancers and normal controls. Fold change witha positive value indicates a relatively higher concentration present in rectalcancer patients while a negative value means a relatively lower concentration ascompared to the normal controls.
Wang et al. Molecular Cancer 2013, 12:121 Page 4 of 12http://www.molecular-cancer.com/content/12/1/121
pathways consisted of glycolysis, serine synthesis pathway,TCA cycle, amino acid metabolism, pyrimidine metabol-ism and gut flora metabolism.
PR analysis of between normal mucosae and stage-relatedrectal cancer tissuesThe differences of metabolic profiling among variousstages of rectal cancer are important for biomarker iden-tification and for accurate molecular diagnosis and ther-apy. OPLS-DA analysis was applied to distinguish themetabolites difference between normal controls and eachstage of rectal cancer tissues. The scores plots of PC1 andPC2 showed that all stages (I, II, III and IV) of rectal can-cer tissues could be clearly distinguished from normalcontrols (Figure 3A). A panel of 40 metabolites withVIP > 1 from the training set and p < 0.05 from Student’s t-test were identified and summarized (Table 2). As shown inTable 2, creatine, uracil, succinate and β-hydroxybutyratechanged along with the process of the rectal cancer.Valine, lactate, glutamine, alanine, trimethylamine-n-oxide (TMAO), lysine and PC (phosphocholine) wereincreased in all rectal cancer patients except stage I. Inter-estingly, acetate, o-acetyl glycoprotein, dimethylamine andleucine became significantly different form stage III tostage IV. Moreover, NAD, formic acid, acetone, isoleucine,acetoacetic acid, sarcosine and acetoacetate were signifi-cantly up-regulated only in stage IV in comparison withnormal controls. The corresponding loading plots basedon OPLS-DA models were presented in Figure 3B. Thecolor scale corresponded to the UV model variableweights. The relative changes in metabolites with signifi-cant correlation coefficients were a major discriminating

Figure 3 Metabolite profiles between different stages of rectal cancer tissues and normal controls. A OPLS-DA scores plots based oneach stages of rectal cancer tissues and normal controls; black triangles represent normal controls (n = 43); red diamonds represent stage I(n = 35); blue diamond’s represent stage II (n = 37); green diamonds represent stage III (n = 37); yellow diamonds represent stage IV (n = 18).B Color map showed the significance of metabolite variations between the classes. Peaks in the positive direction indicated the increasedmetabolites in rectal cancer tissues. Decreased metabolites in rectal cancer tissues were presented as peaks in the negative direction. C Statisticalvalidation of the corresponding PLS-DA models using permutation analysis (200 times). R2 is the explained variance, and Q2 is the predictive ability ofthe model. D Scores plots of OPLS-DA prediction model. 80% of samples were applied to construct the model, and then used it to predict theremaining 20% of samples.
Wang et al. Molecular Cancer 2013, 12:121 Page 5 of 12http://www.molecular-cancer.com/content/12/1/121
factor among different populations, implying the bio-chemical alterations in different morbidity.Model parameters of permutation analysis for differ-
ent stages were as follows: stage I: R2 = 0.93, Q2 = 0.87;stage II: R2 = 0.93, Q2 = 0.86; stage III: R2 = 0.93, Q2 =0.83 and stage IV: R2 = 0.95, Q2 = 0.83. These parame-ters indicated the excellence of the model (Figure 3C).To further confirm the performance of these models,80% of samples were randomly selected as trainingsamples. Prediction parameters of the remaining 20%of samples using OPLS-DA model established with thetraining samples: Normal vs stage I: R2Xcum = 0.179,R2Ycum = 0.928, Q2Ycum = 0.828; Normal vs stage II:R2Xcum = 0.19, R2Ycum = 0.92, Q2Ycum = 0.829; Normalvs stage III: R2Xcum = 0.16, R2Ycum = 0.946, Q2Ycum =0.81; Normal vs stage IV: R2Xcum = 0.16, R2Ycum =0.941, Q2Ycum = 0.754) (Figure 3D).
Trending biomarkersBiomarker identification is important for detectingthe rectal cancer formation, invasion, and metastasis.The representative metabolites with significant differ-ence between controls and rectal cancer tissues wererepresented in box-and-whisker plots (Figure 4), whichshowed the concentration ranges, median quartiles andextremes.The decrease of glucose and increase of lactate in
tumor tissues was not surprising because of the War-burg effect. The results of changes in myo-inositol andglucose in our work were consistent with a previous re-search on breast cancer [16]. Myo-inositol, a precursorin the phosphatidylinositol cycle and a source of severalsecond messengers, was decreased along with the pro-gression of rectal cancers compared with normal con-trols. The function of myo-inositol as an osmoregulator

Table 2 Metabolite changes between each stage of rectal cancers and normal controls
Metabolites chemicalshift
Mutiplicitya Normal control vs. I Normal control vs. II Normalcontrol vs. III
Normalcontrol vs. IV
(ppm) VIPb P-valuec FCd VIPb P-valuec FCd VIPb P-valuec FCd VIPb P-valuec FCd
Myo-inositol 4.06 t 3.04 <0.001 −1.90 3.35 <0.001 −1.93 3.99 <0.001 −2.17 3.16 <0.001 −2.07
3.55 dd 2.92 <0.001 −1.95 3.27 <0.001 −1.99 3.89 <0.001 −2.20 3.09 <0.001 −2.08
3.63 t 2.35 <0.001 −2.00 2.71 <0.001 −2.04 3.42 <0.001 −2.36 2.80 <0.001 −2.42
Taurine 3.27 t 3.10 <0.001 −2.01 3.37 <0.001 −2.03 3.99 <0.001 −2.28 3.18 <0.001 −2.10
α-Glucose 3.55 dd 2.92 <0.001 −1.95 3.27 <0.001 −1.99 3.89 <0.001 −2.20 3.09 <0.001 −2.08
5.23 dd 2.60 <0.001 −4.75 2.81 <0.001 −5.58 3.07 <0.001 −4.57 2.44 <0.001 −4.97
Phosphocreatine 3.93 s 3.02 <0.001 −2.34 3.10 <0.001 −2.07 3.50 <0.001 −2.09 2.91 <0.001 −2.02
3.04 s 2.74 <0.001 −2.29 2.94 <0.001 −2.15 3.36 <0.001 −2.16 2.66 <0.001 −1.71
Creatine 3.94 s 3.02 <0.001 −2.34 3.10 <0.001 −2.07 3.50 <0.001 −2.09 2.91 <0.001 −2.02
3.04 s 2.74 <0.001 −2.29 2.94 <0.001 −2.15 3.36 <0.001 −2.16 2.66 <0.001 −1.71
Glycolate 3.93 s 3.02 <0.001 −2.34 3.10 <0.001 −2.07 3.50 <0.001 −2.09 2.91 <0.001 −2.02
Betaine 3.89 s 1.97 <0.001 −1.85 2.56 <0.001 −2.10 2.57 <0.001 −1.88 1.88 <0.001 −1.62
Dimethylglycine 3.71 s 2.21 <0.001 −2.58 2.33 <0.001 −2.60 2.39 <0.001 −2.13 1.98 <0.001 −2.22
Glyceryl 4.3 m 2.32 <0.001 −1.48 2.40 <0.001 −1.46 2.59 <0.001 −1.45 1.98 <0.001 −1.38
Lactate 1.33 d 1.23 <0.001 1.27 1.84 <0.001 1.26 2.26 <0.001 1.22
4.11 q 1.13 0.004 1.73 1.52 0.001 1.88 1.52 0.001 2.22
Threonine 1.33 d 0.08 <0.001 1.21 1.23 <0.001 1.27 1.84 <0.001 1.26 2.26 <0.001 1.22
Acetate 1.93 s 2.65 <0.001 6.95 1.61 <0.001 2.96
Glutathione 2.56 m 2.49 <0.001 1.62 2.41 <0.001 1.60 2.30 <0.001 1.46 2.35 <0.001 1.81
2.96 m 1.84 <0.001 1.42 1.50 <0.001 1.39
Uracil 7.54 d 1.99 <0.001 3.04 2.58 <0.001 3.69 2.33 <0.001 2.94 2.33 <0.001 2.46
5.8 d 0.91 <0.001 3.06 1.84 <0.001 3.60 2.12 <0.001 3.45 2.19 <0.001 2.67
Succinate 2.41 s 1.05 0.004 1.48 1.15 0.005 1.68 1.93 <0.001 1.75 2.08 <0.001 3.03
O-acetyl glycoprotein 2.07 s 2.30 <0.001 2.65 1.30 0.033 1.35
Mannitol 3.69 m 1.31 0.015 −1.20 1.79 <0.001 −1.32 1.53 0.005 −1.23 1.48 <0.001 −1.46
3.88 m 1.44 <0.001 −1.31 1.68 <0.001 −1.36 1.37 0.004 −1.25 1.04 0.026 −1.24
Dimethylamine 2.73 s 1.24 0.069 1.16 1.97 <0.001 2.32
Leucine 0.96 t 1.22 0.004 1.19 1.73 <0.001 1.30
Valine 1.05 d 1.47 <0.001 3.29
0.99 d 1.84 0.011 1.31 1.59 0.023 1.37 1.46 <0.001 1.93
β-hydroxybutyrate 1.2 d 1.10 0.613 −1.07 1.55 <0.001 2.75 2.49 <0.001 2.68 1.27 0.010 1.53
Glutamine 2.14 m 1.34 0.0011 1.50 1.43 0.003 1.75
3.77 m 1.91 <0.001 1.53 1.43 <0.001 1.31 0.87 0.097 1.18
Acetoacetate 2.28 s 1.90 <0.001 1.55
Sarcosine 2.75 s 1.58 <0.001 2.15
Tyrosine 7.2 d 1.74 0.016 −1.38 1.64 0.012 −1.43 1.42 0.051 −1.28 1.31 0.004 −1.95
6.9 d 1.61 0.277 −1.21 1.40 0.275 −1.20 1.29 0.269 −1.21 1.22 0.006 −2.55
Alanine 1.48 d 1.69 0.010 1.59 1.59 0.014 1.81 1.00 0.022 2.79
Acetoacetic acid 2.31 s 1.77 <0.001 1.60
Serine 3.98 m 1.31 <0.001 1.49 1.93 <0.001 1.56 1.58 <0.001 1.38 1.63 0.004 1.29
Isoleucine 1.01 d 1.16 0.006 1.54
0.95 t 1.46 0.019 1.21
Wang et al. Molecular Cancer 2013, 12:121 Page 6 of 12http://www.molecular-cancer.com/content/12/1/121

Table 2 Metabolite changes between each stage of rectal cancers and normal controls (Continued)
Trimethylamine-N-oxide 3.27 s 1.60 <0.001 3.59 1.23 <0.001 2.73 1.67 0.008 2.09
Lysine 3.77 m 1.91 <0.001 1.53 1.43 <0.001 1.31
Acetone 2.23 s 1.34 0.003 1.49
PC(phosphochline) 3.21 s 1.68 <0.001 1.31 1.13 0.017 1.19 1.40 0.003 1.22
GPC(glycerophosphochline) 3.23 s 2.00 <0.001 1.49 1.75 <0.001 1.51 1.14 0.002 1.26 1.92 <0.001 1.35
NAD 8.83 d 1.05 0.015 3.25
9.15 d 1.55 <0.001 1.97
2-Hydroxyisobutyric acid 1.44 s 1.00 0.018 −1.18 1.17 0.007 −1.22 1.23 0.012 −1.20
Trytophan 7.29 m 1.35 0.012 −1.32 1.75 <0.001 −1.50
Formic acid 8.44 s 1.53 <0.001 1.93aMultiplicity: s singlet, d doublet, t triplet, q quartet, dd doublet of doublets, m multiplet.bVariable importance in the projection was obtained from OPLS-DA model with a threshold of 1.0.cp-value obtained from Student’s t-test.dFold change(FC) between rectal cancers and normal controls. Fold change with a positive value indicates a relatively higher concentration present in rectal cancerpatients while a negative value means a relatively lower concentration as compared to the normal controls.
Wang et al. Molecular Cancer 2013, 12:121 Page 7 of 12http://www.molecular-cancer.com/content/12/1/121
in different stages of malignant transformation could bea further explanation for our results.Many studies have found free amino acids altered in
patients with different kinds of cancer [14,17]. In ourstudy, leucine, glutamine, threonine and serine were sig-nificantly increased along with the progression of rectalcancer, which can be explained as cellular needs forhigher turnover of structural proteins in cell prolifera-tion. Sarcosine, an N-methyl derivative of the amino acidglycine, was significantly up-regulated in stage IV. Uracil
Figure 4 Box-and-whisker plots illustrating discrimination between dline in the middle portion of the box, median; bottom and top boundarieswhiskers, 5th and 95th percentiles, respectively.
is an indicator of transcription, whose increase suggestscell proliferation up-speeded. Methylamine, DMA andTMAO, the products of choline metabolism, were alsoaltered in our study,indicating the disturbance of cholinemetabolism.Based on the modified metabolites, we summarized a
related metabolic pathway of rectal cancer. As shown inFigure 5, the disturbed metabolic pathway included gly-colysis (glucose, lactate), tricarboxylic acid cycle (succin-ate), choline metabolism (TMAO, DMA, methylamine,
ifferent stages of rectal cancers and normal controls. Horizontalof boxes, 25th and 75th percentiles, respectively; lower and upper
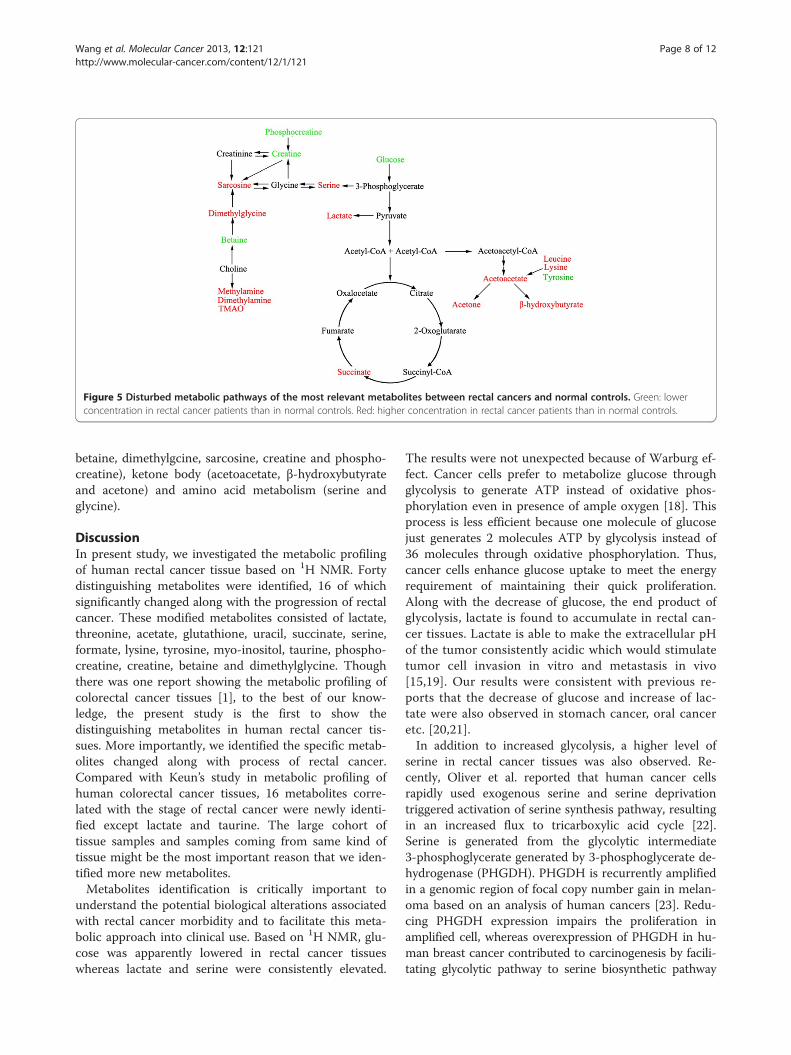
Figure 5 Disturbed metabolic pathways of the most relevant metabolites between rectal cancers and normal controls. Green: lowerconcentration in rectal cancer patients than in normal controls. Red: higher concentration in rectal cancer patients than in normal controls.
Wang et al. Molecular Cancer 2013, 12:121 Page 8 of 12http://www.molecular-cancer.com/content/12/1/121
betaine, dimethylgcine, sarcosine, creatine and phospho-creatine), ketone body (acetoacetate, β-hydroxybutyrateand acetone) and amino acid metabolism (serine andglycine).
DiscussionIn present study, we investigated the metabolic profilingof human rectal cancer tissue based on 1H NMR. Fortydistinguishing metabolites were identified, 16 of whichsignificantly changed along with the progression of rectalcancer. These modified metabolites consisted of lactate,threonine, acetate, glutathione, uracil, succinate, serine,formate, lysine, tyrosine, myo-inositol, taurine, phospho-creatine, creatine, betaine and dimethylglycine. Thoughthere was one report showing the metabolic profiling ofcolorectal cancer tissues [1], to the best of our know-ledge, the present study is the first to show thedistinguishing metabolites in human rectal cancer tis-sues. More importantly, we identified the specific metab-olites changed along with process of rectal cancer.Compared with Keun’s study in metabolic profiling ofhuman colorectal cancer tissues, 16 metabolites corre-lated with the stage of rectal cancer were newly identi-fied except lactate and taurine. The large cohort oftissue samples and samples coming from same kind oftissue might be the most important reason that we iden-tified more new metabolites.Metabolites identification is critically important to
understand the potential biological alterations associatedwith rectal cancer morbidity and to facilitate this meta-bolic approach into clinical use. Based on 1H NMR, glu-cose was apparently lowered in rectal cancer tissueswhereas lactate and serine were consistently elevated.
The results were not unexpected because of Warburg ef-fect. Cancer cells prefer to metabolize glucose throughglycolysis to generate ATP instead of oxidative phos-phorylation even in presence of ample oxygen [18]. Thisprocess is less efficient because one molecule of glucosejust generates 2 molecules ATP by glycolysis instead of36 molecules through oxidative phosphorylation. Thus,cancer cells enhance glucose uptake to meet the energyrequirement of maintaining their quick proliferation.Along with the decrease of glucose, the end product ofglycolysis, lactate is found to accumulate in rectal can-cer tissues. Lactate is able to make the extracellular pHof the tumor consistently acidic which would stimulatetumor cell invasion in vitro and metastasis in vivo[15,19]. Our results were consistent with previous re-ports that the decrease of glucose and increase of lac-tate were also observed in stomach cancer, oral canceretc. [20,21].In addition to increased glycolysis, a higher level of
serine in rectal cancer tissues was also observed. Re-cently, Oliver et al. reported that human cancer cellsrapidly used exogenous serine and serine deprivationtriggered activation of serine synthesis pathway, resultingin an increased flux to tricarboxylic acid cycle [22].Serine is generated from the glycolytic intermediate3-phosphoglycerate generated by 3-phosphoglycerate de-hydrogenase (PHGDH). PHGDH is recurrently amplifiedin a genomic region of focal copy number gain in melan-oma based on an analysis of human cancers [23]. Redu-cing PHGDH expression impairs the proliferation inamplified cell, whereas overexpression of PHGDH in hu-man breast cancer contributed to carcinogenesis by facili-tating glycolytic pathway to serine biosynthetic pathway
Wang et al. Molecular Cancer 2013, 12:121 Page 9 of 12http://www.molecular-cancer.com/content/12/1/121
[24]. These observations together with our findingsstrongly support a notion that altered serine metabol-ism leads disturbance in human rectal cancer.In our study, phosphocreatine, creatine, dimethylgcine
and betaine were down-regulated in rectal cancer tissues,and the levels of methylamines (methylamine, DMA,TMAO) and sarcosine were obviously increased. Thesemetabolites are all involved in choline metabolism path-way. Choline and its derivatives are important constitu-ents in phospholipid metabolism of cell membranes andidentified as markers of cell proliferation. Although me-thylamines, products of choline metabolism, are usuallyregarded as nontoxic substances, they could inducehepatocarcinogenesis in rats and the similar mechan-ism may exist in human [25]. Therefore, methylaminesmay indicate the disturbance of liver homeostasis indevelopment of rectal cancer. The creatine/creatinekinase (CK)/phosphocreatine system plays a key role incellular energy buffering and transport, especially in cellswith high and disturbed energy metabolism. Moreover,creatine shows significant anticancer effect against braintumor, oral squamous cell carcinoma and childhood cere-bellar tumour [20,26,27]. Sarcosine, a metabolite in cho-line metabolism pathway, is generated from glycine byglycine-N-methyl transferase. In the present study, sarco-sine was significantly enhanced, especially in stage IV ofrectal cancer tissues.Ketone bodies (KB), including acetoacetate (AcAc),
β-hydroxybutyrate (βOHB) and acetone, are importantmetabolic substrates. They are produced by liver underconditions of fasting and caloric restriction. KB eleva-tion suggests that it can provide more energy for cellproliferation and compensate the shortage of energy.Our results showed that βOHB in rectal cancer tissuesincreased 2 folds in comparison to normal controls,which was consistent with a previous study that βOHBwas significantly increased in breast cancer and colo-rectal cancer [28,29]. Moreover, we firstly found othertwo KB, AcAc and acetone, were also up-regulated inrectal cancer tissues, with increases of 1.2 and 1.1folds, respectively. βOHB is a predominant KB, whichbelongs to energy-rich compounds transporting energyfrom the liver to other tissues. A previous studyshowed that the concentration of βOHB in blood was3-flod higher than AcAc during fasting [30]. Based onour observation that βOHB changed more significantlythan other two KB, we speculated that βOHB may play acentral role in rectal cancer progression. Recently, βOHBis considered to be associated with epigenetic regulationexcept for energy carrier [31]. It acts as an endogenousand specific inhibitor of class I histone deacetylases, par-ticipating in regulating histone acetylation, gene expres-sion, and eventually promoting stress resistance. Thus,βOHB up-regulation may enhance resistance of tumor
tissue to damage and affect the survival of rectal cancerpatients.Some amino acid levels are reported higher in cancer
tissues than in normal controls [14,21] Our results wereconsistent with these studies that threonine, leucine, val-ine, glutamine, alanine, serine, isoleucine and lysine weremarkedly increased in rectal cancer tissues. The accu-mulation of amino acids in cancer cell could be attrib-uted to the uptake by cancer cells from normal organand blood through the up regulation of amino acidtransporters [32]. The disturbances of above amino acidsreflect cellular needs for higher turnover of structuralproteins in cancer cell proliferation. Uracil, an alternateof thymine, is incorporated into ribonucleic acid in tran-scription. We found that the level of uracil was appar-ently higher in the initial stages of cancer (stage I and II)and a little lower in later stages (stage III and IV),suggesting that cell proliferation may be accelerated inthe process of tumor formation.Myo-inositol is a precursor in the phosphatidylinositol
cycle and a source of several second messengers. Previ-ous studies showed that myo-inositol acts as a cancerchemoprevention agent [33,34]. In our study the de-creased myo-inositol implies neoplasia in human rectaltissue.
ConclusionsIn this study, we analyzed the metabolic profiling of rec-tal cancer tissues in comparison with normal controlsbased on 1H NMR spectroscopy combined with multi-variate statistical analysis. The metabolites distinguishingrectal cancer tissues from normal controls may be in-volved in monitoring the neoplasia, invasion and metas-tasis of tumor, and be potential biomarkers in treatmentof cancer. This opened a window of opportunity to im-prove diagnosis and treatment of malignant tumor forsurgeons and patients.
MethodsStudy populations and sample collectionA total of 127 rectal cancer patients were recruited fromWest China Hospital of Sichuan University during 2009to 2010. The patients enrolled in this study did not re-ceive any neoadjuvant chemotherapy or radiation ther-apy before surgical treatment. The clinical informationof patients was summarized in Table 3. The rectal cancertissue histology, tumor grade, TNM, Duke Stages waspresented in Table 3. And the nutritional status of thepatients, body weight and weight loss were provided(Additional file 1: Table S1). The survival rate of pa-tients enrolled in this study was also provided (Additionalfile 2: Figure S1). As shown in Table 3, the stage of all tis-sue specimens was determined according with the Ameri-can Joint Committee on Cancer (AJCC) for rectal tumors:

Table 3 Clinical information of rectal cancer patients usedin this study
Rectal cancer patients Normal controls
Number 127 43
Age (median,range) 55 28-86 56 35-85
Male/female ration 69/58 16/27
Histology Adenocarcinoma(127) ∕
Pathologic grade ∕
PD 36
MD 80
WD 7
NA 4
Cancer stage/Duke ∕
I/A(35) T1N0M0(10)
T2N0M0(25)
II/B(37) T3N0M0(37)
III/C(37) T2N1aM0(3)
T2N2aM0(2)
T3N1aM0(16)
T3N1bM0(8)
T3N2aM0(4)
T3N2bM0(4)
IV/D(18) T3N0M1a(1)
T3N1aM1a(1)
T3N1bM1a(5)
T3N2aM1a(5)
T3N2bM1a(5)
T4aN2bM1a(1)
Metastatic site ∕
I 35(0)
II 37(0)
III 37(lymph node)
IV 18(liver)
PD poorly differentiated.MD moderately differentiated.WD well-differentiated.NA not applicable.
Wang et al. Molecular Cancer 2013, 12:121 Page 10 of 12http://www.molecular-cancer.com/content/12/1/121
stage I, 35 patients; stage II, 37 patients; stage III, 37 pa-tients; stage IV, 18 patients. The protocols outlined in thefollowing text were approved by the Ethics Committee ofWest China Hospital of Sichuan University. The informedconsents were obtained from all patients prior to samplecollection.Tumor specimens and adjacent normal-appearing tis-
sues at least 5–10 cm away from the edges of a tumorwere collected from rectal cancer patients undergoingcolorectal resection according to procedure reportedpreviously [35]. In total, 170 tissue samples were obtainedfrom patients. The tissues dissected by a senior pathologist
in the operating room were immediately frozen in liquidnitrogen and stored at −80°C. The clinical diagnosis, tumorstage, histology differentiation and resection margin weredetermined by routine histopathology examination of H &E stained specimens by a blinded pathologist.
Sample preparationThe frozen tissue samples ranged from 150 to 400 mg wereweighed and suspended in methanol (4 ml per gram of tis-sue) and double distilled water (0.85 ml per gram of tissue).After vortex, chloroform (2 ml per gram of tissue) wasadded, followed by addition of 50% chloroform (2 ml pergram of tissue). The suspension was left on ice for 30 min,and centrifugated at 1,000 g for 30 min at 4°C. This pro-cedure separated suspension into three phases: a waterphase at the top, a denatured proteins phase in the middle,and a lipid phase at the bottom. The upper phase (aqueousphase) of each sample was collected and evaporated todryness under a stream of nitrogen. The residue wasreconstituted with 580 μl of D2O containing 30 μMphosphate buffer solution (PBS, pH = 7.4) and 0.01 mg/mlsodium (3-trimethylsilyl)-2, 2, 3, 3-tetradeuteriopropionate(TSP) as a chemical shift reference (δ0.0). After centrifugedat 12,000 g for 5 min, the 550 μl supernatant was trans-ferred into a 5-mm NMR tube for NMR spectroscopy [36].
1H-NMR spectroscopic analysisAll tissue samples were analyzed by 1H-NMR spectros-copy at 300 K using a Bruker Avance II 600 spectrometeroperating (Bruker Biospin, Germany) at 600.13 MHz. Aone-dimensional spectrum was acquired by using a stand-ard (1D) Carr-Purcell-Meiboom-Gill (CPMG) pulse se-quence to suppress the water signal with a relaxationdelay of 5 sec. Sixty-four free induction decays (FIDs) werecollected into 64 K data points with a spectral width of12,335.5-Hz spectral, an acquisition time of 2.66 sec, anda total pulse recycle delay of 7.66 sec. The FIDs wereweighted by a Gaussian function with line-broadening fac-tor −0.3 Hz, Gaussian maximum position 0.1, prior toFourier transformation [37].
Pattern recognition (PR) analysisThe raw NMR data has been manually Fourier transformedusing MestReNova-6.1.1-6384 software before data pro-cessing. All of the 1H NMR spectra were corrected forphase and baseline distortions using MestReNova-6.1.1-6384 software. 1H NMR spectra of tissue sampleswere referenced to the TSP resonance at δ0.0. The spectrumranging from 9.5 to 0.5 ppm was divided into 4500 integralsegments of equal length (0.002 ppm). The area under thespectrum was calculated for each segmented region andexpressed as an integral value. The region 4.9–4.6 ppm wasremoved for excluding the effect of imperfect water signal.Moreover, the integrated data were normalized before

Wang et al. Molecular Cancer 2013, 12:121 Page 11 of 12http://www.molecular-cancer.com/content/12/1/121
multivariate statistical analysis to eliminate the dilutionor bulk mass differences among samples due to the dif-ferent weight of tissue, and to give the same total inte-gration value for each spectrum.For multivariate statistical analysis, the normalized
NMR data were imported into SIMCA-P + 11 (Umetrics,AB). The principal component analysis (PCA) was ini-tially applied to analyze the NMR spectral data to separ-ate the tumor samples from the normal samples. Thedata were visualized using the principal component (PC)score plots to identify general trends and outliers. Or-thogonal projection to latent structure with discriminantanalysis (OPLS-DA) was subsequently used to improvethe separation. R2 and Q2 values were used to assess theamount of variation represented by the principal compo-nents and robustness of the model, respectively. ThePLS-DA models were cross-validated by a permutationanalysis (200 times) [38,39]. The default 7-round cross-validation was applied with 1/seventh of the samples be-ing excluded from the mathematical model in eachround, in order to guard against over fitting. The modelcoefficients locate the NMR variables associated withspecific interventions as y variables. The model coeffi-cients were then back-calculated from the coefficientsincorporating the weight of the variables in order to en-hance interpretability of the model: in the coefficientplot, the intensity corresponds to the mean-centeredmodel (variance) and the color-scale derives from theunit variance-scaled model (correlation). The coefficientplots were generated with Matlab scripts with some in-house modifications and were color-coded with the ab-solute value of coefficients (r) [40,41].To identify the variables contributed to the assignment
of spectra between tumor tissues and normal controls, thevariable importance in the projection (VIP) values of allpeaks from OPLS-DA models was analyzed, and variableswith VIP > 1 were considered relevant for group discrim-ination. Moreover, unpaired Student’s t-test (p < 0.05) tothe chemical shifts was also used to assess the significanceof each metabolite. Only both VIP > 1 of multivariate andp < 0.05 of univariate statistical significance were identifiedas distinguishing metabolites. The corresponding chemicalshift and multiplicity of the metabolites were identified bycomparisons with the previous literatures and the HumanMetabolome Database (http://www.hmdb.ca/), a web-based bioinformatics/cheminformatics resource withdetailed information about metabolites and metabolicenzymes.
Additional files
Additional file 1: Table S1. The added clinical information for Rectalcancer patients used in this study. Weight and height were then used tocalculate body mass index (BMI: weight [kg]/height [m2]), which was
further categorized according to the World Health Organization’s age-and sex-adjusted criteria. BMI < 18.5: undernourished; 18.5 < BMI < 24.9:normal weight; 25 < BMI < 29.9: overweight; BMI > 30: obese. Weight losswas defined as loss of more than 5% pre-illness weigh.
Additional file 2: Figure S1. The survival rate of patients enrolled inthis study until Aug, 2013. Initial stages: stage I and II; later stages: stageIII and IV.
Competing interestsThe authors declare that they have no competing interests.
Authors’ contributionsConception and design: HW, YLZ. Financial support: YLZ. Collection andprocess of samples: HW, LW, JC, BZ, PX, TW, XS, YL, ZZ. Collection andanalyze the 1H NMR data: HW, PD. Manuscript writing: HW, YLZ. Perform themultivariate analysis and drafte: HW, HZ, JZ. All of authors read and approvedthe final manuscript.
AcknowledgmentsThis work was supported by National S&T Major project (2011ZX09102-001-013 and 2012ZX09501001-003), Program for New Century Excellent Talentsin University (NSET-11-0360) and Project of the National Natural SciencesFoundation of China (81272459).
Author details1State Key Laboratory of Biotherapy and Cancer Center, West China Hospital,West China Medical School, Sichuan University, 17#, 3rd Section, Ren minSouth Road, Chengdu 610041, China. 2Department of Gastrointestinalsurgery, West China Hospital, West China Medical School, Sichuan University,Chengdu 610041, China. 3Analytical & Testing Center, Sichuan University,Chengdu 610041, China. 4Department of Pediatric Surgery, West ChinaHospital, West China Medical School, Sichuan University, Chengdu 610041,China.
Received: 3 July 2013 Accepted: 18 September 2013Published: 18 October 2013
References1. Chan ECY, Koh PK, Mal M, Cheah PY, Eu KW, Backshall A, Cavill R, Nicholson JK,
Keun HC: Metabolic profiling of human colorectal cancer using high-resolution magic angle spinning nuclear magnetic resonance (HR-MASNMR) spectroscopy and gas chromatography mass spectrometry (GC/MS).J Proteome Res 2008, 8:352–361.
2. Boras Z, Kondza G, Sisljagic V, Busic Z, Gmajnic R, Istvanic T: Prognosticfactors of local recurrence and survival after curative rectal cancersurgery: a single institution experience. Coll Antropol 2012, 36:1355–1361.
3. Claudino WM, Quattrone A, Biganzoli L, Pestrin M, Bertini I, Di Leo A:Metabolomics: available results, current research projects in breastcancer, and future applications. J Clin Oncol 2007, 25:2840–2846.
4. Yang J, Xu G, Hong Q, Liebich HM, Lutz K, Schmülling R-M, Wahl HG:Discrimination of type 2 diabetic patients from healthy controls byusing metabonomics method based on their serum fatty acid profiles.J Chromatogr B 2004, 813:53–58.
5. Xue R, Lin Z, Deng C, Dong L, Liu T, Wang J, Shen X: A serummetabolomic investigation on hepatocellular carcinoma patients bychemical derivatization followed by gas chromatography/massspectrometry. Rapid Commun Mass Spectrom 2008, 22:3061–3068.
6. Bogdanov M, Matson WR, Wang L, Matson T, Saunders-Pullman R, Bressman SS,Beal MF: Metabolomic profiling to develop blood biomarkers for Parkinson’sdisease. Brain 2008, 131:389–396.
7. Bertram HC, Hoppe C, Petersen BO, Duus J, Molgaard C, Michaelsen KF: AnNMR-based metabonomic investigation on effects of milk and meatprotein diets given to 8-year-old boys. Br J Nutr 2007, 97:758–763.
8. Shi C, A-M CAO, H-Z SHENG, X-Z YAN, M-Y LIAO: NMR-spectroscopy-basedmetabonomic approach to the analysis of Bay41-4109, a novel anti-HBVcompound, induced hepatotoxicity in rats. Toxicol Lett 2007, 173:161–167.
9. Wei L, Liao P, Wu H, Li X, Pei F, Li W, Wu Y: Toxicological effects ofcinnabar in rats by NMR-based metabolic profiling of urine and serum.Toxicol Appl Pharmacol 2008, 227:417–429.

Wang et al. Molecular Cancer 2013, 12:121 Page 12 of 12http://www.molecular-cancer.com/content/12/1/121
10. Kaddurah-Daouk R, Kristal BS, Weinshilboum RM: Metabolomics: a globalbiochemical approach to drug response and disease. Annu Rev PharmacolToxicol 2008, 48:653–683.
11. Ward JL, Baker JM, Beale MH: Recent applications of NMR spectroscopy inplant metabolomics. FEBS J 2007, 274:1126–1131.
12. Krishnan P, Kruger N, Ratcliffe R: Metabolite fingerprinting and profiling inplants using NMR. J Exp Bot 2005, 56:255–265.
13. Piotto M, Moussallieh F-M, Dillmann B, Imperiale A, Neuville A, BrigandC, Bellocq J-P, Elbayed K, Namer I: Metabolic characterization ofprimary human colorectal cancers using high resolution magic anglespinning 1 H magnetic resonance spectroscopy. Metabolomics 2009,5:292–301.
14. Lai HS, Lee JC, Lee PH, Wang ST, Chen WJ: Plasma free amino acid profilein cancer patients. Semin Cancer Biol 2005, 15:267–276.
15. Martinez-Zaguilan R, Seftor EA, Seftor RE, Chu Y-W, Gillies RJ, Hendrix MJ:Acidic pH enhances the invasive behavior of human melanoma cells.Clin Exp Metastasis 1996, 14:176–186.
16. Gribbestad IS, Petersen SB, Fjøsne HE, Kvinnsland S, Krane J: 1H NMRspectroscopic characterization of perchloric acid extracts from breastcarcinomas and non‐involved breast tissue. NMR Biomed 1994, 7:181–194.
17. Muscaritoli M, Conversano L, Petti M, Cascino A, Mecarocci S, Annicchiarico M,Fanelli FR: Plasma amino acid concentrations in patients with acutemyelogenous leukemia. Nutrition 1999, 15:195–199.
18. Warburg O: On the origin of cancer cells. Science 1956, 123:309–314.19. Schlappack O, Zimmermann A, Hill R: Glucose starvation and acidosis:
effect on experimental metastatic potential, DNA content and MTXresistance of murine tumour cells. Br J Cancer 1991, 64:663–670.
20. Onda T, Uzawa K, Endo Y, Bukawa H, Yokoe H, Shibahara T, Tanzawa H:Ubiquitous mitochondrial creatine kinase down regulated in oralsquamous cell carcinoma. Br J Cancer 2006, 94:698–709.
21. Hirayama A, Kami K, Sugimoto M, Sugawara M, Toki N, Onozuka H, Kinoshita T,Saito N, Ochiai A, Tomita M: Quantitative metabolome profiling of colon andstomach cancer microenvironment by capillary electrophoresis time-of-flight mass spectrometry. Cancer Res 2009, 69:4918–4925.
22. Maddocks OD, Berkers CR, Mason SM, Zheng L, Blyth K, Gottlieb E, VousdenKH: Serine starvation induces stress and p53-dependent metabolicremodelling in cancer cells. Nature 2012, 493:542–546.
23. Locasale JW, Grassian AR, Melman T, Lyssiotis CA, Mattaini KR, Bass AJ,Heffron G, Metallo CM, Muranen T, Sharfi H: Phosphoglyceratedehydrogenase diverts glycolytic flux and contributes to oncogenesis.Nat Genet 2011, 43:869–874.
24. Possemato R, Marks KM, Shaul YD, Pacold ME, Kim D, Birsoy K,Sethumadhavan S, Woo H-K, Jang HG, Jha AK: Functional genomics revealthat the serine synthesis pathway is essential in breast cancer. Nature2011, 476:346–350.
25. Lin J-K, Ho Y: Hepatotoxicity and hepatocarcinogenicity in rats fed squidwith or without exogenous nitrite. Food Chem Toxicol 1992, 30:695–702.
26. Lehnhardt FG, Bock C, Röhn G, Ernestus RI, Hoehn M: Metabolic differencesbetween primary and recurrent human brain tumors: a 1H NMRspectroscopic investigation. NMR Biomed 2005, 18:371–382.
27. Davies N, Wilson M, Harris L, Natarajan K, Lateef S, Macpherson L, Sgouros S,Grundy R, Arvanitis T, Peet A: Identification and characterisation ofchildhood cerebellar tumours by in vivo proton MRS. NMR Biomed 2008,21:908–918.
28. Ma Y, Liu W, Peng J, Huang L, Zhang P, Zhao X, Cheng Y, Qin H: A pilotstudy of gas chromatograph/mass spectrometry-based serummetabolic profiling of colorectal cancer after operation. Mol Biol Rep2010, 37:1403–1411.
29. Asiago VM, Alvarado LZ, Shanaiah N, Gowda GN, Owusu-Sarfo K, Ballas RA,Raftery D: Early detection of recurrent breast cancer using metaboliteprofiling. Cancer Res 2010, 70:8309–8318.
30. Owen O, Morgan A, Kemp H, Sullivan J, Herrera M, Cahill G Jr: Brainmetabolism during fasting. J Clin Invest 1967, 46:1589–1595.
31. Shimazu T, Hirschey MD, Newman J, He W, Shirakawa K, Le Moan N, GrueterCA, Lim H, Saunders LR, Stevens RD: Suppression of oxidative stress by β-hydroxybutyrate, an endogenous histone deacetylase inhibitor. Science2013, 339:211–214.
32. Yanagida O, Kanai Y, Chairoungdua A, Kim DK, Segawa H, Nii T, Cha SH,Matsuo H, Fukushima J, Fukasawa Y: Human L-type amino acid transporter1 (LAT1): characterization of function and expression in tumor cell lines.Biochim Biophys Acta 2001, 1514:291–302.
33. Vucenik I, Shamsuddin AM: Cancer inhibition by inositol hexaphosphate(IP6) and inositol: from laboratory to clinic. J Nutr 2003, 133:3778S–3784S.
34. Kassie F, Melkamu T, Endalew A, Upadhyaya P, Luo X, Hecht SS: Inhibitionof lung carcinogenesis and critical cancer-related signaling pathways byN-acetyl-S-(N-2-phenethylthiocarbamoyl)-l-cysteine, indole-3-carbinoland myo-inositol, alone and in combination. Carcinogenesis 2010,31:1634–1641.
35. Hong Y, Ho KS, Eu KW, Cheah PY: A susceptibility gene set for early onsetcolorectal cancer that integrates diverse signaling pathways: implicationfor tumorigenesis. Clin Cancer Res 2007, 13:1107–1114.
36. Beckonert O, Keun HC, Ebbels TM, Bundy J, Holmes E, Lindon JC, NicholsonJK: Metabolic profiling, metabolomic and metabonomic procedures forNMR spectroscopy of urine, plasma, serum and tissue extracts. Nat Protoc2007, 2:2692–2703.
37. Hu Z, Deng Y, Hu C, Deng P, Bu Q, Yan G, Zhou J, Shao X, Zhao J, Li Y:1H NMR-based metabonomic analysis of brain in rats of morphinedependence and withdrawal intervention. Behav Brain Res 2012,231:11–19.
38. Trygg J, Holmes E, Lundstedt T: Chemometrics in metabonomics.J Proteome Res 2007, 6:469–479.
39. Martin FPJ, Wang Y, Sprenger N, Yap IK, Lundstedt T, Lek P, Rezzi S,Ramadan Z, Van Bladeren P, Fay LB: Probiotic modulation of symbiotic gutmicrobial–host metabolic interactions in a humanized microbiomemouse model. Mol Syst Biol 2008, 4:157.
40. Feng J, Liu H, Bhakoo KK, Lu L, Chen Z: A metabonomic analysis of organspecific response to USPIO administration. Biomaterials 2011, 32:6558–6569.
41. Holmes E, Foxall PJ, Spraul M, Duncan Farrant R, Nicholson JK, Lindon JC:750 MHz 1H NMR spectroscopy characterisation of the complexmetabolic pattern of urine from patients with inborn errors ofmetabolism: 2-hydroxyglutaric aciduria and maple syrup urinedisease. J Pharm Biomed Anal 1997, 15:1647–1659.
doi:10.1186/1476-4598-12-121Cite this article as: Wang et al.: 1H NMR-based metabolic profiling ofhuman rectal cancer tissue. Molecular Cancer 2013 12:121.
Submit your next manuscript to BioMed Centraland take full advantage of:
• Convenient online submission
• Thorough peer review
• No space constraints or color figure charges
• Immediate publication on acceptance
• Inclusion in PubMed, CAS, Scopus and Google Scholar
• Research which is freely available for redistribution
Submit your manuscript at www.biomedcentral.com/submit