1..comp sci .labview.full
TRANSCRIPT

7/29/2019 1..COMP SCI .Labview.full
http://slidepdf.com/reader/full/1comp-sci-labviewfull 1/10
LABVIEW BASED REALTIME INTEGRATED SAFETY PARAMETERS MONITORING
OF UAV
AMIYA RANJAN PANDA1, ANGSHUMAN ROY2, UTPAL MANDAL3 & HARE KRISHNA RATHA4
1Junior Research Fellow, Integrated Test Range, Defence R&D Organization, Balasore, India
2,3,4Scientist, Integrated Test Range, Defence R&D Organization, Balasore, India
ABSTRACT
This paper describes the necessity and implementation of LabVIEW based integrated Command Transmission
System monitoring and logging system. The existing Command Transmission System did not have facility to log both
ground and flight Command Transmission System parameters simultaneously synchronized to Accumulated Time of the
Day (ATD). Moreover real time monitoring of Command Transmission System parameters was not possible. To overcome
these bottlenecks, this integrated system was conceptualized and developed based on LabVIEW. LabVIEW was used for
providing Graphical User Interface (GUI) and reduction in development time. The system can simultaneously receive data
from Onboard and Ground Command Transmission System through Ethernet and parallel port respectively. Hence all the
Command Transmission System parameters can be monitored and logged in real time. The system uses the User Datagram
Protocol (UDP) unicast Ethernet communication because it can be used when data transfer rates are more or application
transmit informative data to a destination frequently enough that a few lost segments of data are not problematic. All
computers have Ethernet ports now a days, so no extra hardware is needed other than a cable to connect instrument to the
computer. The data recorded in the logging file is used for future analysis.
KEYWORDS: Command Transmission System, LabVIEW, Ethernet Communication, Parallel Port Communication
INTRODUCTION
Command Transmission System
A newly developed Unmanned Aerial Vehicle (UAV) needs rigorous testing to satisfy all expected performance.
When testing the UAV dynamically, there are lots of uncertainties regarding the flight performance. Hence at test facility, a
flight termination system is utilized to secure the life and property. Command Transmission System (CTS) basically
involves in generation and transmission of remote command signals to the airborne flight vehicle to execute some operation
inside the vehicle as required.
Function of CT System: Command Transmission System is used for termination of flight vehicle under test.
Termination of test vehicle is mandatory if the vehicle deviates from its preset trajectory and takes different course due to
unpredictable failures of onboard system. In such cases destruct command is transmitted from ground Command
Transmission System for termination of test vehicle. The commands are transmitted when required during testing.
Commands: Command Transmission System transmits four types of commands (Command 1, Command 2,
Command 3 and Command 4). Command 1 confirms CTS link, ensures no inadvertent arming. Command 2 activates
Command 3 and Command 4. Command 3 stops flow of liquid propellant. Command 4 destroys the test vehicle. Command
1 is transmitted all the time. During termination time Command 4 is transmitted followed by Command 2 and Command 3.
Command 3 is not used in case there is no liquid propellant in the flight. Command 3 is otherwise known as Thrust
Termination command.
International Journal of Computer Science Engineeringand Information Technology Research (IJCSEITR)
ISSN 2249-6831
Vol. 3, Issue 1, Mar 2013, 1-10
© TJPRC Pvt. Ltd.

7/29/2019 1..COMP SCI .Labview.full
http://slidepdf.com/reader/full/1comp-sci-labviewfull 2/10
2 Amiya Ranjan Panda, Angshuman Roy, Utpal Mandal & Hare Krishna Ratha
Requirements
The commands transmitted by transmitter system is received and decoded by on board CTS receiver. The decoded
commands are framed and telemeter by telemetry link. The ground telemetry system, after reception of the data sends to
CTS system for validation. An integrated display application was required which could monitor all CTS related parameters
along with ground system parameters.
The developed application can monitor all the required parameters and also logs all values in specified text file with
respect to the time which is synchronized with Network Time Protocol (NTP) server and can be viewed and monitored in a
single front panel window. Previously, strip chart recorder was available for recording the issued command status from
ground Command Transmission System but that was not sufficient to monitor all the parameters received from on board
package and in this consequence; the strip chart recording system was not synchronized with ATD time. But this new system
is capable of monitoring all the Command Transmission System related parameters and on board status parameters. More
than 24 parameters are logged and monitored by this system during real-time.
System Configuration
Figure 1: System Configuration
This system takes the command status and system chain status information from the Ground Command
Transmission System through parallel port of PC and on-board CTS related parameters from Telemetry stations via server
computer to display the command received by flight vehicle through Ethernet. Telemetry stations continuously receive the
health parameters and safety parameters (Command Transmission System parameters) from on board package of the test
vehicle. Telemetry stations are geographically located at distance along surveyed path to cover the trajectory of flight.
Although data from multiple telemetry stations are received but any two of the station data are displayed for better visibility.
The system unicasts total display data to remote safety officer room.
LABVIEW
LabVIEW Implementation
Lab VIEW is an inventive graphical programming system which helps to design computer-controlled data
acquisition and analysis system [1]. LabVIEW provides an ideal scope to carry out computer-based research. The wired-
together icons to perform simple-to-understand tasks of LabVIEW make operations given below possible.

7/29/2019 1..COMP SCI .Labview.full
http://slidepdf.com/reader/full/1comp-sci-labviewfull 3/10
LabVIEW Based Realtime Integrated Safety Parameters Monitoring of UAV 3
1. Building an array
2. Parsing a string
3. Digitizing an analog voltage
Once a LabVIEW program is created and understood the modularity nature of it facilitates to include in the library
that can be used later for more complicated program.
LabVIEW Program Interface
A Lab VIEW program includes two windows, called the Front Panel and the Block Diagram.
Virtual Instruments (VI)
LabVIEW programs are called Virtual Instruments (VI) because their appearance and operation imitate physical
instruments, such as oscilloscopes and multi meters [1]. Every VI uses functions that manipulate input from the user interface or
other sources and display that information or move it to other files or other computers.
The Front Panel
Once a program is developed, the front panel acts as the face of a laboratory instrument. Front panel includes
controls and indicators, which are the interactive input and output terminals of the VI, respectively. Controls are knobs,
push buttons, dials, and other input mechanisms. Indicators are graphs, LEDs, and other output displays. Hence the front
panel is the program’s user-interface, which facilitates the interaction of:
1. Providing inputs to the program,
2. Monitoring outputs from the program as it runs.
The Block Diagram
The actual LabVIEW programming code is shown in the block diagram. It contains LabView’s well-stocked
libraries of icons that we have selected during the program development. Each icon stands for a block of underlying
executable code that performs a particular useful function. The programming is done by wiring these icons properly, so
that data flows amongst graphical images to achieve a desired function.
Lab VIEW enables us to carry out state of the art research including:
1. Instrument Control
2. Data Acquisition
3. Data Analysis
4. Data Presentation and Data Storage.
SOFTWARE IMPLEMENTATION
The developed application comprises of two units. 1. Data reception through Ethernet 2.Data reception through
parallel port. In each of the above case data reception is followed by data processing and data presentation which has
shown in figure 2.

7/29/2019 1..COMP SCI .Labview.full
http://slidepdf.com/reader/full/1comp-sci-labviewfull 4/10
4 Amiya Ranjan Panda, Angshuman Roy, Utpal Mandal & Hare Krishna Ratha
Figure 2: Data Flow in Integrated Command Transmission System Display Unit
Data Reception Through Ethernet
First the UDP socket is opened then the data reception is done. After that buffer size is matched and then the
control goes to the required unit accordingly. If the buffer size mismatch occurs then the socket is made close, otherwise
control goes to conversion unit. The data received through UDP unit is clustered together and goes to the station selector unit
where data is uncluttered and populated in the display unit. The stations are selected in the front panel window through the
drop down list control. Data from these selected telemetry stations can be shown at a time on the front panel window. The
above mentioned procedure is shown in figure 3. Apart from the above procedure, the data logging facility is available in the
application, which records Command Transmission System related data from all telemetry stations irrespective of selection.
User can log data by selecting ‘logger-on’ on front panel window. The logging unit takes the data from data reception unit
(UDP data) and writing it in a text file. The logging can be done in every hundred millisecond and also the updation on the
front panel is done at the same rate. Here, sender’s data transfer rate is greater than or equal to receiving rate.
Figure 3: Flowchart of Data Reception through Ethernet
For post flight analysis the application takes the data from the logging file to create real time flight scenario. The
data flow diagram depicting the post flight analysis is shown in figure 4.
7/29/2019 1..COMP SCI .Labview.full
http://slidepdf.com/reader/full/1comp-sci-labviewfull 5/10
LabVIEW Based Realtime Integrated Safety Parameters Monitoring of UAV 5
Figure 4: Data Flow During Post Flight Analysis
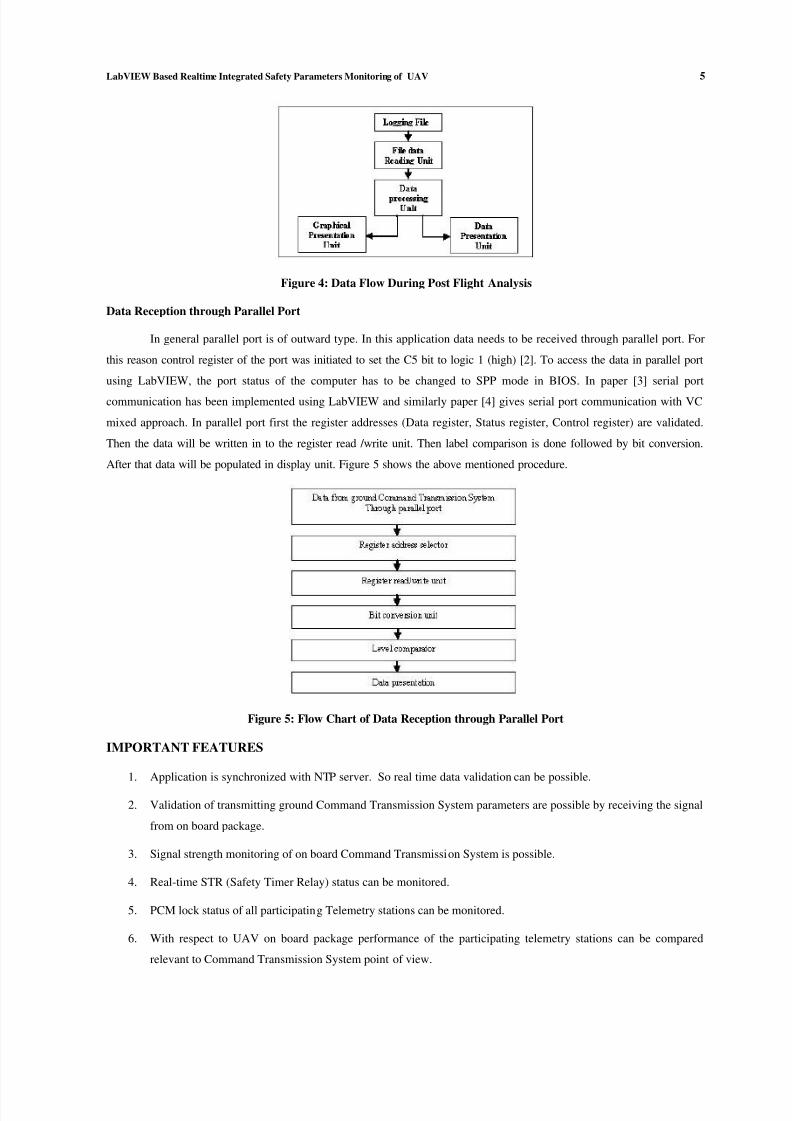
Data Reception through Parallel Port
In general parallel port is of outward type. In this application data needs to be received through parallel port. For
this reason control register of the port was initiated to set the C5 bit to logic 1 (high) [2]. To access the data in parallel port
using LabVIEW, the port status of the computer has to be changed to SPP mode in BIOS. In paper [3] serial port
communication has been implemented using LabVIEW and similarly paper [4] gives serial port communication with VC
mixed approach. In parallel port first the register addresses (Data register, Status register, Control register) are validated.
Then the data will be written in to the register read /write unit. Then label comparison is done followed by bit conversion.
After that data will be populated in display unit. Figure 5 shows the above mentioned procedure.
Figure 5: Flow Chart of Data Reception through Parallel Port
IMPORTANT FEATURES
1. Application is synchronized with NTP server. So real time data validation can be possible.
2. Validation of transmitting ground Command Transmission System parameters are possible by receiving the signal
from on board package.
3. Signal strength monitoring of on board Command Transmission System is possible.
4. Real-time STR (Safety Timer Relay) status can be monitored.
5. PCM lock status of all participating Telemetry stations can be monitored.
6. With respect to UAV on board package performance of the participating telemetry stations can be compared
relevant to Command Transmission System point of view.
7/29/2019 1..COMP SCI .Labview.full
http://slidepdf.com/reader/full/1comp-sci-labviewfull 6/10
6 Amiya Ranjan Panda, Angshuman Roy, Utpal Mandal & Hare Krishna Ratha
7. Real time sequence of commands passed from ground Command Transmission System systems can be validated.
8. Simultaneous logging of all on board and ground Command Transmission System parameters is recorded for post
flight analysis.
9. The Command Transmission System parameters can be monitored from the Logging file.
10. Ethernet link connectivity status can be monitored and unicast receiving port address can also be changed which
enhance the flexibility of the system.
11. Ground Command Transmission System chain configuration can be monitored.
12. If required, more number of telemetry stations can be incorporated into this application in future to track long
range flight.
13. Total display information can be unicasted to display in remote monitoring stations.
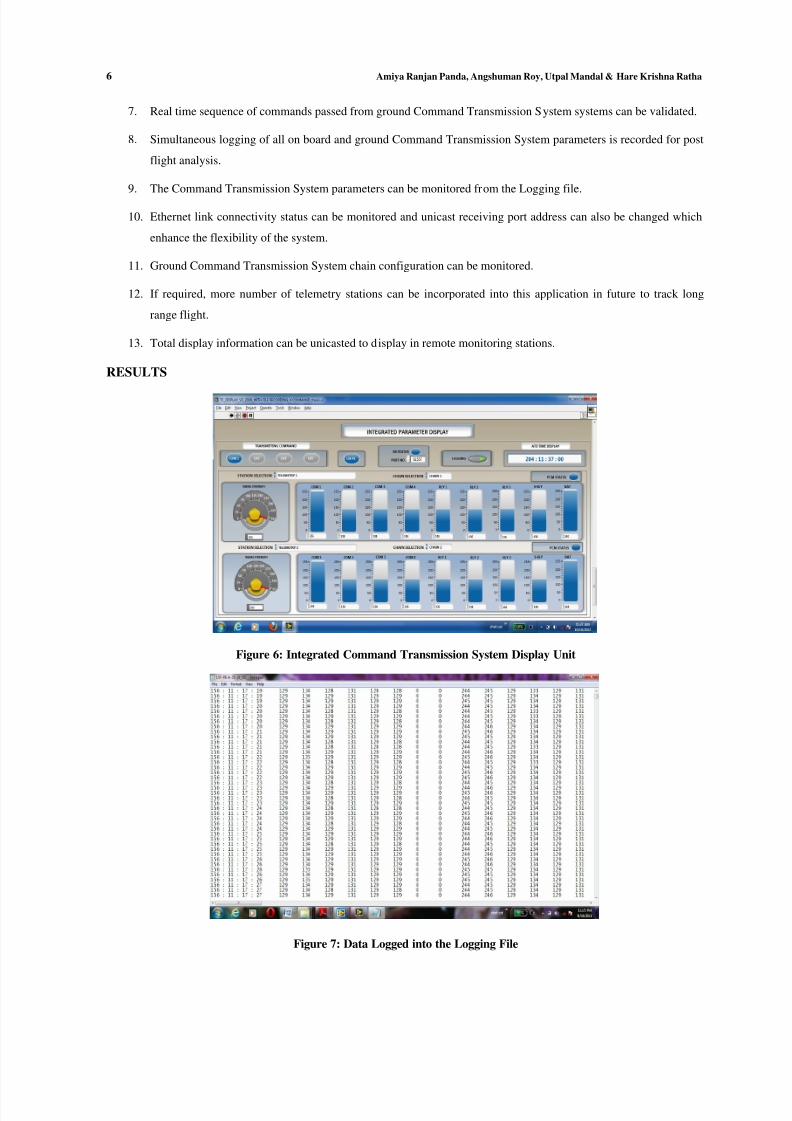
RESULTS
Figure 6: Integrated Command Transmission System Display Unit
Figure 7: Data Logged into the Logging File

7/29/2019 1..COMP SCI .Labview.full
http://slidepdf.com/reader/full/1comp-sci-labviewfull 7/10
LabVIEW Based Realtime Integrated Safety Parameters Monitoring of UAV 7
Figure 8: Block Diagram Showing Data Reception through Ethernet
Figure 9: Block Diagram Showing Data Reception through Parallel Port
Figure 6 represents the integrated Command Transmission System display unit. This is broken into different sub
window for better description purpose. Figure 7 represents the data logged into the logging file. Data are logged with
respect to ATD. Figure 8 shows the code window showing data reception through Ethernet. Figure 9 shows the code
window showing data reception through parallel port [7] [8].
Figure 10: Displaying Transmitting Command and Selected Chain
Figure 10 represents the status of command transmitted from Ground Command Transmission System and chain
configuration.
Figure 11: Selection of Telemetry Stations from Dropdown List

7/29/2019 1..COMP SCI .Labview.full
http://slidepdf.com/reader/full/1comp-sci-labviewfull 8/10
8 Amiya Ranjan Panda, Angshuman Roy, Utpal Mandal & Hare Krishna Ratha
Figure 11 represents the selection of participating Telemetry stations from the existing list of Telemetry stations
and the strength of the commands received by the on board Command Transmission System package.
Figure 12: Displaying Receiving Status, Logging Key and ATD Time
Figure 12 represents Ethernet connectivity link status, logging control switch and ATD synchronized to the NTP
server. ATD TIME DISPLAY unit displays the current system time which are synchronized to the NTP server.
Figure 13: Signal Strength Vs Time
Figure 13 is a graphical chart displaying the variation of signal strength with respect to ATD time during the
future analysis.
Figure 14: Safety Rly Vs Time
Figure 14 is a graphical chart displaying the Safety relay status during the flight test time with respect to ATD
time.This is generally analyzed during the post flight analysis.

7/29/2019 1..COMP SCI .Labview.full
http://slidepdf.com/reader/full/1comp-sci-labviewfull 9/10
LabVIEW Based Realtime Integrated Safety Parameters Monitoring of UAV 9
Figure 15: Com 1, Com 2, Com 3, Com 4 Vs Time
Figure 15 shows the graphical chart for transmission of COM 1, COM 2, COM 3, COM 4 signal with respect to
time. If the strength is one then COM 1 is transmitted and COM 1 is not transmitted if the strength is zero. This is same for
all other commands.
CONCLUSIONS
The application has been tested and validated in various test in the recent past. The system performed
satisfactorily for real time monitoring and logging. Moreover the logged data can be used for post flight analysis. This
application has also been extended to Safety Officer.
In future this facility can be multicasted to other decision making authorities for integrated monitoring of
Command Transmission System. This design approach can be implemented for other application that receives data from
multiple sources, process as per requirements, monitor, log and transmit data to other units.
REFERENCES
1. Lab VIEW 2009 by National Instruments, http://www.ni.com.
2. Lab View Graphical Programming by Gary W johnsion (TMH).
3. Amiya Ranjan Panda; Utpal Mandal; HareKrishna Ratha, “Integrated Monitoring of Encoder Status Parameters
and GUI based Remote Control Panel Using LabVIEW”, International Journal of Computer Application (0975 –
8887), Volume 43– No.3, April 2012, PP21-26.
4. Zhou Hongfu; Xiao Xinyan; Tang Yong, “Serial Communication Interface Design Based on Lab VIEW and VC
Mix Programming”, 8th International Conference on Electronic Measurement & Instruments, (ICEMI2007) PP44-
49, (in English) (ISTP/EI, INSPEC).
5. Machacek J.; Drapela J, “CONTROL OF SERIAL PORT (RS-232) COMMUNICATION IN Lab VIEW”, 9th
International Conference Modern Technique and Technologies, (MTT 2008) PP36-40.
6. Joan Marler and Frank Nezrick, 877,"Interferometer Digital Feedback and Control System", Fermi National
Accelerator Laboratory, 1998, Internal Note 877-23.

7/29/2019 1..COMP SCI .Labview.full
http://slidepdf.com/reader/full/1comp-sci-labviewfull 10/10
10 Amiya Ranjan Panda, Angshuman Roy, Utpal Mandal & Hare Krishna Ratha
7. Svinov, A.; Turygin, Y.V.; Sitar, J, “Remote control system and its development for linear asynchronous motor”,
MECHATRONIKA, 2010, 13th International Symposium, PP 105 – 108.
8. Joan Marler and Frank Nezrick, 877,"Interferometer Digital Feedback and Control System", Fermi National
Accelerator Laboratory, 1998, Internal Note 877-23.