19992004 james w. murray school of oceanography university of washington ees/igel seminar november...
TRANSCRIPT
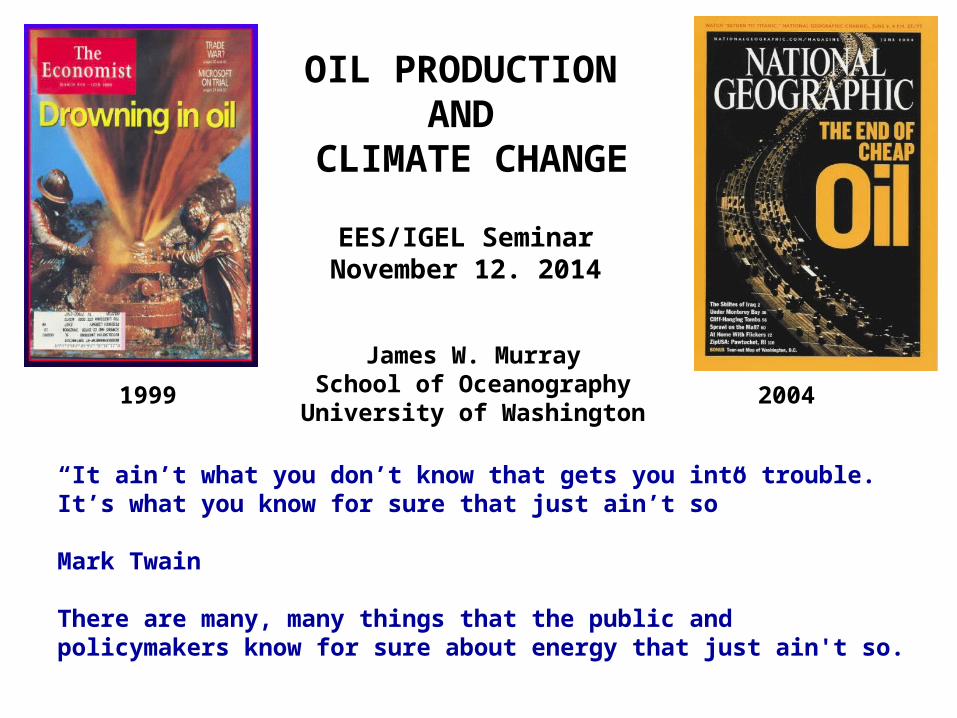
1999 2004
James W. MurraySchool of OceanographyUniversity of Washington
EES/IGEL SeminarNovember 12. 2014
OIL PRODUCTION AND
CLIMATE CHANGE
“It ain’t what you don’t know that gets you into trouble. It’s what you know for sure that just ain’t so”
Mark Twain
There are many, many things that the public and policymakers know for sure about energy that just ain't so.

To be fair to the EIA, nobody – not the White House, not the Congress, not any elected official, not any living, breathing American — wants to hear our government tell us that there are big changes ahead and that things might be considerably worse in the years ahead. Therefore, for the most part our government tries to paint an optimistic picture of the future, with minimal concern for the consequences of bad forecasts.

"We like to think that the reason we enjoy our high standards of living is because we have been so clever at figuring out how to use the world's available resources. But we should not dismiss the possibility that there may also have been a nontrivial contribution of simply having been quite lucky to have found an incredibly valuable raw material that for a century and a half or so was relatively easy to obtain."
- James D. Hamilton (Dept. of Economics, UCSD)
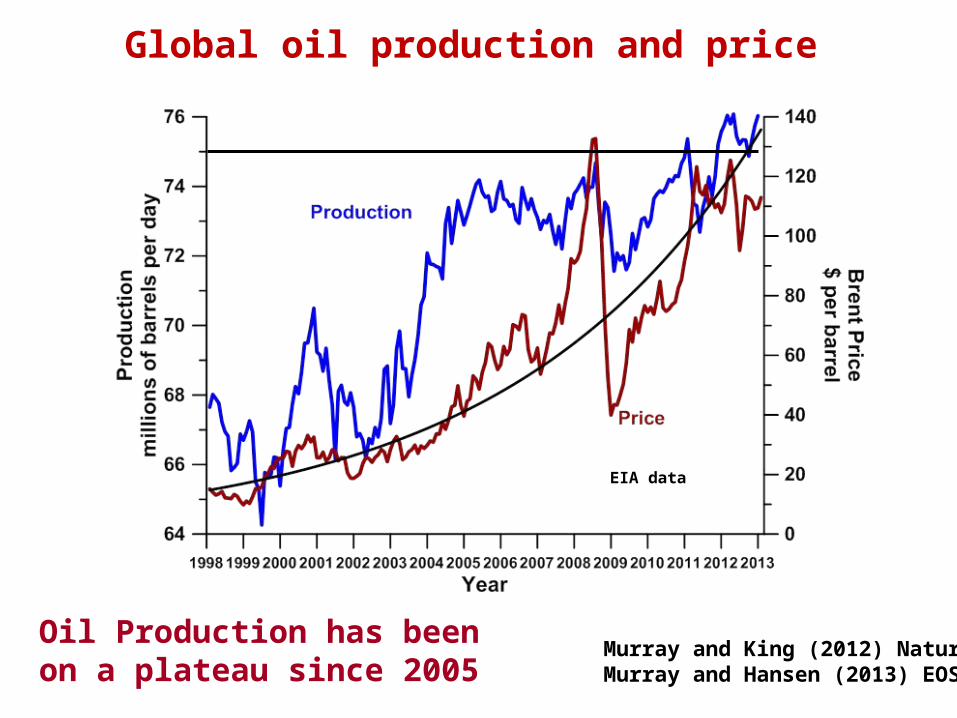
Murray and King (2012) NatureMurray and Hansen (2013) EOS
Global oil production and price
Oil Production has been on a plateau since 2005
EIA data

A Phase Shift

No Peak yet but …
Global Oil Production has been on a plateau since 2005in spite of a large increase in the price of oil.
Why the plateau?
1. Existing oil fields are in decline.2. New production is just keeping pace (so far).3. No increase in total production.

I argue that conventional oil has peaked (or will soon)!
If so the debate about “peak oil” comes down to what are the prospects for production rates from low EROI, expensive unconventional sources.

Background geology (101)Source rocks (Marine Carbon – marine plankton) (past solar energy)Maturation (Temperature and Pressure) Migration from source rocks (fine grained shales) to reservoir rocks (coarse grained sandstones & carbonates)Oil and Gas Traps

Horizontal Drilling and Hydrofracing ($$$)

What is Peak Oil?Geological Peak Oil – supply side view
Conventional oil production will reach a maximum when half the ultimate recoverable resource (URR) has been produced
US reached peak oil in 1970
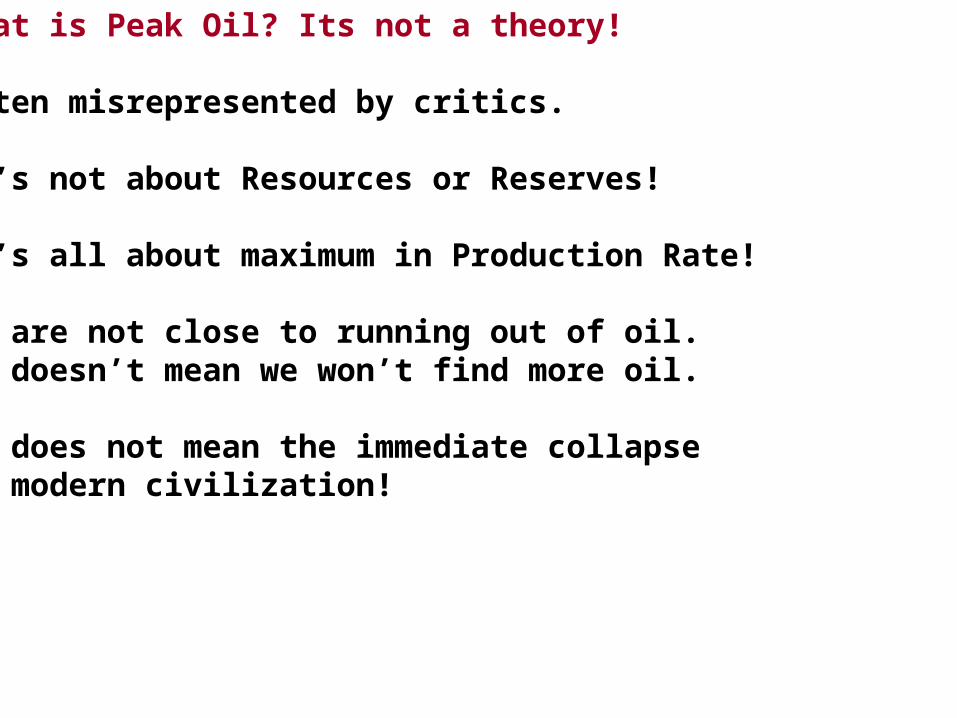
What is Peak Oil? Its not a theory!
Often misrepresented by critics.
It’s not about Resources or Reserves!
It’s all about maximum in Production Rate!
We are not close to running out of oil.It doesn’t mean we won’t find more oil.
It does not mean the immediate collapse of modern civilization!

Oil Wells and Fields Peak --- Regions Peak --- The World will peakEveryone agrees that world oil will peak – controversy on the date.Fields continue to produce after peaking, but more effort and expensewill be required.
M. King Hubbert A model logistic distribution

The Link Between Peak Oil and Climate Change

There is an ongoing Energy Policy DebateThe notion of that fossil fuel supply may be constrained has gone frombeing dismissed, to be partially accepted, to being vociferously dismissed.
The Teams:Cornucopians – the oil and gas industry, its public relations, its bankers, official agencies (EIA and IEA) that tend to parrot industry data. Respected, get lots of press and are well funded.
“Oil production will continue to increase to meet rising demand. There is no physical limit to the global supply of oil so long as the energyindustry is prepared to and allowed to apply its techno wizardry to findand produce it.”
Vs
Peakists – retired and independent petroleum geologists, academics, and energy analysts, US and German military think tanks, IMF
“Geological evidence suggests that rates of global oil productionwill soon reach a maximum then decline. The market may not be able to sustain the cost of high production of “unconventional” oil.”

Confusing Factors
1. Definitions of oil2. Resources vs Reserves vs Production3. “Proven” Reserves4. Discoveries vs Production5. Existing oil fields in decline6. Net Exports7. Energy Return on Energy Invested8. Wild Cards Technology Politics Economy

Definitions of Oil and PriceIEA – International Energy Agency (OECD, International, Paris)EIA – Energy Information Agency in US Department of Energy (US DOE)BP – British Petroleum
Definitions of OilIEA reports Crude + condensates + natural gas liquids + biofuels + processing gains = 91 mb/d
EIA reports Crude + condensates = crude oil = 76 mb/dBP reports Crude + condensate + NGL
NGL = ethane, propane, butane (not liquid)Condensates = low density HC liquids (mostly pentane; C5 to C9) No one tracks actual crude oil (API < 45)
Oil PriceBrent = $86.13NyMeX (WTI) = $81.01
1

The IEA actually admits to “Peak Oil”
The decline rates of all conventional crude-oilfields producing today is spectacular
1. Worldwide oil production will grow to 2025

Here's what's being added to underlying crude oil production and labeled as oil by the oil companies and reporting agencies:
Biofuels - Essentially ethanol and biodiesel.
Natural gas plant liquids - Butane, ethane, pentanes, propane and other non-methane components of raw natural gas.
Lease condensate - Very light hydrocarbons (C5-C9) gathered on production sites from both oil and natural gas wells, often referred to as "natural gasoline" because it can in a pinch be used to power gasoline engines though it doesn't have the octane (30 to 50) of gasoline produced at refineries.
Refinery gain - The most puzzling addition of all to crude oil supply calculations. This is merely the increase in the volume of refinery outputs such as gasoline, diesel and jet fuel versus the volume of crude oil inputs. It is due entirely to the expansion of the liquids produced, but indicates no actual gain in energy. In fact, great gobs of energy are EXPENDED in the refinery process to give us what we actually want.

Actual oil (oil with an API gravity of 45 or less per RBN Energy) production numbers are hard to find.
From Jeff Brown: Estimated crude oil production (mb/d) 2002 – 60 2006 – 65 2010 - 66 2003 – 62 2007 – 65 2011 - 65 2004 – 65 2008 – 66 2012 - 67 2005 – 67 2009 - 64

Crude Oil vs “Crude Oil”
When the industry and the government talk about the price of oil sold on world markets and traded on futures exchanges, they mean one thing. But, when they talk about the total production of oil, they actually mean something quite different--namely, a much broader category that includes all kinds of things that are simply not oil and that could never be sold on the world market as oil.
If what you're selling cannot be sold on the world market as crude oil, then it's not crude oil!

• Reserves are a very small sub-set of resources (oil in place) (overstated).• Reserves take years of development drilling to become supply.• Proved undeveloped reserves may never be developed.• Reserves (an amount) are irrelevant for production (a rate)• It is the production that is used by society
Modified from Medlock (2010)
2

0
100
200
1980 1990 2000
Pro
ved
Re
serv
es,
Gb Saudi
Iran
Iraq
Kuwait
UAE
OPEC Oil “Proven” Reserves!
• Accurate reserve estimates for OPEC countries are state secrets• Values for 1983 are accurate• No adjustment for 193Gb produced since 1980• Kuwait Example: A recent leak of Kuwait Petroleum Company documents
showed the actual reserves are only 48Gb (official reserves are 102Gb). 1980 Kuwait reserves adjusted for production since then are 55Gb
From BP Statistical Review
Not provenby anybody!
Gb = billions of barrels
3

The red box shows the average amount estimated to be discovered by the USGS each year between 1995 and 2025.USGS Forecast is way off base.
Oil discoveries have been declining since 1964.
US
MiddleEast
4
Colin Campbell

Existing oil fields are declining at 5% per year (IEA, EIA, Exxon, CERA, ASPO)
For 2010 to 2030 the world needs 46 mb/d of new production – just to maintain flat production
The IEA forecasts in 2008 projects a 10% increase in oil production between now and 2030 (from 87 to 96 mb/d) (D = +9 mb/d).
The projected growth requires discovery and production of 46 + 9 = 55 mb/d of new oil!
55 mb/d ÷ 9 mb/d = ~6 new Saudi Arabias
Existing Oil Fields are in Decline 5

Examples: Peak and Depletion is Normal

Peak and Depletion in Regions
Q. When will the world peak??
Only 14 of the 54 oil producing nations in the world do not have decreasing oil production.

Net Exports are going down
Over the last three years, consumption inside of OPEC has grown at an astounding >5% average annual rate.
6

Citigroup (2012) – Saudi Arabia will become an oil importer in 2030
Brown and Foucher,2007
Peak Oil has come to the export market

EROI = Energy Return on Invested
Net Energy = Eout – EinEROI = Eout/Ein
7
Soaring Capex!

World Oil Production
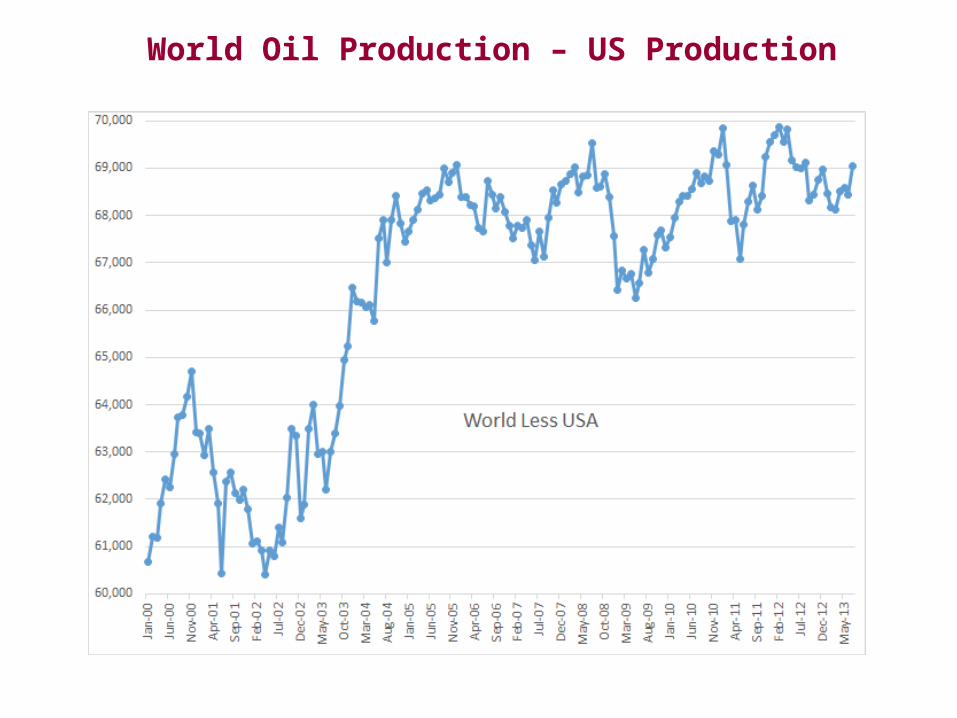
World Oil Production – US Production

USA Production
Increase due to tight oil

The Miracle of Tight Oil
What is shale? = organic rich mud to fine grained source rock= with high porosity and low permeability
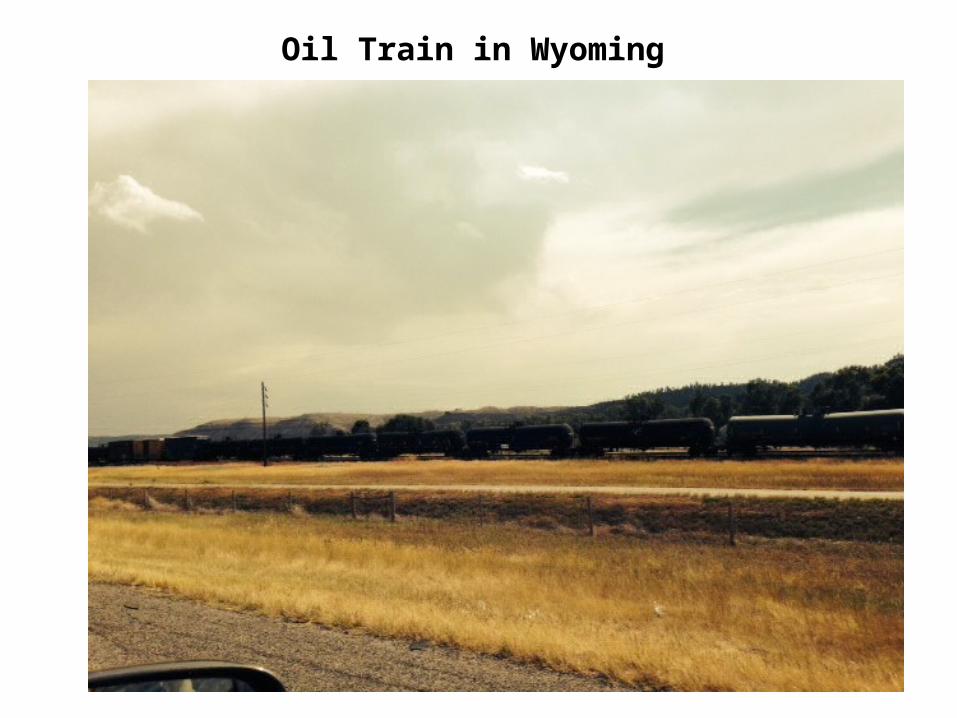
Oil Train in Wyoming

Are shale gas and tight oil game changers?
Detailed analysis by David Hughes (2013, 2014) (Post Carbon Institute) shows:
Spectacularly high early decline rates
“sweet spots” become exhausted
As a result, shale-gas production is already dropping in several key drilling regions, and production of tight oil in the top two regions is likely to peak as early as 2016 or 2017. These two regions, in Texas and North Dakota, comprise 74% of total US tight-oil production.

Bakken Formation – Hot Spots drilled first
As of March 2013, 5,047 wellsProducing 0.70 mbd140 Bbls/day/well !!
Hughes 2013
4 counties = 85%
1 3 5 7 9 11 13 15 17 19 21 23 25 27 29 31 33 35 37 39 41 43 45 470
100
200
300
400
500
600
Oil Production
Months on Production
Oil
Pro
du
ctio
n (
Bar
rels
per
Day
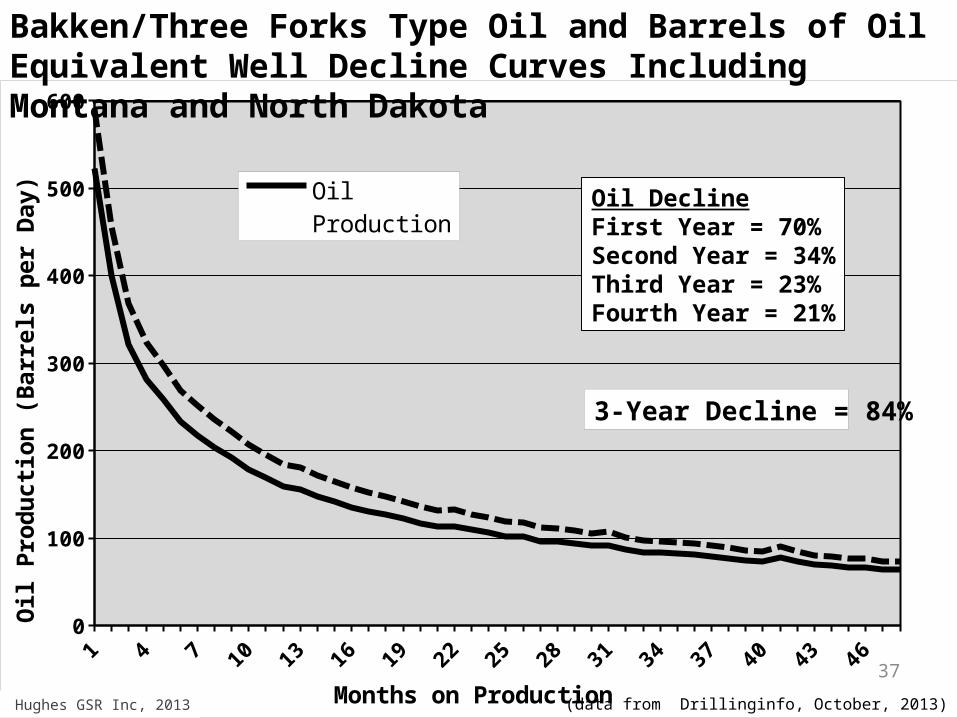
)Bakken/Three Forks Type Oil and Barrels of Oil Equivalent Well Decline Curves Including Montana and North Dakota
(data from Drillinginfo, October, 2013)© Hughes GSR Inc, 2013
Oil DeclineFirst Year = 70%Second Year = 34%Third Year = 23%Fourth Year = 21%
3-Year Decline = 84%
37

2007 2008 2009 2010 2011 2012 20130
100
200
300
400
500
600
700
0
500
1000
1500
2000
2500
3000
3500
4000
4500
5000
Total Oil ProductionNumber of pre-2012 Wells
Year
Oil
Pro
du
ctio
n (
Th
ou
san
d B
arre
ls/d
ay)
Nu
mb
er of P
rod
ucin
g W
ells
First Year Field Decline = 44%
Bakken Field Production Decline – Oil Production from all Wells Drilled Prior to 2012
© Hughes GSR Inc, 2013 (data from Drillinginfo, October, 2013)
38

A drilling treadmill required just to stay constant.
The steep declines in production require an ever increasing treadmill of new drilling just to stay constant. This Red Queen Effect (from Lewis Carroll’s “Through the Looking Glass”) states that “It takes all the running you can do, to keep in the same place!” (Likvern, 2013)
Red Queen Effect
To maintain production of 1 mb/d from Irag requires 60 new wells/year.For the same production from the Bakkan requires 2,500 new wells @ ~$10M each. Remember EROI!

Here are there are five main things to know about the shale plays.
1. They deplete very quickly. The typical shale, or tight rock, well production declines by 80% to 90% within three years. 2. They are expensive. All oil and gas coming form them is several times more expensive than what we got from conventional oil plays. 3. They are environmentally damaging because the fracking fluid is highly toxic and much of it escapes during the blowback process and sometimes water wells are contaminated. 4. Because each well has low flow and depletes quickly, massive numbers of wells must be drilled creating significant infrastructure damage to roads and bridges. Currently no state or municipal authorities are capturing anything close to the total cost of the infrastructure damage from the shale operators which means taxpayers are gong to be left paying those bills. 5. Not all shale plays are created equal – some are vastly superior to others. And even within a given play there are sweet spots and dry holes which can only be determined by punching a well in and seeing what comes out. Some call this the ‘mapping by braille’ approach.

Negative cash flow

The issue of data reporting – a serious ethical issue

Sixty-two of 73 U.S. shale drillers reported one estimate in mandatory filings with the Securities and Exchange Commission while citing higher potential figures to the public, according to data compiled by Bloomberg.

• Tight oil production from the top two plays is likely to peak in the 2016-2017 timeframe (both Hughes and EIA)
• Shale oil production has a high condensate content (~12%)(more volatile)
• High well- and field-decline rates mandate sustained high levels of drilling to maintain production.
• Sweet spots become exhausted early on in field development hence drilling rates must continually escalate to maintain production levels.
• High quality plays are not ubiquitous:
• 74% of tight oil production comes from 2 plays.
• Environmental concerns with fracking are widespread and will likely escalate with the escalating drilling treadmill needed to maintain, let alone grow, shale gas and oil production.
Shale Takeaways
44

The shale revolution did not begin because it was a good idea but
1. because more attractive opportunities were exhausted
and
2. because the market price climbed to support the cost of extraction

The prospects for crude + condensate oil production to exceed 75 mb/d are not good.
Peak Oil and Climate Change
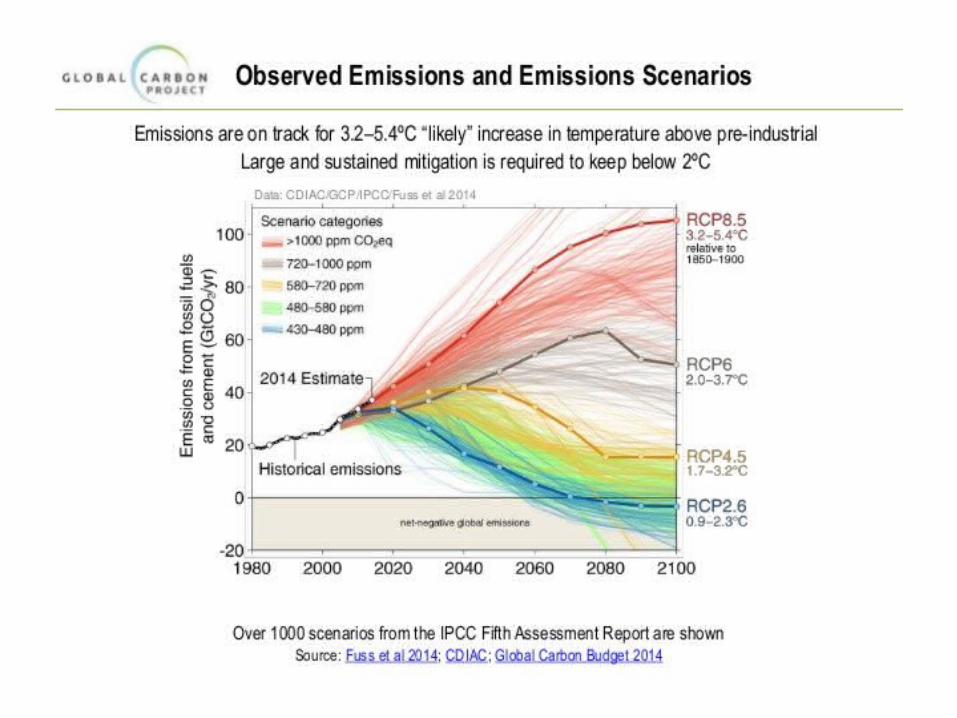


Cumulative Emissions and Scenarios
For a “likely” chance to keep warming less than 2ºC since the period 1861–1880, requires cumulative CO2 emissions to stay below 1000GtC, or 790GtC when allowing for non-CO2
Cumulative emissions 1870–2013 are 550 ±60 GtC; 70% from fossil fuels and cement, 30% from land-use changeCumulative emissions from 1750–1870 are highly uncertain, with about 50 GtC with 90% from land-use change
Source: CDIAC Data; Le Quéré et al 2013; Global Carbon Project 2013

Such trajectories are unsustainable.

Oil consumed by the SRES emission scenarios range up to 325 mb/d (for A1G AIM) in 2100 with an average maximum of 126 mb/d (Hook et al., 2010).
With present oil production on a plateau of 75 mb/d it is very unlikely that such production rates would ever be reached.
0
40
80
2000 2050 2100
Ann
ual O
il P
rodu
ctio
n, G
b
A1 AIM A1 ASF
A1 Image A1 Message
A1 Minicam A1 Maria
A1C AIM A1C Message
A1C Minicam A1G AIM
A1G Message A1G Minicam
A1V1 Minicam A1V2 Minicam
A1T AIM A1T Message
A1T Maria A2 ASF
A2 AIM A2G Image
A2 Message A2 Minicam
A2-A1 Minicam B1 Image
B1 AIM B1 ASF
B1 Message B1 Maria
B1 Minicam B1T Message
B1High Message B1High Minicam
B2 Message B2 AIM
B2 ASF B2 Image
B2 Maria B2 Minicam
B2High Minicam B2C Maria
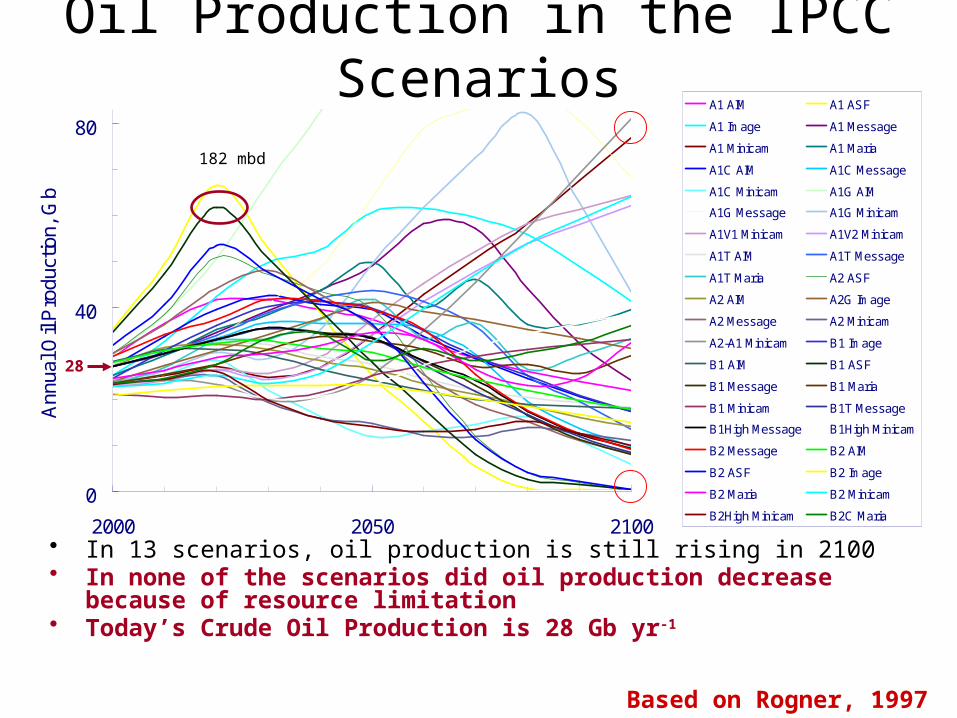
Oil Production in the IPCC Scenarios
• In 13 scenarios, oil production is still rising in 2100• In none of the scenarios did oil production decrease because of resource
limitation• Today’s Crude Oil Production is 28 Gb yr-1
28
182 mbd
Based on Rogner, 1997

The total ultimate CO2 emissions may not be as large as some estimates project.
An updated estimate of the total ultimate carbon emissions from all fossil fuels (including coal) sums to 885 Gton C (Tans and Rutledge, in prep) which is much smaller than the upper limit of 6,000 Gton C estimated by Nakicenovic (2004).

We need an energy transition to a society based on renewable energy.
We need to do it fast , but we are way behind. Today Germany’s electricity is 22% renewable and solar is about 25% of that or 5.5% of the total
We can’t drill out of this problem.We need to reduce consumption drastically.
Example: Globally we get 55 x 1018 joules of useful energy from 475 x 1018 joules of primary energy. 11% efficiency
By increasing efficiency we can get the same energy by burning less fuel
EIA projects a transition of 70 years. YIKES
