1999-2000 schools and staffing survey (sass) data file ...nces.ed.gov/pubs2004/2004303.pdf · this...
TRANSCRIPT
U.S. Department of EducationInstitute of Education SciencesNCES 2004–303
1999–2000 Schools andStaffing Survey (SASS) DataFile User’s Manual
U.S. Department of EducationInstitute of Education SciencesNCES 2004–303
1999–2000 Schools andStaffing Survey (SASS) DataFile User’s Manual
November 2004
Steven C. TourkinKathleen Wise PughSharon E. FondelierRandall J. ParmerCornette ColeBetty JacksonToni WarnerGayle WeantU.S. Bureau of the Census
Elizabeth WalterSynectics for ManagementDecisions, Inc.
Kerry Gruber andLynn ZhaoProject OfficersNational Center forEducation Statistics

U.S. Department of EducationRod PaigeSecretary
Institute of Education SciencesGrover J. WhitehurstDirector
National Center for Education StatisticsRobert LernerCommissioner
The National Center for Education Statistics (NCES) is the primary federal entity for collecting, analyzing,and reporting data related to education in the United States and other nations. It fulfills a congressionalmandate to collect, collate, analyze, and report full and complete statistics on the condition of educa-tion in the United States; conduct and publish reports and specialized analyses of the meaning andsignificance of such statistics; assist state and local education agencies in improving their statisticalsystems; and review and report on education activities in foreign countries.
NCES activities are designed to address high priority education data needs; provide consistent, reliable,complete, and accurate indicators of education status and trends; and report timely, useful, and high qualitydata to the U.S. Department of Education, the Congress, the states, other education policymakers, practitio-ners, data users, and the general public.
We strive to make our products available in a variety of formats and in language that is appropriate to avariety of audiences. You, as our customer, are the best judge of our success in communicating informationeffectively. If you have any comments or suggestions about this or any other NCES product or report, wewould like to hear from you. Please direct your comments to:
National Center for Education StatisticsInstitute of Education SciencesU.S. Department of Education1990 K Street NWWashington, DC 20006-5651
November 2004
The NCES World Wide Web Home Page is http://nces.ed.govThe NCES World Wide Web Electronic Catalog is http://nces.ed.gov/pubsearch
Suggested Citation
Tourkin, S.C., Pugh, K.W,, Fondelier, S.E., Parmer, R.J., Cole, C., Jackson, B., Warner, T., Weant, G., andWalter, E. 1999–2000 Schools and Staffing Survey (SASS) Data File User’s Manual (NCES 2004–303). U.S.Department of Education. Washington, DC: National Center for Education Statistics.
For ordering information on this report, write:
U.S. Department of EducationEDPubsP.O. Box 1398Jessup, MD 20794-1398
Or call toll free 1–877–4ED–Pubs
Content Contact:Kerry Gruber Lynn Zhao(202) 502–7349 (202) [email protected] [email protected]
iii
Preface
This volume is intended to document the data collection of the 1999–2000 Schools and Staffing Survey (SASS) and is intended for several types of readers. Researchers ready to access the data file may choose to go directly to the Electronic Codebooks on the CD-ROMs (restricted-use or public-use), which contain layout and descriptive information on all survey and sampling variables. Persons wishing to ascertain whether their research needs can be served by SASS data may find the Overview useful with descriptions of the survey’s contents and objectives. For those interested in the design and methodology of each SASS component, there are chapters on Sample Design and Implementation, Data Collection, Data Processing, Imputation Procedures, and Weighting and Variance Estimation. (Note: For the 1987–88, 1990–91, and 1993–94 SASS, both a sample design and estimation report and a data file user’s manual were published. For the 1999–2000 SASS, all material is included in this volume.)
Such persons may also find it useful to access the SASS website (http://nces.ed.gov/surveys/sass). The website includes an overview to SASS as well as sections on research issues and methods and procedures, a What’s New section describing recent data file and report releases, and another section listing all SASS releases, downloadable pdf files of all SASS questionnaires, and an Item Bank (http://nces.ed.gov/surveys/SASS/sassib) that allows users to search and view all items that appear in the 1993–94 and 1999–2000 SASS and the 1994–95 Teacher Follow-up Survey (TFS) questionnaires. We are interested in your reaction to the information presented here about the SASS data collection systems as well as the data files we release. We welcome your recommendations for improving our survey work and data products. If you have suggestions or comments or want more information, please contact us via e-mail:
[email protected] Or write us at the following address:
SASS Data Elementary/Secondary Sample Survey Studies Program Elementary/Secondary and Libraries Studies Division National Center for Education Statistics
Institute of Education Sciences 1990 K Street NW Washington, DC 20006–5651 We are also interested in the research you do using the SASS datasets. We would be pleased to receive copies of reports, working papers, and published articles using data from SASS. Send them to the address above.
iv
Acknowledgments The authors would like to thank all those who contributed to the production of the data files and this technical documentation. Kathryn Chandler, Program Chief of the Elementary Secondary Library Services Division, did extensive editing and provided overall production oversight. Stephen Broughman contributed and reviewed information on private schools and the Private School Universe Survey. Steven Kaufman provided information on the sample design and weighting procedures. Wilma Greene provided helpful guidance through the new style guidelines on the formatting of this report. Technical reviewers at the National Center for Education Statistics were Marilyn Seastrom and Tai Phan. The Education Surveys Branch of the Bureau of the Census, as the primary data collector, prepared all data files and drafted major sections of this report. The Education Surveys and Surveys Coordination Branch (ESSCB) of the Demographic Surveys Division (DSD), including Andy Zukerberg, Patrick Healy, and the entire Consumer Expenditures Programming Branch headed by Howard McGowan and assisted by Xiaodong Guan, Stella Kim, Renee Cox, and Jennifer Peterson, produced the computer edits and imputation scheme. Dennis Schwanz of the Demographic Statistical Methods Division (DSMD) provided specifications for universe creation, sample selection, decision rules for eligibility, and specifications for weighting and variances. Charles Edwards and Richard Frazier of DSMD supervised fieldwork for all universe creation aspects of SASS, Diane Probst of DSMD handled the programming of the universe creation and sample selection systems, and David Miller of DSMD handled the reinterview program.
The Education Statistics Services Institute provided technical support and reviewed data files and tables as well as created the ASCII files and Access database for the codebooks for the restricted-use and public-use Electronic Codebooks. Greg Strizek, Deanna Lyter, Michael Luekens, Sarah Kaffenberger, Erica McKnight, Erin Fox, and Kristina Dunman provided crosswalks and SPSS syntax, reviewed tables, researched discrepancies, and assisted with other tasks as needed. Elizabeth Jacinto and Dan McGrath wrote the SAS code for the ASCII data files. Technical reviewers at ESSI were Gerard Rainville and Mike Planty.
Finally, the restricted-use and public-use electronic codebooks would not be possible with the technical support of Synectics, primarily due to Shu Sun, who developed the source code. Steve Wenck provided information about the codebooks and SAS syntax for the manual, and Sameer Desale, Hannah Kyeyune, and Emmanuel Sikali developed the design effect tables.
v
Table of Contents
PREFACE....................................................................................................................................................iii ACKNOWLEDGMENTS ........................................................................................................................... iv I. OVERVIEW.............................................................................................................................................. 1
A. BACKGROUND.................................................................................................................................. 1 B. PURPOSE AND CONTENT OF THE SURVEY........................................................................................ 2
1. School District Questionnaire (Form SASS-1A)..................................................................... 2 2. School Principal Questionnaire (Forms SASS-2A, -2B, -2C, and -2D) .................................. 3 3. School Questionnaire (Forms SASS-3A, -3B, -3C, and -3D) ................................................. 4 4. School Teacher Questionnaire (Forms SASS-4A, -4B, -4C, and -4D).................................... 5 5. School Library Media Center Questionnaire (Forms LS-1A, -1B, and -1C)........................... 5 6. Teacher Follow-up Survey (TFS) (Forms TFS-1, -2, and -3).................................................. 6
C. TARGET POPULATIONS AND ESTIMATES.......................................................................................... 7 1. Target Populations ................................................................................................................... 7 2. Sampling Frame....................................................................................................................... 7 3. Sample Design ......................................................................................................................... 8 4. Estimates.................................................................................................................................. 8 5. Response Rates ........................................................................................................................ 9
D. PERIODICITY OF THE SURVEY ........................................................................................................ 10 E. CONTENTS OF THE MANUAL .......................................................................................................... 10
II. CHANGES IN SASS DESIGN, CONTENT, AND METHODOLOGY FROM 1993–94 TO
1999–2000.............................................................................................................................................. 13 A. DESIGN CHANGES .......................................................................................................................... 13 B. CONTENT CHANGES ....................................................................................................................... 13
1. Additions................................................................................................................................ 13 2. Deletions ................................................................................................................................ 14
C. PROCEDURAL CHANGES................................................................................................................. 14 1. Timing ................................................................................................................................... 14 2. SASS and PSS Concurrence .................................................................................................. 14 3. Use of Generalized Survey Design and Documentation System........................................... 15 4. Questionnaire Printing ........................................................................................................... 16 5. Questionnaire Imaging........................................................................................................... 19
D. METHODOLOGY CHANGES............................................................................................................. 19 1. Teacher Listing Form (TLF).................................................................................................. 19 2. Incentives............................................................................................................................... 19 3. Internet Reporting Option...................................................................................................... 20 4. Nonresponse Follow-up......................................................................................................... 20 5. School Locale Code Changes ................................................................................................ 21
III. PREPARATION FOR THE 1999–2000 SASS .................................................................................... 23
A. COGNITIVE INTERVIEWS ON THE SCHOOL TEACHER QUESTIONNAIRES........................................ 23 B. COGNITIVE INTERVIEWS AND SPLIT PANEL TEST ON THE TEACHER LISTING FORM .................... 24 C. 1998 SPRING FIELD TEST............................................................................................................... 24 D. 1998 FALL FIELD TEST .................................................................................................................. 27 E. FINDINGS AND ACTIONS TAKEN SUBSEQUENT TO THE 1998 FALL FIELD TEST............................ 30
vi 1999–2000 SASS Data File User’s Manual
IV. SAMPLE DESIGN AND IMPLEMENTATION................................................................................. 35 A. PUBLIC, BIA, AND PUBLIC CHARTER SCHOOLS ............................................................................ 35
1. Sampling Frames ................................................................................................................... 35 2. Allocation .............................................................................................................................. 36 3. School Sorting ....................................................................................................................... 41 4. Sample Selection ................................................................................................................... 42
B. SCHOOL DISTRICTS ........................................................................................................................ 42 C. PRIVATE SCHOOLS ......................................................................................................................... 43
1. Sampling Frames ................................................................................................................... 43 2. Allocation .............................................................................................................................. 45 3. School Sorting ....................................................................................................................... 51 4. Sample Selection ................................................................................................................... 51
D. MINIMIZING OVERLAP WITH NAEP AND ECLS............................................................................ 51 1. Terminology .......................................................................................................................... 52 2. Conditional Selection Probabilities ....................................................................................... 52
E. SASS/NAEP OVERLAP SAMPLE DESIGN ...................................................................................... 53 F. PUBLIC, PRIVATE, AND BIA SCHOOL LIBRARY MEDIA CENTERS................................................. 53 G. PUBLIC, PRIVATE, BIA, AND PUBLIC CHARTER SCHOOL TEACHERS............................................ 53
1. Sampling Frame..................................................................................................................... 53 2. Allocation .............................................................................................................................. 54 3. Teacher Sorting...................................................................................................................... 57 4. Teacher Selection................................................................................................................... 57
V. DATA COLLECTION .......................................................................................................................... 59
A. TIME FRAME OF THE SURVEY ........................................................................................................ 59 B. DATA COLLECTION PROCEDURES.................................................................................................. 60
1. Local Education Agencies (LEAs) and the School District Questionnaire (SASS-1A)........ 61 2. Teacher Listing Form (SASS-16) .......................................................................................... 62 3. School Questionnaires (SASS-3A, -3B, -3C, and -3D) ......................................................... 63 4. School Principal Questionnaires (SASS-2A, -2B, -2C, and -2D).......................................... 64 5. School Teacher Questionnaires (SASS-4A, -4B, -4C, and -4D) ........................................... 64 6. School Library Media Center Questionnaires (LS-1A, -1B, and -1C) .................................. 65
VI. RESPONSE RATES............................................................................................................................. 67
A. SURVEY RESPONSE RATES............................................................................................................. 67 B. NONRESPONSE BIAS ANALYSIS ..................................................................................................... 70
1. Unit-Level Nonresponse........................................................................................................ 70 2. Item-Level Nonresponse........................................................................................................ 71
C. ITEM RESPONSE RATES.................................................................................................................. 72 VII. DATA PROCESSING ........................................................................................................................ 75
A. QUESTIONNAIRE CHECK-IN ........................................................................................................... 75 B. DATA CAPTURE.............................................................................................................................. 75 C. REFORMATTING ............................................................................................................................. 75 D. PRELIMINARY ISR CLASSIFICATION.............................................................................................. 75 E. COMPUTER PRE-EDIT..................................................................................................................... 76 F. COMPUTER EDIT ............................................................................................................................ 78
Table of Contents vii
G. FINAL INTERVIEW STATUS EDIT .................................................................................................... 79 1. School District Survey (SASS-1A)........................................................................................ 80 2. School Principal Surveys (SASS-2A, -2B, -2C, and -2D)..................................................... 80 3. Public School Survey (SASS-3A) ......................................................................................... 81 4. Private School Survey (SASS-3B) ........................................................................................ 81 5. BIA School Survey (SASS-3C)............................................................................................. 82 6. Public Charter School Survey (SASS-3D) ............................................................................ 83 7. Teacher Surveys (SASS-4A, -4B, -4C, and -4D) .................................................................. 84 8. School Library Media Center Surveys (LS-1A, -1B, and -1C) ............................................. 85
H. IMPUTATION................................................................................................................................... 86 VIII. IMPUTATION PROCEDURES........................................................................................................ 87
A. IMPUTATION STAGES ..................................................................................................................... 87 1. Stage 1 ................................................................................................................................... 87 2. Stage 2 ................................................................................................................................... 87 3. Stage 3 ................................................................................................................................... 88
B. CREATION OF IMPUTED VALUES.................................................................................................... 88 IX. WEIGHTING AND VARIANCE ESTIMATION............................................................................... 95
A. SCHOOL WEIGHTS (SCHOOL SURVEY, SASS-3A, -3B, -3C, AND -3D)......................................... 96 1. Definition of School Weight.................................................................................................. 96 2. School Weighting Adjustment Cells...................................................................................... 96
B. SCHOOL PRINCIPAL WEIGHTS (SCHOOL PRINCIPAL SURVEY, SASS-2A, -2B, -2C, AND -2D)..... 99 C. PUBLIC SCHOOL DISTRICT WEIGHT (SCHOOL DISTRICT SURVEY, SASS-1A).............................. 99
1. Definition of District Weight................................................................................................. 99 2. Calculation of District Basic Weights ................................................................................. 100
D. SCHOOL TEACHER WEIGHT (SCHOOL TEACHER SURVEY, SASS-4A, -4B, -4C, AND -4D) ........ 102 1. Definition of Teacher Weight .............................................................................................. 102 2. Teacher Weighting Adjustment Cells.................................................................................. 103
E. SCHOOL LIBRARY WEIGHT (SCHOOL LIBRARY MEDIA CENTER SURVEY, LS-1A, -1B, AND -1C) ............................................................................................................................................... 105 1. Definition of School Library Weight................................................................................... 105 2. School Library Adjustment Cells ........................................................................................ 106
F. VARIANCE ESTIMATION............................................................................................................... 108 1. Replication Method ............................................................................................................. 108 2. Taylor Series Linearization Method .................................................................................... 111 3. Approximate Sampling Errors ............................................................................................. 112 4. Details on How Replicate Weights Were Developed .......................................................... 118 5. Summary.............................................................................................................................. 120
X. REVIEWING THE QUALITY OF SASS DATA............................................................................... 121
A. SCHOOL DISTRICT UNIT COUNT COMPARISON (SASS-1A) ........................................................ 122 B. SCHOOL DISTRICT ANALYTIC COUNT COMPARISON (SASS-1A)................................................ 125 C. PUBLIC SCHOOL UNIT COUNT COMPARISON (SASS-3A)............................................................ 127 D. PUBLIC SCHOOL STUDENT COUNT COMPARISON (SASS-3A)..................................................... 128 E. PUBLIC SCHOOL TEACHER FTE COMPARISON (SASS-4A)......................................................... 130 F. PRIVATE SCHOOL UNIT COMPARISON (SASS-3B) ...................................................................... 131 G. PRIVATE SCHOOL STUDENT COUNT COMPARISON (SASS-3B)................................................... 132 H. PRIVATE FTE TEACHER COMPARISON (SASS-4B) ..................................................................... 134
viii 1999–2000 SASS Data File User’s Manual
I. RESPONSE VARIANCE .................................................................................................................. 135 1. Content of Reinterview Questionnaires ............................................................................... 135 2. Procedures............................................................................................................................ 135 3. Major Findings..................................................................................................................... 136
XI. RESTRICTED-USE VS. PUBLIC-USE DATA FILES .................................................................... 137
A. RESTRICTED-USE DATA............................................................................................................... 137 1. How to Get Restricted-Use Data Files................................................................................. 137 2. Treatment of Public Charter Schools and BIA Schools....................................................... 138
B. PUBLIC-USE DATA ....................................................................................................................... 138 1. How to Get Public-Use Data Files....................................................................................... 139 2. Public-Use Data Files .......................................................................................................... 139
C. FILE LINKAGE WITHIN SASS....................................................................................................... 140 1. Sample SAS Syntax for Merging Files Within SASS and Attaching Variable Labels ....... 142 2. Sample SPSS Syntax for Merging Files Within SASS........................................................ 144
D. MERGING SASS DISTRICT AND PUBLIC SCHOOL DATA WITH CCD DATA................................. 145 E. MERGING SASS PRIVATE SCHOOL DATA WITH PSS DATA ........................................................ 145
XII. SAMPLING, CREATED, WEIGHTING, AND IMPUTATION FLAG VARIABLES .................. 147
A. SAMPLING VARIABLES................................................................................................................. 147 1. Urbanicity of School (URBANIC)—Principal, Teacher, and School Files ........................ 147 2. Region (REGION) ............................................................................................................... 147 3. 3-Level Typology (RELIG)—Private Principal, Teacher, and School Files ....................... 148 4. School Control Number (SCHCNTL)—Principal, Teacher, and School Files ................... 148
B. CREATED VARIABLES .................................................................................................................. 149 1. School Level (SCHLEVEL)—Principal, Teacher, and School Files .................................. 150 2. Total Ungraded and K–12 Enrollment (ENRK12UG)—Principal and Teacher Files......... 150
C. WEIGHTING VARIABLES .............................................................................................................. 150 D. IMPUTATION FLAG VARIABLES ................................................................................................... 150
XIII. USER NOTES AND CAUTIONS................................................................................................... 153
A. 1999–2000 SASS ELECTRONIC CODEBOOK (ECB)..................................................................... 153 B. CALCULATION OF AVERAGE YEARS OF TEACHING EXPERIENCE................................................ 153 C. FIPS CODES ................................................................................................................................. 154 D. CODES FOR TEACHERS’ MAJOR FIELD OF STUDY ....................................................................... 154 E. INDUSTRY AND OCCUPATION CODES .......................................................................................... 154 F. CAUTIONS CONCERNING THE MEASUREMENT OF CHANGE ESTIMATES ..................................... 154
1. School Locale Codes Over Time ......................................................................................... 155 2. Changing the Sampling Frame for Public Schools From QED to CCD.............................. 156 3. Changing the Sampling Frame for Private Schools From QED to PSS .............................. 156 4. Estimated Number of Teachers From the Teacher File Versus Estimated Number of
Teachers From the School File ............................................................................................ 156 5. Questionnaire and Conceptual Differences ......................................................................... 157 6. Calculating the Standard Error for a Cross-Year Comparison ............................................ 158
REFERENCES ......................................................................................................................................... 159
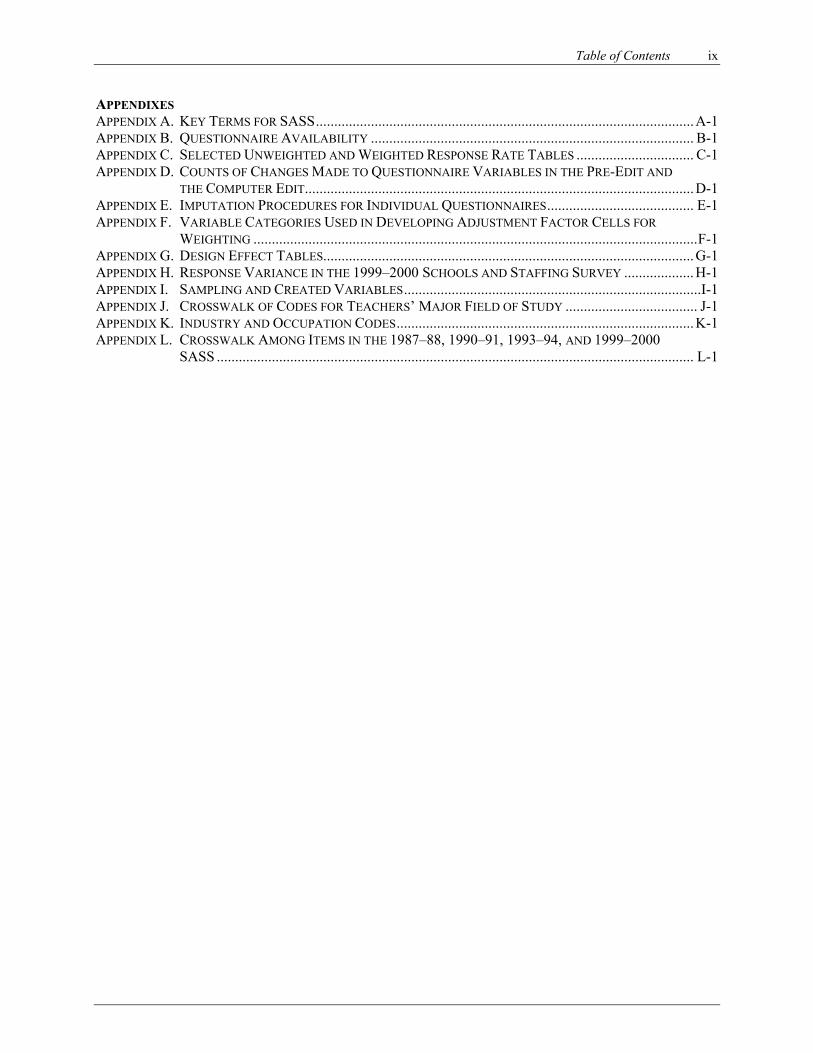
Table of Contents ix
APPENDIXES APPENDIX A. KEY TERMS FOR SASS.......................................................................................................A-1 APPENDIX B. QUESTIONNAIRE AVAILABILITY ........................................................................................ B-1 APPENDIX C. SELECTED UNWEIGHTED AND WEIGHTED RESPONSE RATE TABLES ................................ C-1 APPENDIX D. COUNTS OF CHANGES MADE TO QUESTIONNAIRE VARIABLES IN THE PRE-EDIT AND
THE COMPUTER EDIT..........................................................................................................D-1 APPENDIX E. IMPUTATION PROCEDURES FOR INDIVIDUAL QUESTIONNAIRES........................................ E-1 APPENDIX F. VARIABLE CATEGORIES USED IN DEVELOPING ADJUSTMENT FACTOR CELLS FOR
WEIGHTING .........................................................................................................................F-1 APPENDIX G. DESIGN EFFECT TABLES.....................................................................................................G-1 APPENDIX H. RESPONSE VARIANCE IN THE 1999–2000 SCHOOLS AND STAFFING SURVEY ...................H-1 APPENDIX I. SAMPLING AND CREATED VARIABLES.................................................................................I-1 APPENDIX J. CROSSWALK OF CODES FOR TEACHERS’ MAJOR FIELD OF STUDY .................................... J-1 APPENDIX K. INDUSTRY AND OCCUPATION CODES.................................................................................K-1 APPENDIX L. CROSSWALK AMONG ITEMS IN THE 1987–88, 1990–91, 1993–94, AND 1999–2000
SASS .................................................................................................................................. L-1
x 1999–2000 SASS Data File User’s Manual
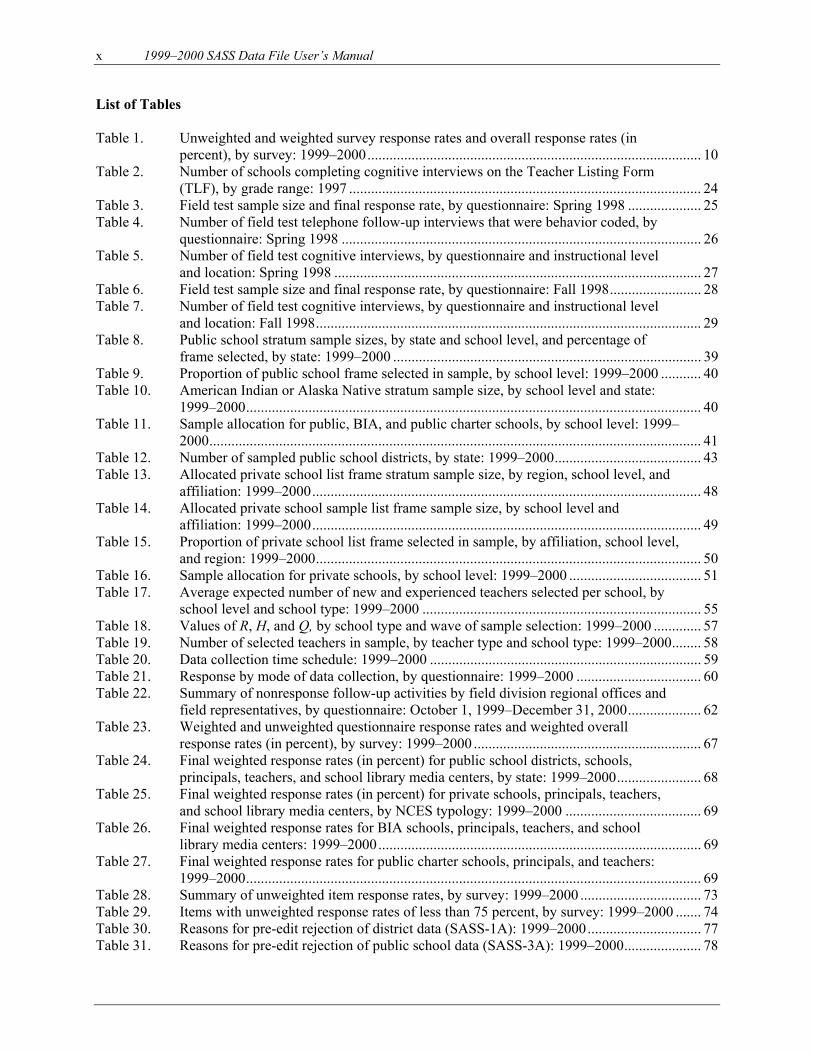
List of Tables Table 1. Unweighted and weighted survey response rates and overall response rates (in
percent), by survey: 1999–2000........................................................................................... 10 Table 2. Number of schools completing cognitive interviews on the Teacher Listing Form
(TLF), by grade range: 1997 ................................................................................................ 24 Table 3. Field test sample size and final response rate, by questionnaire: Spring 1998 .................... 25 Table 4. Number of field test telephone follow-up interviews that were behavior coded, by
questionnaire: Spring 1998 .................................................................................................. 26 Table 5. Number of field test cognitive interviews, by questionnaire and instructional level
and location: Spring 1998 .................................................................................................... 27 Table 6. Field test sample size and final response rate, by questionnaire: Fall 1998......................... 28 Table 7. Number of field test cognitive interviews, by questionnaire and instructional level
and location: Fall 1998......................................................................................................... 29 Table 8. Public school stratum sample sizes, by state and school level, and percentage of
frame selected, by state: 1999–2000 .................................................................................... 39 Table 9. Proportion of public school frame selected in sample, by school level: 1999–2000 ........... 40 Table 10. American Indian or Alaska Native stratum sample size, by school level and state:
1999–2000............................................................................................................................ 40 Table 11. Sample allocation for public, BIA, and public charter schools, by school level: 1999–
2000...................................................................................................................................... 41 Table 12. Number of sampled public school districts, by state: 1999–2000........................................ 43 Table 13. Allocated private school list frame stratum sample size, by region, school level, and
affiliation: 1999–2000.......................................................................................................... 48 Table 14. Allocated private school sample list frame sample size, by school level and
affiliation: 1999–2000.......................................................................................................... 49 Table 15. Proportion of private school list frame selected in sample, by affiliation, school level,
and region: 1999–2000......................................................................................................... 50 Table 16. Sample allocation for private schools, by school level: 1999–2000 .................................... 51 Table 17. Average expected number of new and experienced teachers selected per school, by
school level and school type: 1999–2000 ............................................................................ 55 Table 18. Values of R, H, and Q, by school type and wave of sample selection: 1999–2000 ............. 57 Table 19. Number of selected teachers in sample, by teacher type and school type: 1999–2000........ 58 Table 20. Data collection time schedule: 1999–2000 .......................................................................... 59 Table 21. Response by mode of data collection, by questionnaire: 1999–2000 .................................. 60 Table 22. Summary of nonresponse follow-up activities by field division regional offices and
field representatives, by questionnaire: October 1, 1999–December 31, 2000.................... 62 Table 23. Weighted and unweighted questionnaire response rates and weighted overall
response rates (in percent), by survey: 1999–2000 .............................................................. 67 Table 24. Final weighted response rates (in percent) for public school districts, schools,
principals, teachers, and school library media centers, by state: 1999–2000....................... 68 Table 25. Final weighted response rates (in percent) for private schools, principals, teachers,
and school library media centers, by NCES typology: 1999–2000 ..................................... 69 Table 26. Final weighted response rates for BIA schools, principals, teachers, and school
library media centers: 1999–2000........................................................................................ 69 Table 27. Final weighted response rates for public charter schools, principals, and teachers:
1999–2000............................................................................................................................ 69 Table 28. Summary of unweighted item response rates, by survey: 1999–2000 ................................. 73 Table 29. Items with unweighted response rates of less than 75 percent, by survey: 1999–2000 ....... 74 Table 30. Reasons for pre-edit rejection of district data (SASS-1A): 1999–2000............................... 77 Table 31. Reasons for pre-edit rejection of public school data (SASS-3A): 1999–2000..................... 78
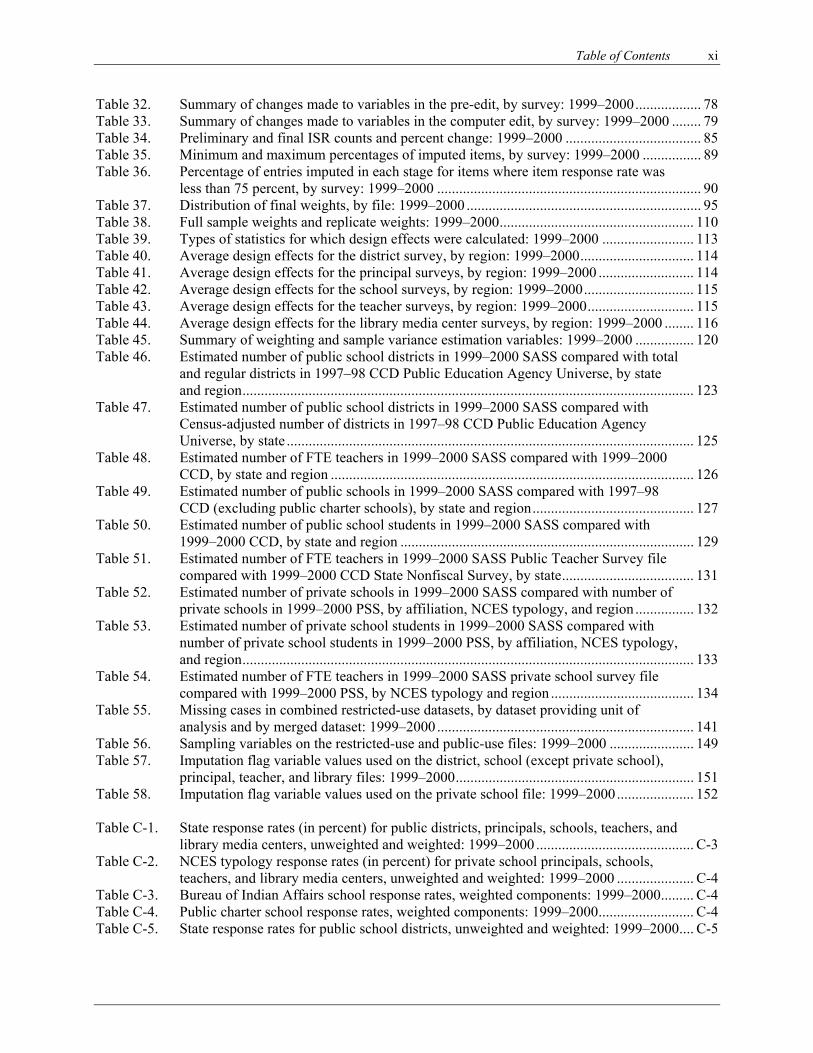
Table of Contents xi
Table 32. Summary of changes made to variables in the pre-edit, by survey: 1999–2000.................. 78 Table 33. Summary of changes made to variables in the computer edit, by survey: 1999–2000 ........ 79 Table 34. Preliminary and final ISR counts and percent change: 1999–2000 ..................................... 85 Table 35. Minimum and maximum percentages of imputed items, by survey: 1999–2000 ................ 89 Table 36. Percentage of entries imputed in each stage for items where item response rate was
less than 75 percent, by survey: 1999–2000 ........................................................................ 90 Table 37. Distribution of final weights, by file: 1999–2000 ................................................................ 95 Table 38. Full sample weights and replicate weights: 1999–2000..................................................... 110 Table 39. Types of statistics for which design effects were calculated: 1999–2000 ......................... 113 Table 40. Average design effects for the district survey, by region: 1999–2000............................... 114 Table 41. Average design effects for the principal surveys, by region: 1999–2000 .......................... 114 Table 42. Average design effects for the school surveys, by region: 1999–2000.............................. 115 Table 43. Average design effects for the teacher surveys, by region: 1999–2000............................. 115 Table 44. Average design effects for the library media center surveys, by region: 1999–2000 ........ 116 Table 45. Summary of weighting and sample variance estimation variables: 1999–2000 ................ 120 Table 46. Estimated number of public school districts in 1999–2000 SASS compared with total
and regular districts in 1997–98 CCD Public Education Agency Universe, by state and region........................................................................................................................... 123
Table 47. Estimated number of public school districts in 1999–2000 SASS compared with Census-adjusted number of districts in 1997–98 CCD Public Education Agency Universe, by state ............................................................................................................... 125
Table 48. Estimated number of FTE teachers in 1999–2000 SASS compared with 1999–2000 CCD, by state and region ................................................................................................... 126
Table 49. Estimated number of public schools in 1999–2000 SASS compared with 1997–98 CCD (excluding public charter schools), by state and region............................................ 127
Table 50. Estimated number of public school students in 1999–2000 SASS compared with 1999–2000 CCD, by state and region ................................................................................ 129
Table 51. Estimated number of FTE teachers in 1999–2000 SASS Public Teacher Survey file compared with 1999–2000 CCD State Nonfiscal Survey, by state.................................... 131
Table 52. Estimated number of private schools in 1999–2000 SASS compared with number of private schools in 1999–2000 PSS, by affiliation, NCES typology, and region................ 132
Table 53. Estimated number of private school students in 1999–2000 SASS compared with number of private school students in 1999–2000 PSS, by affiliation, NCES typology, and region........................................................................................................................... 133
Table 54. Estimated number of FTE teachers in 1999–2000 SASS private school survey file compared with 1999–2000 PSS, by NCES typology and region ....................................... 134
Table 55. Missing cases in combined restricted-use datasets, by dataset providing unit of analysis and by merged dataset: 1999–2000...................................................................... 141
Table 56. Sampling variables on the restricted-use and public-use files: 1999–2000 ....................... 149 Table 57. Imputation flag variable values used on the district, school (except private school),
principal, teacher, and library files: 1999–2000................................................................. 151 Table 58. Imputation flag variable values used on the private school file: 1999–2000..................... 152 Table C-1. State response rates (in percent) for public districts, principals, schools, teachers, and
library media centers, unweighted and weighted: 1999–2000 ........................................... C-3 Table C-2. NCES typology response rates (in percent) for private school principals, schools,
teachers, and library media centers, unweighted and weighted: 1999–2000 ..................... C-4 Table C-3. Bureau of Indian Affairs school response rates, weighted components: 1999–2000......... C-4 Table C-4. Public charter school response rates, weighted components: 1999–2000.......................... C-4 Table C-5. State response rates for public school districts, unweighted and weighted: 1999–2000.... C-5

xii 1999–2000 SASS Data File User’s Manual
Table C-6. State response rates for public school principals, unweighted and weighted: 1999–2000.................................................................................................................................... C-6
Table C-7. Sampled affiliation groups’ response rates for private principals and schools, unweighted and weighted: 1999–2000............................................................................... C-7
Table C-8. NCES typology response rates for private school principals, unweighted and weighted: 1999–2000......................................................................................................... C-8
Table C-9. State response rates for public schools, unweighted and weighted: 1999–2000................ C-9 Table C-10. NCES typology response rates for private schools, unweighted and weighted: 1999–
2000.................................................................................................................................. C-10 Table C-11. State response rates for public school teachers, unweighted and weighted: 1999–2000 . C-11 Table C-12. NCES typology response rates for private school teachers, unweighted and weighted:
1999–2000........................................................................................................................ C-12 Table C-13. State response rates for public school library media centers, unweighted and
weighted: 1999–2000....................................................................................................... C-13 Table C-14. NCES typology response rates for private school library media centers, unweighted
and weighted: 1999–2000 ................................................................................................ C-14 Table C-15. Item response rates for the School District Questionnaire (SASS-1A), unweighted
and weighted: 1999–2000 ................................................................................................ C-15 Table C-16. Item response rates for the Public School Principal Questionnaire (SASS-2A),
unweighted and weighted: 1999–2000............................................................................. C-21 Table C-17. Item response rates for the Private School Principal Questionnaire (SASS-2B),
unweighted and weighted: 1999–2000............................................................................. C-26 Table C-18. Item response rates for the Indian School Principal Questionnaire (SASS-2C),
unweighted and weighted: 1999–2000............................................................................. C-30 Table C-19. Item response rates for the Public Charter School Principal Questionnaire (SASS-
2D), unweighted and weighted: 1999–2000 .................................................................... C-34 Table C-20. Item response rates for the Public School Questionnaire (SASS-3A), unweighted and
weighted: 1999–2000....................................................................................................... C-39 Table C-21. Item response rates for the Private School Questionnaire (SASS-3B), unweighted and
weighted: 1999–2000....................................................................................................... C-45 Table C-22. Item response rates for the Indian School Questionnaire (SASS-3C), unweighted and
weighted: 1999–2000....................................................................................................... C-54 Table C-23. Item response rates for the Public Charter School Questionnaire (SASS-3D),
unweighted and weighted: 1999–2000............................................................................. C-62 Table C-24. Item response rates for the Public School Teacher Questionnaire (SASS-4A),
unweighted and weighted: 1999–2000............................................................................. C-72 Table C-25. Item response rates for the Private School Teacher Questionnaire (SASS-4B),
unweighted and weighted: 1999–2000............................................................................. C-79 Table C-26. Item response rates for the Indian School Teacher Questionnaire (SASS-4C),
unweighted and weighted: 1999–2000............................................................................. C-86 Table C-27. Item response rates for the Public Charter School Teacher Questionnaire (SASS-4D),
unweighted and weighted: 1999–2000............................................................................. C-93 Table C-28. Item response rates for the Public School Library Media Center Questionnaire (LS-
1A), unweighted and weighted: 1999–2000 .................................................................. C-100 Table C-29. Item response rates for the Private School Library Media Center Questionnaire (LS-
1B), unweighted and weighted: 1999–2000................................................................... C-103 Table C-30. Item response rates for the Indian School Library Media Center Questionnaire (LS-
1C), unweighted and weighted: 1999–2000................................................................... C-106
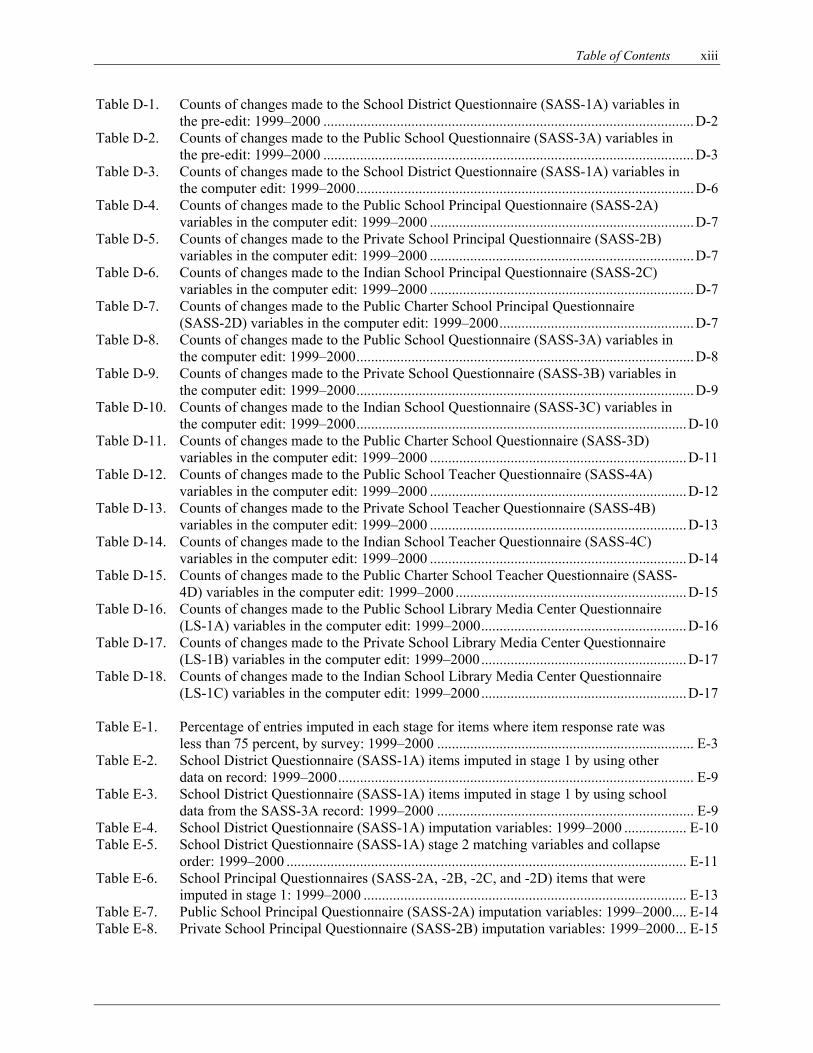
Table of Contents xiii
Table D-1. Counts of changes made to the School District Questionnaire (SASS-1A) variables in the pre-edit: 1999–2000 .....................................................................................................D-2
Table D-2. Counts of changes made to the Public School Questionnaire (SASS-3A) variables in the pre-edit: 1999–2000 .....................................................................................................D-3
Table D-3. Counts of changes made to the School District Questionnaire (SASS-1A) variables in the computer edit: 1999–2000............................................................................................D-6
Table D-4. Counts of changes made to the Public School Principal Questionnaire (SASS-2A) variables in the computer edit: 1999–2000 ........................................................................D-7
Table D-5. Counts of changes made to the Private School Principal Questionnaire (SASS-2B) variables in the computer edit: 1999–2000 ........................................................................D-7
Table D-6. Counts of changes made to the Indian School Principal Questionnaire (SASS-2C) variables in the computer edit: 1999–2000 ........................................................................D-7
Table D-7. Counts of changes made to the Public Charter School Principal Questionnaire (SASS-2D) variables in the computer edit: 1999–2000.....................................................D-7
Table D-8. Counts of changes made to the Public School Questionnaire (SASS-3A) variables in the computer edit: 1999–2000............................................................................................D-8
Table D-9. Counts of changes made to the Private School Questionnaire (SASS-3B) variables in the computer edit: 1999–2000............................................................................................D-9
Table D-10. Counts of changes made to the Indian School Questionnaire (SASS-3C) variables in the computer edit: 1999–2000..........................................................................................D-10
Table D-11. Counts of changes made to the Public Charter School Questionnaire (SASS-3D) variables in the computer edit: 1999–2000 ......................................................................D-11
Table D-12. Counts of changes made to the Public School Teacher Questionnaire (SASS-4A) variables in the computer edit: 1999–2000 ......................................................................D-12
Table D-13. Counts of changes made to the Private School Teacher Questionnaire (SASS-4B) variables in the computer edit: 1999–2000 ......................................................................D-13
Table D-14. Counts of changes made to the Indian School Teacher Questionnaire (SASS-4C) variables in the computer edit: 1999–2000 ......................................................................D-14
Table D-15. Counts of changes made to the Public Charter School Teacher Questionnaire (SASS-4D) variables in the computer edit: 1999–2000 ...............................................................D-15
Table D-16. Counts of changes made to the Public School Library Media Center Questionnaire (LS-1A) variables in the computer edit: 1999–2000........................................................D-16
Table D-17. Counts of changes made to the Private School Library Media Center Questionnaire (LS-1B) variables in the computer edit: 1999–2000........................................................D-17
Table D-18. Counts of changes made to the Indian School Library Media Center Questionnaire (LS-1C) variables in the computer edit: 1999–2000........................................................D-17
Table E-1. Percentage of entries imputed in each stage for items where item response rate was
less than 75 percent, by survey: 1999–2000 ...................................................................... E-3 Table E-2. School District Questionnaire (SASS-1A) items imputed in stage 1 by using other
data on record: 1999–2000................................................................................................. E-9 Table E-3. School District Questionnaire (SASS-1A) items imputed in stage 1 by using school
data from the SASS-3A record: 1999–2000 ...................................................................... E-9 Table E-4. School District Questionnaire (SASS-1A) imputation variables: 1999–2000 ................. E-10 Table E-5. School District Questionnaire (SASS-1A) stage 2 matching variables and collapse
order: 1999–2000 ............................................................................................................. E-11 Table E-6. School Principal Questionnaires (SASS-2A, -2B, -2C, and -2D) items that were
imputed in stage 1: 1999–2000 ........................................................................................ E-13 Table E-7. Public School Principal Questionnaire (SASS-2A) imputation variables: 1999–2000.... E-14 Table E-8. Private School Principal Questionnaire (SASS-2B) imputation variables: 1999–2000... E-15
xiv 1999–2000 SASS Data File User’s Manual
Table E-9. Public Charter School Principal Questionnaire (SASS-2D) imputation variables: 1999–2000........................................................................................................................ E-17
Table E-10. Public School Principal Questionnaire (SASS-2A) stage 2 matching variables and collapse order: 1999–2000 ............................................................................................... E-19
Table E-11. Private School Principal Questionnaire (SASS-2B) stage 2 matching variables and collapse order: 1999–2000 ............................................................................................... E-19
Table E-12. Public Charter School Principal Questionnaire (SASS-2D) stage 2 matching variables and collapse order: 1999–2000 ........................................................................................ E-20
Table E-13. Public School Questionnaire (SASS-3A) items imputed in stage 1 by using other data on record: 1999–2000 ...................................................................................................... E-23
Table E-14. Public School Questionnaire (SASS-3A) items imputed in stage 1 using district data: 1999–2000........................................................................................................................ E-23
Table E-15. Public School Questionnaire (SASS-3A) imputation variables: 1999–2000................... E-24 Table E-16. Public School Questionnaire (SASS-3A) stage 2 matching variables and collapse
order: 1999–2000 ............................................................................................................. E-24 Table E-17. Private School Questionnaire (SASS-3B) items imputed in stage 1 by using other
data on record: 1999–2000............................................................................................... E-27 Table E-18. Private School Questionnaire (SASS-3B) imputation variables: 1999–2000 .................. E-28 Table E-19. Private School Questionnaire (SASS-3B) stage 2 matching variables and collapse
ordering for PSS items: 1999–2000 ................................................................................. E-30 Table E-20. Private School Questionnaire (SASS-3B) stage 2 matching variables and collapse
ordering for non-PSS items: 1999–2000.......................................................................... E-31 Table E-21. Indian School Questionnaire (SASS-3C) items imputed in stage 1 by using other data
on record: 1999–2000 ...................................................................................................... E-33 Table E-22. Public Charter School Questionnaire (SASS-3D) items imputed in stage 1 by using
other data on record: 1999–2000...................................................................................... E-36 Table E-23. Public Charter School Questionnaire (SASS-3D) items imputed in stage 1 using
district data: 1999–2000................................................................................................... E-36 Table E-24. Public Charter School Questionnaire (SASS-3D) imputation variables: 1999–2000 ...... E-37 Table E-25. Public Charter School Questionnaire (SASS-3D) stage 2 matching variables and
collapse order: 1999–2000 ............................................................................................... E-39 Table E-26. School Teacher Questionnaire (SASS-4A, -4B, -4C, and -4D) items imputed in stage
1 by using other data on record: 1999–2000 .................................................................... E-42 Table E-27. Public School Teacher Questionnaire (SASS-4A) imputation variables: 1999–2000 ..... E-43 Table E-28. Private School Teacher Questionnaire (SASS-4B) imputation variables: 1999–2000 .... E-47 Table E-29. Indian School Teacher Questionnaire (SASS-4C) imputation variables: 1999–2000 ..... E-49 Table E-30. Public Charter School Teacher Questionnaire (SASS-4D) imputation variables:
1999–2000........................................................................................................................ E-51 Table E-31. Public School Teacher Questionnaire (SASS-4A) stage 2 matching variables and
collapse order: 1999–2000 ............................................................................................... E-54 Table E-32. Private School Teacher Questionnaire (SASS-4B) stage 2 matching variables and
collapse order: 1999–2000 ............................................................................................... E-55 Table E-33. Indian School Teacher Questionnaire (SASS-4C) stage 2 matching variables and
collapse order: 1999–2000 ............................................................................................... E-56 Table E-34. Public Charter School Teacher Questionnaire (SASS-4D) stage 2 matching variables
and collapse order: 1999–2000 ........................................................................................ E-57 Table E-35. Public School Library Media Center Questionnaire (LS-1A) items imputed in stage 1
by using other data on record: 1999–2000....................................................................... E-61 Table E-36. Private School Library Media Center Questionnaire (LS-1B) items imputed in stage 1
by using other data on record: 1999–2000....................................................................... E-61
Table of Contents xv
Table E-37. Indian School Library Media Center Questionnaire (LS-1C) items imputed in stage 1 by using other data on record: 1999–2000....................................................................... E-62
Table E-38. Public School Library Media Center Questionnaire (LS-1A) imputation variables: 1999–2000........................................................................................................................ E-62
Table E-39. Private School Library Media Center Questionnaire (LS-1B) imputation variables: 1999–2000........................................................................................................................ E-63
Table E-40. Public School Library Media Center Questionnaire (LS-1A) stage 2 matching variables and collapse order: 1999–2000......................................................................... E-64
Table E-41. Private School Library Media Center Questionnaire (LS-1B) stage 2 matching variables and collapse order: 1999–2000......................................................................... E-65
Table F-1. Variable categories used in adjustment cells for the Public, Indian, and Public Charter
School Questionnaires (SASS-3A, -3C, and -3D) and Principal Questionnaires (SASS-2A, -2C, and -2D): 1999–2000 ...............................................................................F-3
Table F-2. Enrollment size class categories used in noninterview adjustment cells for the Public School (except Native American) (SASS-3A), Principal (SASS-2A), and Library Media Center (LS-1A) Questionnaires and for school noninterview adjustment cells for the Public School Teacher Questionnaire (SASS-4A), by state and school level: 1999–2000...........................................................................................................................F-4
Table F-3. Enrollment size class categories used in first-stage ratio adjustment cells for the Public School (except Native American) (SASS-3A), Principal (SASS-2A), and Library Media Center (LS-1A) Questionnaires and for frame ratio adjustment cells for the Public School Teacher Questionnaire (SASS-4A), by state and school level: 1999–2000...........................................................................................................................F-6
Table F-4. Variable categories used in adjustment cells for the Private School (SASS-3B) and Private School Principal (SASS-2B) Questionnaires: 1999–2000......................................F-9
Table F-5. Enrollment size class categories used in noninterview adjustment cells for the Private School (SASS-3B), Principal (SASS-2B), and Library Media Center (LS-1B) Questionnaires and in frame ratio adjustment cells for the Private School Teacher Questionnaire (SASS-4B), by affiliation and school level: 1999–2000 ...........................F-11
Table F-6. Enrollment size class categories used in second-stage ratio adjustment cells for the Private School (SASS-3B), Principal (SASS-2B), and Library Media Center (LS-1B) Questionnaires, by affiliation and school level: 1999–2000 .............................................F-12
Table F-7. Variable categories used in adjustment cells for the School District Questionnaire (SASS-1A): 1999–2000 ....................................................................................................F-13
Table F-8. District enrollment size categories used in noninterview adjustment cells for the School District Questionnaire (SASS-1A), by state: 1999–2000......................................F-14
Table F-9. District enrollment size categories used in first-stage ratio adjustment cells for the School District Questionnaires (SASS-1A), by state: 1999–2000....................................F-15
Table F-10. Variable categories used in adjustment cells for the Public, Indian, and Public Charter School Teacher Questionnaires (SASS-4A, -4C, and -4D): 1999–2000 ..........................F-18
Table F-11. Variable categories used in adjustment cells for the Private School Teacher Questionnaire (SASS-4B): 1999–2000 .............................................................................F-22
Table F-12. Variable categories used in adjustment cells for the Public and Indian School Library Media Center Questionnaires (LS-1A, LS-1C): 1999–2000.............................................F-25
Table F-13. Variable categories used in adjustment cells for the Private School Library Media Center Questionnaire (LS-1B): 1999–2000 ......................................................................F-27
xvi 1999–2000 SASS Data File User’s Manual
Table G-1a. Design effects and standard errors for selected Public School District Questionnaire student totals (D0463, D0458, D0459, D0460, D0461, D0462), by region: 1999–2000....................................................................................................................................G-9
Table G-1b. Design effects and standard errors for selected Public School District Questionnaire student averages (D0463, D0458, D0459, D0460, D0461, D0462), by region: 1999–2000..................................................................................................................................G-10
Table G-1c. Design effects and standard errors for selected Public School District Questionnaire teacher totals (D0476, D0471, D0472, D0473, D0474, D0475), by region: 1999–2000..................................................................................................................................G-11
Table G-1d. Design effects and standard errors for selected Public School District Questionnaire teacher averages (D0476, D0471, D0472, D0473, D0474, D0475), by region: 1999–2000..................................................................................................................................G-12
Table G-1e. Design effects and standard errors for selected Public School District Questionnaire district proportions (D0538, D0542, D0543, D0566, D0591, D0595), by region: 1999–2000........................................................................................................................G-13
Table G-2a. Design effects and standard errors for selected Public School Principal Questionnaire totals (A0225, RACETH_P, A0227), by region: 1999–2000 ..........................................G-14
Table G-2b. Design effects and standard errors for selected Public School Principal Questionnaire averages (A0054, A0055, A0056, AGE_P, TCHEXPER), by region: 1999–2000 .........G-16
Table G-2c. Design effects and standard errors for selected Public School Principal Questionnaire proportions (A0065, A0180, A0207, A0221), by region: 1999–2000 .............................G-17
Table G-3a. Design effects and standard errors for selected Public School Questionnaire student totals (ENRK12UG, S0096–S0100), by region: 1999–2000 ...........................................G-18
Table G-3b. Design effects and standard errors for selected Public School Questionnaire student averages (ENRK12UG, S0096–S0100), by region: 1999–2000......................................G-19
Table G-3c. Design effects and standard errors for selected Public School Questionnaire teacher totals (NUMTCH, S0249, S0250, S0251, S0252, S0253, S0255), by region: 1999–2000..................................................................................................................................G-20
Table G-3d. Design effects and standard errors for selected Public School Questionnaire teacher averages (NUMTCH, S0249, S0250, S0251, S0252, S0253, S0255), by region: 1999–2000........................................................................................................................G-21
Table G-3e. Design effects and standard errors for selected Public School Questionnaire school proportions (S0126, S0147, S0282, S0330), by region: 1999–2000................................G-22
Table G-4a. Design effects and standard errors for selected Public School Teacher Questionnaire totals (T0350, RACETH_T, T0356), by region: 1999–2000...........................................G-23
Table G-4b. Design effects and standard errors for selected Public School Teacher Questionnaire averages (T0065, T0066, T0208, T0209, T0210, T0211, T0212, T0277), by region: 1999–2000........................................................................................................................G-24
Table G-4c. Design effects and standard errors for selected Public School Teacher Questionnaire proportions (T0137, T0138, T0139, T0140, T0141, T0142), by region: 1999–2000 ......G-25
Table G-5a. Design effects and standard errors for selected Public School Library Media Center Questionnaire totals (M0089, M0090, M0091, M0092, M0093, M0094, M0095), by region: 1999–2000 ...........................................................................................................G-26
Table G-5b. Design effects and standard errors for selected Public School Library Media Center Questionnaire averages (M0164, M0053, M0149, M0152, M0155, M0195), by region: 1999–2000 ...........................................................................................................G-27
Table G-5c. Design effects and standard errors for selected Public School Library Media Center Questionnaire proportions (M0070, M0076, M0082, M0054, M0057, M0060), by region: 1999–2000 ...........................................................................................................G-28
Table G-6a. Design effects and standard errors for selected Private School Principal Questionnaire totals (A0225, RACETH_P, A0227), by region: 1999–2000...................G-29
Table of Contents xvii
Table G-6b. Design effects and standard errors for selected Private School Principal Questionnaire averages (A0054, A0055, A0056, AGE_P, TCHEXPER), by region: 1999–2000........................................................................................................................G-31
Table G-6c. Design effects and standard errors for selected Private School Principal Questionnaire proportions (A0065, A0180, A0058, A0059), by region: 1999–2000......G-32
Table G-7a. Design effects and standard errors for selected Private School Questionnaire student totals (ENRK12UG, S0096, S0097, S0098, S0099, S0100), by region: 1999–2000.......G-33
Table G-7b. Design effects and standard errors for selected Private School Questionnaire student averages (ENRK12UG, S0096, S0097, S0098, S0099, S0100), by region: 1999–2000 .G-34
Table G-7c. Design effects and standard errors for selected Private School Questionnaire teacher totals, by region: 1999–2000............................................................................................G-35
Table G-7d. Design effects and standard errors for selected Private School Questionnaire teacher averages (NUMTCH, S0249, S0250, S0251, S0252, S0253, S0255), by region: 1999–2000........................................................................................................................G-36
Table G-7e. Design effects and standard errors for selected Private School Questionnaire school proportions (S0126, S0147, S0282, S0330), by region: 1999–2000................................G-37
Table G-8a. Design effects and standard errors for selected Private School Teacher Questionnaire totals (T0350, RACETH_T, T0356), by region: 1999–2000...........................................G-38
Table G-8b. Design effects and standard errors for selected Private School Teacher Questionnaire averages (T0065, T0066, T0208, T0209, T0210, T0211, T0212, T0277), by region: 1999–2000........................................................................................................................G-39
Table G-8c. Design effects and standard errors for selected Private School Teacher Questionnaire proportions (T0137, T0138, T0139, T0140, T0141, T0142), by region: 1999–2000 ......G-40
Table G-9a. Design effects and standard errors for selected Private School Library Media Center Questionnaire totals (M0089, M0090, M0091, M0092, M0093, M0094, M0095), by region: 1999–2000 ...........................................................................................................G-41
Table G-9b. Design effects and standard errors for selected Private School Library Media Center Questionnaire averages (M0164, M0053, M0149, M0152, M0155, M0195), by region: 1999–2000 ...........................................................................................................G-42
Table G-9c. Design effects and standard errors for selected Private School Library Media Center Questionnaire proportions (M0070, M076, M0082, M0054, M0057, M0060), by region: 1999–2000 ...........................................................................................................G-43
Table G-10a. Design effects and standard errors for selected Indian School Principal Questionnaire totals (A0225, RACETH_P, A0227), by region: 1999–2000 ..........................................G-40
Table G-10b. Design effects and standard errors for selected Indian School Principal Questionnaire averages (A0054, A0055, A0056, AGE_P, TCHEXPER), by region: 1999–2000 .........G-44
Table G-10c. Design effects and standard errors for selected Indian School Principal Questionnaire proportions (A0065, A0180, A0058, A0059), by region: 1999–2000 .............................G-46
Table G-11a. Design effects and standard errors for selected Indian School Questionnaire student totals (ENRK12UG, S0096, S0097, S0098, S0099, S0100), by region: 1999–2000.......G-47
Table G-11b. Design effects and standard errors for selected Indian School Questionnaire student averages (ENRK12UG, S0096, S0097, S0098, S0099, S0100), by region: 1999–2000 .G-48
Table G-11c. Design effects and standard errors for selected Indian School Questionnaire teacher totals (NUMTCH, S0249, S0250, S0251, S0252, S0253, S0255), by region: 1999–2000..................................................................................................................................G-49
Table G-11d. Design effects and standard errors for selected Indian School Questionnaire teacher averages (NUMTCH, S0249, S0250, S0251, S0252, S0253, S0255), by region: 1999–2000........................................................................................................................G-50
Table G-11e. Design effects and standard errors for selected Indian School Questionnaire school proportions (S0126, S0147, S0282, S0330), by region: 1999–2000................................G-51
xviii 1999–2000 SASS Data File User’s Manual
Table G-12a. Design effects and standard errors for selected Indian School Teacher Questionnaire totals (T0350, RACETH_T, T0356), by region: 1999–2000...........................................G-52
Table G-12b. Design effects and standard errors for selected Indian School Teacher Questionnaire averages (T0065, T0066, T0208, T0209, T0210, T0211, T0212, T0277), by region: 1999–2000........................................................................................................................G-53
Table G-12c. Design effects and standard errors for selected Indian School Teacher Questionnaire proportions (T0137, T0138, T0139, T0140, T0141, T0142), by region: 1999–2000 ......G-54
Table G-13a. Design effects and standard errors for selected Indian School Library Media Center Questionnaire totals (M0089, M0090, M0091, M0092, M0093, M0094, M0095), by region: 1999–2000 ...........................................................................................................G-55
Table G-13b. Design effects and standard errors for selected Indian School Library Media Center Questionnaire averages (M0164, M0053, M0149, M0152, M0155, M0195), by region: 1999–2000 ...........................................................................................................G-56
Table G-13c. Design effects and standard errors for selected Indian School Library Media Center Questionnaire proportions (M0070, M0076, M0082, M0054, M0057, M0060), by region: 1999–2000 ...........................................................................................................G-57
Table G-14a. Design effects and standard errors for selected Public Charter School Principal Questionnaire totals (A0225, RACETH_P, A0227), by region: 1999–2000...................G-58
Table G-14b. Design effects and standard errors for selected Public Charter School Principal Questionnaire averages (A0054, A0055, A0056, AGE_P, TCHEXPER), by region: 1999–2000........................................................................................................................G-60
Table G-14c. Design effects and standard errors for selected Public Charter School Principal Questionnaire proportions (A0065, A0180, A0207, A0221, A0058, A0059), by region: 1999–2000 ...........................................................................................................G-61
Table G-15a. Design effects and standard errors for selected Public Charter School Questionnaire student totals (ENRK12UG, S0096, S0097, S0098, S0099, S0100), by region: 1999–2000..................................................................................................................................G-62
Table G-15b. Design effects and standard errors for selected Public Charter School Questionnaire student averages (ENRK12UG, S0096, S0097, S0098, S0099, S0100), by region: 1999–2000........................................................................................................................G-63
Table G-15c. Design effects and standard errors for selected Public Charter School Questionnaire teacher totals(NUMTCH, S0249, S0250, S0251, S0252, S0253, S0255), by region: 1999–2000........................................................................................................................G-64
Table G-15d. Design effects and standard errors for selected Public Charter School Questionnaire teacher averages (NUMTCH, S0249, S0250, S0251, S0252, S0253, S0255), by region: 1999–2000 ...........................................................................................................G-65
Table G-15e. Design effects and standard errors for selected Public Charter School Questionnaire school proportions (S0126, S0147, S0282, S0330), by region: 1999–2000 ...................G -66
Table G-16a. Design effects and standard errors for selected Public Charter School Teacher Questionnaire totals (T0350, RACETH_T, T0356), by region: 1999–2000....................G-67
Table G-16b. Design effects and standard errors for selected Public Charter School Teacher Questionnaire averages (T0065, T0066, T0208, T0209, T0210, T0211, T0212, T0277), by region: 1999–2000.........................................................................................G-68
Table G-16c. Design effects and standard errors for selected Public Charter School Teacher Questionnaire proportions (T0137, T0138, T0139, T0140, T0141, T0142), by region: 1999–2000........................................................................................................................G-69
List of Exhibits Exhibit 1. Comparison of field test questionnaire and final questionnaire format for school magnet
program question.................................................................................................................. 31
1
I. Overview
The Schools and Staffing Survey (SASS) is conducted by the National Center for Education Statistics (NCES) on behalf of the United States Department of Education in order to collect extensive data on American public and private elementary and secondary schools. SASS provides data on the characteristics and qualifications of teachers and principals, teacher hiring practices, professional development, class size, and other conditions in schools across the nation.
SASS is the largest, most extensive survey of K–12 school districts, schools, teachers, and
administrators in the United States today. It includes data from public, private, Bureau of Indian Affairs (BIA), and public charter school sectors. Therefore, SASS provides a multitude of opportunities for analysis and reporting on elementary and secondary educational issues. A. Background In the early 1980s, education policymakers became increasingly aware of the need for studies that would provide national data on public and private schools, their programs, teachers, and staffing levels. Such data would inform policymakers about the status of teaching and education, identify the areas that most need improvement, and clarify conflicting reports on issues related to policy initiatives, such as teacher shortages. The first attempt to address these concerns was a series of surveys that began in 1983 and included: • The Survey of Teacher Demand and Shortage, which was conducted in 1983–84 among public
and private schools and included questions on teacher demand and incentive plans for teachers. • The Public School Survey—School Questionnaire, conducted in 1984–85 to provide descriptive
information about public schools (e.g., enrollment and number of teachers), as well as data on use of teacher incentive plans, volunteers, and computers.
• The National Survey of Private Schools—School Questionnaire, conducted in 1985–86 to provide parallel information about private schools.
• The Public School Survey—Teacher Questionnaire, conducted in 1984–85 to provide information about teacher characteristics, qualifications, incentives, and opinions concerning policy issues.
• The National Survey of Private Schools—Teacher Questionnaire, conducted in 1985–1986 to provide parallel information about private school teachers.
Due to methodology and content problems within these surveys and the increasing demands for more and better education data, NCES initiated a redesign of its elementary/secondary education surveys in 1985. This redesign began with an evaluation of the then-current data system; opinions and advice were solicited from the education policy and research community on matters of context, methodology, and analytic utility. In late 1985, NCES reported the findings of this evaluation under the heading of Excellence in Schools Surveys and Analysis Study, which has become a continuing series and has been renamed the Schools and Staffing Surveys Project. In response to concern expressed in the evaluation about the paucity of information on schooling, NCES expanded the purposes of its earlier surveys. These expansions were also responses to conflicting reports of teacher shortages and to increasing public concern about the status of teaching and schools in general.
2 1999–2000 SASS Data File User’s Manual
Under a contract with NCES, the Rand Corporation redesigned the elementary/secondary education surveys to collect information relevant to their expanded purposes and to correct the methodological difficulties affecting the surveys. The outcome of that effort was a set of concurrent and integrated surveys called the Schools and Staffing Survey (SASS), which was designed to provide a composite national snapshot of America’s public and private schools. Also, in order to increase response rates and to maintain consistency in procedures across types of SASS questionnaires, NCES selected the U.S. Census Bureau to collect and process the data for all parts of the survey. SASS was first conducted by the Census Bureau in the 1987–88 school year, and again in 1990–91, 1993–94, and 1999–2000. The 1999–2000 SASS was expanded to include forms designed for public charter schools. These questionnaires replaced the previous National Study of Charter Schools. Additionally, an online survey was developed for the library media center form as an option to the paper questionnaire in response to the growing population that has access to the Internet. The 1999–2000 SASS provided data on public school districts (local education agencies); public, private, BIA, and public charter schools, principals, and teachers; and public, private, and BIA school library media centers for use by educators, researchers, and policymakers. B. Purpose and Content of the Survey The overall objective of SASS is to collect the information necessary for a complete picture of American elementary and secondary education. The abundance of data collected permits detailed analyses of the characteristics of schools, principals, teachers, and school district policies. The linkage of the SASS questionnaires enables researchers to examine the relationships among these elements of education. The 1999–2000 SASS consisted of five types of questionnaires: the School District Questionnaire (formerly titled the Teacher Demand and Shortage Questionnaire for Public School Districts), the School Principal Questionnaire, the School Questionnaire, the School Teacher Questionnaire, and the School Library Media Center Questionnaire. The questionnaires were slightly modified to meet the needs of the public, private, BIA, and public charter schools. The Teacher Follow-up Survey (TFS) is conducted the year after SASS; for example, the 1999–2000 SASS was followed by the 2000–01 TFS. TFS adds to understanding teachers’ decisions to either stay in the profession or leave by measuring teacher retention, mobility, and attrition from the profession at the national level in both public and private schools.
1. School District Questionnaire (Form SASS-1A)
The purpose of the 1999–2000 School District Questionnaire was to obtain information about school districts, such as student enrollments, number of teachers, teacher recruitment and hiring practices, teacher dismissals, existence of a teacher union, length of the contract year, teacher salary schedules, school choice, magnet programs, graduation requirements, and professional development for teachers and principals. The applicable sections for private, public charter, and BIA schools were incorporated into the Private, Public Charter, and BIA School Questionnaires. Note: The eligible respondent for the School District Questionnaire included any knowledgeable district employee.
The 1999–2000 questionnaire had these nine sections: Section I—Enrollment Information obtained counts of students by race, the number of
days in the school year, participation in the National School Lunch Program, full-time equivalent
I. Overview 3
(FTE) counts of all teachers employed by the local education agency (LEA), and counts of teachers by race.
Section II—Recruitment and Hiring of Teachers collected information on teacher
certification, newly hired teachers and the time frame of job offers, dismissal of teachers from the previous school year, and teacher union contractual information.
Section III—Compensation collected data on salary schedules, benefit rates, additional
contributions, and income in-kind for teachers. Section IV—School and Student Performance obtained data on performance reports,
assessment programs, and rewards or sanctions to district schools for student achievement. Section V—School Organization obtained information about the existence of public
charter schools and the availability of choice and magnet programs in the district. Section VI—Homeschooling obtained information about the existence of homeschooled
students and the criteria for evaluating their performance. Section VII—Graduation Requirements collected data on high school graduation
requirements, community service requirements, and other assessments necessary for graduation. Section VIII—Professional Development obtained information on professional
development programs, funding, and incentives for participation, along with incentives used to recruit or retain teachers to teach in fields of shortage.
Section IX—Migrant Education obtained information about the enrollment of migrant
students and the services provided for them.
2. School Principal Questionnaire (Forms SASS-2A, -2B, -2C, and -2D)
The purpose of the 1999–2000 School Principal Questionnaire was to obtain information about principal/school head demographic characteristics, training, experience, salary, and judgments about the seriousness of school problems. The questionnaire appeared in four versions that contained minor differences in phrasing to reflect differences in governing bodies and position titles in the schools.
The 1999–2000 questionnaire had these five sections: Section I—Experience and Training obtained information about principal work
experience, previous positions held, and training. Section II—Attitudes and Opinions about Education and Your School obtained attitudinal
information about educational goals, school problems, and school governance. Section III—Teacher Professional Development collected information on professional
development opportunities and activities for teachers. Section IV—Teacher and School Performance; Principal’s Activities collected
information about teacher performance, principal professional development, decisionmaking bodies, principals’ school activities, and performance goals.

4 1999–2000 SASS Data File User’s Manual
Section V—Demographic Information obtained information about the principal’s highest degree, salary, race, and age.
3. School Questionnaire (Forms SASS-3A, -3B, -3C, and -3D)
The purpose of the 1999–2000 School Questionnaire was to obtain information about
schools, such as grades offered, number of students enrolled, staffing patterns, teaching vacancies, high school graduation rates, programs and services offered, and college application rates. Note: Although the questionnaires were addressed to “Principal,” the respondent could be any knowledgeable school staff member.
The 1999–2000 School Questionnaire for public, private, and BIA schools had these
seven sections: Section I—General Information about Your School obtained information about grade
range, building capacity, and enrollment. Section II—Admissions, Programs and Performance collected information on
requirements for admission, school programs, and measurement of student performance. Section III—Students and Class Organization collected information about curriculum
options and school organization. Section IV—Parent Involvement and School Safety collected information about parental
involvement in the school and school safety programs. Section V—Staffing obtained information about the number of full- and part-time staff,
racial composition of teachers, methods used to cover teaching vacancies, and level of difficulty involved in filling teacher vacancies.
Section VI—Technology collected information about the number of computers, access to
the Internet, and staff responsible for computer education and support. Section VII—Special Programs and Services obtained information about the National
School Lunch Program, Title I services, Individual Education Plans (IEPs), services for Limited-English Proficient (LEP) students, and migrant education.
Public charter schools. As a continuation of a national study of public charter schools,
NCES added a new SASS form specific to public charter schools to three of the five types of questionnaires: School Questionnaire, School Teacher Questionnaire, and School Principal Questionnaire. All public charter schools in operation as of 1998–1999 were surveyed. A number of questions specific to public charter schools were asked, including: when the charter was granted and by whom, what types of regulations were waived and their importance, whether the school was new or was converted from a pre-existing school, whether the school operated within a school district or not. A small number of school library media center items were also incorporated into the public charter school questionnaire, such as whether the school had a library media center, number of school library media center staff, and number of students who used the library media center in the past week. Public charter schools that operated on their own were asked some of the district items, such as school hiring practices and graduation requirements. The Public Charter School Questionnaire was organized in three sections: School Policies and Practices, Administrative Policies and Practices, and Library Media Center.

I. Overview 5
4. School Teacher Questionnaire (Forms SASS-4A, -4B, -4C, and -4D)
The purpose of the 1999–2000 School Teacher Questionnaire was to obtain information about teachers, such as education and training, teaching assignment, certification, workload, and perceptions and attitudes about teaching. The 1999–2000 questionnaire expanded data collection on teacher preparation, induction, organization of classes, and professional development. The School Teacher Questionnaire was sent out in four versions that were virtually identical except that public charter school teachers who worked in the school prior to its becoming a public charter school were asked if they supported the conversion.
The 1999–2000 School Teacher Questionnaire had these nine sections: Section I—General Information obtained general information about teaching status,
teaching experience, other professional experiences, and public charter school status. Section II—Certification and Training Information collected information about teacher
certification, academic degrees, teacher preparation programs, and other formal training. Section III—Professional Development collected information about professional
development activities and their impact. Section IV—Class Organization obtained information about class enrollments,
organization of classes, and subjects taught. Section V—Resources and Assessment of Students collected information about student
characteristics, resources provided to students, and application of student assessment scores. Section VI—Working Conditions obtained information about school safety and teaching
hours. Section VII—Decision Making collected information about teacher influence on staffing
and budgeting, and perceptions of teaching issues. Section VIII—General Employment Information obtained information about teacher
salary, supplemental income, union affiliation, gender, and race. Section IX—Contact Information requested that respondents provide their personal
contact information as well as contact information for two additional people who would be able to get in touch with them in the event that they relocated. This information was necessary for the TFS that was administered the following year.
5. School Library Media Center Questionnaire (Forms LS-1A, -1B, and -1C)
The purpose of the 1999–2000 School Library Media Center Questionnaire was to obtain
information about library media centers and librarians, such as amount and experience of library staff, and the organization, expenditures, and collections of the library media center.
The 1999–2000 School Library Media Center Questionnaire had these six sections: Section I—Facilities obtained data about the organization of the library media center.
6 1999–2000 SASS Data File User’s Manual
Section II—Staffing collected data about the number of professional, clerical, and volunteer staff in the library, and the highest degrees held by the professional staff members.
Section III—Technology obtained data about the different technology resources in the
school, such as computers, television, DVD, etc. Section IV—1998–99—Collections and Expenditures collected data about the size,
expenditures, and currency of the library media collection. Section V—Scheduling and Transactions obtained data about scheduling, frequency of
use, and borrowing policies. Section VI—Collaboration and Policy collected data about frequency of library media
staff collaboration with classroom teachers, and library media center policies. In addition to the paper questionnaires, the School Library Media Center Questionnaire
was available via the Internet for the public and private schools. The internet versions were identical in content to the paper questionnaires. Note: The School Library Media Center Questionnaire was not sent to public charter schools, although some of the questionnaire items were included in the Public Charter School Questionnaire.
6. Teacher Follow-up Survey (TFS) (Forms TFS-1, -2, and -3)
This survey is a follow-up of selected teachers from the SASS Teacher Survey and is
conducted in the school year following SASS (i.e., 1988–89, 1991–92, 1994–95, and 2000–01). The 2000–01 sample consisted of all interviewed SASS teachers who left teaching within the year after SASS (leavers) and a subsample of those who continued teaching, including those who remained in the same school as in the previous year (stayers) and those who changed schools (movers). The major objectives of this survey were to measure the attrition rate for teachers, examine the characteristics of teachers who stayed in the teaching profession and those who left, obtain activity or occupation data for those who left the teaching profession, and collect data on attitudes about the teaching profession and job satisfaction.
All SASS responding schools completed a listing questionnaire (TFS-1) to update the
status of their SASS teachers. The questionnaire for stayers and movers (TFS-2) asked respondents about their current teaching assignments, reasons for staying in teaching, expected duration in teaching, plans for further education, attitudes about teaching, and demographic characteristics. The questionnaire for leavers (TFS-3) asked respondents about their present occupation or activity, educational plans, reasons for leaving teaching, intent to return to teaching, attitudes about teaching, and demographic characteristics.
TFS data are linked to SASS data to help understand relationships between local districts and school policies and practices, teacher characteristics, and teacher attrition and retention.
I. Overview 7
C. Target Populations and Estimates
1. Target Populations The target populations for the 1999–2000 SASS are described below.
• School districts. LEAs that employed elementary and/or secondary level teachers and were in operation in school year 1999–2000; for example, public school districts, state agencies that operated schools for special student populations (such as inmates of juvenile correctional facilities), the Department of Defense (DoD), and cooperative agencies that provided special services to more than one school district. Entities that authorized public charter schools were not included, unless they were also public school districts.
• Schools. Public, private, and BIA schools with students in any of grades 1–12 and in operation in schools year 1999–2000. Public charter schools open during the 1998–99 schools year and still open in the 1999–2000 school year.
• Principals. Principals of the targeted school populations. • Teachers. Teachers in the targeted school populations who taught students in any of
grades K–12 in school year 1999–2000. • School library media centers. School library media centers in public, private, and BIA
schools.
2. Sampling Frame
The sampling frame for the traditional public schools (i.e., the subset of all public schools that are not public charter schools)1 was an adjusted version of the 1997–98 Common Core of Data (CCD). The population of public schools was drawn from the frame population for the 1997–98 school year. CCD includes regular public schools, DoD-operated military base schools, and special purpose schools, such as special education, vocational, and alternative schools. NCES collects CCD data annually from all state education agencies. Schools outside of the United States and schools that teach only prekindergarten, kindergarten, or postsecondary students were deleted from the CCD frame prior to sampling for SASS. Public schools not in existence in school year 1997–98 and not opening as a result of a split with an existing school were not included. The LEAs operating the selected sample schools were also selected.
The sampling frame for private schools is based on a dual frame approach. The list frame
was based on the 1997–98 Private School Universe Survey (PSS), updated with private school organizations and state lists collected by the Census Bureau in the spring of 1999 for updating the 1999–2000 PSS list frame. An area frame was used to find schools missing from the list frame, thereby compensating for the incomplete coverage of the list frame.
The BIA frame consisted of a list of elementary, secondary, and combined K–12 schools
that either BIA operated or funded during the 1997–98 school year. The list was obtained from the U.S. Department of the Interior. All BIA schools were included in the SASS sample.
The public charter school frame consisted of a list of public charter schools developed for
the Office of Educational Research and Improvement (OERI; renamed the Institute of Education Sciences, IES, in 2002), as described in The State of Charter Schools 2000 (Nelson, Berman,
1 In this volume, “public schools” always refer to the subset of all public schools that are not public charter schools.

8 1999–2000 SASS Data File User’s Manual
Ericson, Kamprath, Perry, Silverman, and Solomon 2000). This list is updated annually; the list used for the 1999–2000 SASS contained all public charter schools under state supervision that were in existence during the 1998–99 school year. All public charter schools were included in the SASS sample.
A subsample of library media centers in schools in the SASS sample were asked to
complete the School Library Media Center Questionnaire. The 1999–2000 school library media center sample size was originally to include all SASS schools, but, for cost and burden reasons, was reduced to exclude public charter schools.
The sampling frame for the School Teacher Questionnaire consisted of lists of teachers
submitted by schools in the SASS sample. The Teacher Listing Form (TLF) was mailed at the beginning of the 1999–2000 school year to all public, private, BIA, and public charter schools in the SASS sample to obtain a complete list of all the teachers employed at each school. The form included space for schools to indicate the race/ethnicity of each teacher, whether the teacher was “new” (less than 3 years of experience), whether the teacher taught classes designed for students with limited English proficiency, the teacher’s assignment (subject matter and/or grade level), and whether the teacher was full- or part-time. The sample of teachers was selected from the list of all teachers who taught students in any of grades K–12 for each school in the sample.
3. Sample Design
SASS uses a stratified probability sample design. Schools were selected first, and once the public schools were selected, the districts associated with these schools were generally in the sample as well. The school library media center sample was a subsample of the SASS school sample. A sample of teachers was selected within each sampled school.
4. Estimates
SASS was designed to produce national and state estimates for public elementary and
secondary school surveys (i.e., schools, teachers, principals, school districts, and school library media centers); national estimates for BIA, public charter school, and public “combined” school surveys (i.e., schools, teachers, principals, and school library media centers); and national and affiliation group estimates for private school surveys (schools, teachers, principals, and school library media centers). The affiliation groups for private schools were:
• Catholic • Friends • Episcopal • National Society for Hebrew Day Schools • Solomon Schechter Day Schools • Other Jewish schools • Lutheran Church, Missouri Synod • Lutheran Church, Wisconsin Synod • Association of Evangelical Lutheran Churches or Evangelical Lutheran Church in
America • Other Lutheran schools • Seventh-Day Adventist • Christian Schools International • American Association of Christian Schools

I. Overview 9
• Association of Christian Schools International • National Association of Private Schools for Exceptional Children • American Montessori Society or other Montessori associations • National Association of Independent Schools • National Independent Private School Association • All else
Comparisons between public and private schools are only possible at the national level,
because private schools were selected for sampling by affiliation group and not by geographic location, such as state.
The teacher survey was designed to support comparisons between new and experienced
teachers (3 years or less of experience vs. more than 3 years of experience). Comparisons between teachers of classes designed for students with limited English proficiency and other teachers are possible at the national level. The school library media center survey was designed to produce estimates at the state level for public schools and at the major affiliation level (Catholic, other religious, nonsectarian) for private schools.
Due to measures taken to protect the confidentiality of individual respondents, the public-
use data files do not support all of the estimates described above. State names are not available on the public-use data files, and affiliation identification for private schools was recoded to a 9-level typology variable with the following categories:
• Catholic, parochial • Catholic, diocesan • Catholic, private • Other religious, conservative Christian • Other religious, affiliated with a denomination • Other religious, not affiliated with any denomination • Nonsectarian, regular school • Nonsectarian, special program • Nonsectarian, special education
Moreover, some detailed affiliation codes were deleted from or collapsed on the public-use data
files. Therefore, estimates from the public-use files are possible for the 9-level typology for the
private sector, and for Census region for the public sector. The exception to this rule is the Public School District data file, where each LEA’s FIPS state code was left on the file for analysis. However, the public-use school, principal, teacher, and library media center files cannot be linked to the district file.
5. Response Rates
Weighted response rates are defined as the number of in-scope responding questionnaires
divided by the number of in-scope sample cases, using the basic weight (inverse of the probability of selection) of the record. All components except teachers involve only one sampling stage, so for these components, the weighted overall response rate and the weighted response rate are the same. Teachers can only be selected from those school that return Teacher Listing Forms, so the weighted overall response rate is the weighted questionnaire response rates times the rate of
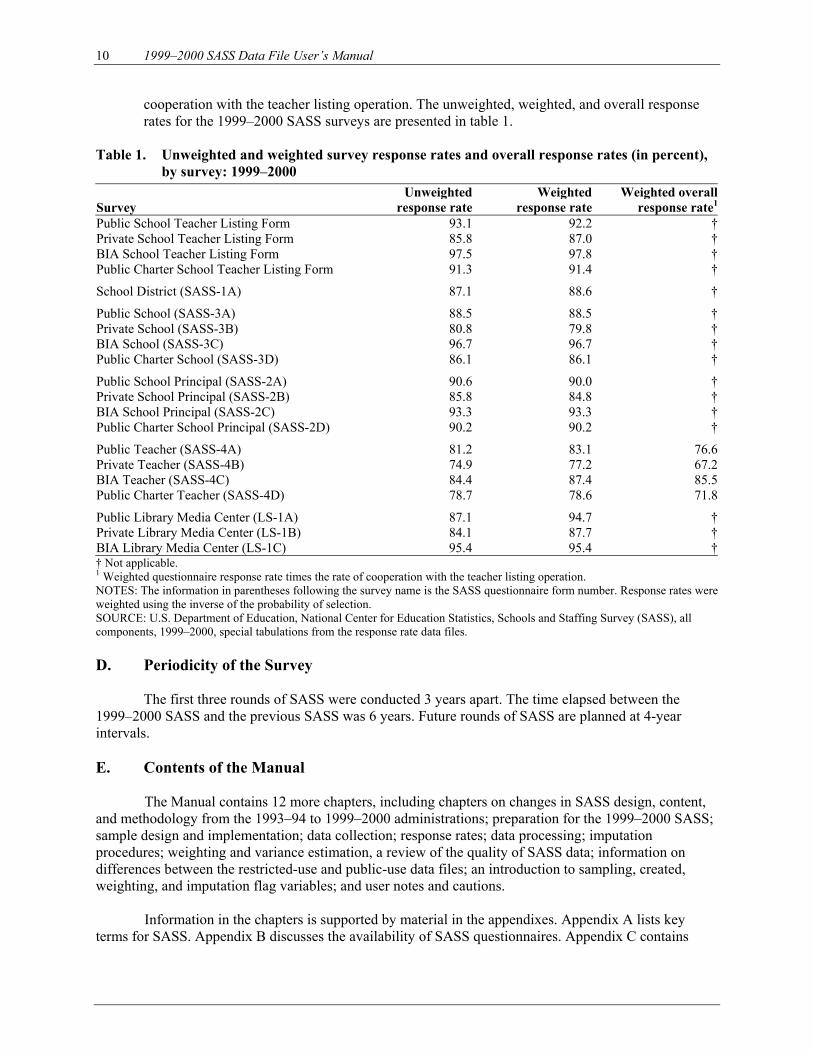
10 1999–2000 SASS Data File User’s Manual
cooperation with the teacher listing operation. The unweighted, weighted, and overall response rates for the 1999–2000 SASS surveys are presented in table 1.
Table 1. Unweighted and weighted survey response rates and overall response rates (in percent),
by survey: 1999–2000
Survey Unweighted
response rateWeighted
response rateWeighted overall
response rate1
Public School Teacher Listing Form 93.1 92.2 †Private School Teacher Listing Form 85.8 87.0 †BIA School Teacher Listing Form 97.5 97.8 †Public Charter School Teacher Listing Form 91.3 91.4 †
School District (SASS-1A) 87.1 88.6 †
Public School (SASS-3A) 88.5 88.5 †Private School (SASS-3B) 80.8 79.8 †BIA School (SASS-3C) 96.7 96.7 †Public Charter School (SASS-3D) 86.1 86.1 †
Public School Principal (SASS-2A) 90.6 90.0 †Private School Principal (SASS-2B) 85.8 84.8 †BIA School Principal (SASS-2C) 93.3 93.3 †Public Charter School Principal (SASS-2D) 90.2 90.2 †
Public Teacher (SASS-4A) 81.2 83.1 76.6Private Teacher (SASS-4B) 74.9 77.2 67.2BIA Teacher (SASS-4C) 84.4 87.4 85.5Public Charter Teacher (SASS-4D) 78.7 78.6 71.8
Public Library Media Center (LS-1A) 87.1 94.7 †Private Library Media Center (LS-1B) 84.1 87.7 †BIA Library Media Center (LS-1C) 95.4 95.4 †† Not applicable. 1 Weighted questionnaire response rate times the rate of cooperation with the teacher listing operation. NOTES: The information in parentheses following the survey name is the SASS questionnaire form number. Response rates were weighted using the inverse of the probability of selection. SOURCE: U.S. Department of Education, National Center for Education Statistics, Schools and Staffing Survey (SASS), all components, 1999–2000, special tabulations from the response rate data files. D. Periodicity of the Survey
The first three rounds of SASS were conducted 3 years apart. The time elapsed between the 1999–2000 SASS and the previous SASS was 6 years. Future rounds of SASS are planned at 4-year intervals. E. Contents of the Manual The Manual contains 12 more chapters, including chapters on changes in SASS design, content, and methodology from the 1993–94 to 1999–2000 administrations; preparation for the 1999–2000 SASS; sample design and implementation; data collection; response rates; data processing; imputation procedures; weighting and variance estimation, a review of the quality of SASS data; information on differences between the restricted-use and public-use data files; an introduction to sampling, created, weighting, and imputation flag variables; and user notes and cautions. Information in the chapters is supported by material in the appendixes. Appendix A lists key terms for SASS. Appendix B discusses the availability of SASS questionnaires. Appendix C contains
I. Overview 11
selected unweighted and weighted unit and item response rate tables, extending the information in chapter VI, Response Rates. Appendix D provides details on the changes made to questionnaire variables in the pre-edit and the computer edit. These edits are discussed in chapter VII, Data Processing. Appendix E details the imputation procedures employed for each questionnaire, and includes tables showing the items for each questionnaire that were imputed; a general discussion of the imputation procedures used in the 1999–2000 SASS is contained in chapter VIII. There are two appendixes associated with chapter IX, Weighting and Variance Estimation: appendix F, Variable Categories Used in Developing Adjustment Factor Cells for Weighting, and appendix G, Design Effect Tables. Appendix H contains a Census Bureau report on response variance in the 1999–2000 SASS, elaborating on the summary of the report that is presented in chapter X, Reviewing the Quality of SASS Data. Appendix I provides a complete list of the SASS 1999–2000 sampling and created variables; a few of these are mentioned in chapter XII. Appendixes J, K, and L all provide additional information on points covered in chapter XIII, User Notes and Cautions. Appendix J is a crosswalk of codes for teachers’ major field of study, appendix K lists the 1990 industry and occupation codes, and appendix L is a crosswalk among items in the 1987–88, 1990–91, 1993–94, and 1999–2000 SASS.

This page is intentionally left blank.

13
II. Changes in SASS Design, Content, and Methodology from 1993–94 to 1999–2000
Several changes in survey sample design, questionnaire content, procedures, and methodology were made between the completion of the third SASS (1993–94) and the implementation of the fourth SASS in school year 1999–2000. A. Design Changes
Below is a summary of the changes made to the 1999–2000 sample design estimation procedures.
• For the private sector, the sample was reallocated to accommodate estimates for one additional affiliation, making a total of 20 affiliations.
• A list of DoD schools was obtained and included on the sampling frame giving SASS complete coverage of domestic DoD schools.
• The Department of Education, Office of Educational Improvement and Research (OERI; renamed the Institute of Education Sciences, IES, in 2002), provided a list of public charter schools that was added to the sampling frame, giving SASS complete coverage of public charter schools as of the 1998–1999 school year (Nelson et al. 2000). Questionnaires were prepared to include some items particular to public charter schools.
• The variance methodology was altered: in earlier SASS administrations, it was assumed that there was no variance associated with certainty schools, and that all error from certainty schools reflected bias. In 1999–2000, it was decided to assume that nonresponse from certainty schools followed a random process and so certainty schools could have variance due to this random process.
• Additional size classes were introduced into all weighting procedures and were customized by state and private school affiliation.
• The control of the overlap with the previous SASS was dropped and replaced with a procedure designed to minimize the overlap between SASS and the National Assessment of Educational Progress (NAEP) sample schools.
• The bootstrap variance system was refined to produce more stable variance estimates. • The school library media center sample size was expanded to include all SASS schools except
public charter schools. The Public Charter School Questionnaire included some questions from the School Library Media Center Questionnaire.
B. Content Changes
Prior to the 1999–2000 SASS administration, two extensive field tests were undertaken. (For a detailed explanation of the field tests, please refer to chapter III, Preparation for the 1999–2000 SASS). As a result of these field tests, the following additions and deletions were made to the SASS questionnaires between the 1993–94 and 1999–2000 administrations.
1. Additions
• A public charter version of the survey was added to the School Principal Questionnaire
(i.e., SASS-2D), School Questionnaire (i.e., SASS-3D), and the School Teacher Questionnaire (i.e., SASS-4D).
• School Questionnaire—number of computers, access to the Internet, whether there was a computer coordinator in the school, availability of certain types of curricular options,

14 1999–2000 SASS Data File User’s Manual
how special education students’ needs were met, changes in the school year or weekly schedule, the enrollment capacity of schools, and whether schools had programs for disruptive students.
• School Principal Questionnaire—principals’/school heads’ frequency of engaging in various school and school-related activities, perceived degree of influence of principals and other groups (state, local, school, and parents) in setting performance standards for students, barriers (e.g., personnel policies, inadequate documentation, lack of support, and stress) to dismissing poor or incompetent teachers, rewards or sanctions for success or failure to meet district or state performance goals, and means for assessing progress on school improvement plan.
• School District Questionnaire (formerly, Teacher Demand and Shortage Questionnaire)—percentage of payroll dedicated to school staff benefits, oversight of homeschooled students and public charter schools, use of school performance reports, existence of migrant education programs and number of migrant students, and procedures for recruiting and dismissing teachers.
• School Teacher Questionnaire—training, teacher induction, teacher professional development (expanded), uses of achievement tests by teachers, use of computers for instruction, and decisionmaking practices.
• School Library Media Center Questionnaire—additional technology, collaboration and policy, and copyright dates of reference materials.
2. Deletions
• School District Questionnaire—layoff data and counts of students by grade level. • School Principal Questionnaire—degrees earned—other than highest (including their
dates, in what field they were earned, and at which college or university a bachelor’s degree was earned), the location and grade levels of the previous school at which respondent was principal, breaks in service, year when eligible to retire, and benefits received in addition to salary.
• School Teacher Questionnaire—breaks in teaching service and number and type of undergraduate courses taken.
• The Student Records Questionnaire and School Library Media Specialist/Librarian Questionnaire of the 1993–94 SASS were dropped.
C. Procedural Changes
1. Timing
Data collection on some of the questionnaires for the 1999–2000 SASS began
comparatively earlier than for the 1993–94 survey. The 1999–2000 School District, School Principal, and School Library Media Center Questionnaires were mailed in September 1999; School Questionnaires were mailed in October, and approximately half of the School Teacher Questionnaires were mailed in late November with the remainder mailed in three waves from January through March 2000.
2. SASS and PSS Concurrence
The 1999–2000 school year was a data collection year for both SASS and PSS. Because
the schools in PSS were the universe for the SASS private school sample, all private schools selected for the 1999–2000 SASS were also in PSS. To avoid overburdening private school

II. Changes in SASS Design, Content, and Methodology from 1993–94 to 1999–2000 15
respondents by asking them to complete two questionnaires in which several questions were the same, the SASS Private School Questionnaire (SASS-3B) was modified to include all PSS questions. Only the SASS questionnaires were mailed to private schools selected for 1999–2000 SASS. During data processing, the PSS data were extracted from the SASS-3B records for these schools and combined with the data for the PSS schools that had not been selected for SASS.
3. Use of Generalized Survey Design and Documentation System
One of the goals of the 1999–2000 SASS was to increase automation in design,
processing, and documentation activities. Census Bureau staff became familiar with software developed by staff in the Special Surveys Division of Statistics Canada, called Developing Surveys (DevSurv), that can perform many of these functions. The version of DevSurv that staff used stored information in a Paradox database accessed through an interface, providing commonly used functions to produce collection instruments, processing files, and documentation in a variety of formats. The information that is entered includes the set of variables used in the survey (question text, response categories, specifications for edits and derived variables, and attributes such as data type, length, and comments about data quality). From this database, staff can generate survey questionnaires, computer-assisted interviewing (CAI) specifications (including CASES and Blaise), spreadsheets for testing scenarios, database structures or record layouts for the survey data files, extended codebooks, as well as SAS and SPSS structures for users to read the microdata files.
Staff used the DevSurv system as follows:
• Developed text files that contained the information for each questionnaire. This
information included the item number and source code (for paper questionnaires) as well as the computer-assisted telephone interviewing (CATI) name and the SAS dataset name.
• Loaded the text files into DevSurv, which provided an error listing by examining field lengths, skip instructions, and minimum/maximum values. Once the DevSurv database was loaded, the interface could be used to update the database and to generate output.
• Generated code for CATI instruments for 12 of the 16 SASS questionnaires.2 The authoring staff used these files as specifications for CATI instruments. For a simple questionnaire, such as the School Principal Questionnaire (232 data fields, few internal edits, and no rosters), authoring staff was able to have an instrument ready for testing the next day. For a complex instrument, the DevSurv file produced error-free code to set up the screens for each question/answer, the skips, and the range checks. Authors programmed additional logic from specifications that staff included in the DevSurv file. Authoring and testing these instruments took 2 to 4 months. These questionnaires included up to 775 items (including edit items) and generally took respondents 30 to 60 minutes to complete. All 12 instruments were completed over an 8-month period, using a total of approximately 48 person-months of work.
• Provided files for posting in an Item Bank on the NCES website (http://nces.ed.gov/surveys/sass/sassib). Staff used these files to add specifications for recoded variables, which programming staff used to program them.
2 There were no CATI instruments for the Library Media Center questionnaires, since there was a research test, for the Library Media Centers only, of offering an Internet response option in addition to or separately from the regular self-administered paper version. Any CATI follow-up on these cases would have interfered with the test. Thus, the phone calls made to Library Media Center Questionnaire respondents were to remind them to complete either the paper or Internet version. There was also no CATI follow-up for respondents to the BIA Teacher Questionnaire because this was a small enough group to handle directly with phone calls or other field follow-up.
16 1999–2000 SASS Data File User’s Manual
• Generated data dictionaries for each file. • Generated a spreadsheet containing key information for each item to be used as a starting
point for data capture specifications. • Generated codebooks for each of the files.
4. Questionnaire Printing
The 1999–2000 SASS was the first administration of SASS to use customized printing of
questionnaires. Docuprint equipment allowed for printing data specific to any respondent on any page. For SASS, it was used for the following purposes.
a. Print Respondent’s Identification Information on Any Page
Docuprint was used to provide a name,3 address, control number, and associated barcode on each questionnaire. Barcodes also were printed on every page of the questionnaire, which was useful for two reasons. First, the questionnaires were stitched together in the binding, and they were unstitched when they were prepared for imaging at the National Processing Center. Bar coding every page ensured that staff could match the respondents with their replies in the event that the individual questionnaire pages became separated. Second, staff members were able to track questionnaires in the event that the respondent information had been removed. In previous administrations of SASS only the front page had been bar coded. Some respondents, in their desire to remain anonymous, tore the identifying first page from the rest of the survey, making it difficult to match the respondent with the questionnaire.
b. Provide Information to Specific Respondents to Avoid Definitional Problems
In the 1993–94 SASS, problems arose in approximately 10 states where many of
the schools reported a larger grade range than ascribed to their school by their state. For example, some schools reported all of the K–12 grades, when the state had them as having only elementary, middle, or high school grades. Public School Questionnaires (SASS-3A) for schools in these states had the following message printed above the questions: “Please report only for grades [print grade range]. We realize your school may include more grades than [print grade range]. However, your state has reported your school on the U.S. Department of Education’s Common Core of Data (CCD) as consisting of several grade level components. Only the component consisting of grades [print grade range] was selected for participation in this survey. For consistency, please report only for the grades [print grade range]. Please call the Census Bureau at 1-800-221-1204 if you have questions about this request.”
c. Accommodate Split-panel Wording for a Library Media Center Test
The school library media center survey included an internet reporting option. A
test was administered in conjunction with this administration at each stage of data collection, which gave additional encouragement to half of the respondents to reply via Internet. Different wording for the two groups was accommodated via Docuprint.
3 The element named varied by questionnaire: it could be the school district name, the school name, the school name plus the word “principal,” or the school name and a teacher name.
II. Changes in SASS Design, Content, and Methodology from 1993–94 to 1999–2000 17
d. Personalize Questionnaires
Docuprint was used to print respondent-specific information such as return dates and names of districts, schools, and teachers on individual questionnaires. Examples explaining where the personalized statements were added and the wording of the additions are provided below.
School District Questionnaire (SASS-1A)
1. On the cover page, in the blank oval to the right of “NOTICE”— “Please return this form by [print month, day, year 17 days after mailout date] in the enclosed envelope.” 2. On page 3, for “Instructions c”— “Please return this form by [print month, day, year 17 days after mailout date] in the enclosed envelope.” 3. On page 3, for question 1a— “Is [print district name] a school district or local education agency?” School Principal Questionnaires (SASS-2A, -2B, -2C, -2D) The text described in 1 and 2 was added to all School Principal Questionnaires. 1. Added the same text as described in numbers 1 and 2 for the School District Questionnaire (but the second sentence was printed in “Instructions 1d” instead of “Instructions c”). 2. On page 3, for question 2a— “Is [print school name] still in operation?” School Questionnaires (SASS-3A, -3B, -3C, -3D) 1. On all School Questionnaires, Docuprint added the same text as described in numbers 1 and 2 for the School District Questionnaire (but the second sentence was printed in “I. Instructions c” instead of “Instructions c”). 2. On page 5 of the Public, Indian, and Public Charter School Questionnaires (SASS-3A, -3C, -3D), above question 6 for specific schools, Docuprint added the message asking schools to report only for the grades specified that was already quoted in section II.4.b. School Teacher Questionnaires (SASS-4A, -4B, -4C, -4D) The text described in 1–6 was added to all School Principal Questionnaires. 1. On cover page, in blank oval to the right of “NOTICE”— “Please return this form within 3 weeks in the enclosed envelope.”

18 1999–2000 SASS Data File User’s Manual
2. On page 4, for “Instructions a”— “This questionnaire is intended only for [print teacher name].” 3. On page 4, for “Instructions b”— “If [print teacher name] no longer works at [print school name], please mark the appropriate box below and return this questionnaire to the U.S. Census Bureau in the enclosed envelope.” 4. On page 4, for “Instructions b.2”— “Has left [print school name] for another reason, such as laid off or to take a non-teaching job.” 5. On page 4, for “Instructions b.3”— “Has never worked at [print school name].” 6. On page 4, for “Instructions c”— “If you are the person named above AND you still work at [print school name], please complete this questionnaire and return it to the U.S. Census Bureau in the enclosed envelope. Please return it within 3 weeks.” School Library Media Center Questionnaires (LS-1A, -1B, -1C)
On all School Library Media Center Questionnaires, there were two versions of page 3. One version strongly encouraged the school to respond via the Internet, while the second version suggested to the school that the internet instrument was an alternative method of completing the paper questionnaire. 1. On the cover page for all School Library Media Center Questionnaires, for “I”— “Is [print school name] currently in operation?’ 2. On the cover page for all School Library Media Center Questionnaires, for “II”— “Does [print school name] have a Library Media Center?’ 3. On page 3 of the Public School Library Media Center Questionnaire, after “2. Enter your username”— [12-digit control number] 4. On page 4 of the Public School Library Media Center Questionnaire and on page 3 of the Indian School Library Media Center Questionnaire, after the envelope symbol— “Please return this questionnaire by [print three weeks after mailout date] in the enclosed envelope.”

II. Changes in SASS Design, Content, and Methodology from 1993–94 to 1999–2000 19
5. Questionnaire Imaging
In previous SASS administrations, Census Bureau staff keyed completed questionnaires. The 1999–2000 SASS used imaging technology. Imaging the forms was expected to be faster, less costly, and at least as accurate as keying. The results of imaging were:
• Imaging was less expensive than traditional keying. Although some keying was required
(key from image, or KFI) for data that could not be read by the equipment, savings still were realized.
• The quality of the image data capture operation was comparable to, if not better than, traditional keying. The estimated overall KFI operator error rate for the 1999–2000 education surveys was 0.24 percent. This compares to a historical operator error rate of 0.28 to 0.36 percent when all data items were keyed.
• Data fields which failed the acceptance criteria level of the software recognition engine and 10 percent of the accepted data were presented to a KFI operator for interpretation (correction) and verification. The recognition engine captured 75.4 percent of the questionnaire fields (13,414,588 of 17,792,365 fields) completed on the questionnaires. Traditionally, these fields went to a keyer/operator for 100 percent verification. In this administration of SASS, only 5,374,580 fields (30.2 percent) were 100 percent verified.
D. Methodology Changes
1. Teacher Listing Form (TLF)
In 1993, the Demographic Statistical Methods Division (DSMD) of the Census Bureau conducted the Teacher List Validity Study (TLVS) in order to evaluate the quality of the data reported on the TLF. This study exposed problems with the TLF; however, TLVS did not obtain very insightful reasons for the problems. Two cognitive interview studies were undertaken on the TLF; the first round occurred in 1995 and the second round followed in 1997. A split panel test was conducted to compare the response rate of the revised version with the original TLF. The test showed there was no statistical difference in response rates between the two forms. As a result of the research, the TLF was revised in order to make it more user-friendly—instructions were trimmed, navigational characteristics were improved, definitions were sharpened, and the formatting was changed. (For more complete information, see NCES Working Paper 95–09, The Results of the 1993 Teacher List Validation Study (TLVS), by Daniel Royce, at http://nces.ed.gov/pubs95/9509.pdf; NCES Working Paper 96–05, Cognitive Research on the Teacher Listing Form for the Schools and Staffing Survey, by Cleo R. Jenkins and Dawn Von Thurn, at http://nces.ed.gov/pubs96/9605.pdf; and NCES Working Paper 97–23, Further Cognitive Research on the Schools and Staffing Survey (SASS) Teacher Listing Form, by Andrew Zukerberg and Meredith Lee, at http://nces.ed.gov/pubs97/9723.pdf.)
2. Incentives
To encourage response, the 1999–2000 SASS used several incentives, including
brochures, teacher kits, and maps. The NCES brochures, which contained summaries of the results from the 1993–94 SASS,
were included in the 1999–2000 initial mailouts of the School District, School, and School Teacher Questionnaires. The purpose of this mailing was to emphasize to educators the importance of their participation in SASS. School districts, public schools, and BIA schools were

20 1999–2000 SASS Data File User’s Manual
sent Snapshots of Public Schools, and private schools were sent Snapshots of Private Schools. Public charter schools were sent the Schools and Staffing Survey 1999–2000 brochure (NCES 1999–349). Public, private, BIA, and public charter school teachers were sent Teachers on Teaching.
The first mailout to teachers also included a voucher/order card for a teacher kit
comprised of a 24-page teacher guide and a 4-ft. by 6-ft. U.S. map with 1990 state population figures.
In December 1999, in lieu of a second reminder postcard, a thank-you letter that included
a wall map of the United States was sent to all schools. The letter also reminded those schools that they were sent a TLF, School Principal Questionnaire, and School Library Media Center Questionnaire (most schools).
3. Internet Reporting Option
An internet reporting option was developed for the School Library Media Center Questionnaire, and 13 respondents from metropolitan Washington, DC area school libraries were recruited for usability testing. Usability testing is a pretest method in which an experienced interviewer observes and videotapes (with respondent permission) respondents as they navigate their way through the survey. When each respondent completes the survey, an interviewer asks specific questions about the respondent’s experience.
Two navigation methods were compared in this test: a “scroll”-based method in which the questionnaire fit on one long page, similar to a word processor document, and a “screen”-based method in which sections of questions appeared on different pages and respondents used a next/previous button and menu bar to navigate through the questionnaire. In addition, two methods of providing edit messages to respondents who entered questionable data were tested: passive edits that gently alerted respondents to look at their response, and active edits that gave respondents the option to automatically erase their answer. Based on the findings from the usability test, a new instrument was designed using the scroll-based version with passive edits. (For more complete information, see NCES Working Paper 2000–04, Selected Papers on Education Surveys: Papers Presented at the 1998 and 1999 ASA and 1999 AAPOR Meetings, which contains the paper, “Designing Surveys for the Next Millennium: Internet Questionnaire Design Issues,” by Andrew Zukerberg, Elizabeth Nichols, and Heather Tedesco, at http://nces.ed.gov/pubs2000/200004.pdf.)
All respondents who were sent the School Library Media Center Questionnaire in the fall
field test were encouraged to complete the form using the internet reporting option. Potential respondents received two letters. The first letter contained their user name and the second letter contained their password. In order to ensure that all responses would remain secure, a 128-bit encryption was imposed.
4. Nonresponse Follow-up
For the 1993–94 SASS, reminder postcards were mailed 1 week after the initial mailing
for each type of questionnaire, and a second survey was sent to each nonrespondent about 5 weeks after the initial mailing for each type of questionnaire. For the 1999–2000 SASS, a second reminder postcard was added. In general, the first reminder postcards were mailed within 1 to 4 weeks of the initial mailout, the second copies of surveys were sent within 6 weeks of the reminder postcards, and the second reminder postcards were sent approximately 1 week after the

II. Changes in SASS Design, Content, and Methodology from 1993–94 to 1999–2000 21
second survey mailout. However, the teacher surveys were sent out in four waves, and due to timing constraints, wave 4 of the teacher surveys did not receive a second mailout, and only wave 1 received a second reminder postcard. In addition, schools received a letter instead of a second postcard.
For the 1993–94 survey, nonresponse follow-up was apportioned between CATI and
Census field representatives (FRs). CATI was used for principal, library, librarian, public school, private school teacher, and BIA school teacher cases, and about two-thirds of the public school teacher cases, while FRs handled nonresponse follow-up for LEAs, private schools, BIA schools, and the remainder of the public school teachers.
For the 1999–2000 SASS, in general, nonresponding cases—except for library cases—
were scheduled for CATI follow-up first, and then sent to FRs. However, some nonresponding cases, including most BIA cases, all cases where there was no telephone number, approximately 18 percent of the wave 2 and 3 teacher cases (including all private school and public charter school cases), TLF cases that were classified as refusals but who returned another SASS form, and requests for a personal visit, were sent directly to FRs. In addition, FRs making a visit to a TLF school were provided with other nonresponse questionnaires for that school. Due to budgetary constraints, the number of teacher cases assigned for CATI and field follow-up was reduced by approximately 15 percent.
A separate CATI instrument was used for nonresponse follow-up for a subsample (due to
budgetary constraints) of those included in the school library media center survey. This CATI instrument did not collect data; rather, it was a split panel research component that encouraged half of the respondents to complete the questionnaire via the Internet and instructed the other half to fill out the paper form (without mention of the internet option).
5. School Locale Code Changes
CCD changed the Census Bureau’s geographic coding of public schools in metropolitan and nonmetropolitan areas as of school year 1998–99. The definitional change was to subdivide “rural” into two codes. As of 1998–99, the definition for code 7 was narrowed from “rural” to “rural, outside a metropolitan area,” and areas that were “rural, within a metropolitan area” were assigned to a new code, 8. This recognizes the areas that are rural, even though the entire surrounding places may be defined as part of a metropolitan area. At the same time, there has been more reporting and assignment of locale codes for public schools using a more precise system of physical addresses (although some public schools still are using mailing addresses). The physical address allows for a more precise coding than at the ZIP code level of the mailing address of a public school. The change in the method of assigning locale codes has resulted in some cases shifting from one locale code prior to the 1998–99 school year to another as of 1998–99 and subsequent years. The 3-level urbanicity variable now includes the code 8 rural areas in the “urban fringe/large town” category, rather than as part of the “rural/small town” category. This definitional and operational change may result in some comparisons of schools by community type or locale over time that do not reflect actual change, but merely a shift in the distribution of schools by community type due to the difference in definition of rural areas or method of community type assignment. (For more complete information, see NCES Working Paper 2002-02, School Locale Codes 1987–2000, by Nancy Speicher, at http://nces.ed.gov/pubs2002/200202.pdf.)

This page is intentionally left blank.

23
III. Preparation for the 1999–2000 SASS Improvement of questionnaires and procedures is an ongoing process for SASS. Before each survey year, field tests and other studies (e.g., cognitive research) are conducted to test new or revised questionnaire items and changes in procedures. The ultimate purpose of these studies is to understand how respondents interpret the questions. Four stages of testing were undertaken in preparation for the 1999–2000 SASS: • Cognitive interviews on the School Teacher Questionnaire; • Cognitive interviews and a split panel test on the Teacher Listing Form; • 1998 Spring Field Test; and • 1998 Fall Spring Test. A. Cognitive Interviews on the School Teacher Questionnaires
Twenty (20) cognitive interviews were conducted with teachers in 1995 in order to evaluate the overall format of the 1993–94 teacher questionnaires and to investigate questions that were identified as problematic during the 1993–94 survey. A combination of cognitive techniques were used—including the concurrent think-aloud technique, the use of paraphrasing, and unstructured retrospective interviewing. Respondents were asked to read aloud as they read through the form and to think aloud as they answered the questions. With the respondents’ permission, the interviews were tape-recorded and either a summary or a transcription of each was written.
Interviews were conducted with eight new teachers (i.e., teachers in their first, second, or third
year of teaching) and seven experienced teachers. Five of the new teachers and five of the experienced teachers were from public schools, while three of the new teachers and two of the experienced teachers were from private schools. In addition, since the answers of teachers with alternative certificates to question 22b (type of certificate) were deemed especially problematic by NCES, five interviews were conducted with public school teachers who were identified by the Department of Education as having alternative certificates.
The following overall issues and recommendations were noted.
• Skip Instructions—The wording, location, and context of the skip instructions differed among questions. As a result respondents overlooked skip instructions or completely misunderstood them. The recommendations included reducing the number of questions with skip instructions and placing explicit instructions after every question telling respondents to move ahead.
• Column format—The questionnaires were arranged in a one-column format that worked well. However, the lines separating the questions from one another cluttered the page, acting like a stop sign to respondents. As a result respondents were inhibited from moving freely from one question to another. It was recommended that the lines separating the questions be removed.
• Question 22b—respondents who had alternative certificates and who were supposed to mark this category didn’t necessarily mark the proper category. It was recommended that a new question should be created to obtain this information.
(For more complete information, see NCES 97-10, Report of Cognitive Research on the Public
and Private School Teacher Questionnaires for the Schools and Staffing Survey 1993–94 School Year, by Cleo R. Jenkins, at http://nces.ed.gov/pubs97/9710.pdf.)
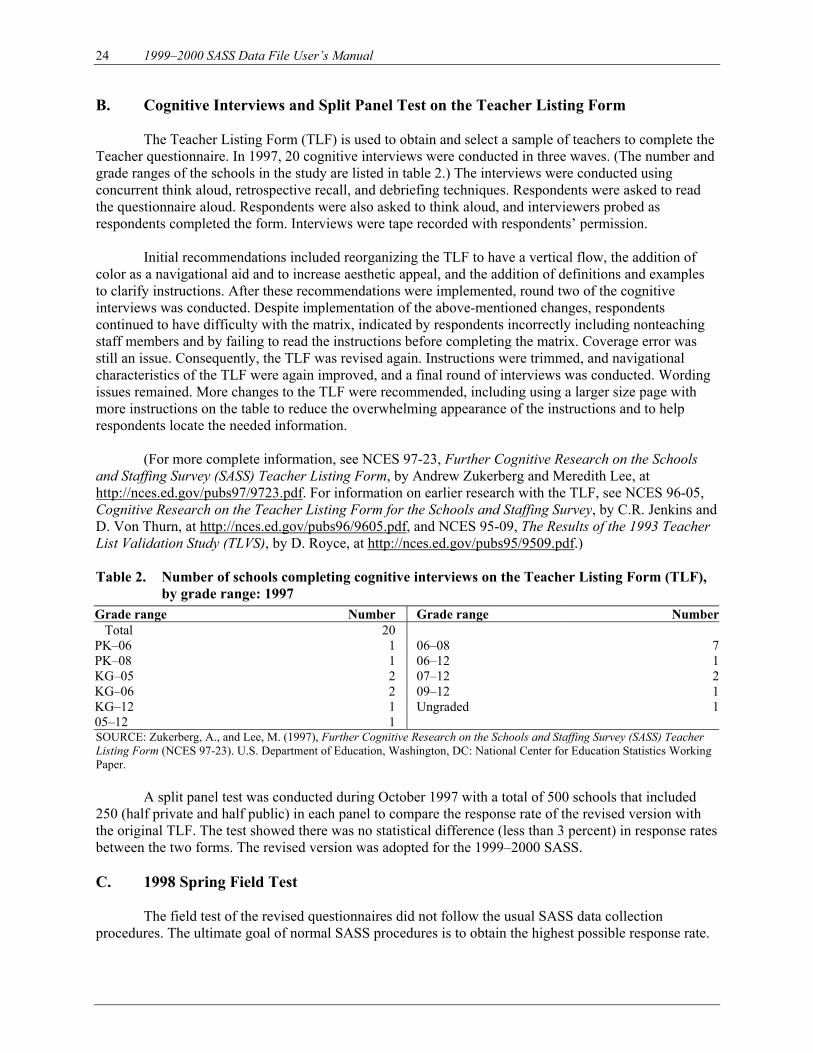
24 1999–2000 SASS Data File User’s Manual
B. Cognitive Interviews and Split Panel Test on the Teacher Listing Form
The Teacher Listing Form (TLF) is used to obtain and select a sample of teachers to complete the Teacher questionnaire. In 1997, 20 cognitive interviews were conducted in three waves. (The number and grade ranges of the schools in the study are listed in table 2.) The interviews were conducted using concurrent think aloud, retrospective recall, and debriefing techniques. Respondents were asked to read the questionnaire aloud. Respondents were also asked to think aloud, and interviewers probed as respondents completed the form. Interviews were tape recorded with respondents’ permission.
Initial recommendations included reorganizing the TLF to have a vertical flow, the addition of
color as a navigational aid and to increase aesthetic appeal, and the addition of definitions and examples to clarify instructions. After these recommendations were implemented, round two of the cognitive interviews was conducted. Despite implementation of the above-mentioned changes, respondents continued to have difficulty with the matrix, indicated by respondents incorrectly including nonteaching staff members and by failing to read the instructions before completing the matrix. Coverage error was still an issue. Consequently, the TLF was revised again. Instructions were trimmed, and navigational characteristics of the TLF were again improved, and a final round of interviews was conducted. Wording issues remained. More changes to the TLF were recommended, including using a larger size page with more instructions on the table to reduce the overwhelming appearance of the instructions and to help respondents locate the needed information.
(For more complete information, see NCES 97-23, Further Cognitive Research on the Schools
and Staffing Survey (SASS) Teacher Listing Form, by Andrew Zukerberg and Meredith Lee, at http://nces.ed.gov/pubs97/9723.pdf. For information on earlier research with the TLF, see NCES 96-05, Cognitive Research on the Teacher Listing Form for the Schools and Staffing Survey, by C.R. Jenkins and D. Von Thurn, at http://nces.ed.gov/pubs96/9605.pdf, and NCES 95-09, The Results of the 1993 Teacher List Validation Study (TLVS), by D. Royce, at http://nces.ed.gov/pubs95/9509.pdf.)
Table 2. Number of schools completing cognitive interviews on the Teacher Listing Form (TLF),
by grade range: 1997 Grade range Number Grade range Number Total 20 PK–06 1 06–08 7PK–08 1 06–12 1KG–05 2 07–12 2KG–06 2 09–12 1KG–12 1 Ungraded 105–12 1 SOURCE: Zukerberg, A., and Lee, M. (1997), Further Cognitive Research on the Schools and Staffing Survey (SASS) Teacher Listing Form (NCES 97-23). U.S. Department of Education, Washington, DC: National Center for Education Statistics Working Paper.
A split panel test was conducted during October 1997 with a total of 500 schools that included 250 (half private and half public) in each panel to compare the response rate of the revised version with the original TLF. The test showed there was no statistical difference (less than 3 percent) in response rates between the two forms. The revised version was adopted for the 1999–2000 SASS. C. 1998 Spring Field Test
The field test of the revised questionnaires did not follow the usual SASS data collection procedures. The ultimate goal of normal SASS procedures is to obtain the highest possible response rate.

III. Preparation for the 1999–2000 SASS 25
The goal of the field test was not to maximize response rate but rather to get enough responses to review in order to determine how well the questionnaires worked. The 1998 field test consisted of abbreviated versions of the questionnaires that included primarily newly developed item modules as well as some of the core items that were asked on previous versions. In early 1998, an advance letter was mailed to the sample LEAs. The teacher sample was selected in January from the teacher lists collected in the split panel TLF test administered in the fall of 1997. The initial mailout for the School and Principal questionnaires was completed in March 1998, followed by a reminder postcard 1 week later. The School District and School Teacher Questionnaires were mailed in March; however, in lieu of sending reminder cards to the individual districts and teachers, Census staff made reminder calls to urge them to return their completed questionnaires. A second questionnaire was mailed approximately 5 weeks after the first mailout to all sample cases that had not returned the questionnaire. Approximately 5 weeks after the second mailout, Census Bureau field staff commenced telephone follow-up to collect cases for behavior coding, which is the systematic application of codes to the interaction between the respondent and interview. Data collection was completed in May 1998.
The table below illustrates the sample sizes and response rates for the field test.
Table 3. Field test sample size and final response rate, by questionnaire: Spring 1998 Questionnaire Sample size Final response rate1 (percent)School District (SASS-1A) 247 80Public School Principal (SASS-2A) 250 71Private School Principal (SASS-2B) 250 71Public School (SASS-3A) 250 68Private School (SASS-3B) 250 73Public School Teacher (SASS-4A) 550 70Private School Teacher (SASS-4B) 550 591 Results from mailout and from telephone follow-up that was limited to obtaining a sample for behavior coding (i.e., the systematic application of codes to the interaction between the respondent and interview). NOTE: The information in parentheses following the questionnaire name is the SASS questionnaire form number. SOURCE: Zukerberg, A. (1999, March). 1998 Pretest and Questionnaire Revisions for the 2000 SASS. Paper presented at the National Center for Education Statistics’ Schools and Staffing Survey (SASS) Technical Review Panel Meeting, Washington, DC.
As mentioned earlier, the questionnaires used in the first field test were abbreviated versions that included newly developed item modules as well as some of the core items that were asked on previous versions. The additions to the individual questionnaires were: • School Questionnaire—teacher professional development opportunities provided by the school,
school reform, parental involvement, and school outcomes. • School Principal Questionnaire—school reform, and professional development for both teachers
and principals. • School Teacher Questionnaire—teacher training, teacher induction, teacher professional
development, instructional practices for math teachers, curriculum development, and decision-making practices.
• School District Questionnaire—teacher professional development, school capacity, and district organization and management.
The completed questionnaires were evaluated using the following three methodologies.
1. Professional Review Panel. During the summer of 1998 a joint NCES-Census Bureau team
reviewed approximately 1,600 completed questionnaires. The team identified and logged inconsistencies in response, respondent comments on the questionnaires, and other potential
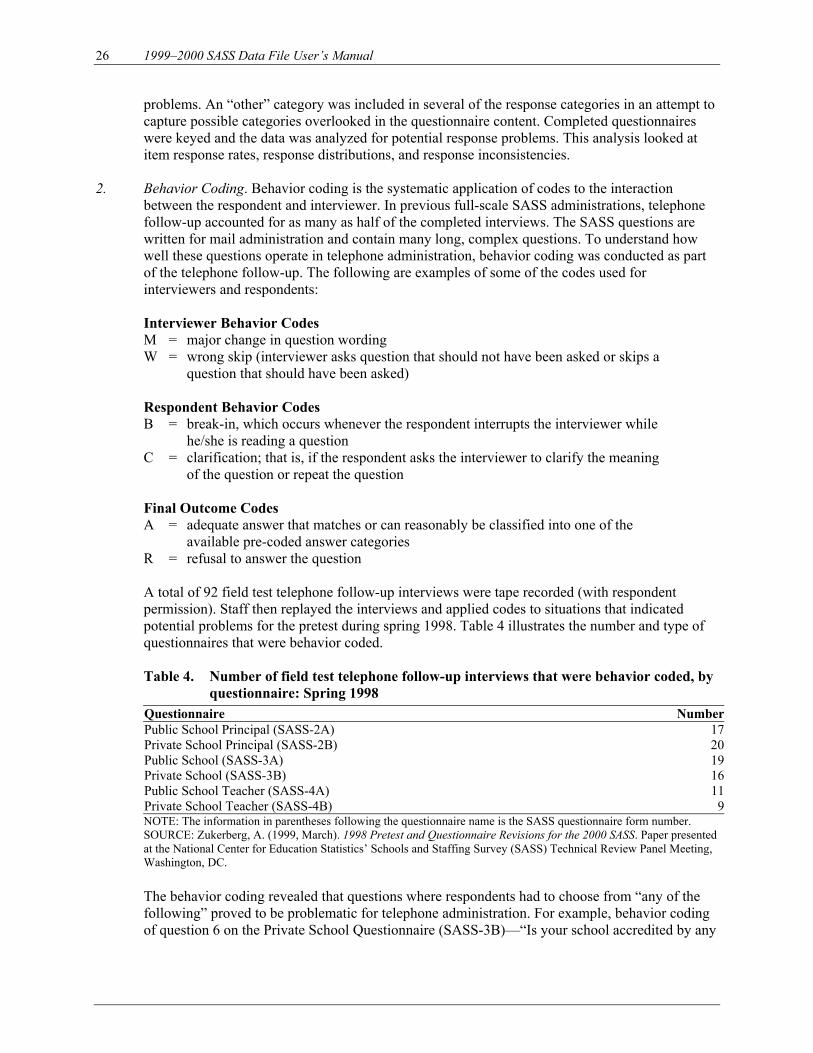
26 1999–2000 SASS Data File User’s Manual
problems. An “other” category was included in several of the response categories in an attempt to capture possible categories overlooked in the questionnaire content. Completed questionnaires were keyed and the data was analyzed for potential response problems. This analysis looked at item response rates, response distributions, and response inconsistencies.
2. Behavior Coding. Behavior coding is the systematic application of codes to the interaction
between the respondent and interviewer. In previous full-scale SASS administrations, telephone follow-up accounted for as many as half of the completed interviews. The SASS questions are written for mail administration and contain many long, complex questions. To understand how well these questions operate in telephone administration, behavior coding was conducted as part of the telephone follow-up. The following are examples of some of the codes used for interviewers and respondents:
Interviewer Behavior Codes M = major change in question wording W = wrong skip (interviewer asks question that should not have been asked or skips a
question that should have been asked) Respondent Behavior Codes B = break-in, which occurs whenever the respondent interrupts the interviewer while
he/she is reading a question C = clarification; that is, if the respondent asks the interviewer to clarify the meaning
of the question or repeat the question Final Outcome Codes A = adequate answer that matches or can reasonably be classified into one of the
available pre-coded answer categories R = refusal to answer the question
A total of 92 field test telephone follow-up interviews were tape recorded (with respondent permission). Staff then replayed the interviews and applied codes to situations that indicated potential problems for the pretest during spring 1998. Table 4 illustrates the number and type of questionnaires that were behavior coded.
Table 4. Number of field test telephone follow-up interviews that were behavior coded, by
questionnaire: Spring 1998 Questionnaire NumberPublic School Principal (SASS-2A) 17Private School Principal (SASS-2B) 20Public School (SASS-3A) 19Private School (SASS-3B) 16Public School Teacher (SASS-4A) 11Private School Teacher (SASS-4B) 9NOTE: The information in parentheses following the questionnaire name is the SASS questionnaire form number. SOURCE: Zukerberg, A. (1999, March). 1998 Pretest and Questionnaire Revisions for the 2000 SASS. Paper presented at the National Center for Education Statistics’ Schools and Staffing Survey (SASS) Technical Review Panel Meeting, Washington, DC.
The behavior coding revealed that questions where respondents had to choose from “any of the following” proved to be problematic for telephone administration. For example, behavior coding of question 6 on the Private School Questionnaire (SASS-3B)—“Is your school accredited by any
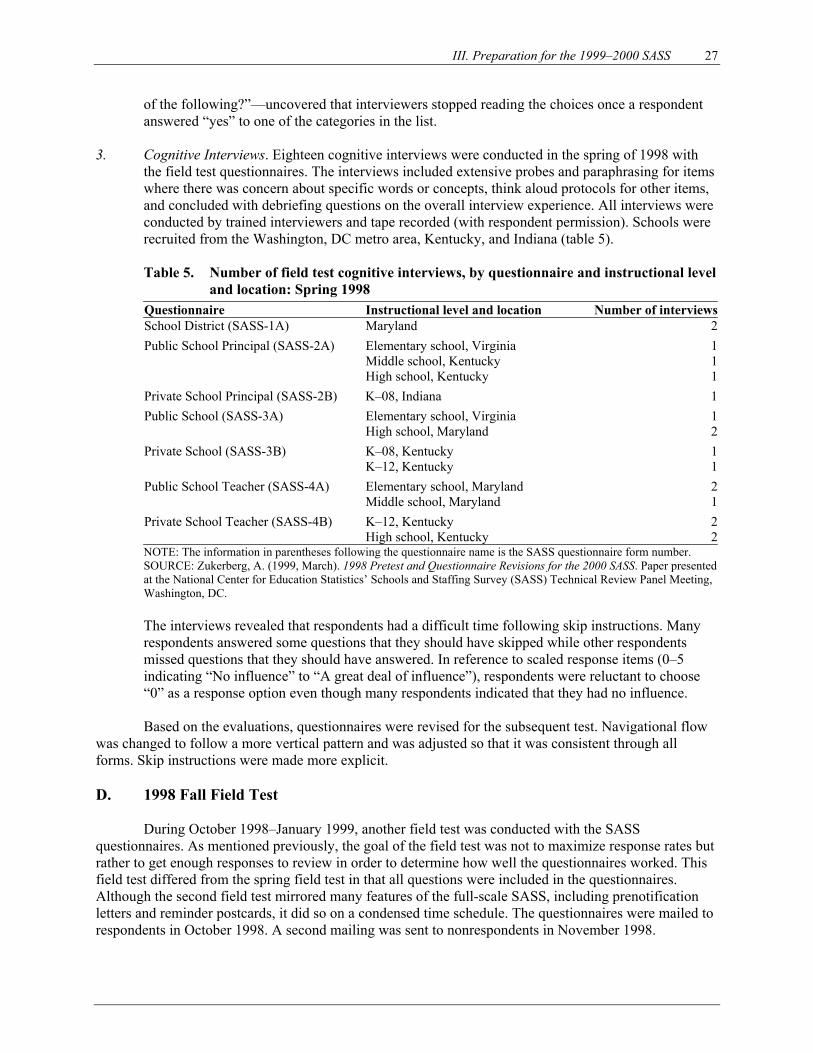
III. Preparation for the 1999–2000 SASS 27
of the following?”—uncovered that interviewers stopped reading the choices once a respondent answered “yes” to one of the categories in the list.
3. Cognitive Interviews. Eighteen cognitive interviews were conducted in the spring of 1998 with the field test questionnaires. The interviews included extensive probes and paraphrasing for items where there was concern about specific words or concepts, think aloud protocols for other items, and concluded with debriefing questions on the overall interview experience. All interviews were conducted by trained interviewers and tape recorded (with respondent permission). Schools were recruited from the Washington, DC metro area, Kentucky, and Indiana (table 5). Table 5. Number of field test cognitive interviews, by questionnaire and instructional level
and location: Spring 1998 Questionnaire Instructional level and location Number of interviewsSchool District (SASS-1A) Maryland 2
Public School Principal (SASS-2A) Elementary school, Virginia Middle school, Kentucky High school, Kentucky
111
Private School Principal (SASS-2B) K–08, Indiana 1
Public School (SASS-3A) Elementary school, Virginia High school, Maryland
12
Private School (SASS-3B) K–08, Kentucky K–12, Kentucky
11
Public School Teacher (SASS-4A) Elementary school, Maryland Middle school, Maryland
21
Private School Teacher (SASS-4B) K–12, Kentucky High school, Kentucky
22
NOTE: The information in parentheses following the questionnaire name is the SASS questionnaire form number. SOURCE: Zukerberg, A. (1999, March). 1998 Pretest and Questionnaire Revisions for the 2000 SASS. Paper presented at the National Center for Education Statistics’ Schools and Staffing Survey (SASS) Technical Review Panel Meeting, Washington, DC.
The interviews revealed that respondents had a difficult time following skip instructions. Many respondents answered some questions that they should have skipped while other respondents missed questions that they should have answered. In reference to scaled response items (0–5 indicating “No influence” to “A great deal of influence”), respondents were reluctant to choose “0” as a response option even though many respondents indicated that they had no influence.
Based on the evaluations, questionnaires were revised for the subsequent test. Navigational flow was changed to follow a more vertical pattern and was adjusted so that it was consistent through all forms. Skip instructions were made more explicit. D. 1998 Fall Field Test
During October 1998–January 1999, another field test was conducted with the SASS questionnaires. As mentioned previously, the goal of the field test was not to maximize response rates but rather to get enough responses to review in order to determine how well the questionnaires worked. This field test differed from the spring field test in that all questions were included in the questionnaires. Although the second field test mirrored many features of the full-scale SASS, including prenotification letters and reminder postcards, it did so on a condensed time schedule. The questionnaires were mailed to respondents in October 1998. A second mailing was sent to nonrespondents in November 1998.
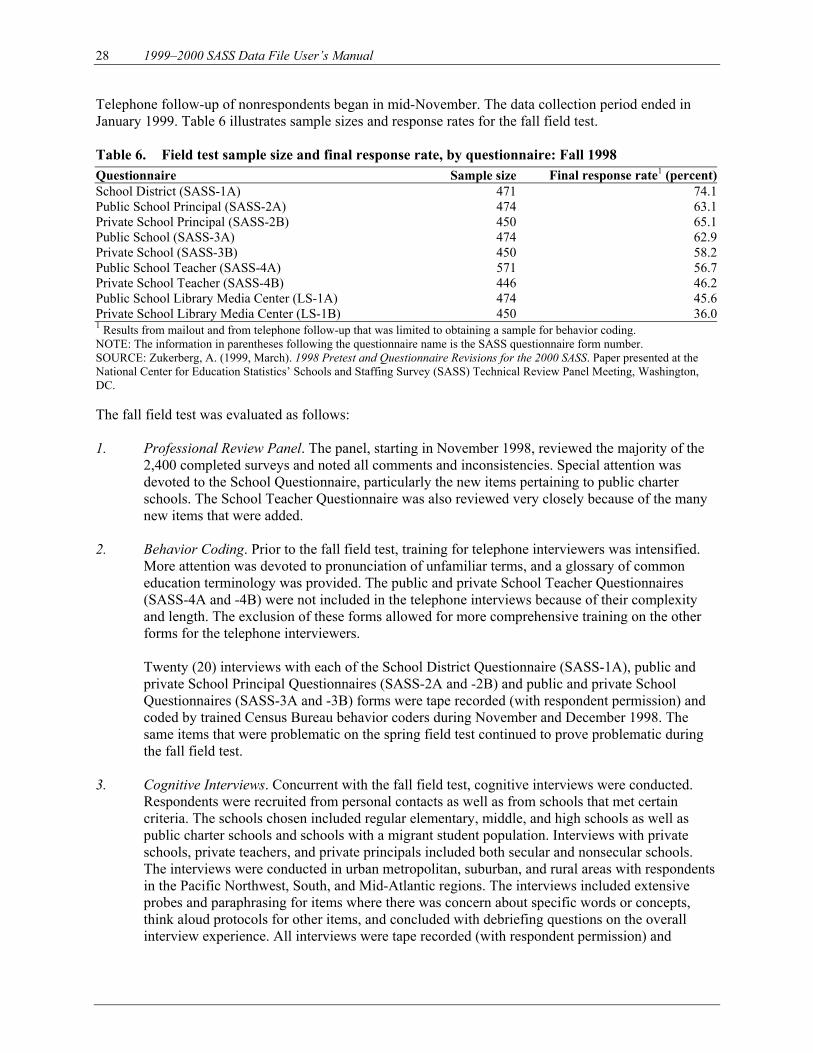
28 1999–2000 SASS Data File User’s Manual
Telephone follow-up of nonrespondents began in mid-November. The data collection period ended in January 1999. Table 6 illustrates sample sizes and response rates for the fall field test. Table 6. Field test sample size and final response rate, by questionnaire: Fall 1998 Questionnaire Sample size Final response rate1 (percent)School District (SASS-1A) 471 74.1Public School Principal (SASS-2A) 474 63.1Private School Principal (SASS-2B) 450 65.1Public School (SASS-3A) 474 62.9Private School (SASS-3B) 450 58.2Public School Teacher (SASS-4A) 571 56.7Private School Teacher (SASS-4B) 446 46.2Public School Library Media Center (LS-1A) 474 45.6Private School Library Media Center (LS-1B) 450 36.01 Results from mailout and from telephone follow-up that was limited to obtaining a sample for behavior coding. NOTE: The information in parentheses following the questionnaire name is the SASS questionnaire form number. SOURCE: Zukerberg, A. (1999, March). 1998 Pretest and Questionnaire Revisions for the 2000 SASS. Paper presented at the National Center for Education Statistics’ Schools and Staffing Survey (SASS) Technical Review Panel Meeting, Washington, DC. The fall field test was evaluated as follows: 1. Professional Review Panel. The panel, starting in November 1998, reviewed the majority of the
2,400 completed surveys and noted all comments and inconsistencies. Special attention was devoted to the School Questionnaire, particularly the new items pertaining to public charter schools. The School Teacher Questionnaire was also reviewed very closely because of the many new items that were added.
2. Behavior Coding. Prior to the fall field test, training for telephone interviewers was intensified.
More attention was devoted to pronunciation of unfamiliar terms, and a glossary of common education terminology was provided. The public and private School Teacher Questionnaires (SASS-4A and -4B) were not included in the telephone interviews because of their complexity and length. The exclusion of these forms allowed for more comprehensive training on the other forms for the telephone interviewers.
Twenty (20) interviews with each of the School District Questionnaire (SASS-1A), public and private School Principal Questionnaires (SASS-2A and -2B) and public and private School Questionnaires (SASS-3A and -3B) forms were tape recorded (with respondent permission) and coded by trained Census Bureau behavior coders during November and December 1998. The same items that were problematic on the spring field test continued to prove problematic during the fall field test.
3. Cognitive Interviews. Concurrent with the fall field test, cognitive interviews were conducted.
Respondents were recruited from personal contacts as well as from schools that met certain criteria. The schools chosen included regular elementary, middle, and high schools as well as public charter schools and schools with a migrant student population. Interviews with private schools, private teachers, and private principals included both secular and nonsecular schools. The interviews were conducted in urban metropolitan, suburban, and rural areas with respondents in the Pacific Northwest, South, and Mid-Atlantic regions. The interviews included extensive probes and paraphrasing for items where there was concern about specific words or concepts, think aloud protocols for other items, and concluded with debriefing questions on the overall interview experience. All interviews were tape recorded (with respondent permission) and
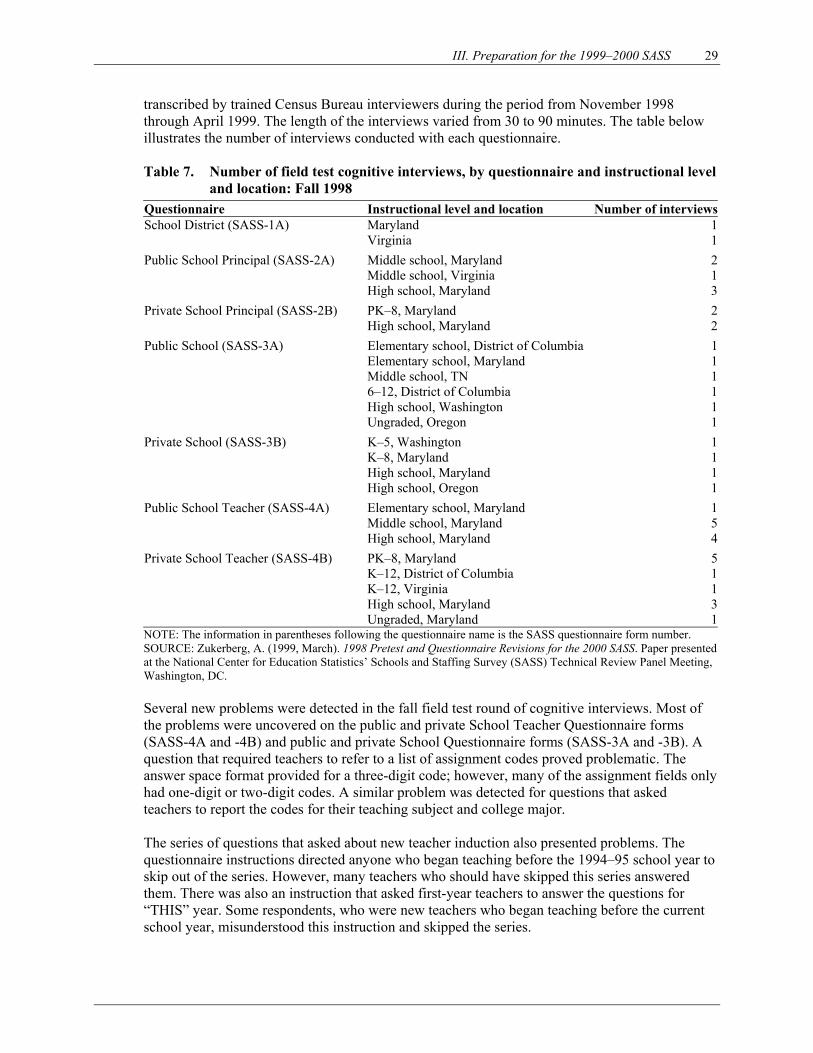
III. Preparation for the 1999–2000 SASS 29
transcribed by trained Census Bureau interviewers during the period from November 1998 through April 1999. The length of the interviews varied from 30 to 90 minutes. The table below illustrates the number of interviews conducted with each questionnaire.
Table 7. Number of field test cognitive interviews, by questionnaire and instructional level
and location: Fall 1998 Questionnaire Instructional level and location Number of interviewsSchool District (SASS-1A) Maryland 1 Virginia 1
Public School Principal (SASS-2A) Middle school, Maryland 2 Middle school, Virginia 1 High school, Maryland 3
Private School Principal (SASS-2B) PK–8, Maryland 2 High school, Maryland 2
Public School (SASS-3A) Elementary school, District of Columbia 1 Elementary school, Maryland 1 Middle school, TN 1 6–12, District of Columbia 1 High school, Washington 1 Ungraded, Oregon 1
Private School (SASS-3B) K–5, Washington 1 K–8, Maryland 1 High school, Maryland 1 High school, Oregon 1
Public School Teacher (SASS-4A) Elementary school, Maryland 1 Middle school, Maryland 5 High school, Maryland 4
Private School Teacher (SASS-4B) PK–8, Maryland 5 K–12, District of Columbia 1 K–12, Virginia 1 High school, Maryland 3 Ungraded, Maryland 1NOTE: The information in parentheses following the questionnaire name is the SASS questionnaire form number. SOURCE: Zukerberg, A. (1999, March). 1998 Pretest and Questionnaire Revisions for the 2000 SASS. Paper presented at the National Center for Education Statistics’ Schools and Staffing Survey (SASS) Technical Review Panel Meeting, Washington, DC.
Several new problems were detected in the fall field test round of cognitive interviews. Most of the problems were uncovered on the public and private School Teacher Questionnaire forms (SASS-4A and -4B) and public and private School Questionnaire forms (SASS-3A and -3B). A question that required teachers to refer to a list of assignment codes proved problematic. The answer space format provided for a three-digit code; however, many of the assignment fields only had one-digit or two-digit codes. A similar problem was detected for questions that asked teachers to report the codes for their teaching subject and college major. The series of questions that asked about new teacher induction also presented problems. The questionnaire instructions directed anyone who began teaching before the 1994–95 school year to skip out of the series. However, many teachers who should have skipped this series answered them. There was also an instruction that asked first-year teachers to answer the questions for “THIS” year. Some respondents, who were new teachers who began teaching before the current school year, misunderstood this instruction and skipped the series.
30 1999–2000 SASS Data File User’s Manual
On the public and private School Questionnaire forms (SASS-3A and -3B), there is a series of questions that pertains to migrant students. Before interviewing schools with migrant students, the interviewers checked with the local Migrant Education offices to find out what schools had these types of students and how many there were. However, during the interviews, some of these schools answered “No” to all the questions that pertained to migrant students.
4. Usability Testing. In addition to the paper SASS forms, an internet reporting option was developed for the School Library Media Center Questionnaire. Thirteen respondents from metropolitan Washington, DC area school libraries were recruited for usability testing. Usability testing is a pretest method in which an experienced interviewer observes and videotapes (with respondent permission) a respondent as they navigate their way through the survey. When the respondent completes the survey, an interviewer asks specific questions about the respondent’s experience. Two navigation methods were compared in this test: a “scroll”-based method in which the questionnaire fit on one long page, similar to a word processor document, and a “screen”-based method in which sections of questions appeared on different pages and respondents used a next/previous button and menu bar to navigate through the questionnaire. In addition, two methods of providing edit messages to respondents who entered questionable data were tested: passive edits that gently alerted respondents to look at their response, and active edits that gave respondents the option to automatically erase their answer. A new instrument was designed based on findings from the usability test. The scroll-based version with passive edits was adopted.
(For more complete information, see NCES 2000–04, Selected Papers on Education Surveys: Papers Presented at the 1998 and 1999 ASA and 1999 AAPOR Meetings, which contains the paper, “Designing Surveys for the Next Millennium: Internet Questionnaire Design Issues,” by Andrew Zukerberg, Elizabeth Nichols, and Heather Tedesco, at http://nces.ed.gov/pubs2000/200004.pdf.)
All respondents who were sent the School Library Media Center Questionnaire in the fall field test were encouraged to complete the form using the internet reporting option. Potential respondents received two letters. The first letter contained their user name and the second letter contained their password. In order to ensure that all responses would remain secure, a 128-bit encryption was imposed.
E. Findings and Actions Taken Subsequent to the 1998 Fall Field Test
Findings and their resolutions are presented below, divided into separate sections for individual SASS questionnaires and overall issues.
Overall Issues Finding Resolution
Respondents missed skip patterns on many occasions (across all questionnaires). Some respondents answered questions that they were supposed to “skip” while some did not answer questions that were intended for them.
►
The skip instructions (e.g., “SKIP to item 4b below”) were revised. The term “skip” was replaced with “GO to,” and the boxes containing these instructions were shaded a deeper color than the background to help them to stand out. (See exhibit 1.)
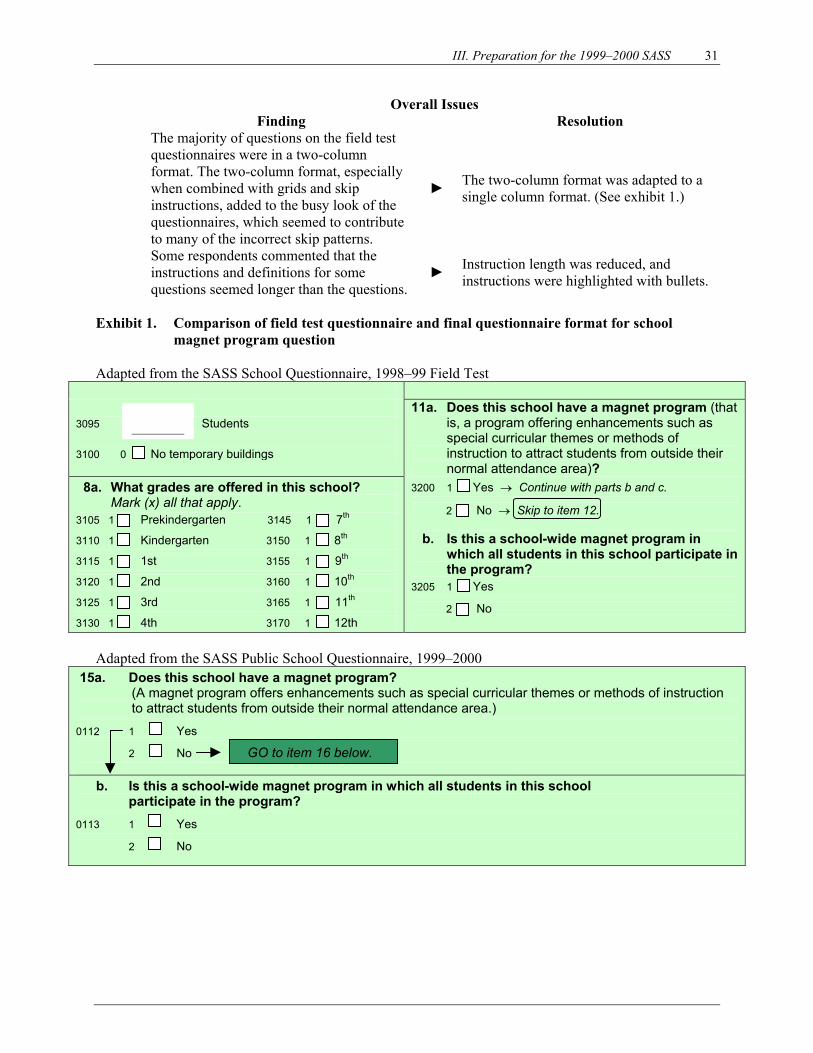
III. Preparation for the 1999–2000 SASS 31
Overall Issues Finding Resolution
The majority of questions on the field test questionnaires were in a two-column format. The two-column format, especially when combined with grids and skip instructions, added to the busy look of the questionnaires, which seemed to contribute to many of the incorrect skip patterns.
► The two-column format was adapted to a single column format. (See exhibit 1.)
Some respondents commented that the instructions and definitions for some questions seemed longer than the questions.
► Instruction length was reduced, and instructions were highlighted with bullets.
Exhibit 1. Comparison of field test questionnaire and final questionnaire format for school
magnet program question Adapted from the SASS School Questionnaire, 1998–99 Field Test
3095 Students 3100 0 No temporary buildings
11a. Does this school have a magnet program (that is, a program offering enhancements such as special curricular themes or methods of instruction to attract students from outside their normal attendance area)?
8a. What grades are offered in this school? Mark (x) all that apply. 3105 1 Prekindergarten 3145 1 7th
3110 1 Kindergarten 3150 1 8th
3115 1 1st 3155 1 9th
3120 1 2nd 3160 1 10th
3125 1 3rd 3165 1 11th
3130 1 4th 3170 1 12th
3200 1 Yes → Continue with parts b and c.
2 No → Skip to item 12.
b. Is this a school-wide magnet program in which all students in this school participate in the program?
3205 1 Yes
2 No
Adapted from the SASS Public School Questionnaire, 1999–2000
15a. Does this school have a magnet program? (A magnet program offers enhancements such as special curricular themes or methods of instruction to attract students from outside their normal attendance area.)
0112 1 Yes
2 No
b. Is this a school-wide magnet program in which all students in this school participate in the program?
0113 1 Yes
2 No
GO to item 16 below.
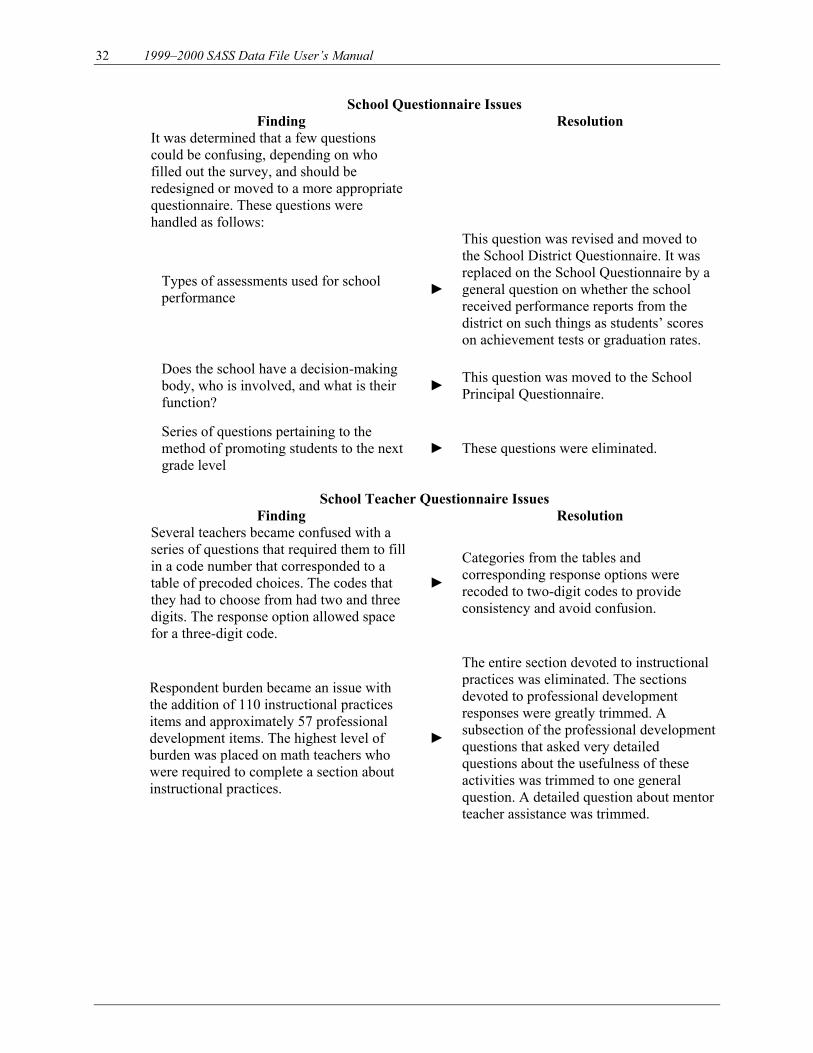
32 1999–2000 SASS Data File User’s Manual
School Questionnaire Issues Finding Resolution
It was determined that a few questions could be confusing, depending on who filled out the survey, and should be redesigned or moved to a more appropriate questionnaire. These questions were handled as follows:
Types of assessments used for school performance ►
This question was revised and moved to the School District Questionnaire. It was replaced on the School Questionnaire by a general question on whether the school received performance reports from the district on such things as students’ scores on achievement tests or graduation rates.
Does the school have a decision-making body, who is involved, and what is their function?
► This question was moved to the School Principal Questionnaire.
Series of questions pertaining to the method of promoting students to the next grade level
► These questions were eliminated.
School Teacher Questionnaire Issues
Finding Resolution Several teachers became confused with a series of questions that required them to fill in a code number that corresponded to a table of precoded choices. The codes that they had to choose from had two and three digits. The response option allowed space for a three-digit code.
►
Categories from the tables and corresponding response options were recoded to two-digit codes to provide consistency and avoid confusion.
Respondent burden became an issue with the addition of 110 instructional practices items and approximately 57 professional development items. The highest level of burden was placed on math teachers who were required to complete a section about instructional practices.
►
The entire section devoted to instructional practices was eliminated. The sections devoted to professional development responses were greatly trimmed. A subsection of the professional development questions that asked very detailed questions about the usefulness of these activities was trimmed to one general question. A detailed question about mentor teacher assistance was trimmed.
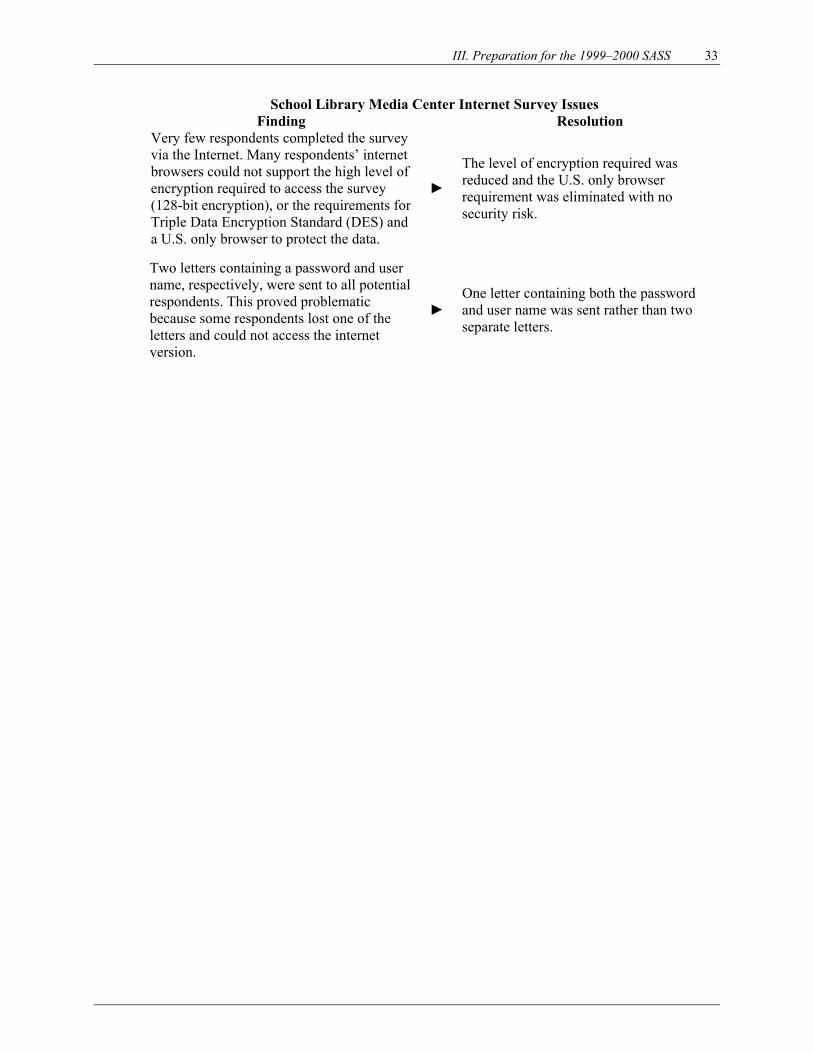
III. Preparation for the 1999–2000 SASS 33
School Library Media Center Internet Survey Issues Finding Resolution
Very few respondents completed the survey via the Internet. Many respondents’ internet browsers could not support the high level of encryption required to access the survey (128-bit encryption), or the requirements for Triple Data Encryption Standard (DES) and a U.S. only browser to protect the data.
►
The level of encryption required was reduced and the U.S. only browser requirement was eliminated with no security risk.
Two letters containing a password and user name, respectively, were sent to all potential respondents. This proved problematic because some respondents lost one of the letters and could not access the internet version.
► One letter containing both the password and user name was sent rather than two separate letters.

This page is intentionally left blank.
35
IV. Sample Design and Implementation SASS uses a stratified probability sample design.4 Details of frame sources, stratification variables, allocation methods, sorting, and sample selection are described in this chapter. Schools were selected first, and the chapter starts with a discussion of the public, BIA, and public charter school sample design and implementation. Once the public schools were selected, the districts associated with these schools were generally in the sample as well. Thus, details of district sample selection follow the discussion of public schools. The private schools are discussed next, followed by a discussion of how the original 1999–2000 SASS selection probabilities were adjusted so that the expected number of private schools that overlapped between the SASS, NAEP, and ECLS samples was minimized without changing a school’s overall selection probability. The school library media center sample, which was a subsample of the SASS school sample, is discussed after that. A sample of teachers was selected within each sampled school; details of the teacher sample are discussed last. A. Public, BIA, and Public Charter Schools
1. Sampling Frames
NCES constructs separate sampling frames for each survey component. The public, BIA, and public charter school frames, and the adjustments they undergo, are described below.
Public schools. The sampling frame for public schools for the 1999–2000 SASS was an
adjusted version of the 1997–98 school year CCD file. NCES collects CCD data annually from all state education agencies. NCES and the state education agencies work cooperatively to assure comparability between data elements reported. CCD is believed to be the most complete public school listing available. CCD includes regular public schools as well as nonregular schools, such as special education, vocational, or technical schools. For the 1997–98 school year, state education agencies used their administrative record data to report data for a total of 91,340 schools in the United States and its outlying areas.
Due to timing constraints, NCES began working with the preliminary 1997–98 CCD file
rather than the final version. Consequently, some corrections and additions to the CCD records needed to be made in order to create a relatively clean sampling frame. Records with missing grade range or address information were contacted. Missing phone numbers were looked up. Student/teacher ratios were checked for reasonability and, if above 50, the teacher count was blanked out and subsequently imputed. Locale code distributions were checked for reasonability. After all other corrections were made, records with missing enrollment or teacher counts were imputed using student/teacher ratios or average values from other schools from the same state and school level (elementary/secondary/combined).
In addition, due to differences in school definition and scope between SASS and CCD,
some records needed to be added or deleted from CCD in order to provide better coverage and a more efficient sample design for SASS. The following types of school records were deleted from CCD in creating the SASS sampling frame: schools flagged as closed, schools outside the 50 states or the District of Columbia, schools with a highest grade less than 1st grade, schools that only taught adult education, school records with “home school” or “home bound” in the name, and any school that, when contacted, turned out to be closed or not a school.
4 For the 1987–88, 1990–91, and 1993–94 SASS, this chapter in the data file user’s manual presented a summary of material from the companion sample design and estimation report. For the 1999–2000 SASS, all material is presented in this volume.
36 1999–2000 SASS Data File User’s Manual
School records were added to the CCD from four sources. First, a list of 50 DoD schools was obtained from DoD school websites. These schools were added to the regular school sampling frame. Second, among the CCD school records in California and Pennsylvania were school records that were really offices that administered specialized school programs. These offices were contacted to obtain lists of schools they administered. These lists were checked against the CCD, and nonmatching schools were added to the CCD while the administrative offices were deleted. This resulted in a net addition of 317 schools. Third, BIA provided a list of 197 schools for 1997–98. This list was checked against the CCD for duplicates. The results are described below. Finally, a list of 1,122 public charter schools for 1998–99 were obtained from the U.S. Department of Education. This list was also checked against the CCD for duplicates, and the results are described below.
The end result of the operations to add and delete records was a SASS public school
sampling frame containing 88,266 public schools.
BIA Schools. The BIA schools were in a separate frame from the public schools, the private schools, or the public charter schools. The list of BIA-funded schools came from the Bureau’s Office of Indian Education Programs: Education Directory (BIA 1998). The directory listed 197 schools funded by BIA and the Office of Indian Education Programs by name of school, location, and the number of teachers and students.
The BIA list was checked against the CCD and the public charter school list. For the
1999–2000 SASS, 65 BIA-funded schools overlapped with the CCD public school frame and 8 overlapped with the public charter school frame. The remaining 124 schools on the BIA list were added to the BIA universe of schools for the 1999–2000 SASS. However, not all of the 197 schools met the SASS eligibility requirement that the facility must provide educational services for any of grades 1 through 12. Some 28 of the directory listings were for dormitories or schools that provided only preschool or adult educational services. The remaining 169 schools constituted the BIA stratum and were allocated with certainty in the sample. Of these schools, 120 received the Indian School Questionnaire, 43 received the Public School Questionnaire, and 6 received the Public Charter School Questionnaire.
Public Charter Schools. The universe of public charter schools was obtained from a list
provided by the U.S. Department of Education’s Office of Educational Research and Improvement (OERI; renamed Institute of Education Sciences, IES, in 2002), as described in The State of Charter Schools 2000 (Nelson et al. 2000). The list, which pertained to the 1998–99 school year, was developed by Research Policy Practice (RPP), a private firm that had previously collected public charter school data under contract with the Department of Education. The SASS public charter school sample consisted of all schools on the list (1,198), excluding 76 apparent duplicates, for a total of 1,122.
2. Allocation
The goals for the school sample of the 1999–2000 SASS were similar to the 1993–94
SASS:
• Use the 1997–98 CCD file as a frame whenever possible. • Produce state estimates of public school characteristics. • Produce state/elementary and state/secondary estimates of the number of schools and
associated school characteristics.
IV. Sample Design and Implementation 37
• Produce national estimates of combined schools. • Produce national estimates by various geographic (region, locale) and school
characteristics. • Minimize the overlap between the 1999–2000 SASS and the 1999–2000 NAEP state
sample and between the 1999–2000 SASS and the Early Childhood Longitudinal Study, Kindergarten Class of 1998–99 (ECLS-K). This was done in order to reduce response burden. (The methodology for minimizing the overlaps is described in sections IV.D, Minimizing Overlap with NAEP and ECLS, and IV.E, SASS/NAEP Overlap Sample Design.)
• Oversample schools with 19.5 percent or greater Native American enrollment so that national estimates of these schools by school characteristics can be produced.
Note: All BIA and public charter schools were selected with certainty; therefore, no
stratification was needed.
a. Public School Strata The SASS public school sample is a stratified sample. For public schools, the
first level of stratification was by three types of schools: (A) Native American schools (schools with 19.5 percent or more Native American students, which were oversampled to improve the reliability of American Indian or Alaska Native [AIAN] student estimates), (B) schools in Delaware, Nevada, and West Virginia (where it is necessary to implement a different sampling methodology to select at least one school from each LEA in the state—see section IV.B), and (C) all other schools (all schools not included in A or B). Schools falling into more than one group were assigned to A, B, or C in hierarchical order. (Note: Alaskan schools were excluded from the 19.5 percent rule determination that placed schools in either group A or B, C. All Alaskan schools were placed in group C because the group C sampling rate for Alaska was higher than the group A sampling rate; this meant that if some Alaskan schools had been placed in group A, their reliability would have been reduced, as would have the reliability of Alaskan schools in general.)
For the second level of stratification, the type A schools were stratified by
Arizona, California, Minnesota, Montana, New Mexico, North Dakota, Oklahoma, South Dakota, Washington, and all other states (except Alaska, since most Alaskan schools have high Native American enrollment). The type B schools were stratified first by state and then by district. Type C schools were stratified by state (all states and the District of Columbia except Delaware, Nevada, and West Virginia).
For the third level of stratification, the three grade-level strata (elementary,
secondary, and combined schools) were defined as follows:
Elementary = Lowest grade ≤ 6 and highest grade ≤ 8
Secondary = Lowest grade ≥ 7 and highest grade ≤ 12
Combined = Lowest grade ≤ 6 and highest grade > 8
In terms of sample allocation, nonregular schools, which include special education, vocational, technical, adult education (if part of an in-scope school), or alternative/continuation grades were included with combined schools.
38 1999–2000 SASS Data File User’s Manual
b. Public School Allocation Methodology
The 1999–2000 SASS sample was allocated so that state-level elementary and secondary estimates and national estimates of combined schools could be made for public schools. The sample was allocated to each state by grade range for regular public schools as well as public schools with high Native American enrollment.
The approach for the allocation was done according to the following priority:
1. Use a total public school sample size in the 1999–2000 SASS of 9,3745 regular schools and 450 Native American schools.
2. Allocate 1,300 schools proportional to the 1993–94 SASS unit standard errors for the state/combined school strata to achieve maximum precision for national combined school estimates. “Maximum precision” refers to an optimum allocation to estimate total number of teachers. A minimum of five combined schools were allocated to each state whenever possible. This constraint increased the total combined school sample size to 1,319 schools.
3. Allocate the remainder of the school sample proportional to the 1993–94 SASS unit standard errors for the state/elementary and state/secondary school strata.
4. Assign a minimum number of schools to each stratum (state/level). For the combined school strata, the minimum was five. For elementary/secondary strata the school minimum was 80. (With 80 schools in a stratum, most elementary/secondary strata coefficients of variation should be 15 percent or less). In Alaska, the combined school sample size was fixed at 80.
5. Control the state data collection burden, so that no stratum has a sample size larger than 40 percent of the total number of schools in the stratum. The allocation process described above could be done using any SASS variable.
Total number of teachers, total student enrollment, and total number of schools were used to do separate allocations. Because the primary objective in SASS is to estimate teacher characteristics and because the allocations based on enrollment and school estimates produced similar allocations to the one based on teacher estimates, the teacher allocation was used as the final allocation.
Table 8 provides the final stratum allocation of the 1999–2000 SASS public
school sample, as well as the percentage of total schools by state in the public school sampling frame that were selected for sample. Table 9 summarizes the percentages by school level. These tables exclude schools with high Native American enrollment. See section IV.A.2.c for further explanation.
5 The regular public school sample size of 9,374 was determined to be the sample size necessary to meet the analytic goals for the 1987–88 SASS (Kaufman 1991).
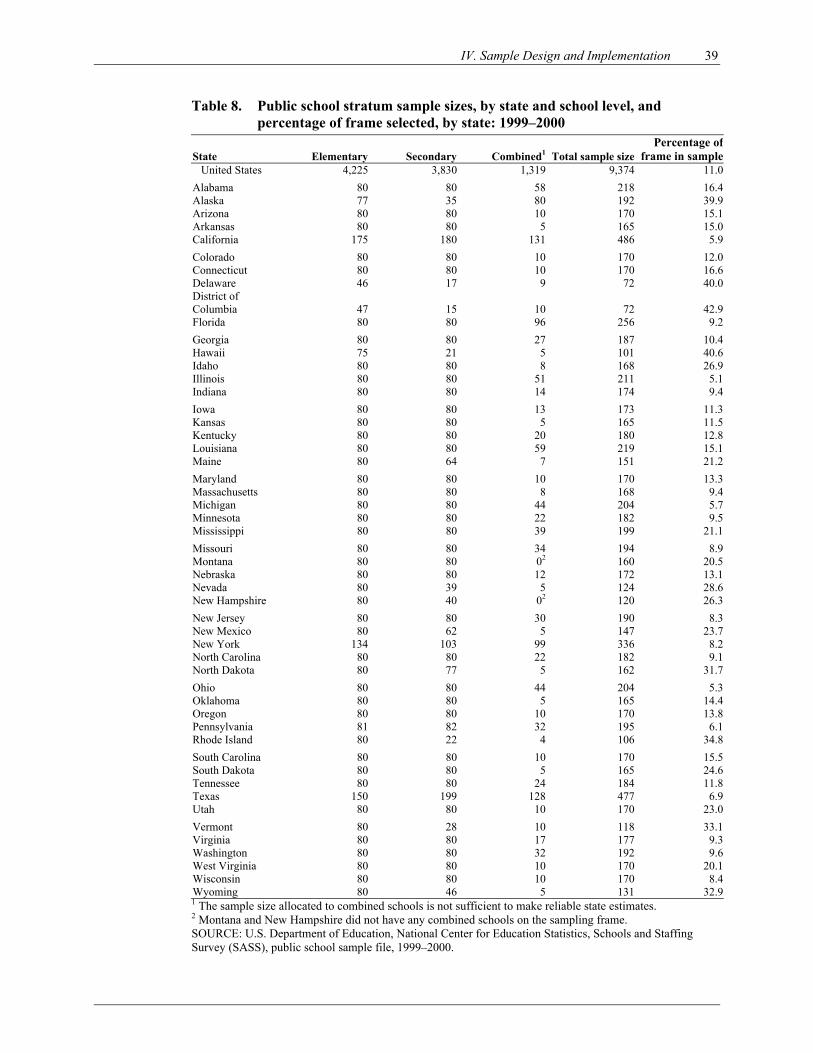
IV. Sample Design and Implementation 39
Table 8. Public school stratum sample sizes, by state and school level, and percentage of frame selected, by state: 1999–2000
State Elementary Secondary Combined1 Total sample size Percentage of
frame in sample United States 4,225 3,830 1,319 9,374 11.0
Alabama 80 80 58 218 16.4Alaska 77 35 80 192 39.9Arizona 80 80 10 170 15.1Arkansas 80 80 5 165 15.0California 175 180 131 486 5.9
Colorado 80 80 10 170 12.0Connecticut 80 80 10 170 16.6Delaware 46 17 9 72 40.0District of Columbia 47 15 10 72 42.9Florida 80 80 96 256 9.2
Georgia 80 80 27 187 10.4Hawaii 75 21 5 101 40.6Idaho 80 80 8 168 26.9Illinois 80 80 51 211 5.1Indiana 80 80 14 174 9.4
Iowa 80 80 13 173 11.3Kansas 80 80 5 165 11.5Kentucky 80 80 20 180 12.8Louisiana 80 80 59 219 15.1Maine 80 64 7 151 21.2
Maryland 80 80 10 170 13.3Massachusetts 80 80 8 168 9.4Michigan 80 80 44 204 5.7Minnesota 80 80 22 182 9.5Mississippi 80 80 39 199 21.1
Missouri 80 80 34 194 8.9Montana 80 80 02 160 20.5Nebraska 80 80 12 172 13.1Nevada 80 39 5 124 28.6New Hampshire 80 40 02 120 26.3
New Jersey 80 80 30 190 8.3New Mexico 80 62 5 147 23.7New York 134 103 99 336 8.2North Carolina 80 80 22 182 9.1North Dakota 80 77 5 162 31.7
Ohio 80 80 44 204 5.3Oklahoma 80 80 5 165 14.4Oregon 80 80 10 170 13.8Pennsylvania 81 82 32 195 6.1Rhode Island 80 22 4 106 34.8
South Carolina 80 80 10 170 15.5South Dakota 80 80 5 165 24.6Tennessee 80 80 24 184 11.8Texas 150 199 128 477 6.9Utah 80 80 10 170 23.0
Vermont 80 28 10 118 33.1Virginia 80 80 17 177 9.3Washington 80 80 32 192 9.6West Virginia 80 80 10 170 20.1Wisconsin 80 80 10 170 8.4Wyoming 80 46 5 131 32.91 The sample size allocated to combined schools is not sufficient to make reliable state estimates. 2 Montana and New Hampshire did not have any combined schools on the sampling frame. SOURCE: U.S. Department of Education, National Center for Education Statistics, Schools and Staffing Survey (SASS), public school sample file, 1999–2000.

40 1999–2000 SASS Data File User’s Manual
Table 9. Proportion of public school frame selected in sample, by school level: 1999–2000
School level Sample size Percentage of frame in sample Total 9,374 11.0Elementary 4,225 7.0Secondary 3,830 18.1Combined 1,319 33.0SOURCE: U.S. Department of Education, National Center for Education Statistics, Schools and Staffing Survey (SASS), public school sample file, 1999–2000.
c. Oversampling of Schools with 19.5 Percent or More Native American Student
Enrollment To improve Native American school estimates, schools with 19.5 percent or
higher AIAN student enrollment (Native American strata) were placed into their own strata. Arizona, California, Minnesota, Montana, New Mexico, North Dakota, Oklahoma, South Dakota, and Washington had individual Native American strata. The rest of the states, except Alaska, were placed into an “all other states” Native American stratum. (Since most Alaskan schools have at least 19.5 percent Native American students, they were not included in this stratification, but they were included in the analytic estimates.) Schools in the Native American strata were also stratified by school level. The goal was to allocate 450 schools to these strata with probability proportional to the measure-of-size in the stratum, but due to rounding in the allocation process, 451 schools were allocated. An additional requirement was that the elementary and secondary strata each contain at least 150 schools. The sample sizes are provided in table 10. This sample is over and above the 9,374 schools allocated in section IV.A.2.b.
Table 10. American Indian or Alaska Native stratum sample size, by school level
and state: 1999–2000 State Total Elementary Secondary Combined Total 451 283 151 17Arizona 40 26 13 1California 13 8 4 1Minnesota 14 8 5 1Montana 25 15 10 01
New Mexico 35 22 12 1North Dakota 14 5 6 3Oklahoma 198 128 69 1South Dakota 24 15 8 1Washington 12 7 3 2All others 76 49 21 61 There were no combined schools in Montana on the frame. SOURCE: U.S. Department of Education, National Center for Education Statistics, Schools and Staffing Survey (SASS), public school sample file, 1999–2000.
d. Public, BIA, and Public Charter School Sample Allocations
Table 11 presents the overall school sample for public, BIA, and public charter
schools broken down by school level.
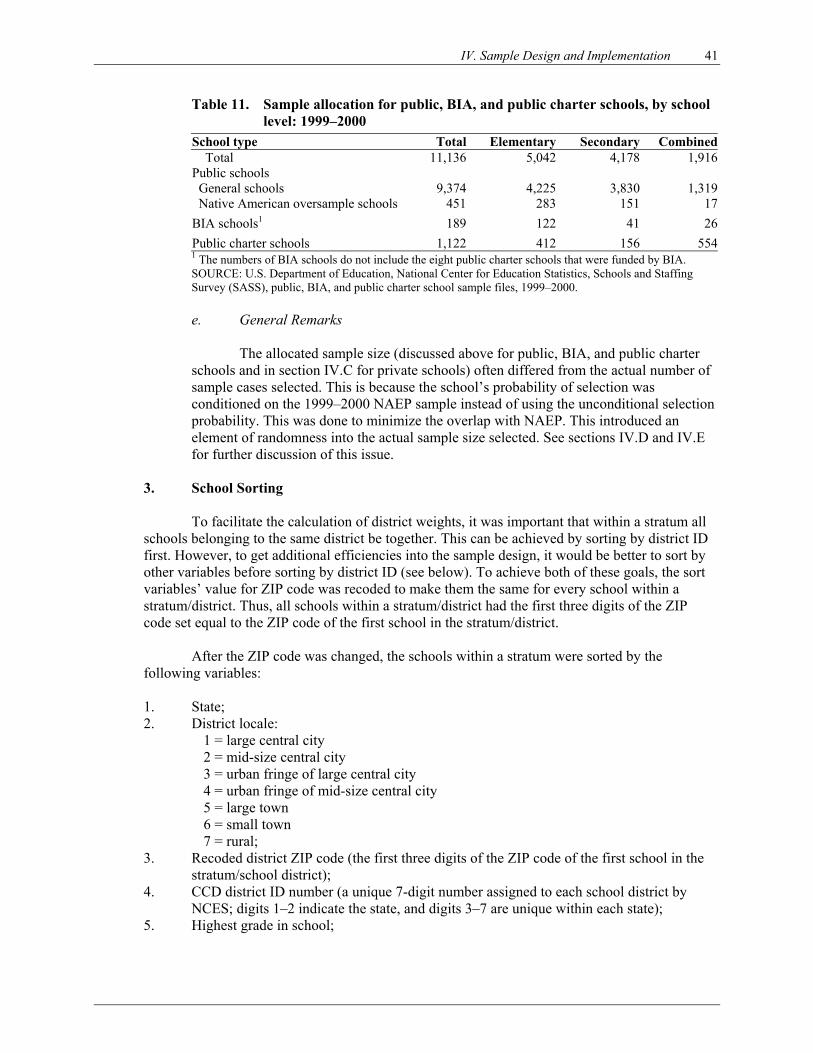
IV. Sample Design and Implementation 41
Table 11. Sample allocation for public, BIA, and public charter schools, by school level: 1999–2000
School type Total Elementary Secondary Combined Total 11,136 5,042 4,178 1,916Public schools General schools 9,374 4,225 3,830 1,319 Native American oversample schools 451 283 151 17
BIA schools1 189 122 41 26
Public charter schools 1,122 412 156 5541 The numbers of BIA schools do not include the eight public charter schools that were funded by BIA. SOURCE: U.S. Department of Education, National Center for Education Statistics, Schools and Staffing Survey (SASS), public, BIA, and public charter school sample files, 1999–2000.
e. General Remarks
The allocated sample size (discussed above for public, BIA, and public charter
schools and in section IV.C for private schools) often differed from the actual number of sample cases selected. This is because the school’s probability of selection was conditioned on the 1999–2000 NAEP sample instead of using the unconditional selection probability. This was done to minimize the overlap with NAEP. This introduced an element of randomness into the actual sample size selected. See sections IV.D and IV.E for further discussion of this issue.
3. School Sorting
To facilitate the calculation of district weights, it was important that within a stratum all
schools belonging to the same district be together. This can be achieved by sorting by district ID first. However, to get additional efficiencies into the sample design, it would be better to sort by other variables before sorting by district ID (see below). To achieve both of these goals, the sort variables’ value for ZIP code was recoded to make them the same for every school within a stratum/district. Thus, all schools within a stratum/district had the first three digits of the ZIP code set equal to the ZIP code of the first school in the stratum/district.
After the ZIP code was changed, the schools within a stratum were sorted by the
following variables:
1. State; 2. District locale:
1 = large central city 2 = mid-size central city 3 = urban fringe of large central city 4 = urban fringe of mid-size central city 5 = large town 6 = small town 7 = rural;
3. Recoded district ZIP code (the first three digits of the ZIP code of the first school in the stratum/school district);
4. CCD district ID number (a unique 7-digit number assigned to each school district by NCES; digits 1–2 indicate the state, and digits 3–7 are unique within each state);
5. Highest grade in school;

42 1999–2000 SASS Data File User’s Manual
6. School percent minority (obtained by summing the number of Black, Hispanic, API, and AIAN students and dividing by total enrollment):
1 = less than 5.5 percent minority or unknown 2 = 5.5 percent to less than 20.5 percent minority 3 = 20.5 to less than 50.5 percent minority 4 = 50.5 percent or more minority
7. School enrollment; and 8. CCD School ID (a unique 12-digit number assigned to each public school by NCES;
digits 1–2 indicate the state, digits 3–7 indicate the LEA within a state, and digits 8–12 are unique within a particular LEA).
The first three sort variables allowed NCES to achieve geographic balance within locale
and region within a state. The fifth variable allowed NCES to achieve sample size requirements for middle schools, and the sixth variable allowed some balance with respect to ethnicity.
4. Sample Selection
As explained earlier, all the BIA schools and all the public charter schools were selected
for the 1999–2000 SASS sample. There were 197 BIA schools and 1,122 public charter schools. (See section IV.A.1 for the discussion of BIA and public charter school sampling frames.)
Within each stratum, all public schools were systematically selected using a probability
proportionate to size algorithm. The measure of size used for the public schools was the square root of the number of teachers in the school as reported on the CCD file. Any school with a measure of size larger than the sampling interval was excluded from the probability sampling operation and included in the sample with certainty. This produced a public school sample of 9,828. Thus, the total 1999–2000 SASS sample for the public, BIA, and public charter schools was 11,139 (9,828 public schools, 189 BIA schools—not counting the 8 public charter schools funded by BIA, and 1,122 public charter schools). These represent the actual sample sizes selected, as opposed to the expected sampled sizes as presented in table 11 above. The difference is attributable to the use of conditional probabilities of selection to achieve minimization of overlap with NAEP and ECLS as described in sections IV.D and IV.E.
B. School Districts The school district sample represented the set of districts associated with schools. No school districts without associated schools were selected for the 1999–2000 SASS, as had been done in previous rounds of SASS. However, school districts in Delaware, Nevada, and West Virginia were treated differently.
School Districts Outside Delaware, Nevada, and West Virginia. During the initial design development of the SASS, consideration was given to selecting the school districts first and then selecting schools within districts. It was hypothesized that doing this would reduce the reliability of both school and teacher estimates, but might be offset by the improvement in reliability of school district estimates. Simulations done on the reliability of school district estimates when the districts were selected first confirmed the loss in reliability for school and teacher estimates (Wright 1988). The simulations also showed that selecting school first would produce only slightly less accurate district estimates. For these reasons the SASS sample design selected schools first. Hence, the district sample consisted of the set of districts that were associated with the SASS public school sample. This provided the linkage between the district and the school.
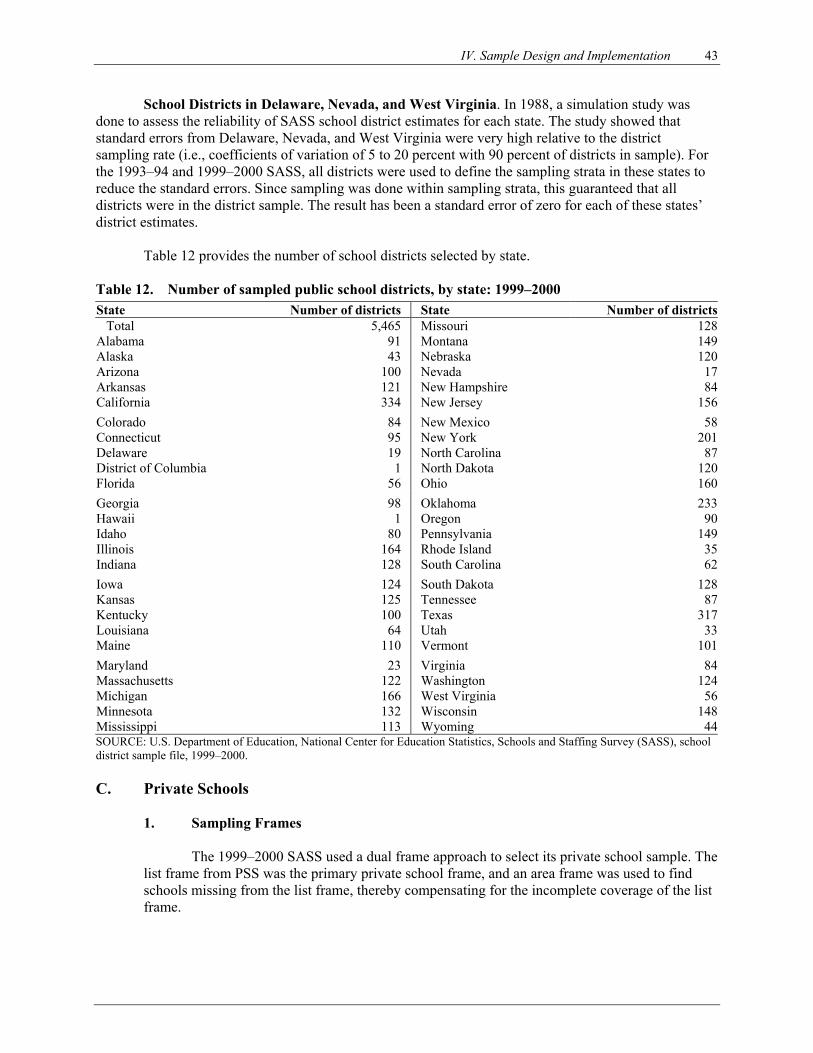
IV. Sample Design and Implementation 43
School Districts in Delaware, Nevada, and West Virginia. In 1988, a simulation study was done to assess the reliability of SASS school district estimates for each state. The study showed that standard errors from Delaware, Nevada, and West Virginia were very high relative to the district sampling rate (i.e., coefficients of variation of 5 to 20 percent with 90 percent of districts in sample). For the 1993–94 and 1999–2000 SASS, all districts were used to define the sampling strata in these states to reduce the standard errors. Since sampling was done within sampling strata, this guaranteed that all districts were in the district sample. The result has been a standard error of zero for each of these states’ district estimates.
Table 12 provides the number of school districts selected by state.
Table 12. Number of sampled public school districts, by state: 1999–2000 State Number of districts State Number of districts Total 5,465 Missouri 128Alabama 91 Montana 149Alaska 43 Nebraska 120Arizona 100 Nevada 17Arkansas 121 New Hampshire 84California 334 New Jersey 156
Colorado 84 New Mexico 58Connecticut 95 New York 201Delaware 19 North Carolina 87District of Columbia 1 North Dakota 120Florida 56 Ohio 160
Georgia 98 Oklahoma 233Hawaii 1 Oregon 90Idaho 80 Pennsylvania 149Illinois 164 Rhode Island 35Indiana 128 South Carolina 62
Iowa 124 South Dakota 128Kansas 125 Tennessee 87Kentucky 100 Texas 317Louisiana 64 Utah 33Maine 110 Vermont 101
Maryland 23 Virginia 84Massachusetts 122 Washington 124Michigan 166 West Virginia 56Minnesota 132 Wisconsin 148Mississippi 113 Wyoming 44SOURCE: U.S. Department of Education, National Center for Education Statistics, Schools and Staffing Survey (SASS), school district sample file, 1999–2000.
C. Private Schools
1. Sampling Frames
The 1999–2000 SASS used a dual frame approach to select its private school sample. The list frame from PSS was the primary private school frame, and an area frame was used to find schools missing from the list frame, thereby compensating for the incomplete coverage of the list frame.

44 1999–2000 SASS Data File User’s Manual
a. List Frame
The base for the private school list frame was the 1997–98 PSS, updated with private school organization and state lists collected by the Census Bureau in the spring of 1999 for updating the 1999–2000 PSS list frame. Twenty-eight private school organizations were asked to supply lists of their schools, and 26 such lists were received. The 50 states and the District of Columbia also provided lists of private schools. All of these lists were compared to the 1997–98 PSS list frame and any school not found on PSS was added to the frame. (This is the usual updating that is done to create a revised PSS list frame every 2 years.) Before sampling, duplicate schools were excluded from the frame. Private schools that did not meet the SASS definition of a school (e.g., provided only prekindergarten, kindergarten, or adult education) were removed. The adapted PSS list frame consisted of 28,124 schools. b. Area Frame
The 1999–2000 SASS private school area frame consisted of the schools from
the 1997–98 PSS area frame. (Due to timing constraints, the Census Bureau did not wait for the 1999–2000 PSS area frame schools to be identified.) The United States was divided by the Census Bureau into 2,062 primary sampling units (PSUs), each PSU consisting of a single county, independent city, or a group of contiguous counties. The 1997–98 PSS area frame consisted of a sample of the 2,062 PSUs. The 1997–98 PSS area frame was designed to produce an approximately 50 percent overlap with the previous PSS (1995–96) area frame. Consequently, the area frame consisted of two sets of sample PSUs: 1) a subsample of the 1995–96 PSS area frame sample PSUs (overlap); and 2) a sample of PSUs selected independently of the 1995–96 PSS area sample (nonoverlap).
Eight of the overlap PSUs from the 1995–96 PSS area frame have been included
in every PSS area frame. These eight PSUs are known as the “certainty PSUs” and remained in the 1997–98 area frame with certainty. All 58 PSUs that had been in the 1995–96 area sample for the first time and not previously included in the overlap sample were selected again for the 1997–98 PSS, resulting in a total overlap sample of 66 PSUs.
An additional 60 PSUs were selected independently of the overlap sample from
the 2,054 noncertainty PSUs. The strata were defined the same way as for the 1995–96 PSS area frame with one exception. Initially, 16 strata were created: region (Northeast, Midwest, South, West), metro/nonmetro status (using 1980 Census data), and high/low percent private enrollment within metro/nonmetro status (above or below the median private school enrollment within each metro/nonmetro status). Beginning with the 1997–98 PSS, the high/low cutoffs were adjusted so as to more nearly equalize the expected variance between the two strata. The purpose of this was to lower the overall standard errors resulting from the sampling of PSUs.
Sample sizes were determined for each metro/nonmetro status within each
region, with probability proportional to the square root of the 1998 projected PSU population. Some adjustments were made to the initial allocation so that each sample size was an even number and that sample size was distributed evenly between low and high groups. This was done in order to have an even number of cases in each strata (with a minimum of two) for pairing purposes for calculating the PSS variances.
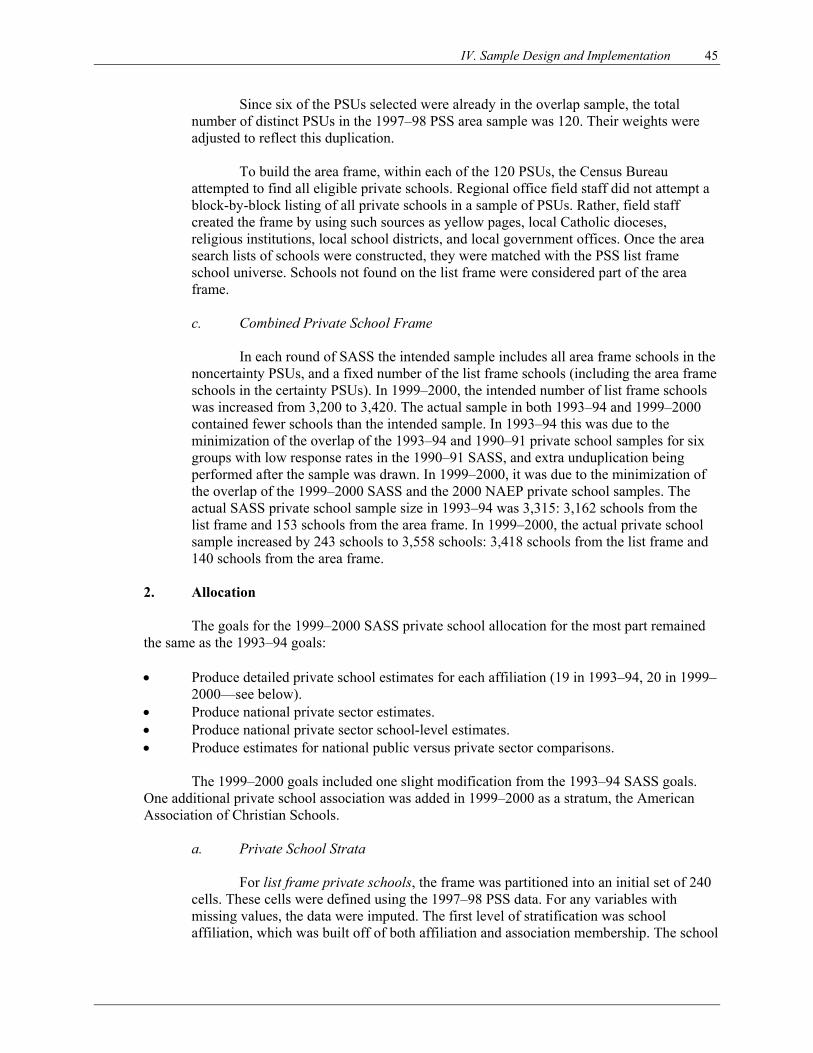
IV. Sample Design and Implementation 45
Since six of the PSUs selected were already in the overlap sample, the total number of distinct PSUs in the 1997–98 PSS area sample was 120. Their weights were adjusted to reflect this duplication.
To build the area frame, within each of the 120 PSUs, the Census Bureau
attempted to find all eligible private schools. Regional office field staff did not attempt a block-by-block listing of all private schools in a sample of PSUs. Rather, field staff created the frame by using such sources as yellow pages, local Catholic dioceses, religious institutions, local school districts, and local government offices. Once the area search lists of schools were constructed, they were matched with the PSS list frame school universe. Schools not found on the list frame were considered part of the area frame.
c. Combined Private School Frame
In each round of SASS the intended sample includes all area frame schools in the
noncertainty PSUs, and a fixed number of the list frame schools (including the area frame schools in the certainty PSUs). In 1999–2000, the intended number of list frame schools was increased from 3,200 to 3,420. The actual sample in both 1993–94 and 1999–2000 contained fewer schools than the intended sample. In 1993–94 this was due to the minimization of the overlap of the 1993–94 and 1990–91 private school samples for six groups with low response rates in the 1990–91 SASS, and extra unduplication being performed after the sample was drawn. In 1999–2000, it was due to the minimization of the overlap of the 1999–2000 SASS and the 2000 NAEP private school samples. The actual SASS private school sample size in 1993–94 was 3,315: 3,162 schools from the list frame and 153 schools from the area frame. In 1999–2000, the actual private school sample increased by 243 schools to 3,558 schools: 3,418 schools from the list frame and 140 schools from the area frame.
2. Allocation
The goals for the 1999–2000 SASS private school allocation for the most part remained
the same as the 1993–94 goals:
• Produce detailed private school estimates for each affiliation (19 in 1993–94, 20 in 1999–2000—see below).
• Produce national private sector estimates. • Produce national private sector school-level estimates. • Produce estimates for national public versus private sector comparisons.
The 1999–2000 goals included one slight modification from the 1993–94 SASS goals.
One additional private school association was added in 1999–2000 as a stratum, the American Association of Christian Schools.
a. Private School Strata
For list frame private schools, the frame was partitioned into an initial set of 240 cells. These cells were defined using the 1997–98 PSS data. For any variables with missing values, the data were imputed. The first level of stratification was school affiliation, which was built off of both affiliation and association membership. The school

46 1999–2000 SASS Data File User’s Manual
affiliation strata were created in the order listed below, and a school was assigned to the first stratum in which it fell. These are the 20 affiliations:
1. Military—membership in the Association of American Military Colleges and
Schools; 2. Catholic—affiliation as Catholic or membership in the National Catholic
Education Association or the Jesuit Secondary Education Association; 3. Friends—affiliation as Friends or membership in the Friends Council on
Education; 4. Episcopal—affiliation as Episcopal or membership in the National Association of
Episcopal Schools association; 5. Hebrew Day—membership in the National Society for Hebrew Day Schools
association; 6. Solomon Schechter—membership in the Solomon Schechter Day Schools; 7. Other Jewish—other Jewish affiliation; 8. Lutheran Church, Missouri Synod—affiliation as the Lutheran Church, Missouri
Synod; 9. Lutheran Church, Wisconsin Synod—affiliation as the Lutheran Church,
Wisconsin Synod; 10. Evangelical Lutheran—affiliation as Evangelical Lutheran Church in America or
membership in the Association of Evangelical Lutheran Churches school association;
11. Other Lutheran—affiliation as other Lutheran; 12. Seventh-Day Adventist—affiliation as Seventh-Day Adventist or membership in
the General Conference of Seventh-Day Adventists; 13. Christian Schools International—membership in Christian Schools International; 14. American Association of Christian Schools—membership in the American
Association of Christian Schools; 15. Association of Christian Schools International—membership in the Association
of Christian Schools International; 16. National Association of Private Schools for Exceptional Children—membership
in the National Association of Private Schools for Exceptional Children; 17. Montessori—membership in the American Montessori Society or other
Montessori associations; 18. National Association of Independent Schools—membership in the National
Association of Independent Schools; 19. National Independent Private School Association—membership in the National
Independent Private School Association; 20. All else—not in any of groups above.
Within each affiliation stratum, schools were stratified by school level
(elementary, secondary, and combined schools), using the same definitions as used for public schools:
Elementary = Lowest grade ≤ 6 and highest grade ≤ 8
Secondary = Lowest grade ≥ 7 and highest grade ≤ 12
Combined = Lowest grade ≤ 6 and highest grade > 8

IV. Sample Design and Implementation 47
Nonregular schools, which include special education, vocational, technical, adult education (if part of an in-scope school) or alternative/continuation grades, were classified as combined schools. Within affiliation/school level, schools were stratified by four Census regions. Northeast = Connecticut, Maine, Massachusetts, New Hampshire, New Jersey,
New York, Pennsylvania, Rhode Island, and Vermont Midwest = Illinois, Indiana, Iowa, Kansas, Michigan, Minnesota, Missouri,
Nebraska, North Dakota, Ohio, South Dakota, and Wisconsin. South = Alabama, Arkansas, Delaware, District of Columbia, Florida,
Georgia, Kentucky, Louisiana, Maryland, Mississippi, North Carolina, Oklahoma, South Carolina, Tennessee, Texas, Virginia, and West Virginia
West = Alaska, Arizona, California, Colorado, Hawaii, Idaho, Montana, Nevada, New Mexico, Oregon, Utah, Washington, and Wyoming
All area frame private schools were selected for the sample, so no stratification
was needed.
b. Private School Allocation Methodology for the List Frame Sample The allocation procedure used for the 1999–2000 SASS was almost the same as
that used for the 1993–1994 SASS. The file was stratified by affiliation/school level/region. A minimum of 100 schools was allocated to each affiliation. If the affiliation had less than 100 schools, all were selected. The remaining sample was allocated proportional to the number of schools in the stratum.
(In addition to the list frame, an area search frame was produced to correct for
coverage deficiencies in the list frame—see section IV.C.2.c.) The private school sample size selected from the list frame was intended to be
3,420 schools. The list frame represents 25,825 of the 27,585 total private schools (i.e., 94 percent of the total private school frame).
Note: In the 1997–98 PSS area frame, 116 schools were found within counties
that had been selected with certainty. Upon recommendation from NCES, these schools were included as part of the list frame before sampling. Twelve of these schools were selected for the 1999–2000 SASS.
Table 13 provides the allocation for the list frame. The table includes allocations
for the affiliation/school level/region strata and total allocations. Table 14 shows school levels by affiliation, as well as totals for each stratum. Table 15 gives the percentage of list frame schools selected for the sample by affiliation, school level, and region.
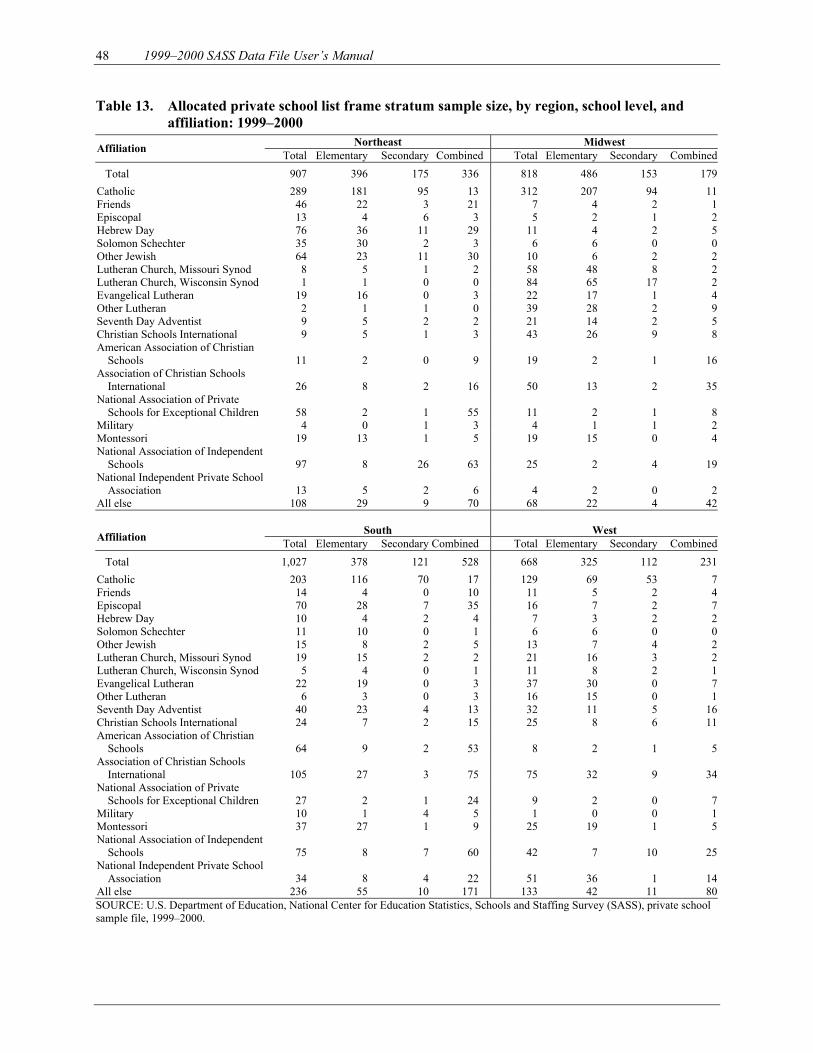
48 1999–2000 SASS Data File User’s Manual
Table 13. Allocated private school list frame stratum sample size, by region, school level, and affiliation: 1999–2000
Northeast Midwest Affiliation Total Elementary Secondary Combined Total Elementary Secondary Combined
Total 907 396 175 336 818 486 153 179
Catholic 289 181 95 13 312 207 94 11Friends 46 22 3 21 7 4 2 1Episcopal 13 4 6 3 5 2 1 2Hebrew Day 76 36 11 29 11 4 2 5Solomon Schechter 35 30 2 3 6 6 0 0Other Jewish 64 23 11 30 10 6 2 2Lutheran Church, Missouri Synod 8 5 1 2 58 48 8 2Lutheran Church, Wisconsin Synod 1 1 0 0 84 65 17 2Evangelical Lutheran 19 16 0 3 22 17 1 4Other Lutheran 2 1 1 0 39 28 2 9Seventh Day Adventist 9 5 2 2 21 14 2 5Christian Schools International 9 5 1 3 43 26 9 8American Association of Christian
Schools 11 2 0 9 19 2 1 16Association of Christian Schools
International 26 8 2 16 50 13 2 35National Association of Private
Schools for Exceptional Children 58 2 1 55 11 2 1 8Military 4 0 1 3 4 1 1 2Montessori 19 13 1 5 19 15 0 4National Association of Independent
Schools 97 8 26 63 25 2 4 19National Independent Private School
Association 13 5 2 6 4 2 0 2All else 108 29 9 70 68 22 4 42
South West Affiliation Total Elementary Secondary Combined Total Elementary Secondary Combined
Total 1,027 378 121 528 668 325 112 231
Catholic 203 116 70 17 129 69 53 7Friends 14 4 0 10 11 5 2 4Episcopal 70 28 7 35 16 7 2 7Hebrew Day 10 4 2 4 7 3 2 2Solomon Schechter 11 10 0 1 6 6 0 0Other Jewish 15 8 2 5 13 7 4 2Lutheran Church, Missouri Synod 19 15 2 2 21 16 3 2Lutheran Church, Wisconsin Synod 5 4 0 1 11 8 2 1Evangelical Lutheran 22 19 0 3 37 30 0 7Other Lutheran 6 3 0 3 16 15 0 1Seventh Day Adventist 40 23 4 13 32 11 5 16Christian Schools International 24 7 2 15 25 8 6 11American Association of Christian
Schools 64 9 2 53 8 2 1 5Association of Christian Schools
International 105 27 3 75 75 32 9 34National Association of Private
Schools for Exceptional Children 27 2 1 24 9 2 0 7Military 10 1 4 5 1 0 0 1Montessori 37 27 1 9 25 19 1 5National Association of Independent
Schools 75 8 7 60 42 7 10 25National Independent Private School
Association 34 8 4 22 51 36 1 14All else 236 55 10 171 133 42 11 80SOURCE: U.S. Department of Education, National Center for Education Statistics, Schools and Staffing Survey (SASS), private school sample file, 1999–2000.
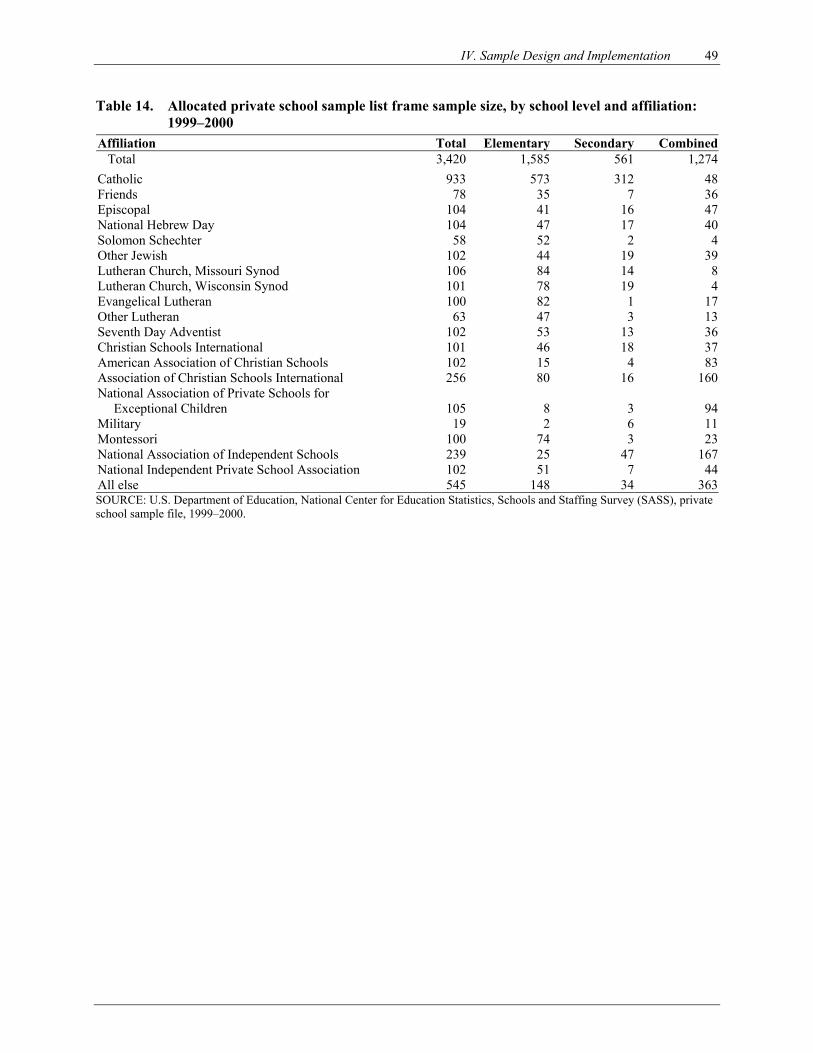
IV. Sample Design and Implementation 49
Table 14. Allocated private school sample list frame sample size, by school level and affiliation: 1999–2000
Affiliation Total Elementary Secondary Combined Total 3,420 1,585 561 1,274
Catholic 933 573 312 48Friends 78 35 7 36Episcopal 104 41 16 47National Hebrew Day 104 47 17 40Solomon Schechter 58 52 2 4Other Jewish 102 44 19 39Lutheran Church, Missouri Synod 106 84 14 8Lutheran Church, Wisconsin Synod 101 78 19 4Evangelical Lutheran 100 82 1 17Other Lutheran 63 47 3 13Seventh Day Adventist 102 53 13 36Christian Schools International 101 46 18 37American Association of Christian Schools 102 15 4 83Association of Christian Schools International 256 80 16 160National Association of Private Schools for
Exceptional Children 105 8 3 94Military 19 2 6 11Montessori 100 74 3 23National Association of Independent Schools 239 25 47 167National Independent Private School Association 102 51 7 44All else 545 148 34 363SOURCE: U.S. Department of Education, National Center for Education Statistics, Schools and Staffing Survey (SASS), private school sample file, 1999–2000.
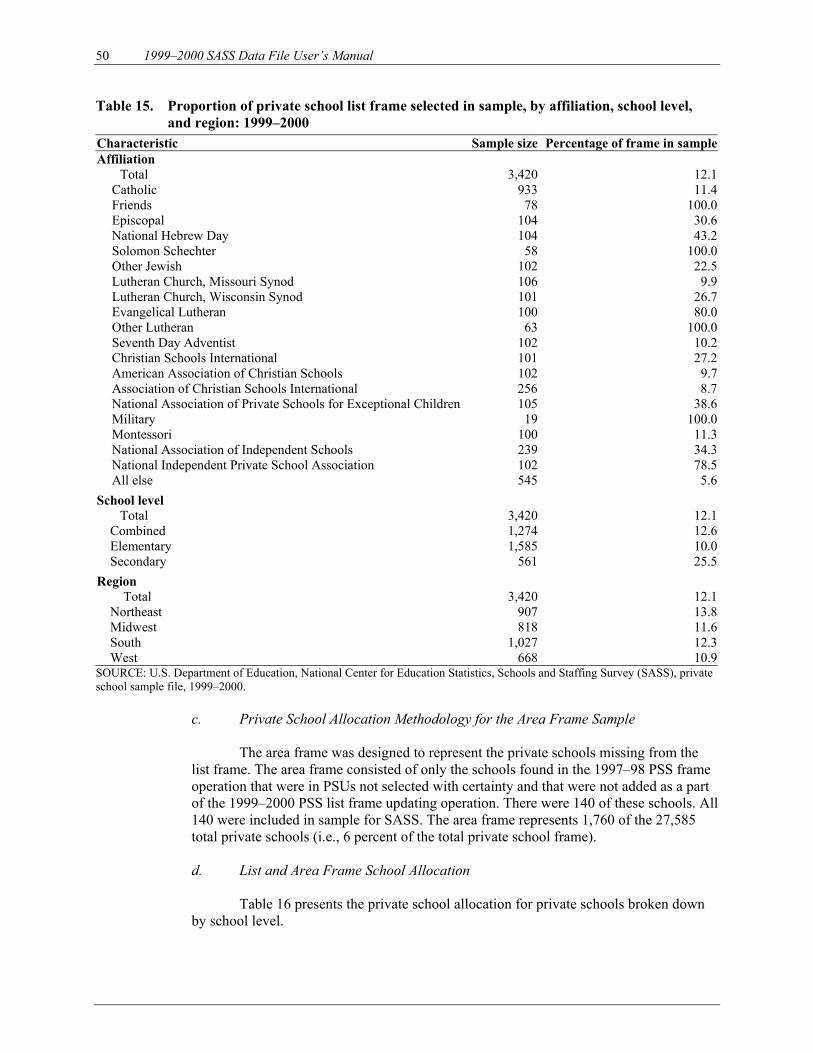
50 1999–2000 SASS Data File User’s Manual
Table 15. Proportion of private school list frame selected in sample, by affiliation, school level, and region: 1999–2000
Characteristic Sample size Percentage of frame in sampleAffiliation Total 3,420 12.1
Catholic 933 11.4Friends 78 100.0Episcopal 104 30.6National Hebrew Day 104 43.2Solomon Schechter 58 100.0Other Jewish 102 22.5Lutheran Church, Missouri Synod 106 9.9Lutheran Church, Wisconsin Synod 101 26.7Evangelical Lutheran 100 80.0Other Lutheran 63 100.0Seventh Day Adventist 102 10.2Christian Schools International 101 27.2American Association of Christian Schools 102 9.7Association of Christian Schools International 256 8.7National Association of Private Schools for Exceptional Children 105 38.6Military 19 100.0Montessori 100 11.3National Association of Independent Schools 239 34.3National Independent Private School Association 102 78.5All else 545 5.6
School level Total 3,420 12.1
Combined 1,274 12.6Elementary 1,585 10.0Secondary 561 25.5
Region Total 3,420 12.1
Northeast 907 13.8Midwest 818 11.6South 1,027 12.3West 668 10.9
SOURCE: U.S. Department of Education, National Center for Education Statistics, Schools and Staffing Survey (SASS), private school sample file, 1999–2000.
c. Private School Allocation Methodology for the Area Frame Sample
The area frame was designed to represent the private schools missing from the list frame. The area frame consisted of only the schools found in the 1997–98 PSS frame operation that were in PSUs not selected with certainty and that were not added as a part of the 1999–2000 PSS list frame updating operation. There were 140 of these schools. All 140 were included in sample for SASS. The area frame represents 1,760 of the 27,585 total private schools (i.e., 6 percent of the total private school frame).
d. List and Area Frame School Allocation
Table 16 presents the private school allocation for private schools broken down
by school level.
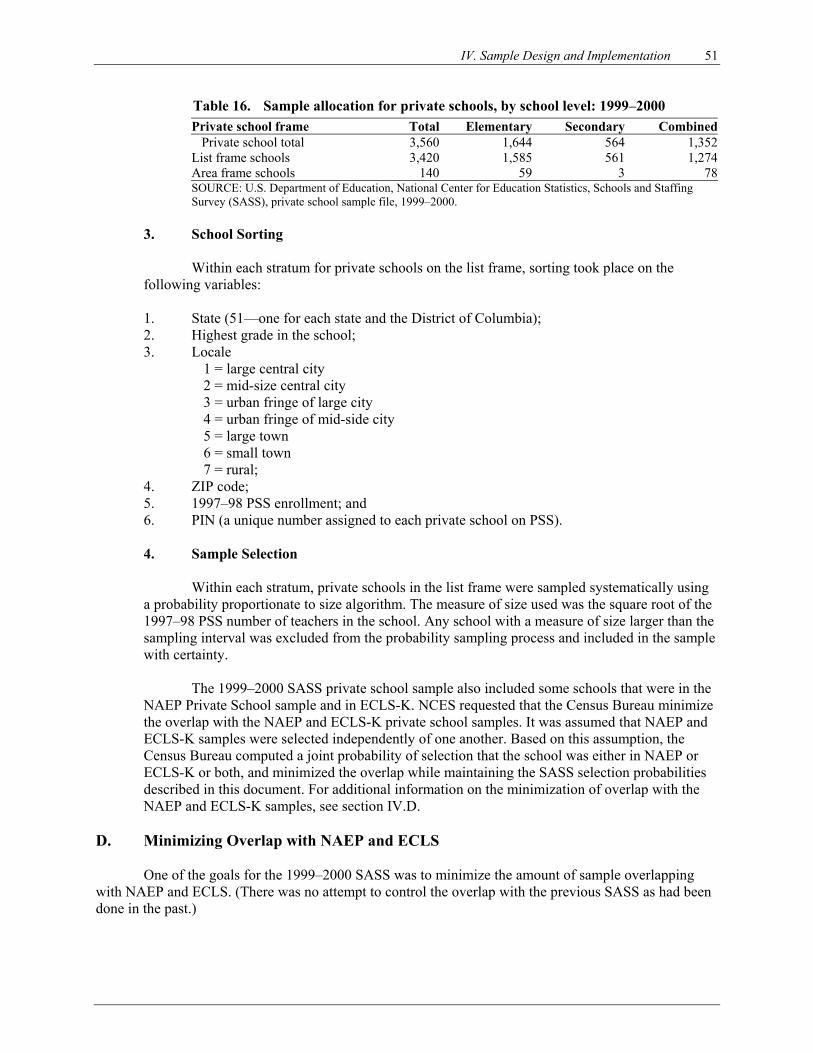
IV. Sample Design and Implementation 51
Table 16. Sample allocation for private schools, by school level: 1999–2000 Private school frame Total Elementary Secondary Combined Private school total 3,560 1,644 564 1,352List frame schools 3,420 1,585 561 1,274Area frame schools 140 59 3 78SOURCE: U.S. Department of Education, National Center for Education Statistics, Schools and Staffing Survey (SASS), private school sample file, 1999–2000.
3. School Sorting
Within each stratum for private schools on the list frame, sorting took place on the following variables:
1. State (51—one for each state and the District of Columbia); 2. Highest grade in the school; 3. Locale
1 = large central city 2 = mid-size central city 3 = urban fringe of large city 4 = urban fringe of mid-side city 5 = large town 6 = small town 7 = rural;
4. ZIP code; 5. 1997–98 PSS enrollment; and 6. PIN (a unique number assigned to each private school on PSS).
4. Sample Selection
Within each stratum, private schools in the list frame were sampled systematically using
a probability proportionate to size algorithm. The measure of size used was the square root of the 1997–98 PSS number of teachers in the school. Any school with a measure of size larger than the sampling interval was excluded from the probability sampling process and included in the sample with certainty.
The 1999–2000 SASS private school sample also included some schools that were in the
NAEP Private School sample and in ECLS-K. NCES requested that the Census Bureau minimize the overlap with the NAEP and ECLS-K private school samples. It was assumed that NAEP and ECLS-K samples were selected independently of one another. Based on this assumption, the Census Bureau computed a joint probability of selection that the school was either in NAEP or ECLS-K or both, and minimized the overlap while maintaining the SASS selection probabilities described in this document. For additional information on the minimization of overlap with the NAEP and ECLS-K samples, see section IV.D.
D. Minimizing Overlap with NAEP and ECLS
One of the goals for the 1999–2000 SASS was to minimize the amount of sample overlapping with NAEP and ECLS. (There was no attempt to control the overlap with the previous SASS as had been done in the past.)
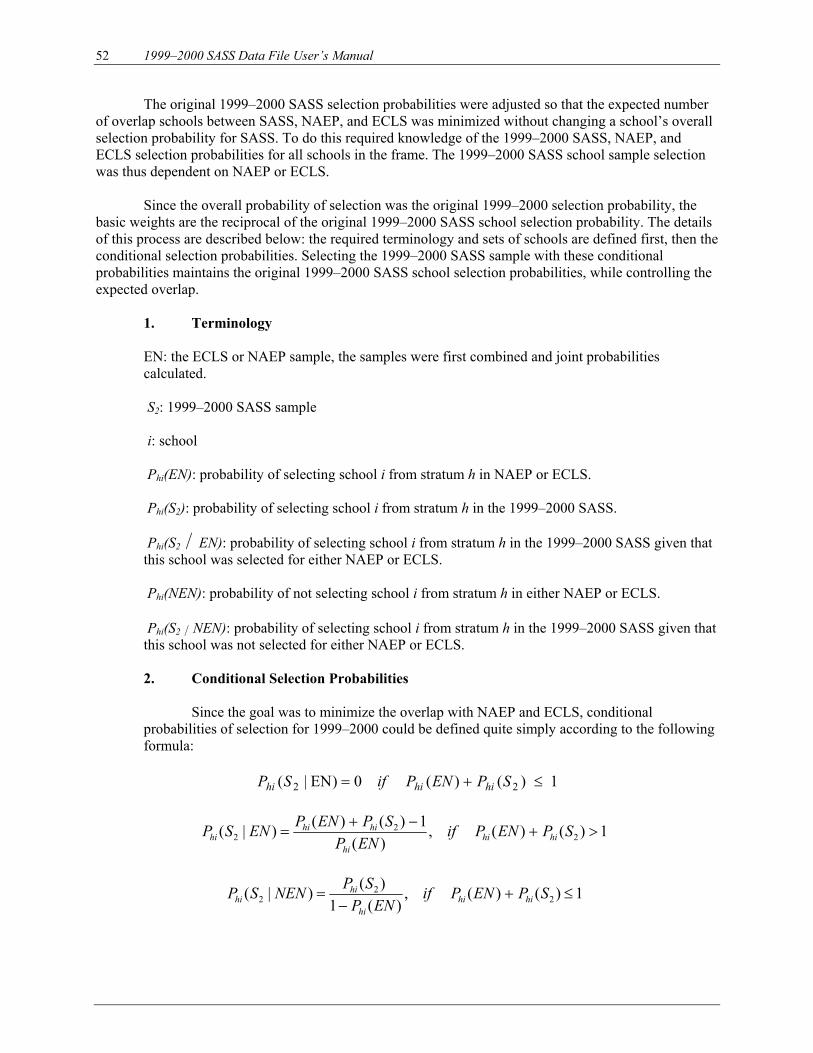
52 1999–2000 SASS Data File User’s Manual
The original 1999–2000 SASS selection probabilities were adjusted so that the expected number of overlap schools between SASS, NAEP, and ECLS was minimized without changing a school’s overall selection probability for SASS. To do this required knowledge of the 1999–2000 SASS, NAEP, and ECLS selection probabilities for all schools in the frame. The 1999–2000 SASS school sample selection was thus dependent on NAEP or ECLS.
Since the overall probability of selection was the original 1999–2000 selection probability, the basic weights are the reciprocal of the original 1999–2000 SASS school selection probability. The details of this process are described below: the required terminology and sets of schools are defined first, then the conditional selection probabilities. Selecting the 1999–2000 SASS sample with these conditional probabilities maintains the original 1999–2000 SASS school selection probabilities, while controlling the expected overlap.
1. Terminology
EN: the ECLS or NAEP sample, the samples were first combined and joint probabilities calculated. S2: 1999–2000 SASS sample i: school Phi(EN): probability of selecting school i from stratum h in NAEP or ECLS. Phi(S2): probability of selecting school i from stratum h in the 1999–2000 SASS. Phi(S2 EN): probability of selecting school i from stratum h in the 1999–2000 SASS given that this school was selected for either NAEP or ECLS. Phi(NEN): probability of not selecting school i from stratum h in either NAEP or ECLS. Phi(S2 NEN): probability of selecting school i from stratum h in the 1999–2000 SASS given that this school was not selected for either NAEP or ECLS.
2. Conditional Selection Probabilities
Since the goal was to minimize the overlap with NAEP and ECLS, conditional
probabilities of selection for 1999–2000 could be defined quite simply according to the following formula:
1)()(0)EN|( 22 ≤+= SPENPifSP hihihi
1)()(,)(
1)()()|( 22
2 >+−+
= SPENPifENP
SPENPENSP hihihi
hihihi
1)()(,)(1
)()|( 22
2 ≤+−
= SPENPifENP
SPNENSP hihihi
hihi
IV. Sample Design and Implementation 53
1)()(1)|( 22 >+= SPENPifNENSP hihihi It can be verified that these conditional selection probabilities preserved the original
1999–2000 SASS selection probabilities, Phi(S2), while minimizing the expected overlap between 1999–2000 SASS schools and ECLS and NAEP.
E. SASS/NAEP Overlap Sample Design
As part of the 1999–2000 SASS data collection effort, 800 schools were selected from the NAEP state design: 400 schools each were selected from the 4th grade and 8th grade NAEP samples. Schools were stratified by grade, census region, and locale. Within each stratum, schools were sorted by NAEP region, school district, and enrollment. Schools were selected systematically with probability proportional to size, where size was the NAEP state sample basic weight times the SASS measure of size. Note: The samples for 4th and 8th grade were drawn independently, so some schools were selected twice. The sample schools were subjected to the same data collection procedures as all other SASS sample schools. Schools interviewed by both SASS and NAEP were weighted to represent all public schools with 4th or 8th grade in states participating in the state NAEP. Administrators and teachers associated with these sample schools were also weighted to represent administrators and teachers from these same schools. F. Public, Private, and BIA School Library Media Centers
The original school library media center sample included all public, private, and BIA schools in the SASS school sample. There were no public charter schools in the library media center sample.
Note: After data collection began, libraries were subsampled due to resource constraints. Sample
cases that had not responded by a certain date were systematically subsampled from the original sample. Libraries subsampled out were not subjected to nonresponse follow-up procedures and were not considered part of the sample. Libraries selected as part of the subsampling operation had their weights adjusted accordingly. If, however, the libraries subjected to subsampling returned a questionnaire by mail at a later date, they were excluded from the subsampling process and no additional weighting factor was applied. There were 949 libraries that ended up being dropped from the sample through this procedure. G. Public, Private, BIA, and Public Charter School Teachers
The public, private, BIA, and public charter school teacher samples are described together because they were selected using identical methodology. The only differences were in the average number of teachers selected within a school.
1. Sampling Frame
Selecting the teacher sample in public, private, public charter, and BIA schools involved first asking the sampled schools to complete the Teacher Listing Form (TLF), which requested the following information for each teacher: • Grade range taught—mostly students in grades K–6 or mostly students in grades 7–12; • Subject matter taught—special education, general elementary, math, science,
English/language arts, social studies, vocational/technical, or other;
54 1999–2000 SASS Data File User’s Manual
• Teaching status—Full- or part-time;6 • Race/ethnicity—White (non-Hispanic), Black (non-Hispanic), Hispanic, Asian or Pacific
Islander, or American Indian or Alaska Native; • New/experienced—(Teachers in their first, second, or third year of teaching are classified
as new teachers); and • Whether taught classes designed for students with limited English proficiency—Teachers
who used native languages to instruct students with limited English proficiency; or teachers who provided students with limited English proficiency with intensive instruction in English.
The above information for each teacher in a selected SASS school comprised the
school teacher frame. A weighted 8 percent of public schools, 13 percent of private schools, 2 percent
of BIA schools, and 9 percent of public charter schools did not provide teacher lists. A factor in the teacher weighting system was used to adjust for these nonparticipant schools.
2. Allocation
a. Teacher Strata
Within each selected school, teachers were stratified into one of five teacher
types in the following hierarchical order:
• Asian or Pacific Islander (API); • American Indian or Alaska Native (AIAN); • Taught classes designed for students with limited English proficiency; • New; and • Experienced.
b. Within-School Teacher Allocation
The public, BIA, public charter, and private teacher samples were allocated
among the five strata listed above. The total teacher allocation was approximately 72,000. The approximate allocation was 1,600 API teachers, 1,600 AIAN teachers, and 2,100 teachers of classes designed for students with limited English proficiency. Approximately 100 teachers from each of these three strata were allocated to public charter schools in order to achieve a minimum reliability. The remaining 66,700 sample teachers were allocated among new and experienced teachers. Approximately 3,700 of these remaining teachers were to be selected from public charter schools so as to achieve an average sample teacher cluster size approximating that of private schools. Teachers from BIA schools were included with public school teachers for allocation purposes. If a teacher belonged to more than one stratum, for example API and new, the teacher was categorized into the first stratum to which he or she belonged. In this example, that would be API.
Before teachers were allocated to the new/experienced strata, schools were first
allocated an overall number of teachers to be selected. This overall teacher sample size 6 The teaching status variable was used in the imputation process.
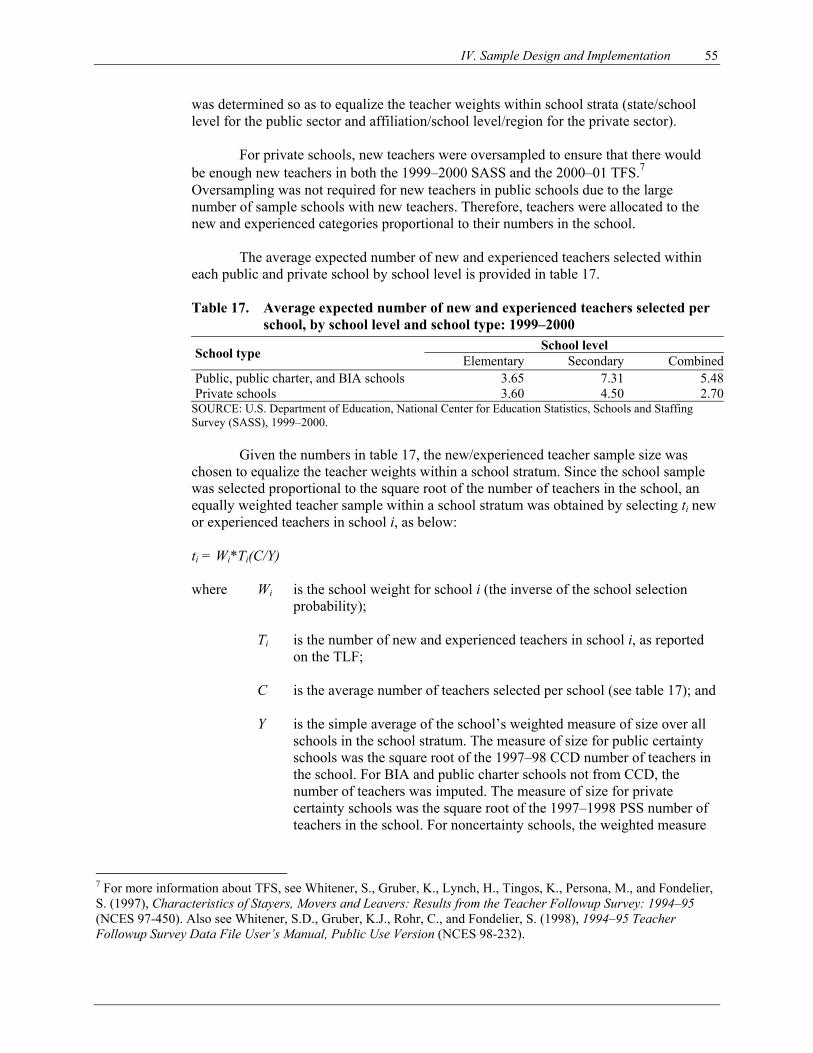
IV. Sample Design and Implementation 55
was determined so as to equalize the teacher weights within school strata (state/school level for the public sector and affiliation/school level/region for the private sector).
For private schools, new teachers were oversampled to ensure that there would
be enough new teachers in both the 1999–2000 SASS and the 2000–01 TFS.7 Oversampling was not required for new teachers in public schools due to the large number of sample schools with new teachers. Therefore, teachers were allocated to the new and experienced categories proportional to their numbers in the school.
The average expected number of new and experienced teachers selected within each public and private school by school level is provided in table 17.
Table 17. Average expected number of new and experienced teachers selected per
school, by school level and school type: 1999–2000 School level School type Elementary Secondary Combined
Public, public charter, and BIA schools 3.65 7.31 5.48Private schools 3.60 4.50 2.70
SOURCE: U.S. Department of Education, National Center for Education Statistics, Schools and Staffing Survey (SASS), 1999–2000.
Given the numbers in table 17, the new/experienced teacher sample size was
chosen to equalize the teacher weights within a school stratum. Since the school sample was selected proportional to the square root of the number of teachers in the school, an equally weighted teacher sample within a school stratum was obtained by selecting ti new or experienced teachers in school i, as below:
ti = Wi*Ti(C/Y)
where Wi is the school weight for school i (the inverse of the school selection
probability); Ti is the number of new and experienced teachers in school i, as reported
on the TLF; C is the average number of teachers selected per school (see table 17); and
Y is the simple average of the school’s weighted measure of size over all schools in the school stratum. The measure of size for public certainty schools was the square root of the 1997–98 CCD number of teachers in the school. For BIA and public charter schools not from CCD, the number of teachers was imputed. The measure of size for private certainty schools was the square root of the 1997–1998 PSS number of teachers in the school. For noncertainty schools, the weighted measure
7 For more information about TFS, see Whitener, S., Gruber, K., Lynch, H., Tingos, K., Persona, M., and Fondelier, S. (1997), Characteristics of Stayers, Movers and Leavers: Results from the Teacher Followup Survey: 1994–95 (NCES 97-450). Also see Whitener, S.D., Gruber, K.J., Rohr, C., and Fondelier, S. (1998), 1994–95 Teacher Followup Survey Data File User’s Manual, Public Use Version (NCES 98-232).
56 1999–2000 SASS Data File User’s Manual
of size equals the school sampling interval times the square root of the number of teachers in the school.
The maximum number of new/experienced teachers per school was set at twice
the average number of teachers selected per school from table 17. At least one teacher was selected in each school.
Given the allocation of teachers, ti, teachers were allocated to the
new/experienced strata, tni and tei, respectively, in the following manner.
tni = (A*Tni*ti)/(Tei+A*Tni), and
tei = (Tei*ti)/(Tei+A*Tni)
where A is the oversampling factor for new teachers (A = 1.0 for public, BIA, and public charter school teachers and A = 1.5 for private school teachers);
The values for A were determined based on the new teacher sample
sizes needed to meet minimum reliability requirements; Tni is the number of new teachers in school i; and
Tei is the number of experienced teachers in school i;
The API teachers, AIAN teachers, and teachers who taught classes designed for
students with limited English proficiency were allocated in the following manner:
tpi = (Wi * Tpi)/R
tai = (Wi * Tai)/H
tbi = (Wi * Tbi)/Q
where Tpi is the number of API teachers in school i; Tai is the number of AIAN teachers in school i; Tbi is the number of teachers who taught classes designed for students with
limited English proficiency in school i; R is the national sampling interval to ensure that at least 1,600 API
teachers are selected nationwide (see table 18); H is the national sampling interval to ensure that at least 1,600 AIAN
teachers are selected nationwide (see table 18); and Q is the national sampling interval to ensure that at least 2,100 teachers
who taught classes designed for students with limited English proficiency are selected nationwide (see table 18).
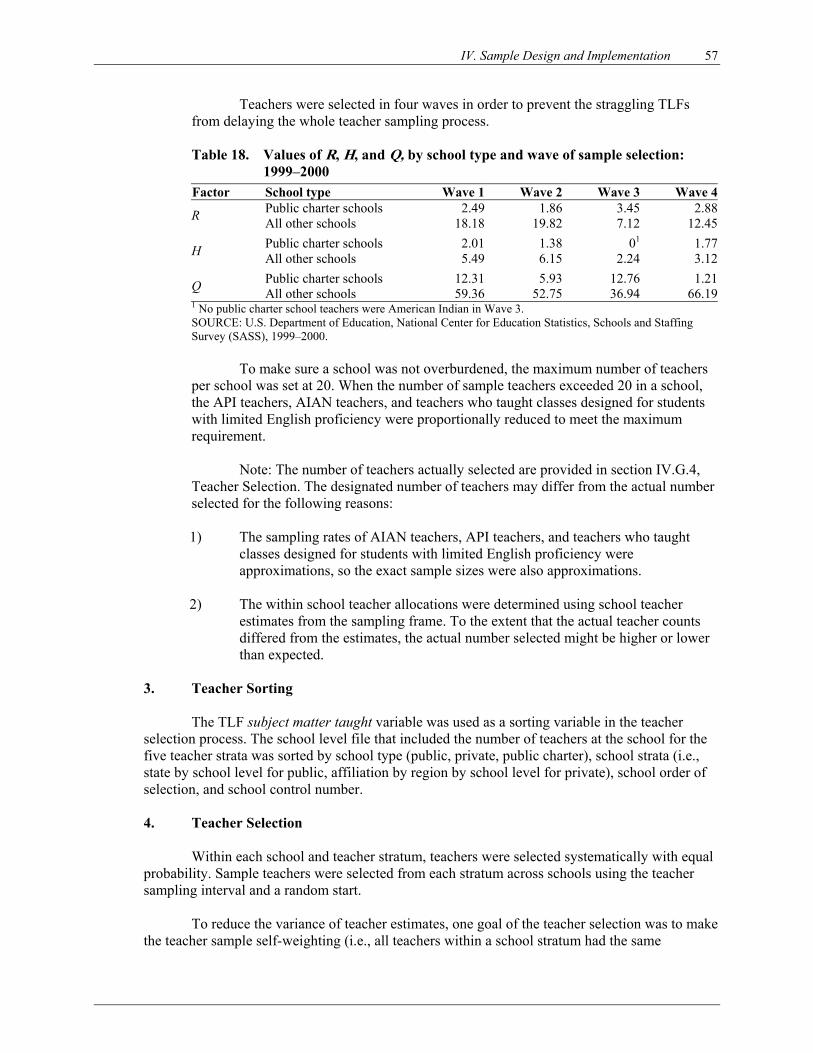
IV. Sample Design and Implementation 57
Teachers were selected in four waves in order to prevent the straggling TLFs from delaying the whole teacher sampling process.
Table 18. Values of R, H, and Q, by school type and wave of sample selection:
1999–2000 Factor School type Wave 1 Wave 2 Wave 3 Wave 4
Public charter schools 2.49 1.86 3.45 2.88R All other schools 18.18 19.82 7.12 12.45
Public charter schools 2.01 1.38 01 1.77H All other schools 5.49 6.15 2.24 3.12
Public charter schools 12.31 5.93 12.76 1.21Q All other schools 59.36 52.75 36.94 66.191 No public charter school teachers were American Indian in Wave 3. SOURCE: U.S. Department of Education, National Center for Education Statistics, Schools and Staffing Survey (SASS), 1999–2000.
To make sure a school was not overburdened, the maximum number of teachers per school was set at 20. When the number of sample teachers exceeded 20 in a school, the API teachers, AIAN teachers, and teachers who taught classes designed for students with limited English proficiency were proportionally reduced to meet the maximum requirement.
Note: The number of teachers actually selected are provided in section IV.G.4,
Teacher Selection. The designated number of teachers may differ from the actual number selected for the following reasons:
1) The sampling rates of AIAN teachers, API teachers, and teachers who taught
classes designed for students with limited English proficiency were approximations, so the exact sample sizes were also approximations.
2) The within school teacher allocations were determined using school teacher
estimates from the sampling frame. To the extent that the actual teacher counts differed from the estimates, the actual number selected might be higher or lower than expected.
3. Teacher Sorting
The TLF subject matter taught variable was used as a sorting variable in the teacher
selection process. The school level file that included the number of teachers at the school for the five teacher strata was sorted by school type (public, private, public charter), school strata (i.e., state by school level for public, affiliation by region by school level for private), school order of selection, and school control number.
4. Teacher Selection
Within each school and teacher stratum, teachers were selected systematically with equal
probability. Sample teachers were selected from each stratum across schools using the teacher sampling interval and a random start.
To reduce the variance of teacher estimates, one goal of the teacher selection was to make
the teacher sample self-weighting (i.e., all teachers within a school stratum had the same
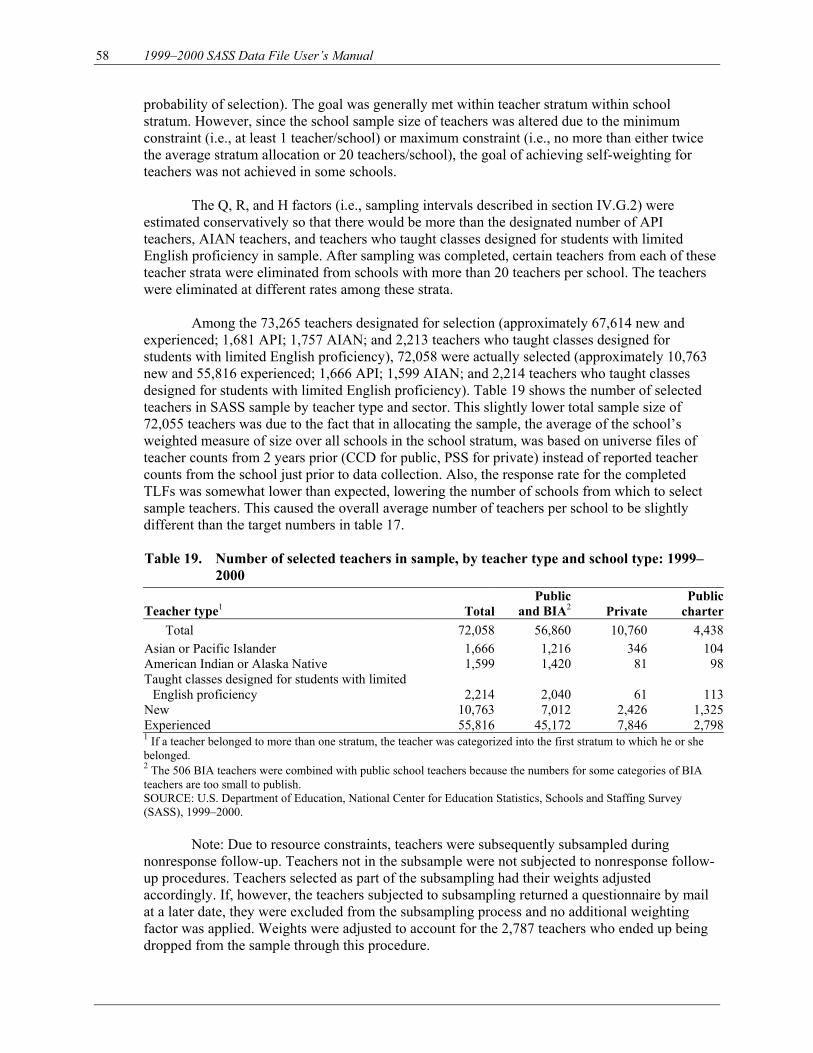
58 1999–2000 SASS Data File User’s Manual
probability of selection). The goal was generally met within teacher stratum within school stratum. However, since the school sample size of teachers was altered due to the minimum constraint (i.e., at least 1 teacher/school) or maximum constraint (i.e., no more than either twice the average stratum allocation or 20 teachers/school), the goal of achieving self-weighting for teachers was not achieved in some schools.
The Q, R, and H factors (i.e., sampling intervals described in section IV.G.2) were
estimated conservatively so that there would be more than the designated number of API teachers, AIAN teachers, and teachers who taught classes designed for students with limited English proficiency in sample. After sampling was completed, certain teachers from each of these teacher strata were eliminated from schools with more than 20 teachers per school. The teachers were eliminated at different rates among these strata.
Among the 73,265 teachers designated for selection (approximately 67,614 new and
experienced; 1,681 API; 1,757 AIAN; and 2,213 teachers who taught classes designed for students with limited English proficiency), 72,058 were actually selected (approximately 10,763 new and 55,816 experienced; 1,666 API; 1,599 AIAN; and 2,214 teachers who taught classes designed for students with limited English proficiency). Table 19 shows the number of selected teachers in SASS sample by teacher type and sector. This slightly lower total sample size of 72,055 teachers was due to the fact that in allocating the sample, the average of the school’s weighted measure of size over all schools in the school stratum, was based on universe files of teacher counts from 2 years prior (CCD for public, PSS for private) instead of reported teacher counts from the school just prior to data collection. Also, the response rate for the completed TLFs was somewhat lower than expected, lowering the number of schools from which to select sample teachers. This caused the overall average number of teachers per school to be slightly different than the target numbers in table 17.
Table 19. Number of selected teachers in sample, by teacher type and school type: 1999–
2000
Teacher type1 TotalPublic
and BIA2 PrivatePublic
charter
Total 72,058 56,860 10,760 4,438
Asian or Pacific Islander 1,666 1,216 346 104American Indian or Alaska Native 1,599 1,420 81 98Taught classes designed for students with limited
English proficiency 2,214 2,040 61 113New 10,763 7,012 2,426 1,325Experienced 55,816 45,172 7,846 2,7981 If a teacher belonged to more than one stratum, the teacher was categorized into the first stratum to which he or she belonged. 2 The 506 BIA teachers were combined with public school teachers because the numbers for some categories of BIA teachers are too small to publish. SOURCE: U.S. Department of Education, National Center for Education Statistics, Schools and Staffing Survey (SASS), 1999–2000.
Note: Due to resource constraints, teachers were subsequently subsampled during nonresponse follow-up. Teachers not in the subsample were not subjected to nonresponse follow-up procedures. Teachers selected as part of the subsampling had their weights adjusted accordingly. If, however, the teachers subjected to subsampling returned a questionnaire by mail at a later date, they were excluded from the subsampling process and no additional weighting factor was applied. Weights were adjusted to account for the 2,787 teachers who ended up being dropped from the sample through this procedure.
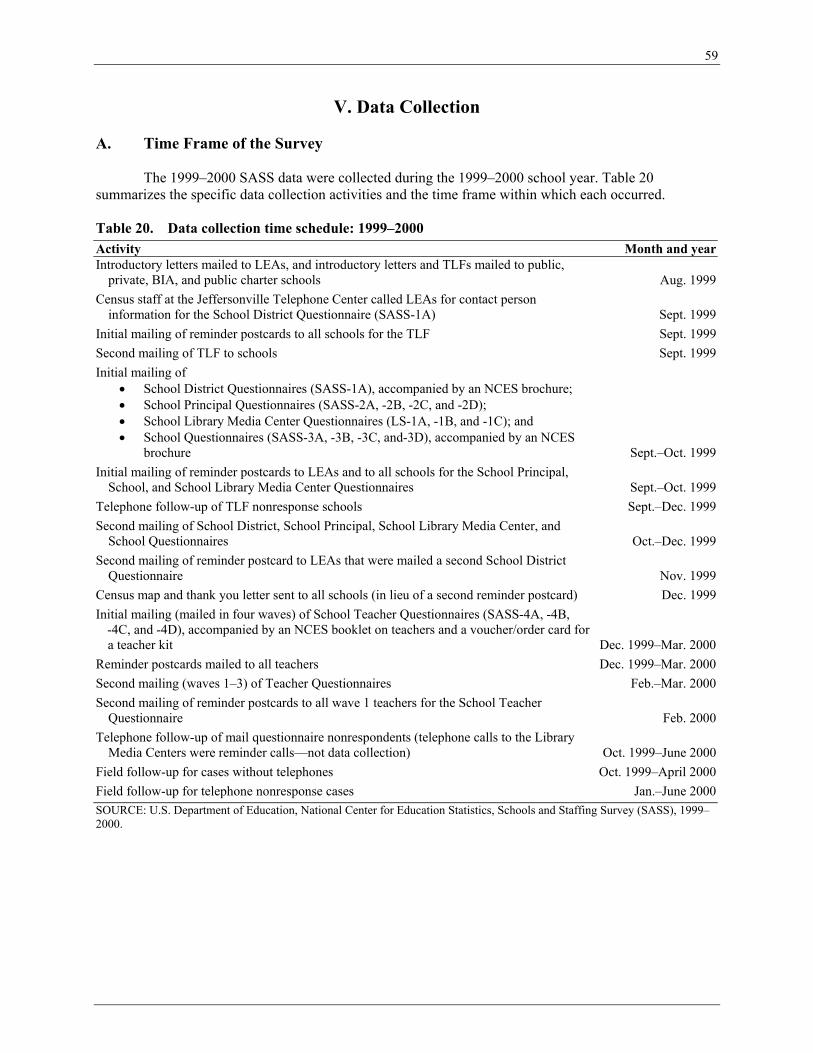
59
V. Data Collection
A. Time Frame of the Survey
The 1999–2000 SASS data were collected during the 1999–2000 school year. Table 20 summarizes the specific data collection activities and the time frame within which each occurred.
Table 20. Data collection time schedule: 1999–2000 Activity Month and yearIntroductory letters mailed to LEAs, and introductory letters and TLFs mailed to public,
private, BIA, and public charter schools Aug. 1999Census staff at the Jeffersonville Telephone Center called LEAs for contact person
information for the School District Questionnaire (SASS-1A) Sept. 1999Initial mailing of reminder postcards to all schools for the TLF Sept. 1999Second mailing of TLF to schools Sept. 1999Initial mailing of
• School District Questionnaires (SASS-1A), accompanied by an NCES brochure; • School Principal Questionnaires (SASS-2A, -2B, -2C, and -2D); • School Library Media Center Questionnaires (LS-1A, -1B, and -1C); and • School Questionnaires (SASS-3A, -3B, -3C, and-3D), accompanied by an NCES
brochure Sept.–Oct. 1999Initial mailing of reminder postcards to LEAs and to all schools for the School Principal,
School, and School Library Media Center Questionnaires Sept.–Oct. 1999Telephone follow-up of TLF nonresponse schools Sept.–Dec. 1999Second mailing of School District, School Principal, School Library Media Center, and
School Questionnaires Oct.–Dec. 1999Second mailing of reminder postcard to LEAs that were mailed a second School District
Questionnaire Nov. 1999Census map and thank you letter sent to all schools (in lieu of a second reminder postcard) Dec. 1999Initial mailing (mailed in four waves) of School Teacher Questionnaires (SASS-4A, -4B,
-4C, and -4D), accompanied by an NCES booklet on teachers and a voucher/order card for a teacher kit Dec. 1999–Mar. 2000
Reminder postcards mailed to all teachers Dec. 1999–Mar. 2000Second mailing (waves 1–3) of Teacher Questionnaires Feb.–Mar. 2000Second mailing of reminder postcards to all wave 1 teachers for the School Teacher
Questionnaire Feb. 2000Telephone follow-up of mail questionnaire nonrespondents (telephone calls to the Library
Media Centers were reminder calls—not data collection) Oct. 1999–June 2000Field follow-up for cases without telephones Oct. 1999–April 2000Field follow-up for telephone nonresponse cases Jan.–June 2000SOURCE: U.S. Department of Education, National Center for Education Statistics, Schools and Staffing Survey (SASS), 1999–2000.
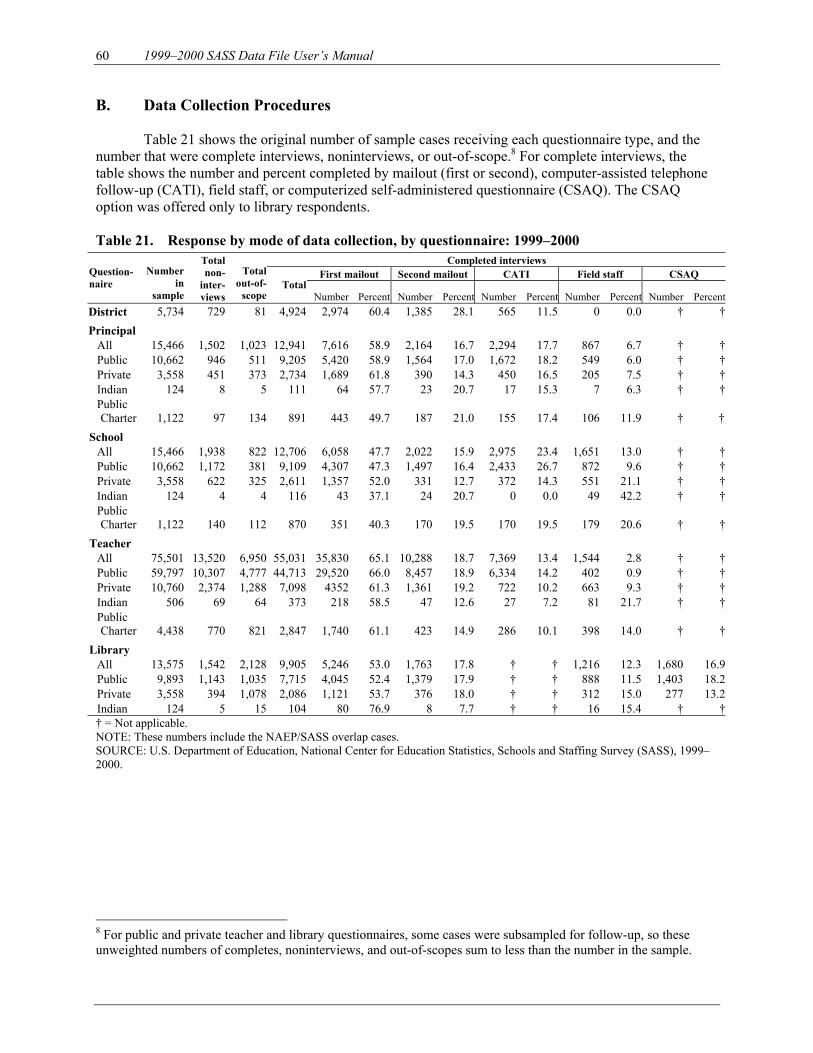
60 1999–2000 SASS Data File User’s Manual
B. Data Collection Procedures
Table 21 shows the original number of sample cases receiving each questionnaire type, and the number that were complete interviews, noninterviews, or out-of-scope.8 For complete interviews, the table shows the number and percent completed by mailout (first or second), computer-assisted telephone follow-up (CATI), field staff, or computerized self-administered questionnaire (CSAQ). The CSAQ option was offered only to library respondents. Table 21. Response by mode of data collection, by questionnaire: 1999–2000
Completed interviews First mailout Second mailout CATI Field staff CSAQ Question-
naire Number
in sample
Total non-
inter-views
Total out-of-
scope Total
Number Percent Number Percent Number Percent Number Percent Number PercentDistrict 5,734 729 81 4,924 2,974 60.4 1,385 28.1 565 11.5 0 0.0 † †
Principal All 15,466 1,502 1,023 12,941 7,616 58.9 2,164 16.7 2,294 17.7 867 6.7 † †Public 10,662 946 511 9,205 5,420 58.9 1,564 17.0 1,672 18.2 549 6.0 † †Private 3,558 451 373 2,734 1,689 61.8 390 14.3 450 16.5 205 7.5 † †Indian 124 8 5 111 64 57.7 23 20.7 17 15.3 7 6.3 † †Public Charter 1,122 97 134 891 443 49.7 187 21.0 155 17.4 106 11.9 † †
School All 15,466 1,938 822 12,706 6,058 47.7 2,022 15.9 2,975 23.4 1,651 13.0 † †Public 10,662 1,172 381 9,109 4,307 47.3 1,497 16.4 2,433 26.7 872 9.6 † †Private 3,558 622 325 2,611 1,357 52.0 331 12.7 372 14.3 551 21.1 † †Indian 124 4 4 116 43 37.1 24 20.7 0 0.0 49 42.2 † †Public Charter 1,122 140 112 870 351 40.3 170 19.5 170 19.5 179 20.6 † †
Teacher All 75,501 13,520 6,950 55,031 35,830 65.1 10,288 18.7 7,369 13.4 1,544 2.8 † †Public 59,797 10,307 4,777 44,713 29,520 66.0 8,457 18.9 6,334 14.2 402 0.9 † †Private 10,760 2,374 1,288 7,098 4352 61.3 1,361 19.2 722 10.2 663 9.3 † †Indian 506 69 64 373 218 58.5 47 12.6 27 7.2 81 21.7 † †Public Charter 4,438 770 821 2,847 1,740 61.1 423 14.9 286 10.1 398 14.0 † †
Library All 13,575 1,542 2,128 9,905 5,246 53.0 1,763 17.8 † † 1,216 12.3 1,680 16.9Public 9,893 1,143 1,035 7,715 4,045 52.4 1,379 17.9 † † 888 11.5 1,403 18.2Private 3,558 394 1,078 2,086 1,121 53.7 376 18.0 † † 312 15.0 277 13.2Indian 124 5 15 104 80 76.9 8 7.7 † † 16 15.4 † †† = Not applicable. NOTE: These numbers include the NAEP/SASS overlap cases. SOURCE: U.S. Department of Education, National Center for Education Statistics, Schools and Staffing Survey (SASS), 1999–2000.
8 For public and private teacher and library questionnaires, some cases were subsampled for follow-up, so these unweighted numbers of completes, noninterviews, and out-of-scopes sum to less than the number in the sample.
V. Data Collection 61
1. Local Education Agencies (LEAs) and the School District Questionnaire (SASS-1A)
a. Advance Letter and LEA Contact Operation
In August 1999, a letter was mailed to each sample LEA; the letter described SASS and requested the LEA’s cooperation. This letter also informed LEA personnel that a Census field representative would call during September to obtain the name of a contact person (the person to whom the School District questionnaire—SASS-1A—should be addressed). Staff then telephoned the LEAs and obtained the contact names. b. Questionnaire Mailings and Reminder Postcards
The first mailout of the School District Questionnaires (SASS-1A) to the sample
LEAs was 2 weeks after the LEA contact person telephone calls were completed. The questionnaires were addressed to the contact person whose name had been provided in September or, if no name had been provided, to “Superintendent.” The package included the brochure, Snapshots of Public Schools. The eligible respondent for the School District Questionnaire included any knowledgeable LEA employee (for some LEAs, the data were provided by several staff members).
Reminder postcards were mailed 1 week after the initial mailout. After 6 weeks,
a second copy of the questionnaire was mailed to each LEA for which the original form had not been returned. A second reminder postcard was mailed to nonresponding LEAs 1 week after the second mailout of the School District Questionnaire. c. Nonresponse Follow-up
The mailout phase was completed at the end of December. CATI nonresponse
follow-up began in January 2000 and was completed in the beginning of March. Field follow-up of 34 large LEAs began in January while CATI was in progress. Following CATI completion, approximately 400 more LEAs (CATI nonrespondents) were assigned to field representatives. Field follow-up was completed in June.
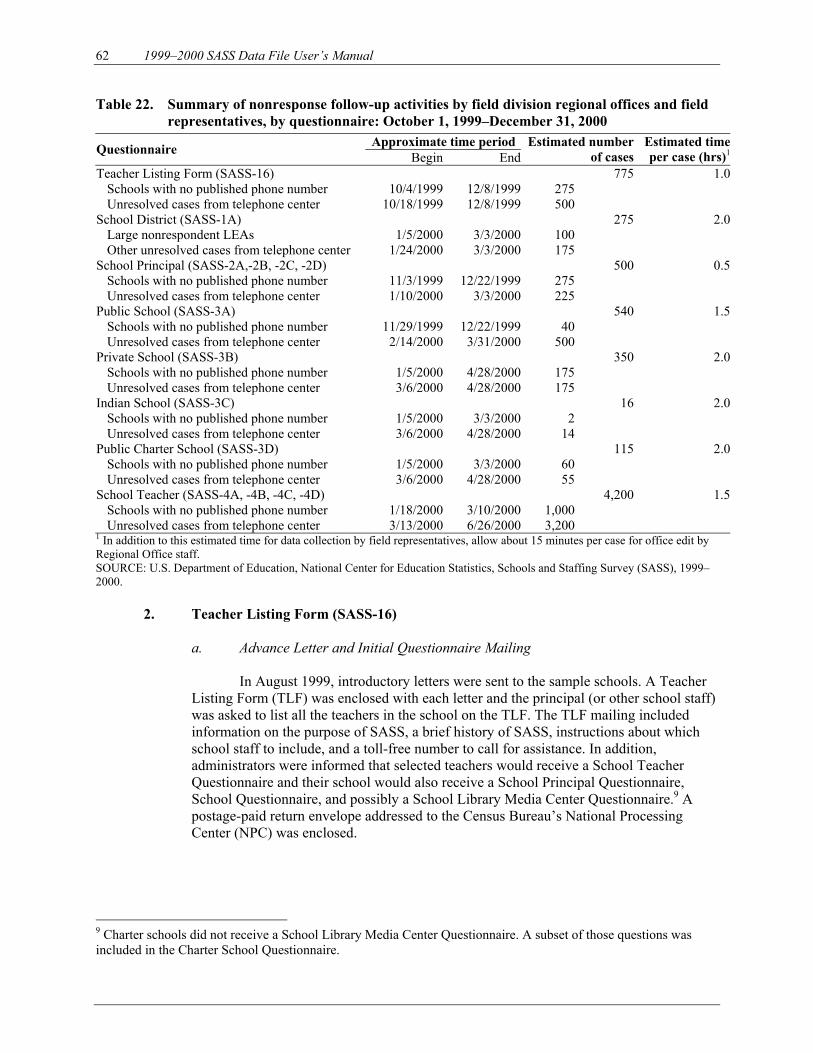
62 1999–2000 SASS Data File User’s Manual
Table 22. Summary of nonresponse follow-up activities by field division regional offices and field representatives, by questionnaire: October 1, 1999–December 31, 2000
Approximate time periodQuestionnaire Begin EndEstimated number
of cases Estimated time per case (hrs)1
Teacher Listing Form (SASS-16) 775 1.0Schools with no published phone number 10/4/1999 12/8/1999 275 Unresolved cases from telephone center 10/18/1999 12/8/1999 500
School District (SASS-1A) 275 2.0Large nonrespondent LEAs 1/5/2000 3/3/2000 100 Other unresolved cases from telephone center 1/24/2000 3/3/2000 175
School Principal (SASS-2A,-2B, -2C, -2D) 500 0.5Schools with no published phone number 11/3/1999 12/22/1999 275 Unresolved cases from telephone center 1/10/2000 3/3/2000 225
Public School (SASS-3A) 540 1.5Schools with no published phone number 11/29/1999 12/22/1999 40 Unresolved cases from telephone center 2/14/2000 3/31/2000 500
Private School (SASS-3B) 350 2.0Schools with no published phone number 1/5/2000 4/28/2000 175 Unresolved cases from telephone center 3/6/2000 4/28/2000 175
Indian School (SASS-3C) 16 2.0Schools with no published phone number 1/5/2000 3/3/2000 2 Unresolved cases from telephone center 3/6/2000 4/28/2000 14
Public Charter School (SASS-3D) 115 2.0Schools with no published phone number 1/5/2000 3/3/2000 60 Unresolved cases from telephone center 3/6/2000 4/28/2000 55
School Teacher (SASS-4A, -4B, -4C, -4D) 4,200 1.5Schools with no published phone number 1/18/2000 3/10/2000 1,000 Unresolved cases from telephone center 3/13/2000 6/26/2000 3,200
1 In addition to this estimated time for data collection by field representatives, allow about 15 minutes per case for office edit by Regional Office staff. SOURCE: U.S. Department of Education, National Center for Education Statistics, Schools and Staffing Survey (SASS), 1999–2000.
2. Teacher Listing Form (SASS-16)
a. Advance Letter and Initial Questionnaire Mailing
In August 1999, introductory letters were sent to the sample schools. A Teacher Listing Form (TLF) was enclosed with each letter and the principal (or other school staff) was asked to list all the teachers in the school on the TLF. The TLF mailing included information on the purpose of SASS, a brief history of SASS, instructions about which school staff to include, and a toll-free number to call for assistance. In addition, administrators were informed that selected teachers would receive a School Teacher Questionnaire and their school would also receive a School Principal Questionnaire, School Questionnaire, and possibly a School Library Media Center Questionnaire.9 A postage-paid return envelope addressed to the Census Bureau’s National Processing Center (NPC) was enclosed.
9 Charter schools did not receive a School Library Media Center Questionnaire. A subset of those questions was included in the Charter School Questionnaire.
V. Data Collection 63
b. Reminder Postcard and Second Questionnaire Mailing
Three weeks after the TLFs were mailed, a reminder postcard was mailed to each school. One week after the postcard, a second copy of the TLF was mailed to each school that had not returned the first TLF. c. Nonresponse Follow-up
Telephone follow-up of the TLF nonresponse schools began 1 week after the
second mailout of the questionnaire via paper and pencil interview (PAPI) and was completed in mid-December. Following PAPI, cases were assigned to field staff. These cases included cases that were classified as refusals but who returned another SASS form, requests for a personal visit, cases previously sent to field representatives with inconclusive outcomes, and telephone center noninterviews. Field follow-up was completed in late January.
3. School Questionnaires (SASS-3A, -3B, -3C, and -3D)
a. Advance Letter (Public Charter Schools—SASS-3D—Only)
In August 1999, an introductory letter was mailed to the directors of all public
charter schools that explained the purpose of SASS and requested their information. This letter also informed the director that SASS would be conducted in place of the National Study of Charter Schools, a 4-year longitudinal survey of charter schools.
b. Questionnaire Mailings and Reminder Postcards
In October, the public, private, BIA, and public charter school questionnaires
(SASS-3A, -3B, -3C, and -3D) were mailed to the schools. The initial mailing included the questionnaires and a brochure of findings. Public and BIA schools were sent Snapshots of Public Schools. Private schools were sent Snapshots of Private Schools. The findings in both brochures were based on the 1993–94 SASS. Public charter schools were sent Schools and Staffing Survey 1999–2000 (NCES 1999–349). Although these questionnaires were addressed to “Principal,” the respondent could be any knowledgeable school staff member (e.g., assistant principal or school secretary). Reminder postcards were sent to all schools within 2 weeks of the first mailing of the questionnaire.
Approximately 1 month after the initial mailing, a second copy of the
questionnaire was mailed to each school for which the original form had not been received. In lieu of a second reminder postcard, a thank-you letter that included a wall map of the United States was sent to all schools 1 month after the second mailing of the questionnaires. The letter also reminded those schools that they had been sent a TLF, a School Principal Questionnaire, and (for most schools) a School Library Media Center Questionnaire.
64 1999–2000 SASS Data File User’s Manual
c. Nonresponse Follow-up
In October 1999, some nonresponse cases were assigned to field staff for follow-up activities in conjunction with the TLF nonrespondent follow-up.10 For most nonresponse public, private, and public charter school cases, CATI follow-up began 1 month after the second reminder. Since there were only 50 BIA school cases, they were all assigned for field follow-up, which took place concurrently with CATI for the public, private, and public charter schools.
Field follow-up for most public, private, and public charter schools began in
March 2000, approximately 2 weeks after CATI was completed, although field follow-up for schools without phones had begun in January. In May, a letter was sent to the remaining public charter school nonrespondents to inform them that field representatives would be calling to request their cooperation. Field follow-up for all schools was completed in June 2000.
4. School Principal Questionnaires (SASS-2A, -2B, -2C, and -2D)
a. Questionnaire Mailings and Reminder Postcard
School Principal Questionnaires were mailed in September 1999. The principal was the only eligible respondent, and therefore, all questionnaires were addressed to the principal. All reminder postcards were mailed within 3 weeks of the first mailing. Approximately 1 month after the first mailout, a second questionnaire was mailed to principals who had not responded. The mailout phase was completed in mid-November. b. Nonresponse Follow-up
In October 1999, some cases were assigned to field staff for follow-up activities
in conjunction with the TLF nonrespondent follow-up. CATI nonresponse follow-up began in mid-November. Following CATI closeout in December, the remaining principal questionnaires were assigned to field representatives. The field phase was completed in May 2000.
5. School Teacher Questionnaires (SASS-4A, -4B, -4C, and -4D)
a. Questionnaire Mailings and Reminder Postcards
Since the lists of teachers were obtained from the schools through the TLF over a
4-month period, School Teacher Questionnaires were mailed to the schools in four waves, in order to maximize the available time for collecting the questionnaire data. Approximately 49 percent of the questionnaires were mailed in December 1999, 39 percent in January 2000, 5 percent in February 2000, and 7 percent in March 2000. Each questionnaire was accompanied by Teachers on Teaching, a brochure of findings about teachers from the 1993–94 SASS, and by a voucher/order card for a teacher kit comprised of a 24-page teacher guide and a 4-ft. by 6-ft. U.S. map with 1990 state
10 The first field follow-up was for nonresponding TLFs, as the TLFs had the earliest closeout. When it was determined that a personal visit to a school was required for the TLF, the field representative was provided with other nonresponse questionnaires—principal, school, library media center.
V. Data Collection 65
population figures. Reminder postcards were mailed within 1 week of the first questionnaire mailout for each wave.
Within 6 weeks of the initial mailing for each type of questionnaire, a second copy of the questionnaire was mailed to each wave, excluding wave 4 (wave 4 was sent directly to CATI for nonresponse follow-up), for which the original form had not been returned.
A second reminder postcard was mailed within 1 week of the second
questionnaire mailout, but due to time limitations, it was mailed only to wave 1 teachers.
b. Nonresponse Follow-up
CATI and field nonresponse follow-up began approximately 1 month after the second mailing for each wave of the School Teacher Questionnaires. In general, cases with phone numbers were assigned to CATI and cases without phone numbers were assigned to field staff. Some additional teacher cases were assigned directly to field staff if a school had been assigned to field staff for follow-up of other questionnaires. When CATI started, 1,241 teacher questionnaires had been assigned to field staff.
The number of cases assigned for CATI and field follow-up for each of the four
waves was reduced by approximately 15 percent to lower costs. This reduction was applied to experienced teachers only (not New teachers, Teachers of classes designed for students with limited English proficiency, Asian or Pacific Islander teachers, or American Indian or Alaska Native). After CATI was completed, the remaining nonrespondent cases were to have been assigned to field representatives. However, in March 2000, staff observed that the number of CATI nonrespondents likely would exceed expectations, which would impact staffing and costs further. The following adjustments were made: • CATI was extended through the end of the school year. Public school teachers
remained in CATI, substantially reducing the number of cases that would have been assigned to field staff. In addition, all wave 4 teachers were assigned to CATI through the end of the school year.
• Of the 13,691 teacher cases from mailout waves 2 and 3 that would have been assigned to CATI at that time (and to field staff after CATI), 2,500 were assigned to field staff directly. These included all of the private school and public charter school teacher cases, from which staff expected response rates lower than public school teachers. Assigning these cases to field staff for an extended time period increased the chances of getting interviews.
• A letter was sent to the active CATI cases (approximately 8,000) in May 2000. The letter asked for their cooperation and provided the respondents with toll-free numbers to call and arrange an interview to be conducted at their convenience.
All follow-up was completed in June 2000.
6. School Library Media Center Questionnaires (LS-1A, -1B, and -1C)
a. Questionnaire Mailings and Reminder Postcards
The school library media center questionnaires were mailed in September 1999.
It could be completed by the school librarian or another school staff member who was
66 1999–2000 SASS Data File User’s Manual
familiar with the library. A computerized self-administered questionnaire (CSAQ) was available on the Internet. Details and benefits to completing the questionnaire online were outlined in the beginning of the questionnaire. Reminder postcards were mailed within 1 month of the initial mailout.
b. Nonresponse Follow-up
A separate CATI instrument was used for the school library media center
nonresponse follow-up. There were two rounds of CATI nonresponse follow-up for public and private schools. (BIA school nonrespondents were sent for field follow-up.) The CATI instrument did not collect data in either round; rather, respondents were encouraged to reply by mail or CSAQ. The first round took place from November to December, and the second round took place from February to March 2000. In the second round, calls were made to respondents from the first round who had said they would respond but had not.
Field follow-up activities began in October 1999 in conjunction with the TLF
nonrespondent follow-up. As field representatives were assigned TLF questionnaires for schools without phones, they were also given nonresponding principal and library questionnaires for those schools. A sample reduction was implemented after the CATI closeout in March because of a higher than expected number of nonresponse cases. The cases sent to field staff included 650 school library media center cases already assigned along with the SASS principal follow-up, 300 new cases along with the SASS school follow-up, and a sample of 900 from the remaining 2,350 school library media center cases. Field follow-up was completed in June.
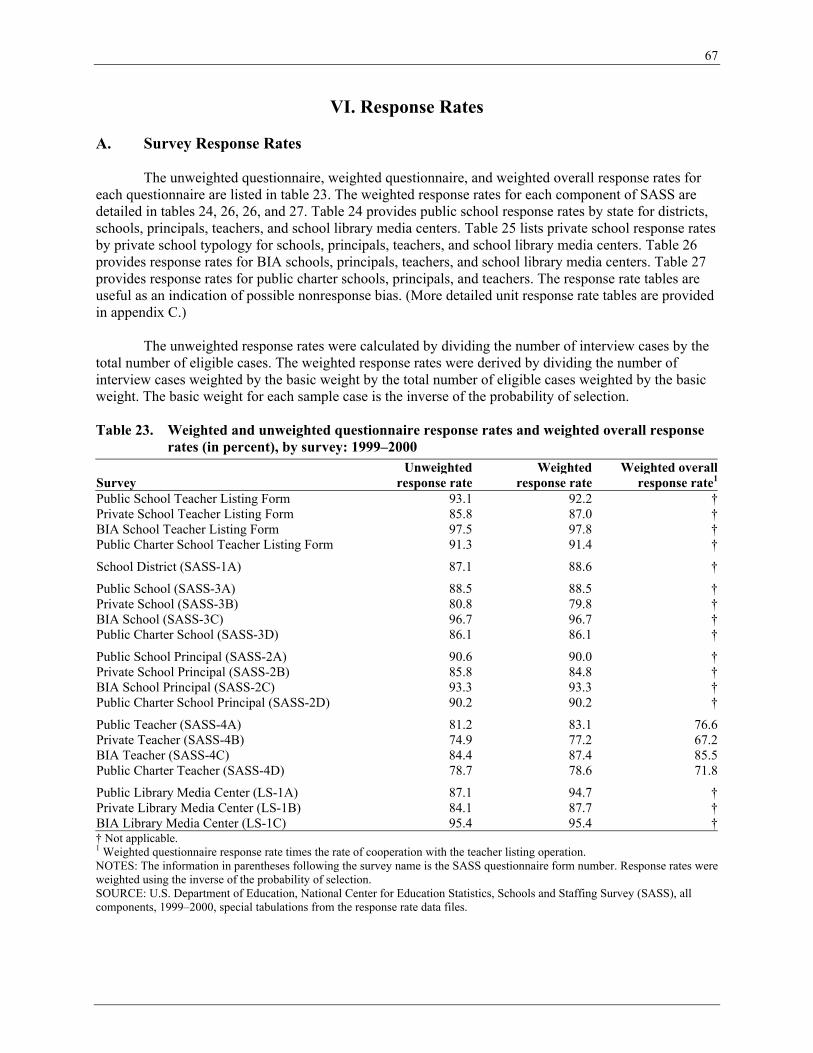
67
VI. Response Rates A. Survey Response Rates The unweighted questionnaire, weighted questionnaire, and weighted overall response rates for each questionnaire are listed in table 23. The weighted response rates for each component of SASS are detailed in tables 24, 26, 26, and 27. Table 24 provides public school response rates by state for districts, schools, principals, teachers, and school library media centers. Table 25 lists private school response rates by private school typology for schools, principals, teachers, and school library media centers. Table 26 provides response rates for BIA schools, principals, teachers, and school library media centers. Table 27 provides response rates for public charter schools, principals, and teachers. The response rate tables are useful as an indication of possible nonresponse bias. (More detailed unit response rate tables are provided in appendix C.) The unweighted response rates were calculated by dividing the number of interview cases by the total number of eligible cases. The weighted response rates were derived by dividing the number of interview cases weighted by the basic weight by the total number of eligible cases weighted by the basic weight. The basic weight for each sample case is the inverse of the probability of selection. Table 23. Weighted and unweighted questionnaire response rates and weighted overall response
rates (in percent), by survey: 1999–2000
Survey Unweighted
response rateWeighted
response rateWeighted overall
response rate1
Public School Teacher Listing Form 93.1 92.2 †Private School Teacher Listing Form 85.8 87.0 †BIA School Teacher Listing Form 97.5 97.8 †Public Charter School Teacher Listing Form 91.3 91.4 †
School District (SASS-1A) 87.1 88.6 †
Public School (SASS-3A) 88.5 88.5 †Private School (SASS-3B) 80.8 79.8 †BIA School (SASS-3C) 96.7 96.7 †Public Charter School (SASS-3D) 86.1 86.1 †
Public School Principal (SASS-2A) 90.6 90.0 †Private School Principal (SASS-2B) 85.8 84.8 †BIA School Principal (SASS-2C) 93.3 93.3 †Public Charter School Principal (SASS-2D) 90.2 90.2 †
Public Teacher (SASS-4A) 81.2 83.1 76.6Private Teacher (SASS-4B) 74.9 77.2 67.2BIA Teacher (SASS-4C) 84.4 87.4 85.5Public Charter Teacher (SASS-4D) 78.7 78.6 71.8
Public Library Media Center (LS-1A) 87.1 94.7 †Private Library Media Center (LS-1B) 84.1 87.7 †BIA Library Media Center (LS-1C) 95.4 95.4 †† Not applicable. 1 Weighted questionnaire response rate times the rate of cooperation with the teacher listing operation. NOTES: The information in parentheses following the survey name is the SASS questionnaire form number. Response rates were weighted using the inverse of the probability of selection. SOURCE: U.S. Department of Education, National Center for Education Statistics, Schools and Staffing Survey (SASS), all components, 1999–2000, special tabulations from the response rate data files.
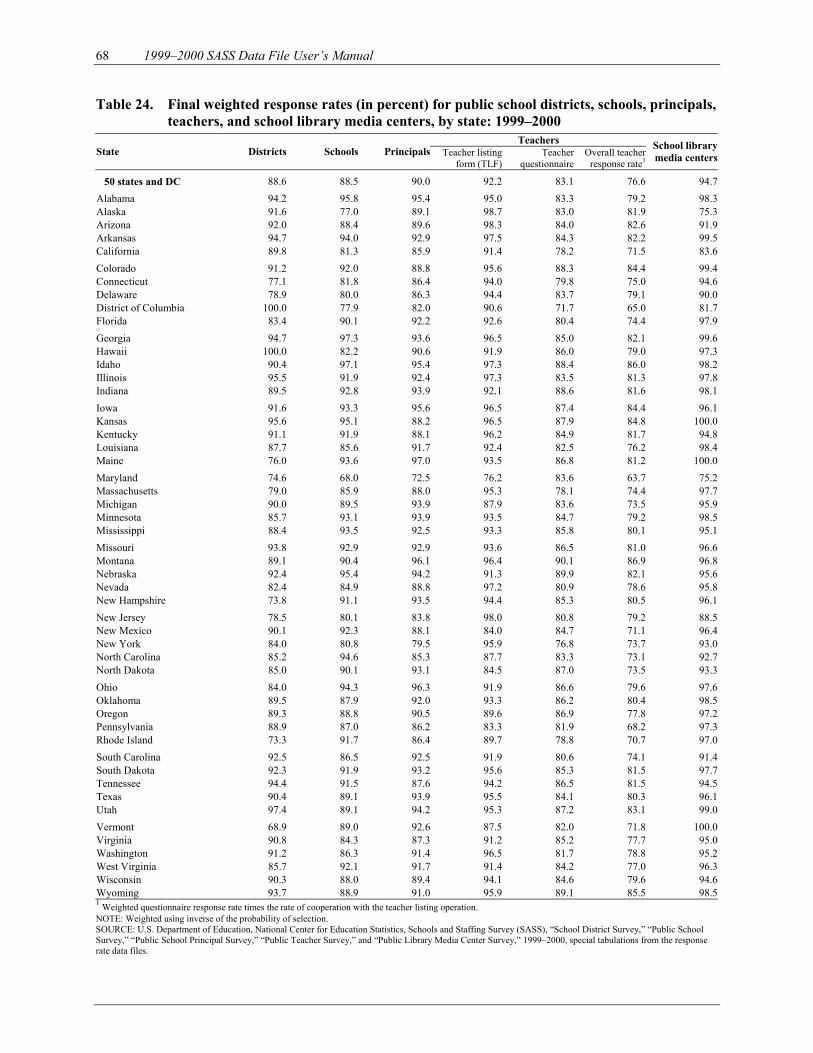
68 1999–2000 SASS Data File User’s Manual
Table 24. Final weighted response rates (in percent) for public school districts, schools, principals, teachers, and school library media centers, by state: 1999–2000
Teachers State Districts Schools Principals Teacher listing
form (TLF)Teacher
questionnaireOverall teacher
response rate1
School library media centers
50 states and DC 88.6 88.5 90.0 92.2 83.1 76.6 94.7
Alabama 94.2 95.8 95.4 95.0 83.3 79.2 98.3Alaska 91.6 77.0 89.1 98.7 83.0 81.9 75.3Arizona 92.0 88.4 89.6 98.3 84.0 82.6 91.9Arkansas 94.7 94.0 92.9 97.5 84.3 82.2 99.5California 89.8 81.3 85.9 91.4 78.2 71.5 83.6
Colorado 91.2 92.0 88.8 95.6 88.3 84.4 99.4Connecticut 77.1 81.8 86.4 94.0 79.8 75.0 94.6Delaware 78.9 80.0 86.3 94.4 83.7 79.1 90.0District of Columbia 100.0 77.9 82.0 90.6 71.7 65.0 81.7Florida 83.4 90.1 92.2 92.6 80.4 74.4 97.92.5
Georgia 94.7 97.3 93.6 96.5 85.0 82.1 99.6Hawaii 100.0 82.2 90.6 91.9 86.0 79.0 97.3Idaho 90.4 97.1 95.4 97.3 88.4 86.0 98.2Illinois 95.5 91.9 92.4 97.3 83.5 81.3 97.8Indiana 89.5 92.8 93.9 92.1 88.6 81.6 98.1
Iowa 91.6 93.3 95.6 96.5 87.4 84.4 96.1Kansas 95.6 95.1 88.2 96.5 87.9 84.8 100.0Kentucky 91.1 91.9 88.1 96.2 84.9 81.7 94.8Louisiana 87.7 85.6 91.7 92.4 82.5 76.2 98.4Maine 76.0 93.6 97.0 93.5 86.8 81.2 100.0
Maryland 74.6 68.0 72.5 76.2 83.6 63.7 75.2Massachusetts 79.0 85.9 88.0 95.3 78.1 74.4 97.7Michigan 90.0 89.5 93.9 87.9 83.6 73.5 95.9Minnesota 85.7 93.1 93.9 93.5 84.7 79.2 98.5Mississippi 88.4 93.5 92.5 93.3 85.8 80.1 95.1
Missouri 93.8 92.9 92.9 93.6 86.5 81.0 96.6Montana 89.1 90.4 96.1 96.4 90.1 86.9 96.8Nebraska 92.4 95.4 94.2 91.3 89.9 82.1 95.6Nevada 82.4 84.9 88.8 97.2 80.9 78.6 95.8New Hampshire 73.8 91.1 93.5 94.4 85.3 80.5 96.1
New Jersey 78.5 80.1 83.8 98.0 80.8 79.2 88.5New Mexico 90.1 92.3 88.1 84.0 84.7 71.1 96.4New York 84.0 80.8 79.5 95.9 76.8 73.7 93.0North Carolina 85.2 94.6 85.3 87.7 83.3 73.1 92.7North Dakota 85.0 90.1 93.1 84.5 87.0 73.5 93.3
Ohio 84.0 94.3 96.3 91.9 86.6 79.6 97.6Oklahoma 89.5 87.9 92.0 93.3 86.2 80.4 98.5Oregon 89.3 88.8 90.5 89.6 86.9 77.8 97.2Pennsylvania 88.9 87.0 86.2 83.3 81.9 68.2 97.3Rhode Island 73.3 91.7 86.4 89.7 78.8 70.7 97.0
South Carolina 92.5 86.5 92.5 91.9 80.6 74.1 91.4South Dakota 92.3 91.9 93.2 95.6 85.3 81.5 97.7Tennessee 94.4 91.5 87.6 94.2 86.5 81.5 94.5Texas 90.4 89.1 93.9 95.5 84.1 80.3 96.1Utah 97.4 89.1 94.2 95.3 87.2 83.1 99.0
Vermont 68.9 89.0 92.6 87.5 82.0 71.8 100.0Virginia 90.8 84.3 87.3 91.2 85.2 77.7 95.0Washington 91.2 86.3 91.4 96.5 81.7 78.8 95.2West Virginia 85.7 92.1 91.7 91.4 84.2 77.0 96.3Wisconsin 90.3 88.0 89.4 94.1 84.6 79.6 94.6Wyoming 93.7 88.9 91.0 95.9 89.1 85.5 98.51 Weighted questionnaire response rate times the rate of cooperation with the teacher listing operation. NOTE: Weighted using inverse of the probability of selection. SOURCE: U.S. Department of Education, National Center for Education Statistics, Schools and Staffing Survey (SASS), “School District Survey,” “Public School Survey,” “Public School Principal Survey,” “Public Teacher Survey,” and “Public Library Media Center Survey,” 1999–2000, special tabulations from the response rate data files.
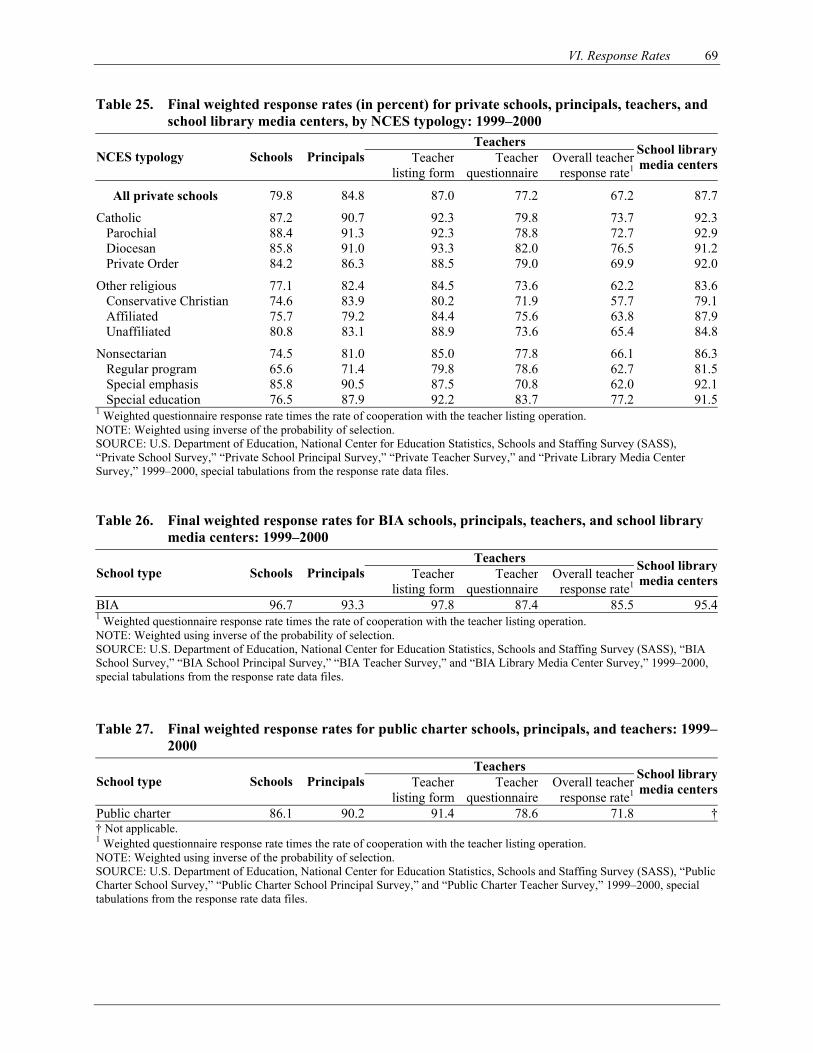
VI. Response Rates 69
Table 25. Final weighted response rates (in percent) for private schools, principals, teachers, and school library media centers, by NCES typology: 1999–2000
Teachers NCES typology Schools Principals Teacher
listing formTeacher
questionnaireOverall teacher
response rate1
School library media centers
All private schools 79.8 84.8 87.0 77.2 67.2 87.7
Catholic 87.2 90.7 92.3 79.8 73.7 92.3 Parochial 88.4 91.3 92.3 78.8 72.7 92.9 Diocesan 85.8 91.0 93.3 82.0 76.5 91.2 Private Order 84.2 86.3 88.5 79.0 69.9 92.0
Other religious 77.1 82.4 84.5 73.6 62.2 83.6 Conservative Christian 74.6 83.9 80.2 71.9 57.7 79.1 Affiliated 75.7 79.2 84.4 75.6 63.8 87.9 Unaffiliated 80.8 83.1 88.9 73.6 65.4 84.8
Nonsectarian 74.5 81.0 85.0 77.8 66.1 86.3 Regular program 65.6 71.4 79.8 78.6 62.7 81.5 Special emphasis 85.8 90.5 87.5 70.8 62.0 92.1 Special education 76.5 87.9 92.2 83.7 77.2 91.51 Weighted questionnaire response rate times the rate of cooperation with the teacher listing operation. NOTE: Weighted using inverse of the probability of selection. SOURCE: U.S. Department of Education, National Center for Education Statistics, Schools and Staffing Survey (SASS), “Private School Survey,” “Private School Principal Survey,” “Private Teacher Survey,” and “Private Library Media Center Survey,” 1999–2000, special tabulations from the response rate data files. Table 26. Final weighted response rates for BIA schools, principals, teachers, and school library
media centers: 1999–2000 Teachers
School type Schools Principals Teacher listing form
Teacher questionnaire
Overall teacher response rate1
School library media centers
BIA 96.7 93.3 97.8 87.4 85.5 95.41 Weighted questionnaire response rate times the rate of cooperation with the teacher listing operation. NOTE: Weighted using inverse of the probability of selection. SOURCE: U.S. Department of Education, National Center for Education Statistics, Schools and Staffing Survey (SASS), “BIA School Survey,” “BIA School Principal Survey,” “BIA Teacher Survey,” and “BIA Library Media Center Survey,” 1999–2000, special tabulations from the response rate data files. Table 27. Final weighted response rates for public charter schools, principals, and teachers: 1999–
2000 Teachers
School type Schools Principals Teacher listing form
Teacher questionnaire
Overall teacher response rate1
School library media centers
Public charter 86.1 90.2 91.4 78.6 71.8 †† Not applicable. 1 Weighted questionnaire response rate times the rate of cooperation with the teacher listing operation. NOTE: Weighted using inverse of the probability of selection. SOURCE: U.S. Department of Education, National Center for Education Statistics, Schools and Staffing Survey (SASS), “Public Charter School Survey,” “Public Charter School Principal Survey,” and “Public Charter Teacher Survey,” 1999–2000, special tabulations from the response rate data files.
70 1999–2000 SASS Data File User’s Manual
B. Nonresponse Bias Analysis A comprehensive nonresponse bias analysis (Bokossa, Salvucci, and Ghosh forthcoming) was conducted for each of the components of the 1999–2000 SASS. The analysis evaluated the extent of potential bias introduced by school district nonresponse, school nonresponse, school principal nonresponse, teacher nonresponse, and school library nonresponse at both the unit and item levels.
1. Unit-Level Nonresponse First, for each of the SASS components, unweighted and weighted response rates11 were
calculated for selected characteristics. For public school, public charter school, and BIA school related SASS surveys, the selected school characteristics were state, region, community type (i.e., central city, urban fringe/large town, and rural/small town), school instruction level (i.e., elementary, secondary, and combined), and student enrollment categories. For private school related SASS surveys, the selected school characteristics were region, affiliation, NCES typology, community type, school instruction level, and student enrollment categories. For school districts, the selected district characteristics were state, region, community type, and student enrollment categories.
The results from the first step were used to identify the set of characteristics in each of
the SASS components for which the response rates were relatively low (i.e., less than 75 percent). Then, in the second step, for the set of characteristics that did not attain at least a 75 percent response rate, weighted estimates12 of the percentage of districts, schools, principals, teachers, and libraries were calculated and then compared to the corresponding population value obtained from the CCD or PSS frames. For example, since public school response rates in Maryland fell below 75 percent, weighted estimates of the percent of public schools were calculated for community types, percent minority categories, student enrollment categories, and number of teachers categories. Significant differences (p<0.05) between the percent distribution of the SASS weighted estimates and the population distribution for the selected characteristics suggested a potential bias in the weighted estimates due to nonresponse. To continue the example from above, the percentage of public schools in two community type categories and three student enrollment categories were found to be significantly different when estimated from SASS versus when estimated from CCD.
Estimates calculated for selected characteristics of the district component included the
number of schools, the number of teachers, and the number of students in the district. For the school, principal, and library media center components, the percentage of minority students, the number of teachers, and the number of students in the school were calculated for use in the evaluation. For the teacher components, the number of teachers and the number of students were calculated for use in the evaluation.
When considering unit nonresponse, even at levels below 75 percent, there was no
evidence to point to a substantial bias in SASS estimates.
11 Base weights that did not include an adjustment for nonresponse were used to calculate the weighted response rate estimates. 12 Base weights that did not include an adjustment for nonresponse were used to calculate the weighted estimates.
VI. Response Rates 71
2. Item-Level Nonresponse
Unweighted response rates were calculated for all items in each of the SASS components. Items with unweighted response rates (calculated for the questionnaires returned) below 75 percent13 were examined to determine if they showed the potential for nonresponse bias. For each of these items, the weighted percent distribution of school characteristics for those that had responded to an item were compared to the percent distribution of the same school characteristics in the population, derived from either the SASS Teacher Listing Form file, CCD, or PSS. When the distribution of characteristics among the population differed significantly from the distribution of those characteristics among an item’s respondents, it suggested a potential for nonresponse bias. However, while this comparison could indicate the potential for bias, it could not indicate whether the bias was due only to item nonresponse, only to unit nonresponse, or to a combination of the two. Thus, an additional analysis was devised and applied to some of the items that were found to have a potential for bias to indicate when the source of the potential bias was due only to item nonresponse.
Using selected items from the public, private, and public charter school files, and from
the Indian school library file, the following estimates were calculated:
• estimate A, the weighted percentage of schools (using the base weight without a nonresponse adjustment) with a particular characteristic among unit respondents;
• estimate B, the weighted percentage of schools (using the base weight without a nonresponse adjustment) with a particular characteristic among item respondents; and
• population estimate, the percentage of schools with a particular characteristic in the population.
A potential for bias due to unit nonresponse was determined by testing to see if the difference between estimate A and the population estimate was significantly different. Similarly, a potential for bias due to item nonresponse was determined by testing to see if the difference between estimate B and the population estimate was significantly different. If both estimates A and B differed significantly from the population estimate, it was concluded that the potential bias may be jointly due to both unit- and item-level nonresponse. If estimate B differed significantly from the population estimate, but estimate A did not, it was concluded that the source of potential bias for that item was due only to item nonresponse.
Since the analysis above resulted in the conclusion that in most cases the bias effect of unit nonresponse and item nonresponse was confounded, the analysis was repeated, but this time the final weights adjusted for nonresponse were used. Using final weights at both the unit-level and the item-level should help to reduce the unit-level nonresponse bias. Thus, in those cases where the difference between estimate A and the population estimate was no longer significant, but the difference between estimate B and the population estimate was significant, it was concluded that the bias was largely due to the item-level nonresponse.
The results of these analyses for some of the items with response rates of less than 75
percent are available in section 4 of the SASS 1999–2000 Nonresponse Bias Analysis (Bokossa, Salvucci, and Ghosh forthcoming).
13 The large majority of items with response rates below 75 percent were from the school, teacher, and library media center questionnaires.
72 1999–2000 SASS Data File User’s Manual
C. Item Response Rates
The unweighted item response rates are the number of sample cases responding to an item divided by the number of sample cases eligible to answer the item, excluding the unit nonrespondents. That is, following NCES Standard 1-3-5: “Item response rates (RRI) are calculated as the ratio of the number of respondents for whom an in-scope response was obtained (Ix for item x) to the number of respondents who are asked to answer that item. The number asked to answer an item is the number of unit-level respondents (I) minus the number of respondents with a valid skip for item x (Vx)….
x
x
VIIRRI−
=
(Seastrom 2003, p. 23). For SASS, the unweighted item response rates ranged from 10 percent to 100 percent. Tables 28 and 29 provide a brief summary of the item response rates. The item response rates in these tables are unweighted, and do not reflect additional response loss due to respondents’ refusal to participate in the survey. (More detailed item response rate tables are provided in appendix C.) All items with a response rate below 75 percent were examined for bias. However, only four variables were deleted from the data file because of low response rates and questionable data. All four appeared on the Library Media Center Questionnaires (LS-1A, LS-1B, and LS-1C):
• M0158
Total number of current print or microform periodical subscriptions held at the end of the 1998–99 school year [22D (total) on LS-1A and LS-1B, 21D (total) on LS-1C]
• M0159
Number of current print or microform periodical subscriptions acquired during the 1998–99 school year [22D (acquired) on LS-1A and LS-1B, 21D (acquired) on LS-1C]
• M0161 Total number of electronic subscriptions held at the end of the 1998–99 school year [22E (total) on LS-1A and LS-1B, 21E (total) on LS-1C]
• M0162 Number of electronic subscriptions acquired during the 1998–99 school year [22E (acquired) on LS-1A and LS-1B, 21E (acquired) on LS-1C]
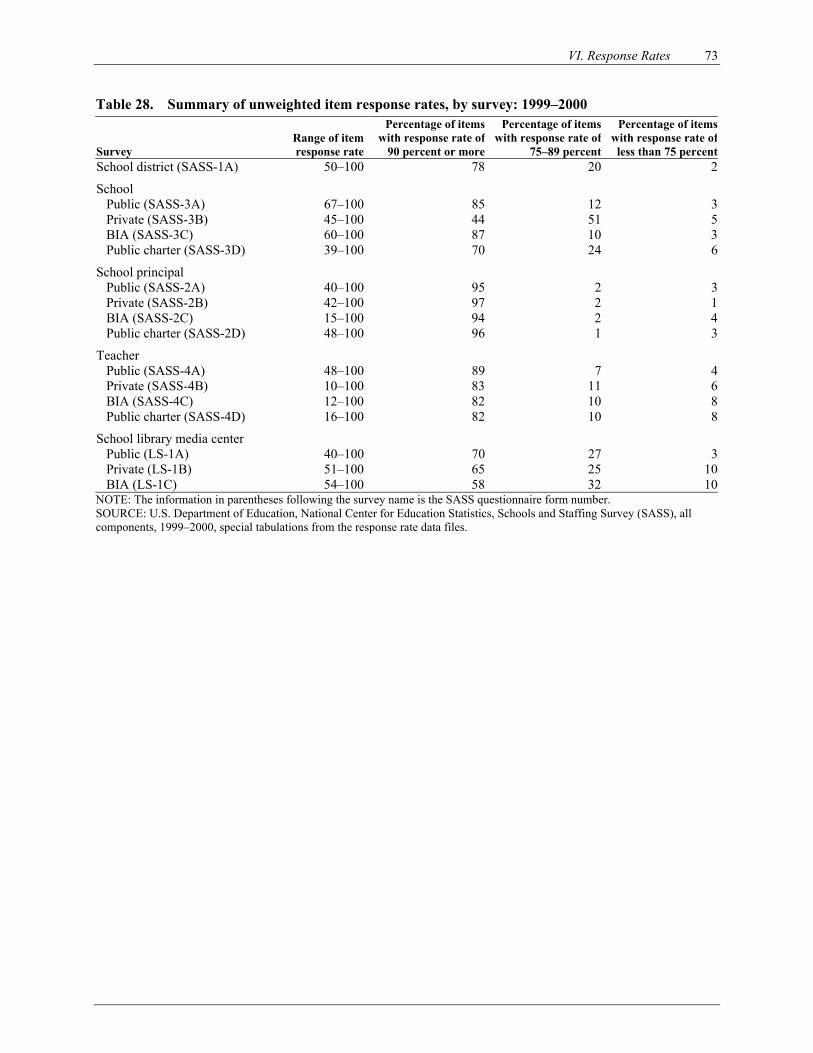
VI. Response Rates 73
Table 28. Summary of unweighted item response rates, by survey: 1999–2000
Survey Range of item response rate
Percentage of items with response rate of
90 percent or more
Percentage of items with response rate of
75–89 percent
Percentage of items with response rate of less than 75 percent
School district (SASS-1A) 50–100 78 20 2
School Public (SASS-3A) 67–100 85 12 3 Private (SASS-3B) 45–100 44 51 5 BIA (SASS-3C) 60–100 87 10 3 Public charter (SASS-3D) 39–100 70 24 6
School principal Public (SASS-2A) 40–100 95 2 3 Private (SASS-2B) 42–100 97 2 1 BIA (SASS-2C) 15–100 94 2 4 Public charter (SASS-2D) 48–100 96 1 3
Teacher Public (SASS-4A) 48–100 89 7 4 Private (SASS-4B) 10–100 83 11 6 BIA (SASS-4C) 12–100 82 10 8 Public charter (SASS-4D) 16–100 82 10 8
School library media center Public (LS-1A) 40–100 70 27 3 Private (LS-1B) 51–100 65 25 10 BIA (LS-1C) 54–100 58 32 10NOTE: The information in parentheses following the survey name is the SASS questionnaire form number. SOURCE: U.S. Department of Education, National Center for Education Statistics, Schools and Staffing Survey (SASS), all components, 1999–2000, special tabulations from the response rate data files.
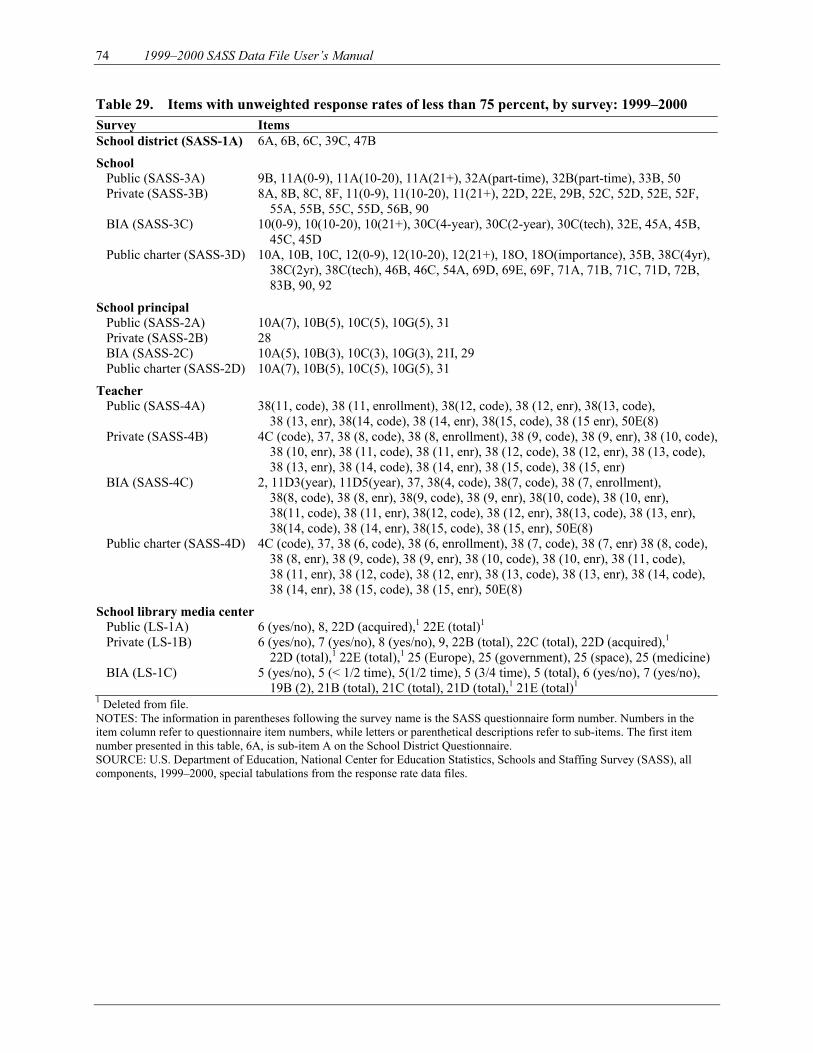
74 1999–2000 SASS Data File User’s Manual
Table 29. Items with unweighted response rates of less than 75 percent, by survey: 1999–2000 Survey Items School district (SASS-1A) 6A, 6B, 6C, 39C, 47B
School Public (SASS-3A) 9B, 11A(0-9), 11A(10-20), 11A(21+), 32A(part-time), 32B(part-time), 33B, 50 Private (SASS-3B) 8A, 8B, 8C, 8F, 11(0-9), 11(10-20), 11(21+), 22D, 22E, 29B, 52C, 52D, 52E, 52F,
55A, 55B, 55C, 55D, 56B, 90 BIA (SASS-3C) 10(0-9), 10(10-20), 10(21+), 30C(4-year), 30C(2-year), 30C(tech), 32E, 45A, 45B,
45C, 45D Public charter (SASS-3D) 10A, 10B, 10C, 12(0-9), 12(10-20), 12(21+), 18O, 18O(importance), 35B, 38C(4yr),
38C(2yr), 38C(tech), 46B, 46C, 54A, 69D, 69E, 69F, 71A, 71B, 71C, 71D, 72B, 83B, 90, 92
School principal Public (SASS-2A) 10A(7), 10B(5), 10C(5), 10G(5), 31 Private (SASS-2B) 28 BIA (SASS-2C) 10A(5), 10B(3), 10C(3), 10G(3), 21I, 29 Public charter (SASS-2D) 10A(7), 10B(5), 10C(5), 10G(5), 31
Teacher Public (SASS-4A) 38(11, code), 38 (11, enrollment), 38(12, code), 38 (12, enr), 38(13, code),
38 (13, enr), 38(14, code), 38 (14, enr), 38(15, code), 38 (15 enr), 50E(8) Private (SASS-4B) 4C (code), 37, 38 (8, code), 38 (8, enrollment), 38 (9, code), 38 (9, enr), 38 (10, code),
38 (10, enr), 38 (11, code), 38 (11, enr), 38 (12, code), 38 (12, enr), 38 (13, code), 38 (13, enr), 38 (14, code), 38 (14, enr), 38 (15, code), 38 (15, enr)
BIA (SASS-4C) 2, 11D3(year), 11D5(year), 37, 38(4, code), 38(7, code), 38 (7, enrollment), 38(8, code), 38 (8, enr), 38(9, code), 38 (9, enr), 38(10, code), 38 (10, enr), 38(11, code), 38 (11, enr), 38(12, code), 38 (12, enr), 38(13, code), 38 (13, enr), 38(14, code), 38 (14, enr), 38(15, code), 38 (15, enr), 50E(8)
Public charter (SASS-4D) 4C (code), 37, 38 (6, code), 38 (6, enrollment), 38 (7, code), 38 (7, enr) 38 (8, code), 38 (8, enr), 38 (9, code), 38 (9, enr), 38 (10, code), 38 (10, enr), 38 (11, code), 38 (11, enr), 38 (12, code), 38 (12, enr), 38 (13, code), 38 (13, enr), 38 (14, code), 38 (14, enr), 38 (15, code), 38 (15, enr), 50E(8)
School library media center Public (LS-1A) 6 (yes/no), 8, 22D (acquired),1 22E (total)1 Private (LS-1B) 6 (yes/no), 7 (yes/no), 8 (yes/no), 9, 22B (total), 22C (total), 22D (acquired),1
22D (total),1 22E (total),1 25 (Europe), 25 (government), 25 (space), 25 (medicine) BIA (LS-1C) 5 (yes/no), 5 (< 1/2 time), 5(1/2 time), 5 (3/4 time), 5 (total), 6 (yes/no), 7 (yes/no),
19B (2), 21B (total), 21C (total), 21D (total),1 21E (total)1 1 Deleted from file. NOTES: The information in parentheses following the survey name is the SASS questionnaire form number. Numbers in the item column refer to questionnaire item numbers, while letters or parenthetical descriptions refer to sub-items. The first item number presented in this table, 6A, is sub-item A on the School District Questionnaire. SOURCE: U.S. Department of Education, National Center for Education Statistics, Schools and Staffing Survey (SASS), all components, 1999–2000, special tabulations from the response rate data files.
75
VII. Data Processing A. Questionnaire Check-in
Paper questionnaires returned by individual respondents and those completed by field representatives during telephone follow-up were sent to the Census Bureau processing unit in Jeffersonville, Indiana. Upon receipt, clerks assigned codes to each questionnaire to indicate its status (e.g., complete interview, refusal, deceased—for teachers, and school no longer exists). Then the questionnaires were batched by type and by interview status (i.e., interviews, noninterviews, and out-of-scope for the survey) for data capture. B. Data Capture
In previous administrations of SASS, Census Bureau staff keyed the completed questionnaires. For the 1999–2000 SASS, imaging technology was used to capture the data. Imaging the forms was expected to be faster, less costly, and at least as accurate as keying.
The questionnaires were disassembled and each duplex page was scanned. Data images were extracted and a response file was created. The response file was processed through recognition software at a 99 percent confidence level. If the recognition software was 99 percent certain that the response field contained a valid mark or alpha numeric, the entry was copied to an output file. If the response fell outside the confidence level, the imaged response was presented to a keying operator to interpret and key from the image (KFI). After 100 percent verification of the KFI data entries, those data and the data initially accepted by the recognition software were merged to create the output file. C. Reformatting
After the SASS questionnaire data were captured, the output files from the different sources (imaging/keying, CATI,14 and CSAQ15) were reformatted into SAS16 datasets and then merged so that there was one file for each questionnaire type (SASS-1A, SASS-2A, etc.). For some variables on the CATI and CSAQ files, the values were recoded to be consistent with those from the paper questionnaires. D. Preliminary ISR Classification
The next step in processing was to make a preliminary determination of each case’s interview status (ISR); that is, whether it was an interview, a noninterview, or was out-of-scope for the survey. In general, those cases with “out-of-scope” check-in codes (assigned by clerks to the paper questionnaires when they were received by the Census Bureau) or “out-of-scope” final outcome codes (assigned by CATI interviewers) were classified as out-of-scope (ISR=3) for the preliminary ISR. Otherwise, cases with data entries were classified as interviews (ISR=1), and those with no data were classified as noninterviews (ISR=2).
14CATI is the acronym for computer-assisted telephone interviewing. For these cases, electronic data files were created as the data were collected. 15CSAQ is the acronym for computer self-administered questionnaire. This data collection instrument was Internet-based and was used only for the library component of SASS. Electronic files were created as the data were collected. 16 SAS is a statistical software package with a proprietary data format.

76 1999–2000 SASS Data File User’s Manual
E. Computer Pre-Edit Past SASS surveys have resulted in systematic discrepancies large enough to be seen at the state
level between the school enrollment and teacher counts reported in SASS and those from the CCD. These discrepancies often occur because schools will report data for the entire district rather than just their school or because school administrators define the school in a different way than the state report to CCD did. For example, a school with grades K–8 at one address might, in fact, be two different CCD schools—an elementary school with grades K–6 and a junior high school with grades 7 and 8. In the past, SASS counts were adjusted after processing to better agree with CCD estimates. For the 1999–2000 SASS, these discrepancies were addressed before processing. (Processing starts with the blanking and consistency edits described in section F.)
In order to resolve these discrepancies, Census conducted an extensive review and reconciliation
process. First, a series of computerized checks were run after the preliminary ISR was completed to identify individual responses that did not agree with CCD individual school data supplied by the state. The conditions for each check are documented in tables 30 and 31. To identify the cases, each of the conditions described in the table was programmed using the SAS language. The software then systematically went through the District and School data files and generated a listing of every case that met the specified condition. Census professional staff reviewed the computer record of cases that met each condition. During the review, questionnaire data were compared with CCD data. Some questionnaire entries were deemed to be more accurate than CCD data. Entries that were deemed to be less accurate than CCD data were corrected by using information reported in other questionnaire items, sample file data, or information from other sources (e.g., the most recent CCD file, the district’s website, or other education websites). The goal was to increase consistency with CCD. Wrong entries that could not be corrected were blanked and then imputed. The procedures described above are referred to as “pre-edits” because they took place before the regular SASS data editing and imputation. Tables 30 and 31 list the number and percentage of items rejected for each condition.
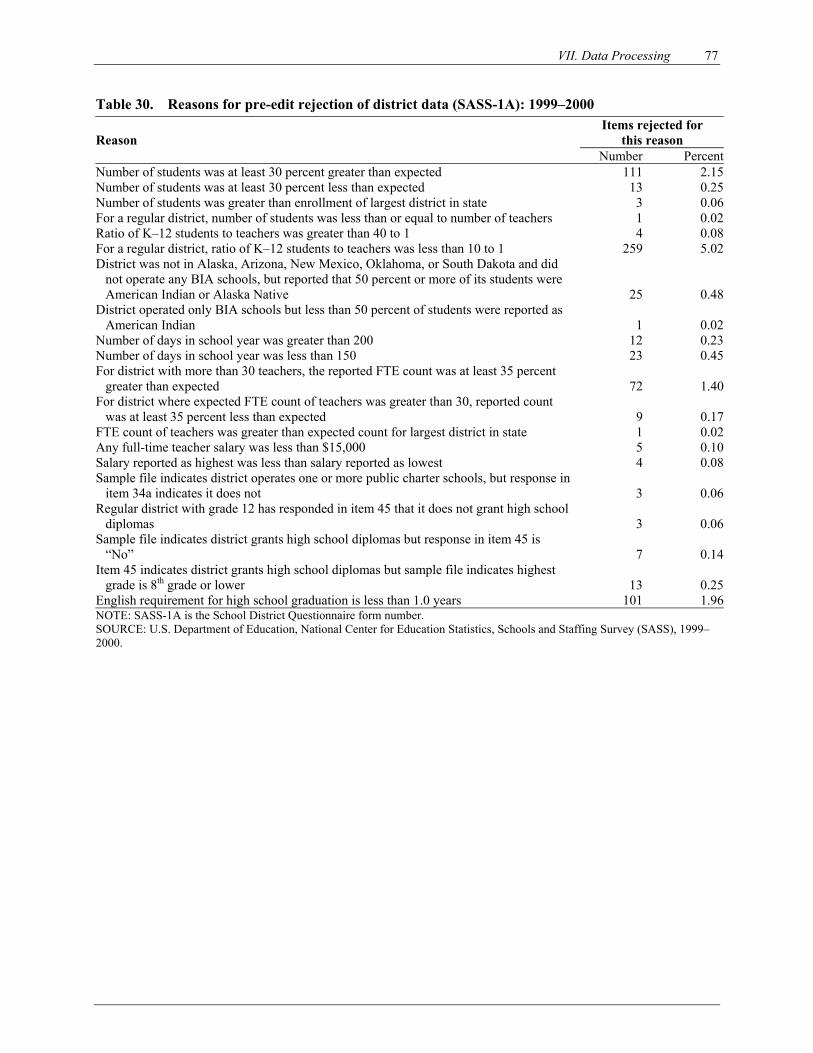
VII. Data Processing 77
Table 30. Reasons for pre-edit rejection of district data (SASS-1A): 1999–2000 Items rejected for
this reason Reason Number Percent
Number of students was at least 30 percent greater than expected 111 2.15Number of students was at least 30 percent less than expected 13 0.25Number of students was greater than enrollment of largest district in state 3 0.06For a regular district, number of students was less than or equal to number of teachers 1 0.02Ratio of K–12 students to teachers was greater than 40 to 1 4 0.08For a regular district, ratio of K–12 students to teachers was less than 10 to 1 259 5.02District was not in Alaska, Arizona, New Mexico, Oklahoma, or South Dakota and did
not operate any BIA schools, but reported that 50 percent or more of its students were American Indian or Alaska Native 25 0.48
District operated only BIA schools but less than 50 percent of students were reported as American Indian 1 0.02
Number of days in school year was greater than 200 12 0.23Number of days in school year was less than 150 23 0.45For district with more than 30 teachers, the reported FTE count was at least 35 percent
greater than expected 72 1.40For district where expected FTE count of teachers was greater than 30, reported count
was at least 35 percent less than expected 9 0.17FTE count of teachers was greater than expected count for largest district in state 1 0.02Any full-time teacher salary was less than $15,000 5 0.10Salary reported as highest was less than salary reported as lowest 4 0.08Sample file indicates district operates one or more public charter schools, but response in
item 34a indicates it does not 3 0.06Regular district with grade 12 has responded in item 45 that it does not grant high school
diplomas 3 0.06Sample file indicates district grants high school diplomas but response in item 45 is
“No” 7 0.14Item 45 indicates district grants high school diplomas but sample file indicates highest
grade is 8th grade or lower 13 0.25English requirement for high school graduation is less than 1.0 years 101 1.96NOTE: SASS-1A is the School District Questionnaire form number. SOURCE: U.S. Department of Education, National Center for Education Statistics, Schools and Staffing Survey (SASS), 1999–2000.

78 1999–2000 SASS Data File User’s Manual
Table 31. Reasons for pre-edit rejection of public school data (SASS-3A): 1999–2000 Items rejected for
this reason Reason Number Percent
Lowest grade was 2 or more grade levels lower than expected 1,219 12.94Highest grade was 2 or more grade levels higher than expected 919 9.76No grade levels were reported 22 0.23Grade levels were same as expected but enrollment was at least 30 percent greater than
expected 242 2.57Regular school where enrollment was at least 30 percent less than expected 956 10.15Enrollment was greater than 5,000 3 0.03Enrollment reported in item 7a was at least 20 percent greater than total number reported
in item 9 (students by race) 222 2.36Enrollment reported in item 7a was at least 20 percent less than total number reported in
item 9 (students by race) 59 0.63Regular school where ratio of students to teachers was less than 10 to 1 521 5.53Ratio of students to teachers was less than 1 to 1 13 0.14School that was not a vocational school and ratio of students to teachers was greater than
40 to 1 165 1.75Ratio of students to teachers was greater than 100 to 1 74 0.79Regular school where number of teachers was at least 35 percent greater than expected 1,585 16.83Regular school where number of teachers was at least 35 percent less than expected 776 8.24Number of full-time teachers was 0 or missing 105 1.11NOTE: SASS-3A is the Public School Questionnaire form number. SOURCE: U.S. Department of Education, National Center for Education Statistics, Schools and Staffing Survey (SASS), 1999–2000. Table 32. Summary of changes made to variables in the pre-edit, by survey: 1999–2000
Survey Number of variables where
changes were madeRange of number of
records affectedRange of percent of
records affectedSchool District (SASS-1A) 50 1–237 0.02–4.60Public School (SASS-3A) 257 1–530 0.01–5.63NOTE: The information in parentheses following the survey name is the SASS questionnaire form number. SOURCE: U.S. Department of Education, National Center for Education Statistics, Schools and Staffing Survey (SASS), 1999–2000. Note: Pre-edits were done when data from frame variables were available to compare to data collected through the questionnaire. The school district and public school files were the only SASS files that contained frame variables to make such comparisons possible. F. Computer Edit
After pre-edit corrections were made to the school district and public school files, all files were submitted to a computer edit. This edit consisted of a range check, a consistency edit, and a blanking edit. (Data changes were generally made during the consistency edit.)
The range check deleted entries that were outside the range of acceptable values.
The consistency edit identified inconsistent entries within each record and, whenever possible, corrected them; if they could not be corrected, the entries were deleted. These inconsistencies could have been:
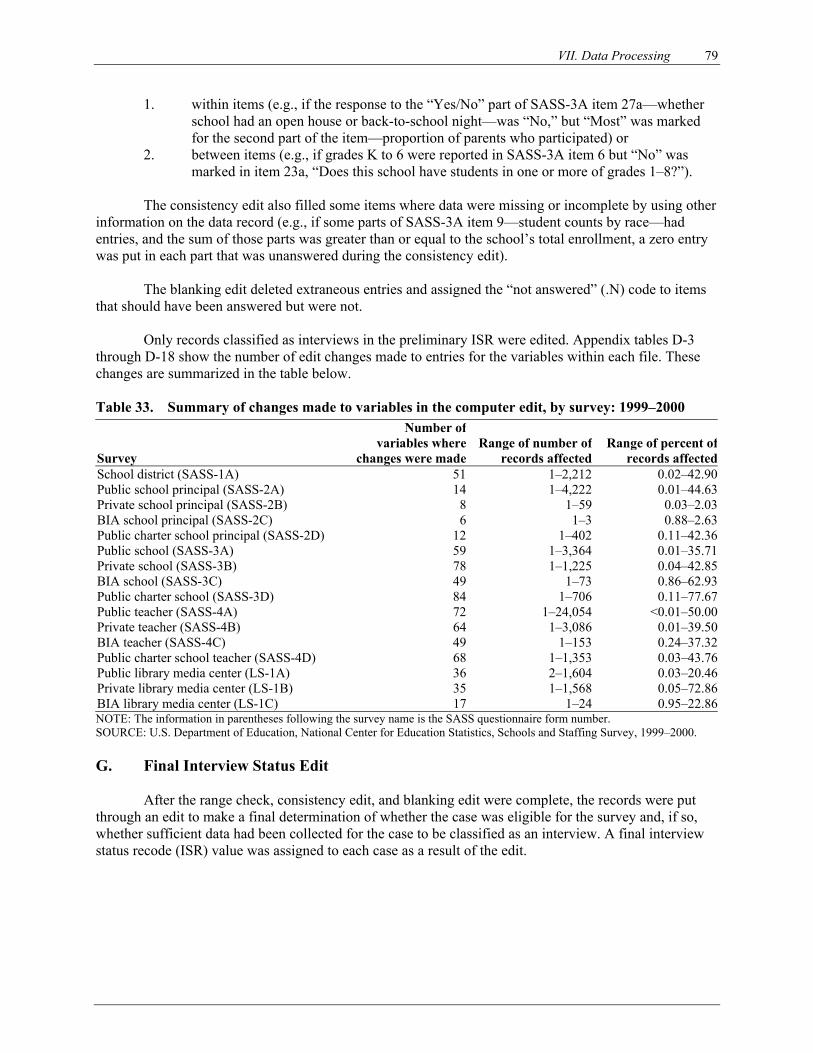
VII. Data Processing 79
1. within items (e.g., if the response to the “Yes/No” part of SASS-3A item 27a—whether school had an open house or back-to-school night—was “No,” but “Most” was marked for the second part of the item—proportion of parents who participated) or
2. between items (e.g., if grades K to 6 were reported in SASS-3A item 6 but “No” was marked in item 23a, “Does this school have students in one or more of grades 1–8?”).
The consistency edit also filled some items where data were missing or incomplete by using other
information on the data record (e.g., if some parts of SASS-3A item 9—student counts by race—had entries, and the sum of those parts was greater than or equal to the school’s total enrollment, a zero entry was put in each part that was unanswered during the consistency edit).
The blanking edit deleted extraneous entries and assigned the “not answered” (.N) code to items that should have been answered but were not.
Only records classified as interviews in the preliminary ISR were edited. Appendix tables D-3 through D-18 show the number of edit changes made to entries for the variables within each file. These changes are summarized in the table below. Table 33. Summary of changes made to variables in the computer edit, by survey: 1999–2000
Survey
Number ofvariables where
changes were madeRange of number of
records affectedRange of percent of
records affectedSchool district (SASS-1A) 51 1–2,212 0.02–42.90Public school principal (SASS-2A) 14 1–4,222 0.01–44.63Private school principal (SASS-2B) 8 1–59 0.03–2.03BIA school principal (SASS-2C) 6 1–3 0.88–2.63Public charter school principal (SASS-2D) 12 1–402 0.11–42.36Public school (SASS-3A) 59 1–3,364 0.01–35.71Private school (SASS-3B) 78 1–1,225 0.04–42.85BIA school (SASS-3C) 49 1–73 0.86–62.93Public charter school (SASS-3D) 84 1–706 0.11–77.67Public teacher (SASS-4A) 72 1–24,054 <0.01–50.00Private teacher (SASS-4B) 64 1–3,086 0.01–39.50BIA teacher (SASS-4C) 49 1–153 0.24–37.32Public charter school teacher (SASS-4D) 68 1–1,353 0.03–43.76Public library media center (LS-1A) 36 2–1,604 0.03–20.46Private library media center (LS-1B) 35 1–1,568 0.05–72.86BIA library media center (LS-1C) 17 1–24 0.95–22.86NOTE: The information in parentheses following the survey name is the SASS questionnaire form number. SOURCE: U.S. Department of Education, National Center for Education Statistics, Schools and Staffing Survey, 1999–2000. G. Final Interview Status Edit
After the range check, consistency edit, and blanking edit were complete, the records were put through an edit to make a final determination of whether the case was eligible for the survey and, if so, whether sufficient data had been collected for the case to be classified as an interview. A final interview status recode (ISR) value was assigned to each case as a result of the edit.

80 1999–2000 SASS Data File User’s Manual
1. School District Survey (SASS-1A)
A case was classified as out-of-scope (ISR=3) if:
• The district named on the questionnaire no longer existed; or • The district did not serve any students in grades 1–12 or comparable ungraded levels; or • The agency named on the questionnaire label was not a school district or other public
education agency that employed elementary and/or secondary teachers.
A case was classified as an interview (ISR=1) if:
• None of the conditions for out-of-scope cases was met; and • The number of K–12 students in the district was reported (D0457); and • The total number of FTE teachers was reported (D0476); and • There were values for at least 22 other variables (approximately 10 percent of remaining
items).
A case was classified as a noninterview (ISR=2) if the conditions for out-of-scope cases and interview cases were not met.
2. School Principal Surveys (SASS-2A, -2B, -2C, and -2D)
A case was classified as out-of-scope (ISR=3) if:
• The school named on the questionnaire label was classified as out-of-scope; or • The school had no principal, headmaster, or administrator.
A case was classified as an interview (ISR=1) if:
• Neither of the conditions for out-of-scope cases was met; and • The respondent had reported the highest degree he/she had earned (A0225); and • The respondent had reported the number of years he/she had been principal of the school
named on the questionnaire (A0054); and • There were valid entries in at least 6 of these items:
Years as principal at other schools (A0054) Years of teaching experience prior to becoming a principal (A0055) Years of teaching experience since becoming a principal (A0056) School positions held prior to becoming a principal (A0058-A0064) Annual salary (A0226) Gender (A0227) Race (A0228) Hispanic origin (A0230) Year of birth (A0231)
Cases were classified as noninterviews (ISR=2) if the conditions for out-of-scope cases
and interview cases were not met.
VII. Data Processing 81
3. Public School Survey (SASS-3A)
A case was classified as out-of-scope (ISR=3) if:
• The school named on the questionnaire was not in operation during the 1999–2000 school year; or
• The school did not serve students in any of grades 1–12 or comparable ungraded levels; or
• The institution named on the questionnaire was not a public school; or • The school had been converted to a public charter school.
A case was classified as an interview (ISR=1) if:
• None of the conditions for out-of-scope cases was met; and • The number of K–12 students was reported (S0092); • The number of teachers working at the school was reported (S0227 and/or S0228); and • There were values for at least 29 other items (approximately 10 percent of the remaining
questionnaire items).
A case was classified as a noninterview (ISR=2) if the conditions for out-of-scope cases and interview cases were not met.
4. Private School Survey (SASS-3B)
A case was classified as out-of-scope (ISR=3) if:
• The school named on the questionnaire was not in operation during the 1999–2000
school year; or • It did not serve students in any of grades 1–12 or comparable ungraded levels; or • The institution named on the questionnaire was not a private school.
A case was classified as an interview (ISR=1) if:
• None of the conditions for out-of-scope cases was met; and • The total number of students was reported (S0900); and • The total number of teachers was reported (S0963); and • At least 10 of these items (or groups of items) had valid entries:
Grades offered (S0058, S0060, ...S0090) Enrollment by grade level (S0059, S0061, ...S0091) Whether school was coeducational (S0901) Enrollment by race (S0096–S0101) Length of school day (S0102) Days in school year (S0470) Average daily attendance (S0107) Length of school day for kindergartners (S0903) Type of school (S0110) Whether school was located in a private home (S0906) Whether school has religious orientation (S0907) Association membership (S0911–S0952) Number of full-time teachers (S0228) Number of part-time teachers (S0959–S0962)
82 1999–2000 SASS Data File User’s Manual
Teachers by race (S0249–S0253) Number of teachers absent on most recent school day (S0255) Whether school grants high school diplomas (S0574) or whether school had 12th
grades in 1998–1999 school year (S0161) Whether school had any boarding students (S0965) Whether school charged tuition (S0968) Requirements for admission (S0116–S0123) Programs offered (S0125–S0131) Teacher hiring criteria (S0477–S0486) Whether school had teaching vacancies (S0256) Number of newly hired teachers (S0487) Whether school had teacher salary schedule or lowest teacher’s salary or highest
teacher’s salary (S0500, S0507, S0508) Benefit rate for teachers (S0509) Teachers’ benefits (S0517–S0523) Pay incentives for fields of shortage (S0615) Other pay incentives (S0611–S0613) Training for aspiring principals (S0587) Free teacher training for fields of shortage (S0628) School staffing (S0205–S0226, S0229–S0248) Violence prevention program (S0203) Whether any students were eligible for federal lunch program (S0282) Whether any students received Title I services (S0288) Number of IEP students (S0315) Whether school had LEP students (S0320) Whether school had LEP instruction (S0329)
A case was classified as a noninterview (ISR=2) if the conditions for out-of-scope cases
and interview cases were not met.
5. BIA School Survey (SASS-3C)
A case was classified as out-of-scope (ISR=3) if:
• The school named on the questionnaire was not in operation during the 1999–2000 school year; or
• The school did not serve students in any of grades 1–12 or comparable ungraded levels; or
• The institution named on the questionnaire was not a school funded by BIA; or • The school had been converted to a public charter school.
A case was classified as an interview (ISR=1) if:
• None of the conditions for out-of-scope cases was met; and • The number of K–12 students was reported (S0092); and • The number of teachers working at the school was reported (S0227 and/or S0228); and • There were values for at least 28 other items (approximately 10 percent of the remaining
items). A case was classified as a noninterview (ISR=2) if the conditions for out-of-scope cases
and interview cases were not met.
VII. Data Processing 83
6. Public Charter School Survey (SASS-3D)
A case was classified as out-of-scope (ISR=3) if:
• The school named on the questionnaire was not in operation during the 1999–2000 school year; or
• The school did not serve students in any of grades 1–12 or comparable ungraded levels; or
• The institution named on the questionnaire was not a public charter school. A case was classified as an interview (ISR=1) if:
• None of the conditions for out-of-scope cases was met; and • The number of K–12 students was reported (S0092); and • The number of teachers working at the school was reported (S0227 and/or S0228); and • There were valid entries in at least four of these items (or groups of items):
Grade levels offered (S0058–S0090) Students counts by race (S0096–S0100) Who granted school’s charter (S0756) Whether school was a pre-existing public or private school (S0757) Type of school (S0110) Number of home-schooled students enrolled in school (S0791) Whether school was for at-risk students (S0111) Year school began operating as a charter school (S0759) Waiver for teacher certification requirement (S0760 or S0761) Waiver for staff hiring or firing policies (S0762 or S0763)) Waiver for teacher salaries (S0768 or S0769) Waiver for curriculum requirements (S0770 or S0771) Waiver for student assessment criteria (S0774 or S0775) Waiver for length of school day or year (S0776 or S0777) Waiver for control of finances (S0778 or S0779) Waiver for performance rewards and sanctions (S0786 or S0787) Whether school is operated by an organization or company (S0795) District that operates school (S0796 or S5797) Admission requirements (S0115–S0122) Whether school had written contract with parents (S0176, S0177) or parents were
involved in governance (S0182, S0183) or parents were required to volunteer at school (S0794)
• At least five of the these items (or groups of items) had valid entries: Programs offered (S0125–S0131) or services offered (S0132–S0134) or violence
prevention program (S0203) Federal lunch program (S0282 or S0284 or S0287) or Title I (S0288, S0289) or IEP
students (S0315) or LEP students (S0320, s0321) or LEP instruction (S0329) Teacher hiring criteria (S0477–S0486) Number of newly hired teachers (s0487) Length of school day (S0102) or days in school year (S0470) or average daily
attendance (S0107) School staff (S0205–S0208, S0211–S0248) Teacher counts by race (S0249–S0253) Number of teachers absent on most recent school day (S0255)
84 1999–2000 SASS Data File User’s Manual
Whether school grants high school diplomas (S0574) or school had 12th graders in 1998–1999 (S0161)
Lowest and highest teacher salaries (S0507, S0508) or teacher benefit rate (S0509) or teacher benefits (S0517–S0522)
Teacher pay incentives (S0611–S0613, S0615) Free teacher training for fields of shortage (S0628) When school’s charter was granted (S0754–S0755) Magnet program (S0112–S0114) Performance reports (S0793) State rewards or sanctions (S0540, S0541) Parent participation (S0168–S0175, S0178–S0181, S0184–S0185) Facilitation of parent participation (S0186–S0193) Procedures for teacher dismissal (S0492–S0494) Agreement with teachers’ union (S0497) School capacity (S0108, S0109) Extended school calendar (S0150, S0151) Block scheduling (S0146) Month in teacher contract year (S0499)
A case was classified as a noninterview (ISR=2) if the conditions for out-of-scope cases
and interview cases were not met.
7. Teacher Surveys (SASS-4A, -4B, -4C, and -4D)
A case was classified as out-of-scope (ISR=3) if:
• The school where the teacher was selected for sample was classified as out-of-scope; or • The teacher no longer worked at the school named on the questionnaire (e.g., he/she
transferred to another school, retired, left teaching, or was deceased); or • The person named on the questionnaire label had never worked at the school named on
the label; or • The person named on the questionnaire worked at the school but did not teach any classes
(e.g., he/she was an assistant principal, counselor, or librarian); or • The person named on the label was a short-term substitute teacher, student teacher, or
teacher’s aide.
A case was classified as an interview (ISR=1) if:
• None of the conditions for out-of-scope cases was met; and • The respondent reported the year that he/she began teaching in the school where he/she
was selected for the survey sample (T0064); and • The respondent reported whether he/she had a college degree (T0070 or T0080 or T0083
or T0084 or T0087 or T0090 or T0093 or T0096 or T0099); and • The respondent reported his/her main teaching assignment field (T0102); and • The respondent reported whether or not he/she had a state teaching certificate in his/her
main assignment field (T0103); and • At least one grade level of students taught by the respondent was reported (T0191-
T0205); and • There were values for at least 31 other items (approximately 10 percent of the remaining
items).
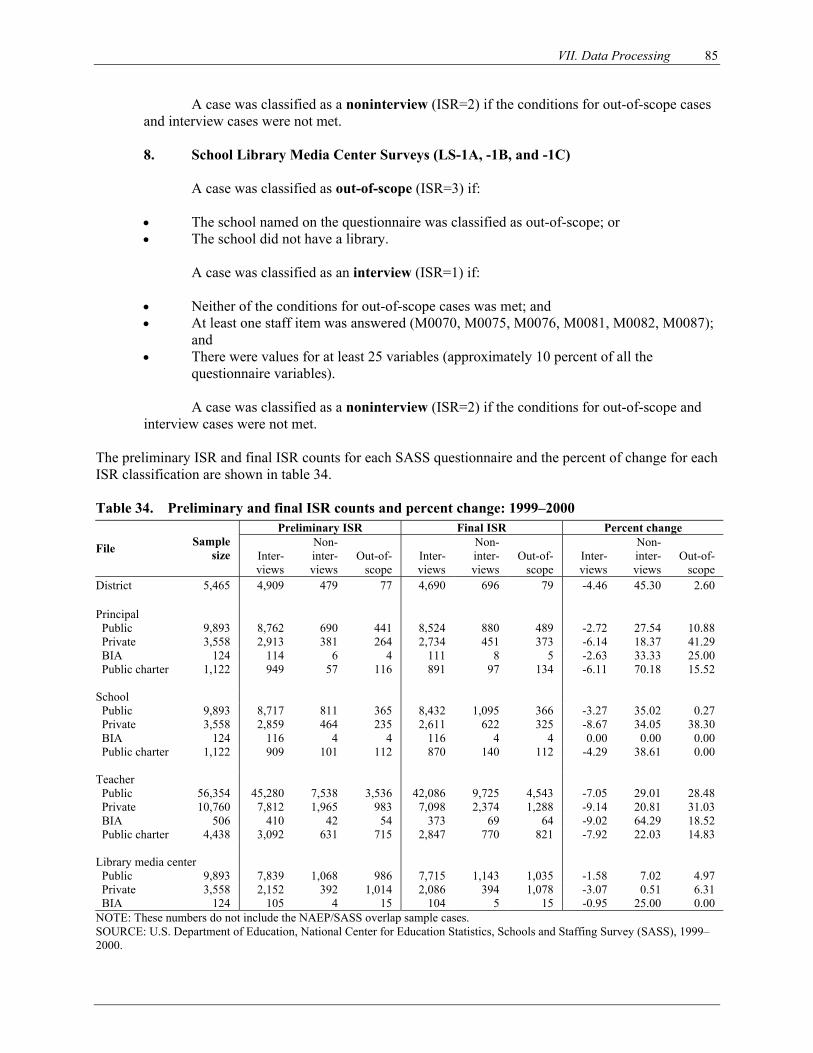
VII. Data Processing 85
A case was classified as a noninterview (ISR=2) if the conditions for out-of-scope cases and interview cases were not met.
8. School Library Media Center Surveys (LS-1A, -1B, and -1C)
A case was classified as out-of-scope (ISR=3) if:
• The school named on the questionnaire was classified as out-of-scope; or • The school did not have a library.
A case was classified as an interview (ISR=1) if:
• Neither of the conditions for out-of-scope cases was met; and • At least one staff item was answered (M0070, M0075, M0076, M0081, M0082, M0087);
and • There were values for at least 25 variables (approximately 10 percent of all the
questionnaire variables).
A case was classified as a noninterview (ISR=2) if the conditions for out-of-scope and interview cases were not met.
The preliminary ISR and final ISR counts for each SASS questionnaire and the percent of change for each ISR classification are shown in table 34. Table 34. Preliminary and final ISR counts and percent change: 1999–2000
Preliminary ISR Final ISR Percent change
File Sample size Inter-
views
Non-inter-views
Out-of-scope
Inter-views
Non-inter-views
Out-of-scope
Inter-views
Non-inter-views
Out-of-scope
District
5,465 4,909 479 77 4,690 696 79 -4.46 45.30 2.60
Principal Public 9,893 8,762 690 441 8,524 880 489 -2.72 27.54 10.88 Private 3,558 2,913 381 264 2,734 451 373 -6.14 18.37 41.29 BIA 124 114 6 4 111 8 5 -2.63 33.33 25.00 Public charter 1,122 949 57 116 891 97 134 -6.11 70.18 15.52 School Public 9,893 8,717 811 365 8,432 1,095 366 -3.27 35.02 0.27 Private 3,558 2,859 464 235 2,611 622 325 -8.67 34.05 38.30 BIA 124 116 4 4 116 4 4 0.00 0.00 0.00 Public charter 1,122 909 101 112 870 140 112 -4.29 38.61 0.00 Teacher Public 56,354 45,280 7,538 3,536 42,086 9,725 4,543 -7.05 29.01 28.48 Private 10,760 7,812 1,965 983 7,098 2,374 1,288 -9.14 20.81 31.03 BIA 506 410 42 54 373 69 64 -9.02 64.29 18.52 Public charter 4,438 3,092 631 715 2,847 770 821 -7.92 22.03 14.83 Library media center Public 9,893 7,839 1,068 986 7,715 1,143 1,035 -1.58 7.02 4.97 Private 3,558 2,152 392 1,014 2,086 394 1,078 -3.07 0.51 6.31 BIA 124 105 4 15 104 5 15 -0.95 25.00 0.00 NOTE: These numbers do not include the NAEP/SASS overlap sample cases. SOURCE: U.S. Department of Education, National Center for Education Statistics, Schools and Staffing Survey (SASS), 1999–2000.
86 1999–2000 SASS Data File User’s Manual
H. Imputation
After the final ISR edit, there were many variables with missing values on the files. Values were created for these variables in the next step of the processing, which is described in chapter VIII, Imputation Procedures.
87
VIII. Imputation Procedures
After the edits and final ISR (interview status recode) processing were completed for each file, there were missing values within some records classified as interviews (ISR=1). These were cases where the respondent had not answered some applicable questionnaire items and data for those items were not added in the consistency edit. After the edits, values were imputed to items with missing data within interview records in three processing stages, which are described below. For a detailed discussion of the imputation procedures employed for individual questionnaires, see appendix E. (For records where the respondent did not provide enough data for the case to be classified as an interview, noninterview adjustment factors were used during the weighting process to compensate for the missing data.)
A. Imputation Stages
1. Stage 1
In the first stage of imputation, the following sources were used to create entries for items with missing values:
• Other items on the same questionnaire; • Data from a related SASS questionnaire (for example, using data from a school record to
impute missing values on the questionnaire for the school’s principal); • Data from the sample file (for example, using data from the 1997–98 Private School
Universe Survey (PSS) to impute values for a SASS sample private school); and • Data from other surveys (for public charter schools only).
More information about first stage imputation is provided in the detailed discussions of
imputation procedures for each SASS questionnaire in later sections of this chapter.
2. Stage 2 In the second stage of imputation, values were created by extracting data from the record
for a sample case with similar characteristics, known as the “sequential nearest neighbor hot deck” procedure for imputing for item nonresponse (Kalton and Kasprzyk 1982, 1986; Kalton 1983; Little and Rubin 1987; Madow, Olkin, and Rubin 1983).
In order to match records with missing values to similar cases with good values (donors),
“imputation” variables were created at the end of the stage 1 imputation. These variables identified certain characteristics that were deemed to be relevant to the data collected by each questionnaire. For example, for the public school questionnaire (SASS-3A), variables that indicated the school’s instructional level (elementary, secondary, combined, ungraded), the type of school (regular, special education, vocational, alternative, school with a special program emphasis), the percent of minority students (less than 5.5 percent, 5.5–20.4 percent, 20.5–50.4 percent, more than 50.4 percent), and the type of community where the school was located (urban, suburban, small town, rural) were created for each school at the end of stage 1. For cases where the information had not been provided by the questionnaire respondent, data from the school’s sample file record were used to create the variable.
After creation of the imputation variables, the records in each SASS file were sorted so
that similar records were near each other. For these record sorts, some of the imputation variables were used along with other questionnaire data (e.g., school’s actual enrollment) and some
88 1999–2000 SASS Data File User’s Manual
geographic data (e.g., state where school was located for public schools). For example, before stage 2 imputation for school district questionnaire items 5a, 7, 8, 11, 12, 17, 18, 20, 21, 25, and 26, the district records were sorted by GROUP / STATE / LEVEL / URB / D0457; that is, the records were sorted by the districts’ K–12 enrollment (variable D0457), within each urbanicity category (urban, suburban, small town, rural), within each instructional level (elementary, secondary, combined or ungraded), within each state where the districts were located, within each group of states with similar sized districts.
In addition to sorting the data records, the imputation variables were also used to match
records with missing values to those where data had been provided (donors). The variables used for these matches varied according to the content of the questionnaire item with the missing value. For example, for item 14 (whether school was for at-risk students) on the public school questionnaire, the variables used to match records with missing values to donor records were (1) type of school (regular, special education, alternative, etc.), (2) instructional level (elementary, secondary, combined, ungraded), and (3) urbanicity (urban, suburban, small town, rural). For item 33 (teachers by race) on the SASS-3A, the matching variables were urbanicity and percent of minority students (less than 5.5 percent, 5.5–20.4 percent, etc).
The procedures described above were done by computer processing. However, for the
Indian School Questionnaire (SASS-3C), the Indian School Principal Questionnaire (SASS-2C), and the Indian School Library Media Center Questionnaire (LS-1C), the “sequential nearest neighbor hot deck” imputation procedure was not used because there were so few cases. Instead, values were clerically imputed to items with missing values. The data record, sample file record, and other sources were reviewed, and a value consistent with the information from those sources was imputed.
3. Stage 3
After the second stage of imputation was completed for each file, there were records that
still had missing values for some items. These were cases where (1) the stage 2 imputation failed to create a value because there was no suitable record to use as a donor, (2) the value imputed in stage 2 was deleted in the post-imputation edits because it was outside the acceptable range for the item or was inconsistent with other data on the same record, or (3) the item was not part of the stage 2 imputation because there were very few cases where it was unanswered (usually fewer than 10).
For these cases, values were clerically imputed to the items with missing values. That is,
staff reviewed the data record, sample file record, and other sources, and identified a value consistent with the information from those sources for imputation.
B. Creation of Imputed Values
For some incomplete items, the entry from another part of the questionnaire, the sample file,
another survey, or the data record for a similar sample case was directly imputed to complete the item; for others, the entry was used as part of an adjustment factor with other data on the incomplete record. For example, if a respondent did not report whether a school had any students identified as limited English proficient (LEP) in item 43a of the public school questionnaire, the response (Yes or No) for a similar school was imputed to item 43a of the incomplete record. However, if a respondent had answered “Yes” to item 43a but did not report the number of LEP students, the ratio of the number of LEP students to the total enrollment for a similar school was used with the enrollment at the school for which item 43b was
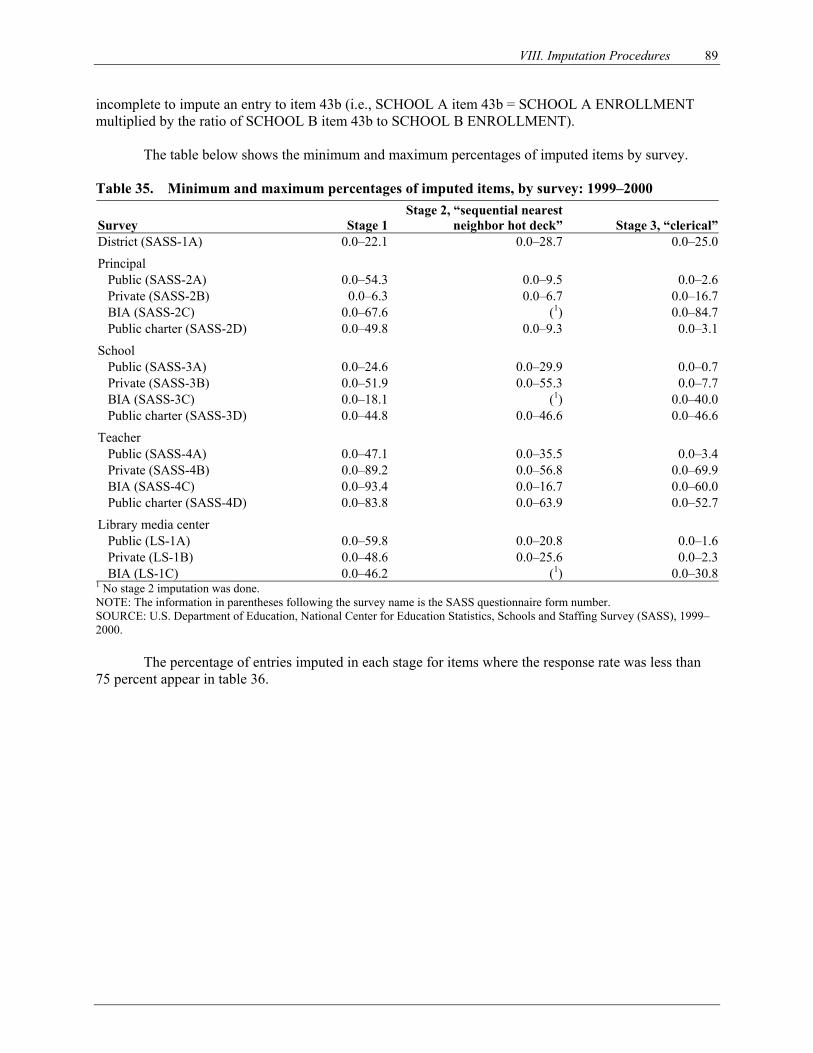
VIII. Imputation Procedures 89
incomplete to impute an entry to item 43b (i.e., SCHOOL A item 43b = SCHOOL A ENROLLMENT multiplied by the ratio of SCHOOL B item 43b to SCHOOL B ENROLLMENT).
The table below shows the minimum and maximum percentages of imputed items by survey.
Table 35. Minimum and maximum percentages of imputed items, by survey: 1999–2000
Survey Stage 1Stage 2, “sequential nearest
neighbor hot deck” Stage 3, “clerical” District (SASS-1A) 0.0–22.1 0.0–28.7 0.0–25.0
Principal Public (SASS-2A) 0.0–54.3 0.0–9.5 0.0–2.6 Private (SASS-2B) 0.0–6.3 0.0–6.7 0.0–16.7 BIA (SASS-2C) 0.0–67.6 (1) 0.0–84.7 Public charter (SASS-2D) 0.0–49.8 0.0–9.3 0.0–3.1
School Public (SASS-3A) 0.0–24.6 0.0–29.9 0.0–0.7 Private (SASS-3B) 0.0–51.9 0.0–55.3 0.0–7.7 BIA (SASS-3C) 0.0–18.1 (1) 0.0–40.0 Public charter (SASS-3D) 0.0–44.8 0.0–46.6 0.0–46.6
Teacher Public (SASS-4A) 0.0–47.1 0.0–35.5 0.0–3.4 Private (SASS-4B) 0.0–89.2 0.0–56.8 0.0–69.9 BIA (SASS-4C) 0.0–93.4 0.0–16.7 0.0–60.0 Public charter (SASS-4D) 0.0–83.8 0.0–63.9 0.0–52.7
Library media center Public (LS-1A) 0.0–59.8 0.0–20.8 0.0–1.6 Private (LS-1B) 0.0–48.6 0.0–25.6 0.0–2.3 BIA (LS-1C) 0.0–46.2 (1) 0.0–30.81 No stage 2 imputation was done. NOTE: The information in parentheses following the survey name is the SASS questionnaire form number. SOURCE: U.S. Department of Education, National Center for Education Statistics, Schools and Staffing Survey (SASS), 1999–2000.
The percentage of entries imputed in each stage for items where the response rate was less than 75 percent appear in table 36.
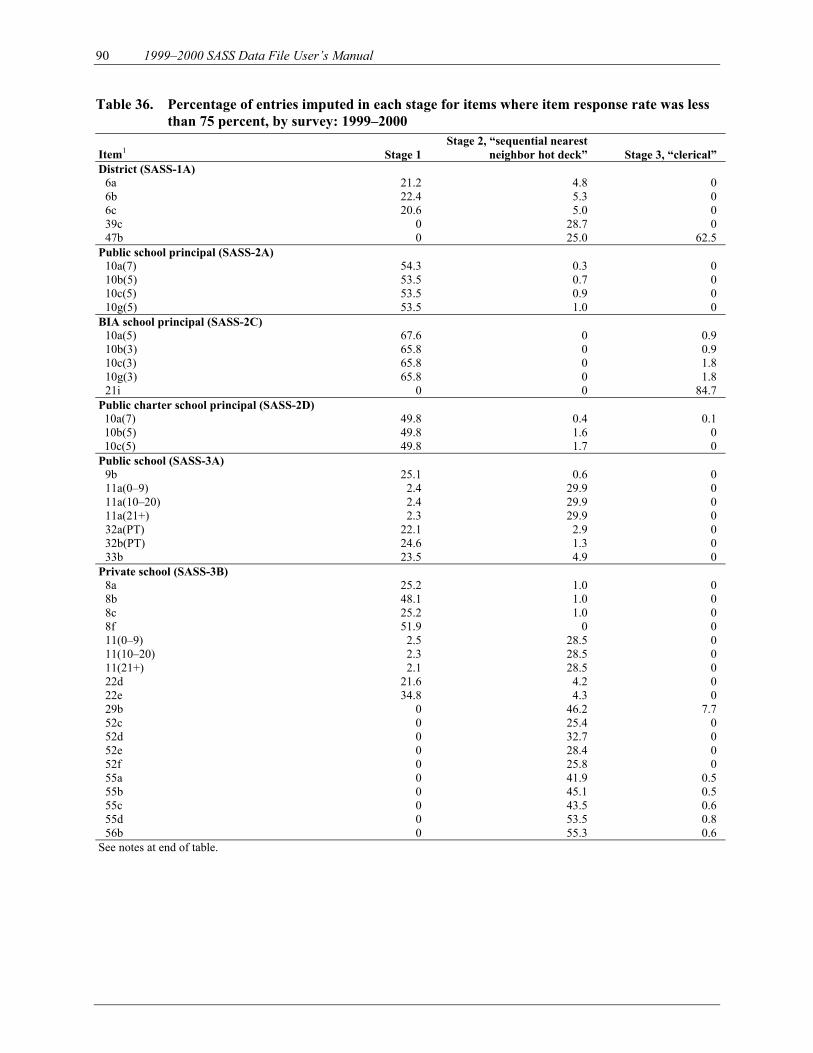
90 1999–2000 SASS Data File User’s Manual
Table 36. Percentage of entries imputed in each stage for items where item response rate was less than 75 percent, by survey: 1999–2000
Item1 Stage 1 Stage 2, “sequential nearest
neighbor hot deck” Stage 3, “clerical” District (SASS-1A)
6a 6b 6c 39c 47b
21.2 22.4 20.6
0 0
4.8 5.3 5.0
28.7 25.0
0 0 0 0
62.5 Public school principal (SASS-2A)
10a(7) 10b(5) 10c(5) 10g(5)
54.3 53.5 53.5 53.5
0.3 0.7 0.9 1.0
0 0 0 0
BIA school principal (SASS-2C) 10a(5) 10b(3) 10c(3) 10g(3) 21i
67.6 65.8 65.8 65.8
0
0 0 0 0 0
0.9 0.9 1.8 1.8
84.7 Public charter school principal (SASS-2D)
10a(7) 10b(5) 10c(5)
49.8 49.8 49.8
0.4 1.6 1.7
0.1
0 0
Public school (SASS-3A) 9b 11a(0–9) 11a(10–20) 11a(21+) 32a(PT) 32b(PT) 33b
25.1 2.4 2.4 2.3
22.1 24.6 23.5
0.6
29.9 29.9 29.9 2.9 1.3 4.9
0 0 0 0 0 0 0
Private school (SASS-3B) 8a 8b 8c 8f 11(0–9) 11(10–20) 11(21+) 22d 22e 29b 52c 52d 52e 52f 55a 55b 55c 55d 56b
25.2 48.1 25.2 51.9 2.5 2.3 2.1
21.6 34.8
0 0 0 0 0 0 0 0 0 0
1.0 1.0 1.0
0 28.5 28.5 28.5 4.2 4.3
46.2 25.4 32.7 28.4 25.8 41.9 45.1 43.5 53.5 55.3
0 0 0 0 0 0 0 0 0
7.7 0 0 0 0
0.5 0.5 0.6 0.8 0.6
See notes at end of table.
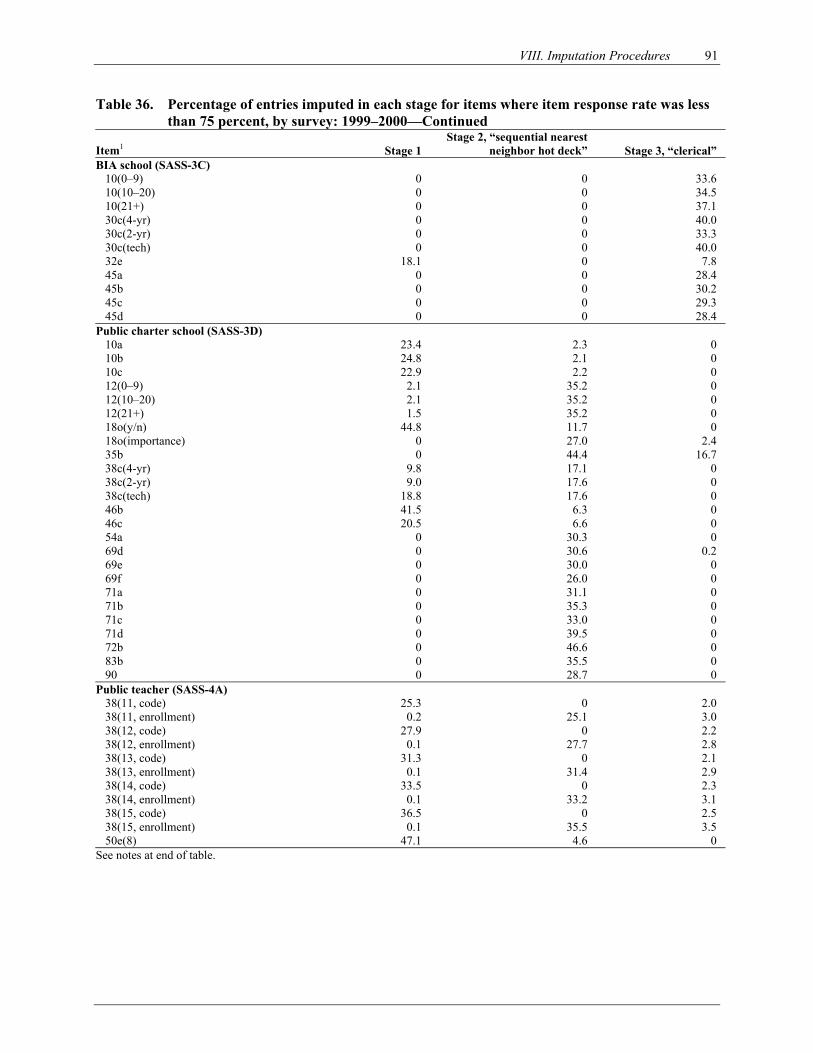
VIII. Imputation Procedures 91
Table 36. Percentage of entries imputed in each stage for items where item response rate was less than 75 percent, by survey: 1999–2000—Continued
Item1 Stage 1 Stage 2, “sequential nearest
neighbor hot deck” Stage 3, “clerical” BIA school (SASS-3C)
10(0–9) 10(10–20) 10(21+) 30c(4-yr) 30c(2-yr) 30c(tech) 32e 45a 45b 45c 45d
0 0 0 0 0 0
18.1 0 0 0 0
0 0 0 0 0 0 0 0 0 0 0
33.6 34.5 37.1 40.0 33.3 40.0 7.8
28.4 30.2 29.3 28.4
Public charter school (SASS-3D) 10a 10b 10c 12(0–9) 12(10–20) 12(21+) 18o(y/n) 18o(importance) 35b 38c(4-yr) 38c(2-yr) 38c(tech) 46b 46c 54a 69d 69e 69f 71a 71b 71c 71d 72b 83b 90
23.4 24.8 22.9 2.1 2.1 1.5
44.8 0 0
9.8 9.0
18.8 41.5 20.5
0 0 0 0 0 0 0 0 0 0 0
2.3 2.1 2.2
35.2 35.2 35.2 11.7 27.0 44.4 17.1 17.6 17.6 6.3 6.6
30.3 30.6 30.0 26.0 31.1 35.3 33.0 39.5 46.6 35.5 28.7
0 0 0 0 0 0 0
2.4 16.7
0 0 0 0 0 0
0.2 0 0 0 0 0 0 0 0 0
Public teacher (SASS-4A) 38(11, code) 38(11, enrollment) 38(12, code) 38(12, enrollment) 38(13, code) 38(13, enrollment) 38(14, code) 38(14, enrollment) 38(15, code) 38(15, enrollment) 50e(8)
25.3 0.2
27.9 0.1
31.3 0.1
33.5 0.1
36.5 0.1
47.1
0
25.1 0
27.7 0
31.4 0
33.2 0
35.5 4.6
2.0 3.0 2.2 2.8 2.1 2.9 2.3 3.1 2.5 3.5
0 See notes at end of table.

92 1999–2000 SASS Data File User’s Manual
Table 36. Percentage of entries imputed in each stage for items where item response rate was less than 75 percent, by survey: 1999–2000—Continued
Item1 Stage 1 Stage 2, “sequential nearest
neighbor hot deck” Stage 3, “clerical” Private teacher (SASS-4B)
4c 37 38(8, code) 38(8, enrollment) 38(9, code) 38(9, enrollment) 38(10, code) 38(10, enrollment) 38(11, code) 38(11, enrollment) 38(12, code) 38(12, enrollment) 38(13, code) 38(13, enrollment) 38(14, code) 38(14, enrollment) 38(15, code) 38(15, enrollment)
0
89.2 27.9 0.3
32.8 0.2
38.5 0
43.3 0
47.4 0
51.6 0
55.6 0
58.2 0
6.9
0 0
28.9 0
32.8 0
38.9 0
43.3 0
47.1 0
51.4 0
54.0 0
56.8
69.9 0.7 1.8 1.6 1.9 1.7 1.4 1.4 1.4 1.4 1.3 1.0 1.2 1.2 1.3 1.3 1.4 1.4
BIA teacher (SASS-4C) 2 11(2nd masters, year) 11(CAG, year) 37 38(7, code) 38(7, enrollment) 38(8, code) 38(8, enrollment) 38(9, code) 38(9, enrollment) 38(10, code) 38(10, enrollment) 38(11, code) 38(11, enrollment) 38(12, code) 38(12, enrollment) 38(13, code) 38(13, enrollment) 38(14, code) 38(14, enrollment) 38(15, code) 38(15, enrollment) 50e(8)
0
44.4 33.3 93.4 14.8
0 16.7
0 0 0 0 0 0 0 0 0 0 0 0 0 0 0
77.1
0 0 0 0 0
14.8 0
16.7 0 0 0 0 0 0 0 0 0 0 0 0 0 0
6.8
27.8
0 0
1.3 22.2 22.2 27.8 27.8 33.3 33.3 33.3 33.3 40.0 40.0 44.4 44.4 50.0 50.0 60.0 60.0 60.0 60.0 0.8
Public charter teacher (SASS-4D) 4c 37 38(6, code) 38(6, enrollment) 38(7, code) 38(7, enrollment) 38(8, code) 38(8, enrollment)
0
84.1 27.2
0 37.6
0 45.9
0
0 0 0
26.6 0
36.8 0
44.8
53.4 0.3 0.9 1.2 1.1 1.6 1.4 2.1
See notes at end of table.
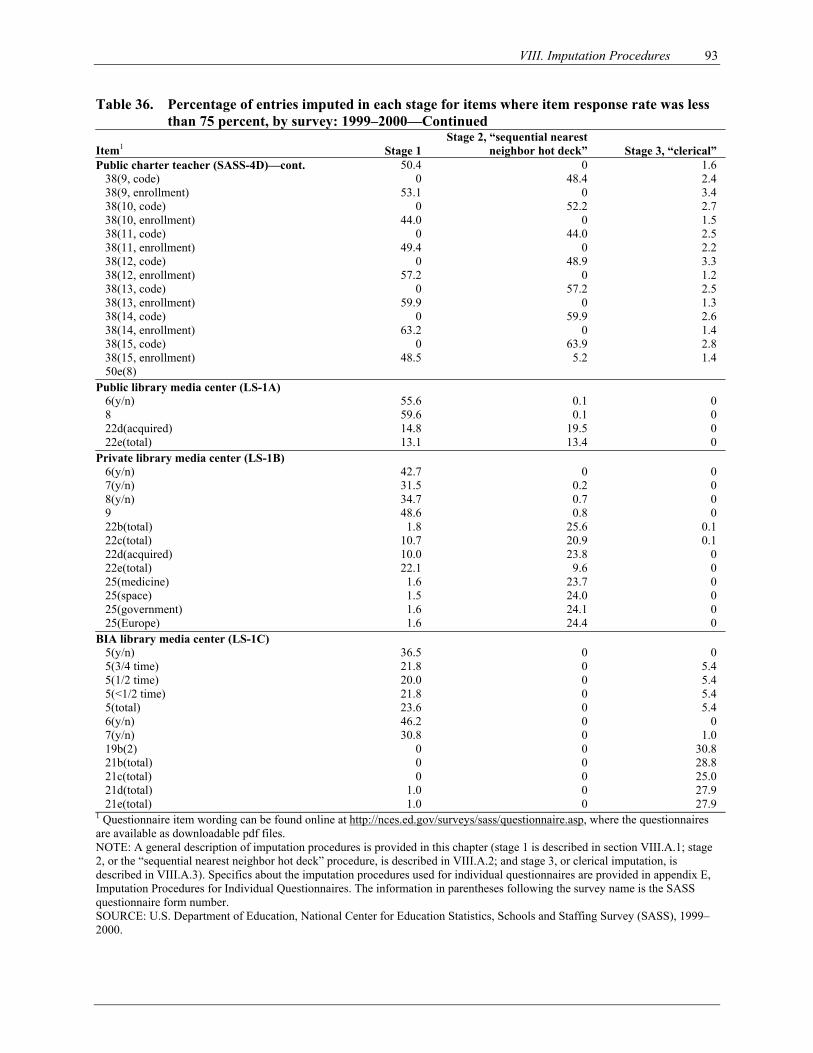
VIII. Imputation Procedures 93
Table 36. Percentage of entries imputed in each stage for items where item response rate was less than 75 percent, by survey: 1999–2000—Continued
Item1 Stage 1 Stage 2, “sequential nearest
neighbor hot deck” Stage 3, “clerical” Public charter teacher (SASS-4D)—cont.
38(9, code) 38(9, enrollment) 38(10, code) 38(10, enrollment) 38(11, code) 38(11, enrollment) 38(12, code) 38(12, enrollment) 38(13, code) 38(13, enrollment) 38(14, code) 38(14, enrollment) 38(15, code) 38(15, enrollment) 50e(8)
50.4 0
53.1 0
44.0 0
49.4 0
57.2 0
59.9 0
63.2 0
48.5
0 48.4
0 52.2
0 44.0
0 48.9
0 57.2
0 59.9
0 63.9 5.2
1.6 2.4 3.4 2.7 1.5 2.5 2.2 3.3 1.2 2.5 1.3 2.6 1.4 2.8 1.4
Public library media center (LS-1A) 6(y/n) 8 22d(acquired) 22e(total)
55.6 59.6 14.8 13.1
0.1 0.1
19.5 13.4
0 0 0 0
Private library media center (LS-1B) 6(y/n) 7(y/n) 8(y/n) 9 22b(total) 22c(total) 22d(acquired) 22e(total) 25(medicine) 25(space) 25(government) 25(Europe)
42.7 31.5 34.7 48.6 1.8
10.7 10.0 22.1 1.6 1.5 1.6 1.6
0
0.2 0.7 0.8
25.6 20.9 23.8 9.6
23.7 24.0 24.1 24.4
0 0 0 0
0.1 0.1
0 0 0 0 0 0
BIA library media center (LS-1C) 5(y/n) 5(3/4 time) 5(1/2 time) 5(<1/2 time) 5(total) 6(y/n) 7(y/n) 19b(2) 21b(total) 21c(total) 21d(total) 21e(total)
36.5 21.8 20.0 21.8 23.6 46.2 30.8
0 0 0
1.0 1.0
0 0 0 0 0 0 0 0 0 0 0 0
0
5.4 5.4 5.4 5.4
0 1.0
30.8 28.8 25.0 27.9 27.9
1 Questionnaire item wording can be found online at http://nces.ed.gov/surveys/sass/questionnaire.asp, where the questionnaires are available as downloadable pdf files. NOTE: A general description of imputation procedures is provided in this chapter (stage 1 is described in section VIII.A.1; stage 2, or the “sequential nearest neighbor hot deck” procedure, is described in VIII.A.2; and stage 3, or clerical imputation, is described in VIII.A.3). Specifics about the imputation procedures used for individual questionnaires are provided in appendix E, Imputation Procedures for Individual Questionnaires. The information in parentheses following the survey name is the SASS questionnaire form number. SOURCE: U.S. Department of Education, National Center for Education Statistics, Schools and Staffing Survey (SASS), 1999–2000.

This page is intentionally left blank.

95
IX. Weighting and Variance Estimation
This chapter describes the weighting processes for the different SASS samples. The general purpose of the weighting is to produce population estimates from the SASS sample data. That process includes adjustment for nonresponse using respondents’ data, and adjustment of the sample totals to the frame totals to reduce sampling variability. For each type of SASS questionnaire, the formula for the weight will be presented, along with a brief description of each element of the weight. When computations are done within cells, such as nonresponse adjustments, the cells will be described. Sometimes a cell did not have sufficient sample size to produce a reliable estimate; in such cases, cells were collapsed. The least important variable was always collapsed first, then the second least important variable, etc. The collapsing criteria are also described. Variable categories are defined in appendix F.
The school weight is described in section IX.A. Since the public, BIA, public charter, and private school weights have basically the same structure, they are presented together. They differ in the definition of the cells used to compute the nonresponse adjustment factor and the first-stage ratio adjustment factor (i.e., a factor used to adjust for deficiencies in the sample selected from the frame), and the private school weighting also had one additional factor applied. These cells are described separately within the school weight section. Since the public, BIA, public charter, and private principal weights are similar to the school weights, they are described next. The public district weights are described in section IX.C, and the description includes how district basic weights were computed. The teacher weights are described in section IX.D. Since the public, BIA, public charter, and private school teacher weights have the same structure, they are presented together. They differ only in the definition of the cells used to compute the various weighting factors. These cells are described separately within the teacher weight section. Section IX.E describes the school library weights. Since the public, BIA, and private library weights also have basically the same structure, they are presented together. They differ in the definition of the cells used to compute the various weighting factors, and the private library weighting also had one additional factor applied. These cells are described separately within the library weighting section. In addition, this chapter contains a final section on variance estimation, which describes the preferred methods of estimating sampling errors for SASS.
The distribution of the final weights from each file is provided in table 37.
Table 37. Distribution of final weights, by file: 1999–2000 Weight at a given percentile File Minimum 1st 5th 10th 25th 50th 75th 90th 95th 99th Maximum Mean
District 0.75 0.99 1.00 1.07 1.27 2.03 3.50 5.91 8.25 16.65 76.46 3.09Public principal 0.84 1.13 1.84 2.27 3.22 5.50 12.13 23.74 31.30 49.13 96.32 9.71Private principal 0.63 0.82 1.01 1.33 2.98 7.30 13.10 18.68 26.92 48.00 162.61 9.59BIA principal 1.05 1.05 1.05 1.05 1.07 1.07 1.10 1.10 1.10 1.10 1.10 1.07Public charter principal 1.02 1.02 1.03 1.03 1.06 1.11 1.14 1.20 1.21 1.25 1.25 1.11Public school 0.91 1.29 1.94 2.35 3.35 5.69 12.33 23.87 32.40 50.13 110.81 9.93Private school 0.65 0.78 1.16 1.32 3.16 7.45 13.83 20.27 30.88 55.88 149.26 10.43BIA school 1.01 1.01 1.01 1.01 1.01 1.01 1.07 1.11 1.11 1.11 1.11 1.03Public charter school 1.06 1.06 1.06 1.07 1.10 1.14 1.23 1.24 1.26 1.40 1.40 1.16Public school teacher 1.59 4.72 6.88 10.50 19.98 36.91 83.94 153.83 289.82 463.25 688.00 70.92Private school teacher 0.96 2.85 6.34 9.07 28.46 55.70 81.72 129.13 155.14 208.12 1,081.45 63.27BIA school teacher 1.11 1.40 2.02 2.14 3.71 5.68 7.25 8.50 9.79 63.00 73.27 6.31Public charter school
teacher 1.04 1.30 1.67 2.20 3.63 5.35 7.67 10.84 12.34 18.38 29.80 6.14
Public school library 0.89 1.13 1.78 2.19 3.13 5.61 12.25 23.87 32.60 51.51 165.36 9.96Private school library 0.57 0.83 1.08 1.24 2.64 5.95 11.35 16.43 21.87 38.33 122.00 8.18BIA school library 1.02 1.02 1.02 1.02 1.02 1.02 1.07 1.11 1.11 1.11 1.11 1.04SOURCE: U.S. Department of Education, National Center for Education Statistics, Schools and Staffing Survey (SASS), 1999–2000.

96 1999–2000 SASS Data File User’s Manual
A. School Weights (School Survey, SASS-3A, -3B, -3C, and -3D)
1. Definition of School Weight
The final weight for the public, BIA, public charter, and private school data is the product of:
(Basic Weight) and (Sampling Adjustment Factor) and (Noninterview Adjustment Factor) and (First-Stage Ratio Adjustment Factor) and (Second-Stage Ratio Adjustment Factor17)
Where:
Basic Weight is the inverse of the probability of selection of the school.
Sampling Adjustment Factor is an adjustment that accounts for unusual circumstances that affect the school’s probability of selection, such as splits, mergers, or duplication (e.g., a junior high school and a senior high school merge to become a junior/senior high school).
Noninterview Adjustment Factor is an adjustment that accounts for total school nonresponse. It is the weighted (product of basic weight and sampling adjustment factor) ratio of the total eligible in-scope schools to the total responding in-scope schools within cells. First-Stage Ratio Adjustment Factor is a factor that adjusts the sample estimates to known frame totals. For public schools, it is equal to the ratio of the total number of SASS frame noncertainty schools to the weighted sample estimate of the total number of noncertainty schools within each cell in the frame. For private schools, the adjustment is the same, except for the area frame. For the area frame, all schools in the noncertainty PSUs were in sample and there were no universe counts for all noncertainty PSUs. These schools had a factor equal to 1.0. Certainty schools were excluded from the numerator and denominator of this factor and also had their factor set equal to 1.0.
Second-Stage Ratio Adjustment Factor (for private schools only) is a factor that adjusts sample estimates based on an older sampling frame to current independent control counts. For the 1999–2000 SASS, the list frame for private schools was the current 1999–2000 PSS list frame whereas the area frame was based on an older 1997–1998 PSS area frame sample. The second-stage ratio adjustment factor is the ratio of the weighted 1999–2000 PSS estimates of schools to the weighted 1999–2000 SASS sample estimate of schools within each cell.
2. School Weighting Adjustment Cells
School noninterview and first- and second-stage ratio adjustments are computed within
cells. The schools are classified into cells based on sampling frame data for the noninterview and first-stage ratio adjustments. For the second-stage ratio adjustment, private schools are classified into cells using questionnaire data.
17 Private schools only.
IX. Weighting and Variance Estimation 97
For public, BIA, public charter, and private schools, schools selected with certainty were adjusted separately for the noninterview adjustment. This was done due to changes in the variance methodology, which now allows SASS to reflect a variance associated with certainty schools due to nonresponse. See section IX.F for further details on the variance methodology.
a. Public School Adjustment Cells
For public schools (except Native American schools18), the noninterview
adjustment cells were: state by school level by enrollment size class by urbanicity. If the school was a noncertainty school and the noninterview adjustment factor was less than or equal to 1.5 and there were at least 15 interviewed schools in the cell, no collapsing was done. If the school was a certainty school and the noninterview adjustment factor was less than or equal to 2.0 and there were at least five interviewed schools and one noninterviewed school in the cell, no collapsing was done. Otherwise, cells were collapsed in the following order: enrollment size class first, urbanicity second, and school level third.
The first-stage ratio adjustment cells for public schools (still excepting Native
American schools) were generally state by school level by urbanicity by enrollment size class. In some states, enrollment size class was not used, and in other states, urbanicity was not used. Specific details are listed in appendix F. If the noninterview adjustment factor was between 0.667 and 1.5 and there were at least 15 noncertainty schools in the cell, no collapsing was done. In some cases, these rules were relaxed in order to avoid excessive collapsing. Otherwise, cells were collapsed in the following order: enrollment size class first, urbanicity second, and school level third.
For Native American elementary schools, the noninterview adjustment cells were school level by state (10 “states”) by enrollment size class, while for secondary and combined schools the cells were school level by state (10 “states”). If the noninterview adjustment factor was less than or equal to 2.0 and there were at least 10 interviewed schools in the cell, no collapsing was done. Otherwise, cells were collapsed in the same sequence as in other public schools: enrollment size class first, urbanicity second, and school level third. These collapsing criteria differ from the criteria used for other public schools due to the smaller number of Native American schools.
The first-stage ratio adjustment cells for Native American elementary schools were state (10 “states”) by school level and enrollment size class, while for Native American secondary and combined schools they were state (10 “states”) by school level. If the noninterview adjustment factor was between 0.667 and 1.5 and there were at least 10 noncertainty schools in the cell, no collapsing was done. In some cases, these rules were relaxed in order to avoid excessive collapsing. Otherwise, cells were collapsed in the following order: enrollment size class first, school level second, and state (10 “states”) third.
b. BIA School Adjustment Cells
For BIA schools, the noninterview adjustment cells were by school level and, for
elementary schools only, by enrollment size class. If the noninterview adjustment factor was less than or equal to 2.0 and there were at least 10 interviewed schools and 1
18 Public schools with 19.5 percent or more Native American students.

98 1999–2000 SASS Data File User’s Manual
noninterviewed school in the cell, no collapsing was done. Otherwise, cells were collapsed in the same order as in public schools: enrollment size class first, urbanicity second, and school level third. The collapsing criteria differ from the criteria used for public schools due to the smaller number of BIA schools and the selection with certainty. These conditions made collapsing less desirable.
There was no first-stage ratio adjustment for BIA schools because they were all
certainty schools.
c. Public Charter School Adjustment Cells For public charter schools, the noninterview adjustment cells were school level
by state (14 “states”) by enrollment size class. If the noninterview adjustment factor was less than or equal to 2.0 and there were at least 10 interviewed schools and 1 noninterviewed school in the cell, no collapsing was done. Otherwise, cells were collapsed in the same sequence as in public and BIA schools: enrollment size class first, urbanicity second, and school level third. The collapsing criteria differ from the criteria used for public schools due to the smaller number of public charter schools and the selection with certainty. These conditions made collapsing less desirable.
There was no first-stage ratio adjustment for public charter schools because they
were all certainty schools. d. Private School Adjustment Cells
For private list frame schools, the noninterview adjustment cells were defined
based on eight different tables. The first table included only schools that were selected with certainty. These schools were classified into cells based on affiliation, school level, and enrollment size class. If the noninterview adjustment factor was less than or equal to 2.0 and there were at least 15 schools in the cell and there was at least 1 noninterviewed school in the cell, no collapsing was done. If collapsing occurred, enrollment size class was collapsed first, school level second, and affiliation third.
The Catholic and All Else affiliations were placed in separate tables. The cell
classification for these schools was based on urbanicity by school level by enrollment size class. If the noninterview adjustment factor was less than or equal to 2.0 and there were at least 15 schools in the cell, no collapsing was done. If collapsing was done, enrollment size class was collapsed first, urbanicity second, and school level third. There was no collapsing across affiliations.
For the other five tables, the remaining 18 affiliations were grouped based on
similarities in enrollment size class categories within school level. If the noninterview adjustment factor was less than or equal to 2.0 and there were at least 15 schools in the cell, no collapsing was done. If collapsing was done, enrollment size class was collapsed first, school level second, and affiliation last.
For private area frame schools, the noninterview adjustment cells were classified
by 3-level typology by school level by enrollment size class. If the noninterview adjustment factor was less than or equal to 2.0 and there were at least 15 schools in the cell, no collapsing was necessary. If collapsing was needed, enrollment size class was

IX. Weighting and Variance Estimation 99
collapsed first, school level second, and 3-level typology last. This collapsing order was determined to be in reverse order of importance to the survey.
For the first-stage ratio adjustment, list frame schools were classified into cells
based on affiliation by school level. Again, urbanicity was used to define the cells for the Catholic and All Else affiliations. If the noninterview adjustment factor was between 0.667 and 1.5 and there were at least 15 noncertainty schools in the cell, no collapsing was done. Otherwise, cells were collapsed first by urbanicity for Catholic and All Else affiliations, followed by school level and affiliation. See appendix F for specific details about variable categories.
There was no first-stage ratio adjustment for area frame schools since, within
frame, they were all selected with certainty. For the second-stage ratio adjustment factor, the cells (list and area) were defined
using 14 different tables. Affiliation 2 (Catholic) was split into three tables, one for each Catholic category (categories 1–3 of the 9-level typology variable). Within each table, ratio adjustment cells were by school level and enrollment size class. Collapsing took place on enrollment size class first, then school level. Affiliations 1 (Military) and 20 (All Else) were split into six tables, one for each non-Catholic category (categories 4–9 of the 9-level typology variable). Within each table, ratio adjustment cells were by school level and enrollment size class. For category 4 of the 9-level typology variable (Conservative Christian), collapsing took place on enrollment size class first, school level second, and affiliation third. For the other 9-level typology categories, collapsing took place on school level first, enrollment size class second, and affiliation third. The other affiliations (3–19) were divided into five tables, where cells were defined by enrollment size class and school level within affiliation. Collapsing occurred on enrollment size class first, school level second, and affiliation third. Generally, if the factor was between 0.667 and 1.5 and there were at least 15 schools in the cell, no collapsing was done. The collapsing rules were altered in some instances to reduce the amount of collapsing. See appendix F for specific details about variable categories.
B. School Principal Weights (School Principal Survey, SASS-2A, -2B, -2C, and -2D)
The public, BIA, public charter, and private school principal weighting was done the same way as the school survey weighting described above. Since the respondents for each of the principal surveys and the corresponding school surveys could be different, the weighting process was done separately for each survey. The sum of the principal weights may not equal the sum of the school weights because some schools do not have principals. C. Public School District Weight (School District Survey, SASS-1A)
1. Definition of District Weight
The final weight for the public school district data is the product of:
(Basic Weight) and (Sampling Adjustment Factor) and (District Noninterview Factor) and (Frame Ratio Adjustment Factor) where:
100 1999–2000 SASS Data File User’s Manual
Basic Weight is the inverse of the probability of selection of the district. Note: Districts were not selected directly, so the computation of this probability is rather complex. See section IX.C.2 for more details. Sampling Adjustment Factor is an adjustment that accounts for unusual circumstances that affect the district’s probability of selection, such as a merger, split, or duplication. For example, if two districts consolidated into one, the consolidated district’s basic weight should reflect the two probabilities of selection. Noninterview Adjustment Factor is an adjustment that accounts for total district nonresponse. It is the weighted (product of the basic weight and sampling adjustment factor) ratio of total eligible in-scope districts to the total responding in-scope districts, computed within cells. Separate noninterveiw adjustment factors were computed for the district for Hawaii, the district for the District of Columbia, and all districts whose student enrollments were much higher than those of other districts in the same state (identified by a large district flag), and these records were excluded from the collapsing process. It was felt the large districts may have skewed the noninterview adjustment factors if they were combined with districts with much lower student enrollments. Hawaii and the District of Columbia each have only one district, so no within state collapsing is possible. Frame Ratio Adjustment Factor is a factor that adjusts the sample estimates to known frame totals. It is the ratio of the total number of noncertainty districts in the frame to the weighted sample estimate of the total number of noncertainty districts in the frame, computed within cells. Certainty districts were assigned a factor of 1.0.
Noninterview and frame ratio adjustments are computed within cells. The noninterview
adjustment cells were: state by district enrollment size class by metro status code. If the noninterview adjustment factor was less than 1.5 and there were at least 10 districts in the cell, no collapsing was done. Otherwise, cells were collapsed (metro status code first and district enrollment size class second in some states, district enrollment size class then metro status code in other states). Specific details of the cell definitions are listed in appendix F.
The frame adjustment cells were the same as the noninterview adjustment cells. If the noninterview adjustment factor was between 0.667 and 1.5 and there were at least 10 noncertainty districts in the cell, no collapsing was done. Otherwise, cells were collapsed: metro status code first and district enrollment size class second in some states, with district enrollment size class first and metro status code second in other states. Collapsing criteria were also altered in some states in order to reduce the amount of collapsing.
2. Calculation of District Basic Weights
Given the complexity of the sampling scheme, the calculation of the district basic weights
is not straightforward. There are two situations that need discussion: the districts outside Delaware, Nevada, and West Virginia, and the districts in those three states, which are all certainty districts.
a. Districts outside Delaware, Nevada, and West Virginia
The district sample was not selected directly through a district frame. Instead, the
districts were selected through the school (i.e., the districts associated with the school
IX. Weighting and Variance Estimation 101
sample comprised the district sample). The basic weight, therefore, is more complicated than normal.
Since schools were stratified by school level (elementary, secondary, and combined), and by type (Native American, other public) the probability of selection for district k, (Pk(sel)) can be written as follows:
where: Pk(NAI,ELM) is the probability of selecting district k which contains schools
that are classified as elementary and Native American. This equals the sum of the school selection probabilities for the schools that are Native American, elementary, and in district k. If the sum is greater than 1.0, then Pk(NAI,ELM) is set equal to 1.0.
Pk(NAI,SEC) is the probability of selecting district k which contains schools
that are classified as secondary and Native American. This equals the sum of the school selection probabilities for the schools that are Native American, secondary, and in district k. If the sum is greater than 1.0, then Pk(NAI,SEC) is set equal to 1.0.
Pk(NAI,COM) is the probability of selecting district k which contains schools
that are classified as combined and Native American. This equals the sum of the school selection probabilities for the schools that are Native American, combined, and in district k. If the sum is greater than 1.0, Pk(NAI,COM) is set equal to 1.0.
Pk(PUB,ELM) is the probability of selecting district k which contains schools that are elementary and not Native American. This equals the sum of the school selection probabilities for the schools that are not Native American, are elementary, and are in district k. If the sum is greater than 1.0, then Pk(NAI,ELM) is set equal to 1.0.
Pk(PUB,SEC) is the probability of selecting district k which contains schools
that are secondary and not Native American. This equals the sum of the school selection probabilities for the schools that are not Native American, are secondary, and are in district k. If the sum is greater than 1.0, then Pk(PUB,SEC) is set equal to 1.0.
Pk(PUB,COM) is the probability of selecting district k which contains schools
that are combined and not Native American. This equals the sum of the school selection probabilities for the schools that are not Native American, are combined, and are in district k. If the sum is greater than 1.0, then Pk(PUB,COM) is set equal to 1.0.
Note that 1/Pk(sel) equals the basic weight.
Pk(Sel)=1–[(1-Pk(NAI,ELM))(1-Pk(NAI,SEC)) (1-Pk(NAI,COM))(1-Pk(PUB,ELM))(1-Pk(PUB,SEC))
(1-Pk(PUB,COM))]

102 1999–2000 SASS Data File User’s Manual
b. Districts in Delaware, Nevada, and West Virginia
The basic weight is 1.0 for all districts in Delaware, Nevada, and West Virginia since all districts in these three states were guaranteed being selected for sample. Their status as certainty districts is due to a simulation study done in 1988 to assess the reliability of SASS district estimates for all states. The simulation study found that standard errors from Delaware, Nevada, and West Virginia were very high relative to the district sampling rate (i.e., coefficients of variation of 5 to 20 percent with 90 percent of districts in sample). To reduce the standard error, all districts from these three states were defined as school sampling strata, which placed all the districts in the district sample, and reduced the standard error to zero.
D. School Teacher Weight (School Teacher Survey, SASS-4A, -4B, -4C, and -4D)
1. Definition of Teacher Weight
The final weight for public, BIA, public charter, and private school teachers is the product of:
(Basic Weight) and (School Sampling Adjustment Factor) and (Teacher Sampling Adjustment Factor) and (School Noninterview Adjustment Factor) and (Teacher-within-school Noninterview Adjustment Factor) and (Frame Ratio Adjustment Factor) and (Teacher Adjustment Factor) where: Basic Weight is the inverse of the probability of selection of the teacher. School Sampling Adjustment Factor is an adjustment that accounts for unusual circumstances that affect the school’s probability of selection, such as a merger, split, or duplication. Teacher Sampling Adjustment Factor is an adjustment that accounts for the experienced teachers from non-BIA/non-public charter schools who were subsampled out during mail nonresponse follow-up. Subsampling was necessary because the nonresponse follow-up workload was considerably higher than expected, overwhelming available interviewing resources. If a teacher who was subject to the subsampling process subsequently returned a questionnaire by mail, he/she was excluded from the subsampling process and was processed along with other interviewed teacher records. Records subsampled out and not returning a questionnaire by mail were excluded from the sample. Records subsampled in and not returning a questionnaire by mail were kept in the sample and had an appropriate teacher sampling adjustment factor applied.
School Noninterview Adjustment Factor is an adjustment that accounts for schools that did not have teachers selected because TLFs were not provided by the school. It is the weighted (the product of the school basic weight and the school sampling adjustment factor) ratio of total eligible in-scope schools to the total in-scope schools providing teacher lists, computed within cells. Teacher-within-school Noninterview Adjustment Factor is an adjustment that accounts for sampled teachers that did not respond to the survey. It is the weighted (product of all
IX. Weighting and Variance Estimation 103
previously defined components) ratio of the total eligible teachers to the total eligible responding teachers computed within cells. Frame Ratio Adjustment Factor is a factor that adjusts the sample estimates to known frame totals of number of teachers. For the set of noncertainty schools, the factor is the ratio of the frame estimate of the total number of teachers to the weighted (product of all previously defined components) sample estimate of the total number of teachers. These factors are computed within cells. The sample estimate uses the frame count of the number of teachers in the school. For public schools, the 1997–1998 CCD was used as the frame and the teacher counts were in terms of FTEs. For private schools, the 1997–98 PSS was used as the frame and teacher counts were in terms of headcounts.
Teachers from certainty schools were assigned a factor of 1.0. Teacher Adjustment Factor is a factor that adjusts for the inconsistency between the estimated number of teachers from the SASS school data files and the SASS teacher sample files. It is the ratio of the weighted number of teachers from the school data file for a cell to the weighted number of teachers on the teacher data file for a cell. The weight is the product of all previously defined components. This factor ensures that teacher estimates from the teacher file will agree with the corresponding teacher aggregates from the school file (after imputation) since the teacher file counts are being adjusted to agree with the school counts.
The school nonresponse adjustments, the teacher within-school noninterview
adjustments, the frame ratio adjustments, and the teacher adjustments are computed within cells. The cells for the frame ratio adjustments are the same as those used in the school weight. The cells for the frame adjustments are described in section IX.A.2, School Weighting Adjustment Cells. 2. Teacher Weighting Adjustment Cells
a. Public, BIA, and Public Charter School Teacher Adjustment Cells
For public, BIA, and public charter schools, the school noninterview adjustment cells were the same as those used for the noninterview adjustment cells in the school weight. The collapsing criteria were also the same as those used in the school noninterview adjustment in the school weight.
The teacher-within-school noninterview adjustment cells were: state by wave
(data from waves 2 and 3 were processed together) by subject matter taught by teacher strata by urbanicity (only for new and experienced teachers). Subject matter taught and teacher strata were obtained from the data provided on the TLF. If the teacher-within-school noninterview adjustment factor was less than 1.5 and there were at least 15 teachers in the cell, no collapsing was done. Otherwise, cells were collapsed (subject matter taught first, urbanicity second—when applicable, and teacher strata third.) The frame ratio adjustment cells were the same as those used for the public school first-stage ratio adjustment in the school weighting. The collapsing criteria were also the same as those used in the school first-stage ratio adjustment in the school weighting.
104 1999–2000 SASS Data File User’s Manual
The teacher adjustment cells for public and public charter schools were state by school level by enrollment size class by teaching status. For BIA schools, cells were school level by enrollment size class by teaching status. Teacher adjustment factors were defined using data from the school surveys for the numerator and from the teacher surveys for the denominator. In all cases, if the factor was between 0.667 and 1.5, and there were at least 15 schools in the cell, no collapsing was done. Otherwise, cells were collapsed (teaching status first, enrollment size class second, and school level third).
b. Private School Teacher Adjustment Cells
For private list frame schools, the school noninterview adjustment cells were the
same as those used for the noninterview adjustment cells in the school weight. The collapsing criteria were the same as those used in the noninterview adjustment in the school weight.
For private schools found on the area frame, the school noninterview adjustment
cells were 3-level typology by school level by number of teachers. If the school noninterview adjustment factor was less than 2.0 and there were at least 15 schools in the cell, no collapsing was done. If collapsing occurred, teacher size class was collapsed first, school level was collapsed second, and 3-level typology was collapsed last.
The teacher-within-school noninterview adjustment cells for teachers from
private list frame schools were: affiliation by subject matter taught by experience level. Urbanicity was additionally used to define cells in the Catholic and All Else affiliations. Subject matter taught and experience level were obtained from the data provided on the TLF. If the teacher-within-school noninterview adjustment factor was less than 1.5 and there were at least 15 teachers in the cell, no collapsing was done. If collapsing occurred, urbanicity was collapsed first (for Catholic and All Else affiliations), experience level was collapsed second, subject matter taught was collapsed third, and affiliation was collapsed last.
The teacher-within-school noninterview adjustment cells for teachers from
private area frame schools were 3-level typology by subject matter taught by experience level. If the teacher-within-school noninterview factor was less than 1.5 and there were at least 15 teachers in the cell, no collapsing was done. If collapsing was done, experience level was collapsed first, subject matter taught was collapsed second, and 3-level typology was collapsed last.
The frame ratio adjustment cells only applied to teachers from private school list
frame schools, and they were the same as those used in the private school first-stage ratio adjustment in the school weighting. The collapsing criteria were also the same as those used in the first-stage ratio adjustment in the school weighting.
For the teacher adjustment factor, the list and area frame private school teachers
were combined. The teacher adjustment cells were affiliation by school level by teaching status. Teacher adjustment factors were defined using data from the school surveys for the numerator and from the teacher surveys for the denominator. If the teacher adjustment factor was between 0.667 and 1.5 and there were at least 15 schools in the cell, no collapsing was done. Otherwise, cells were collapsed (teaching status first, school level second, and affiliation third).
IX. Weighting and Variance Estimation 105
E. School Library Weight (School Library Media Center Survey, LS-1A, -1B, and -1C)
SASS school library data are used to estimate the characteristics of schools with libraries as well as schools without libraries. Whenever possible, sample schools with libraries and sample schools without libraries are adjusted separately. This is done to study the characteristics of each type of school. When it is not possible to adjust the library weights by the type of school, all sample libraries and schools without libraries are adjusted as a whole.
1. Definition of School Library Weight
The final weight for the public, BIA, and private school library data is the product of the following:
(School Basic Weight) and (Library Subsampling Factor) and (Sampling Adjustment Factor) and (Library Type A Noninterview Adjustment Factor) and (Library Type B Noninterview Adjustment Factor) and (First-Stage Ratio Adjustment Factor) and (Second-Stage Ratio Adjustment Factor)
where: School Basic Weight is the inverse of the probability of selection of the school. Library Subsampling Factor is an adjustment that accounts for the subsampling of the SASS sample libraries during the nonresponse follow-up phase of the library survey. Subsampling was necessary due to the higher than expected mail nonresponse, overwhelming available resources. If a library was subject to the subsampling process but subsequently returned a questionnaire by mail, it was excluded from the subsampling process and was processed along with other interviewed libraries. Records subsampled out and not returning a questionnaire by mail were excluded from the sample. Records subsampled in and not returning a questionnaire by mail were kept in the sample and had an appropriate library sampling adjustment factor applied. Sampling Adjustment Factor is an adjustment that accounts for unusual circumstances that affect the school’s probability of selection, such as splits, mergers, or duplication. This is the same factor as applied to the SASS school sample.
Type A Noninterview Adjustment Factor is an adjustment that accounts for schools that were general refusals or could not be contacted and the library status was not known. Because it was not clear if the school had a library or not, this factor adjusts all schools (with and without libraries) together. It is the weighted (product of the basic weight and the subsampling factor and the sampling adjustment factor) ratio of the total in-scope interviewed libraries plus the total in-scope noninterviewed libraries to the total in-scope interviewed libraries. Type B Noninterview Adjustment Factor is an adjustment that accounts for library nonrespondents. Given that schools with libraries were able to be distinguished from schools without libraries, this adjustment is made separately for SASS sample schools with and without libraries.
Schools with libraries: This adjustment is the weighted (product of the basic weight and the library subsampling factor and the sampling adjustment factor and
106 1999–2000 SASS Data File User’s Manual
the type A noninterview adjustment factor) ratio of the interviewed libraries plus the noninterviewed libraries to the interviewed libraries.
Schools without libraries: This adjustment is the weighted (product of the basic weight and the library subsampling factor and the sampling adjustment factor and the type A noninterview adjustment factor) ratio of the interviewed schools without libraries plus the noninterviewed schools without libraries to the interviewed schools without libraries.
First-Stage Ratio Adjustment Factor is a factor that adjusts the sample estimates to known frame totals. The adjustment is equal to the ratio of the total number of noncertainty schools in the 1999–2000 SASS school frame that were eligible for the library survey to the weighted (product of the basic weight and the library subsampling factor and the sampling adjustment factor) library sample estimate of the total number of noncertainty schools within each cell. Certainty schools were excluded from the computation, and they were assigned an adjustment factor of 1.0.
Second-Stage Ratio Adjustment Factor (for private school libraries only) is a factor that adjusts the library sample estimates to independent control counts, the 1999–2000 PSS. This adjustment is equal to the ratio of the total interviewed schools in the 1999–2000 PSS to the weighted (product of the basic weight and the library subsampling factor and the sampling adjustment factor and the type A noninterview adjustment factor and the type B noninterview adjustment factor and the first-stage ratio adjustment factor) library sample estimate of the total number of sample libraries (interviewed libraries and interviewed schools without libraries) within each cell. Interviewed libraries and interviewed schools without libraries from both the list and area frames were included in this adjustment.
2. School Library Adjustment Cells
Public charter schools were not a part of the library survey.
a. Public School Library Adjustment Cells
Library noninterview and ratio adjustments are computed within cells. For public schools, except certainty and Native American schools, the Type A
and Type B noninterview adjustment cells were state by school level by enrollment size class by urbanicity. If the noninterview adjustment factor was less than or equal to 1.5 and there were at least 15 interviews in the cell, no collapsing was done. Otherwise, cells were collapsed in the following order: enrollment size class, urbanicity, and school level.
For certainty schools, the Type A and Type B noninterview adjustment cells
were state or region (depending on the number of certainty schools contained in the region) by school level. If the noninterview adjustment factor was less than or equal to 2.0 and there were at least 5 interviews and at least 1 noninterview in the cell, no collapsing was done. Otherwise cells were collapsed (school level first and state or region second).
For public schools, except Native American schools, the first-stage ratio
adjustment cells were state by school level by urbanicity. If first-stage ratio adjustment
IX. Weighting and Variance Estimation 107
factor was between 0.667 and 1.5 and there were at least 15 noncertainty schools in the cell, no collapsing was done. Otherwise, cells were collapsed (urbanicity first and school level second).
For Native American elementary schools, the Type A and Type B noninterview
adjustment cells were state (10 “states”) by school level by enrollment size class; while the secondary and combined schools cells were state (10 “states”) by school level. If noninterview adjustment factor was less than or equal to 2.0 and there were at least 10 interviews in a cell, no collapsing was done. Otherwise cells were collapsed (enrollment size class first, school level second, and state third).
The Native American school first-stage ratio adjustment cells were the same as
the noninterview adjustment cells, state by school level by enrollment size class (elementary schools only). If the first-stage ratio adjustment factor was between 0.667 and 1.5 and there were at least 10 noncertainty schools in the cell, no collapsing was done. Otherwise, cells were collapsed (enrollment size class first, school level second, and state third).
b. BIA School Library Adjustment Cells
Library noninterview and ratio adjustments are computed within cells. For BIA schools, the Type A and Type B noninterview adjustment cells were by
school level and, for elementary schools only, by enrollment size class. If the noninterview adjustment factor was less than or equal to 2.0 and there were at least 10 interviews and at least 1 noninterview in the cell, no collapsing was done. Otherwise, cells were collapsed (enrollment size class first and school level second).
c. Private School Library Adjustment Cells
Library noninterview and ratio adjustments are computed within cells.
For private school noncertainty libraries from the list frame, the Type A and
Type B noninterview adjustment cells were the 20 affiliations by school level by enrollment size class. The Catholic and All Else affiliations additionally used urbanicity to define cells. If the noninterview adjustment factor was less than 2.0 and there were at least 15 interviews in the cell, no collapsing was done. Otherwise, cells were collapsed (enrollment size class first, urbanicity second for the Catholic and All Else affiliations, school level third, and affiliation last).
For private school certainty libraries from the list frame, the Type A and Type B noninterview adjustment cells were the 15 affiliations that contained certainty libraries by school level by enrollment size class. If the noninterview adjustment factor was less than 2.0 and there were at least 15 interviews and at least 1 noninterview in the cell, no collapsing was done. Otherwise, cells were collapsed (enrollment size class first, school level second, and affiliation third).
For private school libraries from the area frame, the Type A and Type B noninterview adjustment cells were 3-level typology by school level by enrollment size class. If the noninterview adjustment factor was less than 2.0 and there were at least 15
108 1999–2000 SASS Data File User’s Manual
interviews in the cell, no collapsing was done. Otherwise, cells were collapsed (enrollment size class first, school level second, and 3-level typology third).
The first-stage ratio adjustment cells for private school libraries from the list
frame were affiliation by school level by urbanicity (Catholic and All Else only). If first-stage ratio adjustment factor was between 0.667 and 1.5 and there were at least 15 libraries in the cell, no collapsing was done. Otherwise, collapsing was done (school level first, urbanicity second for the Catholic and All Else affiliations, and affiliation third).
For private school libraries from both the list and area frames, the second-stage ratio adjustment cells were affiliation by school level by enrollment size class. Cells were defined based on survey data. If the second-stage ratio adjustment factor was between 0.667 and 1.5 and there were at least 15 libraries in the cell, no collapsing was done. Otherwise, cells were collapsed (enrollment size class first, school level second, and affiliation last).
F. Variance Estimation
In surveys with complex sample designs, such as SASS, direct estimates of the sampling errors assuming a simple random sample will typically underestimate the variability in the estimates. The SASS sample design and estimation included procedures that deviate from the assumption of simple random sampling, such as stratifying the school sample, oversampling new school teachers, and sampling with differential probabilities.
The preferred methods of calculating sampling errors to reflect these aspects of the complex
sample design of SASS are, in this order,
• replication method, • Taylor series linearization method; and • design effects.
These methods are described in the subsections below.
1. Replication Method
Replication methods involve constructing a number of subsamples (replicates) from the
full sample and computing the statistic of interest for each replicate. The mean square error of the replicate estimates around the full sample estimate provides an estimate of the variance of the statistic (Wolter 1985). The replicate weights are used to compute the variance of a statistic, Y, as given below.
Variance (Y) = ∑ −r
r YYn
2)(1
Where: Yr = the estimate of Y using the rth set of replicate weights
n = the number of replicates The SASS surveys completed before 1993 used a procedure known as balanced repeated
replication (BRR) for the calculation of sampling variance. BRR assumes sampling is done with replacement, and hence, BRR does not reflect the increase in precision due to sampling a large proportion of a finite population. For most surveys, where the sampling rates are small, the
IX. Weighting and Variance Estimation 109
increase in precision will be small and can safely be ignored. However, with the SASS, the public surveys (school, administrator, school district, teacher, and library) are designed to produce reliable state estimates. This necessarily implies large sampling rates, which can lead to very large overestimates of variance with BRR. Likewise, the private sector surveys (school, administrator, teacher and library) are designed to produce detailed private association estimates, which also imply large sampling rates, and consequent overestimation of variance with BRR.
It is possible to adjust the BRR to include a finite population correction (FPC). However,
since SASS uses a PPS systematic selection procedure, it is not clear what the appropriate FPC would be. It is even possible for an appropriate FPC to be greater than one. (See Kaufman 2001.)
To overcome this limitation, a bootstrap variance estimator was implemented for the
1993–1994 SASS and its role was expanded in the 1999–2000 SASS. The bootstrap variance estimator was used for public schools, private list frame noncertainty schools, and public school districts in 1993–1994. The 1999–2000 bootstrap variance estimator was modified from the 1993–1994 estimator to increase its stability. In 1999–2000, an additional bootstrap estimator was also used for public schools and private list frame certainty schools. The bootstrap variance reflects the increase in precision due to large sampling rates because the bootstrap is done systematically without replacement, as was the original sampling. Thus, the bootstrap estimate should better reflect the effect of high sampling rates.
The idea behind bootstrap variance estimation is to use the distribution of the sample
weights to generate a bootstrap frame. A series of bootstrap samples of a prespecified bootstrap sample size can be selected from the bootstrap frame, respective replicate weights computed, and variances estimated with standard BRR software. In SASS, this process is repeated for a number of independent samples which are selected according to the SASS sample design, and using variables from the frame. A true estimate of the variance is computed with these independent samples. Given the true variance estimate, the bootstrap stratum sample sizes are chosen to get as close as possible to the true stratum variance estimates. Once the bootstrap stratum sample sizes are determined, bootstrap samples and replicate weight are generated for the actual fielded sample using these bootstrap stratum sample sizes. This process indirectly generates an appropriate FPC. For further details, see Kaufman (1998). The bootstrap replicate basic weights (inverse of the probability of selection) generated for the fielded sample were subsequently reweighted by processing each set of replicate basic weights through the weighting procedure described in this chapter.
With the introduction of the charter schools, the number of certainty units increased
dramatically. Because of that, it was decided to treat nonresponse as a stage of sample selection. For certainty schools, this allowed for the reflection of a variance component that otherwise would be regarded as a bias. (See chapter IV, Sample Design and Implementation, for a discussion of the public and private schools selected with certainty.) The nonresponse sampling model is:
• For noncertainty schools, nonresponse is considered a nested random process within
selected PSUs. Within appropriately defined cells, it is assumed nonresponse follows a “missing at random” process.
• For certainty schools, nonresponse is considered the first stage of selection. It is assumed that this process follows a simple random sample without replacement model within appropriately defined cells. The frame size for this selection is assumed to be the number of selected certainty schools in the cell and the sample size is the number of responding certainty schools in the cell.
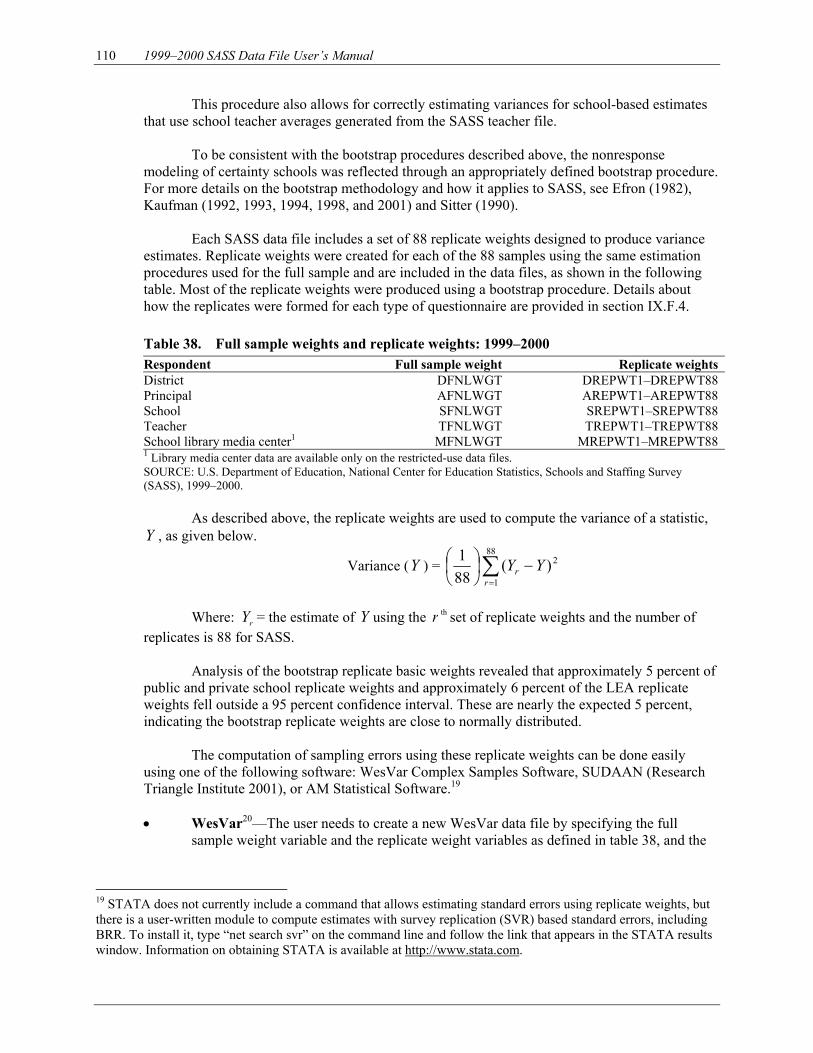
110 1999–2000 SASS Data File User’s Manual
This procedure also allows for correctly estimating variances for school-based estimates that use school teacher averages generated from the SASS teacher file.
To be consistent with the bootstrap procedures described above, the nonresponse
modeling of certainty schools was reflected through an appropriately defined bootstrap procedure. For more details on the bootstrap methodology and how it applies to SASS, see Efron (1982), Kaufman (1992, 1993, 1994, 1998, and 2001) and Sitter (1990).
Each SASS data file includes a set of 88 replicate weights designed to produce variance
estimates. Replicate weights were created for each of the 88 samples using the same estimation procedures used for the full sample and are included in the data files, as shown in the following table. Most of the replicate weights were produced using a bootstrap procedure. Details about how the replicates were formed for each type of questionnaire are provided in section IX.F.4.
Table 38. Full sample weights and replicate weights: 1999–2000 Respondent Full sample weight Replicate weights District DFNLWGT DREPWT1–DREPWT88 Principal AFNLWGT AREPWT1–AREPWT88 School SFNLWGT SREPWT1–SREPWT88 Teacher TFNLWGT TREPWT1–TREPWT88 School library media center1 MFNLWGT MREPWT1–MREPWT88 1 Library media center data are available only on the restricted-use data files. SOURCE: U.S. Department of Education, National Center for Education Statistics, Schools and Staffing Survey (SASS), 1999–2000.
As described above, the replicate weights are used to compute the variance of a statistic,
Y , as given below.
Variance (Y ) = ∑=
−
88
1
2)(881
rr YY
Where: rY = the estimate of Y using the thr set of replicate weights and the number of
replicates is 88 for SASS. Analysis of the bootstrap replicate basic weights revealed that approximately 5 percent of
public and private school replicate weights and approximately 6 percent of the LEA replicate weights fell outside a 95 percent confidence interval. These are nearly the expected 5 percent, indicating the bootstrap replicate weights are close to normally distributed.
The computation of sampling errors using these replicate weights can be done easily
using one of the following software: WesVar Complex Samples Software, SUDAAN (Research Triangle Institute 2001), or AM Statistical Software.19
• WesVar20—The user needs to create a new WesVar data file by specifying the full
sample weight variable and the replicate weight variables as defined in table 38, and the
19 STATA does not currently include a command that allows estimating standard errors using replicate weights, but there is a user-written module to compute estimates with survey replication (SVR) based standard errors, including BRR. To install it, type “net search svr” on the command line and follow the link that appears in the STATA results window. Information on obtaining STATA is available at http://www.stata.com.
IX. Weighting and Variance Estimation 111
replication method (BRR). The replicate weights and the full sample weight can be highlighted and dragged to their appropriate place on the “New WesVar Data File” window.
• SUDAAN21—The user needs to specify the sample design as a “Balanced Repeated Replication” design as well as specifying the replicate weight variables (table 38). Specifying the sample design (DESIGN=BRR) is done in the procedure call statement (e.g., PROC DESCRIPT DESIGN=BRR;). The specification of the replicate weights is done with the REPWGT statement (e.g., to produce sampling errors for estimates from the Principal file use the statement: REPWGT AREPWT1-AREPWT88;).
• AM22—The user needs to set the replicate weights along with the replication method using the right-click context menu in the variable list window. Once the “Set Replicate Weights” window is displayed, the replicate weights as identified in table 38 can be highlighted and dragged into the window. At the bottom of the window are four options for replication method; BRR should be selected.
2. Taylor Series Linearization Method Note: The Taylor series linearization method cannot be used with the public-use data
files. Using a Taylor series linearization method is another approach to estimating sampling
errors for complex sample designs. With the exception of the district file, all the SASS restricted-use data files include appropriately defined variables that allow the calculation of variances using Taylor series expansion. The district file does not include these variables since districts are not selected directly in the SASS sampling methodology but are pulled into sample from the public school. The three Taylor series variables are:
• TAYSTRAT—the variance stratum; • TAYSAMPN—the number of sample units selected within each variance stratum; and • TAYPOPN—the population of the variance stratum.
Note: The stratum information included in the TAYSTRAT variable provides
information for Taylor series variance estimation methods when using the SASS files. Because of the number of strata required for the SASS sample design, subsetting the SASS data may result in strata with only one sampled respondent and prevent the software from providing estimates. In such a situation, strata must be collapsed. It is recommended that the stratum with only one sampled response be collapsed with the stratum number closest to it because units are arranged by selection order.
Some software packages allow for specification of the type of sample design in the
variance estimates computation. TAYSTRAT defines the strata used in the variance estimates computation. The software may use TAYSAMPN and TAYPOPN as provided on the files, while other software requires the user to define a sampling rate, which is TAYSAMPN/TAYPOPN.
20 The current version of WesVar is available from Westat. Information can be obtained at http://www.westat.com/wesvar. A previous version, WesVarPC (version 2.12), is available free of charge at that website. Note: Version 2.12 of WesVarPC is no longer being updated or revised. 21 The current version of SUDAAN is available from the Research Triangle Institute. Information on obtaining SUDAAN can be found at http://www.rti.org/sudaan. 22 The current version of AM is available from the American Institutes for Research. AM is freeware and can be downloaded at http://am.air.org.
112 1999–2000 SASS Data File User’s Manual
This sampling rate is used to perform the finite population correction. For the teacher files, the finite population correction as defined here is not appropriate; it is recommended that no finite population correction be applied for teacher files.
Five different software packages (AM, SAS, SUDAAN, STATA, and SPSS) use the
Taylor expansion method to estimate sampling errors based on complex sample designs. For stratified samples, the procedure pools stratum variance estimates to compute the overall variance estimate. • AM 23—The user needs to define the CLUSTER, STRATA, and WEIGHT variables
using the “Edit Metadata” option on the right-click context menu in the variable list window. Once the “Edit Metadata” window is displayed, the appropriate design role is specified for each of the three variable types mentioned above.
• SAS24 version 8 or higher—Users will need to employ the SURVEYMEANS procedure, which uses the Taylor expansion method to estimate sampling errors based on complex sample designs. For stratified samples, the procedure pools stratum variance estimates to compute the overall variance estimate. However, the stratification variables are not available on the public-use file.
• SUDAAN25—The user should specify the sample design as a “Without Replacement” design (DESIGN=WOR) in the procedure call statement (e.g., PROC DESCRIPT DESIGN=WOR;).
• STATA26—A variety of estimation procedures are available using the SVY commands. Prior to using the SVY procedures in version 8 or higher, the user must specify a variable containing the sampling weights, strata, and PSU identifier variables. For the SASS files, these variables should be specified as follows: pweight=(‘final weight for file’), (strata=TAYSTRAT) (psu=CNTLNUM).
• SPSS27 version 12 or higher—The user will need to employ the Complex Samples module, which uses the Taylor expansion method to estimate sampling errors based on complex sample designs. The user must specify the analysis, strata, cluster, and sample weight variables using the Analysis Preparation Wizard prior to running any analysis in the Complex Samples module.
3. Approximate Sampling Errors Direct computation of the standard errors is always recommended. It is particularly
important when the statistical significance of statements would be affected by small differences in the estimated standard errors. Nonetheless, although calculating the sampling errors using the replication method or the Taylor series linearization method is preferred, simple approximations of the sampling errors may be valuable for some purposes. One such approximation is discussed below.
Popular statistical software packages may not compute standard errors of the estimates by taking into account complex sample designs, but assume the data are from a simple random
23 The current version of AM is available from the American Institutes for Research. AM is freeware and can be downloaded at http://am.air.org. 24 The current version of SAS is available from the SAS Institute. Information can be obtained at http://www.sas.com. 25 The current version of SUDAAN is available from the Research Triangle Institute. Information on obtaining SUDAAN can be found at http://www.rti.org/sudaan. 26 Information on obtaining STATA is available at http://www.stata.com. 27 The current version of SPSS is available from SPSS. Information can be obtained at http://www.spss.com.

IX. Weighting and Variance Estimation 113
sample design. The impact of departures from simple random sampling on the precision of sample estimates is often measured by the design effect (designated as DEFF). For any statistical estimator (for example, a mean or a proportion), the design effect is the ratio of the estimate of the variance of a statistic derived from consideration of the sample design to that obtained from the formula for simple random samples. The following formulas define the design effect and consequent use of the design effect to calculate the standard error:
2
2
)()(
SRS
DESIGN
sese
DEFF = (1)
DEFFsese SRSDESIGN ×= (2)
where seDESIGN designates the standard error of an estimate calculated by taking into account the complex nature of the survey design, and seSRS designates the standard error of the same estimate calculated as if the survey design was a simple random sample. One may think of this ratio as a measure of the efficiency of the actual design. In SASS, the DEFF is typically greater than one due to the clustering of the sample and the differential weights attached to the observations. Since SASS has such a large number of variables it is not feasible to calculate the DEFF for every variable and every type of estimate. Empirical studies (e.g., Synectics for Management Decisions 1992) have shown that appropriately formed groups of SASS statistics tend to have similar design effects. Therefore, it is sufficient that the design effects be computed for at least some group of key variables and some basic statistics. The average of these design effects can be considered as a measure of the efficiency of the survey design compared to the alternative simple random sampling for those types of statistics. For the 1999–2000 SASS, accordingly, an average design effect was derived for a group of variables (see appendix G for list of variables and variable by variable design effects) for each type of statistic (table 39) for each of the four regions (Northeast, Midwest, South, and West). Tables 40 through 44 present the resulting average design effects for the each of the five types of SASS surveys. Examples of how to use these tables are provided in the following sections.
Table 39. Types of statistics for which design effects were calculated: 1999–2000 Survey Type of statistic Survey Type of statistic District (SASS-1A) Student total Teacher (SASS-4A, -4B, 4C, Teacher total Student average and –4d) Teacher average Teacher total Teacher proportion Teacher average District proportion Library media center (LS-1A, Library total -1B, and –1C) Library average Principal (SASS-2A, -2B Principal total Library proportion -2C, and -2D) Principal average Principle proportion School (SASS-3A, -3B, Student total -3C, and -3D) Student average Teacher total Teacher average School proportion SOURCE: U.S. Department of Education, National Center for Education Statistics, Schools and Staffing Survey (SASS), 1999–2000.
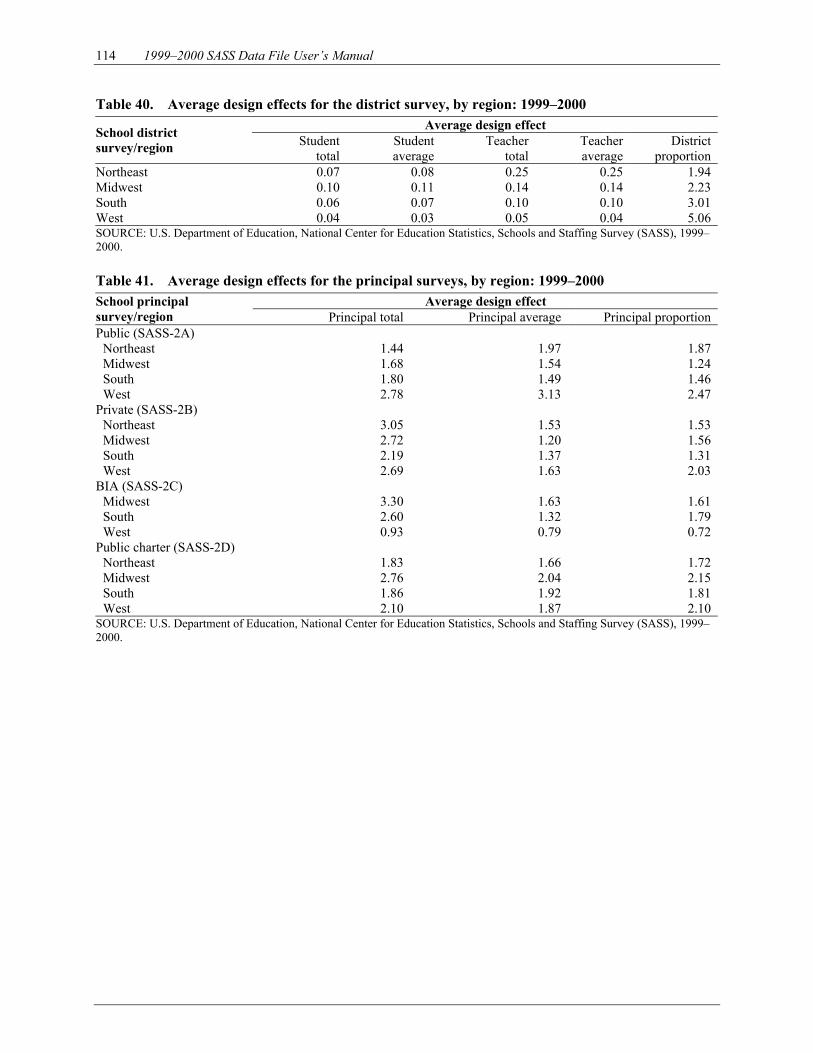
114 1999–2000 SASS Data File User’s Manual
Table 40. Average design effects for the district survey, by region: 1999–2000 Average design effect School district
survey/region Student total
Student average
Teacher total
Teacher average
District proportion
Northeast 0.07 0.08 0.25 0.25 1.94 Midwest 0.10 0.11 0.14 0.14 2.23 South 0.06 0.07 0.10 0.10 3.01 West 0.04 0.03 0.05 0.04 5.06 SOURCE: U.S. Department of Education, National Center for Education Statistics, Schools and Staffing Survey (SASS), 1999–2000.
Table 41. Average design effects for the principal surveys, by region: 1999–2000
Average design effect School principal survey/region Principal total Principal average Principal proportion Public (SASS-2A)
Northeast 1.44 1.97 1.87 Midwest 1.68 1.54 1.24 South 1.80 1.49 1.46 West 2.78 3.13 2.47
Private (SASS-2B) Northeast 3.05 1.53 1.53 Midwest 2.72 1.20 1.56 South 2.19 1.37 1.31 West 2.69 1.63 2.03
BIA (SASS-2C) Midwest 3.30 1.63 1.61 South 2.60 1.32 1.79 West 0.93 0.79 0.72
Public charter (SASS-2D) Northeast 1.83 1.66 1.72 Midwest 2.76 2.04 2.15 South 1.86 1.92 1.81 West 2.10 1.87 2.10
SOURCE: U.S. Department of Education, National Center for Education Statistics, Schools and Staffing Survey (SASS), 1999–2000.
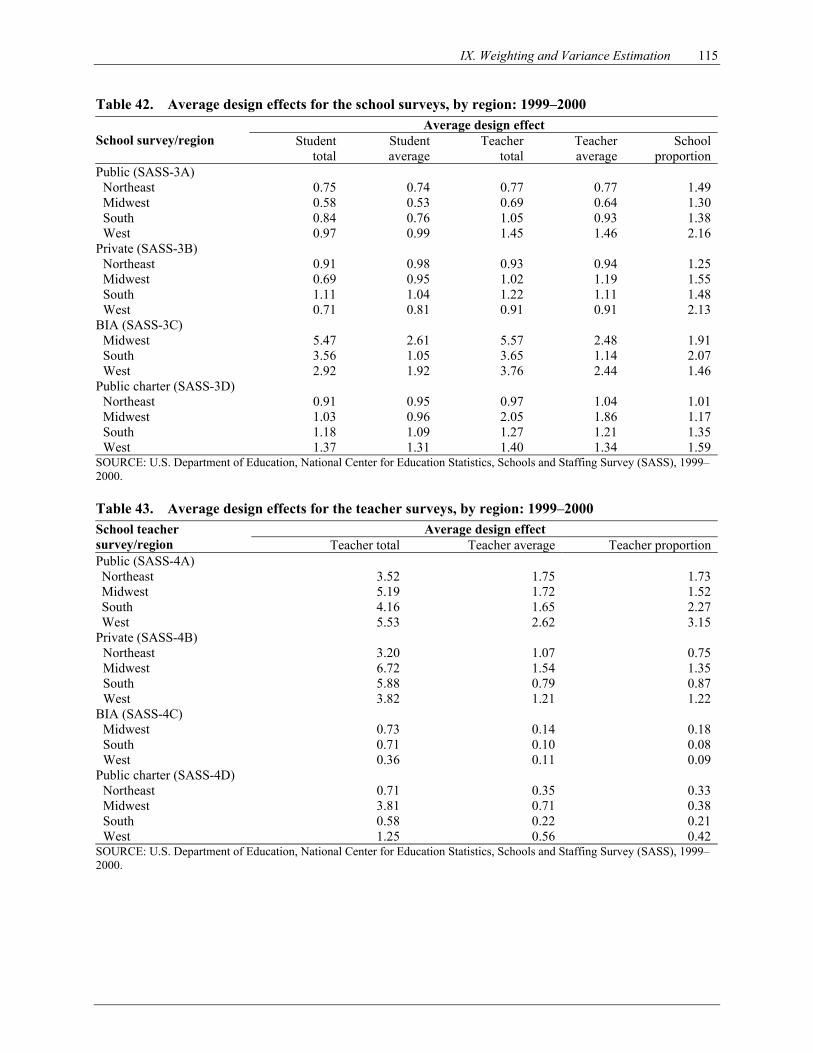
IX. Weighting and Variance Estimation 115
Table 42. Average design effects for the school surveys, by region: 1999–2000 Average design effect
School survey/region Student total
Student average
Teacher total
Teacher average
School proportion
Public (SASS-3A) Northeast 0.75 0.74 0.77 0.77 1.49 Midwest 0.58 0.53 0.69 0.64 1.30 South 0.84 0.76 1.05 0.93 1.38 West 0.97 0.99 1.45 1.46 2.16
Private (SASS-3B) Northeast 0.91 0.98 0.93 0.94 1.25 Midwest 0.69 0.95 1.02 1.19 1.55 South 1.11 1.04 1.22 1.11 1.48 West 0.71 0.81 0.91 0.91 2.13
BIA (SASS-3C) Midwest 5.47 2.61 5.57 2.48 1.91 South 3.56 1.05 3.65 1.14 2.07 West 2.92 1.92 3.76 2.44 1.46
Public charter (SASS-3D) Northeast 0.91 0.95 0.97 1.04 1.01 Midwest 1.03 0.96 2.05 1.86 1.17 South 1.18 1.09 1.27 1.21 1.35 West 1.37 1.31 1.40 1.34 1.59
SOURCE: U.S. Department of Education, National Center for Education Statistics, Schools and Staffing Survey (SASS), 1999–2000. Table 43. Average design effects for the teacher surveys, by region: 1999–2000
Average design effect School teacher survey/region Teacher total Teacher average Teacher proportion Public (SASS-4A) Northeast 3.52 1.75 1.73 Midwest 5.19 1.72 1.52 South 4.16 1.65 2.27 West 5.53 2.62 3.15
Private (SASS-4B) Northeast 3.20 1.07 0.75 Midwest 6.72 1.54 1.35 South 5.88 0.79 0.87 West 3.82 1.21 1.22
BIA (SASS-4C) Midwest 0.73 0.14 0.18 South 0.71 0.10 0.08 West 0.36 0.11 0.09
Public charter (SASS-4D) Northeast 0.71 0.35 0.33 Midwest 3.81 0.71 0.38 South 0.58 0.22 0.21 West 1.25 0.56 0.42
SOURCE: U.S. Department of Education, National Center for Education Statistics, Schools and Staffing Survey (SASS), 1999–2000.
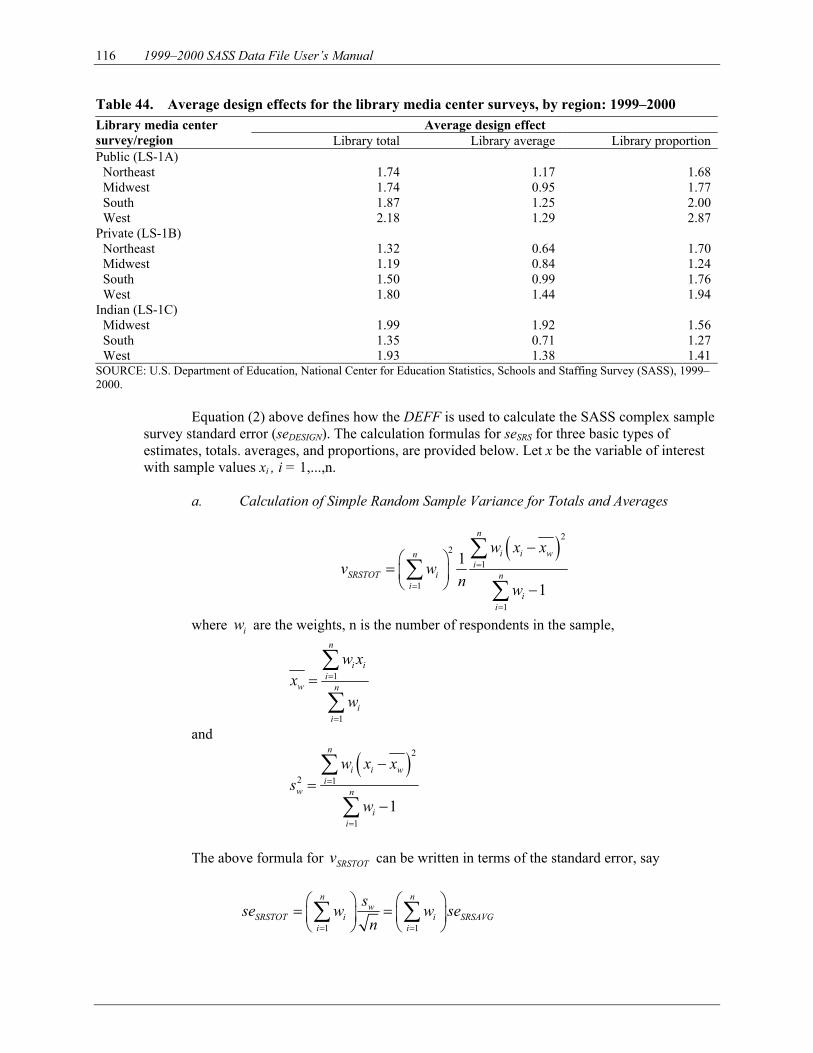
116 1999–2000 SASS Data File User’s Manual
Table 44. Average design effects for the library media center surveys, by region: 1999–2000 Average design effect Library media center
survey/region Library total Library average Library proportion Public (LS-1A)
Northeast 1.74 1.17 1.68 Midwest 1.74 0.95 1.77 South 1.87 1.25 2.00 West 2.18 1.29 2.87
Private (LS-1B) Northeast 1.32 0.64 1.70 Midwest 1.19 0.84 1.24 South 1.50 0.99 1.76 West 1.80 1.44 1.94
Indian (LS-1C) Midwest 1.99 1.92 1.56 South 1.35 0.71 1.27 West 1.93 1.38 1.41
SOURCE: U.S. Department of Education, National Center for Education Statistics, Schools and Staffing Survey (SASS), 1999–2000.
Equation (2) above defines how the DEFF is used to calculate the SASS complex sample survey standard error (seDESIGN). The calculation formulas for seSRS for three basic types of estimates, totals. averages, and proportions, are provided below. Let x be the variable of interest with sample values xi , i = 1,...,n.
a. Calculation of Simple Random Sample Variance for Totals and Averages
( )22
1
1
1
1
1
n
i i wni
SRSTOT i ni
ii
w x xv w
n w
=
=
=
−
= −
∑∑
∑
where iw are the weights, n is the number of respondents in the sample,
1
1
n
i ii
w n
ii
w xx
w
=
=
=∑
∑
and
( )2
2 1
11
n
i i wi
w n
ii
w x xs
w
=
=
−=
−
∑
∑
The above formula for SRSTOTv can be written in terms of the standard error, say
1 1
n nw
SRSTOT i i SRSAVGi i
sse w w sen= =
= = ∑ ∑
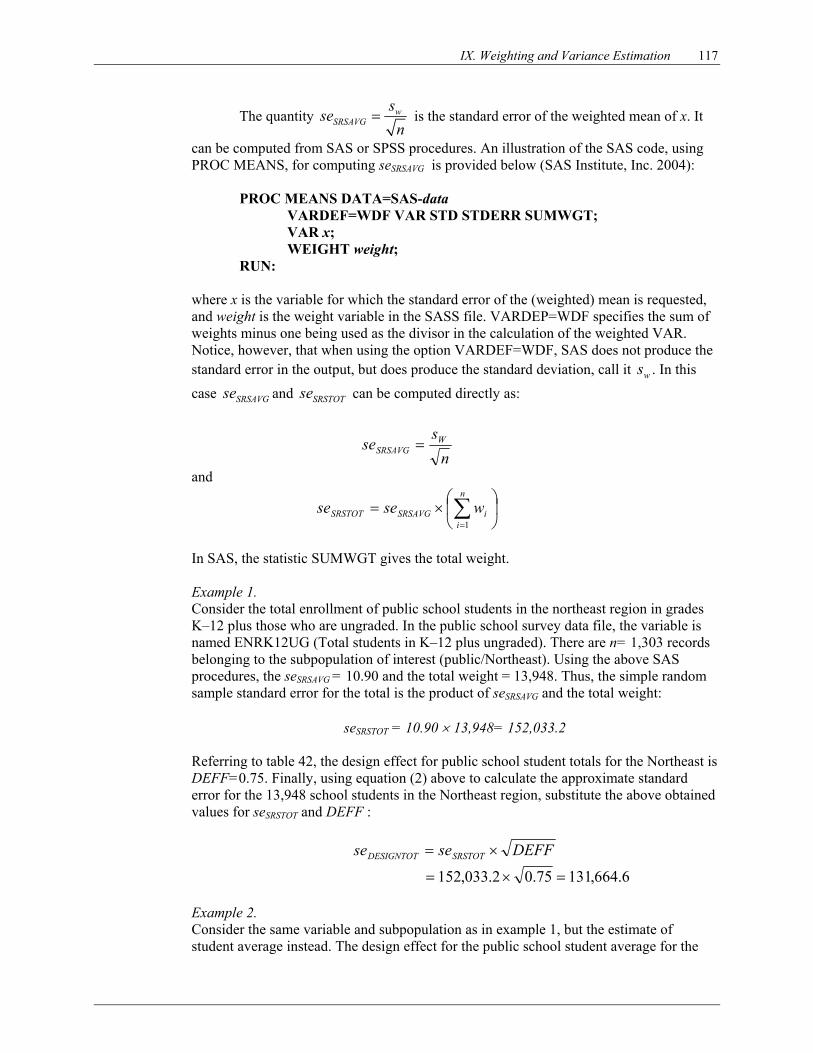
IX. Weighting and Variance Estimation 117
The quantity wSRSAVG
ssen
= is the standard error of the weighted mean of x. It
can be computed from SAS or SPSS procedures. An illustration of the SAS code, using PROC MEANS, for computing seSRSAVG is provided below (SAS Institute, Inc. 2004):
PROC MEANS DATA=SAS-data
VARDEF=WDF VAR STD STDERR SUMWGT; VAR x; WEIGHT weight;
RUN:
where x is the variable for which the standard error of the (weighted) mean is requested, and weight is the weight variable in the SASS file. VARDEP=WDF specifies the sum of weights minus one being used as the divisor in the calculation of the weighted VAR. Notice, however, that when using the option VARDEF=WDF, SAS does not produce the standard error in the output, but does produce the standard deviation, call it ws . In this case SRSAVGse and SRSTOTse can be computed directly as:
ns
se WSRSAVG =
and
×= ∑
=
n
iiSRSAVGSRSTOT wsese
1
In SAS, the statistic SUMWGT gives the total weight.
Example 1. Consider the total enrollment of public school students in the northeast region in grades K–12 plus those who are ungraded. In the public school survey data file, the variable is named ENRK12UG (Total students in K–12 plus ungraded). There are n= 1,303 records belonging to the subpopulation of interest (public/Northeast). Using the above SAS procedures, the seSRSAVG = 10.90 and the total weight = 13,948. Thus, the simple random sample standard error for the total is the product of seSRSAVG and the total weight:
seSRSTOT = 10.90 × 13,948= 152,033.2 Referring to table 42, the design effect for public school student totals for the Northeast is DEFF=0.75. Finally, using equation (2) above to calculate the approximate standard error for the 13,948 school students in the Northeast region, substitute the above obtained values for seSRSTOT and DEFF :
DEFFsese SRSTOTDESIGNTOT ×=
6.664,13175.02.033,152 =×= Example 2. Consider the same variable and subpopulation as in example 1, but the estimate of student average instead. The design effect for the public school student average for the
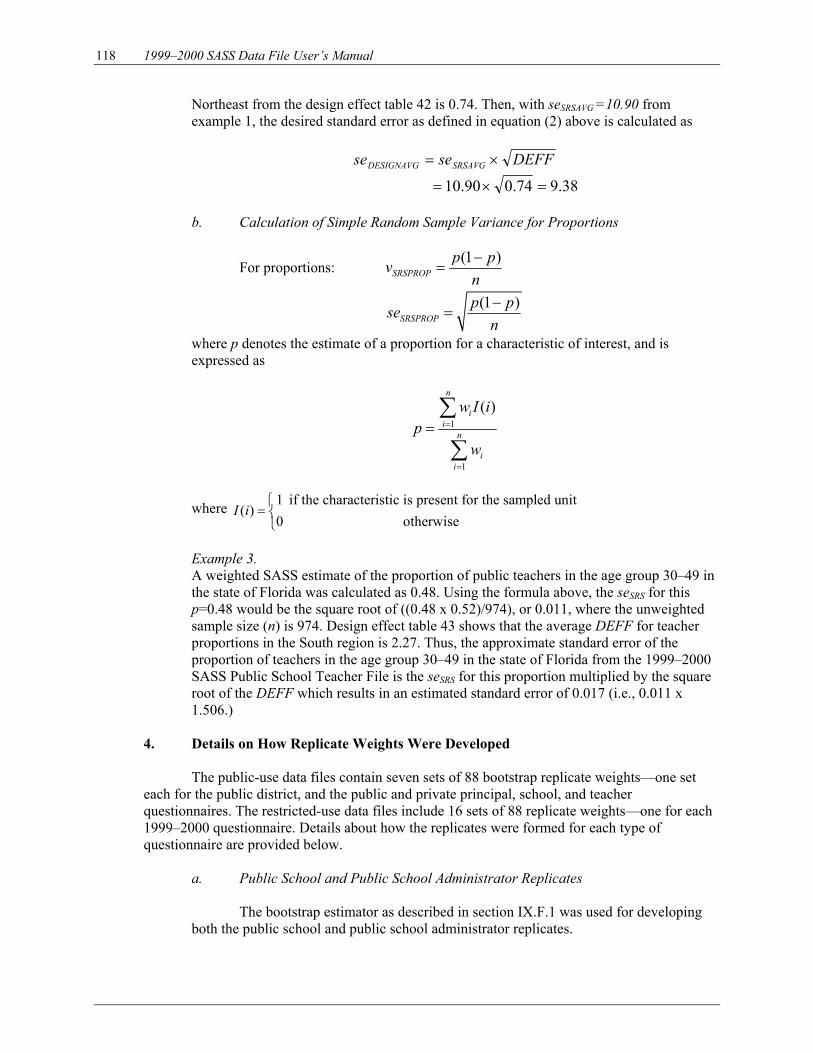
118 1999–2000 SASS Data File User’s Manual
Northeast from the design effect table 42 is 0.74. Then, with seSRSAVG =10.90 from example 1, the desired standard error as defined in equation (2) above is calculated as
DEFFsese SRSAVGDESIGNAVG ×=
38.974.090.10 =×=
b. Calculation of Simple Random Sample Variance for Proportions
For proportions: (1 )
SRSPROPp pv
n−
=
(1 )SRSPROP
p psen−
=
where p denotes the estimate of a proportion for a characteristic of interest, and is expressed as
1
1
( )n
ii
n
ii
w I ip
w
=
=
=∑
∑
where 1 if the characteristic is present for the sampled unit( )
0 otherwiseI i
=
Example 3. A weighted SASS estimate of the proportion of public teachers in the age group 30–49 in the state of Florida was calculated as 0.48. Using the formula above, the seSRS for this p=0.48 would be the square root of ((0.48 x 0.52)/974), or 0.011, where the unweighted sample size (n) is 974. Design effect table 43 shows that the average DEFF for teacher proportions in the South region is 2.27. Thus, the approximate standard error of the proportion of teachers in the age group 30–49 in the state of Florida from the 1999–2000 SASS Public School Teacher File is the seSRS for this proportion multiplied by the square root of the DEFF which results in an estimated standard error of 0.017 (i.e., 0.011 x 1.506.)
4. Details on How Replicate Weights Were Developed The public-use data files contain seven sets of 88 bootstrap replicate weights—one set
each for the public district, and the public and private principal, school, and teacher questionnaires. The restricted-use data files include 16 sets of 88 replicate weights—one for each 1999–2000 questionnaire. Details about how the replicates were formed for each type of questionnaire are provided below.
a. Public School and Public School Administrator Replicates
The bootstrap estimator as described in section IX.F.1 was used for developing
both the public school and public school administrator replicates.
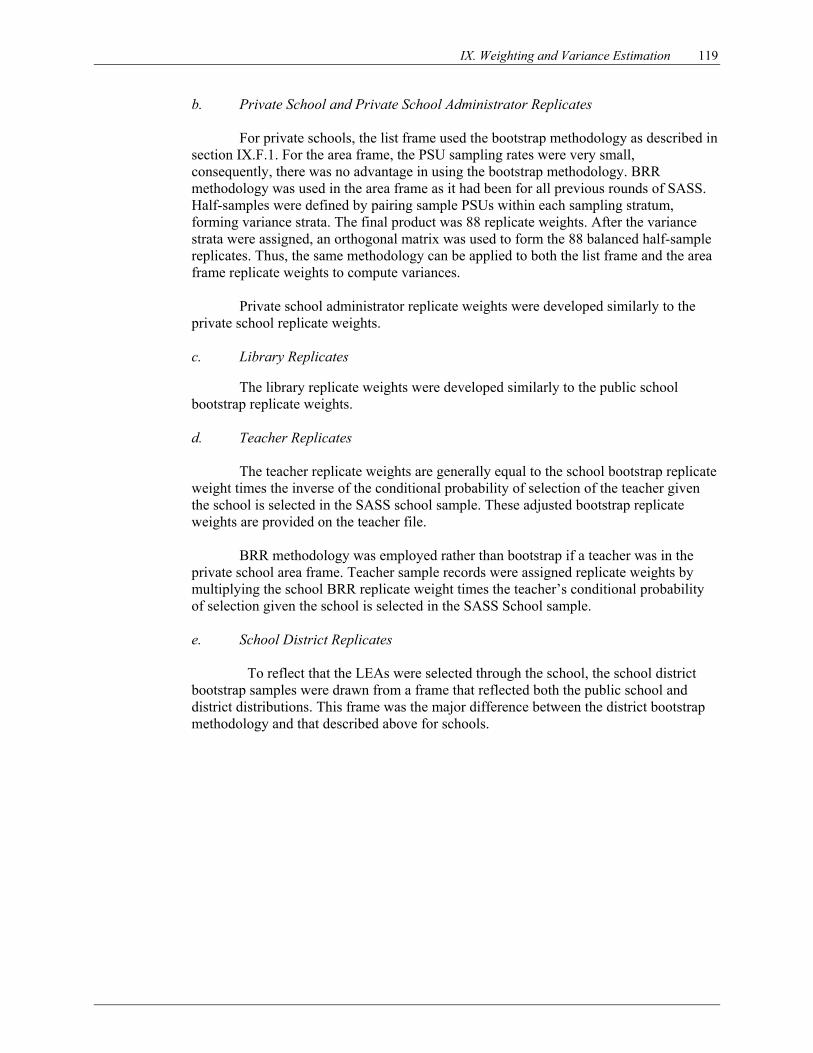
IX. Weighting and Variance Estimation 119
b. Private School and Private School Administrator Replicates For private schools, the list frame used the bootstrap methodology as described in
section IX.F.1. For the area frame, the PSU sampling rates were very small, consequently, there was no advantage in using the bootstrap methodology. BRR methodology was used in the area frame as it had been for all previous rounds of SASS. Half-samples were defined by pairing sample PSUs within each sampling stratum, forming variance strata. The final product was 88 replicate weights. After the variance strata were assigned, an orthogonal matrix was used to form the 88 balanced half-sample replicates. Thus, the same methodology can be applied to both the list frame and the area frame replicate weights to compute variances.
Private school administrator replicate weights were developed similarly to the
private school replicate weights. c. Library Replicates
The library replicate weights were developed similarly to the public school
bootstrap replicate weights.
d. Teacher Replicates
The teacher replicate weights are generally equal to the school bootstrap replicate weight times the inverse of the conditional probability of selection of the teacher given the school is selected in the SASS school sample. These adjusted bootstrap replicate weights are provided on the teacher file.
BRR methodology was employed rather than bootstrap if a teacher was in the
private school area frame. Teacher sample records were assigned replicate weights by multiplying the school BRR replicate weight times the teacher’s conditional probability of selection given the school is selected in the SASS School sample.
e. School District Replicates
To reflect that the LEAs were selected through the school, the school district
bootstrap samples were drawn from a frame that reflected both the public school and district distributions. This frame was the major difference between the district bootstrap methodology and that described above for schools.
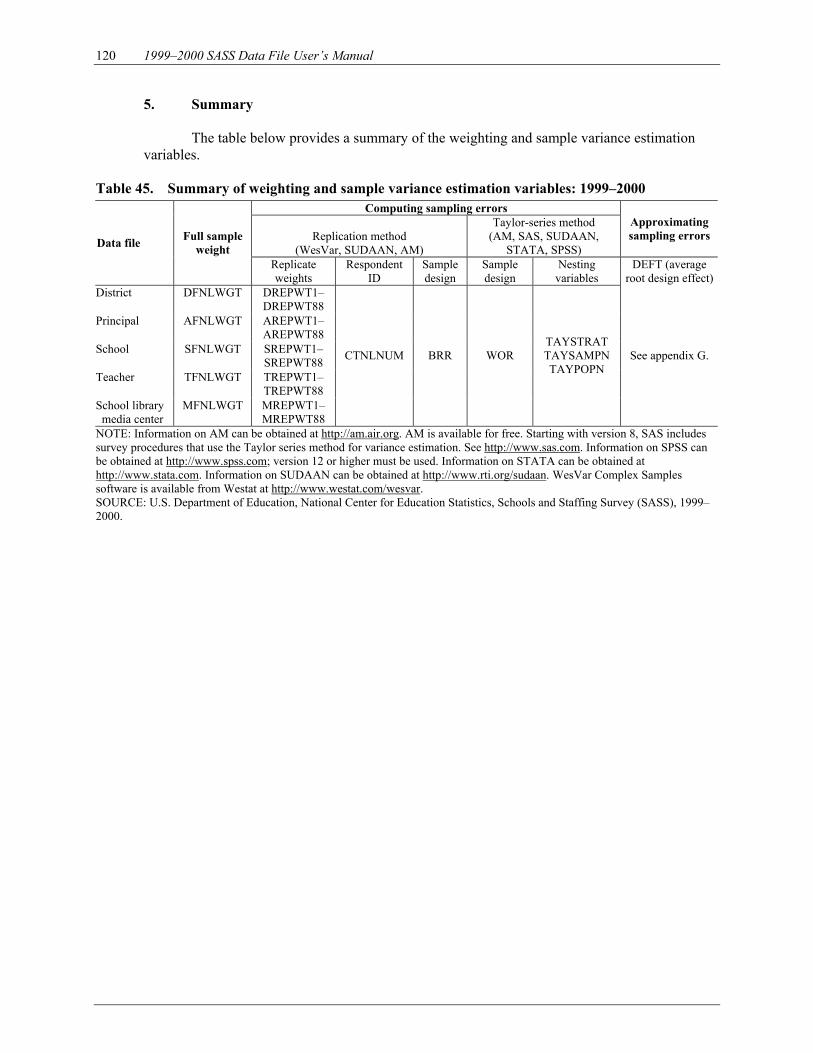
120 1999–2000 SASS Data File User’s Manual
5. Summary
The table below provides a summary of the weighting and sample variance estimation variables.
Table 45. Summary of weighting and sample variance estimation variables: 1999–2000
Computing sampling errors
Replication method (WesVar, SUDAAN, AM)
Taylor-series method (AM, SAS, SUDAAN,
STATA, SPSS)
Approximating sampling errors Data file Full sample
weight Replicate weights
Respondent ID
Sample design
Sample design
Nesting variables
DEFT (average root design effect)
District DFNLWGT DREPWT1–DREPWT88
Principal
AFNLWGT AREPWT1–AREPWT88
School
SFNLWGT SREPWT1–SREPWT88
Teacher
TFNLWGT TREPWT1–TREPWT88
School library media center
MFNLWGT MREPWT1–MREPWT88
CTNLNUM BRR WOR TAYSTRAT TAYSAMPN TAYPOPN
See appendix G.
NOTE: Information on AM can be obtained at http://am.air.org. AM is available for free. Starting with version 8, SAS includes survey procedures that use the Taylor series method for variance estimation. See http://www.sas.com. Information on SPSS can be obtained at http://www.spss.com; version 12 or higher must be used. Information on STATA can be obtained at http://www.stata.com. Information on SUDAAN can be obtained at http://www.rti.org/sudaan. WesVar Complex Samples software is available from Westat at http://www.westat.com/wesvar. SOURCE: U.S. Department of Education, National Center for Education Statistics, Schools and Staffing Survey (SASS), 1999–2000.
121
X. Reviewing the Quality of SASS Data
NCES program staff have the responsibility of ensuring that a database is acceptable for public release. Before files are released to the public, staff review the data for errors associated with the edit, imputation, and weighting programs. Frequency counts and univariate, bivariate, and multivariate tables were reviewed, and when possible comparisons were made to external sources, such as CCD (for public districts, schools, and teachers) and PSS (for private schools and teachers). In addition, a reinterview study (described in section X.I, Response Variance) is conducted for each SASS administration.
Below are aspects of the datasets that were reviewed: Unit nonresponse: Response rates were calculated at the state or affiliation level for all SASS
components. (See chapter VI, Response Rates, and appendix C, tables C-1 through C-14.) Nonresponse districts, schools, principals, and teachers were studied in greater detail to identify patterns of unit and item nonresponse (Bokossa, Salvucci, and Ghosh forthcoming). Item nonresponse: The extent of item nonresponse for each SASS questionnaire was determined. (See chapter VI, Response Rates, and appendix C, tables C-15 through C-30.) Items with high nonresponse rates are identified and reported in tables. Items with high nonresponse rates were identified and reported. Following this review, four items were deleted from the data file. (See section VI.C, Item Response Rates.) Edits: The validity of the skip patterns in the questionnaire was established for each SASS questionnaire during the processing of the data; that is, Census Bureau analysts verified that each item in the questionnaire had the number of responses it should have if skip instructions were followed correctly. Quality checks on the edit specifications were performed and resulted in some corrections (which were treated as a form of imputation). Reasonableness of data: Univariate, bivariate, and multivariate tabulations of key survey variables were obtained and compared to estimates from the previous SASS survey. Tabulations were reviewed to determine whether the basic relationships observed were within reasonable bounds, allowing for elements of change (such as random fluctuations in variance, or a trend such as overall population growth in a state). Frequency counts: Unweighted record counts for every variable were examined from the restricted-use file. Variables with out-of-range values or inconsistent values were identified and values with these characteristics were corrected. Unweighted record counts: Unweighted record counts are published so that users can determine whether the correct number of records has been identified. The weighted record counts are to provide data users with selected final national estimates for comparison. (See appendix C, Selected Unweighted and Weighted Response Rate Tables.) Replicate weights: The review of the SASS replicate weights consisted of reviewing the distribution of these weights. The following was done:
1. For each replicate, the weights were totaled. Each replicate total, as well as the average of these numbers, was checked against the full-sample estimate. The standard error of the replicate totals was computed and checked for reasonableness.
122 1999–2000 SASS Data File User’s Manual
2. A check was performed to verify that 95 percent of the replicate weights were contained in an appropriately computed 95 percent confidence interval. This was done with both the basic replicate weights and the final replicate weights.
External data checks: One way to verify the external validity of SASS data is to make
comparisons to the survey universe, or frame, from which the sample is drawn. For public school districts, schools, principals, and teachers, the external file is an adjusted version of the CCD, an annual administrative census of all public school districts and schools in the United States and its territories. The corresponding frame for private schools, principals, and teachers is PSS. PSS is conducted every 2 years and was coincident with SASS in 1999–2000. The sampling frame is generally drawn about 2 years prior to the field collection of SASS data. Direct comparison can be made between the estimated count of the survey unit, such as school districts or schools, and the corresponding CCD or PSS count. Such comparisons are usually made between SASS and the sampling frame year of the universe. Another type of comparison is between the survey estimate of a characteristic of districts or schools, such as enrollment, with the CCD or PSS estimate. Those comparisons are usually made to the concurrent years, as the data collected in the field for one year is only valid the same year of the universe. The number of students attending school or the number of teachers employed are subject to more year-to-year change than the number of schools or districts. A. School District Unit Count Comparison (SASS-1A)
Comparisons of the number of public school districts by state and region were made to the CCD
1997–98 Public Education Agency Universe as well as to the CCD 1999–2000 Public Education Agency Universe. For the 1999–2000 SASS, the district sample consisted of the set of districts that were associated with the SASS public school sample. The districts in-scope for SASS were those that employed elementary and/or secondary level teachers and were in operation in school year 1999–2000. CCD also collects information on supervisory unions and some other administrative districts that neither operate schools nor hire teachers. Thus, two SASS-CCD comparisons were made, one to the total number of CCD districts for the state and one to the number of “regular” CCD districts (the total number of districts minus the number of districts that were out-of-scope for SASS) in the state. Depending upon the number of out-of-scope districts in each particular state, the SASS estimates are either closer to the total or to the regular number of districts in CCD. An additional source of difference arises from the different ways CCD and SASS treated charter schools. Some of the “regular” CCD districts included nothing but charter schools, but no SASS districts included charter schools because SASS treated each charter school as an independent entity. Estimates of teachers and students were compared with the 1999–2000 CCD, because that was the same year in which SASS data were collected and would represent an independent estimate of the same conditions. The CCD estimates are independent from SASS, as SASS collects its data directly from school districts in sample, and CCD data are collected from the state education agencies.
Comparisons in counts of public school districts by state between CCD and SASS are shown in
tables 46 and 47. The first table compares the estimated number of public school districts in SASS (calculated using the district final weight) with the number of total and regular districts in the 1997–98 CCD Public Education Agency Universe. The second compares the estimated number of public school districts in SASS (calculated using the district basic weight) with the adjusted frame developed by the sampling statisticians at the Census Bureau in preparation for SASS data collection. These are two different measures of “fit” between the weighted count from SASS and the frame count of districts. The
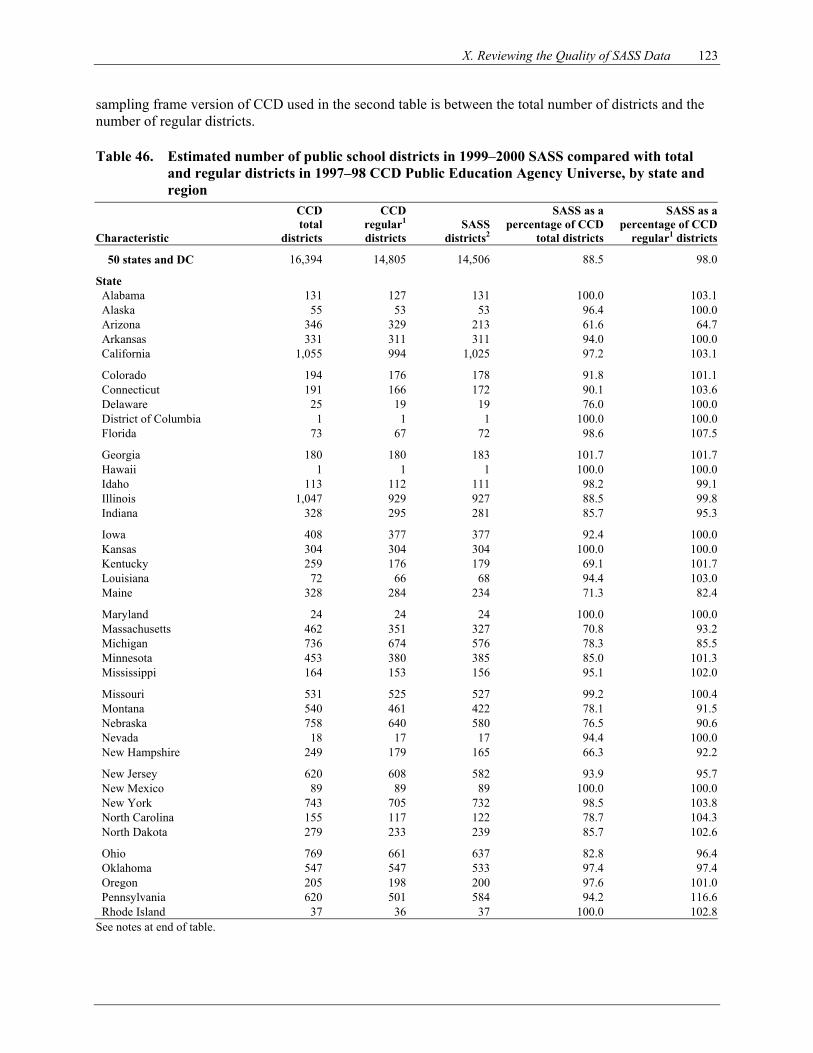
X. Reviewing the Quality of SASS Data 123
sampling frame version of CCD used in the second table is between the total number of districts and the number of regular districts.
Table 46. Estimated number of public school districts in 1999–2000 SASS compared with total and regular districts in 1997–98 CCD Public Education Agency Universe, by state and region
Characteristic
CCD total
districts
CCD regular1
districtsSASS
districts2
SASS as a percentage of CCD
total districts
SASS as a percentage of CCD
regular1 districts
50 states and DC 16,394 14,805 14,506 88.5 98.0
State Alabama 131 127 131 100.0 103.1Alaska 55 53 53 96.4 100.0Arizona 346 329 213 61.6 64.7Arkansas 331 311 311 94.0 100.0California 1,055 994 1,025 97.2 103.1
Colorado 194 176 178 91.8 101.1Connecticut 191 166 172 90.1 103.6Delaware 25 19 19 76.0 100.0District of Columbia 1 1 1 100.0 100.0Florida 73 67 72 98.6 107.5
Georgia 180 180 183 101.7 101.7Hawaii 1 1 1 100.0 100.0Idaho 113 112 111 98.2 99.1Illinois 1,047 929 927 88.5 99.8Indiana 328 295 281 85.7 95.3
Iowa 408 377 377 92.4 100.0Kansas 304 304 304 100.0 100.0Kentucky 259 176 179 69.1 101.7Louisiana 72 66 68 94.4 103.0Maine 328 284 234 71.3 82.4
Maryland 24 24 24 100.0 100.0Massachusetts 462 351 327 70.8 93.2Michigan 736 674 576 78.3 85.5Minnesota 453 380 385 85.0 101.3Mississippi 164 153 156 95.1 102.0
Missouri 531 525 527 99.2 100.4Montana 540 461 422 78.1 91.5Nebraska 758 640 580 76.5 90.6Nevada 18 17 17 94.4 100.0New Hampshire 249 179 165 66.3 92.2
New Jersey 620 608 582 93.9 95.7New Mexico 89 89 89 100.0 100.0New York 743 705 732 98.5 103.8North Carolina 155 117 122 78.7 104.3North Dakota 279 233 239 85.7 102.6
Ohio 769 661 637 82.8 96.4Oklahoma 547 547 533 97.4 97.4Oregon 205 198 200 97.6 101.0Pennsylvania 620 501 584 94.2 116.6Rhode Island 37 36 37 100.0 102.8
See notes at end of table.
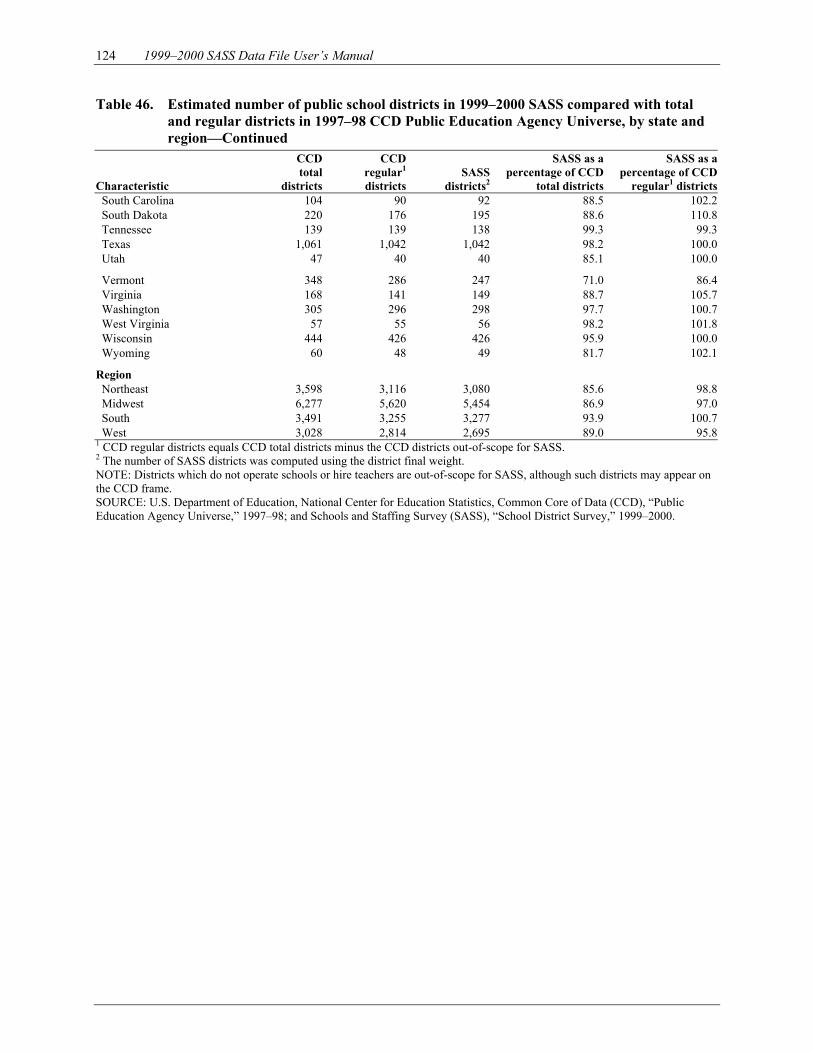
124 1999–2000 SASS Data File User’s Manual
Table 46. Estimated number of public school districts in 1999–2000 SASS compared with total and regular districts in 1997–98 CCD Public Education Agency Universe, by state and region—Continued
Characteristic
CCD total
districts
CCD regular1
districtsSASS
districts2
SASS as a percentage of CCD
total districts
SASS as a percentage of CCD
regular1 districtsSouth Carolina 104 90 92 88.5 102.2South Dakota 220 176 195 88.6 110.8Tennessee 139 139 138 99.3 99.3Texas 1,061 1,042 1,042 98.2 100.0Utah 47 40 40 85.1 100.0
Vermont 348 286 247 71.0 86.4Virginia 168 141 149 88.7 105.7Washington 305 296 298 97.7 100.7West Virginia 57 55 56 98.2 101.8Wisconsin 444 426 426 95.9 100.0Wyoming 60 48 49 81.7 102.1
Region Northeast 3,598 3,116 3,080 85.6 98.8Midwest 6,277 5,620 5,454 86.9 97.0South 3,491 3,255 3,277 93.9 100.7West 3,028 2,814 2,695 89.0 95.8
1 CCD regular districts equals CCD total districts minus the CCD districts out-of-scope for SASS. 2 The number of SASS districts was computed using the district final weight. NOTE: Districts which do not operate schools or hire teachers are out-of-scope for SASS, although such districts may appear on the CCD frame. SOURCE: U.S. Department of Education, National Center for Education Statistics, Common Core of Data (CCD), “Public Education Agency Universe,” 1997–98; and Schools and Staffing Survey (SASS), “School District Survey,” 1999–2000.
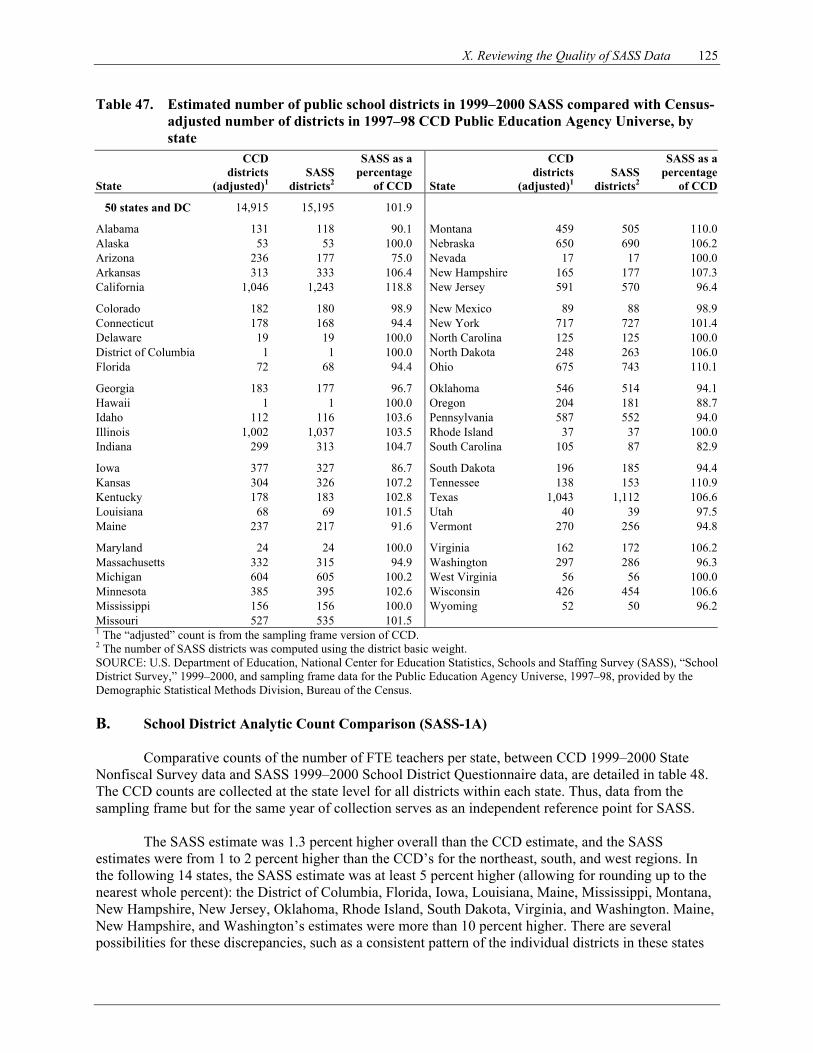
X. Reviewing the Quality of SASS Data 125
Table 47. Estimated number of public school districts in 1999–2000 SASS compared with Census-adjusted number of districts in 1997–98 CCD Public Education Agency Universe, by state
State
CCD districts
(adjusted)1 SASS
districts2
SASS as apercentage
of CCD State
CCD districts
(adjusted)1 SASS
districts2
SASS as apercentage
of CCD
50 states and DC 14,915 15,195 101.9
Alabama 131 118 90.1 Montana 459 505 110.0Alaska 53 53 100.0 Nebraska 650 690 106.2Arizona 236 177 75.0 Nevada 17 17 100.0Arkansas 313 333 106.4 New Hampshire 165 177 107.3California 1,046 1,243 118.8 New Jersey 591 570 96.4
Colorado 182 180 98.9 New Mexico 89 88 98.9Connecticut 178 168 94.4 New York 717 727 101.4Delaware 19 19 100.0 North Carolina 125 125 100.0District of Columbia 1 1 100.0 North Dakota 248 263 106.0Florida 72 68 94.4 Ohio 675 743 110.1
Georgia 183 177 96.7 Oklahoma 546 514 94.1Hawaii 1 1 100.0 Oregon 204 181 88.7Idaho 112 116 103.6 Pennsylvania 587 552 94.0Illinois 1,002 1,037 103.5 Rhode Island 37 37 100.0Indiana 299 313 104.7 South Carolina 105 87 82.9
Iowa 377 327 86.7 South Dakota 196 185 94.4Kansas 304 326 107.2 Tennessee 138 153 110.9Kentucky 178 183 102.8 Texas 1,043 1,112 106.6Louisiana 68 69 101.5 Utah 40 39 97.5Maine 237 217 91.6 Vermont 270 256 94.8
Maryland 24 24 100.0 Virginia 162 172 106.2Massachusetts 332 315 94.9 Washington 297 286 96.3Michigan 604 605 100.2 West Virginia 56 56 100.0Minnesota 385 395 102.6 Wisconsin 426 454 106.6Mississippi 156 156 100.0 Wyoming 52 50 96.2Missouri 527 535 101.5 1 The “adjusted” count is from the sampling frame version of CCD. 2 The number of SASS districts was computed using the district basic weight. SOURCE: U.S. Department of Education, National Center for Education Statistics, Schools and Staffing Survey (SASS), “School District Survey,” 1999–2000, and sampling frame data for the Public Education Agency Universe, 1997–98, provided by the Demographic Statistical Methods Division, Bureau of the Census. B. School District Analytic Count Comparison (SASS-1A) Comparative counts of the number of FTE teachers per state, between CCD 1999–2000 State Nonfiscal Survey data and SASS 1999–2000 School District Questionnaire data, are detailed in table 48. The CCD counts are collected at the state level for all districts within each state. Thus, data from the sampling frame but for the same year of collection serves as an independent reference point for SASS. The SASS estimate was 1.3 percent higher overall than the CCD estimate, and the SASS estimates were from 1 to 2 percent higher than the CCD’s for the northeast, south, and west regions. In the following 14 states, the SASS estimate was at least 5 percent higher (allowing for rounding up to the nearest whole percent): the District of Columbia, Florida, Iowa, Louisiana, Maine, Mississippi, Montana, New Hampshire, New Jersey, Oklahoma, Rhode Island, South Dakota, Virginia, and Washington. Maine, New Hampshire, and Washington’s estimates were more than 10 percent higher. There are several possibilities for these discrepancies, such as a consistent pattern of the individual districts in these states
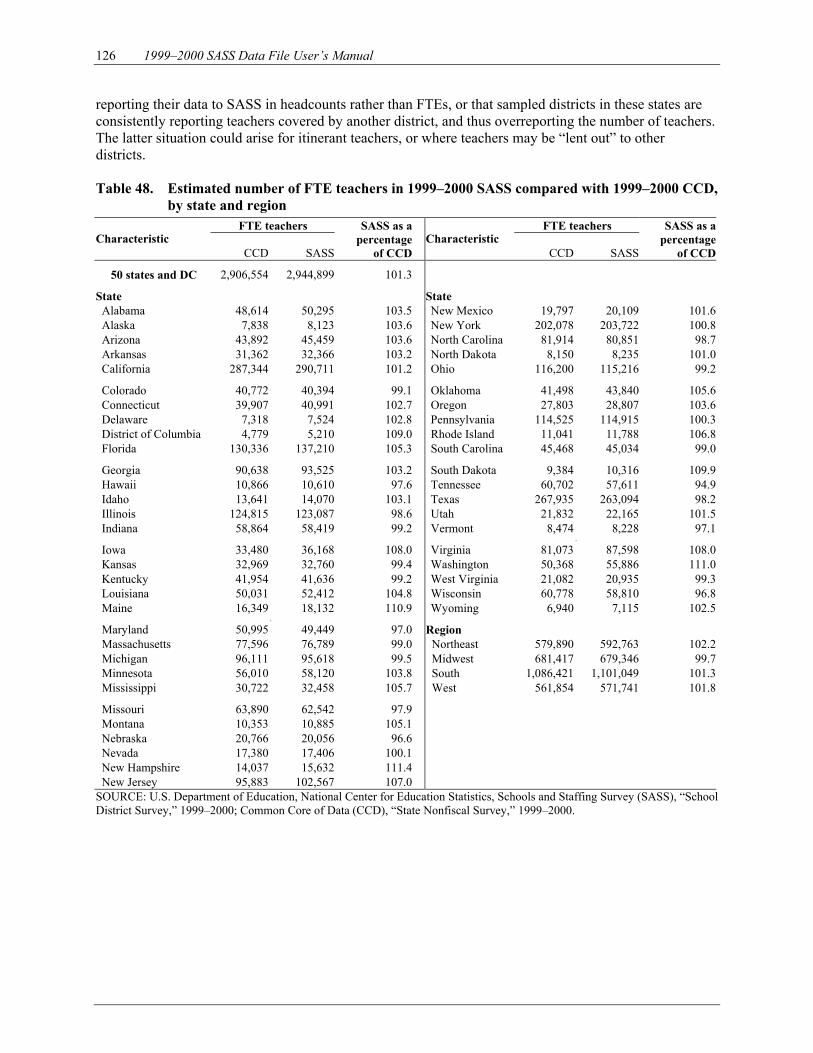
126 1999–2000 SASS Data File User’s Manual
reporting their data to SASS in headcounts rather than FTEs, or that sampled districts in these states are consistently reporting teachers covered by another district, and thus overreporting the number of teachers. The latter situation could arise for itinerant teachers, or where teachers may be “lent out” to other districts. Table 48. Estimated number of FTE teachers in 1999–2000 SASS compared with 1999–2000 CCD,
by state and region FTE teachers FTE teachers
Characteristic CCD SASS
SASS as a percentage
of CCD Characteristic
CCD SASS
SASS as a percentage
of CCD
50 states and DC 2,906,554 2,944,899 101.3
State State Alabama 48,614 50,295 103.5 New Mexico 19,797 20,109 101.6Alaska 7,838 8,123 103.6 New York 202,078 203,722 100.8Arizona 43,892 45,459 103.6 North Carolina 81,914 80,851 98.7Arkansas 31,362 32,366 103.2 North Dakota 8,150 8,235 101.0California 287,344 290,711 101.2 Ohio 116,200 115,216 99.2
Colorado 40,772 40,394 99.1 Oklahoma 41,498 43,840 105.6Connecticut 39,907 40,991 102.7 Oregon 27,803 28,807 103.6Delaware 7,318 7,524 102.8 Pennsylvania 114,525 114,915 100.3District of Columbia 4,779 5,210 109.0 Rhode Island 11,041 11,788 106.8Florida 130,336 137,210 105.3 South Carolina 45,468 45,034 99.0
Georgia 90,638 93,525 103.2 South Dakota 9,384 10,316 109.9Hawaii 10,866 10,610 97.6 Tennessee 60,702 57,611 94.9Idaho 13,641 14,070 103.1 Texas 267,935 263,094 98.2Illinois 124,815 123,087 98.6 Utah 21,832 22,165 101.5Indiana 58,864 58,419 99.2 Vermont 8,474 8,228 97.1 ,
Iowa 33,480 36,168 108.0 Virginia 81,073 87,598 108.0Kansas 32,969 32,760 99.4 Washington 50,368 55,886 111.0Kentucky 41,954 41,636 99.2 West Virginia 21,082 20,935 99.3Louisiana 50,031 52,412 104.8 Wisconsin 60,778 58,810 96.8Maine 16,349 18,132 110.9 Wyoming 6,940 7,115 102.5 ,
Maryland 50,995 49,449 97.0 Region Massachusetts 77,596 76,789 99.0 Northeast 579,890 592,763 102.2Michigan 96,111 95,618 99.5 Midwest 681,417 679,346 99.7Minnesota 56,010 58,120 103.8 South 1,086,421 1,101,049 101.3Mississippi 30,722 32,458 105.7 West 561,854 571,741 101.8
Missouri 63,890 62,542 97.9 Montana 10,353 10,885 105.1 Nebraska 20,766 20,056 96.6 Nevada 17,380 17,406 100.1 New Hampshire 14,037 15,632 111.4 New Jersey 95,883 102,567 107.0
SOURCE: U.S. Department of Education, National Center for Education Statistics, Schools and Staffing Survey (SASS), “School District Survey,” 1999–2000; Common Core of Data (CCD), “State Nonfiscal Survey,” 1999–2000.
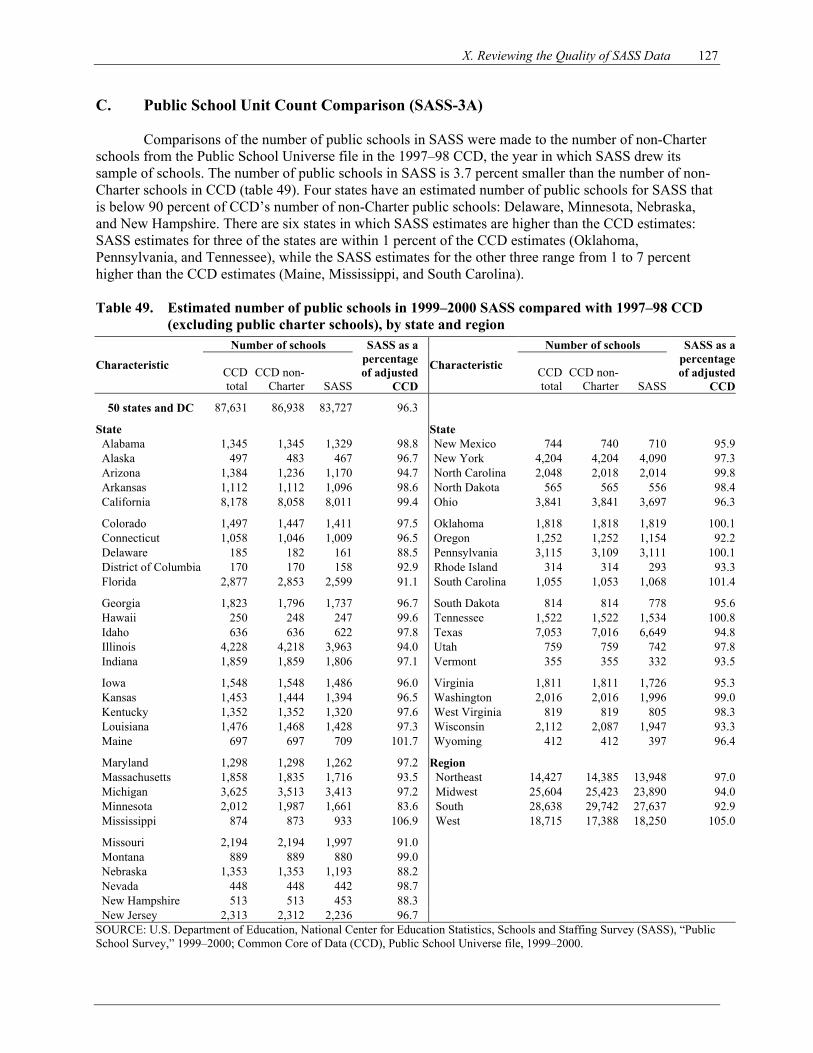
X. Reviewing the Quality of SASS Data 127
C. Public School Unit Count Comparison (SASS-3A)
Comparisons of the number of public schools in SASS were made to the number of non-Charter schools from the Public School Universe file in the 1997–98 CCD, the year in which SASS drew its sample of schools. The number of public schools in SASS is 3.7 percent smaller than the number of non-Charter schools in CCD (table 49). Four states have an estimated number of public schools for SASS that is below 90 percent of CCD’s number of non-Charter public schools: Delaware, Minnesota, Nebraska, and New Hampshire. There are six states in which SASS estimates are higher than the CCD estimates: SASS estimates for three of the states are within 1 percent of the CCD estimates (Oklahoma, Pennsylvania, and Tennessee), while the SASS estimates for the other three range from 1 to 7 percent higher than the CCD estimates (Maine, Mississippi, and South Carolina). Table 49. Estimated number of public schools in 1999–2000 SASS compared with 1997–98 CCD
(excluding public charter schools), by state and region Number of schools Number of schools
Characteristic CCD total
CCD non- Charter SASS
SASS as apercentageof adjusted
CCD
Characteristic CCD total
CCD non- Charter SASS
SASS as apercentageof adjusted
CCD
50 states and DC 87,631 86,938 83,727 96.3
State State Alabama 1,345 1,345 1,329 98.8 New Mexico 744 740 710 95.9Alaska 497 483 467 96.7 New York 4,204 4,204 4,090 97.3Arizona 1,384 1,236 1,170 94.7 North Carolina 2,048 2,018 2,014 99.8Arkansas 1,112 1,112 1,096 98.6 North Dakota 565 565 556 98.4California 8,178 8,058 8,011 99.4 Ohio 3,841 3,841 3,697 96.3
Colorado 1,497 1,447 1,411 97.5 Oklahoma 1,818 1,818 1,819 100.1Connecticut 1,058 1,046 1,009 96.5 Oregon 1,252 1,252 1,154 92.2Delaware 185 182 161 88.5 Pennsylvania 3,115 3,109 3,111 100.1District of Columbia 170 170 158 92.9 Rhode Island 314 314 293 93.3Florida 2,877 2,853 2,599 91.1 South Carolina 1,055 1,053 1,068 101.4
Georgia 1,823 1,796 1,737 96.7 South Dakota 814 814 778 95.6Hawaii 250 248 247 99.6 Tennessee 1,522 1,522 1,534 100.8Idaho 636 636 622 97.8 Texas 7,053 7,016 6,649 94.8Illinois 4,228 4,218 3,963 94.0 Utah 759 759 742 97.8Indiana 1,859 1,859 1,806 97.1 Vermont 355 355 332 93.5
Iowa 1,548 1,548 1,486 96.0 Virginia 1,811 1,811 1,726 95.3Kansas 1,453 1,444 1,394 96.5 Washington 2,016 2,016 1,996 99.0Kentucky 1,352 1,352 1,320 97.6 West Virginia 819 819 805 98.3Louisiana 1,476 1,468 1,428 97.3 Wisconsin 2,112 2,087 1,947 93.3Maine 697 697 709 101.7 Wyoming 412 412 397 96.4
Maryland 1,298 1,298 1,262 97.2 Region Massachusetts 1,858 1,835 1,716 93.5 Northeast 14,427 14,385 13,948 97.0Michigan 3,625 3,513 3,413 97.2 Midwest 25,604 25,423 23,890 94.0Minnesota 2,012 1,987 1,661 83.6 South 28,638 29,742 27,637 92.9Mississippi 874 873 933 106.9 West 18,715 17,388 18,250 105.0
Missouri 2,194 2,194 1,997 91.0 Montana 889 889 880 99.0 Nebraska 1,353 1,353 1,193 88.2 Nevada 448 448 442 98.7 New Hampshire 513 513 453 88.3 New Jersey 2,313 2,312 2,236 96.7
SOURCE: U.S. Department of Education, National Center for Education Statistics, Schools and Staffing Survey (SASS), “Public School Survey,” 1999–2000; Common Core of Data (CCD), Public School Universe file, 1999–2000.

128 1999–2000 SASS Data File User’s Manual
D. Public School Student Count Comparison (SASS-3A) Comparisons of the number of public school students in SASS were made to the concurrent year from the CCD State Nonfiscal Survey. Two comparisons were made, one to the CCD total number of students, and also to the CCD K–12 student count. The latter is the better comparison for SASS, as the SASS definition of students excludes prekindergarten (e.g., students in grades K–12 for schools that offer a 1st grade as well as kindergarten). While there are a few public schools included in CCD’s definition of K–12 that might not be eligible for SASS, in general most public kindergarten students would be eligible to be counted as a student for SASS, and therefore it does not make sense to exclude kindergartners from the student counts when making the comparison to CCD. Overall, the SASS student count is almost 4 percent lower than CCD’s total students, and just over 2 percent lower than CCD’s K–12 student count (table 50). There were slightly more than three-quarters of a million prekindergarten students included in CCD (751,173) in 1999–2000, and excluding them brings the SASS student count into a closer degree of “fit” than the SASS number of schools. However, excluding the prekindergarten students enlarges the amount of difference in those states for which SASS is higher than the CCD count, but in most cases it is only about a percentage point or two higher.
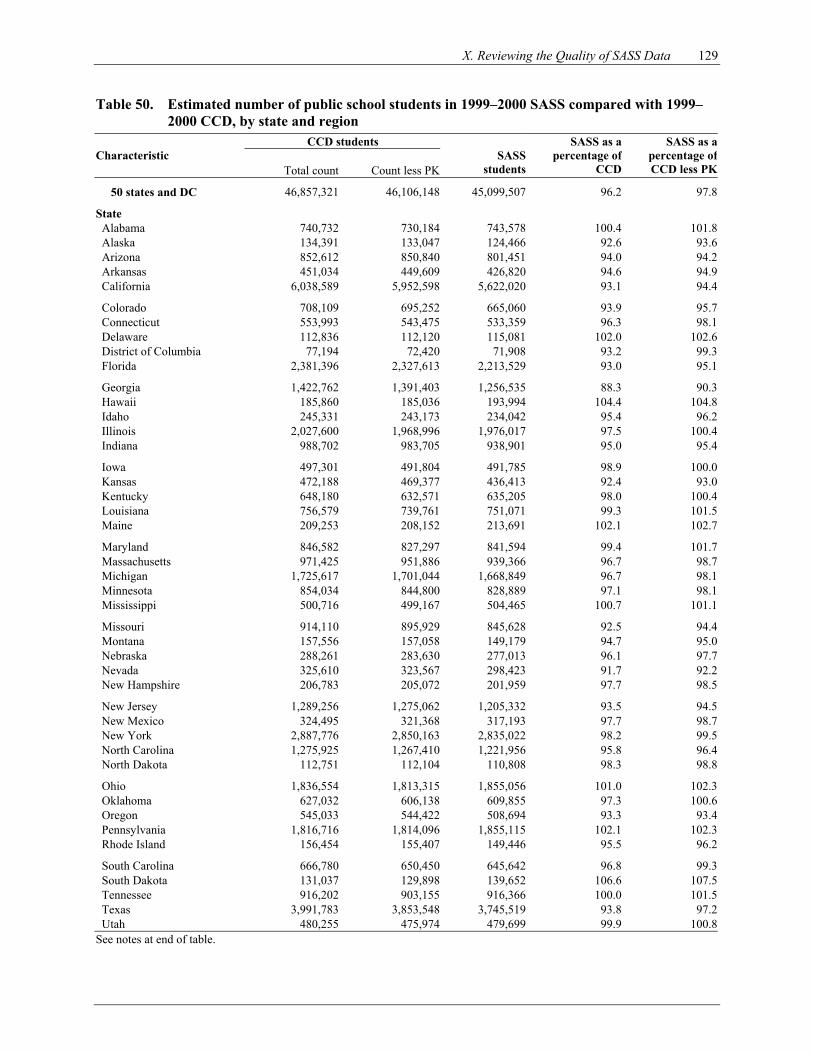
X. Reviewing the Quality of SASS Data 129
Table 50. Estimated number of public school students in 1999–2000 SASS compared with 1999–2000 CCD, by state and region
CCD students Characteristic
Total count Count less PKSASS
students
SASS as a percentage of
CCD
SASS as a percentage ofCCD less PK
50 states and DC 46,857,321 46,106,148 45,099,507 96.2 97.8
State Alabama 740,732 730,184 743,578 100.4 101.8Alaska 134,391 133,047 124,466 92.6 93.6Arizona 852,612 850,840 801,451 94.0 94.2Arkansas 451,034 449,609 426,820 94.6 94.9California 6,038,589 5,952,598 5,622,020 93.1 94.4
Colorado 708,109 695,252 665,060 93.9 95.7Connecticut 553,993 543,475 533,359 96.3 98.1Delaware 112,836 112,120 115,081 102.0 102.6District of Columbia 77,194 72,420 71,908 93.2 99.3Florida 2,381,396 2,327,613 2,213,529 93.0 95.1
Georgia 1,422,762 1,391,403 1,256,535 88.3 90.3Hawaii 185,860 185,036 193,994 104.4 104.8Idaho 245,331 243,173 234,042 95.4 96.2Illinois 2,027,600 1,968,996 1,976,017 97.5 100.4Indiana 988,702 983,705 938,901 95.0 95.4
Iowa 497,301 491,804 491,785 98.9 100.0Kansas 472,188 469,377 436,413 92.4 93.0Kentucky 648,180 632,571 635,205 98.0 100.4Louisiana 756,579 739,761 751,071 99.3 101.5Maine 209,253 208,152 213,691 102.1 102.7
Maryland 846,582 827,297 841,594 99.4 101.7Massachusetts 971,425 951,886 939,366 96.7 98.7Michigan 1,725,617 1,701,044 1,668,849 96.7 98.1Minnesota 854,034 844,800 828,889 97.1 98.1Mississippi 500,716 499,167 504,465 100.7 101.1
Missouri 914,110 895,929 845,628 92.5 94.4Montana 157,556 157,058 149,179 94.7 95.0Nebraska 288,261 283,630 277,013 96.1 97.7Nevada 325,610 323,567 298,423 91.7 92.2New Hampshire 206,783 205,072 201,959 97.7 98.5
New Jersey 1,289,256 1,275,062 1,205,332 93.5 94.5New Mexico 324,495 321,368 317,193 97.7 98.7New York 2,887,776 2,850,163 2,835,022 98.2 99.5North Carolina 1,275,925 1,267,410 1,221,956 95.8 96.4North Dakota 112,751 112,104 110,808 98.3 98.8
Ohio 1,836,554 1,813,315 1,855,056 101.0 102.3Oklahoma 627,032 606,138 609,855 97.3 100.6Oregon 545,033 544,422 508,694 93.3 93.4Pennsylvania 1,816,716 1,814,096 1,855,115 102.1 102.3Rhode Island 156,454 155,407 149,446 95.5 96.2
South Carolina 666,780 650,450 645,642 96.8 99.3South Dakota 131,037 129,898 139,652 106.6 107.5Tennessee 916,202 903,155 916,366 100.0 101.5Texas 3,991,783 3,853,548 3,745,519 93.8 97.2Utah 480,255 475,974 479,699 99.9 100.8
See notes at end of table.
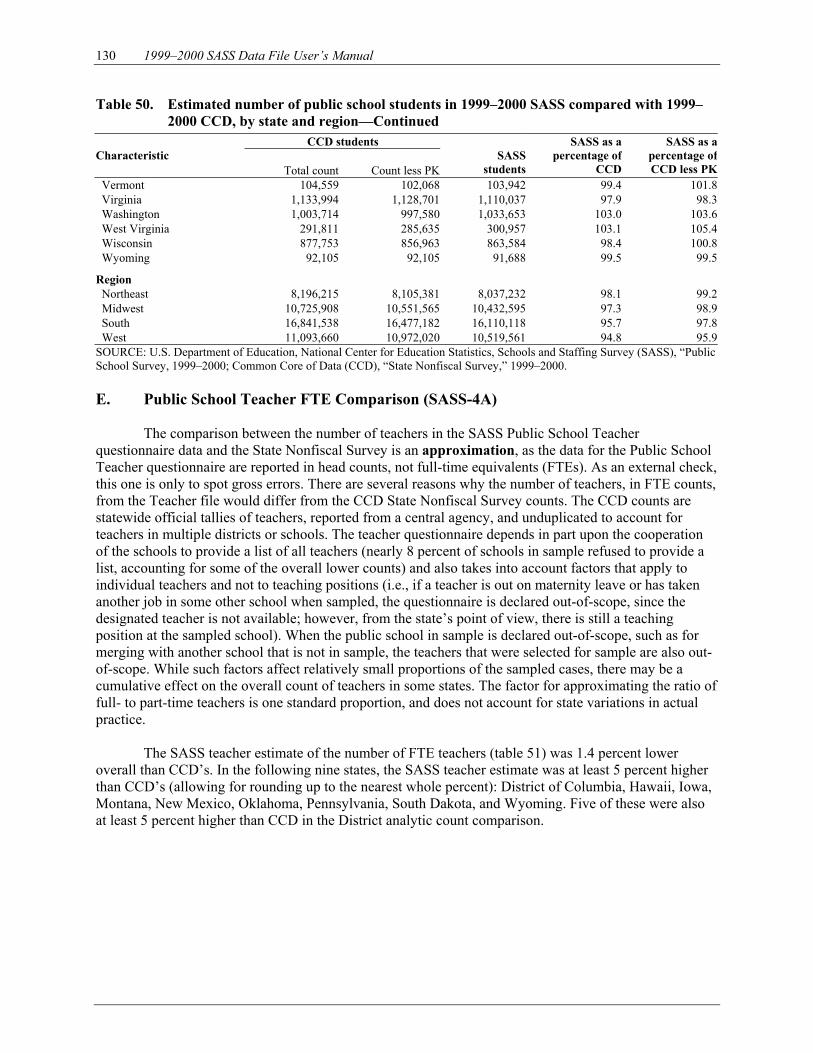
130 1999–2000 SASS Data File User’s Manual
Table 50. Estimated number of public school students in 1999–2000 SASS compared with 1999–2000 CCD, by state and region—Continued
CCD students Characteristic
Total count Count less PKSASS
students
SASS as a percentage of
CCD
SASS as a percentage ofCCD less PK
Vermont 104,559 102,068 103,942 99.4 101.8Virginia 1,133,994 1,128,701 1,110,037 97.9 98.3Washington 1,003,714 997,580 1,033,653 103.0 103.6West Virginia 291,811 285,635 300,957 103.1 105.4Wisconsin 877,753 856,963 863,584 98.4 100.8Wyoming 92,105 92,105 91,688 99.5 99.5
Region Northeast 8,196,215 8,105,381 8,037,232 98.1 99.2Midwest 10,725,908 10,551,565 10,432,595 97.3 98.9South 16,841,538 16,477,182 16,110,118 95.7 97.8West 11,093,660 10,972,020 10,519,561 94.8 95.9
SOURCE: U.S. Department of Education, National Center for Education Statistics, Schools and Staffing Survey (SASS), “Public School Survey, 1999–2000; Common Core of Data (CCD), “State Nonfiscal Survey,” 1999–2000. E. Public School Teacher FTE Comparison (SASS-4A) The comparison between the number of teachers in the SASS Public School Teacher questionnaire data and the State Nonfiscal Survey is an approximation, as the data for the Public School Teacher questionnaire are reported in head counts, not full-time equivalents (FTEs). As an external check, this one is only to spot gross errors. There are several reasons why the number of teachers, in FTE counts, from the Teacher file would differ from the CCD State Nonfiscal Survey counts. The CCD counts are statewide official tallies of teachers, reported from a central agency, and unduplicated to account for teachers in multiple districts or schools. The teacher questionnaire depends in part upon the cooperation of the schools to provide a list of all teachers (nearly 8 percent of schools in sample refused to provide a list, accounting for some of the overall lower counts) and also takes into account factors that apply to individual teachers and not to teaching positions (i.e., if a teacher is out on maternity leave or has taken another job in some other school when sampled, the questionnaire is declared out-of-scope, since the designated teacher is not available; however, from the state’s point of view, there is still a teaching position at the sampled school). When the public school in sample is declared out-of-scope, such as for merging with another school that is not in sample, the teachers that were selected for sample are also out-of-scope. While such factors affect relatively small proportions of the sampled cases, there may be a cumulative effect on the overall count of teachers in some states. The factor for approximating the ratio of full- to part-time teachers is one standard proportion, and does not account for state variations in actual practice. The SASS teacher estimate of the number of FTE teachers (table 51) was 1.4 percent lower overall than CCD’s. In the following nine states, the SASS teacher estimate was at least 5 percent higher than CCD’s (allowing for rounding up to the nearest whole percent): District of Columbia, Hawaii, Iowa, Montana, New Mexico, Oklahoma, Pennsylvania, South Dakota, and Wyoming. Five of these were also at least 5 percent higher than CCD in the District analytic count comparison.
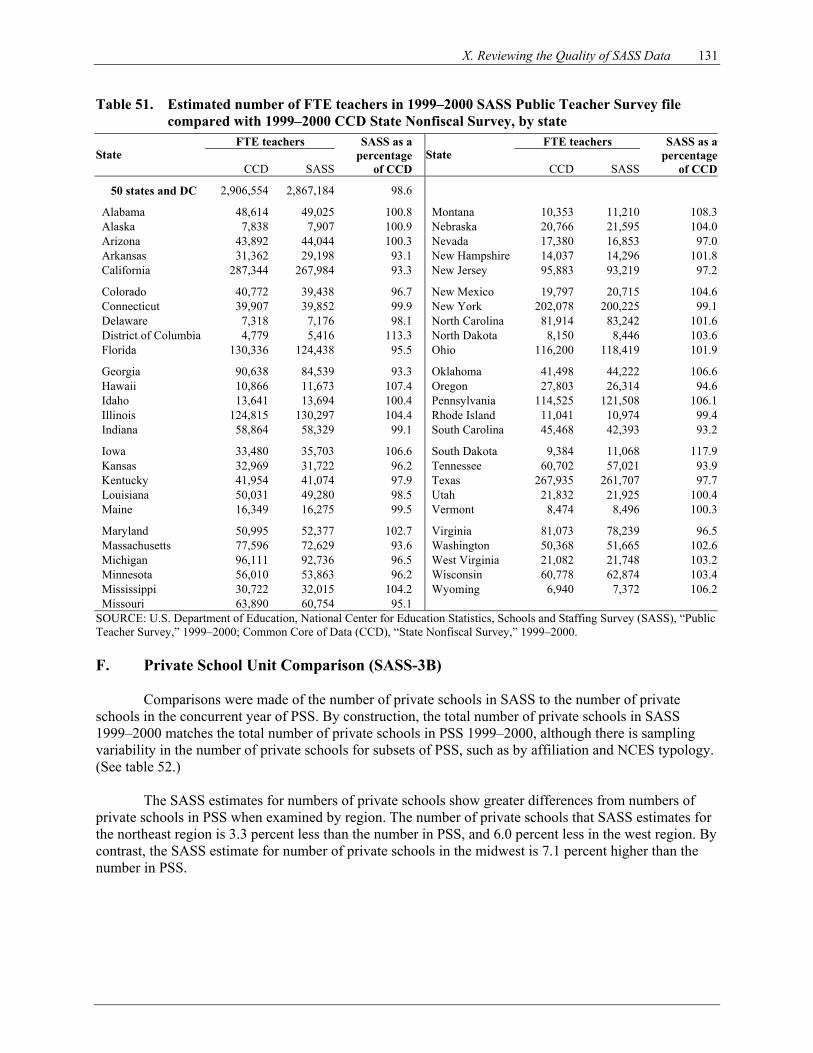
X. Reviewing the Quality of SASS Data 131
Table 51. Estimated number of FTE teachers in 1999–2000 SASS Public Teacher Survey file compared with 1999–2000 CCD State Nonfiscal Survey, by state
FTE teachers FTE teachers State
CCD SASS
SASS as apercentage
of CCD State
CCD SASS
SASS as apercentage
of CCD
50 states and DC 2,906,554 2,867,184 98.6
Alabama 48,614 49,025 100.8 Montana 10,353 11,210 108.3Alaska 7,838 7,907 100.9 Nebraska 20,766 21,595 104.0Arizona 43,892 44,044 100.3 Nevada 17,380 16,853 97.0Arkansas 31,362 29,198 93.1 New Hampshire 14,037 14,296 101.8California 287,344 267,984 93.3 New Jersey 95,883 93,219 97.2
Colorado 40,772 39,438 96.7 New Mexico 19,797 20,715 104.6Connecticut 39,907 39,852 99.9 New York 202,078 200,225 99.1Delaware 7,318 7,176 98.1 North Carolina 81,914 83,242 101.6District of Columbia 4,779 5,416 113.3 North Dakota 8,150 8,446 103.6Florida 130,336 124,438 95.5 Ohio 116,200 118,419 101.9
Georgia 90,638 84,539 93.3 Oklahoma 41,498 44,222 106.6Hawaii 10,866 11,673 107.4 Oregon 27,803 26,314 94.6Idaho 13,641 13,694 100.4 Pennsylvania 114,525 121,508 106.1Illinois 124,815 130,297 104.4 Rhode Island 11,041 10,974 99.4Indiana 58,864 58,329 99.1 South Carolina 45,468 42,393 93.2
Iowa 33,480 35,703 106.6 South Dakota 9,384 11,068 117.9Kansas 32,969 31,722 96.2 Tennessee 60,702 57,021 93.9Kentucky 41,954 41,074 97.9 Texas 267,935 261,707 97.7Louisiana 50,031 49,280 98.5 Utah 21,832 21,925 100.4Maine 16,349 16,275 99.5 Vermont 8,474 8,496 100.3
Maryland 50,995 52,377 102.7 Virginia 81,073 78,239 96.5Massachusetts 77,596 72,629 93.6 Washington 50,368 51,665 102.6Michigan 96,111 92,736 96.5 West Virginia 21,082 21,748 103.2Minnesota 56,010 53,863 96.2 Wisconsin 60,778 62,874 103.4Mississippi 30,722 32,015 104.2 Wyoming 6,940 7,372 106.2Missouri 63,890 60,754 95.1
SOURCE: U.S. Department of Education, National Center for Education Statistics, Schools and Staffing Survey (SASS), “Public Teacher Survey,” 1999–2000; Common Core of Data (CCD), “State Nonfiscal Survey,” 1999–2000. F. Private School Unit Comparison (SASS-3B)
Comparisons were made of the number of private schools in SASS to the number of private schools in the concurrent year of PSS. By construction, the total number of private schools in SASS 1999–2000 matches the total number of private schools in PSS 1999–2000, although there is sampling variability in the number of private schools for subsets of PSS, such as by affiliation and NCES typology. (See table 52.)
The SASS estimates for numbers of private schools show greater differences from numbers of
private schools in PSS when examined by region. The number of private schools that SASS estimates for the northeast region is 3.3 percent less than the number in PSS, and 6.0 percent less in the west region. By contrast, the SASS estimate for number of private schools in the midwest is 7.1 percent higher than the number in PSS.
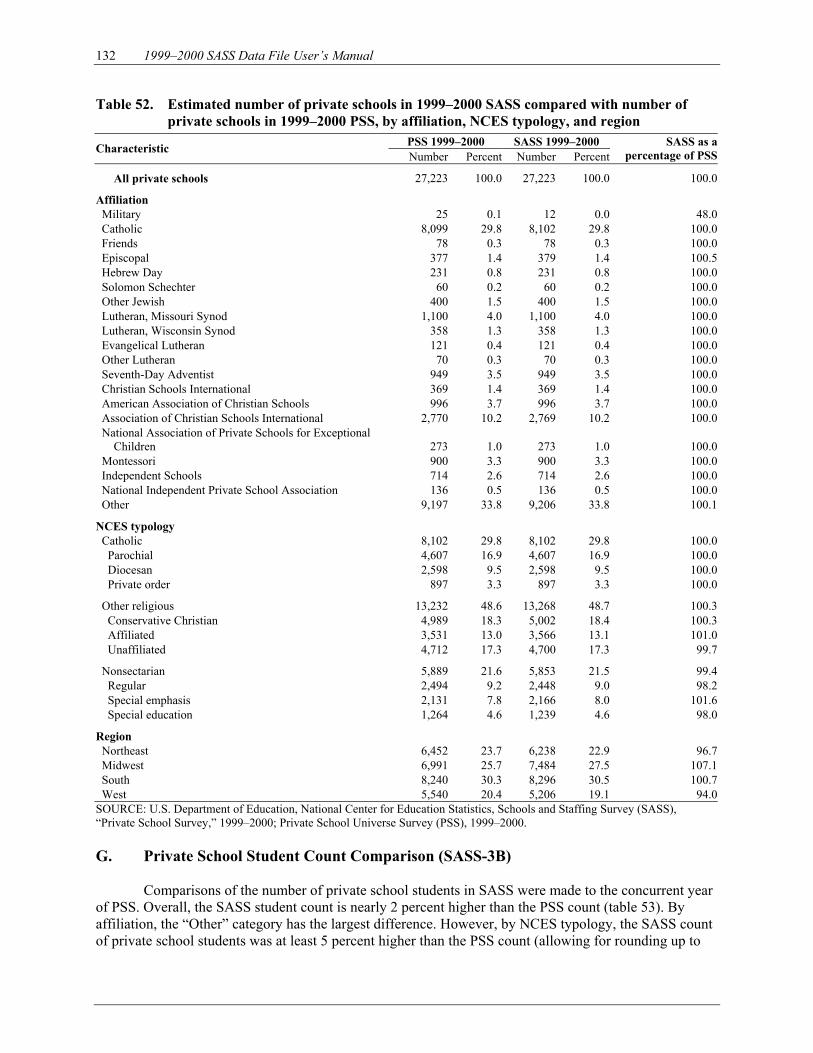
132 1999–2000 SASS Data File User’s Manual
Table 52. Estimated number of private schools in 1999–2000 SASS compared with number of private schools in 1999–2000 PSS, by affiliation, NCES typology, and region
PSS 1999–2000 SASS 1999–2000 Characteristic Number Percent Number Percent
SASS as apercentage of PSS
All private schools 27,223 100.0 27,223 100.0 100.0
Affiliation Military 25 0.1 12 0.0 48.0Catholic 8,099 29.8 8,102 29.8 100.0Friends 78 0.3 78 0.3 100.0Episcopal 377 1.4 379 1.4 100.5Hebrew Day 231 0.8 231 0.8 100.0Solomon Schechter 60 0.2 60 0.2 100.0Other Jewish 400 1.5 400 1.5 100.0Lutheran, Missouri Synod 1,100 4.0 1,100 4.0 100.0Lutheran, Wisconsin Synod 358 1.3 358 1.3 100.0Evangelical Lutheran 121 0.4 121 0.4 100.0Other Lutheran 70 0.3 70 0.3 100.0Seventh-Day Adventist 949 3.5 949 3.5 100.0Christian Schools International 369 1.4 369 1.4 100.0American Association of Christian Schools 996 3.7 996 3.7 100.0Association of Christian Schools International 2,770 10.2 2,769 10.2 100.0National Association of Private Schools for Exceptional
Children 273 1.0 273 1.0 100.0Montessori 900 3.3 900 3.3 100.0Independent Schools 714 2.6 714 2.6 100.0National Independent Private School Association 136 0.5 136 0.5 100.0Other 9,197 33.8 9,206 33.8 100.1
NCES typology Catholic 8,102 29.8 8,102 29.8 100.0Parochial 4,607 16.9 4,607 16.9 100.0Diocesan 2,598 9.5 2,598 9.5 100.0Private order 897 3.3 897 3.3 100.0
Other religious 13,232 48.6 13,268 48.7 100.3Conservative Christian 4,989 18.3 5,002 18.4 100.3Affiliated 3,531 13.0 3,566 13.1 101.0Unaffiliated 4,712 17.3 4,700 17.3 99.7
Nonsectarian 5,889 21.6 5,853 21.5 99.4Regular 2,494 9.2 2,448 9.0 98.2Special emphasis 2,131 7.8 2,166 8.0 101.6Special education 1,264 4.6 1,239 4.6 98.0
Region Northeast 6,452 23.7 6,238 22.9 96.7Midwest 6,991 25.7 7,484 27.5 107.1South 8,240 30.3 8,296 30.5 100.7West 5,540 20.4 5,206 19.1 94.0
SOURCE: U.S. Department of Education, National Center for Education Statistics, Schools and Staffing Survey (SASS), “Private School Survey,” 1999–2000; Private School Universe Survey (PSS), 1999–2000. G. Private School Student Count Comparison (SASS-3B) Comparisons of the number of private school students in SASS were made to the concurrent year of PSS. Overall, the SASS student count is nearly 2 percent higher than the PSS count (table 53). By affiliation, the “Other” category has the largest difference. However, by NCES typology, the SASS count of private school students was at least 5 percent higher than the PSS count (allowing for rounding up to
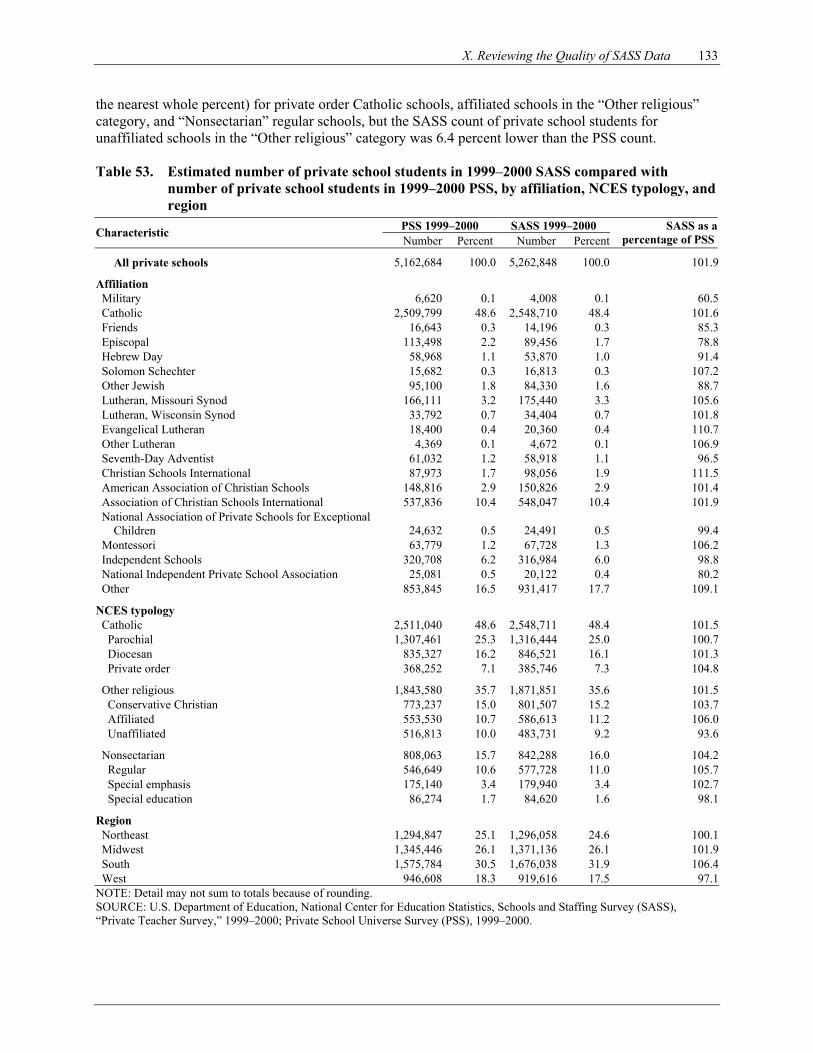
X. Reviewing the Quality of SASS Data 133
the nearest whole percent) for private order Catholic schools, affiliated schools in the “Other religious” category, and “Nonsectarian” regular schools, but the SASS count of private school students for unaffiliated schools in the “Other religious” category was 6.4 percent lower than the PSS count. Table 53. Estimated number of private school students in 1999–2000 SASS compared with
number of private school students in 1999–2000 PSS, by affiliation, NCES typology, and region
PSS 1999–2000 SASS 1999–2000 Characteristic Number Percent Number Percent
SASS as a percentage of PSS
All private schools 5,162,684 100.0 5,262,848 100.0 101.9
Affiliation Military 6,620 0.1 4,008 0.1 60.5Catholic 2,509,799 48.6 2,548,710 48.4 101.6Friends 16,643 0.3 14,196 0.3 85.3Episcopal 113,498 2.2 89,456 1.7 78.8Hebrew Day 58,968 1.1 53,870 1.0 91.4Solomon Schechter 15,682 0.3 16,813 0.3 107.2Other Jewish 95,100 1.8 84,330 1.6 88.7Lutheran, Missouri Synod 166,111 3.2 175,440 3.3 105.6Lutheran, Wisconsin Synod 33,792 0.7 34,404 0.7 101.8Evangelical Lutheran 18,400 0.4 20,360 0.4 110.7Other Lutheran 4,369 0.1 4,672 0.1 106.9Seventh-Day Adventist 61,032 1.2 58,918 1.1 96.5Christian Schools International 87,973 1.7 98,056 1.9 111.5American Association of Christian Schools 148,816 2.9 150,826 2.9 101.4Association of Christian Schools International 537,836 10.4 548,047 10.4 101.9National Association of Private Schools for Exceptional
Children 24,632 0.5 24,491 0.5 99.4Montessori 63,779 1.2 67,728 1.3 106.2Independent Schools 320,708 6.2 316,984 6.0 98.8National Independent Private School Association 25,081 0.5 20,122 0.4 80.2Other 853,845 16.5 931,417 17.7 109.1
NCES typology Catholic 2,511,040 48.6 2,548,711 48.4 101.5Parochial 1,307,461 25.3 1,316,444 25.0 100.7Diocesan 835,327 16.2 846,521 16.1 101.3Private order 368,252 7.1 385,746 7.3 104.8
Other religious 1,843,580 35.7 1,871,851 35.6 101.5Conservative Christian 773,237 15.0 801,507 15.2 103.7Affiliated 553,530 10.7 586,613 11.2 106.0Unaffiliated 516,813 10.0 483,731 9.2 93.6
Nonsectarian 808,063 15.7 842,288 16.0 104.2Regular 546,649 10.6 577,728 11.0 105.7Special emphasis 175,140 3.4 179,940 3.4 102.7Special education 86,274 1.7 84,620 1.6 98.1
Region Northeast 1,294,847 25.1 1,296,058 24.6 100.1Midwest 1,345,446 26.1 1,371,136 26.1 101.9South 1,575,784 30.5 1,676,038 31.9 106.4West 946,608 18.3 919,616 17.5 97.1
NOTE: Detail may not sum to totals because of rounding. SOURCE: U.S. Department of Education, National Center for Education Statistics, Schools and Staffing Survey (SASS), “Private Teacher Survey,” 1999–2000; Private School Universe Survey (PSS), 1999–2000.
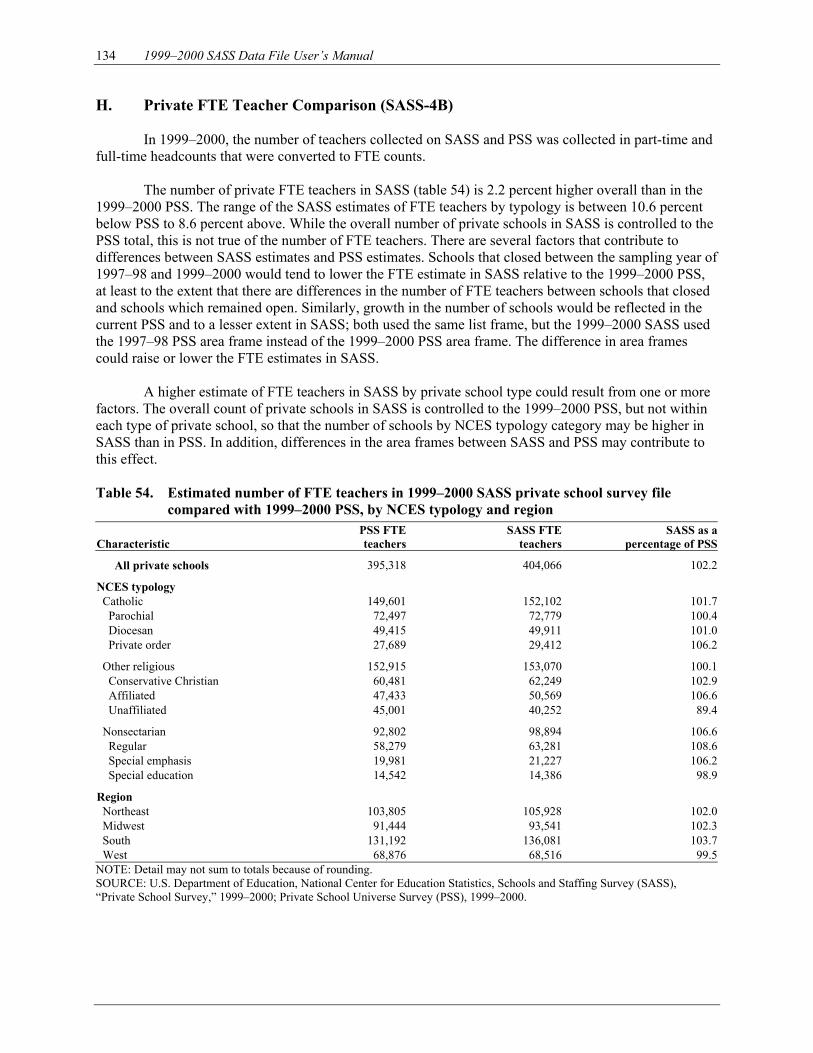
134 1999–2000 SASS Data File User’s Manual
H. Private FTE Teacher Comparison (SASS-4B) In 1999–2000, the number of teachers collected on SASS and PSS was collected in part-time and full-time headcounts that were converted to FTE counts. The number of private FTE teachers in SASS (table 54) is 2.2 percent higher overall than in the 1999–2000 PSS. The range of the SASS estimates of FTE teachers by typology is between 10.6 percent below PSS to 8.6 percent above. While the overall number of private schools in SASS is controlled to the PSS total, this is not true of the number of FTE teachers. There are several factors that contribute to differences between SASS estimates and PSS estimates. Schools that closed between the sampling year of 1997–98 and 1999–2000 would tend to lower the FTE estimate in SASS relative to the 1999–2000 PSS, at least to the extent that there are differences in the number of FTE teachers between schools that closed and schools which remained open. Similarly, growth in the number of schools would be reflected in the current PSS and to a lesser extent in SASS; both used the same list frame, but the 1999–2000 SASS used the 1997–98 PSS area frame instead of the 1999–2000 PSS area frame. The difference in area frames could raise or lower the FTE estimates in SASS. A higher estimate of FTE teachers in SASS by private school type could result from one or more factors. The overall count of private schools in SASS is controlled to the 1999–2000 PSS, but not within each type of private school, so that the number of schools by NCES typology category may be higher in SASS than in PSS. In addition, differences in the area frames between SASS and PSS may contribute to this effect. Table 54. Estimated number of FTE teachers in 1999–2000 SASS private school survey file
compared with 1999–2000 PSS, by NCES typology and region
Characteristic PSS FTEteachers
SASS FTEteachers
SASS as apercentage of PSS
All private schools 395,318 404,066 102.2
NCES typology Catholic 149,601 152,102 101.7Parochial 72,497 72,779 100.4Diocesan 49,415 49,911 101.0Private order 27,689 29,412 106.2
Other religious 152,915 153,070 100.1Conservative Christian 60,481 62,249 102.9Affiliated 47,433 50,569 106.6Unaffiliated 45,001 40,252 89.4
Nonsectarian 92,802 98,894 106.6Regular 58,279 63,281 108.6Special emphasis 19,981 21,227 106.2Special education 14,542 14,386 98.9
Region Northeast 103,805 105,928 102.0Midwest 91,444 93,541 102.3South 131,192 136,081 103.7West 68,876 68,516 99.5
NOTE: Detail may not sum to totals because of rounding. SOURCE: U.S. Department of Education, National Center for Education Statistics, Schools and Staffing Survey (SASS), “Private School Survey,” 1999–2000; Private School Universe Survey (PSS), 1999–2000.

X. Reviewing the Quality of SASS Data 135
I. Response Variance
A reinterview study has been conducted for each SASS administration. Reinterview programs are typically designed to evaluate fieldwork and/or estimate error components, such as simple response variance and response bias, in a survey model (Forsman and Schreiner 1991). The purpose of the SASS reinterview programs was to estimate simple response variance; that is, to measure the consistency in response between the original survey and the reinterview (reliability of the data) for certain questions considered critical to the survey or suspected to be problematic. High response variance (inconsistency) indicates there is a problem with the design of the question or the nature of the data being collected. It also can often indicate the presence of bias in the data. However, while reinterview studies allow the detection of problems in the questions, they usually cannot identify causes of response error or correct the problems. The 1999–2000 SASS reinterview program consisted of administering a subset of questions to a subset of public and private schools and public and private school teachers.
This section summarizes material from Response Variance in the 1999–2000 Schools and Staffing
Survey, by Sharon Ennis and David Miller, Quality Assurance and Evaluation Branch, Demographic Statistical Methods Division, U.S. Census Bureau. See appendix H for the full report.
1. Content of Reinterview Questionnaires
The Public School Reinterview Questionnaire (SASS-3A(R)) collected information on 95
questions from the Public School Questionnaire. Included in those were general information items concerning percentage of students absent, average daily attendance, and school capacity; admissions and performance items on requirements for admission and uses of district performance reports; students and class organization items on curriculum options and school organization; parent involvement and school safety items; technology items on the number of computers, internet access, and computer/technical support staff; special programs and services items on Title 1, Individual Education Plans, limited-English proficient students, and migrant students.
The Private School Reinterview Questionnaire (SASS-3B(R)) collected information on
81 questions from the Private School Questionnaire. The items included were essentially the same as those in the Public School Reinterview Questionnaire, excluding the items on district performance reports and migrant students.
The Teacher Reinterview Questionnaire (SASS-4(R)) collected information on 57
questions from the Teacher Questionnaire. Included in those were teaching experience items on main teaching assignment, first year of teaching, and preparation for teaching; professional development items on various professional development activities and their impact; resources and assessment of students items on different types of students and the resources provided for teaching them; working conditions items on safety at the teacher’s current school; and decision making items on the teachers’ perceptions of various issues about teaching. 2. Procedures
The reinterview sample for each of the SASS surveys was a random subsample of that
survey’s full sample. The sample included only those cases originally conducted by mail in order to match the original interview and reinterview modes. The reinterview response rate was 75.1 percent for the school sample and 70.5 percent for the teacher sample.

136 1999–2000 SASS Data File User’s Manual
The response error reinterview model assumed the reinterview was an independent replication of the original interview. The index of inconsistency and the gross difference rate were the principal measures of response variance in categorical data. Pearson’s correlation coefficient provided a measure of data reliability for continuous variables. (In some cases where questions in the 1999–2000 SASS were asked in previous administrations of SASS, the 1993–94 reinterview results were given for comparison.)
3. Major Findings
Of the 95 questions evaluated from the Public School Questionnaire, 42 percent
displayed high response variance, suggesting poor reliability. Response variance was moderate for 45 percent of the questions analyzed and low for 13 percent.
Of the 81 questions analyzed from the Private School Survey, 33 percent displayed high
response variance, indicating that the responses were unreliable. Response variance was moderate for 47 percent of the questions analyzed and low for 20 percent.
For public school teachers, 44 percent of the 57 questions displayed high response
variance, suggesting problems with reliability. There was moderate response variance for 42 percent of the questions analyzed and low response variance for 14 percent.
For private school teachers, 26 percent of the 57 questions displayed high response
variance, 54 percent displayed moderate response variance, and 18 percent displayed low response variance.

137
XI. Restricted-Use vs. Public-Use Data Files A. Restricted-Use Data Restricted-use data files contain individually identifiable information, which is confidential and protected by law. While the restricted-use versions of SASS data do not include direct identifiers, such as the respondent’s name, on the files, the restricted-use versions do feature more indirect variables that could identify individuals, such as linkages to other datasets, which could provide the name of the school. Restricted-use data files also allow researchers to perform analyses at the micro level that are not possible with public-use data. For example, with restricted-use data files, researchers can examine the state level data for public elementary and secondary schools and teachers, and the private school affiliation level data for private schools and teachers.
1. How to Get Restricted-Use Data Files
Researchers who can demonstrate a need for more detailed information may request access to the restricted-use datasets containing identification codes that facilitate linkage between survey components for statistical research purposes, provided that they follow computer security requirements and fill out an Affidavit of Nondisclosure. (See section XI.C, File Linkage Within SASS.) State-level or affiliation-level analyses are only possible with the restricted-use data files. Researchers requesting access to the restricted-use datasets must obtain a license to use those data by providing the following information: • The title of the survey(s) to which access is desired; • A detailed discussion of the statistical research project which necessitates accessing the
NCES survey; • The name of the principal project officer at the institution who will be heading up the
research effort and who will enforce the legal provisions of the license agreement; • The number, name(s), and job title(s) of professional and technical staff, including
graduate students, who will be accessing the survey dataset; and • The estimated loan period necessary for accessing the NCES survey dataset.
Return all of the above information to:
Data Security Office Statistical Standards Group National Center for Education Statistics 1990 K Street NW, Room 9060 Washington, DC 20006
All of these procedures are detailed in the NCES Restricted-Use Data Procedures
Manual, available for download at http://nces.ed.gov/statprog/confid6.asp. After reviewing the access request, the Commissioner will inform the requestor whether a
license to use the restricted data has been approved.
138 1999–2000 SASS Data File User’s Manual
Requestors and/or institutions that violate the agreement are subject to a fine of not more than $250,000 (under the provisions of 18 U.S.C. 3559 and 3571) or imprisonment for not more than 5 years, or both. The confidentiality provisions that NCES must follow by law can be found at http://nces.ed.gov/statprog. 2. Treatment of Public Charter Schools and BIA Schools
The number of charter schools had increased measurably since the 1993–94 SASS, so it was decided that the 1999–2000 SASS would include public charter schools. The goal was to survey all public charter schools known to be operational in 1998–99 and still operating in 1999–2000. When a public charter school was selected, the sample file had information about whether the public charter was part of the LEA or was under the authority of a chartering agency. Public charter schools operating under the jurisdiction of the LEA followed the procedure for traditional public schools. Public charter schools that were their own school district or that were under another type of chartering agency filled out a school questionnaire that had the district items included (data on salary schedules and hiring policies, for example).
Public charter school records were excluded from the public-use data files, as public
charter schools are more easily identifiable than public schools in general. The data records for BIA schools, principals, and teachers were handled according to the
following decisions: • BIA schools operated by an LEA and reported on the CCD were administered Public
School, Public Principal, and Public School Teacher Questionnaires, but flagged on the file as a BIA school, since those schools also were on the BIA Directory.
• BIA schools operated as public charter schools were administered Public Charter School, Public Charter School Principal, and Public Charter School Teacher Questionnaires but flagged on the file as BIA schools, since those schools were also from the public charter school frame.
• BIA schools that were either operated directly by BIA or through a tribal agency but not as traditional public or public charter schools were administered the Indian School, Indian School Principal, and the Indian School Teacher Questionnaires and also flagged on the file as BIA schools.
The second and third type of BIA schools were excluded from the public-use data files,
as BIA schools are more easily identifiable than public schools in general. The BIA flags are only found on the restricted-use version of the datasets.
B. Public-Use Data NCES uses the term “public-use data” for survey data when the individually identifiable information has been coded or deleted to protect the confidentiality of survey respondents. The public-use versions of SASS data do not include direct identifiers, such as the respondent’s name, on the files. The public-use data files do not contain state codes either, but public-use data can be used for analyses at the national level or by Census region.
The 1999–2000 SASS data are released in accordance with the provisions of the amended National Education Statistics Act of 1994 (20 U.S.C. 9017), the General Education Provisions Act (GEPA) (20 U.S.C. 1221 e-l) and the Carl D. Perkins Vocational Education Act.
XI. Restricted-Use vs. Public-Use Data Files 139
Under the provisions of Section 183 of the Education Sciences Reform Act of 2002, Public Law 107–279 (20 U.S.C. 9873), NCES is responsible for protecting the confidentiality of individual respondents and releases data (CD-ROMs) for statistical purposes only. Record matching or deductive disclosure by any user is prohibited by federal law. To ensure that the confidentiality provisions contained in Public Law 107–279 have been fully implemented, procedures for disclosure avoidance were used in preparing the public-use version of the data for release. Every effort has been made to provide the maximum research information that is consistent with reasonable confidentiality protections for individually-identifiable data.
The public-use version of the data is made available in an abridged form to researchers and the general public. State names or codes and the most detailed geographic descriptors of community size (locale codes 1–8) were deleted. Any individually-identifiable data (such as exact age or salary) that could be used to identify specific schools, principals, or teachers were categorized or recoded for the public-use version of the data. Researchers who meet a set of qualifications described in section XI.A.1 may receive the right to use restricted-use data containing identification codes that provide more detailed information for statistical research purposes.
1. How to Get Public-Use Data Files
All NCES public-use data files can be accessed (at no cost) from the NCES website. Public-use CD-ROMs are also available through ED Pubs, as long as supplies last. Orders can be placed with ED Pubs through the ED Pubs website at http://www.edpubs.org or by calling (877) 4–EDPubs or (877) 433-7827.
2. Public-Use Data Files
The public-use data files were edited using the following procedures and principles:
• Respondent control numbers with embedded case information were scrambled to remove individually-identifiable information but retain linking properties;
• Sampling frame and administration variables with individually-identifiable information were deleted; and
• Survey variables with information that might lead to the identification of an individual were recoded to prevent disclosures or, if necessary, deleted.
The School District file for public schools was separated into two parts: 1) demographic
information; and 2) teacher demand and shortage data and district policy information. The demographic data are contained on a separate file that cannot be linked to other data files and contain data that did not require recoding or masking for confidentiality reasons. The district policy information was attached to school records and, thus, allows linkage with school, principal, and teacher information. (See section XI.C, File Linkage Within SASS.)
The private school 3-level typology variable categories are based on methodological work completed at NCES. The three categories are Catholic, Other Religious, and Nonsectarian. Information on the rationale for the development of the typology can be found in the technical report called Diversity of Private Schools (McMillen and Benson 1991). The original, specific affiliation identifiers were removed and each school was recoded according to the typology.
On the School, Principal, and Teacher files, continuous variables that would permit
disclosure of school, teacher, or principal identity have been collapsed into categories. For

140 1999–2000 SASS Data File User’s Manual
example, salary and age on the Principal and Teacher files were categorized as well as top and bottom-coded. On the School file, average daily attendance, number of LEP students, and percent minority enrollment were put into discrete categories.
Disclosure risk analysis was used to determine the number and size of categories for the
number of teachers, number of students, minority enrollment, and urbanicity on the School, Principal, and Teacher files. The new categories are defined for the appropriate source codes on the file record layouts.
The public-use file was also edited to address concerns regarding the possible disclosure
of individual data by persons with detailed knowledge about a responding school. To alleviate this concern, an undisclosed number of variables on the Teacher and Principal files were identified on a subset of cases and masked so that an individual with detailed knowledge about a school attempting to identify a respondent’s data cannot be certain that they have succeeded in their endeavor.
As indicated above, public charter school records and the records for BIA schools
operated as public charter schools and BIA schools that were either operated directly by BIA or through a tribal agency were excluded from the public-use data files, as these schools are more easily identifiable than public schools in general.
C. File Linkage Within SASS
When each school was selected for the school sample, its principal or headmaster was also
selected for the principal sample, along with a sample of teachers at that school who received the Teacher Questionnaire. For public, private, and BIA schools, a staff member who was responsible for the school library, if any, was also included in the sample for the Library Media Center Questionnaire. (For public charter schools, a subset of questions about the library was included on the school questionnaire.) For public schools, the school district, or LEA, with jurisdiction over the sample school was selected for the district sample.
On the restricted-use and public-use files, any combination of the school, principal, and teacher
datasets within each available SASS school sector can be merged using the school control number (SCHCNTL). The library datasets are available in the restricted-use version only, but they also can be merged with the school, principal, and teacher datasets using the school control number (SCHCNTL). The school control number is present on all of these files and will link them together.
The public teacher, school, principal, and library datasets may be merged with the district dataset on the restricted-use version only. While the public school district dataset is available in the public-use version, it is not possible to merge it with respondents on the other datasets. However, some district information has been appended to the record of each public school whose district also returned a questionnaire on the public-use records.
Sample SAS and SPSS syntax for merging files and for attaching variable labels is included in the sections below. Table 55 provides the number of missing cases in combined SASS restricted-use datasets. The surveys that are included on public-use datasets are shaded.
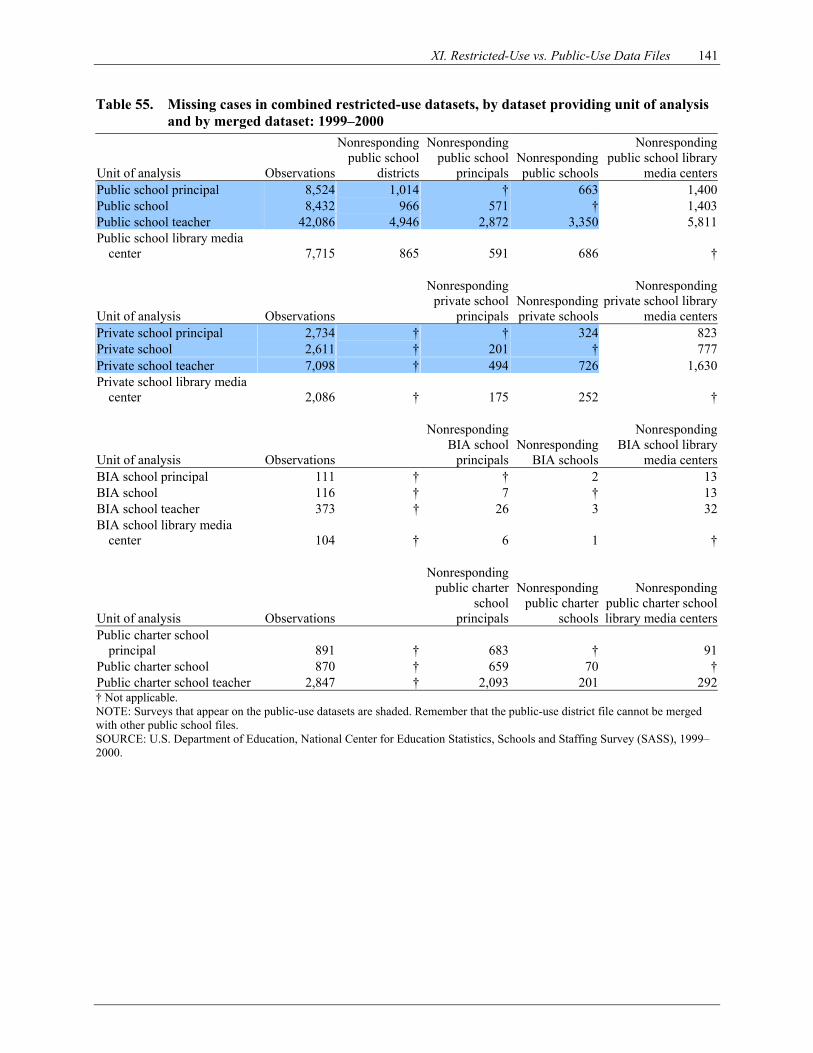
XI. Restricted-Use vs. Public-Use Data Files 141
Table 55. Missing cases in combined restricted-use datasets, by dataset providing unit of analysis and by merged dataset: 1999–2000
Unit of analysis Observations
Nonresponding public school
districts
Nonresponding public school
principalsNonresponding public schools
Nonresponding public school library
media centersPublic school principal 8,524 1,014 † 663 1,400Public school 8,432 966 571 † 1,403Public school teacher 42,086 4,946 2,872 3,350 5,811Public school library media
center 7,715 865 591 686 †
Unit of analysis Observations
Nonresponding private school
principalsNonresponding private schools
Nonresponding private school library
media centersPrivate school principal 2,734 † † 324 823Private school 2,611 † 201 † 777Private school teacher 7,098 † 494 726 1,630Private school library media
center 2,086 † 175 252 †
Unit of analysis Observations
Nonresponding BIA school
principalsNonresponding
BIA schools
Nonresponding BIA school library
media centersBIA school principal 111 † † 2 13BIA school 116 † 7 † 13BIA school teacher 373 † 26 3 32BIA school library media
center 104 † 6 1 †
Unit of analysis Observations
Nonresponding public charter
school principals
Nonresponding public charter
schools
Nonresponding public charter school library media centers
Public charter school principal 891 † 683 † 91
Public charter school 870 † 659 70 †Public charter school teacher 2,847 † 2,093 201 292† Not applicable. NOTE: Surveys that appear on the public-use datasets are shaded. Remember that the public-use district file cannot be merged with other public school files. SOURCE: U.S. Department of Education, National Center for Education Statistics, Schools and Staffing Survey (SASS), 1999–2000.
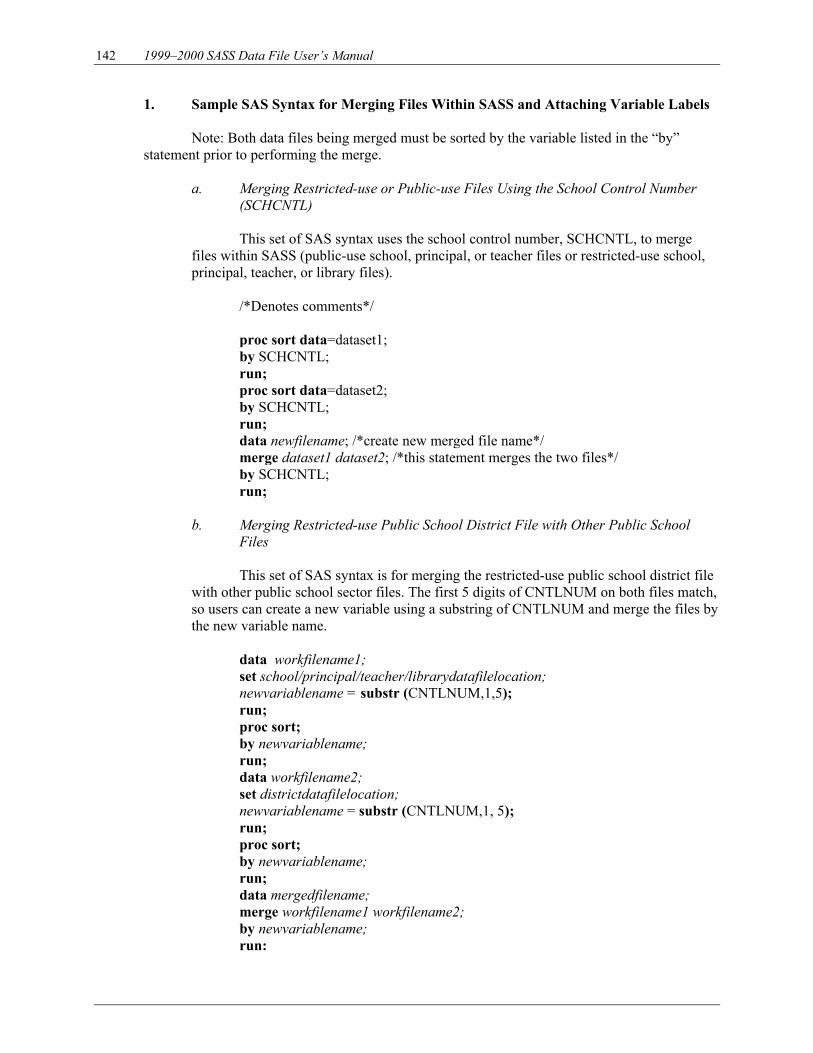
142 1999–2000 SASS Data File User’s Manual
1. Sample SAS Syntax for Merging Files Within SASS and Attaching Variable Labels Note: Both data files being merged must be sorted by the variable listed in the “by”
statement prior to performing the merge.
a. Merging Restricted-use or Public-use Files Using the School Control Number (SCHCNTL)
This set of SAS syntax uses the school control number, SCHCNTL, to merge
files within SASS (public-use school, principal, or teacher files or restricted-use school, principal, teacher, or library files).
/*Denotes comments*/ proc sort data=dataset1; by SCHCNTL; run; proc sort data=dataset2; by SCHCNTL; run; data newfilename; /*create new merged file name*/ merge dataset1 dataset2; /*this statement merges the two files*/ by SCHCNTL; run;
b. Merging Restricted-use Public School District File with Other Public School Files
This set of SAS syntax is for merging the restricted-use public school district file
with other public school sector files. The first 5 digits of CNTLNUM on both files match, so users can create a new variable using a substring of CNTLNUM and merge the files by the new variable name.
data workfilename1; set school/principal/teacher/librarydatafilelocation; newvariablename = substr (CNTLNUM,1,5); run; proc sort; by newvariablename; run; data workfilename2; set districtdatafilelocation; newvariablename = substr (CNTLNUM,1, 5); run; proc sort; by newvariablename; run; data mergedfilename; merge workfilename1 workfilename2; by newvariablename; run:
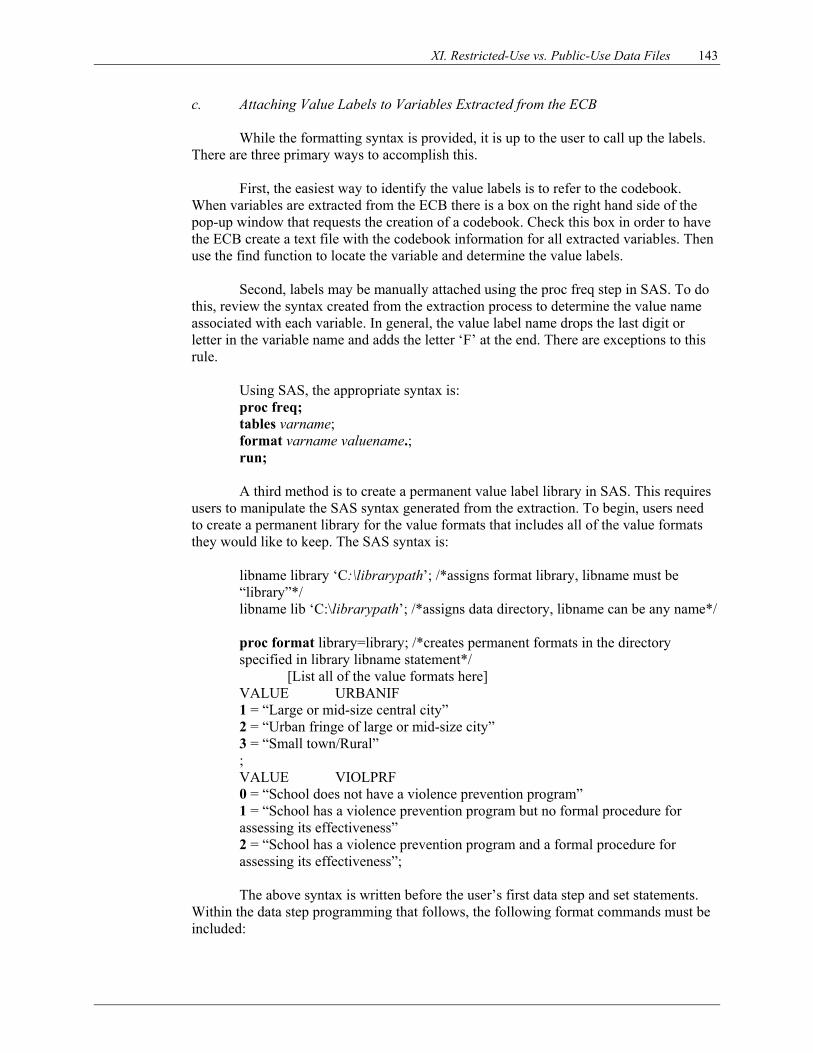
XI. Restricted-Use vs. Public-Use Data Files 143
c. Attaching Value Labels to Variables Extracted from the ECB
While the formatting syntax is provided, it is up to the user to call up the labels. There are three primary ways to accomplish this.
First, the easiest way to identify the value labels is to refer to the codebook. When variables are extracted from the ECB there is a box on the right hand side of the pop-up window that requests the creation of a codebook. Check this box in order to have the ECB create a text file with the codebook information for all extracted variables. Then use the find function to locate the variable and determine the value labels.
Second, labels may be manually attached using the proc freq step in SAS. To do
this, review the syntax created from the extraction process to determine the value name associated with each variable. In general, the value label name drops the last digit or letter in the variable name and adds the letter ‘F’ at the end. There are exceptions to this rule.
Using SAS, the appropriate syntax is: proc freq; tables varname; format varname valuename.; run;
A third method is to create a permanent value label library in SAS. This requires
users to manipulate the SAS syntax generated from the extraction. To begin, users need to create a permanent library for the value formats that includes all of the value formats they would like to keep. The SAS syntax is:
libname library ‘C:\librarypath’; /*assigns format library, libname must be “library”*/ libname lib ‘C:\librarypath’; /*assigns data directory, libname can be any name*/
proc format library=library; /*creates permanent formats in the directory specified in library libname statement*/
[List all of the value formats here] VALUE URBANIF 1 = “Large or mid-size central city” 2 = “Urban fringe of large or mid-size city” 3 = “Small town/Rural” ; VALUE VIOLPRF 0 = “School does not have a violence prevention program” 1 = “School has a violence prevention program but no formal procedure for assessing its effectiveness” 2 = “School has a violence prevention program and a formal procedure for assessing its effectiveness”;
The above syntax is written before the user’s first data step and set statements.
Within the data step programming that follows, the following format commands must be included:
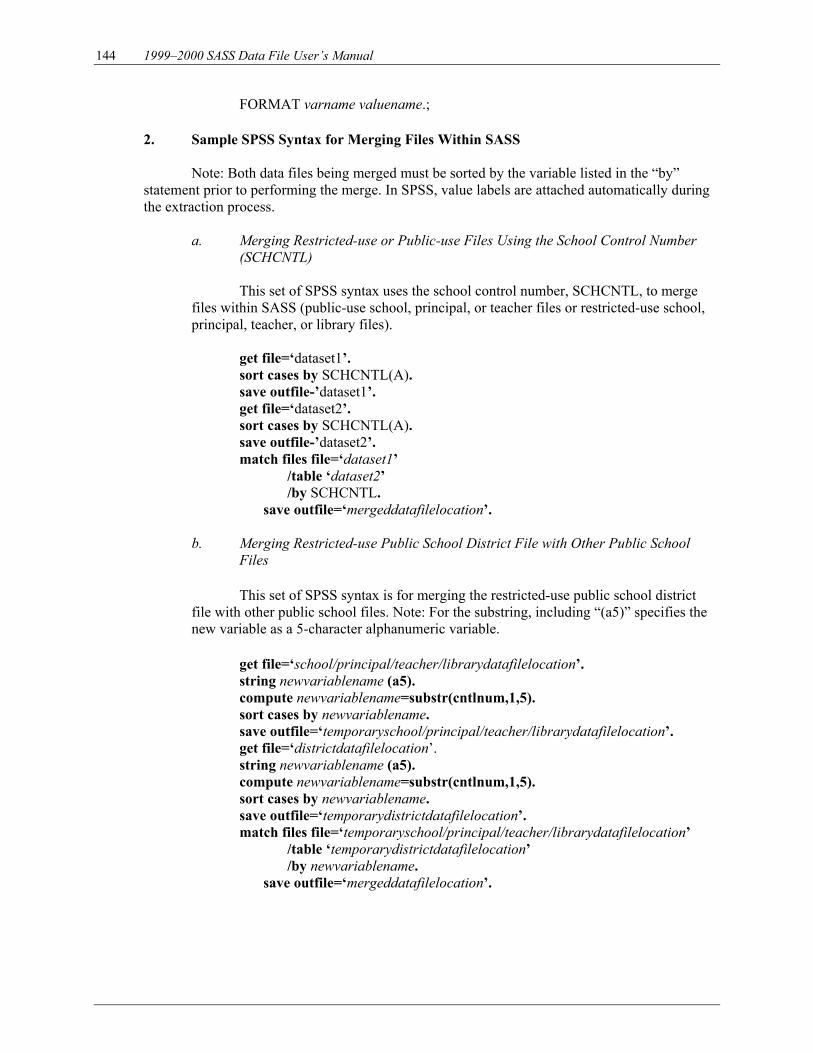
144 1999–2000 SASS Data File User’s Manual
FORMAT varname valuename.;
2. Sample SPSS Syntax for Merging Files Within SASS
Note: Both data files being merged must be sorted by the variable listed in the “by” statement prior to performing the merge. In SPSS, value labels are attached automatically during the extraction process.
a. Merging Restricted-use or Public-use Files Using the School Control Number
(SCHCNTL) This set of SPSS syntax uses the school control number, SCHCNTL, to merge
files within SASS (public-use school, principal, or teacher files or restricted-use school, principal, teacher, or library files).
get file=‘dataset1’. sort cases by SCHCNTL(A). save outfile-’dataset1’. get file=‘dataset2’. sort cases by SCHCNTL(A). save outfile-’dataset2’. match files file=‘dataset1’
/table ‘dataset2’ /by SCHCNTL. save outfile=‘mergeddatafilelocation’.
b. Merging Restricted-use Public School District File with Other Public School
Files
This set of SPSS syntax is for merging the restricted-use public school district file with other public school files. Note: For the substring, including “(a5)” specifies the new variable as a 5-character alphanumeric variable.
get file=‘school/principal/teacher/librarydatafilelocation’. string newvariablename (a5). compute newvariablename=substr(cntlnum,1,5). sort cases by newvariablename. save outfile=‘temporaryschool/principal/teacher/librarydatafilelocation’. get file=‘districtdatafilelocation’. string newvariablename (a5). compute newvariablename=substr(cntlnum,1,5). sort cases by newvariablename. save outfile=‘temporarydistrictdatafilelocation’. match files file=‘temporaryschool/principal/teacher/librarydatafilelocation’
/table ‘temporarydistrictdatafilelocation’ /by newvariablename. save outfile=‘mergeddatafilelocation’.

XI. Restricted-Use vs. Public-Use Data Files 145
D. Merging SASS District and Public School Data with CCD Data
More information on districts can be obtained by merging the CCD with the restricted-use SASS district dataset.
On the public school file, the variable SC_AG_ID is the 7-digit district ID from the CCD and is identical to CCDIDLEA on the district file. Both are identical to LEAID on the CCD. A simple name change to one of the variables is all that is needed to merge CCD district information onto SASS.
SC_NCSID is the 5-digit public school ID from the CCD. On the CCD the school is identified with the variable NCESSCH, which is a 12-digit variable with the first 7 digits identifying the district and the last 5 digits identifying the specific school. The 5 digits comprising SC_NCSID are unique only within the district. In order to correctly merge a SASS public school with CCD information, it is necessary to combine the school’s ID (SC_NCSID) and its district’s ID (SC_AG_ID). That created variable would be identical to the CCD variable NCESSCH.
In SAS, the user will need to concatenate the district and school IDs in order to merge public school data from the CCD:
newvariablename = sc_ag_id||sc_ncsid;
In SPSS, the user should initialize a new string variable with 12 characters and then concatenate
the district and school IDs: string newvariablename (A12). COMPUTE newvariablename = CONCAT(sc_ag_id,sc_ncsid).
Note: The user should make sure that the first variable listed is the district variable to ensure that
the numbers are in the same order as on the CCD. E. Merging SASS Private School Data with PSS Data
For private schools, the variable SC_NCSID is the unique 8-digit PIN taken from PSS for private schools. It is equivalent to SPIN on the PSS. A simple name change to one of the variables is all that is needed to merge PSS private school information onto SASS.

This page is intentionally left blank.

147
XII. Sampling, Created, Weighting, and Imputation Flag Variables
Variables in the SASS data file are characterized as questionnaire variables, sampling variables, created variables, weighting variables, and imputation flag variables. The most important of these variables are listed here. A. Sampling Variables The sampling variables are generally characteristics of the populations that are known prior to data collection and that are used in grouping the sampled members (strata). Some variables created during the sampling process, such as SCHCNTL, are included with the sampling variables. Four of the most important sampling variables are listed here; the full list of sampling variables on the restricted-use and public-use files is shown in table 56, and specifications for all of the sampling variables are included in appendix I.
1. Urbanicity of School (URBANIC)—Principal, Teacher, and School Files
This variable is a recoding of “Locale code—school physical address” (SLOCPHYS), which is based on the school’s 1997–98 physical address, from Census Geography. SLOCPHYS is an 8-level variable: 1. Large central city; 2. Mid-size central city; 3. Urban fringe of large city; 4. Urban fringe of mid-size city; 5. Large town; 6. Small town; 7. Rural, outside MSA; and 8. Rural, in MSA.
The eight SLOCPHYS levels are consolidated into three major urbanicity categories: large or mid-size central city, urban fringe of large or mid-size city, and small town/rural. SLOCPHYS levels 1 and 2 are central city, 3, 4, 5, and 8 are urban fringe, and 6 and 7 are small town/rural designations. This categorization conforms to the Census Bureau’s geographic definitions of urbanicity (and OMB’s list of Metropolitan Statistical Areas).
1. Large or mid-size central city; 2. Urban fringe of large or mid-size city; 3. Small town/rural
2. Region (REGION)
Region is the smallest geographic unit available on the public-use file. The four regions are:
1. Northeast: Maine, New Hampshire, Vermont, Massachusetts, Rhode Island, Connecticut, New York, New Jersey, Pennsylvania
2. Midwest: Ohio, Indiana, Illinois, Michigan, Wisconsin, Minnesota, Iowa, Missouri, North Dakota, South Dakota, Nebraska, Kansas
3. South: Delaware, Maryland, District of Columbia, Virginia, West Virginia, North Carolina, South Carolina, Georgia, Florida, Kentucky, Tennessee, Alabama, Mississippi, Arkansas, Louisiana, Oklahoma, Texas
4. West: Montana, Idaho, Wyoming, Colorado, New Mexico, Arizona, Utah, Nevada, Washington, Oregon, California, Alaska, Hawaii

148 1999–2000 SASS Data File User’s Manual
People using the restricted-use file will find more information on location, such as state and zip code. The numeric codes for geographic areas used in SASS are based on the Federal Information Processing Standards (FIPS) publications produced by the U.S. Department of Commerce’s National Institute of Standards and Technology (NIST). The detailed names of counties and corresponding codes are published in FIPS Publication 6-4, Counties and Equivalent Entities of the United States, Its Possessions, and Associated Areas, while the names and codes for the Metropolitan Statistical Areas are included in FIPS Publication 8-6, Metropolitan Areas (Including MSAs, CMSAs, PMSAs, and NECMAs). (For more information, see the FIPS Pubs website at http://www.itl.nist.gov/fipspubs.)
3. 3-Level Typology (RELIG)—Private Principal, Teacher, and School Files
There is a wide diversity among private schools, between types of religiously-oriented schools, nonsectarian schools, and special purpose schools. On the restricted-use file, the schools are characterized according to a 9-level typology variable (TYPOLOGY). The nine categories are: 1. Catholic, Parochial; 2. Catholic, Diocesan; 3. Catholic, Private order; 4. Other religious, Conservative Christian; 5. Other religious, denomination-affiliated; 6. Other religious, unaffiliated; 7. Nonsectarian, regular program; 8. Nonsectarian, special emphasis program; and 9. Nonsectarian, special education program. For the public-use file, these nine categories are recoded into the 3-level typology variable’s three categories:
1. Catholic; 2. Other religious; 3. Nonsectarian.
4. School Control Number (SCHCNTL)—Principal, Teacher, and School Files
The school control number (SCHCNTL) is on the School file and is added to the Principal and Teacher files. Use this variable when merging school records with principal and/or teacher records.
All of the SASS 1999–2000 sampling variables are listed in the table below. For more complete descriptions of the sampling variables, see appendix I.
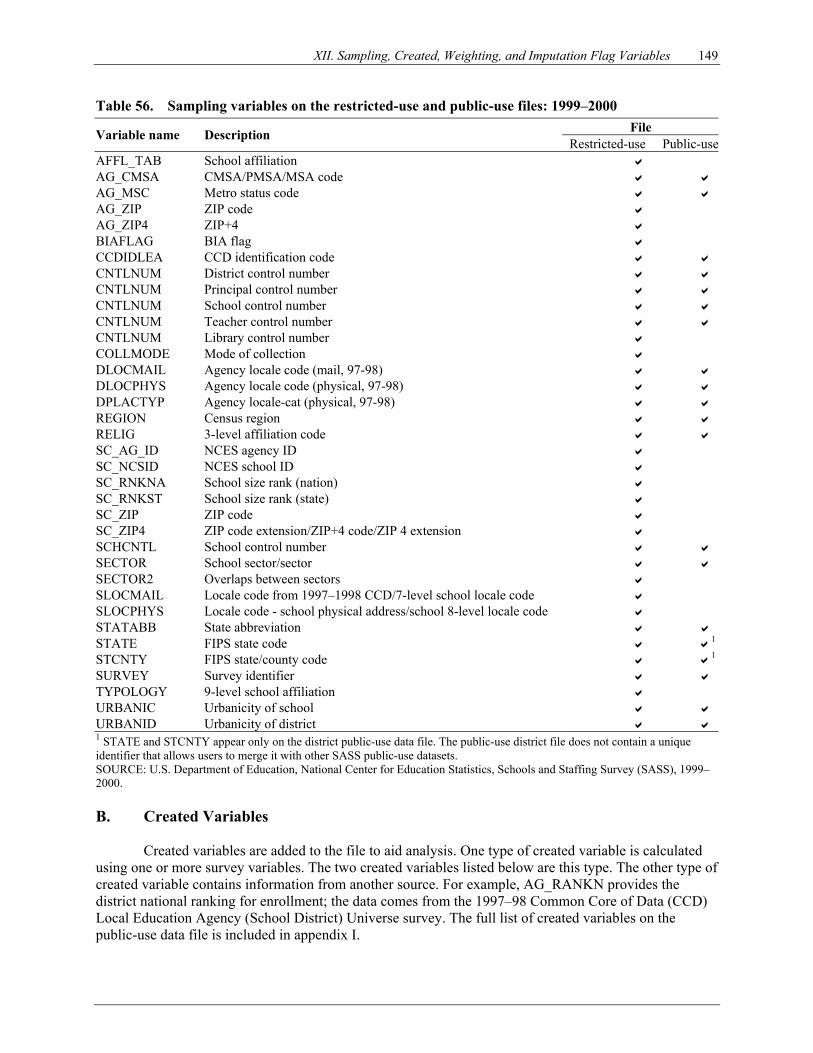
XII. Sampling, Created, Weighting, and Imputation Flag Variables 149
Table 56. Sampling variables on the restricted-use and public-use files: 1999–2000 File Variable name Description
Restricted-use Public-use AFFL_TAB School affiliation AG_CMSA CMSA/PMSA/MSA code AG_MSC Metro status code AG_ZIP ZIP code AG_ZIP4 ZIP+4 BIAFLAG BIA flag CCDIDLEA CCD identification code CNTLNUM District control number CNTLNUM Principal control number CNTLNUM School control number CNTLNUM Teacher control number CNTLNUM Library control number COLLMODE Mode of collection DLOCMAIL Agency locale code (mail, 97-98) DLOCPHYS Agency locale code (physical, 97-98) DPLACTYP Agency locale-cat (physical, 97-98) REGION Census region RELIG 3-level affiliation code SC_AG_ID NCES agency ID SC_NCSID NCES school ID SC_RNKNA School size rank (nation) SC_RNKST School size rank (state) SC_ZIP ZIP code SC_ZIP4 ZIP code extension/ZIP+4 code/ZIP 4 extension SCHCNTL School control number SECTOR School sector/sector SECTOR2 Overlaps between sectors SLOCMAIL Locale code from 1997–1998 CCD/7-level school locale code SLOCPHYS Locale code - school physical address/school 8-level locale code STATABB State abbreviation STATE FIPS state code 1
STCNTY FIPS state/county code 1
SURVEY Survey identifier TYPOLOGY 9-level school affiliation URBANIC Urbanicity of school URBANID Urbanicity of district 1 STATE and STCNTY appear only on the district public-use data file. The public-use district file does not contain a unique identifier that allows users to merge it with other SASS public-use datasets. SOURCE: U.S. Department of Education, National Center for Education Statistics, Schools and Staffing Survey (SASS), 1999–2000. B. Created Variables Created variables are added to the file to aid analysis. One type of created variable is calculated using one or more survey variables. The two created variables listed below are this type. The other type of created variable contains information from another source. For example, AG_RANKN provides the district national ranking for enrollment; the data comes from the 1997–98 Common Core of Data (CCD) Local Education Agency (School District) Universe survey. The full list of created variables on the public-use data file is included in appendix I.
150 1999–2000 SASS Data File User’s Manual
1. School Level (SCHLEVEL)—Principal, Teacher, and School Files
School level is defined as elementary, secondary, or combined. School level is based on the school’s report of what school levels are offered. This variable is created from S0058–S0090 as follows:
1. Elementary if school has any of grades K–6 and none of grades 9–12; 2. Secondary if school has any of grades 7–12 and none of grades K–6; 3. Combined for all other cases.
2. Total Ungraded and K–12 Enrollment (ENRK12UG)—Principal and Teacher Files
The total ungraded and K–12 student enrollment in school is copied from the
corresponding school questionnaire (S0092 on the Public School Questionnaire and S0101 on the Private School Questionnaire). For the public-use file, this information is recoded into three categories:
1. Less than 300 students; 2. 300 to 499 students; 3. 500 or more students.
C. Weighting Variables
The weighting process includes adjustment for nonresponse using respondents’ data, and adjustment of the sample totals to the frame totals to reduce sampling variability. Final weights are used to produce estimates from the SASS sample data. Replicate weights are included so the variance accounts for the complex sample design. Each record has a final weight and 88 replicate weights. All analyses should include calculating weighted estimates. The weights to be used for analysis are as follows:
Respondent Full sample weight Replicate weights District DFNLWGT DREPWT1–DREPWT88 Principal AFNLWGT AREPWT1–AREPWT88 School SFNLWGT SREPWT1–SREPWT88 Teacher TFNLWGT TREPWT1–TREPWT88
The ECB program automatically includes these variables in the SAS, SPSS for Windows, ASCII,
and Codebook extract files. D. Imputation Flag Variables The imputation flags were created to enable users to identify imputed values. (“F_” precedes the relevant variable number for all imputation flag variables.) Users can employ the imputation flag to delete the imputed values, use alternative imputation procedures, or account for the imputation in computation of the reliability of the estimates produced from the dataset. (If there is no imputation flag corresponding to a particular variable, no values for that variable were imputed.) For example, some users might wish to analyze the data with the missing values rather than the imputed values. If the imputation flag corresponding to the variable is not 0 (see list below), the user can replace the imputed response with a missing value to accomplish this goal. This method could also be used to replace the imputed value with a value imputed by some user-defined imputation approach.
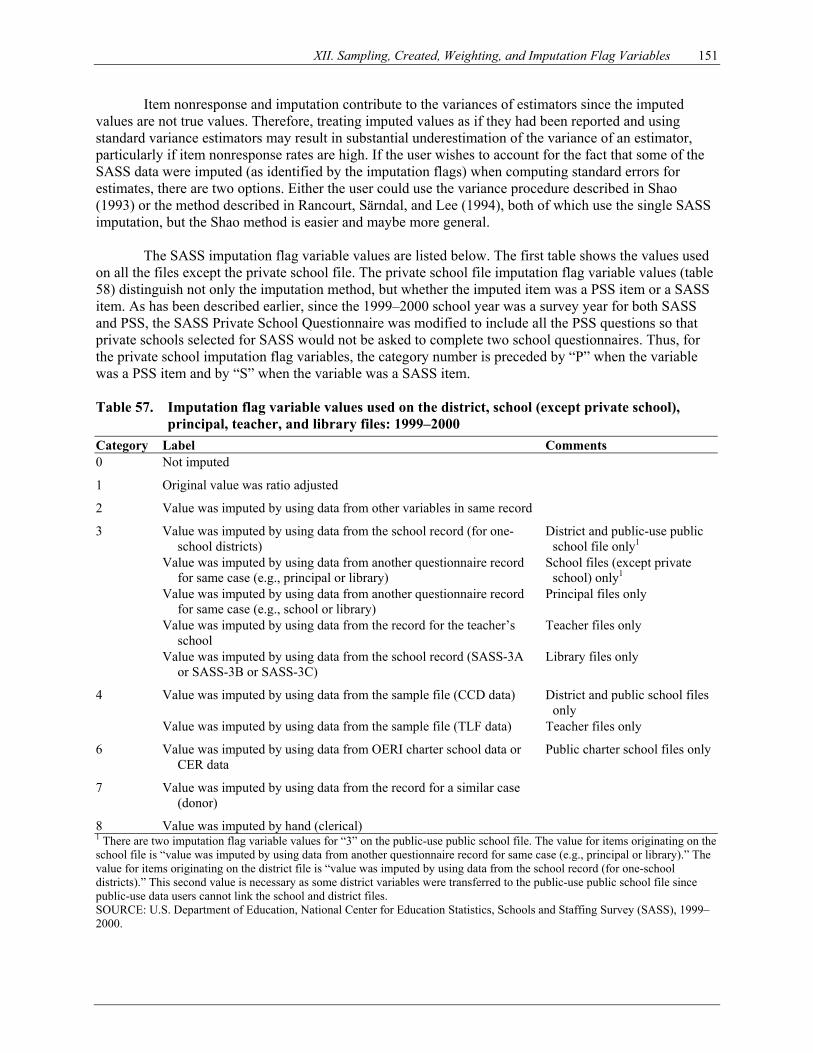
XII. Sampling, Created, Weighting, and Imputation Flag Variables 151
Item nonresponse and imputation contribute to the variances of estimators since the imputed values are not true values. Therefore, treating imputed values as if they had been reported and using standard variance estimators may result in substantial underestimation of the variance of an estimator, particularly if item nonresponse rates are high. If the user wishes to account for the fact that some of the SASS data were imputed (as identified by the imputation flags) when computing standard errors for estimates, there are two options. Either the user could use the variance procedure described in Shao (1993) or the method described in Rancourt, Särndal, and Lee (1994), both of which use the single SASS imputation, but the Shao method is easier and maybe more general.
The SASS imputation flag variable values are listed below. The first table shows the values used on all the files except the private school file. The private school file imputation flag variable values (table 58) distinguish not only the imputation method, but whether the imputed item was a PSS item or a SASS item. As has been described earlier, since the 1999–2000 school year was a survey year for both SASS and PSS, the SASS Private School Questionnaire was modified to include all the PSS questions so that private schools selected for SASS would not be asked to complete two school questionnaires. Thus, for the private school imputation flag variables, the category number is preceded by “P” when the variable was a PSS item and by “S” when the variable was a SASS item. Table 57. Imputation flag variable values used on the district, school (except private school),
principal, teacher, and library files: 1999–2000 Category Label Comments 0 Not imputed
1 Original value was ratio adjusted
2 Value was imputed by using data from other variables in same record
3 Value was imputed by using data from the school record (for one-school districts)
District and public-use public school file only1
Value was imputed by using data from another questionnaire record for same case (e.g., principal or library)
School files (except private school) only1
Value was imputed by using data from another questionnaire record for same case (e.g., school or library)
Principal files only
Value was imputed by using data from the record for the teacher’s school
Teacher files only
Value was imputed by using data from the school record (SASS-3A or SASS-3B or SASS-3C)
Library files only
4 Value was imputed by using data from the sample file (CCD data) District and public school files only
Value was imputed by using data from the sample file (TLF data) Teacher files only
6 Value was imputed by using data from OERI charter school data or CER data
Public charter school files only
7 Value was imputed by using data from the record for a similar case (donor)
8 Value was imputed by hand (clerical) 1 There are two imputation flag variable values for “3” on the public-use public school file. The value for items originating on the school file is “value was imputed by using data from another questionnaire record for same case (e.g., principal or library).” The value for items originating on the district file is “value was imputed by using data from the school record (for one-school districts).” This second value is necessary as some district variables were transferred to the public-use public school file since public-use data users cannot link the school and district files. SOURCE: U.S. Department of Education, National Center for Education Statistics, Schools and Staffing Survey (SASS), 1999–2000.
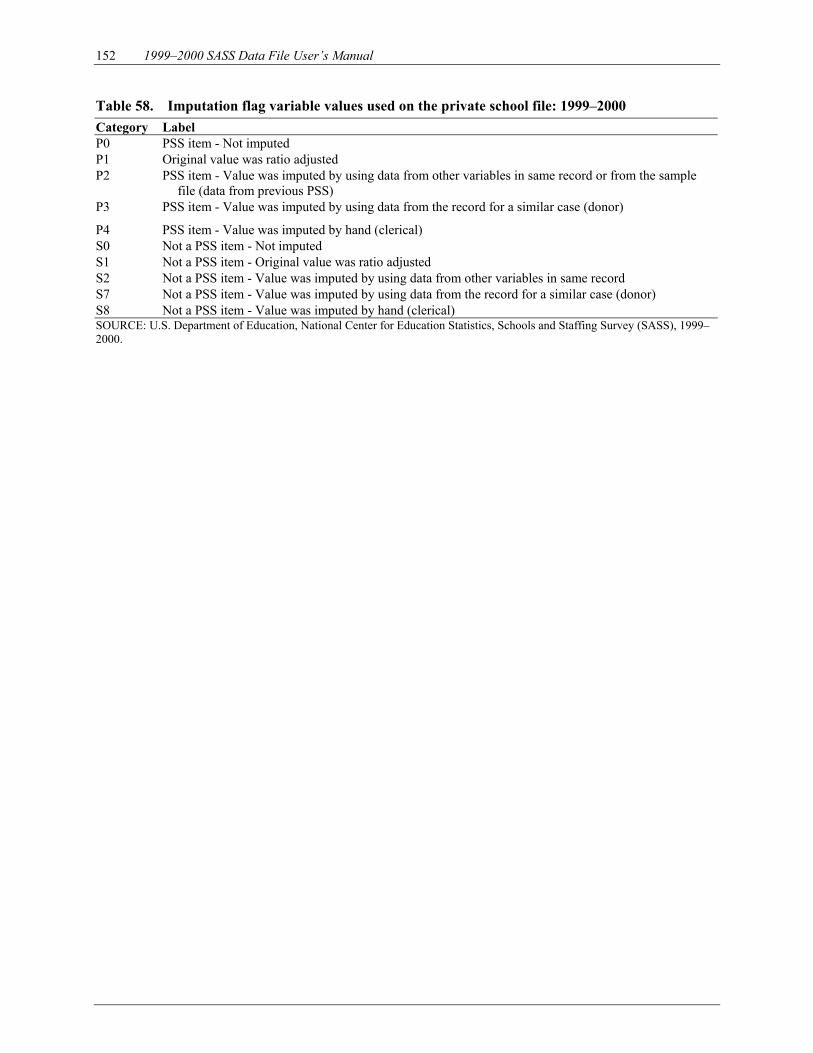
152 1999–2000 SASS Data File User’s Manual
Table 58. Imputation flag variable values used on the private school file: 1999–2000 Category Label P0 PSS item - Not imputed P1 Original value was ratio adjusted P2 PSS item - Value was imputed by using data from other variables in same record or from the sample
file (data from previous PSS) P3 PSS item - Value was imputed by using data from the record for a similar case (donor)
P4 PSS item - Value was imputed by hand (clerical) S0 Not a PSS item - Not imputed S1 Not a PSS item - Original value was ratio adjusted S2 Not a PSS item - Value was imputed by using data from other variables in same record S7 Not a PSS item - Value was imputed by using data from the record for a similar case (donor) S8 Not a PSS item - Value was imputed by hand (clerical) SOURCE: U.S. Department of Education, National Center for Education Statistics, Schools and Staffing Survey (SASS), 1999–2000.
153
XIII. User Notes and Cautions A. 1999–2000 SASS Electronic Codebook (ECB)
The 1999–2000 SASS ECB features multiple search functions allowing the user to search by sector, respondent, keyword, variable name, or type of variable. The ECB provides weighted and unweighted frequencies in the search results, saves extraction variable lists for future sessions, and creates a syntax file for exporting to SPSS or SAS. The CD also contains data files in ASCII format and documentation files in Word. (For more information on ordering NCES products, please visit http://www.nces.ed.gov/help/orderinfo.asp.)
The Electronic Codebook (ECB) is a tool that gives the user a vehicle to browse through the lists of variables and variables’ information for datasets. The ECB handles data in multiple files with the following characteristics:
• Maximum record length = 1,024; • Multiple records per case; and • Variable names (8 character SAS/SPSS name unique within each file, but NOT necessarily
unique across files.
The ECB performs the following:
• Presentation of a list of ALL variables • For each variable a separate window provides information such as:
- Frequencies, percentages, codes, and labels - Descriptions
• Easy navigation between sectors, respondents, and files • Context-sensitive help • Setup adaptable to different storage and extract locations • For user selected variables, creation of
- SAS syntax, including PROC FORMAT labeling - SPSS syntax, including VALUE LABELS formatting - IDs for merging modules automatically included in SAS/SPSS syntax - Printed codebook in ASCII text format - Saved extraction variable lists
• Search for text • Import of saved extraction variable lists
On the public-use files, any combination of the school, principal, and teacher datasets can be merged using the school control number (SCHCNTL). The school control number variable is present on all of these files and will link them together. However, public-use data files cannot be linked to their district records.
B. Calculation of Average Years of Teaching Experience Items 6 and 7 on the School Teacher Questionnaire ask about the years of full- and part-time teaching experience that the teacher has in both public and private schools. Public school teachers are skipped out of the questions on private school experience if they’ve never taught in private schools; similarly, private school teachers are skipped out of the questions about public school teaching experience if they’ve never taught in public schools. As a result of this skip pattern, public school teachers who have
154 1999–2000 SASS Data File User’s Manual
never taught in private schools will have a value of “missing” for the public school teacher file variables T0068 (Yrs tching FT in private schls) and T0069 (Yrs tching PT in private schls), and private school teachers who have never taught in public schools will have a value of “missing” for the private school teacher file variables T0068 (Yrs tching FT in public schls) and T0069 (Yrs tching PT in public schls). To calculate the average number of years that all public school teachers have taught in private schools, or the average number of years that all private school teachers have taught in public schools, you should recode these missing values to zeros. Otherwise, the average that you calculate will reflect the average number of years that public school teachers have taught in private schools only for those public school teachers who have ever taught in private schools, or the average number of years that private school teachers have taught in public schools only for those private school teachers who have ever taught in public schools. This recoding will not be necessary if you are interested in the total years of teaching experience because there is already a created variable (TOTEXPER—total teaching experience) that calculates that. C. FIPS Codes Users with restricted-use files will encounter FIPS codes. FIPS stands for Federal Information Processing Standards. FIPS publications are produced by the U.S. Department of Commerce’s National Institute of Standards and Technology (NIST). The FIPS codes used in SASS standardize numeric codes for geographic areas. The detailed names of counties and corresponding codes are published in FIPS Publication 6-4, Counties and Equivalent Entities of the United States, Its Possessions, and Associated Areas, while the names and codes for the Metropolitan Statistical Areas are included in FIPS Publication 8-6, Metropolitan Areas (Including MSAs, CMSAs, PMSAs, and NECMAs). Copies of these publications are for sale by the National Technical Information Service (NTIS), U.S. Department of Commerce, Springfield, VA 22161; write to or call the NTIS Computer Products Office at (703) 487-4650 for cost and ordering information. When ordering, refer to Federal Information Processing Standards Publication 6-4 (FIPSPUB6-4) or Federal Information Processing Standards Publication 8-5 (FIPSPUB8-6 and its title. (For more information, see the FIPS Pubs website at http://www.itl.nist.gov/fipspubs.) D. Codes for Teachers’ Major Field of Study A crosswalk of the major field of study codes used for undergraduate and advanced degrees across the 1987–88, 1990–91, 1993–94, and 1999–2000 questionnaires is included in appendix J. E. Industry and Occupation Codes The 1999–2000 SASS used the 1990 Census of Population industry and occupation codes that were used in the 1993–94 SASS (instead of the revised list of industry and occupation codes developed for the 2000 Decennial Census). These codes were used to categorize teachers’ responses to questions like 4c, “What kind of work were you doing?” and 4d, “What were your most important activities or duties at that job?” A list of the 1990 Census of Population industry and occupation codes is provided in appendix K. The list also includes the corresponding 1987 Standard Industrial Classification (SIC) codes and 1980 Standard Occupational Classification (SOC) codes. F. Cautions Concerning the Measurement of Change Estimates
Care must be taken estimating 1987–88 to 1999–2000 change in a SASS data element, because some of the measured change may not be attributable to a change in the education system (like a 3 percent
XIII. User Notes and Cautions 155
drop in enrollment) but rather due to changes in the design and/or operation of SASS. The types of changes that might partially contribute to difficulties in measuring change are described below.
1. School Locale Codes Over Time
Locale codes are one of the major classification systems used by federal agencies to classify the urbanicity of geographic or governmental units. A school locale code defines how a school is situated in a particular location in terms of the size of the community in which it is located and the proximity of that community to urban and metropolitan areas. The Governments Division of the Census Bureau assigns the locale codes based on information from CCD.
Two changes made since the administration of the 1993–94 SASS impacted the 1999–2000 SASS: • As of 1994–95, the threshold size of a large city was lowered from 400,000 to 250,000,
and the population density requirement was dropped. • As of 1997–98, CCD no longer allowed states to change locale codes. Initially, state
education agencies were allowed to edit or change the locale codes assigned to schools in their state. These changes were not checked in the usual edit routines, and some files subsequently were released with incorrect locale codes. However, some of the changes led to implausible locale code designations, such as all schools in a state being coded large town.
These definitional and operational changes may result in some comparisons of schools by
community type or locale over time that do not reflect actual change, but merely a shift in the distribution of schools by community type due to the difference in definition of rural areas or method of community type assignment. Changes to the CCD files continue to be made. More recent changes that did not impact the 1999–2000 SASS include the following: • As of 1998–99, CCD started using the physical location of the school to determine the
locale code whenever the physical location address had been reported by the state. (Originally, 17 states provided this information.) If the mailing address was the school’s physical location, states did not report a separate location address. Mailing address remained the default if no physical location address was reported. The use of location address rather than mailing address makes the locale codes more valuable and eliminates one source of inconsistency between CCD and commercial school mailing lists.
• Also as of 1998–99, CCD subdivided “rural” into two codes. The definition for code 7 was narrowed from “rural” to “rural, outside a metropolitan area,” and areas that were “rural, within a metropolitan area” were assigned to a new code, 8. This new code was added in response to users who wanted to identify all schools located in rural areas, even though the entire surrounding places may be defined as part of a metropolitan area. About 7 percent of the schools were given the new code.
• As of 1999–2000, the Census Bureau assigned metro status codes based on locale codes. (Metro status refers to proximity to a city that has been given metropolitan statistical status by the Census Bureau. It should not be confused with urbanicity, which refers to the population density for a given area.) Metro status codes make up a simple system of three codes based on the location of the school district.
156 1999–2000 SASS Data File User’s Manual
For more information on the history of locale codes, the definitions of the codes and how they have changed since the original codes were developed, the original methodology for assigning school locale codes, metro status codes, and district-level locale codes, and the changes that have taken place in the methodologies, see NCES 2002–02, School Locale Codes, 1987–2000, by Nancy Speicher at http://nces.ed.gov/pubs2002/200202.pdf.
2. Changing the Sampling Frame for Public Schools From QED to CCD
The 1987–88 SASS used the QED as its sampling frame, and defined a school as a
physical location. Beginning with the 1990–91 SASS, the sampling frame for public schools was changed to CCD. For the 1990–91, 1993–94, and 1999–2000 SASS administrations, SASS (CCD) defined a school as an administrative unit.
It is possible to collapse the 1990–91 and 1993–94 SASS public school data to the QED
school as it was defined in the 1987–88 SASS, thereby eliminating this concern. However, these estimates may no longer be consistent with CCD estimates for public schools. (For more information, see NCES 95–02, QED Estimates of the 1990–91 Schools and Staffing Survey: Deriving and Comparing QED School Estimates with CCD Estimates, by Albert Holt and Brian Scanlon, at http://nces.ed.gov/pubs95/9502.pdf.)
Because QED and CCD have different sets of schools, part of the change in school
related estimates could be attributable to this difference.
3. Changing the Sampling Frame for Private Schools From QED to PSS The 1987–88 SASS used the QED as its sampling frame, and defined a school as a
physical location. Beginning with the 1990–91 SASS, the sampling frame for private schools was changed to the Private School Universe Survey (PSS). PSS defines a school as an administrative unit. Although in most cases the administrative unit corresponds to a physical location, administrative units that operate multiple campuses may choose to be counted as one school in PSS. Therefore, the estimated number of private schools using PSS as the sampling frame (1990–91, 1993–94, and 1999–2000 SASS) could be lower than when using the QED (1987–88 SASS).
Because QED and CCD have different sets of schools, part of the change in school
related estimates could be attributable to this difference. 4. Estimated Number of Teachers From the Teacher File Versus Estimated Number of
Teachers From the School File
In the 1990–91 and 1993–94 SASS, the estimated number of teachers from the teacher file was adjusted to match the estimated number of teachers from the school file to make estimates from the two files more consistent. Since this was not done in the 1987–88 or 1999–2000 survey, some of the distributional difference between teacher files from different survey years may be partially attributable to this adjustment. In the public 1987–88 and 1999–2000 files, the teacher counts on the teacher file are smaller than the counts on the school file. In the 1990–91 and 1993–94 files, the teacher file counts are increased to equalize the estimates between the teacher and school files. This increase is not a change in the educational system, but a consistency correction between the files.

XIII. User Notes and Cautions 157
5. Questionnaire and Conceptual Differences
Care must also be observed in the interpretation of change estimates across survey administrations since specific questions are not always worded the same from the first SASS survey to subsequent surveys. Both major and minor changes in wording of specific items occur; the ordering of items may be different and concepts can be different. (See appendix L, Crosswalk among Items in the 1987–88, 1990–91, 1993–94, and 1999–2000 SASS.)
As an example, in both the 1987–88 and 1990–91 SASS, the question, “Which best
describes the community in which the school is located?” was asked of the respondent to the school survey. The SASS reinterview program in both 1988 and 1991 determined the responses to this item were highly subjective and exhibited moderate response variance. As a result of this finding, the 1990–91 and subsequent SASS data files have contained an “urbanicity” code28 that is believed to be a more accurate description of the community than the self-reports. This methodology currently assigns locale codes based on the school’s physical location matched to Bureau of the Census data files containing population density data, Standard Metropolitan Statistical Area (SMSA) codes, and a Census code defining urban and rural areas. This rigorously defined locale code is conceptually different from the self-report of community type found on the 1987–88 SASS files.
Rewording a question or moving a question to another part of the questionnaire can affect
the size of the estimates. This “change” occurs because the context for responding to the question has changed, and the question now may measure something different than it did originally. An example of items changing between the 1987–88 SASS and the 1990–91 SASS is the question about student participation in a vocational or technical program. In the 1987–88 SASS, the number of students participating in a vocational program was asked in a series along with student participation in various programs, such as in remedial reading or math programs. There was no restriction on the students’ school levels included in the 1987–88 number of vocational program students. However, in the 1990–91 SASS, the vocational program participation item was restricted to schools with grades 10 through 12. The vocational program question in 1990–91 is part of a sequence of items on enrollment of the school’s students in the academic, vocational, or general high school curriculum. The two estimates, from 1987–88 and 1990–91, are not strictly comparable and do not measure the same group of vocational students. (As of the 1993–94 survey, the questionnaire only asks whether the school offers such a program.)
In some cases, SASS may continue to make adjustments to questions. For example, there
have been at least minor changes in the layout of college major fields in the principal and teacher questionnaires in each survey administration. In 1987–88, the college major field codes were grouped into either Education or General majors with the General major codes at the top of the list (Principals—then called “Administrators”) or at the left-hand side of the page (Teachers). This meant that the first major encountered for a math teacher would be “Mathematics” rather than “Mathematics education.” Because more teachers (and many principals) major in education with a specialization in an academic field than in the general field, the order was switched in 1990–91. This resulted in more mathematics teachers, for example, reporting a mathematics education major in 1990–91 than in 1987–88. Such a change could be due in large part to teachers noticing “Mathematics education” first, rather than “Mathematics,” and to a lesser extent, the real changes between two survey years. In 1993–94, “Education” became “Education Fields” and “General” became “General Fields” but the main change was expanding the space for the list
28 The first locale code used in SASS is described in Johnson (1989). Recent changes to the locale code are described in Speicher (2002).
158 1999–2000 SASS Data File User’s Manual
from less than half a page to a full page. In 1999–2000, some fields were re-worded, categories were added, some categories were re-ordered, and new subheadings were added. Principals were no longer asked the subject of their degree(s). (See appendix J, Crosswalk of Codes for Teachers’ Major Field of Study.)
6. Calculating the Standard Error for a Cross-Year Comparison
When analyzing the change between two survey collections, such as between 1987–88 and 1999–2000, the following statistics should be computed:
22
21
21
sese
PPt+
−=
Where P1 and P2 are the estimates to be compared and se1 and se2 are the standard errors
for time 1 and time 2, respectively. This formula is valid only for independent estimates.
159
References Bokossa, M., Salvucci, S., and Ghosh, D. (forthcoming). Nonresponse Bias Analysis for the 1999–2000 Schools and Staffing Survey (SASS). U.S. Department of Education, National Center for Education Statistics. Washington, DC: U.S. Government Printing Office. Bureau of Indian Affairs. (1998). Office of Indian Education Programs: Education Directory. Washington, DC: U.S. Government Printing Office. Efron, B. (1982). The Jackknife, the Bootstrap, and Other Resampling Plans. Philadelphia: SIAM. Ennis, S., and Miller, D. (2004). Response Variance in the 1999–2000 Schools and Staffing Survey. In S.C. Tourkin, K.W. Pugh, S.E. Fondelier, R.J. Parmer, C. Cornette, B. Jackson, T. Warner, G. Weant, and E. Walter, 1999–2000 Schools and Staffing Survey Data File User’s Manual (NCES 2004–303; appendix H). U.S. Department of Education. Washington, DC: National Center for Education Statistics. Forsman, G., and Schreiner, I. (1991). The Design and Analysis of Reinterview: An Overview. In P. P. Biemer, R.M. Groves, L. E. Lybert, N. A. Mathiowetz, and S. Sudman (Eds.), Measurement Errors in Surveys (pp. 279–301). New York: John Wiley & Sons. Holt, A., and Scanlon, B. (1995). QED Estimates of the 1990–91 Schools and Staffing Survey: Deriving and Comparing QED School Estimates with CCD Estimates (NCES 95–02). U.S. Department of Education. Washington, DC: National Center for Education Statistics Working Paper. Jenkins, C.R. (1997). Report of Cognitive Research on the Public and Private School Teacher Questionnaires for the Schools and Staffing Survey 1993–94 School Year (NCES 97–10). U.S. Department of Education. Washington, DC: National Center for Education Statistics Working Paper. Jenkins, C.R., and Von Thurn, D. (1996). Cognitive Research on the Teacher Listing Form for the Schools and Staffing Survey (NCES 96–05). U.S. Department of Education. Washington, DC: National Center for Education Statistics Working Paper. Johnson, F. (1989). Assigning Type of Locale Codes to the 1987–88 CCD Public School Universe (NCES Technical Report, Data Series: SP–CCD–87188–7.4, CS 89–194). U.S. Department of Education. Washington, DC: National Center for Education Statistics. Kalton, G. (1983). Compensating for Missing Survey Data. Ann Arbor: Survey Research Center, University of Michigan. Kalton, G. and Kasprzyk, D. (1982). Imputing for Missing Survey Responses. American Statistical Association 1982 Proceedings of the Section on Survey Research Methods, 22–31. Kalton, G. and Kasprzyk, D. (1986). The Treatment of Missing Survey Data. Survey Methodology, 12(1): 1–16. Kaufman, S. (1991). 1987–88 Schools and Staffing Survey: Sample Design and Estimation (NCES 91–127). U.S. Department of Education, National Center for Education Statistics. Washington, DC: U.S. Government Printing Office.

160 1999–2000 SASS Data File User’s Manual
Kaufman, S. (1992). Balanced Half-sample Replication with Aggregation Units. American Statistical Association 1992 Proceedings of the Section on Survey Research Methods, 440–445. Kaufman, S. (1993). A Bootstrap Variance Estimator for the Schools and Staffing Survey. American Statistical Association 1993 Proceedings of the Section on Survey Research Methods, 675–680. Kaufman, S. (1994). Properties of the Schools and Staffing Survey’s Bootstrap Variance Estimator. American Statistical Association 1994 Proceedings of the Section on Survey Research Methods, 1116–1121. Kaufman, S. (1998). A Bootstrap Variance Estimator for Systematic PPS Sampling. American Statistical Association 1998 Proceedings of the Section on Survey Research Methods, 769–774. Kaufman, S. (1999). Using the Bootstrap to Estimate the Variance from a Single Systematic PPS Sample. American Statistical Association 1999 Proceedings of the Section on Survey Research Methods, 683–688. Kaufman, S. (2000). Using the Bootstrap to Estimate the Variance in A Very Complex Sample Design. American Statistical Association 2000 Proceedings of the Section on Survey Research Methods, 180–185. Kaufman, S. (2001). A New Model for Estimating the Variance under Systematic Sampling. American Statistical Association 2001 Proceedings of the Section on Survey Research Methods. Little, R.J.A. and Rubin, D.B. (1987). Statistical Analysis with Missing Data. New York: John Wiley and Sons. Madow, W.G., Olkin, I., and Rubin, D.B. (Eds.) (1983). Incomplete Data in Sample Surveys, Vols. 1, 2, and 3, New York: Academic Press. McMillen, M., and Benson, P. (1991). Diversity of Private Schools (NCES 92–082). U.S. Department of Education, National Center for Education Statistics. Washington, DC: U.S. Government Printing Office. Nelson, B., Berman, P. Ericson, J., Kamprath, N., Perry, R., Silverman, D., and Solomon, D. (2000). The State of Charter Schools 2000. Washington, DC: U.S. Department of Education, Office of Educational Research and Improvement. Rancourt, E., Särndal, C., and Lee, H. (1994). Estimation of the Variance in the Presence of Nearest Neighbour Imputation. American Statistical Association 1994 Proceedings of the Section on Survey Research Methods, 888–893. Research Triangle Institute. (2001). User Manual, Release 8.0. Research Triangle Park, NC: Research Triangle Institute. Royce, D. (1995). The Results of the 1993 Teacher List Validation Study (TLVS) (NCES 95–09). U.S. Department of Education. Washington, DC: National Center for Education Statistics Working Paper. SAS Institute, Inc. (2002) SAS OnlineDoc®9. Cary, NC: SAS Institute Inc. Salvucci, S., Holt, A., Moonesingle, R. (1995). Design Effects and Generalized Variance Functions for the 1990–91 Schools and Staffing Survey (SASS), Volume II, Technical Report (NCES 95-342-II). U.S. Department of Education, National Center for Education Statistics. Washington, DC: U.S. Government Printing Office.
References 161
Shao, J. (1993). Balanced Repeated Replication. American Statistical Association 1993 Proceedings of the Section on Survey Research Methods, 544–549. Sitter, R.R. (1990). Comparing Three Bootstrap Methods for Survey Data (Tech. Rep. No. 152). Ottawa, Canada: Carleton University, Laboratory for Research in Statistics and Probability. Speicher, N. (2002). School Locale Codes 1987–2000 (NCES 2002–02). U.S. Department of Education. Washington, DC: National Center for Education Statistics Working Paper. Synectics for Management Decisions, Inc. (1992). Generalized Variance Estimates for 1987–88 Schools and Staffing Survey (SASS) (NCES 94-02). U.S. Department of Education. Washington, DC: National Center for Education Statistics Working Paper. Whitener, S., Gruber, K., Lynch, H., Tingos, K., Persona, M., and Fondelier, S. (1997), Characteristics of Stayers, Movers and Leavers: Results from the Teacher Followup Survey: 1994–95 (NCES 97–450). U.S. Department of Education, National Center for Education Statistics. Washington, DC: U.S. Government Printing Office. Whitener, S.D., Gruber, K.J., Rohr, C., and Fondelier, S. (1998), 1994–95 Teacher Followup Survey Data File User’s Manual, Public Use Version (NCES 98–232). U.S. Department of Education, National Center for Education Statistics. Washington, DC: U.S. Government Printing Office. Wolter, K.M. (1985). Introduction to Variance Estimation. New York: Springer-Verlag, chapter 3. Wright, D. (1988). Early Elementary and Secondary Redesign Research - The Schools and Staffing Survey, an internal NCES paper. Zukerberg, A. (1999, March). 1998 Pretest and Questionnaire Revisions for the 2000 SASS. Paper presented at the National Center for Education Statistics’ Schools and Staffing Survey (SASS) Technical Review Panel Meeting, Washington, DC. Zukerberg, A., and Lee, M. (1997). Further Cognitive Research on the Schools and Staffing Survey (SASS) Teacher Listing Form (NCES 97–23). U.S. Department of Education. Washington, DC: National Center for Education Statistics Working Paper. Zukerberg, A., Nichols, E., and Tedesco, H. (2000). Designing Surveys for the Next Millennium: Internet Questionnaire Design Issues. In NCES (Ed.) Selected Papers on Education Surveys: Papers Presented at the 1998 and 1999 ASA and 1999 AAPOR Meetings (NCES 2000–04) (pp. 79–85). U.S. Department of Education. Washington, DC: National Center for Education Statistics Working Paper.