1995-2006 grimm aerosol technik gmbh & co. kgdata.cas.manchester.ac.uk/.../manual_sw_gbr.pdf- 3...
TRANSCRIPT


- 2 -
1995-2006 Grimm Aerosol Technik GmbH & Co. KG 7th Edition, September 2006 All rights reserved. No part of this manual may be duplicated in any form or in any media, either written or electronic, without express written authorization of Grimm Aerosol Technik GmbH Disclaimer While every effort has been made to ensure the accuracy of this manual, this publication could include technical inaccuracies or typographical errors. Changes are periodically made to the information herein; these changes will be incorporated in new editions of the publication. Grimm Aerosol Technik GmbH may make improvements or changes in the products or programs described in this publication at any time. Neither Grimm Aerosol Technik GmbH nor its dealers or distributors shall be liable to the user or any other person or entity with respect to any liability, loss, or damage caused or alleged to be caused directly or indirectly by this publication. The information in this document is subject to change without notice. This document may not, in whole or in part, be copies, photocopied, reproduced, translated, or reduced to any electronic medium or machine-readable form without prior consent in writing from Grimm Aerosol Technik GmbH. Trademark Acknowledgments Microsoft, MS, Windows, and Windows NT are either registered trademarks or trademarks of Microsoft Corporation in the U.S. and/or other countries. Other product names mentioned in this manual may be trademarked or registered trademarks of their respective companies and are the sole property of their respective manufacturers and should be treated as such. Grimm Aerosol Technik GmbH & Co. KG
Dorfstraße 9 83404 Ainring (Germany) Phone: +49/ (0) 86 54 / 578 – 0 Fax: +49/ (0) 86 54 / 578 – 35 Email: [email protected] Homepage: www.grimm-aerosol.com
- 3 -
Table of Contents 1 HARDWARE AND INSTALLATION........................................................................................... 5 1.1 SUPPORTED SPECTROMETERS ................................................................................................. 5 1.2 COMPUTER SPECIFICATIONS................................................................................................... 5 1.3 OPERATING SPECIFICATIONS .................................................................................................. 6 1.4 SOFTWARE INSTALLATION...................................................................................................... 6 1.5 INITIAL SOFTWARE STARTUP ................................................................................................. 6 1.6 CONNECTION AND SET UP OF THE SPECTROMETER.......................................................... 7 2 WINDOWS OPERATING SYSTEM ............................................................................................. 8 2.1 BACKGROUND PROGRAM ........................................................................................................ 8 2.2 EXECUTABLE FILES................................................................................................................... 8 2.3 MEASUREMENT DATA FILES .................................................................................................. 8 2.4 FILE MANAGER LIST FILE ....................................................................................................... 9 2.5 CONFIGURATION FILE .............................................................................................................. 9 2.6 TEMPORARY FILE....................................................................................................................... 9 3 PARAMETER AND DEFAULT SETTINGS .............................................................................. 10 3.1 THE MENU GROUP [OPTIONS] .......................................................................................... 10 3.2 SPECTROMETER PARAMETER ............................................................................................... 10 3.3 AUTOMATIC START AND STOP PARAMETER...................................................................... 13 3.4 GRAPH ........................................................................................................................................ 15 3.5 SENSOR CALIBRATION DATA ............................................................................................... 19 3.6 ALARM PARAMETER ............................................................................................................... 21 3.7 LOCATION LIST......................................................................................................................... 21 3.8 LANGUAGE................................................................................................................................ 22 3.9 SYSTEM PARAMETER .............................................................................................................. 22 4 MEASUREMENT .......................................................................................................................... 25 4.1 THE MENU GROUP [FILE]...................................................................................................... 25 4.2 DIALOG BOX [NEW]................................................................................................................ 25
4.2.1 Starting Measurement (Online) ................................................................................ 26 4.2.2 Automatic Measurement (Automatic) ..................................................................... 26 4.2.3 Reading Memory Cards .............................................................................................. 26
4.3 DISPLAY STORED FILES ......................................................................................................... 27 4.4 DELETE A MEASUREMENT FILE ............................................................................................ 27 4.5 CREATE FILTER FILE ............................................................................................................... 27 4.6 CREATE A TEXT FILE FOR A SPREADSHEET PROGRAM .................................................... 28 4.7 FILE MANAGER (SEARCH FILE) ........................................................................................... 29 4.8 PRINT REPORT........................................................................................................................... 30 4.9 PREVIEW REPORT..................................................................................................................... 30 4.10 PRINTER CONFIGURATION..................................................................................................... 30 5 MEASUREMENT DISPLAY........................................................................................................ 31 5.1 NUMERICAL AND GRAPHICAL VIEW ................................................................................... 31 5.2 DATA FILES DISPLAYS ........................................................................................................... 32 6 FILTER TEST (OPTIONAL) ....................................................................................................... 34

- 4 -
6.1 GENERAL ...................................................................................................................................... 34 6.2 SELECT DRIVER FILES.................................................................................................................... 34 6.3 SELECT SERIAL PORT..................................................................................................................... 35 6.4 CALIBRATION DATA OF THE SECOND SENSOR (DOWNSTREAM) ............................................... 35 6.5 START THE FILTER TEST ................................................................................................................ 35 6.6 FINISH THE FILTER TEST ................................................................................................................ 36 6.7 OPEN THE FILES ............................................................................................................................ 36 7 EXTRAS .......................................................................................................................................... 37 7.1 STATISTICAL EVALUATION ................................................................................................... 37 7.2 GRAVIMETRIC EVALUATION ................................................................................................. 39 7.3 PAH CORRECTION FACTOR................................................................................................... 39 8 ABOUT AND HELP....................................................................................................................... 40 8.1 SOFTWARE MANUAL ............................................................................................................... 40 8.2 TUTORIAL SOFTWARE ............................................................................................................ 40 9 TROUBLESHOOTING ................................................................................................................. 41 Index
- 5 -
1 HARDWARE AND INSTALLATION
This manual describes all the functions of the program in connection with the GRIMM spectrometers. The catalog number is 1.177, the version 3.30. This program is only designed to operate in connection with the spectrometer series from GRIMM Aerosol Technik GmbH & Co KG, Ainring, as shown below. 1.1 Supported spectrometers
The software runs with the following spectrometers from GRIMM: Model 107 (1.107) – include special editions with TSP or Coarse Model 180 / 190 Model 265 (SVC) Model 365 Model 1.101 (Junior) Model 1.102 version 2.60 Model 1.104 / 1.105 / 1.106 / 1.107 / 1.108 Model 1.109 + Sky OPC Model 7.209 Model 7.309 / 7.310. The software v3.30 does support the GRIMM meteorological station include the GRIMM PAH sensor and it does calculate the TSP value (optional and only with dust monitor version 8.10 or 12.10). 1.2 Computer Specifications
The existing program GRIMM 1.177 runs under the operating system Microsoft Windows™ 98/98 SE/ME/2000/XP (95/NT 4.0 not tested). The minimum requirements are: IBM PC Pentium II or IBM-compatible, 64MB RAM (128 MB under Microsoft Windows™ ME/2000/XP recommend), CD ROM (software is also available on 3½ disks), VGA graphic card with 256 colors, 2 GB hard disk, Mouse, keyboard, VGA Monitor with 800*600 resolution, Microsoft Windows™ 98 or higher (95/NT 4.0 not tested). The standard requirements are: IBM PC Pentium III or IBM-compatible, 64MB RAM (128 MB under Microsoft Windows™ ME/2000/XP recommend), CD ROM (software is also available on 3½ disks), VGA graphic card with high color (16 bit)

- 6 -
8 GB hard disk, Mouse, keyboard, VGA Monitor, 1024*768 resolution by high color, Printer incl. MS - Windows - printer driver, Microsoft Windows™ 98 or higher (95/NT 4.0 not tested). 1.3 Operating Specifications
The program runs under the graphic user interface MS-WINDOWS 98/98 SE/ME and under MS-Windows NT 5.0 (MS-Windows 2000)/XP. Previous MS-WINDOWS versions may be incompatible and should therefore not be used.
Hint This manual assumes that the user has a good basic working knowledge of MS-WINDOWS operating systems and commands.
1.4 Software Installation
1. Start up your computer. Insert the compact disc into your CD-ROM drive or
Disk 1 into your floppy disk drive. 2. Click on Start button in the lower-left corner of your Windows screen. 3. The Windows Start menu appears. 4. From the Windows Start menu, select RUN the select BROWSE and select the
setup.exe from either the CD or floppy drive. The installation program will begin. Follow any on-screen installation instructions.
5. Installation procedure will create a work group called GRIMM. 1.5 Initial Software Startup
When you start the software for the first time, the user is prompted to install the driver for the Spectrometer:
1. Start the program. 2. Open the menu [OPTION -> SYSTEM]. 3. Click on [Driver]. 4. Click [Load driver]. 5. Browse to the location of the driver file for your Spectrometer, select it, then and
press [OK]. The software loads the driver and stores the data in the file user.ini. (Driver file is on CD in the directory “...\Driver” or on a separate disk)
6. Press the button [OK]. The program will automatically close. 7. Restart the program.

- 7 -
Attention If the driver file is not displayed in the dialogue box, viewing system files is not enabled on your computer. Please contact your IT department.
1.6 Connection and Set Up of the Spectrometer
This program is used to transfer data to and from the spectrometer using the serial COM port of the user’s PC for configuration purposes and data retrieval. .
Attention Use only the Grimm RS232 cable (#1.143) or you may damage your spectrometer and/or the computer. We recommend the GRIMM serial cable type E or F. Please read the hardware user manual before setting up the serial connection between the spectrometer and the PC.
Turn the spectrometer on (see user manual of the spectrometer for details). After a short startup period the display on the dust-monitor will show the model and the version number of the monitor as well as the current date and time. After that the spectrometer displays the following message: FILTER CHANGED? PRESS +: YES -: NO Press the key [+] only if you have changed the old filter, otherwise press the [-] key. The software will now control the spectrometer. by the software, click on the standby mode.
- 8 -
2 WINDOWS OPERATING SYSTEM
2.1 Background Program
MS-WINDOWS can have several programs running simultaneously with either one or no programs in the foreground, all the remaining programs work in the background. The computer can passively or actively execute other work programs for which they require no interaction of the user.
The Grimm 1.177 Software can be switched to run in the background. In the meantime it is possible to work with other software. The GRIMM 1.177 software will gather all data during this time invisibly in the background. Each active program deprives the computer of certain calculating power. Therefore, if many programs run simultaneously, the computer can offer for each individual program only a little calculating power. The consequence of this is that some programs get insufficient calculating power to fulfill tasks or that the programs are now very slow. In this case you must terminate some programs. 2.2 Executable Files
The main files are “1177v3.exe. and “cfx32.ocx”. The file “1177v3.exe” is the main program and the file “cfx32.ocx” is the graphical module (Active X component). The Active X component was registered in the MS Windows registry when the program was installed. 2.3 Measurement Data Files
The software writes the data gathered from the spectrometer or a memory card reader into two files, e.g.:
mass1.dm mass1.di
Both files will be written to the directory “…\data”, which is a sub directory from the home directory (normally “C:\Program files\Grimm\DustMonitor”). The filter efficiency data are written in two files, e.g.: filter1.dmf filter1.dmi Both files are written to the directory “…\data”, which is a sub directory from the home directory (normally “C:\Program files\Grimm\DustMonitor”). The software creates a directory named \data (normally “C:\Program files\Grimm\DustMonitor\data”). The software saves each measurement file in this directory, except a different directory has selected.
Symbol Key

- 9 -
Fundamentals The system writes all the measured data to the *.dm files and additional data information to the *.di files (* is the user selected file name). The additional data information is time of the measurement, counts/mass mode, model of the spectrometer, etc.
Attention Both *.dm and *.di files must be stored in the same directory whether the data is stored on hard disk or floppy disk.
2.4 File Manager List File
The file manager list file contains the start time, the measurement mode, the directory name and the file name from each measurement file. The name of this file is “MEAS.DAT”. This file is necessary for the File Manager List. You can search for each measurement file with the file manager. NOTE: The File Manager can not find a measurement file, when you move a measurement file in another directory or you delete a file. You must delete the file “MEAS.DAT” when you delete all your measurement files for a backup. The program will create a new empty file “MEAS.DAT” when you start the software. 2.5 Configuration File
The following file must be in the home directory. All information entered in the menu group [OPTIONS] is stored in the file “USER.INI” including driver files. The software creates a new file “USER.INI” with default parameter, when the file does not exist.
Hint If you have corrupted executable/command files, reinstall the software and run the setup procedures again.
2.6 Temporary file
Com1a.tmp Temporary file for reading the memory card. Com3a.tmp Temporary file for reading the memory card with a modem.

- 10 -
3 PARAMETER AND DEFAULT SETTINGS
3.1 The Menu Group [OPTIONS]
All the measurement and display configurations are made in this group menu. This is a short overview on the possible settings which will be described later in detail. 1) Dust Monitor
Select and enter measurement parameters. 2) Automatic
Select and enter the start and end times of up to 20 series of automatic measurements or program the timer from the
Spectrometer. 3) Graph
Select and enter all required parameters for display of measurement values. 4) Sensor
Enter the calibration data from the analog sensors. 5) Alarm
Select the desired values for alarm (e.g. the TWA value for dust) as well as for the attached optional sensors.
6) Location Select and enter the number and the name and the gravimetric factor for every measuring location or place.
7) Language Select the language English or German.
8) System Manage the driver list and enter important modem parameters.
3.2 Spectrometer Parameter
First page [Measurement]
The program will ONLY display the options available for the instrument being used. For example a Spectrometer Model 1.107 with a firmware version of 7.30 will function only in Environmental mode and with two sample intervals (six second and one minute). Therefore, they are the only choices that will be available.
- 11 -
Measurement Mode Environmental: PM-10, (Coarse), PM-2.5, PM-1.0 in µg/m³ (TSP optional). Shows only coarse data when [Differential] in the dialogue box OPTIONS GRAPH
second page CALCULATIONS. Occupational health: Inhalable; Thoracic; Alveolic in µg/m³. Mass distribution: The values are displayed in 5, 8, 16 or 32 size channels in µg/m3 Count distribution: The values are displayed in 4, 8, 12,15 or 31 size channels in particle/liter. Sample Period Interval 1, 2 or 3 second: These sample periods are only for model 1.108 version 8.60. You must select Count distribution and an 8 channel mode in the group multiplex to enable the 1, 2 or 3 second sample period group. Dust monitors model 1.109 version 12.30 with a firmware ID “F” or higher have also an interval of 1,2 or 3 second. You must select Count distribution and an 16 channel mode in the group multiplex to enable the 1, 2 or 3 second sample period group. 6 seconds - Fast mode The values are sent from the Spectrometer to the computer every 6 seconds. Only a few spectrometer models can save the data in 6 second interval on the memory card. Interval 1/5/10/15/30 or 60 minutes The averaged values are sent to the Spectrometer every 1/5/10/15/30 or 60 minutes to the computer. Multiplex only model 1.108 / 1.109 (Firmware D or higher) The Spectrometer model 1.108 (and model 1.109 version 12.30 with firmware ID “F” or higher) can works with three different size ranges. The normal size range is from 0.30µm (0.25µm) up to greater 20µm (32µm) in 15 (31) different size channels. This model can also work in a multiplex mode. In this mode the unit has a size range from 0.30µm up to greater 1.6µm (2.0 µm) OR from 1.6µm (2.0µm) up to greater 20µm (3µm) in 8 (16) different size channels. This multiplex mode is recommended when you measure only in the fine size ranges, e.g. for filter test or permanent measure of coarse particles.

- 12 -
Second page [Unit/C-factor] Unit parameter Standby after measuring: After measurements are recorded, the current task is closed and the Spectrometer is set to Standby Mode When this option is disabled and you use a modem, the program starts the spectrometer after receiving the data from the memory card C-factor from location list The software sends the C-factor from your
location list to the Spectrometer. The C-factor is independent of the recorded location number. Environmental dust monitors model 107/180/190 works without C-factor. C-factor/Location Number Location number from PC: The software sends the selected location number from the right field [Location:] to the Spectrometer. Read memory card from this location: The Spectrometer sends only the data from the memory card which was measured with this location number to the PC. This will shorten the data transfer time as not all the data on the memory card is being transferred provided there are not more than one location number.. Third page [Computer/modem]
Group [Serial interface] Select the serial interface on which your Spectrometer is connected with the computer. Normally a desktop computer has two serial interfaces (COM1 and COM2) and a notebook has only one serial interface (COM1). Group [Baud rate] Set the baud rate for the data transfer from the memory card to the PC. Normally set the fastest transfer rate. If you use a slower computer or you have problems with the data transfer, then set a slower transfer rate.

- 13 -
Group [Modem parameter] Modem on If this option is selected, the software establishes the communication with the Spectrometer over an analog modem connected to the selected COM port and receives the data via analog modem connection. The respective modem settings can be configured under Menu OPTIONS SYSTEM Second page MODEM Phone number: Input the area code and the telephone number of the modem connected to your Spectrometer. Verify connection The program calls the Spectrometer and sends the Standby order. The software sends a detailed error message if the connection failed. You must select all the modem parameters, including baud rate and port number in the dialogue box [System] second page [Modem]. 3.3 Automatic start and stop Parameter
First Page [Presetting with attached PC]
Enter a list of series of up to 30 sample start and end times. The software will start and stop the measurement using the entries in this list. To program the Spectrometer for automatic measurement: 1) Insert start date and time in
your country format. You can also open the calendar with the down arrow on the right side. You can move forward and backward month by month with the left and right arrows. Click on the date and the software take this date. At next step insert the time in your country format.
2) Insert stop date/time in same format as above. 3) Check the field [Read memory], if you want to read the data from the internal
memory or from the memory card at the start time. 4) Daily automatic measurement start and stop times can be set by simply clicking at
[Daily] and then selecting the appropriate start and stop times. 5) Check the field [Modem] and the program will receive the data via the modem
connection and not from the serial interface. In this case you must input the phone number in the field [Enter TEL-Nr.:] in the dialogue box [Spectrometer].
6) Press the button [INSERT].
- 14 -
To erase one entry: 1) Select the entry to be erased. The entry will be highlighted. 2) Press the command button [ERASE] To quit press the button [END] when you want to leave the program. If you want to cancel the complete file, click at [CLEAR ALL]. After all the information is entered you can leave the dialog box by pressing [END]. 1) Note that daily automatic measurements CANNOT be mixed with single sample
measurement data. Therefore you can only activate the [Daily] function if the list box is empty.
2) Select date and time the same way you have set in the MS-WINDOWS under [International] your proper date and time format.
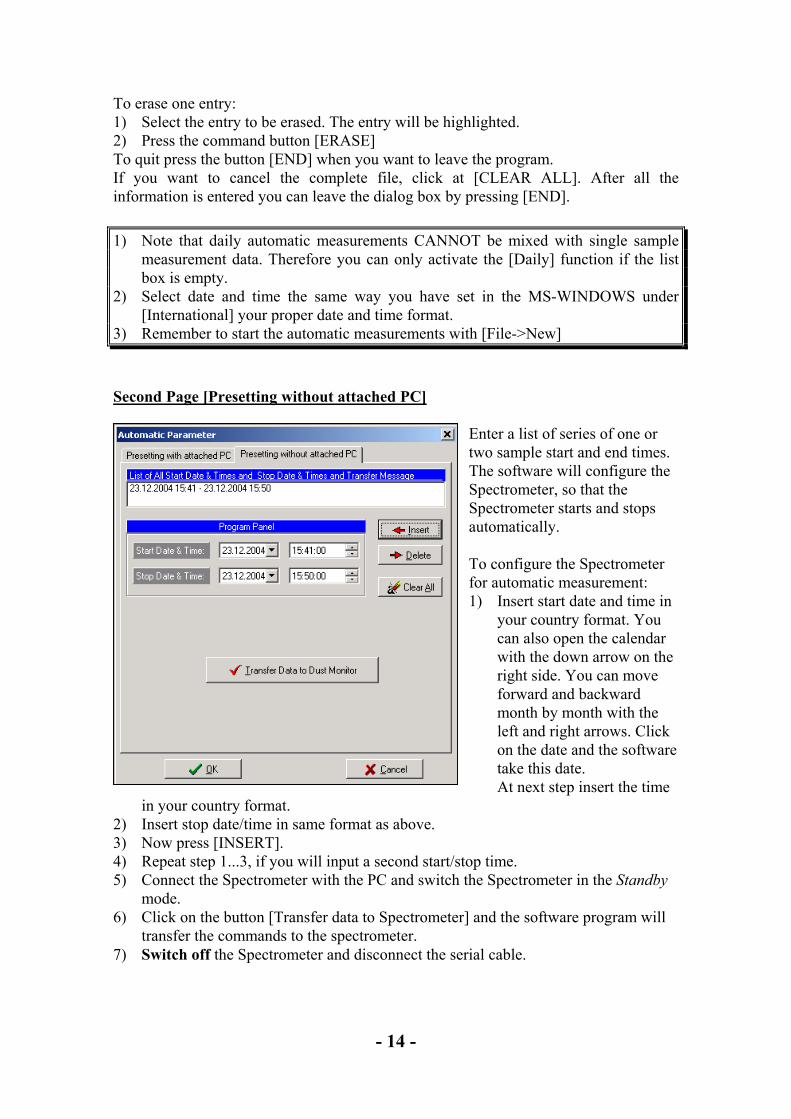
3) Remember to start the automatic measurements with [File->New] Second Page [Presetting without attached PC]
Enter a list of series of one or two sample start and end times. The software will configure the Spectrometer, so that the Spectrometer starts and stops automatically. To configure the Spectrometer for automatic measurement: 1) Insert start date and time in
your country format. You can also open the calendar with the down arrow on the right side. You can move forward and backward month by month with the left and right arrows. Click on the date and the software take this date. At next step insert the time
in your country format. 2) Insert stop date/time in same format as above. 3) Now press [INSERT]. 4) Repeat step 1...3, if you will input a second start/stop time. 5) Connect the Spectrometer with the PC and switch the Spectrometer in the Standby
mode. 6) Click on the button [Transfer data to Spectrometer] and the software program will
transfer the commands to the spectrometer. 7) Switch off the Spectrometer and disconnect the serial cable.

- 15 -
To erase one entry: 3) Select the entry to be erased. The entry will be highlighted. 4) Press the command button [ERASE] To quit press the button [END] when you want to leave the program. If you want to cancel the complete file, click at [CLEAR ALL]. After all the information is entered you can leave the dialog box by pressing [END]. It is not possible to program the spectrometer when you use a modem 3.4 Graph
First Page [View channels]
Combo box [Operational Mode] Click on the down arrow to open the list. Select one of the modes in the list. The group [Size Channels] shows the channels of the selected mode. Group [Channels] Click on channels to be displayed graphically. All activated channels are displayed with an "X". Group [Sensors] Click on the sensors to be displayed in the graphic. All activated sensors are then displayed with an "X". This group is invisible, if you do not use an analog sensor.

- 16 -
Second Page [Calculation]
Group [Real Data/Percent] Shows the absolute values or calculate the size distribution in percent. The percent calculation is only in the mass or in the count mode available, not in the environmental or occupational health mode. Group [Channels] Shows the values accumulative or differential. Accumulative means, that the values from the different channels are added up. Each smaller size channel is equal or higher as the previous channel. Before the physical unit is the “>” sign. The differential mode shows the values in size ranges, e.g. the value from 0.3-0.4µm, 0.4-0.5µm,
The program shows the coarse data when you select [Environmental] in the dialogue box OPTIONS SPECTROMETER MEASUREMENT MODE and [Differential] in the group [Channels]. Group [Calculation Volume] Shows the values in different physical units. You can choose between particles/µg per liter/m³/cubic foot. Standard means that the physical unit is in the count mode particle/liter and in the mass modes µg/m³. Group [Data Presentation] Sliding average The software permits to calculate the mean values continuously from the last 10 measurements. This may be of interest on longer data sets if the sudden jump of mass changes is not needed. This function works only in the fast mode (6 second sample interval). Scientific Number Shows the data in the table in the scientific data format with exponent or in the normal format without exponent. Group [Histogram/Calculated Surface Aerea] Histogram The program shows the measurement values in a histogram when it checked and in a time diagram when the field is unchecked.

- 17 -
Calculated surface area The software calculates the surface area from the particles. The software assumes that the particle is a sphere and calculates the area of these particles. This is an approximate value because the particles naturally have many different geometrical forms.
Attention The software allows you to select an algorithmic calculation . It is not a good idea to calculate environmental or occupational health data with PERCENT or to calculate occupational data DIFFERENTIAL. The software warns you with a red info panel at the measurement window or with a warning message, when you export such data. However, it is useful to calculate the environmental data DIFFERENTIAL, because the result is the new channel COARSE (PM10 – PM2.5).
Third Page [Axis/Zoom]
Group [Y-Axis] Automatic scale If you select this button, the software will automatically display the highest value shown. Maximum If this button is not activated you have to enter your desired limit. The Y-axis will remain at the same limit independent of the size of the values. This only applies for the linear and the 3-D graphic. Values above the limit are not shown. Use only the maximum limit. The [Calculated Average] function is not available in the online mode. The software shows the data in the online mode always with the selected
SAMPLE INTERVAL. Pixel value The parameter pixel value allows you to stretch the Y-Axis. A value that sets the equivalent unit representation of Y-axis in pixels. This means, that you can change the factor in pixels, to accomplish vertical scroll bars in the chart window. The default value is 0.

- 18 -
The value 10 means, that a concentration of 10000 particles/liter needs 1000 horizontal pixels. Is the graph area is too small, then a vertical scroll bar appears. You can set the pixel value for
• the measurement graph, • the sensor graph and • for the filter efficiency graph (*.dmf files).
Group [Calculated Average] Calculate the mean value for 1 minute or 1 hour or 1 day or 1 week or 1 month. This is only possible if the sample interval time (menu [Options->Spectrometer]) is lower than the average time. This function is not available in the online mode. Forth Page [Stripes]
Combo box [Operational Mode] Click on the down arrow to open the list. Select one of the modes in the list. The group [Size Channels] shows the channels of the selected mode. Stripes List This is a method that allows you to pass two values in which a color frame is to be displayed in the background of the chart. This function is very useful when you want to denote a specific area in the chart. From (Y-Axis) Numeric value corresponding to the beginning of the stripe.
To (Y-Axis) Numeric value corresponding to the ending of the stripe. Stripe Color Click on the panel of the right side of the line to select a color for this stripe. It displays a Windows dialog box for selecting colors. Clear List Delete the stripes list of the selected operational mode.

- 19 -
Fifth Page [Graph] Group [Graph view] Save Graph View Save the user parameter of the measurement graph and of the sensor graph. The program stores the size, color and view of the graph. Reset Graph View Delete the user parameter of the measurement graph and of the sensor graph and set the default parameter.
3.5 Sensor Calibration Data
Grimm Spectrometers are capable of measuring with one to four auxiliary environmental sensors i.e. temperature, relative humidity, air velocity, pressure. The corresponding parameters (factor, offset) for each sensor match only with the selected instrument. The software can read the calibration data from your analogue sensor, when you press the button [Scan Sensor Data]. It is
necessary for the spectrometer to be in STAND BY mode and to be connected with the sensor connected and attached to a computer.. Only GRIMM sensors with the serial number xxExxxxx have implemented an EPROM, which contains the calibration data. It is not possible to scan the sensor calibration data from spectrometers with serial numbers xAxxxxxx to xDxxxxxx. It is not possible to scan the calibration data from old sensors or from sensors which are not manufactured by GRIMM. In this case you must enter the sensor calibration data manually. Do not change the sequence of the sensors. You can program the dust monitor with the calibration data from sensors without EPROM’s (see Hardware manual). In this case the software can also scan the calibration data from such sensors.

- 20 -
Group [Sensor Calibration Data] To select the correct data enter: Serial Number Enter the serial number of the sensor. When the sensor has no serial number, then enter any text. The software does not support a sensor when this text field is empty! Name Enter the corresponding name for the sensor i.e. temperature, humidity, wind speed. Unit Enter the corresponding unit for the sensor i.e. °C, % rH, m/s, Pa. Factor Enter the corresponding span conversion factor for the sensor to convert the voltage into the corresponding measured value. Example: Temperature sensor with factor 10 means, that 1 voltage depends with 10 °C. Offset Enter the voltage value that corresponds with the sensor value 0. Example: Temperature sensor with offset 2 means, that 2 V is 0 °C. 0 V is –20 °C (factor is 10).
Hint You can not connect more than three sensors on the analogue input from the spectrometer. The fourth sensor is always an internal sensor e.g. barometric pressure or differential pressure.
Group [One Wire Bus] Newer dust monitors (S/N: xFxxxxxx or xGxxxxxx) supports sensors with an one wire bus (OWB) interface. Please check the fields [Wind speed/wind direction], [Rain] and/or [PAH] (optional), if you use one or more of such sensors. The software shows the error message [Wrong sensor par.] by an online measurement, when the selected OWB sensors are not identical with the connected OWB sensors.

- 21 -
3.6 Alarm parameter
Here it is possible to enter the values which should be monitored not to exceed configured high limits. In the main window of the software the number of alarms is displayed. Alarm Channel Select the desired size channel for each measurement mode you want to record as an alarm level. Alarm value
Enter the desired alarm value as a number for each mode. 3.7 Location list
The Spectrometer can store the records for measurement for up 99 locations. A short name for easier identification of the location can be given. This short name will appear in the window [Measurement] group. [Measurement Parameter]. To enter or change a name use
the following steps: 1.) Insert the number of the location you want to change 2.) Enter the new name for this location 3.) Enter the gravimetric factor (C-factor) for this location 4.) Press the command button [INSERT] To quit press the button [END] If you want to cancel the complete list, click on [CLEAR ALL].

- 22 -
3.8 Language
Please close all open windows, before you change the language! Please select one language in the list and press [OK]. The software change the language of all windows, except open windows.
3.9 System parameter
First page [Driver] The program uses individualized and customized unit drivers to control the Spectrometer and analyze the measurement data protocol. The driver contains all the information about the Spectrometer. You must load the unit driver for your Spectrometer, before the program can work with your spectrometer. Load driver You MUST load your unit driver from the floppy disk or from your
installation CD. The unit driver has the extension *.drv. Restart the software. Change active driver If there is more than one driver in the list, then you must activate one of the drivers that corresponds to the instrument the computer is connected to. Delete driver list Delete all the drivers in the list.
Attention The software deletes the file USER.INI, when you press the button [Delete driver list]. You must load a driver file after the restart of the software and you must enter all the parameters in the menu group [OPTIONS].

- 23 -
Second page [Modem] Group [Modem dialogue] This group contains the messages which were send from modem to modem. The default parameter is valid for many countries. Only experienced users should change these parameters.
Dialog Description Answer Message for a received call Arq Message for safety connection Busy Message when the line is busy Connect Message, when the connection is right Dial Order for dialing Init Initialize string for the modem No connect This message is send to the computer, when the modem gets no
connection with the spectrometer Ring Message, when the modem detects a ring Group [Modem parameter] This group contains important modem parameter. The default parameters are valid for many countries. Only experts shall change these parameters. Parameter Description Dial type Dial with the old impulse dial or the new tone dial Handshake Select the handshake Port Select the port where your modem is connected(Default is Com 3) Baud rate Select the maximum baud rate for your modem (56 kBaud is
recommend) Rings Number of dial tones, before the modem connect the call Wait connect Cancels the call after this time (in seconds), when no connection
could be established Wait redial The software repeats the call after the time in seconds, configured
under Wait redail, when no connection could be established.

- 24 -
Third page [Parameter] Group [Save File] The software creates the file name automatically when this check box is selected. The file name consists of the date and the time and a five digit number. The program saves the file in the directory …\data, which is in the home directory (normally “C:\Program files\Grimm \DustMonitor”).
Drive and directory for the measurement data Select the drive and the directory, in which the measurement data are saved. If you have unchecked the field [Automatic file name], then you can select and change each directory before the measurement starts.

- 25 -
4 MEASUREMENT
4.1 The Menu Group [File]
In this group you may select the following possibilities: 1) New
Starts a measurement directly (online) or reads the memo card or activates the automatic measurement cycle.
2) Open This option allows you to select a stored data file. The chosen file is opened and the values are displayed on the screen.
3) Delete File Here you can delete a measurement file.
4) Create filter file Create a new file from an Upstream file and a
Downstream file. The new file shows the filter efficiency. 5) Export File
Create an ASCII text file from a measurement file. A spreadsheet software can import this file.
6) Search file Search for an older measurement file.
7) Print Print the report from a measurement or from a filter efficiency file.
8) Preview Preview the report from a measurement or from a filter efficiency file.
9) Printer configuration Select and configure your printer
10) End Terminates your measurement.
4.2 Dialog box [New]
If you would like to start a new measurement, start the automatic mode or if want to see data from the memo card, select the [New] dialog box. First page [Numeric] You can select between three possibilities: 1.) Start a measurement in the online mode 2.) to read the memo card or 3.) start the automatic measurement.

- 26 -
The program will first ask you for a file name for your data if the parameter [Automatic file name] in the dialog box [System] is unchecked.
Attention Selecting an already existing file name will overwrite the existing data.
After you have confirmed your entry with [OK], the next window appears. 4.2.1 Starting Measurement (Online)
The Spectrometer displays the data continuously in on-line mode.
Notice 1.) Answer FILTER CHANGED when Spectrometer switched on. 2.) Spectrometer must be connected to computer with a serial cable (Please refer to the user manual of the spectrometer
4.2.2 Automatic Measurement (Automatic)
Automatic measurement is controlled by the software through the computer. Each automatic parameter setting in the dialog box will be carried out automatically. The measurement is started/stopped at the time entered in the dialog box [Automatic-Parameters].
Notice 1.) Answer FILTER CHANGED when Spectrometer switched on. 2.) Spectrometer must be connected to computer with a serial cable
4.2.3 Reading Memory Cards
The program read the memory card or the internal memory from the Spectrometer. After the data transfer is finish, the program shows a list with the following information: • Start - Start date/time of measurement • Stop - End date/time of measurement • Loc - Location number of data measurement. You must select all the measurement cycles, which you will save on the hard disk. After then press the button [Save] and the program save this measurements on the hard disk.

- 27 -
The maximum size of one measurement cycle is 32700 data sets. The software divide the measurement cycle in two or three files, when the measurement cycle is larger than 32700 data sets. 4.3 Display Stored Files
With the menu [File ---> Open file] you can open a stored measurement file. The following dialog box is a standard - dialog box (file selector box), as this uses also the graphic user interface MS-WINDOWS. If you have difficulties, refer to your MS-WINDOWS manual for detailed instructions. You can select between [Measurement Files] and [Filter Files] in the combo box [File Type]. [Measurement Files] shows you all the measurement files (*.dm) and [Filter Files] shows you all the filter efficiency files (*.dmf) from the selected directory. The chapter 4.5 explain, how you can create a filter efficiency file! 4.4 Delete a measurement file
Select a measurement file and press [OPEN]. The program will delete the *.dm and *.di file. 4.5 Create filter file
To create a filter efficiency file use the following steps:
1. Establish and set instrument for either mass or particle size measurements 2. Make a measurement before the filter and save this measurement. This
measurement is called DOWNSTREAM measurement. 3. Make a measurement after the filter and save this measurement. This
measurement is called UPSTREAM measurement 4. Click File - Create Filter File. You will be prompted to select the upstream
file. Scroll through file or do a wildcard search for the first two letters of your file name with the extension of .dm.
5. Highlight and click OK 6. The downstream file will appear with the file name of the upstream file in the
file name dialog box. Scroll down/do a wildcard search/change the file name to XXb.dm [where xx is the first two letters of the file name] Highlight and click OK. "File Saved!"
7. The software creates a filter efficiency file. Choose the menu [File->Open file] and a file selector box appears. The software uses the name of the downstream file. The extension is *.dmf and *.dif for the corresponding header file.
8. Select the file type [Filter file] and all the list shows all the filter files in this directory. Choose the filter file and open the file with the [OK] button.
It is helpful for you, when you use for the upstream file the file name “up… .dm” and for the downstream file “down… .dm”. You can see, which file is a upstream file and which is a downstream file, e.g. up01.dm and down01.dm.

- 28 -
4.6 Create a text file for a spreadsheet program
If you would like to transfer your results into a spreadsheet or word processor program, simply transfer the data in ASCII-format. To do so, first enter the following parameters, then press the button [Export] and select the files to be transferred. Group [Separator] Individual measurements can be separated with a comma, a semicolon, a space or with a tabulator sign. If you work with MS-Excel 5.0 or higher, for example, we recommend you separate with a
tabulator. Group [Data] Option to select to export the measurement data, the service data, the sensor data, or a combination of the three possibilities. Group [Unit Parameter] Headline Create a headline that describes each column. Space line Create a space line between each data line. Thousand Separator Create a thousand separator after each 3 digits after the decimal comma. Export Create text files that contains the measurement data or filter efficiency data. These files can be read from many spreadsheet programs, e.g. MS-Excel®. The software appends the text file when an older text file with the same file name exists! You can select more than one file in the file selector box. The program creates an ASCII file for each selected measurement file. The export module calculates the data with the chosen parameter in the menu OPTIONS
GRAPH CALCULATION. The program shows a warning message when you select in the menu OPTIONS GRAPH CALCULATION a combination of calculation algorithmic which is normally not meaningful. You can continue with [YES] or you can stop the data export with [NO].

- 29 -
Button [Open Excel] Open MS-Excel, if installed, and load the selected text file in MS-Excel. The software shows the error message “The specified file was not found”, when MS-Excel is not installed. Button [Print] Send the selected text files to a printer. NEW! You can select more than one file in the file-selector-box. Button [End] Close the dialog box. 4.7 File Manager (Search File)
This option will help you to search for specific measurement file on your PC.
The complete file name includes the drive character, and all the directory names could not be longer than 255 characters. The program does not add the measurement file in the list, when the complete name including the directory is longer than 255 characters! The software add a measurement file also in the list, when you overwrite an existing file. In this case exists a double of the measurement file in the list! Group [Search Criteria]
You can search with the filter [Date] or [Mode] or with both search filter. Group [Date] Select a date. A helpful calendar opens, when you click at the down arrow in the date field. You can set the search filter “before the date”, “only the date” or “after the date”. Group [Mode] You can select each combination of modes. The software shows only the measurement files, which contains data from the selected modes.

- 30 -
Button [Search Files] Press the button [Search Files] after you have selected your search filter. Button [Load Files] You can open some files in the list. At first select between 1 or 7 lines in the list. Then press the button [Load files] and the program opens all the selected files. The program can not open more than seven measurement files. Button [OK] Close the File Manager. 4.8 Print report
Print a report from the active measurement window. The report contains the mean value data and some information about the measurement. 4.9 Preview report
Shows the preview report from the active measurement file. Symbol Description Zoom to fit Shows the complete report page 100% Shows the report in the original size Zoom to width Shows the report to width Arrows Without function Printer setup Allows you to specify which of several printers will be used to print
the report and also to configure your printer. Print Print the report Save report Save the report as Quick Report file. Load report Load an old Quick Report file. Close Close the preview window. 4.10 Printer Configuration
Allows you to specify which of several printers will be used to print the report and also to configure your printer. All open windows can be printed by clicking on the [OK].
- 31 -
5 MEASUREMENT DISPLAY
5.1 Numerical and Graphical view
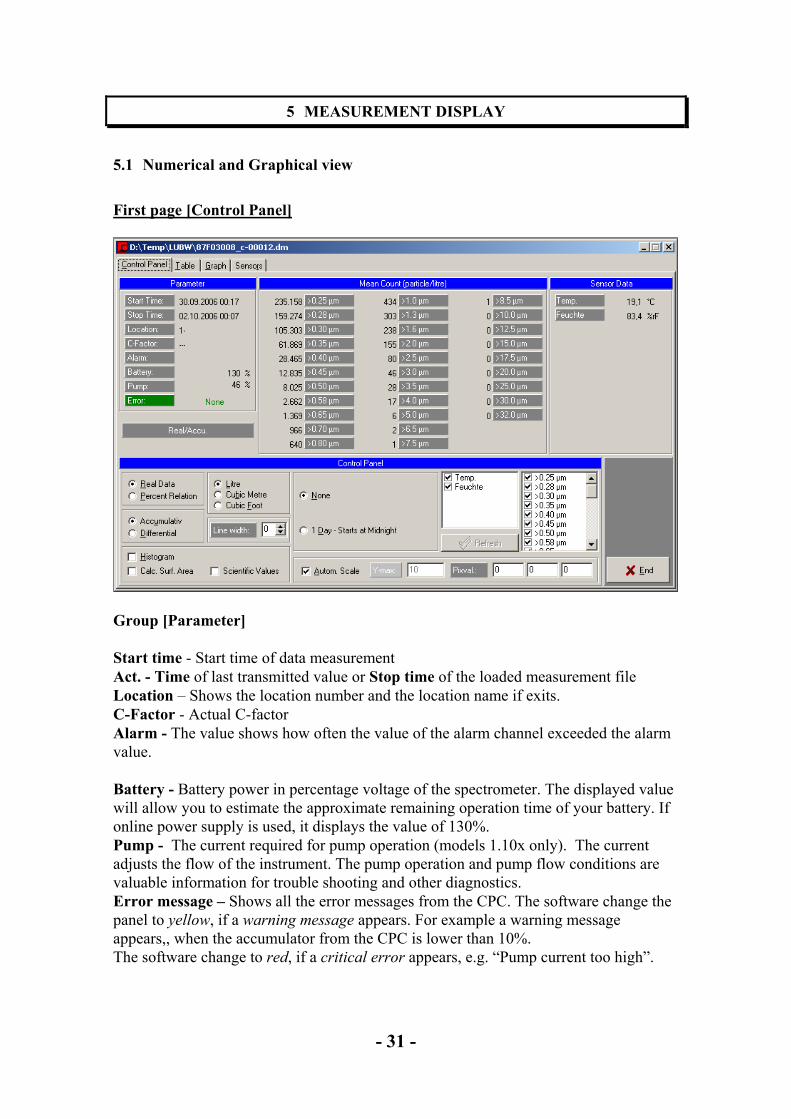
First page [Control Panel]
Group [Parameter] Start time - Start time of data measurement Act. - Time of last transmitted value or Stop time of the loaded measurement file Location – Shows the location number and the location name if exits. C-Factor - Actual C-factor Alarm - The value shows how often the value of the alarm channel exceeded the alarm value. Battery - Battery power in percentage voltage of the spectrometer. The displayed value will allow you to estimate the approximate remaining operation time of your battery. If online power supply is used, it displays the value of 130%. Pump - The current required for pump operation (models 1.10x only). The current adjusts the flow of the instrument. The pump operation and pump flow conditions are valuable information for trouble shooting and other diagnostics. Error message – Shows all the error messages from the CPC. The software change the panel to yellow, if a warning message appears. For example a warning message appears,, when the accumulator from the CPC is lower than 10%. The software change to red, if a critical error appears, e.g. “Pump current too high”.

- 32 -
Group [Measurement data here [Mean Count (particle/liter)] Indicate the measurements so far transferred by the Spectrometer. If you evaluate your measurement file, see also the median value of the individual channels in reference to the entire measurement. Group [Sensor data] Display of the connected environmental sensors. These measurements are sent by the Spectrometer to the PC. Info Panel (Dark grey panel) This panel inform you, which calculation algorithm is used by the program on the measurement data. You can select the different calculation algorithm in the menu [OPTIONS GRAPH Calculation]. Real / Percent Shows the real data or calculate the data in percent. Accu / Diff. Shows the data accumulative or differential. Slid.Av. Calculate a sliding average from the last 10 measurement data. This
is only possible, when you measure in the 6 second sample interval. The panel is red, when you selected in the menu OPTIONS GRAPH CALCULATION a combination of calculation algorithmic, which is normally not meaningful. Group [Control Panel] The Control Panel allows you to change the calculation and data representing parameters. Please read chapter 3.4 “Second page” and “Third page” for additional information. The Conrtol Panel is only enabled, when you load a measurement file. You can not change any parameter, when you runs an ONLINE measurement. Second page [Table] Shows the measurement data in a table. Third page [Graph] Show the measurement graph for all selected channels. Forth page [Sensors] Shows the sensor graph, if a sensor is connect. 5.2 Data Files Displays
Data files may be displayed graphical. The table below describe the symbols in the tool bar from the graph.

- 33 -
Symbol Description Camera Copy a bitmap graph in the clipboard Shear Copy the values in the clipboard. Printer Print the graph Area diagram Shows the data as area diagram Bar diagram Shows the data as bar diagram Line diagram Shows the data as line diagram Point diagram Shows the data as point diagram View 3D Shows the graph as 3D or as 2D graph Angles 3D This property shows a dialog that allows you to set/reset the 3D
view and the angles used to draw the chart. Cluster Shows the values side by side or in succession Legend Shows the legend on the right side, if you have choose more than
one channel Horizontal grid Switch on or off the horizontal grid Vertical grid Switch on or off the vertical grid Font Change the fonts of all the titles, legend and values Tool Switch on or off the legend, color bar, pattern bar and data table With the help of the horizontal scroll bar at the lower screen board you can move within your measurement file.

- 34 -
6 FILTER TEST (OPTIONAL)
6.1 General This software can control two identical dust monitors simultaneously. You can use this function to measure the efficiency of a filter. The first dust monitor (DM1) measure the dust before the filter. This is the UPSTREAM measurement. The second dust monitor measure the dust after the filter. This is the DOWNSTREAM measurement. 6.2 Select driver files
You need two special driver files to activate the filter test mode. These special driver files have the identification character “F”. At first you load the two special driver files with the button [Load Driver] in the list. You can find these driver files on your CD. Then select the first driver file in the list
and press the button [Change Active Driver]. Select this driver file from the dust monitor, which represent the dust monitor before the filter (UPSTREAM). At following the button [Change Driver (DM2)] appears. Select the second driver file in the list and press the button [Change Driver (DM2)]. Select this driver file from the dust monitor, which represent the dust monitor after the filter (DOWNSTREAM).
- 35 -
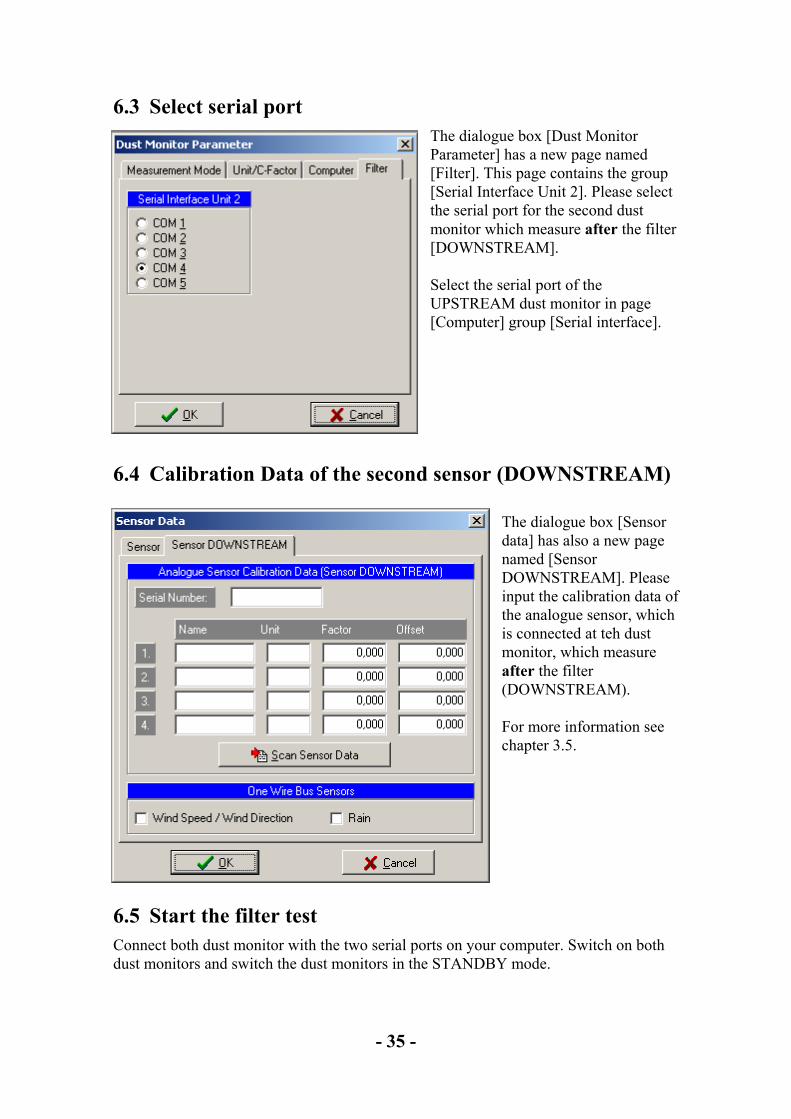
6.3 Select serial port The dialogue box [Dust Monitor Parameter] has a new page named [Filter]. This page contains the group [Serial Interface Unit 2]. Please select the serial port for the second dust monitor which measure after the filter [DOWNSTREAM]. Select the serial port of the UPSTREAM dust monitor in page [Computer] group [Serial interface].
6.4 Calibration Data of the second sensor (DOWNSTREAM)
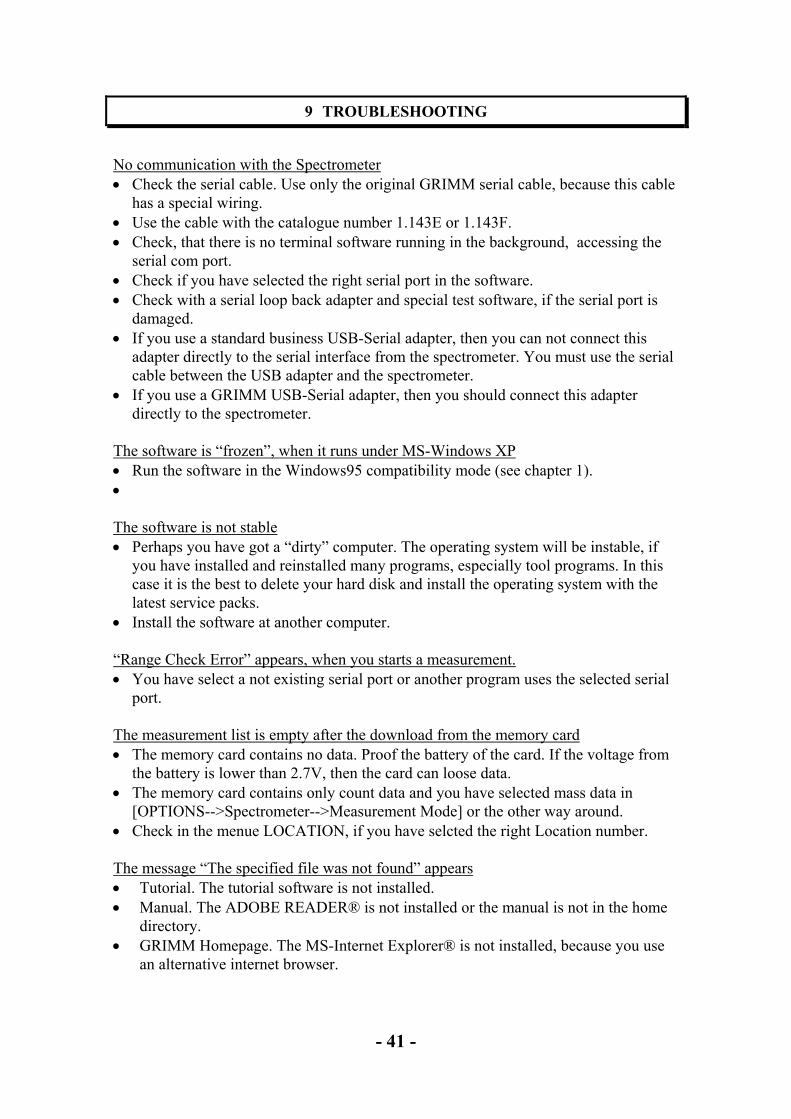
The dialogue box [Sensor data] has also a new page named [Sensor DOWNSTREAM]. Please input the calibration data of the analogue sensor, which is connected at teh dust monitor, which measure after the filter (DOWNSTREAM). For more information see chapter 3.5.
6.5 Start the filter test Connect both dust monitor with the two serial ports on your computer. Switch on both dust monitors and switch the dust monitors in the STANDBY mode.

- 36 -
Select the menu group [File], menu [Start filter test] to start the filter test. At following the software opens three child windows for the UPSTREAM unit, the DOWNSTREAM unit and to show the filter efficiency. Please note, that the software create the file name automatically. You can not input a file name!
6.6 Finish the filter test Press the button [STOP] of the child windows [Filter Efficiency] to finish the test. Please wait until all the three windows are closed. 6.7 Open the files The software create three files. The first file name begins with “up... .dm” (and *.di) and contains the measurement before the filter (UPSTREAM). The second file name begins with “down... .dm” (and *.di) and contains the measurement after the filter (DOWNSTREAM). The third file has the extension *.dmf (and *.dmi) and contains the filter efficiency values. Please do not forget to select the data type in the file-selector box from *.dm to *.dmf. Otherwise the file selector box does not shows the filter efficiency files.

- 37 -
7 EXTRAS
7.1 Statistical Evaluation
The program calculates with the data of a measurement file some statistical values. You can calculate with the data of a filter efficiency file too. In this case select in the file selector box the file type from “Measurement Files” to “Filter Files” and select a *.dmf file. Order Statistics • Minimum
The smallest value of the data set. • Maximum
The largest value of the data set. Descriptive Statistic • Statistical range
The statistical range is defined as the difference between the smallest and the largest value of a set. R = Maximum – Minimum.

- 38 -
Moments • Arithmetic Mean
The arithmetic mean of a set of values is the quantity commonly called the mean or the average
• Variance The variance is the middle square deviation of a set of values from the arithmetic mean.
• Standard Deviation The standard deviation of a probability distribution is defined as the square root of the variance.
• Variation Coefficient The variation coefficient is defined as the division between the standard deviation and the arithmetic mean. V = s / x.
The important statistical parameters are the variance and the standard deviation. The statistical range is very “runaway” sensitive. The variation coefficient is scale independent and gives you the variability of a measuring better as other parameters. Group [Date / Time Range] You see in the first line from this group the date/time range from the loaded measurement file. You can reduce the date/time range with the date/time edit fields below. You must calculate the statistical values again with the button [CALCULATION], when you change the date/time range. Group [Data] You can select between the measurement data, the sensor data or both. The software calculate only the statistical values from the selected data sets. You must calculate the statistical values again with the button [CALCULATION], when you change anything. Group [File Parameter] This group shows you some information from the loaded measurement file: the mode, the C-factor, the location number, the directory and the name of the file. Button [Calculation] You must recalculate the statistical values when you change any of the parameters in this dialogue box. Button [Load file] The program delete the actual data from the (computer) memory and load new measurement data. After then the program calculate the statistical values from the complete data of the file. Button [Close] Close the dialogue box.

- 39 -
7.2 Gravimetric evaluation
This function allows you to correlate the measured mass values to a reference value obtained by a gravimetric measurement. Note that gravimetric evaluation is not possible for measuring in mode
COUNTS (particle/liter) as only the numbers of the particles are counted and there is no reference to the dust mass. Procedure: Detailed information’s to the gravimetric evaluation take from the spectrometer user manual! 1.) Weight the collected dust mass of the filter. Enter this value at the first text field
[Real Filter Weight]. 2.) Enter the counted dust mass from the spectrometer in the text field [Calculated
Filter Weight]. 3.) Press the command button [Calculate] to calculate the gravimetric factor. 4.) Overwrite the old C-factor with the new C-factor with the button [Transfer to File].
The program change the C-factor in the selected file. When you open this file later with [File-->Open], than the programs shows the measurement data include the new C-factor.
Do not change the C-factor if you use a spectrometer model 107 (1.107), 180 or 190. These units should be run with the C-factor 1.00. 7.3 PAH correction factor
This function allows you to correlate the measured PAH values to a reference PAH value obtained by a calibration procedure. Procedure: Detailed information’s to the PAH evaluation take from the PAH user manual!
1. Enter the reference value at the first text field [Reference Value]. 2. Enter the corresponding value from the instrument in the text field [Instrument
Value]. 3. Press the command button [Calculate] to calculate the PAH correction factor. 4. Overwrite the old factor with the new factor with the button [Transfer to File].
The program change the factor in the selected file. When you open this file later with [File-->Open], than the programs shows the measurement data include the new PAH correction factor.

- 40 -
8 ABOUT AND HELP
8.1 Software manual
The menu [Manual] starts the ADOBE READER® and opens the software manual. This feature is not functional, when you do have not installed the ADOBE READER®. 8.2 Tutorial Software
The program starts the tutorial software. The tutorial contains information of the spectrometers. The [Tutorial 1.101 – 1.109] shows you in some pictures, how you can use the different components of the spectrometer system. The [Tutorial 1.165] shows in some pictures, how you can build up the weather housing
The [Operation 1.101 – 1.109] explains the various possibilities of the keyboard of the spectrometer. You must press the red key at first, then you must take off the key and at last you must press one of the yellow key. Some features are available, when the spectrometer is in the standby mode. Other features are available in the running mode or in both modes. The [Size channels 1.101 – 1.109] shows the size channels from all spectrometer models and versions. You must select the spectrometer model and version number in the menu [OPTIONS MODEL], before you open the dialogue box [Size channels 1.101 – 1.109].
- 41 -
9 TROUBLESHOOTING
No communication with the Spectrometer • Check the serial cable. Use only the original GRIMM serial cable, because this cable
has a special wiring. • Use the cable with the catalogue number 1.143E or 1.143F. • Check, that there is no terminal software running in the background, accessing the
serial com port. • Check if you have selected the right serial port in the software. • Check with a serial loop back adapter and special test software, if the serial port is
damaged. • If you use a standard business USB-Serial adapter, then you can not connect this
adapter directly to the serial interface from the spectrometer. You must use the serial cable between the USB adapter and the spectrometer.
• If you use a GRIMM USB-Serial adapter, then you should connect this adapter directly to the spectrometer.
The software is “frozen”, when it runs under MS-Windows XP • Run the software in the Windows95 compatibility mode (see chapter 1). • The software is not stable • Perhaps you have got a “dirty” computer. The operating system will be instable, if
you have installed and reinstalled many programs, especially tool programs. In this case it is the best to delete your hard disk and install the operating system with the latest service packs.
• Install the software at another computer. “Range Check Error” appears, when you starts a measurement. • You have select a not existing serial port or another program uses the selected serial
port. The measurement list is empty after the download from the memory card • The memory card contains no data. Proof the battery of the card. If the voltage from
the battery is lower than 2.7V, then the card can loose data. • The memory card contains only count data and you have selected mass data in
[OPTIONS-->Spectrometer-->Measurement Mode] or the other way around. • Check in the menue LOCATION, if you have selcted the right Location number. The message “The specified file was not found” appears • Tutorial. The tutorial software is not installed. • Manual. The ADOBE READER® is not installed or the manual is not in the home
directory. • GRIMM Homepage. The MS-Internet Explorer® is not installed, because you use
an alternative internet browser.

- 42 -
Index
A
Alarm · 21 Automatic measurement · 13 Average · 18
B
Background Program · 8
C
Calculation · 16 C-factor · 12, 39 Channels · 15, 16 Coarse · 17 Computer Specification · 5 Connection · 7 Count distribution · 11
D
Driver Change · 22 Delete · 22 Load · 22
Dust monitor · 5
E
Environmental · 11 Error message · 31
F
Fast mode · 11 File
Automatic name · 24 Configuration · 9 Delete · 27 File manager · 9 Filter test · 27
Measurement data · 8 Search · 29 Temporary · 9
Filter efficiency · 27
G
Graph · 32 Graph View · 19 Gravimetric · 39
H
Headline · 28
I
Info Panel · 17, 32 Interval · 11
L
Location number · 12
M
Mass distribution · 11 Measurement
Automatic · 26 Data · 32 Graph · 32 Load data · 27 Start · 26
Memory Card Data transfer · 26 Location · 12
Modem · 13 Parameter · 23 Phone number · 13 Switch on · 13
Multiplex · 11

- 43 -
N
Numeric · 31
O
Operating System · 8 Operational Mode · 11, 15, 18 Options
Alarm · 21 Automatic · 13 Dust monitor · 10 Graph · 15 Location list · 21 Sensor calibration data · 19 System parameter · 22
P
PAH · 39 Percent · 16 Print data · 29 Printer configuration · 30
R
Real Data · 16 Report
Preview · 30 Print · 30
S
Sample Period · 11 Save
Graph · 19 Sensor · 15
Calibration data · 19 Factor · 20 Name · 20 Offset · 20 Unit · 20
Sensor data · 32 Sensor graph · 32 Separator · 28 Serial interface
Baud rate · 12 Port · 12
Sliding average · 16 Space line · 28 Spreadsheet · 28 Startup · 6 Statistic · 37 Surface area · 17
T
Troubleshooting · 41 Tutorial · 40
V
View channels · 15 Volume · 16