1992djatmikophd.pdf
TRANSCRIPT

7/26/2019 1992djatmikophd.pdf
http://slidepdf.com/reader/full/1992djatmikophdpdf 1/507
Glasgow Theses Service
http://theses.gla.ac.uk/
Djatmiko, Eko Budi (1992) Hydro-structural studies on swath type
vessels. PhD thesis.
http://theses.gla.ac.uk/5508/
Copyright and moral rights for this thesis are retained by the author
A copy can be downloaded for personal non-commercial research or
study, without prior permission or charge
This thesis cannot be reproduced or quoted extensively from without first
obtaining permission in writing from the Author
The content must not be changed in any way or sold commercially in any
format or medium without the formal permission of the Author
When referring to this work, full bibliographic details including the
author, title, awarding institution and date of the thesis must be given
7/26/2019 1992djatmikophd.pdf
http://slidepdf.com/reader/full/1992djatmikophdpdf 2/507
HYDRO-STRUCTURAL STUDIES
ON SWATH TYPE VESSELS
by
Eko Budi Djatmiko, MSc
Thesis submitted for the Degree of Doctor of Philosophy
Department of Naval Architecture and Ocean Engineering
University of Glasgow
July. 1992
© Eko
B.
Djatmiko 1992

7/26/2019 1992djatmikophd.pdf
http://slidepdf.com/reader/full/1992djatmikophdpdf 3/507
IMAG ING SERVICESNORTH
B o sto n S p a, W e th erb y
W e s t Y o rk sh ire ,
L S2 3 7 BQ
www.bl.uk
CONTAINS
PULLOUTS

7/26/2019 1992djatmikophd.pdf
http://slidepdf.com/reader/full/1992djatmikophdpdf 4/507
IM A GING SERVICES NORTH
Boston Spa, Wetherby
West Yorkshire, LS23 7BQ
www.bl.uk
B EST COp y AVA ILAB LE.
VARIAB LE PRINT QUAL ITY

7/26/2019 1992djatmikophd.pdf
http://slidepdf.com/reader/full/1992djatmikophdpdf 5/507
D EC LA R A TION
Except w here reference is m ade to the work of others,
this thesis is believed to be original

7/26/2019 1992djatmikophd.pdf
http://slidepdf.com/reader/full/1992djatmikophdpdf 6/507
A C K N O W L E D G E M E N T S
I am wholeheartedly grateful to Professor D. Faulkner, the Head of Department,
for giving me such a chance to carry out this research as well as kindly providing
supervision throughout. My understanding on ship structural design philosophy would
remain feeble without his continuous guidance.
I sincerely thank Drs. P.K. Das, A.Incecik and R.C. McGregor for their useful
discussions at various levels of my research. Sincere thanks are also due to Drs. H.S.
Chan, H.H. Chun and Mr. Y. Pu who have allowed me to incorporate their work on
SWATH motion prediction, SWATH resistance assesment and reliability analysis,
respectively, into my study. Moreover, I am grateful to other fellow researchers in the
Department: Messers. A.F. Miller, C. Tolikas and Mrs. L.B.Caldwell who have been·
so co-operative in working together within the SWATH group, Mr. R. Prince-Wright
for supplying me with wave stochastics information, and Mr. M.R. Mainal for his
pleasant friendship.
J
Gratitude is further acknowledged to all the technicians at the Hydrodynamics
Laboratory for their help during the time I was carrying out the SW ATIl model tests. I
would like also to convey my gratitude to Mrs. I.P. Faulkner who has helped me with
correcting the manuscript of this thesis.
Encouragement from my colleagues at the Faculty of Marine Technology,
Institute of Technology, Surabaya, is very much appreciated. I am especially grateful to
Ir. Soegiono and Ir. Soeweify, MEng. for their concern with the extension of my
scholarship grant. Mr. H. Choraque is thanked for his earnest companionship during
my study in Glasgow.
Financial support is acknowledged to the Indonesian Government and the Marine
Technology Directorate of the Science and Engineering Research Council.
Finally, I am grateful for moral support and encouragement from my mother and
family at home in Indonesia. Most of all, I am forever indebted to my dearest wife Lini
and son Ellinas for their endurance and patience in waiting for me to complete my study
in Scotland. Appropriately this thesis is dedicated to them.

7/26/2019 1992djatmikophd.pdf
http://slidepdf.com/reader/full/1992djatmikophdpdf 7/507
CONTENTS
Page:
DECLARATION
i
ACKNOWLEDGEMENTS
ii
CONTENTS
ill
LIST OF FIGURES
ix
LIST OF TABLES xiv
SUMMARY xvi
CHAPTER 1 - INTRODUCTION
1
1.1. H istory and D evelopm ent of SW ATH Ships
1.2. SWATH Ship G eom etry and C haracteristics
1.2.1. SW ATH H ulls
1.2.2. SW A TH Struts
1.2.3. SW A TIl C ross D eck Structures
1.2.4. Som e B asic D esign P aram eters
1.3. Som e Potential A pplications of SW A TH Ships
1.4. H ydro-Structural Studies on SWATH -T ype V essels
1
3
4
5
6
7
8
11
CHAPTER 2 - HYDRODYNAMIC FEATURES OF SW ATH SHIPS
2.1 . Int roduct ion
2.2. The Nature of SW A TIl Ship M otions
2.3. Concept of Fluid Forces on a Cylinder in W aves
2.4. M otion Equation of a SW ATIl Ship
2.4.1. D efinition of a C o-ordinate S ystem
2.4.2. Form ulation of E quations of Motion
2.4.3. Solution of the Motion E quation
2.4.4. H ydrodynam ic F orces
2.4.4.1. Problem Form ulation w ith Forw ard Speed
2.4.4.2. T he Froude-K rylov C om ponent
2.4.4 .3 . T he D iffractio n Compon en t
2 .4 .5 . Hydro dynam ic Coefficie nts
2 .4 .6. Hydrostatic R estorin g F orces
25
26
27
29
29
29
32
34
35
36
3 7
39
39
Contents
ill

7/26/2019 1992djatmikophd.pdf
http://slidepdf.com/reader/full/1992djatmikophdpdf 8/507
2.5. Some Methods of SWA TIl Ship Motion Assessment
2.6. Existing Computer Programs for SWATH Motions and
Dynamic Structural Loadings Assessment
2.6.1. Computer Program Based on the Strip Theory
2.6.2. Computer Program Based on the Three-Dimensional
Sink-Source Technique
2.6.3. Computer Program Based on the Three-Dimensional
Translating Pulsating Source Technique 43
2.7. Experimental Investigation of SWATH Ship Motions 45
2.7.1. Measurement of SWATH Model Motions at Zero Speed 46
2.7.1.1. Measurement Devices 46
2.7.1.2. Amplifier and Data Acquisition Devices 47
2.7.1.3. Running the Test 48
2.7.2. Measurement of SWATH Model Motions with Forward Speeds 48
2.7.3. Test Data Analysis 49
2.8. Comparison of Experimental Results and Theoretical Predictions 51
2.8.1. Head Seas 51
2.8.2. Beam Seas 52
2.8.3. Quartering Seas 52
2.8.4. Head Seas with Forward Speeds 52
2.8.5. Following Seas with Forward Speeds 53
2.9. SWATH Performance in Seaways 54
2.10. SWATII Ship Resistance 58
2.11. Discussion 60
2.12. Conclusions 62
40
41
41
42
CHAPTER 3 • PREDICTION OF WAVE LOADS ON SWATH SHIPS
3.1. Introduction
3.2. Analytical Methods on Wave Load Prediction
3.2.1. DTNSRDC
3.2.2. American Bureau of Shipping (ABS)
3.2.3. Mitsui Engineering & Shipbuilding (MES)
3.2.4. Hyundai Heavy Industries (RH )
3.2.5. BruneI University
3.2.6. NTU Athens
3.2.7. NTH Trondheim
3.2.8. University of Glasgow
87
89
90
92
93
93
94
95
95
95
Contents
iv
7/26/2019 1992djatmikophd.pdf
http://slidepdf.com/reader/full/1992djatmikophdpdf 9/507
3.3. Experimental Approach 98
3.3.1. Procedures of Wave Load Tests Carried Out at UoG 100
3.3.2. Comparison of Experimental and Theoretical Predictions
on SWATIl Primary Loads 102
3.4. Determination of SWATIl Wave Loads at Preliminary Design Stage 104
3.5. Assessment of the Long-Term Primary Load for SWATIl Ships 107
3.5.1. The Determination of Cyclic Lifetime Load 107
3.5.1.1. Wave Load Responses 108
3.5.1.2. Operational Modes 109
3.5.1.3. Selection of Sea Spectra 110
3.5.1.4. Lifetime Load Distribution 111
3.5.2. Description of the Result on Long-Term Analysis 113
3.6. Short-Term Analysis of SWATIl Structural Response
to EnvironmentalLoads 114
3.6.1. Factors Affecting the Extreme Value of Responses 115
3.6.1.1. Operation Time 115
3.6.1.2. Risk Parameter 115
3.6.1.3. Frequency of Encounter with Seas 116
3.6.1.4. Ship Speed in a Seaway 116
3.6.2. Extreme Value of Responses 116
3.6.3. Comparison of SWATIl Structural Responses by the Short-
and Long-Term Analysis 117
3.7. Comparison of Design Values from Rigorous Analysis
with the Simplified Approaches 119
3.8. Discussion 121
3.9. Conclusions 123
CHAPTER 4 - PREDICTION OF SLAMMING ON SWATH SHIPS
4.1. Introduction
4.2. Analytical Approach on Slamming Prediction
4.2.1. Frequency-Domain Analysis
4.2.2. Time-Domain Analysis
4.2.2.1. Prediction of Slam Occurence
4.2.2.2. Instantaneous Relative Vertical Velocity
4.2.2.3. Evaluation of Impact Pressure
4.2.2.4. Post Impact Behaviour
4.2.2.5. Structure of Program SLAMTIME
143
145
146
148
148
149
150
151
151

7/26/2019 1992djatmikophd.pdf
http://slidepdf.com/reader/full/1992djatmikophdpdf 10/507
4.2.2.6. Routine SLAM 152
4.2.2.7. Routine PIMPACT 153
4.2.2.8. Routine POSTSLAM 153
4.2.3. Probabilistic Approach 154
4.3. Slamming Experiments on a Small SWATH Model 157
4.3.1. Measurement of Relative Motions 158
4.3.2. Measurement of Slamming Pressures 159
4.3.2.1. Point Pressure Approach 159
4.3.2.2. Panel Pressure Approach 160
4.3.3. Test Data Analysis and Results 160
4.4. Some Methods for Estimating of Design Slamming Pressures 163
4.4.1. Existing Design Slamming Pressure Data 164
4.4.2. Empirical Formula for Design Slamming Pressures 165
4.4.2.1. Sellars Method 165
4.4.2.2. Allen and Jones Method 167
4.4.2.3. Det norske Veritas (DnV) 168
4.4.2.4. Lloyd's Register (LR) 169
4.4.2.5. American Bureau of Shipping (ABS) 169
4.4.2.6. Loscombe's Algorithm 170
4.4.2.7. Graham's Approach 171
4.5. Slamming Characteristics of a Notional SWATH· A Case Study 171
4.5.1. Probability of Slamming Occurrence 172
4.5.2. Extreme Slamming Pressure 174
4.6. Comparison of Estimated Design Slamming Pressure 175
4.7. Discussion 177
4.7.1. Slamming Aspects of SWATH Structural Design 177
4.7.2. Further SWATI Slamming Investigation- Drop Tests 180
4.8. Conclusions 180
CHAPTER 5 • PRELIMINARY SWATH STRUCTURAL DESIGN
5.1. Introduction
5.2. SWATH Structural Design Criteria
5.3. SWATH Structural Design Programs
5.3.1. DTNSRDC
ASSET/SWATH
Program
5.3.2. US Navy Structural Synthesis Design Program
(SSDP)
5.3.3. DREA CEM Program for SWATH Ships
5.3.4. UCL SWATH Structural Design Program
203
204
209
210
212
213
214
vi

7/26/2019 1992djatmikophd.pdf
http://slidepdf.com/reader/full/1992djatmikophdpdf 11/507
5.3.5. USCG Small SWATH Structural Design
5.3.6. Loscombe's Small SWATH Structural Design
5.3.7. Rule-Based SWATH Structural Design
5.4. Initial Scantling Design for SWATH Ships
5.4.1. Computer Program for Initial Scantling Design
5.4.2. Sensitivity Evaluation of Structural Weight
5.5. Discussion
5.6. Conclusions
214
215
217
218
218
219
221
222
CHAPTER 6 - FATIGUE PERFORMANCE OF SWATH SHIPS
6.1. Introduction 239
6.2. Prediction of Ship Fatigue Life 242
6.2.1. Full Spectral Analysis 242
6.2.2. Simplified Approach in Fatigue Analysis 244
6.3. Evaluation of SWATH Fatigue Behaviour 245
6.3.1. Identification of SWATH's Fatigue Susceptible Regions 245
6.3.2. Determination of SWA TIl Ship Structural Stress 247
6.3.3. Fatigue Performance of SWA TIl Ships - A Case Study 248
6.3.3.1. Assessment of SWATH Fatigue Life 249
6.3.3.2. Sensitivity Evaluation 251
6.3.4. Effects of Stress Concentration Factor (SCF) 254
6.4. Reliability Against Fatigue Failures 255
6.4.1. Analysis by AFOSM Method 258
6.4.2. Analysis by Wirsching's Method 261
6.5. Discussion 263
6.5.1. Fracture Mechanics for Crack Propagation Analysis 264
6.5.2. Aspects of Fatigue Design on Light-Weight Material (GRP) 267
6.5.3. Fatigue Inspection and Repair Strategy 269
6.6. Conclusions 271
CHAPTER
7 -
CONCLUDING REMARKS
7.1. General
7.2. Hydrodynamic Performance
7.3. Primary Dynamic Loads
7.4. Slamming Investigations
7.5. Preliminary Structural Design
288
288
290
291
292
Con ten t s
vu

7/26/2019 1992djatmikophd.pdf
http://slidepdf.com/reader/full/1992djatmikophdpdf 12/507
7.6. Fatigue Performance 293
7.7. Future Work 294
7.8. Closure 295
REFERENCES 296
APPENDIX A - FURTHER SWATH MOTION DATA A-I
APPENDIX B - FURTHER SWATH LOADING DATA B-1
APPENDIX C - ON THE STUDY OF SHIP SLAMMING BY
DROP TEST MODELS C-l
APPENDIX D - ON THE DESIGN OF A MULTIPLE-ANGLE
SWATH DROP TEST MODEL D-l
APPENDIX E - SWAT STRUCTURAL DESIGN AND
ARRANGEMENTS
E-l
Conten t s
viii

7/26/2019 1992djatmikophd.pdf
http://slidepdf.com/reader/full/1992djatmikophdpdf 13/507
CHAPTER 1
Figure 1.1.
Figure 1.2.
Figure 1.3.
Figure 1.4.
Figure 1.5.
Figure 1.6.
Figure 1.7.
Figure 1.8.
Figure 1.9.
CHAPTER 2
Figure 2.1.
Figure 2.2.
Figure 2.3.
Figure 2.4.
Figure 2.5.
Figure 2.6.
Figure 2.7.
Figure 2.8.
Figure 2.9.
Figure 2.10.
Figure 2.11.
Figure 2.12.
Figure 2.13.
Figure 2.14.
Figure 2.15.
Figure 2.16.
Figure 2.17.
Figure 2.18.
Figure 2.19.
Figure 2.20.
Figure 2.21.
Figure 2.22.
LIST OF FIGURES
SWATIl ship geometry
SWATIl Patents
A schematic history of SWATH
General arrangement plan for the SSP Kaimalino
US Navy's towed-array sonar vessel the Victorious (T-AGOS 19)
The world largest SWATIl vessel Rad is so n D iamo nd
SWATH and monohull speeds in rough seas
SWATIl and monohull wetted surface area
Schematic diagram of hydro-structural study on SWATHs
US Navy/Coast Guard seakeeping trials motions comparisons
Fluid forces and moments diagram
Co-ordinate system
Model test arrangement at zero Froude number
Diagrammatic arrangement of instrument connections
for SWATH model motion and wave load tests
Photograph of the amplifier and recording devices for
SWATH model tests
SWATII model mounted on the towing carriage
Photograph SWATH model in stationary test
Photograph SWA
TIl
model underway in a head wave
Sum and difference unit in the amplifier
Typical wave and motion elevations from data analysis program
Discretisation of SWATH models
SWA TH-FV model motions in head seas (Fn=O.OO)
SW ATII-FV model motions in beam seas (Fn=D.OO)
SWATII-FV model motions in bow-quartering seas (Fn=D.OO)
SWATH-3 model motions in bow-quartering seas (Fn=D.OO)
SWATIl-I model motions in bow-quartering seas (Fn=O.OO)
SWA TIl-I model motions in head seas (Fn=0.39)
SWATH-l model motions in head seas (Fn=D.52)
SWA TH-FV model motions in following seas (Fn=D.13)
SWATII-FV model motions in following seas (Fn=0.26)
SWA TII-FV model motions in following seas (Fn=O.39)
Page:
18
19
20
21
22
22
23
24
24
68
69
69
70
71
72
73
74
74
72
75
76
77
77
78
79
80
81
81
82
82
83

7/26/2019 1992djatmikophd.pdf
http://slidepdf.com/reader/full/1992djatmikophdpdf 14/507
Figure 2.23. SW ATH-FV model motions in following seas (Fn=O.52) 83
Figure 2.24. SWATH-FV model motions in bow-quartering seas at various Fn 84
Figure 2.25a. Distribution of the down time for SWATH-FV operating
in the North-Atlantic (Criteria 1-4) 85
Figure 2.25b. Distribution of the down time for SWATH-FV operating
in the North-Atlantic (Criteria 1-7) 85
Figure 2.26. Measured residuary and calculated wave-making resistance coeff.
for SWA TH-FV and its component contribution vs Fn 86
Figure 2.27. Total resistance of the SWATH-FV model in calm water vs Fn 86
Figure 2.28. Total resistance of the SWATH-FV model in calm water and
in waves vs Fn 86
Figure 2.29. Typical variations of SWATH vertical motion responses
(heave. roll. pitch) vs tuning factor 85
CHAPTER 3
Figure 3.1.
Definition sketch of SWATH cross-section
127
Figure 3.2.
Definition of global wave loads
127
Figure 3.3.
Side forces (V2) on SWATH-3 model in beam and
bow-quartering seas 128
Figure 3.4.
Vertical shear forces (V3) on SWATH-FV model in beam
and bow-quartering seas
128
Figure 3.5.
Transverse bending moment (M4) on SWATH-1 model
in beam and bow-quartering seas
129
Figure 3.6.
Transverse bending moment (M4) on SWATH-3 model
in beam and bow-quartering seas
129
Figure 3.7.
Transverse bending moment (M4) on SWATH-FV model
in beam and bow-quartering seas 129
Figure 3.8.
Side forces on SWATH-3 model in various wave headings
130
Figure 3.9.
Peak values of side forces on SWATH-3 in various
wave headings
130
Figure 3.10.
Wave load responses of SWATH-FV model in
bow-quartering seas
131
Figure 3.11.
Forward speed effects on load responses
132
Figure 3.12.
SWATH side force from model tests
133
Figure 3.13. Maximum lifetime side force and moment in struts
for small SWATIIs
133
Figure 3.14. Procedure of the computation on wave load distribution
134
Figure 3.15. Transverse bending moment at the cross-deck midpoint
of the 2500-tonne SWATII-FV in regular waves
135
Figure 3.16.
Schematic of operating mode
135
Figure 3.17.
Family of six-parameter wave spectra (Hs = 3.0 m)
136

7/26/2019 1992djatmikophd.pdf
http://slidepdf.com/reader/full/1992djatmikophdpdf 15/507
Figure 3.18. Transverse bending moment response spectra ofthe 2500-tonne
SWA TH-FV in beam seas (Hs = 3.0 m) 136
Figure 3.19. Probability density function of transverse bending moment for
the 2500-tonne SWATH-FV in beam seas (Hs
=
3.0 m) 137
Figure 3.20. Transverse bending moment histogram of the 2500-tonne
SWATH-FV operating in the North Atlantic 138
Figure 3.21. Lifetime transverse bending moment on the 2500-tonne
SWATH-3 in the North Atlantic 139
Figure 3.22. Beam sea dominated vs all heading lifetime transv. bending
moment for the 2500-T SWATH-3 in the North Atlantic 139
Figure 3.23. Significant wave height persistence in the North Atlantic
every 1.52 m interval 137
Figure 3.24. Statistical values of transverse bending moments for SWATHs
by the short-term analysis 140
Figure 3.25a. Most probable extreme transverse bending moment
on the 2500-tonne SWATH-FV 141
Figure 3.25b. Extreme transverse bending moment with 99% confidence
on the 2500-tonne SWATH-FV 141
Figure 3.26. Extreme values of transverse bending moment on SWATII-FV
by the long-term analysis 142
CHAPTER 4
Figure 4.1.
Figure 4.2.
Figure 4.3.
Figure 4.4a.
Figure 4.4b.
Figure 4.4c.
Figure 4.4d.
Figure 4.5.
Figure 4.6.
Figure 4.7.
Figure 4.8.
Figure 4.9.
Figure 4.10.
Figure 4.11.
Figure 4.12.
Impact angle
Relations between variables in bow ramp during slam impact
Impact angle relations on the wet deck of SWATHs
Proposed slamming program SLAMTIME
Routine SLAM
Routine PIMPACT
Routine POSTSLAM
Technical drawing of the Fishing SWATH model
Instrumentation arrangement for SWATIl slamming test
Instrumentation set up for the panel slamming test
Photographs of SWATH-FV model subjected to severe
slamming (a. front view; b. plan view)
Typical record of relative motions at four local points
Typical record of slamming pressure and the corresponding
relative motion
Relative vertical motion at four local points of SWATH-FV
at Fn=O.13 (a. Point 1 ; b. Point 2; c. Point 3; d. Point 4)
Relative vertical motion at four local points of SWAlli-FV
at Fn=O.26 (a. Point 1 ; b. Point 2 ; c. Point 3 ; d. Point 4)
185
185
185
186
186
187
187
188
189
189
190
191
191
192
192

7/26/2019 1992djatmikophd.pdf
http://slidepdf.com/reader/full/1992djatmikophdpdf 16/507
Figure 4.13. Relative verticalmotion at four local points of SWATIl-FV
at Fn=O.39 (a. Point 1 ; b. Point 2 ; c. Point 3 ; d. Point 4) 193
Figure 4.14. Relative verticalmotion at four local points of SWATIl-FV
at Fn=O.52 (a. Point 1 ; b. Point 2; c. Point 3; d. Point 4) 193
Figure 4.15. Slammingpressure time history (pointpressure impact) 194
Figure 4.16. Relativemotion time history 195
Figure 4.17. Slamming pressure Ps vs V
l
measured at Position 2
of the wet deck of SWATIl-FV model (k=32) 195
Figure 4.18. Slamming pressure Ps vs V? measured at Position 3
of the wet deck of SWATH-FV model (k=26) 196
Figure 4.19. Slamming pressure Ps vs Vl measured at Position 4
of the wet deck of SWATH-FV model (k=9) 196
Figure 4.20. Typical time history of slamming force on Panel A 197
Figure 4.21. Average slamming pressure Ps vs V? measured at Panel A
on the underdeck of Fishing SWATIl model 198
Figure 4.22. Average slamming pressure Ps vs Vl measured at Panel B
on the underdeck of Fishing SWATIl model 198
Figure 4.23a. Sinkage of SWATH-FV model in calm water and in waves
at forward speeds 199
Figure 4.23b. Static trim of SWATIl-FV model in calm water and in waves
at forward speeds 199
Figure 4.24. Slamming occurrences of SWATIl-FV for different conditions 200
Figure 4.25. Extreme slamming pressures on SWATIl-FV operating in
region JSOI (a. Position 2; b. Position 3 ; c. Position 4) 201
Figure 4.26. Extreme slamming pressures on SWATH-FV operating in
region JS02 (a. Position 2 ; b. Position 3 ; c. Position 4) 201
Figure 4.27. Comparison of design slamming pressure for SWATHs
by various methods 202
CHAPTER 5
Figure 5.1.
Figure 5.2.
Figure 5.3.
Figure 5.4.
Figure 5.5.
Figure 5.6
Figure 5.7a.
Structuralmaterials used in SWATIl vessels
Ship structural design process
Box girder under sagging moment
Ultimate stress distribution taking into account of buckling
SWATIl structural configuration and loading conditions
Definitio of structural regions and location in cross structure
of points of stress calculation
Standard arrangement for small SWATHs constructed out of
steel or aluminium
229
229
230
231
232
233
234

7/26/2019 1992djatmikophd.pdf
http://slidepdf.com/reader/full/1992djatmikophdpdf 17/507
Figure 5.7b. Standard arrangement for small SWATHs constructed
outofGRP
234
Figure 5.8. Flowchart diagram of the computer program for the determination
of SWATH initial scantlings of SWATH vessels 235
Figure 5.9. Comparison of structural weights from stress concentration
and effective width approaches 236
Figure 5.10. Effect of construction material combinations on structural weights 236
Figure 5.11. Effect of construction material combinations on structural cost 237
Figure 5.12. Effect of change in maximum breadth to structural weight and cost 237
Figure 5.13. Effect of change in box clearance to structural weight and cost 238
Figure 5.14. Effect of adding one transverse bulkhead on structural
weight and cost 238
CHAPTER 6
Figure 6.1.
S-N design curves for non-tubular members and connections
277
Figure 6.2.
Schematic of Fatigue Prediction Method
278
Figure 6.3.
a) Principal stress contours and b) Shear stress contours
on SWATIl's bulkhead
279
Figure 6.4.
Fatigue life of two SWA TIl vessels in the North Atlantic based
on the mean lifetime stress and Class-D weld joints
280
Figure 6.5.
Fatigue life of two SWATIl vessels in the North Atlantic
(equal stress range proportion for the two vessels)
280
Figure 6.6.
Loading histories of SWATH-3 and SWATH-FY
281
Figure 6.7.
Fatigue life of SWATH-FY in the North Atlantic
(for different Weibull-shape parameters) 282
Figure 6.8.
SWATIl notation for the determination of SCFs
282
Figure 6.9.
Probability distributions of load (L) and resistance (R) 283
Figure 6.10.
Change of fatigue reliability with operating time for SWATH-FY
284
Figure 6.11.
Probability of fatigue damage on SWATH-FY
(Class-D weld joints)
284
Figure 6.12.
Change of fatigue reliability with operating time for SWATH-FY
as predicted by AFOSM and Wirsching methods
285
Figure 6.13.
Change of fatigue reliability with operating time for SWATH-FY
SWATII-FY as predicted by Wirsching's method
285
Figure 6.14. Specimen for crack growth observation 286
Figure 6.15.
A model for fatigue crack growth according to Paris-Erdogan law
286
Figure 6.16. Crack growth in a simple butt weld on SWATH deck plating
286
Figure 6.17.
Typical S-N curves for marine-type GRP laminates
287
Figure 6.18.
Updated fatigue reliability for fracture mechanics based
analysis with MPI at regular intervals
287
Figure 6.19.
Updated fatigue reliability for fracture mechanics based
analysis with MPI at optimised intervals
287
7/26/2019 1992djatmikophd.pdf
http://slidepdf.com/reader/full/1992djatmikophdpdf 18/507
L IST O F T A BL E S
CHAPTER 1
Page:
Table 1.1. SWATIl vessels existing until June 1992
Table 1.2. SWATIl ship basic design parameters
Table 1.3. Basic design parameter relationships
Table 1.4. Comparison between SWATIl and Monohull ship
16
17
17
18
CHAPTER 2
Table 2.1. Motion induced coefficients (potential) 64
Table 2.2. Hydrostatic restoring forces 64
Table 2.3. Main particulars of SWATIl models for motion studies 65
Table 2.4. Main particulars of notional SWATIls 65
Table 2.5. Long term distribution of wave occurrence in the North Atlantic 66
Table 2.6. Selected seakeeping criteria and categories for SWATIls 66
Table 2.7. Assessment of SWATIl operability 67
Table 2.8. Operability of SWATIls in the North Atlantic 68
Table 2.9. Wave data for the North Atlantic 68
CHAPTER 3
Table 3.1. SWATIl speed probabilities
Table 3.2. Values of six parameter spectra as a function of significant
wave height, Hs (m)
Table 3.3. Design side loads (in kN) by various methods
125
125
126
CHAPTER 4
Table 4.la. Joint probability (%) of significant wave height and period for
grid point ISOI at 59.92
o
N, 2.29
0
W 182
Table 4.1b. Joint probability
(%)
of significantwave height and period for
grid point JS02 at 59.92
o
N, 0.9l
o
W 182

7/26/2019 1992djatmikophd.pdf
http://slidepdf.com/reader/full/1992djatmikophdpdf 19/507
Table 4.2.
Table 4.3.
Slamming rates of SWATII-FV operating in the JS01 region
Comparison of design slammingpressure (in kPa) calculated
by various methods
183
184
CHAPTER 5
Table 5.1a. 'Basic' weights and densities for SHIP-A (HY100 and
different frame spacings) 224
Table 5.tb. 'Basic' weights and densities for SHIP-A (3-ft frame spacing
and different materials) 224
Table 5.2. Magnification factors to the nominal stress for several critical
locations on SWATIl cross structure 225
Table 5.3. Sampleof output data from initial scantlingdesign program 227
Table 5.4. Combinations of structural material for structural
weight observation
224
CHAPTER 6
Table 6.1. Fatigue life of the 2500-tonne SWATH-FV computed by Miner's
rule for Class-D weld 273
Table 6.2. Iterative computation ofWeibull-shape parameter (~)
for SWATII-FV 274
Table 6.3. Dependence of the SWATIl-FV's fatigue life on Weibull-shape
paramerer 275
Table 6.4. Comparison of SWATII-FV fatigue lives for all heading
weighted and beam sea dominated operations 274
Table 6.5. Effect of different weld classes to the fatigue life of SWATH-FY
(Allowable extreme stressrange Sea
=
292 N/mm2) 276
Table 6.6. Data for fatigue reliability analysis 276
Table 6.7. Fatigue design criteria for 1LP deck and hull structure 276

7/26/2019 1992djatmikophd.pdf
http://slidepdf.com/reader/full/1992djatmikophdpdf 20/507
SUMMARY
This thesis presents a study on SWATIl type vessels which is directed towards
the collection and use for structural design of experimental data related to motions and
primary dynamic loads of such vessels. This data will be of use in the validation of a
mathematical model for motion and wave load predictions recently developed at the
Department. Further, experimental data on slamming will also be acquired to lay a
foundation for the future development of a reliable analytical model. Design loads
pertinent to SWATIls comprising the extreme primary loads, lifetime cyclic loads and
local panel pressures are then built upon the former findings to be of use in structural
designs, especially in the determination of initial scantlings and fatigue characterisation.
Examples are given throughout on the evaluation of hypothetical SWATHs operating in
the North Atlantic.
The underlying theoretical formulation of SWATH ship motions is presented
together with a description of a newly developed motion prediction theory. This is
followed by a clarification of the procedures for conducting seakeeping tests on
SWATH models. Validation of the analytical motion model by the measured data of
single and tandem strut SWATH models is then presented. Subsequently, practical
applications of implementing motion predictions to the assessment of SW ATIl
operability in real seaways are described.
Theoretical background of SWATH primary wave loads is briefly outlined. The
enhancement of the motion program MARCHS to tackle the primary load on SWATHs
is described. The development of experimental data on SWATH loadings by way of
seakeeping techniques is presented. Correlation of this experimental data and the
theoretical assessment is made to demonstrate the validity of the mathematical model so
developed. Lifetime cyclic and extreme loads required in the fatigue and ultimate
strength designs, respectively, are developed by applying long- and short-term wave
statistics.
Slamming phenomenon attributable to SWATH operation in adverse water is
being investigated by model tests. Possible formats of analytical models for slamming
predictions are incorporated. Comparison of experimentally generated slamming data
and the simplified predictions, as well as the pressure data from various SWATIl
designs, are presented.
Transforming the load effects information to preliminary SWATH structural
design is the next subject addressed. Simple beam theory is adopted, instead of more

7/26/2019 1992djatmikophd.pdf
http://slidepdf.com/reader/full/1992djatmikophdpdf 21/507
rigorous first principles approach to structural designs. Enhancement of the present
design tools for more detailed design is pointed out.
Fatigue behaviour of SWATIl is studied by considering the lifetime cyclic load
together with the application of classical damage accumulation analysis by Miner's rule.
Implementation of the simplified fatigue damage assessment, which requires the stress
distribution parameter to be determined, is then used. Reliability analysis is further
incorporated to assess the safety level of SWATIl structure against fatigue failure. The
structural inspection and maintenance strategy related to fatigue damage is established
by referring to former evaluations. Finally, the need to explore fatigue of alternative
lightweight construction materials, and the use of a higher level fatigue characterisation
by crack propagation assessment are put forward.

7/26/2019 1992djatmikophd.pdf
http://slidepdf.com/reader/full/1992djatmikophdpdf 22/507
CHAPTER
INTRODUCTION

7/26/2019 1992djatmikophd.pdf
http://slidepdf.com/reader/full/1992djatmikophdpdf 23/507
CHAPTER 1
INTRODUCTION
The development of advanced marine vehicles today places more emphasis on
better seakeeping to perform specific tasks rather than improving merchant freight
storage, the area in which the present monohull/conventional ship seems to be most
efficient The SWATH vessel is one of themost recent marine vehicle concepts which
offers a better seakeeping performance and less operationally imposed speed reduction
when operation in severe weather.
As is mentioned by Kennell (1985) the acronym SWATH, which was chosen by
the U.S. Navy in the early 1970s, refers to Small-Waterplane-Area Twin/Three-Hull
Ships. Other names, as quoted by Gore (1985), for instance SSS (Semi-Submerged
Ship), MODCAT (Modified Catamaran), LWP (LowWaterplane) Area Catamaran and
TRISEC (Trisected) Ship have been used during the projects covering these new
'species' at the Naval Ocean System Center, at the DTNSRDC, at the Naval Ship
Engineering Center and at Litton Industries, respectively. SWATH is also well
recognised by other names, i.e. SSP (Semi-Submerged Platform) in the USA, and
SSC (Semi-Submerged Catamaran) which is most commonly used in Japan.
1.1. HISTORY AND DEVELOPMENT OF SWATH SHIPS
The idea of the SWATH concept is to design a vessel which can sail in waves
with as Iowa reduction in its speed as possible, without slamming and without
shipping green water. The conceptual approach is that of an aerofoil slender body at the
sea-air surface intersection and the majority of the buoyant volume concentrated away
from wave action in a submerged torpedo-like lower hull. By attachment of an upper
hull well above the sea surface, slamming and the shipping of green seas may be
minimised. This single hull small waterplane area design, which is not dissimilar to the
concept proposed by Boericke (1959), has insufficient transverse restoring moment.
The solution to this problem lies in constructing another structure and coupling the two
together with an extension of the upper hull, as is done for catamaran ships. The
appearance of a SWATH ship, therefore, can be characterised by submerged hulls
away from the surface and streamlined surface-piercing struts, attached to the hulls,
which support a deck structure well above the waterline. The combination of these
three sections is usually referred to as the hull girder (see Fig. 1.1).

7/26/2019 1992djatmikophd.pdf
http://slidepdf.com/reader/full/1992djatmikophdpdf 24/507
In considering the SWATH concept, one may trace the history of SWATH
development from two sources, i.e. multi-hulls and submerged hulls. The first multi-
hulls introduced into Europe by Sir William Petty (1660) were followed by the
construction of early catamarans in the 1660s. However, it is unwise not to mention the
Polynesians who, some centuries ago, had sailed on multi-hull craft [Seascape (1987)].
Submerged hulls were first introduced by Lundborg (1880). McGregor (1983)
considers the first SWATH can probably be credited to the design proposed by Nelson
in 1905. The original design of this vessel by Nelson (1905), however, was not aimed
at improved seakeeping performance, but more concerned with the storage of certain
freights that may be much affected by fluctuations of the weather. Another early design
leading to modem SWATHs was by Faust (1932).
Creed and Lewis first proposed their 'Mobile Seadrome', as a steady mobile
landing field for aircraft operations, to the British Admiralty in 1942 and the U.S.
Navy. Although an interesting idea, due to other wartime priorities this was not
considered a serious contender for an aircraft carrier. According to Pieroth and Lamb
(1985) neither the British Admiralty nor the U.S. Navy, therefore, attempted to develop
the concept further. Nonetheless, Creed (1946) applied for and was awarded patent for
the design. Two decades later Leopold (1969a, 1969b) of Litton Industries introduced a
design labelled as TRISEC, which apparently resembled Creed's but with considerable
development. At about the same time a moderate waterplane area twin-hull vessel
Duplus
was built in The Netherlands. The vessel had a maximum speed of 8 knots
with control surfaces mounted on the hulls. By the early 70s Lang (1971) claimed his
patent on SWATH, covering stabilising and canard fins in conjunction with control
systems. Figure 1.2. shows SWATIl patents claimed by these inventors, and for the
sake of simplicity to understand the SWATH history, a diagram is given by McGregor
(1983) as in Fig. 1.3.
The first SWATH ship built was a work boat for the Hawaiian Laboratory of the
Naval Ocean System Center (NOSC), the 190-ton SSP
Kaimalino.
This vessel was
the creation of a team led by Lang in the U.S. Naval Undersea Center (NUC), based in
San Diego. The design of this SWATH started in the late 1960s, followed by the
construction in the U.S. Coast Guard Shipyard in Curtis Bay in 1972. As reported by
Lang et al (1971, 1973) and Lang and Higdon (1974) the ship was completed by 1973.
For a period there was an absence of SWA TIl ship building in the U.S.A. Then
RMI, Inc., commenced the construction of a 58-ton SWATH in the early 1980s. The
SD-60-SW ATIl, since named Ha/ycon, was designed as a commercial or government
service boat. Luedeke and Montague (1984) mentioned that the construction was
completed and available for demonstration in March 1985. Another SWATH
demonstrator, F.G. Creed, was produced by a US shipyard in 1987 and since has
been subjected to comprehensive sea trials by Pegg et al (1990) in Canada. Two other

7/26/2019 1992djatmikophd.pdf
http://slidepdf.com/reader/full/1992djatmikophdpdf 25/507
SWATHs have been built in the USA in the late 80s. One is a high-speed commercial
leisure craft the Navatek 1, the design of which has been reported by Seidl (1992) at
the 11th ISSC. The latest vessel is a 3500-tonne US Navy's ocean surveillance
SWATH T-AGOS 19, named the Victorious. A number of references have been
presented on this vessel, notably by Covich (1987).
Since the
Kaimalino,
SWATH efforts in the U.S., and widespread SWATH
research internationally, have resulted in a number of designs as well as the
construction of a demonstrator vessel, the Suave Lino. Concurrently, SWATH
development commenced in Japan with the Mitsui Engineering
&
Ship Building Co.,
Ltd. Five vessels have been built by this company since 1977.These are the test vehicle
Marine Ace,
followed by the construction of a 343-ton ferry the
Seagull,
which was
formerly named Mesa 80, then a 236-ton hydrographic survey vessel Kotozaki, the
2849-ton diver support vessel
Kaiyo
and the latest, a 19-ton leisure cruiser
Marine
Wave.
Another SWATH hydrographic survey ship, the
Ohtori,
was built by
Mitsubishi Heavy Industry, Ltd. which together with Mitsui, had been encouraged by
the Japanese Government to foster exploitation of the SWATH concept. As indicated
by Gupta and Schmidt (1986), both hydrographic vessels built in Japan are of similar
size to the SSP
Kaimalino.
Some publications have lately reported further SWATHs
produced by Japan in recent years.
Within the European countries. only three SWATH vessels have been built so far.
The first built is a small fishing SWATH Ali, which was designed by MacGregor et al
(1988). This vessel is currently operating in the West Coast of North Scotland. The
second as reported by Milner (1990) is a high-speed ferry the Patria, designed and
built by FBM Marine at Isle of Wight, South of England. The Patria is presently
operated between Madeira and Porto Santo, off the Atlantic coast in North Africa. The
most recent SWATH, and the largest of all existing SWATHs (A = 11740 tonnes),
named Radisson Diamond, has been built at Rauma Shipyard in Finland. According to
Lloyd's Ship Manager (1992) the first year of operation of this luxury cruiser will be in
the Mediterranean before sailing to its final destination in the Carribean. Existing
SWATH ships are listed in Table 1.1 and some are illustrated in Figs. 1.4 through 1.6.
More information on SWATH ship research and developments may be found in papers
by Betts (1988a) and Lang (1989).
1.2. SWATH SHIP GEOMETRY AND CHARACTERISTICS
As has been briefly outlined in the previous section, a SWATH ship is a
displacement vessel in which most of the buoyancy is provided by the twin-hulls
positioned sufficiently far below the water surface to be clear from the worst buffeting

7/26/2019 1992djatmikophd.pdf
http://slidepdf.com/reader/full/1992djatmikophdpdf 26/507
of ocean waves. A twin-hull form would supply adequate beam for the necessary
hydrostatic restoring moments. The slender hydrofoil struts lead to increased
operational capability through greatly improved seakeeping performances in seaways,
including minimising speed reduction in rough water. The arrangement of the hulls and
struts in such a way presents a much smaller waterplane area to dynamic wave action
than conventional monohull ships or catamarans. This concept has also been
advantageously applied to the semi-submersible platform used in the offshore oil
industry. The rectangular box cross structure supported by struts a considerable
distance above the water make adverse wave effects, like deck bottom slamming or
deck wetness, generally avoidable.
1.2.1. The SWATH Hulls
A SWATIl ship incurs a penalty in greater frictional resistance due to the greater
wetted surface area compared to a comparable monohull. Nevertheless, substantial
improvement can be made in overall resistance by shaping the lower hulls and selecting
the best length diameter ratio. This aspect of hull shaping the submerged hull had been
explored by Boericke (1959) and more recently by Chapman (1977). The cross
sectional area shape of the submerged hulls can be circular, elliptical or rectangular.
Other alternatives include circles with flattened tops and bottoms and vertical oval
sections. The circular shape of the cross sectional gives the minimum wetted surface
area per unit cross-section area, so
it
leads to low frictional resistance. Moreover, this
shape is more efficient to withstand the design pressure. As an example, circular hulls
are applied for the SSP
Kaimalino,
Fig. 1.4.
The elliptical cross-section shape with the major axis horizontal, such as that
constructed for the
Seagull,
provides less hydrodynamic side loads but it may increase
vertical motion damping effects and added virtual mass. Furthermore, elliptical hulls
can allow lower draught. Their disadvantages are increases in weight and higher
manufacturing costs. Although the rectangular cross-section hull is the cheapest to
construct, it may not be suitable for high speed SWATIl ships since this shape tends to
be heavier, gives greater drag and also provides smaller headroom. However, this
shape remains suitable for stationary marine vehicles, such as semi-submersible
offshore drilling rigs.
Hull shaping not only applies to the cross-section but also the longitudinal plane
section, e.g. for the
Victorious
in Fig. 1.5. In this aspect efforts are primarily directed
to improve the capability of arranging the machinery space in the lower hulls as well as
improving resistance and seakeeping characteristics. Simple hull designs with constant
cross-section along the hull length and contoured nose and tail offer ease of
construction, but for a small ship may not allow sufficient space for machinery

7/26/2019 1992djatmikophd.pdf
http://slidepdf.com/reader/full/1992djatmikophdpdf 27/507
installation. Another option is that the hull cross-section can remain constant with a
local bulge to accommodate machinery. Alternatively, a simply contoured hull may be
chosen, constructed with a maximum cross-section at the mid length. The addition of
bulges at the nose and tail may reduce resistance at high speeds and allow even greater
control over the buoyancy distribution. More details of this review are presented by
MacGregor (1986).
Hull dimension is mainly characterised by the length diameter ratio, LID, which
radically influences the ship features. LID lies between 10 and 15 for hull lengths below
60 metres. For the bigger ship, where the increase in the hull diameter with respect to
the requirement of machinery installation is no longer critical, increasing the ratio to
between 15 and 20 allows reduction of resistance and form drag to become possible.
Nevertheless, the skin friction will increase as a result of the larger wetted surface area.
Meanwhile, a higher ratio changes the water flow velocities into the propeller which in
turn alters the quasi propulsive coefficient. From another viewpoint, a smaller diameter
improves the ability to withstand external pressures. Deeply submerged hulls give a
better sonar performance and permit easier diver and submersible operations.
1.2.2. The SWATII Struts
There are three shapes of cross-section generally constructed as the column of a
floating structure, namely circular, rectangular and aerofoil or streamline shaped. Only
the first two shapes are commonly used for offshore drilling rig vertical columns since
the resistance is not the most prominent consideration on a stationary marine vehicle.
Therefore, for a SW A111 ship either aerofoil shaped or streamlined struts are the best
option, as these shapes give less drag. In SW A111 design, determining the number of
struts per hull is one fundamental decision that must be made by the designer. The
number of struts per hull affects the magnitude of side loads as well as the resistance
experienced by the ship.
The tandem strut configuration should offer lower side loads, which also means
lower bending moment imposed on the cross structure. With regard to maneouvring, a
tandem strut SW A111 theoretically gives a turning circle of approximately five times
the ship length, compared to ten times for a single strut SWA111. Another attribute is
that four independent struts provide a high degree of control towards LeB and LCF
adjustment so that desired motion performances may be achieved.
A single strut design certainly offers some advantages compared to a tandem strut
configuration. It offers more freedom in the machinery arrangement as well as easier
access to the lower hull. Although control over LeB and LCFis slightly restrained,

7/26/2019 1992djatmikophd.pdf
http://slidepdf.com/reader/full/1992djatmikophdpdf 28/507
however, as a result of higher GMT the roll stiffness is obviously more adequate to
ensure that quasi static heel angles are avoided.
The most extensive comparison between single and tandem strut per hull has been
carried out experimentally on
sse
M arin e A ce
by Mitsui under the sponsorship of
Japan Marine Machinery Development Association (JAMDA) and is reported by
Oshima et al (1979). During the test it was found that the resistance of the single strut
type is lower than the tandem strut. indicating a greater miscellaneous resistance for the
tandem strut due to spray drag. induced drag on fins, etc.
The strut height dictates the deck bottom clearance and draught. A relatively
deeper draught allows flexibility in choosing the propeller diameter. This also ensures
that the propeller submergence can be maintained in any sea state. However. deeper
draught in tum influences the ship resistance and, moreover, a limitation in usable dock
and harbour facilities should also
be
considered by a designer.
Strut dimensions are generally described by strut thickness to chord ratio, til. strut
thickness to hull diameter ratio, tID. or in terms of strut thickness to ship
displacementl/I ratio. t/
l1/3.
A low
til
ratio offers lower wave making resistance at the
expense of limitation on the machinery access into the lower hulls. Most designs have
tID
ratios lying between 0.5 to 0.25. In order to improve TPI, GMT and ease of access,
the U.S. Navy recommends a t/ l1/3 ratio of about 0.17; most of the existing SWAnl
ships have a ratio of between 0.2 and 0.1.
1.2.3. The SWATH Cross Deck Structures
The cross deck geometry of a SWATH ship is rectangular in section with an
option for inner side only or inner and outer side sponsons. The bottom of the deck is
the wet deck. and the distance from this deck to the waterline is defined as box
clearance. When apportioning volume between struts and box. the line of demarcation
is at the wet deck. Control of strut and box longitudinal separation is gained through the
use of box set back. The box clearance remains an unknown parameter until an
adequate clearance to avoid adverse wave effects is thoroughly investigated. Based on
the SSP Kaimalino model investigation. Lang and Higdon (1974) reported that bottom
slamming can be reduced by mounting well faired double bows on a the flat section.
Another observation by Smith (1979) shows that a three hulled SWATIl provides more
benefit because of its smaller deck area forward. so slamming loads will be much
lower.

7/26/2019 1992djatmikophd.pdf
http://slidepdf.com/reader/full/1992djatmikophdpdf 29/507
The box depth design needs to consider the bending moment and shear force
imposed by the wave loads on the deck structure through the struts. A ship with length
below 30 metres should be able to have one full deck in the cross structure, whereas
larger ships my need multiple decks.
1.2.4. Some Basic Design Parameters
Basic ship parameters are always the most important data required in the design
process, and this is also true of SWATH ship design. The terms used here are,
therefore, not different from those used for monohull ships with, of course, many more
additional parameters as a consequence of the more complex SWATH geometry. In the
early days of SWATH ship development researchers suffered from the lack of historical
design data, so that early SWATH ships owed nothing to conventional ship design
data.
The SWATH ship overall length is related to the submerged hull length and the
strut length. Early SWATIl ships had an overall length the same as the hull length. The
hull length is mainly dictated by the displacement required, resistance characteristics,
machinery, ballast, fuel arrangement and strut length arrangement.
The relationship of beam to length or displacement, Le. I . . J B or B/6.
1
/
3
, of a
SWATH ship is different from monohull experience; this results in new challenges and
even opportunities in the top side arrangement. Beam is the parameter that influences
the transverse stability most, thus beam should be considered carefully. A greater value
of
LIB
means shortening the righting arm but an excessive beam also means greater
bending moment to be resisted by the cross structure.
A consequence of locating most of the SWATH ship buoyant volume well below
the water surface is a much deeper draught compared to an equivalent size of a
monohull ship. For large ships this deeper draught leads to some limitations due to dry
docking facilities and harbour water depth. The deeper draught also brings about the
increase in cross-deck bending moment, hence requires much care in structural design.
However, an increase in draught allows for better underwater visual observation from
dome ends or sonar properties. In addition, propeller cavitation and ventilation, which
are significantly affected by the shallow submergence of the propeller, can be
substantially reduced, as observed by Kennell (1985).
The summation of deeper draught, considerably high box clearance and box depth
is relatively greater depth to the main deck, which also means greater freeboard. The
drier deck of a SWATH ship is one of the particular benefits of greater depth and
freeboard.

7/26/2019 1992djatmikophd.pdf
http://slidepdf.com/reader/full/1992djatmikophdpdf 30/507
The SWATH basic design parameter relationships are summarised and listed in
Tables 1.2 and 1.3. A comparison between a SWATH ship with an equivalent size of
monohul1 in term of basic design parameters is given in Table 1.4.
1.3. SOME POTENTIAL APPLICATIONS OF SWATH SHIPS
Having studied the concept, some characteristics and basic design parameters of
the SWA TIl ship, one can try to clarify advantages and disadvantages of a SWATH
ship compared to a monohull, as well as some potential applications of a SWATH ship.
The primary advantage of a SWATH ship is its relatively lower magnitude of
deck motions, i.e. heave, roll and pitch, in a seaway while at rest or underway, which
also means lower magnitude of acceleration in the related modes. This feature directly
influences the improvement of shipboard activities and safety, such as crew
performance, deck equipment operability and passenger comfort. From this view point
a SWATH ship is suitable to be used as an air-capable ship and as a passenger ferry.
Hightower and Seiple (1978) identified the combination of steadiness, with its
station-keeping ability, makes a SWATH ship capable to carry out over-the-side work.
This capability was demonstrated when the SSP
Kaimalino
successfully recovered
floating equipment in a seaway after a lO00-ton monohull failed in several attempts. In
addition, as a result of the high degree of directional stability such work can be
conducted by a SWATH ship at any heading angle without difficulties, while a
monohull is restricted to head seas. The SWATH seakeeping could possibly be
enhanced as much as 50 percent by fitting active control surfaces, that is, canards
forward and stabilisers aft. Considering this performance a SWATH ship offers great
potential to be used as a stable support vessel.
In terms of regular transportation, reliability in maintaining the maximum speed in
foul weather, in accordance with the required schedule, often can not be fulfilled by a
moderate, or even large, monohull ship. A relatively small SW ATB ship, however,
could possibly satisfy such requirement, as its combination of slender streamlined
wave-piercing struts and deeply submerged hulls with a reasonable installed power
makes it amenable for operation in heavy seas. Thus a SWATH ship is considered by
Wu (1985) as the merging of the speed qualities of vehicles such as hovercraft, planing
boats or hydrofoil with the good seakeeping qualities of semi-submersibles.
Comparative studies of SWA TIl and monohulls were made by the U.S. Navy in 1979.
One of these was in speed performance in higher sea states, where the SWATH ship
shows its superiority over the monohull, as shown in the curves of Fig. 1.7 [Mantle
(1980)].

7/26/2019 1992djatmikophd.pdf
http://slidepdf.com/reader/full/1992djatmikophdpdf 31/507
A SWATH ship is well known for having a spacious unobstructed stable deck.
This certainly is of great importance for naval activities, such as V/STOL
(Vertically/Short Take Off and Landing) aircraft carrier or as a missile launching base,
as well as for some commercial and research operations. Due to this characteristic
accommodation spaces above the main deck level can be arranged more conveniently.
Odd volumes in the hull girder, especially in the struts and hulls cannot always be used
which may require correct arrangement of deck houses. Existing designs have provided
as much as one third of the total usable volume in deck houses.
A SWATH ship offers a high degree of survivability when damaged. This is
mainly provided by the cross box which provides a huge reserve of buoyancy in case
of underwater damage. The impact of a large missile on the side can possibly sink a
small mono hull frigate, but this would not be the case for a SWATH frigate. As the
first strut that is hit resists the missile blast, the other strut may survive and the
propeller on this side can still maintain its function. The situation would be more
beneficial when a tandem strut per hull configuration is utilised. Nevertheless, a
versatile counter flooding ballast system should still be installed due to vulnerability
towards asymmetric flooding and static heeling after damage.
The deeply submerged hull is indicated by Mabuchi et al (1985) as a particular
advantage for an underwater work support vessel. Sonar systems and other equipment
installed in the lower hulls should work with higher accuracy, particularly when using
electric power as the prime mover giving reduction in noise and vibration. The
capability of underwater observation could be improved by mounting a plexiglass dome
at the fore part of the hull to allow 180 degrees underwater viewing, as was done by
Hightower et al (1985) on the SSP
Kalmalino,
In naval activities these features could
obviously satisfy the mission carried out by a mine sweeper ship.
Although the concept of SWATH ship is relatively new, the required technology,
unlike other advanced marine vehicles which require high technology considerations, is
not much different from the technology of monohull ships. This means that SWATH
construction can be implemented using standard shipbuilding technology with, of
course, some extensions to match the unusual SWATH geometry. Nevertheless, some
believe that SWATH ship owes more to the technology experiences of semi-
submersibles rather than to the conventional ship.
The advantages of SWATH ships mentioned previously are not achieved without
drawbacks. The first significant drawback as a result of low waterplane area of a
SWATH ship is a lower tons per inch immersion (TPI). TPI indicates the sensitivity of
a ship's draught to changes in weight during design or operation. As a consequence of

7/26/2019 1992djatmikophd.pdf
http://slidepdf.com/reader/full/1992djatmikophdpdf 32/507
reduced TPI in SWATH designs, a much greater draught change would occur on a
SWATIl than on an equal displacement monohull for a given change in weight This is
then followed by considerable change of box clearance so that in certain cases deck
bottom slamming becomes more adverse.
Secondly, a low waterplane area with short strut length brings about a reduction
of moment to change trim one inch (MTI), which is a direct measure of the trim
sensitivity of a ship. A ship with very low MTI, which also means low hydrostatic
restoring moment, would be vulnerable towards pitch instabilities in following seas. An
extra careful consideration of weight distribution including the accuracy of LCB and
LeG estimation is therefore required in SWATIl ship design. In addition, this would
also require a sophisticated counter ballast system. Because of these deficiencies a
SWATH ship certainly would not satisfy the mission of general cargo ships which
require large variable payload capability.
Another problem which has arisen in association with the weight sensitivity, is
exploration of new alternatives for lighter structural material than steel for SWATH
construction in order to increase DWT/ll. ratio and further increase in payload. So far
only alumunium is technically and economically considered as an appropriate material
substitute for steel, although the use of GRP becomes more attractive lately. Existing
SWA TIl ships to date, apart from sse Kaiyo which is all steel constructed, were
either constructed using all alumunium or hybrid, usually alumunium upper hull and
steel struts and lower hulls. As reported in Combat Craft (1985a, 1985b), no serious
problems arise from the use of all alumunium or hybrid structure except on Su ave L in o
which experienced reccurent cracking in the welding joints. The use of Dupont's
explosion bonded alumunium plate Dataclad to the primary joint between alumunium
and steel has been successfully adopted in the construction of SSP Kaimalino.
The two hull geometry of SWATIl ships result in larger wetted surface area than
in monohulls as shown Fig. 1.8. This creates higher total resistance in calm water
operations as it is only at very high speed that the reduced wavemaking resistance of
SWA TIl will give a lower total resistance than an equivalent monohull. Gore (1985)
shows that theoretically, with the same amount of power installed, a SWA TIl ship will
have a maximum speed approximately two knots less than an equivalent displacement
monohull ship. Another consequence of increasing resistance is higher fuel
consumption. Moreover, such a geometry entails more skin plating and stiffening and
hence structural cost
Small SW ATIl ships suffer from limitations in machinery arrangement. Small
struts make machinery installation and access for maintenance very difficult. Placing the
prime mover in the box brings about problems in designing the transmission system, in
addition to the reduction in shaft transmission efficiency. Some transmission systems,
Chapte r 1 - In t roduct ion
10

7/26/2019 1992djatmikophd.pdf
http://slidepdf.com/reader/full/1992djatmikophdpdf 33/507
namely chain-drive, Z-drive, hydraulic and electrical, have been proposed to overcome
the problem. As stated by Stenson (1976), the use of chain system tends to be more
complex and more costly. SSP
Kaimalino
experienced a broken shaft in one of the
chain-drive system early in her life. The Z-drive system is considered by Mabuchi et al
(1985) to be the most suitable as this gives higher efficiency, low cost and lighter
weight.
The SWATH ship's wider beam and deeper draught restrict the harbours,
drydocks and channels to which it will have access. Higher freeboard makes passenger
and cargo transfer onto the quayside (or smaller craft when working alongside) more
difficult.
The bending moment on the cross deck structure and the motion characteristics of
SWATHs with a large single strut per hull are likely to be troublesome while stationary
in beam seas. Strengthening should be provided at the strut-box intersection to resist
any fatigue loads as SWATHs are unbraced structures.
Some advantages in motion performance gained by the inherently high degree of
directional stability are obtained at the expense of large turning circles and difficulty in
turning at high speeds was indicated by Seren (1983).
The most severe hindrance to the development of the concept is concern over cost
and lack of design data which have discouraged progress in development and
construction of SWATH vessels.
1.4. HYDRO-STRUCTURAL STUDIES ON SWATH TYPE VESSELS
Most SWATH studies in the past have been dedicated primarily to observations of
hydrodynamic performance, namely the motion and resistance characteristics. This is
sound and fair because the concept behind SWATH lies in the exploitation of its
seakeeping superiority over other marine craft. A vast amount of motion data has
undoubtly been acquired in the past two decades and they are spread around many
institutions. Despite this extensive data, Betts (1988b) indicates that explicit
incorporation of this in the design programs that have evolved proves to be
troublesome. This is unlike the resistance prediction that can be conveniently
accommodated in most ship synthesis programs. Furthermore, realistic operability
criteria still need to be developed for use in association with motion predictions. Betts
(1988b) regards these motion and realistic operability criteria as being top priority for
future research.

7/26/2019 1992djatmikophd.pdf
http://slidepdf.com/reader/full/1992djatmikophdpdf 34/507
The next priority for more comprehensive investigations is accurate prediction of
both the primary and secondary load effects to apply to SWATH structures. This would
then be followed by the establishment of rational structural design tools incorporating
reliability techniques.
The Department has undertaken the study of SWATH hydrodynamics since early
in 1980s. The familiarity with such problems related to offshore structures, semi-
submersible in particular, was the main experience to be transferred to SWATIl
vessels. The first study was conducted on a three-hull SWATH, rather than twin-hull,
by Smith (1982) and followed by others, which ranges from detailed motion
prediction, resistance and wave loadings, and covered both theoretical and experimental
investigations, as well as the development of a SWATH synthesis design tool.
SWATIl structural programme came later after the hydrodynamic problems were
well formulated and the development of synthesis design tool by MacGregor (1989)
was steadily in progress. Faulkner et al (1986) outlined the reliability concept by which
ultimate strength and fatigue SWATH structural design can be approached. Structural
design by Classification Rules is not considered as viable at present. This is due in
particular to the absentee of such rules. although ABS (1990) has provisional rules but
this is not comprehensive and naturally lacks support from actual experience.
Recognising this concern SWATIl structural synthesis must be founded upon sensible
load effect modelling and a rational approach to first principles structural designs.
Previous experience in rational structural design of monohull ships and offshore
platforms, e.g. by Faulkner and Sadden (1978) and Lee and Faulkner (1989), are to be
transformed to deal with SWATIls. The actual programme of the integrated structural
design of SWATIl ships was commenced in the Department by late 1990. and is
funded by the SERC. The study presented within this thesis constitutes part of this
integrated structural programme.
The initial aim of the present research was to generate experimental data on
motions and dynamic loads from SWATH model tests. The data was used to validate a
mathematical model for motion and wave load predictions recently developed at the
Department Further, experimental data on slamming will also be acquired to lay down
a foundation for the development of a reliable analytical model in future. Design loads
pertinent to SWATHs comprise the extreme primary loads. lifetime cyclic loads and
local panel pressures. These are then built upon the former findings and their statistical
treatment is an important aspect to be considered in the analysis. SWATH structural
design is then exercised, primarily in the determination of initial scantlings and fatigue
characteristics. A flowchart diagram of the current SWATIl study as shown in Fig. 1.9 l
illustrates the relationships among the explored subjects. All these observations are
contained in separate later Chapters of this thesis.

7/26/2019 1992djatmikophd.pdf
http://slidepdf.com/reader/full/1992djatmikophdpdf 35/507
The underlying theoretical formulation of SWATH ship motions is firstly
presented in Chapter 2. The limitation of the two-dimensional strip theory and other
approaches is then indicated. This led to the need for a three-dimensional diffraction
theory for predicting motion behaviours of SWATHs in regular waves. Such a program
named MARCHS, which was developed by Chan (1990), is now available in the
Department. The procedure for running
it
is to be outlined. The capability to deal more
accurately and efficiently with forward speed effects on motions is the main attraction
of this motion program.
In the second part of Chapter 2, emphasis is given to the procedures for
conducting well planned seakeeping tests on SWATH models at the Department's
Hydrodynamics Laboratory. Various instrumentation and computer softwares utilised
for test data acquisitions and analysis are indicated. Validation of the analytical model
by the measured data of single and tandem strut SWATH models is then presented.
Following this, practical applications of implementing motion predictions to the
assessment of SWATIl operability in real seaways are described.
A supplementary observation on SWATIl ship resistance is incorporated in this
chapter. SWATH resistance characteristics are clarified by the presentation of
theoretical and experimental data. An unconventional feature of SWATIl resistance in
waves is evidenced from the test, and suggests a further area of research that needs to
be pursued.
The discussion in Chapter 3 concentrates chiefly on the topics of primary wave
loadings on SWATHs. A review is given of the efforts undertaken by a number of
research institutions worldwide in the development of wave loads peculiar to SWATH
ships. In parallel theoretical backgrounds to this problem are briefly outlined. The
enhancement to the motion program MARCHS to tackle the primary load on SWATHs
is mentioned.
The development of experimental data on SWATH loadings by way of
seakeeping techniques is presented. Experimental procedures, which in part refer to that
presented in Chapter 2, are put forward. Further, correlation of experimental data and
the theoretical assessment is made to demonstrate the validity of the mathematical model
developed.
Practical design of SWATH structures calls for accurate design loads which need
to be derived from a well developed understanding of the random nature of the
operational environment. The frequency-domain loading data generated for regular
waves by the so-called short-term analysis is used to provide an extreme response
required for ultimate strength design. The long-term stochastic analysis approach is

7/26/2019 1992djatmikophd.pdf
http://slidepdf.com/reader/full/1992djatmikophdpdf 36/507
used to establish the load distribution over the lifetime of a vessel. This latter approach
is of importance in supplying the load information for fatigue design. Nevertheless,
extreme loads can also be assessed based on this method by using the appropriate
statistical properties.
Examples of the application of the above methods are made on three hypothetical
SWA TIls operating in the North Atlantic. Comparison of the design loads derived from
a rigorous analysis with that from simplified formulations is another interesting aspect
that is pointed out.
The slamming phenomenon attributable to SW ATIl operation in adverse weather
is an important area that has not been sufficiently looked at in current SWATIl
technology developments. Chapter 4 is dedicated to explore this particular issue.
Theoretical prediction to tackle SWATH slamming is barely available at present.
However, an attempt will be made to elucidate possible formats for analytical models
for slamming predictions.
Recognising the difficulty in deriving design pressure, an alternative investigation
by way of experimental data has been programmed. Two distinct measurement
technique, namely the point pressure and integrated panel force have been adopted. At
the same time measurement on the relative motion is also conducted to characterise the
severity of slamming impact on SWATH's deck bottom. Again, statistical distributions
are used to investigate slamming behaviours of SWATIl operating in actual seas.
Comparison of experimentally generated slamming data and the simplified
predictions of SWATH design pressure is presented. This is augmented by the pressure
data from various SWATH designs. The accumulated pressure data shows substantial
scatter, but discrete trends are identified.
Having established a basic understanding of primary and secondary load effects
intrinsic to SWA TIls the next logical step is transferring such information to structural
design. Comprehensive SWA 111 structural design is impossible to be accomplished in
the present study because of the extensive nature of the subject, as well as the restricted
time of the present research. Only a simplified design procedure which might be useful
in very early design stage is, therefore, presented in Chapter
5 , '
A simple beam theory is adopted in the present design. The analysis can only
accommodate a limited variations in structural configurations, but it does allow a few
alternative structural materials to
be
explored. Improvement of the present computation
tool, to include the wet deck scantlings and lower hull design routines, is indicated
14

7/26/2019 1992djatmikophd.pdf
http://slidepdf.com/reader/full/1992djatmikophdpdf 37/507
Another aspect of practical structural design that is addressed within this study is
on the fatigue characteristics of SWATHs, as presented in Chapter 6. The well
established design technology from monohull ships is transferred for SW ATH
analysis. Lifetime cyclic loads developed in Chapter 3 are used. Classical damage
accumulation analysis by Miner's rule is then applied. Simplified fatigue damage is then
assessed with derived stress distributions. Applying this approach allows for sensitivity
evaluations of aspects affecting fatigue performance of SWATHs to be carried out
rapidly, with an acceptable accuracy.
Reliability analysis is incorporated to assess the safety level of SWATH structure
against fatigue failure. The general advanced first order second moment (AFOSM)
approach is utilised with Wirsching's fatigue reliability format. Rational structural
design is demonstrated by this safety evaluation.
A related subject to be discussed in this chapter focuses on the structural
inspection and maintenance strategy for fatigue damage. Finally, the need to explore
fatigue of alternative lightweight construction materials, and the use of a higher level
fatigue approach for crack propagation is considered.
General conclusions to the current study are presented in Chapter 7 by referring to
the findings drawn for the preceding chapters. At this point suggestions for future
research are put forward. For this purpose some preliminary observations on the
relevant subjects. mainly in the form of state of art review. are supplemented in the
appendices.
Chapter l=Int roduct lon
15

7/26/2019 1992djatmikophd.pdf
http://slidepdf.com/reader/full/1992djatmikophdpdf 38/507
M
0\
0\
-
~
t : : :
= '
. . . . . .
'J:j
t : : :
= '
~
.~
= 8
I
~
I
I
bJ)
I
I
· 1 3
I
I
I
.~
I
I
~
I
~
I
. 3
I
en
en
~
I
:>
I
I
:I:
I
I
E - o
I
I
~
I
I
I
I
Cl)
I
-
I
.
I
~
. . . . .
~
I
E - <
I
I
I
I
I
I
I
I
~~I
~Sl
~gl
j I
I
I
008\0
00
V' l
• . V' l
-~~
'
-
-
~
O_ \ OV' l V' l V' l Oo l
V' l \ O\ OV' l V' l - <t M
M
, c i ; ' : ' : ~ f i f i 6
0')
. . . .
I'
Ot l Ot f l O' <f OO' <f O~ ' OOO
~_ \ O . . . . OOO\ O\ oV' l 1' M\ o\ oV' l
. o N : N : c i N : ~ N
f i ' : ' : ~
< t,
M
i
-
u
~
Chapter
1-
Introduction
16

7/26/2019 1992djatmikophd.pdf
http://slidepdf.com/reader/full/1992djatmikophdpdf 39/507
Table 1.2. The SWATH Ship Basic Design Parameters [Gore (1985)]
Volume ofd isp lacemcn t;
V
65 - 90% contained in the hulls
(a ve ra ge 80% )
15 - 20% contained in the struts
14 - 22 (average 15 - 17)
(>I.JD
for A ~ 15,000 tons)
HuU Pr isma ti c Coe ff ic ien t;
Cp
St ru t th ickness ;
t I D
lit
0.45 - 0.93 (average 0.7 - 0.9)
30-60%
5 - 15 for tandem strut per
hull
20 - 40 for single strut per hull
(for A ~ 15,000 tons average
lit;
30 - 40)
S tr ut W a te ll'la ne ;
Area Coeffic ien t
~
IJB
0.7 - 0.8
S W AT H ship d en sitY
2.0 - 5.0
(>L/B for ships ~ 15,000 tons)
1/3 of total vol. of hull girder
(average 20 - 25% )
30 - 50% of total in ternal vol,
(average 35 - 40% )
15 - 20 lbs/cuft
V ol, of D eck H ouses
vol, of struts and hulls
Table 1.3. Basic Design Parameter Relationships [MacGregor (1986)]
Endurance
Vhull/V
= O . S
L= 5.4 Al/3
L= 6.2 t : : . 1 / 3 ( . : : _ ) 1
V+2
B = = 2.39
Al/3
B
=0.46
L
T - 0.57 AI/3
OWet Deck = 1.56T
0M.in
Deck = =
2.0ST
I . J D = 10 -15 (L < 6Om)
I . J D =
15 -
20 (L > 6O m) for circular hulls
D = 0.336 A1/3
0=0.6T
S
= 0.32-1/3
S I D ' 1.00 (0 < 4)
SID = 1 .2 5 (D > 4)
S(f= 0.70
t / t : : .
IJ 3
=
0.1 - 0.2
tID ' 0.25 - 0.5
SW/A = = 0.43
Payload/A = 0.13
Log (endurance) =2 .1 )9 2 - 2 .9 Io
g
,,( ~
; , n
J
V olum e of hu ll
Leng th overal l
B read th overal l
Desi gn d raugh t
Depth
HuU dimensions
Hu ll s ubmergence
St ru t th ickness
S truc tu ra l We igh t
Payload
Chapter 1-Introduction 17

7/26/2019 1992djatmikophd.pdf
http://slidepdf.com/reader/full/1992djatmikophdpdf 40/507
Table 1.4. Comparison Between SWATH and Monohull Ship [Gore (1985)]
.,
e n
:J
0
X
'
U
III
0
)(
0
•
II:
.
~
. . .
0
:J
II:
IT
E
(;
:j
•
:J
•
%
I
j
•
,
:J
%
An
Total internal volume:
Length :
Beam:
Draught:
Wetted surface area :
Depth to main deck:
Freeboard:
SWATH 20 - 30% > monohull
SWATH 30 - 40% < monohull
S\VATH 60 - 70%
>
monohull
SWATH 60 - 70% > monohull
SWATH
±
60%
>
monohull
SWATH
±
75%
>
monohull
SWATH ±50% > monohull
(for larger ships)
SWATH
±
25% > monohull
Figure 1.1. SWATH ship geometry [Kennell (1985)]
Chap/er J -Ill troduction 18
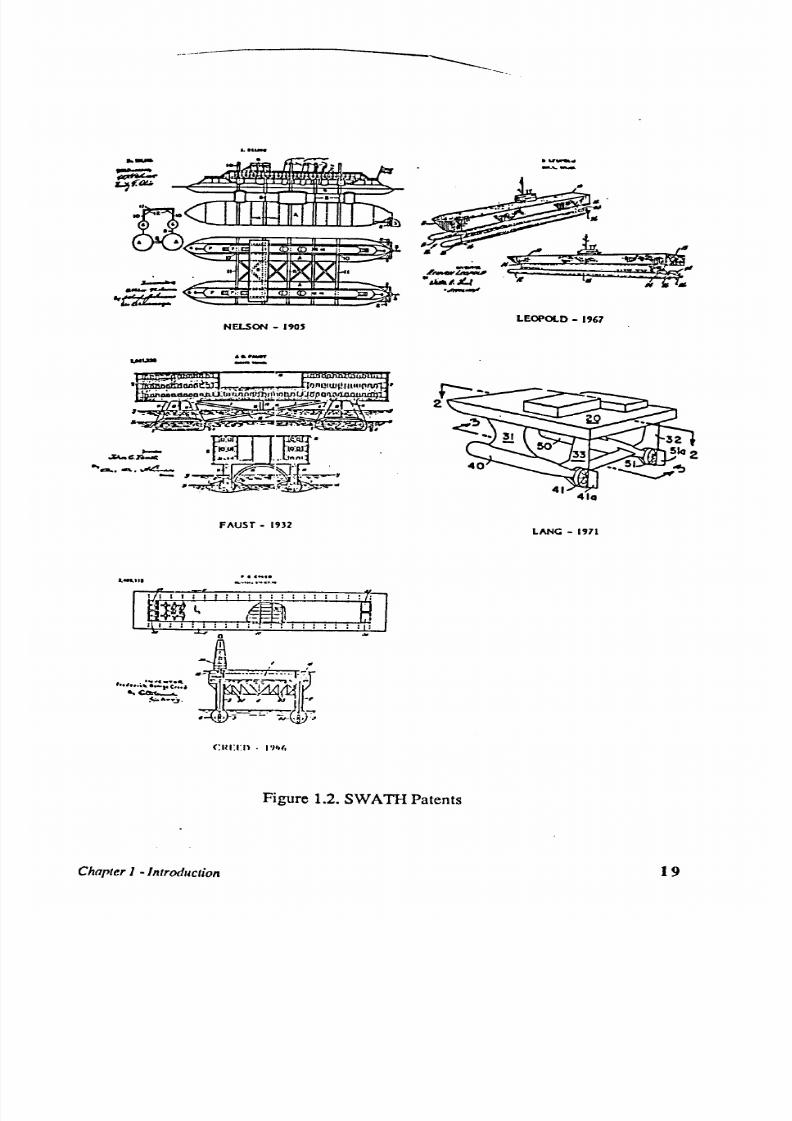
7/26/2019 1992djatmikophd.pdf
http://slidepdf.com/reader/full/1992djatmikophdpdf 41/507
. . . . . . .
NELSON - 190'
FAUST - 1932
. . . . . . . . .
CIUTn . 1'1 (,
~:':'------'~
N$;$:;;~
~ . ~
LEOPOLD - .'67
LANe -
1971
Figure 1.2. SWATH Patents
Chapter
1
-Introduction
19
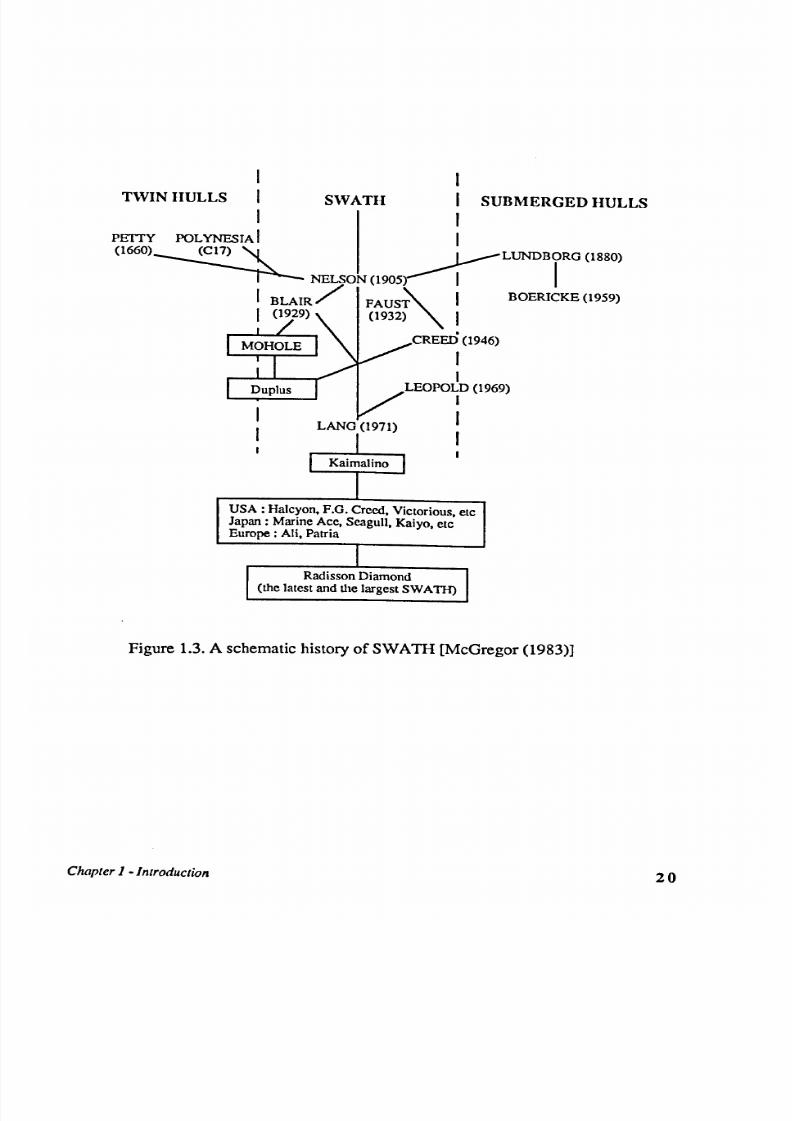
7/26/2019 1992djatmikophd.pdf
http://slidepdf.com/reader/full/1992djatmikophdpdf 42/507
I
T W IN H U L L S SW A T H I SU BM ER GE D H UL LS
I
PETTY POL Y NESTA
I I
(1660)~7) 'l. ~LUNDBORG (1880)
~ NELSON (1905) I
I
I
BLAIR/ FAUSi\.
I
BOERICKE(l959)
I (1929) (1932) '\ I
CREED (1946)
I
I
LEOPOLD (1969)
I
I
I
LANG
(1971)
I
I
Kaimalino I
I
I
USA: Halcyon, F.G. Cre ed , V ic to rio us , e tc
Japan: M arine A ce, Seagull, K aiyo, etc
E uro pe : A li, P atria
Rad is son Diamond
1
(the latest and the largest SW A
TIl)
Figure 1.3. A schematic history of SWATH [McGregor (1983)]
Chapter l-Introduction

7/26/2019 1992djatmikophd.pdf
http://slidepdf.com/reader/full/1992djatmikophdpdf 43/507
Cut'WO'( llIowint .... I e . .. .. _I~u, , 01SSI'IC.imfJino
. r , : : : - _ . .
~'
. .
'
.......
.
.
0
-0',
' l - .
I
. : : . - : _ .
.
' .
Figure 1.4. G eneral arrangem ent plan for the SSP
Kaimalino
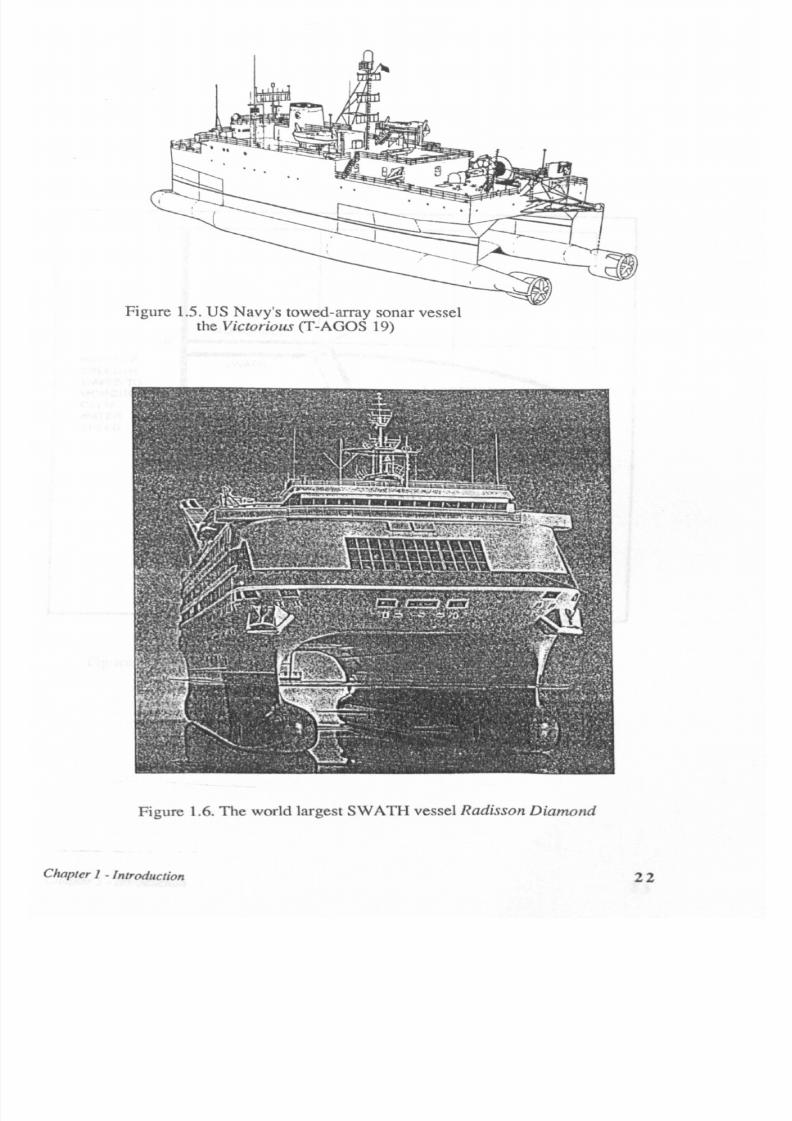
7/26/2019 1992djatmikophd.pdf
http://slidepdf.com/reader/full/1992djatmikophdpdf 44/507
Figure 1.5. US Navy's towed-array sonar vessel
the Victorious (T-AGOS 19)
Figure 1.6. The world largest SWATH vessel
Radisson Diamond
Chapter
1
-Introduction
22

7/26/2019 1992djatmikophd.pdf
http://slidepdf.com/reader/full/1992djatmikophdpdf 45/507
1.5 .......-------r--------r--------,
MONOttULl
1.0
AATIOOF
SWATH
SPEED IN
WAVES T O
lIMITED BY
MONOHUU
LIMITED
:IQ DECK
C A L '
BVRIDE
WETNESSES
WATER
QUALITY
PER HOUR
SPEED
e
®
0.5
o
SKlNIFtCAHT WAVE HEJGHT ( 'UERS)
6
Figure 1.7. SWATH and Monohull Speeds in Rough Seas [Mantle (1980)]
Chap te r 1 - In tro du ctio n
23

7/26/2019 1992djatmikophd.pdf
http://slidepdf.com/reader/full/1992djatmikophdpdf 46/507
1000
.ollod
_'oc.
, , , , I J
10000
•
10000 20000
tllo,lo•• ,o..,
. . . . )
Figure 1.8. SW A TIl and M onohull W etted Surface Area [Routa (1985)]
SWATH HYDRODYNAMICS
------>-
PRIMARY LOADING
( INAVE ENCOUNTER WADS)
SECONDARY LOADING
(SLAMMING. WCAL PRESSURES)
~ ~ I
I
I
I
I
I
I
FATIGUE DESIGN
t < - - . . . .
PRELIMINARY STRUCTURAL
DESIGN
Sufficiently studied
- - - - Partly evaluated or indicated
Figure 1.9. Schem atic diagram of hydro-structural study on SW A Tlls
Chapte r 1 - In tr oduc tio n
24

7/26/2019 1992djatmikophd.pdf
http://slidepdf.com/reader/full/1992djatmikophdpdf 47/507
CHAPTER2
HYDRODYNAMIC FEATURE OF
SWATH SHIPS

7/26/2019 1992djatmikophd.pdf
http://slidepdf.com/reader/full/1992djatmikophdpdf 48/507
CHAPTER2
HYDRODYNAMIC FEATURES OF SWATH SHIPS
2.1. INTRODUCTION
For many centuries speed performance had traditionally been regarded as the most
important factor, while seakeeping performance had not held the same importance in
ship design. Many advanced marine vehicles, such as surface effect ships, hydrofoil
crafts and planing hull type vessels were conceived and established to overcome the
speed limitation of conventional displacement vessels.
Nevertheless, stable platforms with good mobility even in adverse waters
achieved a new significance in recent years, since many activities of ocean technology
development have looked to exploit and ensure the natural resources in the ocean.
Hosada et al (1983) suggest that seakeeping performance is now increasingly
recognised as important not only in the field of ocean development but also in the fields
of marine transportation and naval activities. The reason is obvious, because better
seakeeping qualities lead to a higher operational rate, improve the operability (less
down time) hence ensuring regularity in services, and better passenger comfort which
results in successful operation of the ferries as well as better crew performances on
board and more accurate data acquisition which affects the mission effectiveness. A
novel concept of SWATH type vessels has evolved within the past two decades to meet
the requirement for better seakeeping operations.
This chapter studies motion characteristics of SWATIl vessels. Much emphasis is
given to the motion data acquisition carried out experimentally at the Hydrodynamics
Laboratory. Comparison is then made between experimental and theoretical results for
validation purposes. For this particular reason a background review of the theoretical
concept and the development of prediction tools will be first outlined. Operational
performance of SWATHs in real seaways based on the appropriate seakeeping criteria
is further studied by applying a sea spectral prediction method. To supplement this
observation on hydrodynamic performance of SW A1Hs a brief observation on their
resistance aspects is put forward. An investigation of SWATH motion and resistance
behaviour at high speed operations is another area necessary to be pursued in the
future. Design implications due to hydrodynamic performances of SWATH type
vessels are discussed.
Chapter
2
-Ilydrodynamic Features o/SWATlls
25

7/26/2019 1992djatmikophd.pdf
http://slidepdf.com/reader/full/1992djatmikophdpdf 49/507
2.2. THE NATURE OF SWATH SHIP MOTIONS
SWATIl ships have been proved to have much lower motion than monohull ships
in any mode of oscillation. This lower motion is obtained from the combination of
deeply submerged hulls and the small waterplane area of the struts. The deeply
submerged hulls. which provide the buoyancy. will experience low wave exciting
forces. whereas the small waterplane area of a SWATH ensures the natural frequency
will be much lower than an equivalent conventional vessel. The relationship between
the natural frequency and the waterplane area
in
the heave mode of motion is :
c o
=
z
pgA
w
(2.1)
M + AVM
z
This expression shows that a decrease in Aw (waterplane area) brings about lower
natural frequency o o z . The other expressions of natural frequency for roll and pitch
modes of motion are :
0> =
pgVGM
T
~
I~
+
IA~
and
c o =
pgVGM
L
9
le +
I
Ae
(2.2)
(2.3)
Again. compared with monohull ships the roll and pitch natural frequencies of
SWATH ships will be much lower. The lower natural frequencies in heave. pitch and
roll motions also means that longer natural periods are gained. Long natural periods
prevent the resonance with most sea waves. thus degradation of SWATH operability
will be avoided. The most striking comparison of ship motions resulted from the joint
U.S. Navy and Coast Guard sea trials conducted off Hawaii in 1978. as reported by
Woolaver and Peters (1980) and Holcomb and Allen (1983). The ship deployed during
the comparative trials was a 3100-ton high endurance Coast Guard cutter, USCGC
Mel/on ,
a 220-ton U.S. Navy SWATH. SSP
Kaimalino
and a llD-ton USCG patrol
boat
Cape C o rw in .
The SWATIl experienced slightly less pitch and heave. and much
less roll. The curves in Fig. 2.1 show the superior seakeeping of a small SWATH ship
compared to a monohull ship which is 15 times larger. It should also be noted the 200-
ton SWATIl has half the roll motion of the 3100-ton monohull.
Chapter
2
-H ydrodynamic F eatures o f SW AT lis
26

7/26/2019 1992djatmikophd.pdf
http://slidepdf.com/reader/full/1992djatmikophdpdf 50/507
2.3. CONCEPT OF FLUID FORCES ON A CYLINDER IN WAVES
As outlined by Comstock (1977) the basic understanding of ship motion can
easily be studied by considering the case of a freely floating cylinder in a train of
regular harmonic (sinusoidal) waves which
are
long with respect to the cylinder.
When surface waves pass through a floating body the ambient fluid will exert
hydrodynamic forces and moments on the body. These consist of two components, i.e.
the unsteady exciting components, known as the first order forces, lead to the body
oscillations and these components are linearly proportional to the wave height. On the
other hand, second order forces are attributable to the non-linear effects and these
components
are
generally small and proportional to the square of the wave height.
Figure 2.2 from Atlar et al (1987) shows the diagram of the division of the fluid
forces and moments exerted by the surrounding fluid on the floating body subjected to
the surface waves. The following clarification is concerned with the division of forces
(or moments).
The first order oscillatory forces can be divided into two main components,
namely, viscous force and pressure force. The viscous force, F
v
,
is brought about by
the fluid viscosity and deals with the fluid flow velocities relative to the body. The flow
velocities are generated by the body motion and by waves. The former, i.e. flow
velocities generated by the body motion, create damping force on the body, known as
damping force due to viscosity. The latter in certain cases, such as rolling cylinders in
fluid where the pressure force is very small, the fluid force will be dominated by
viscosity force.
The pressure force consists of the hydrostatic restoring force and the
hydrodynamic force. The hydrostatic force, F
c
'
is the force caused by the fluid
displaced when the floating body changes its submerged volume. This force usually
corresponds linearly to the motion displacement and acts against it. Therefore, FC can
be written as :
F
=
-Cs
c
(2.4)
where C
=
restoring force coefficient, and
s = motion displacement
Chapter
2 -
Hydrod ynam ic Featu re s o f SWAT lis
27

7/26/2019 1992djatmikophd.pdf
http://slidepdf.com/reader/full/1992djatmikophdpdf 51/507
The hydrodynamic inertial force,
FA'
which is created by the hydrodynamic
added mass A corresponds with the acceleration, s , and opposes the motion, and is
written as:
F
=
-As
A
(2.5)
where A = hydrodynamic added mass (or mass moment of inertia)
The hydrodynamic velocity force, F
B
, is proportional to the velocity, s , and acts
against it. This force is a result of energy losses of the body due to radiated surface
waves:
F
=
-Bs
B
(2.6)
where B
=
hydrodynamic damping per unit velocity.
The wave induced force,
F
w' is the summing of the incident wave force,
F
I
,nd
the diffracted wave force,
F
D
.
This force is also known as the wave exciting force and,
since its magnitude varies with time, it is included as follows:
F = (F + F ) e-
irot
WID
(2.7)
where i = r-i
r o =
radian frequency of the incident waves, and
t = time
According to Newton's second law, the sum of the above fluid forces will be
balanced by the inertial forces (or moments).
FM
is equal to the body mass (or mass of
moment inertia) multiplied by the acceleration of the body motion as :
F = Ms = F - F - F - F
M W ABC
(2.8)
where
M
=
total body mass (or mass moment inertia)
By substituting equations (2.4) and (2.6) into equation (2.8), the force (or
moment) equation becomes:
Ms
=
F - As -
Bs - Cs or
w
(M + A) s + Bs + Cs = F
W
(2.9)
Chapter 2 -L ly dro dy namic F eatu re s o f SWAT II s
8

7/26/2019 1992djatmikophd.pdf
http://slidepdf.com/reader/full/1992djatmikophdpdf 52/507
2.4. MOTION EQUATION OF A SWATH SHIP
The theoretical background to solve the problem of six-degree of freedom coupled
motions of a SWATH ship in regular quartering seas addressed in this section is
extracted from the reports by Lee and Curphey (1977), Seren and Atlar (1984a), and
Atlar (1986).
2.4.1. Definition of a Co-ordinate System
The co-ordinate system applied in the analysis is a right handed rectangular co-
ordinate system, as shown in Fig. 2.3. This co-ordinate system can be described as
follows:
a. Earth fixed axes
(O -Xo YoZo)
are fixed with respect to earth. Their origin is
located arbitrarily but usually at the calm-water surface.
b. Body fixed axes (G-xyz) have their origin at the centre of gravity of the body
and are coincident with the intersections of the principal planes of inertia.
c. Space-fixed or mean body axes
(O-XYZ)
originate at the main position of the
body centre of gravity and are used to describe the body oscillations. The
system is parallel to the earth-fixed
(O -Xo YOZo )
system but translates with the
advancing ship speed U.
2.4.2. Formulation of Equations of Motion
There are some assumptions that should be stated in this analysis so that the
solution performed could be justified. These assumptions are :
a. the exciting forces and moments are assumed to be solely contributed by free
surface waves
b. the wave amplitudes or the wave slopes are assumed to be small
c. the vessel is operated in an infinitely deep ocean, therefore, no appreciable
currents or winds would cancel the linear response assumption, and
d. the submerged parts of the vessel are assumed to be reasonably slender.
Considering these assumptions, the six-degree of freedom linear coupled equation
of motion for a floating body subject to sinusoidal wave excitation of frequency w may
be expressed in the following form :
Chapter
2
-U y dr od yn am ic F ea tu re s o f SWAT l is
29
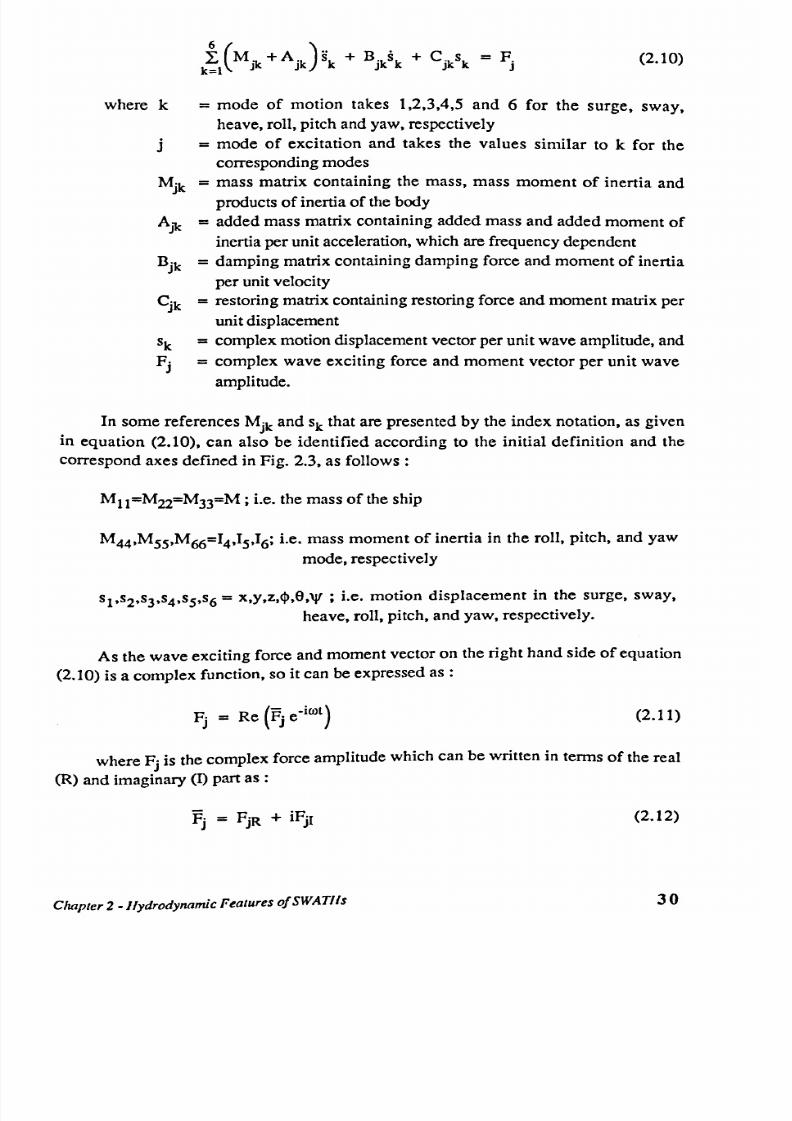
7/26/2019 1992djatmikophd.pdf
http://slidepdf.com/reader/full/1992djatmikophdpdf 53/507
(2.10)
where k = mode of motion takes
1,2,3,4,5
and
6
for the surge, sway,
heave, roll, pitch and yaw, respectively
j
= mode of excitation and takes the values similar to k for the
corresponding modes
Mjk = mass matrix containing the mass, mass moment of inertia and
products of inertia of the body
Ajlc
=
added mass matrix containing added mass and added moment of
inertia per unit acceleration, which are frequency dependent
Bjlc = damping matrix containing damping force and moment of inertia
per unit velocity
C
jlc
= restoring matrix containing restoring force and moment matrix per
unit displacement
sk = complex motion displacement vector per unit wave amplitude, and
F
j
= complex wave exciting force and moment vector per unit wave
amplitude.
In some references Mjlcand sk that are presented by the index notation, as given
in equation
(2.10),
can also be identified according to the initial definition and the
correspond axes defined in Fig.
2.3.
as follows:
Mll=M22=M33=M; Le. the mass of the ship
M44,MS5,M66=I4,Is,I6; Le. mass moment of inertia in the roll. pitch. and yaw
mode. respectively
SI
,s2,s3,s4,s5,s6
=
x,y,z,cp,e.'Jf ; i.e. motion displacement in the surge, sway,
heave, roll, pitch. and yaw, respectively.
As the wave exciting force and moment vector on the right hand side of equation
(2.10)
is a complex function, so it can be expressed as:
(2.11)
where F· is the complex force amplitude which can be written in terms of the real
J
(R) and imaginary (I) part as :
(2.12)
Chapter 2 - lly dr o dynam ic F eatu re s o /SWATJ ls
30

7/26/2019 1992djatmikophd.pdf
http://slidepdf.com/reader/full/1992djatmikophdpdf 54/507
B y substituting eq. (2.11) into eq. (2.12), itcan be found that:
Fj
=
{(FjR
+
iFjI) e-
irot
} or
Fj
=
FjR cos rot
+
iFjI sin rot
(2.13)
and eq. (2.13) can be w ritten as:
(2.14)
where
(2.15)
= m axim um of the w ave exciting force, and
e j = arctan (FjR /FjI ) (2.16)
= the phase shift of the maximum of the wave exciting force from the
incident w ave at the origin of the w ave co-ordinate system [see p.4
of the report by Seren and A tlar (1984a»).
To be com patible w ith the com plex expression of F
j
, th e mo tio n d is pla cemen t
sk
is also assum ed to be a com plex function given by :
(2.17)
Furtherm ore, the velocity and the acceleration com ponents can be expressed as :
S k
= -
ir o S k e-irot
.. . 2 - -irot
Sk = -lro sk e
(2.18)
(2.19)
Follow ing the above sequence from eq. (2.11) to (2.16) the m otion displacem ent
can also be writte n a s fo llows:
Sk = skR + iS
kI
sk = skR cos rot + SkI sin rot
ISkl
=
~(s~
+
S~I)
sk = ISkl cos (ak - rot)
at = a rc tan (skIlskR)
(2.20)
(2.21)
(2.22)
(2.23)
(2.24)
Chapter
2
-Hydrodynamic Fea tu re s o /SWAT lls
31

7/26/2019 1992djatmikophd.pdf
http://slidepdf.com/reader/full/1992djatmikophdpdf 55/507
where: Iskl = the maximum of the motion displacement, and
uk
=
the phase shift of the maximum of the motion displacement from
the maximum of the incident wave at the origin of the wave
co-ordinate system.
2.4.3. Solution of the Motion Equation
The surge mode is assumed to be decoupled from the other modes. Moreover, the
added mass, damping and diffracted wave force in the x-direction are assumed to be
small and negligible. The equation of surge motion, therefore, can be expressed by:
(2.25)
or by using the coordinate system as a reference, eq. (2.25) becomes:
Mx = F
1
(2.26)
The symmetry of the hull with respect to the longitudinal centre plane leads to the
decoupling of the vertical plane (heave and pitch) from the horizontal plane (sway, roll
and yaw) modes. Consequently the equation of motion can be divided into two groups.
By expanding eq. (2.10) for heave and pitch modes, i.e.
j,k
=
3
and
5,
this can
be written as :
(M33 + A
33
) s3 + B
33
s
3
+ C
33
s
3
+ A3S
s
S + B3S
s
S + C
3S
s
S
= F3
(Mss
+
ASS) Ss
+
Bssss
+
Csss
s
+
As/J
3
+
B
S3
s
3
+
CS3 s3
=
Fs
(2.27)
or, by using the corresponding co-ordinate system, eqs.(2.27), becomes:
(M33 +
A
33
)
Z + B33
z
+ C
33
z
+
A3S
e
+
B3S
e
+
e
3S
e =
F3
(Mss + Ass) e + Bsse + esse + Asi + BS3
z
+ e
S3
z =
Fs
(2.28)
Substituting eqs. (2.18) and (2.19) into eq. (2.27) for j.k = 3 and 5 the following
equations are derived :
32

7/26/2019 1992djatmikophd.pdf
http://slidepdf.com/reader/full/1992djatmikophdpdf 56/507
B y substituting eqs.
(2.12)
and
(2.20)
into eq.
(2.29)
fo r
kj
=
3
and
5
and a rr anging
the right and left hand-side of the above equation in term s of the real and imaginary
part, the follow ing matrix form of the resulting equation is obtained:
s 3 R
F 3 R
s S R
F S R
x
=
s 3 I F 3 I
s S I F S I
.... (2.30)
or by using the index notation corresponding to the co-ordinate system eq. (2.30) can
be w ritten as :
-c.oB
S 3
x
=
Z I F3I
e
I
F S I
.... (2.31 )
By expanding eq.
(2.10)
for sway, roll and yaw modes, i.e . j,k =
2,4
and
6,
this
can be written as :
(M22 + A
22
)S 2 + B2i2 + A
24
s
4
+ B
24
s
4
+ A
26
s
6
+ B
26
s
6
= F2
(M M +AM)S4 +B4i4 +C
44
s
4
+A
42
s
2
+B
42
s
2
+A
46
S
6
+B
46
S
6
=F
4
(M 66 + A66)S6 + B
66
s
6
+ A
62
S
2
+ B
62
S
2
+ A
64
s
4
+ B
64
s
4
= F6
(2.32)
Applying the corresponding co-ordinate system , motion equation (2.29) becomes:
33

7/26/2019 1992djatmikophd.pdf
http://slidepdf.com/reader/full/1992djatmikophdpdf 57/507
(M22 + A22)Y +B22y+A24~ + B
24
$+
A26'V
+ B
26
V =
F2
(M 44 + A44)~
+
B 44$ +
C
44
< j)
+ A
42
y + B 42
Y
+ A46 'V
+
B46'iT
=
F4
(M66 + A66)'V + B66'iT + A
62
y
+
B
62
y + A64~
+
B64$
=
F6
(2.33)
A similar procedure, as in the coupled heave and pitch, is implemented for the
sway, roll and yaw, i.e. kj = 2,4 and 6, which yields the following matrix form of eq.
(2.32) as :
-m
2
(MU +A
22
>
_m
2
A _m
2
A
m0
22
m0
24
mB26
'2R F2R4 26
_m
2
A
2
_m
2
A
mB
24
mB44
mB46
4
-m (M«+A
44
)+C
44
46
14R
F4R
-m
2
A
_m
2
A
-m
2
(M66 + A
66
)+C
66
mB62
mB64
mB66
16R
r
6R
2
44
x
=
-mB
22
-mB
24
-mB
26
2
_m
2
A
_m
2
A
m (Mu +A
22
>
24
26
121
F21
-m0
24
-O)B
44
-
mB
46
_m
2
A
- m
2
(M« + A
44
)+C«
2
F41
4
-m A
26
141
- O)B
62
-mB
64
-m8
66
2
_0)2
A
-m
2
(M66 +A
66
)+C
66
F61
0) A62
44
' 6 1
•... (2.34)
or by using the index notation in conjunction with the coordinate system equation above
can be
written as :
2
2
2
mB
ll
roB
24
roB
26
Y
R
F2R
Q)
(M
ll
+A
22
>
-(&) A24
-ro A
26
-m
2
A24
2
2
roB
24
roB
4
,
roB
46 ~R F2Rro (14 +A,,)+C44 -ro A46
-m
2
A
2
-ro
2
(J6 +A
66
)+C
66
roB
62
roB
64
O)B
66
'R
F6R
62
-(&) A'4
x
=
-ro
2
(Mll+All)
2
2
F2I
m8
ll
-m0
24
-roB
26
-(&) A24
-0) A
26
YI
2
_0)2(J,+A
44
)+C
44
2
~I
F'l
0)8
24
-roB'4
-O)B
46
-(&) A24
-(&) A
26
2
2
_0)2(16 +A
66
)+C
66
' I
F61
roB
62
-roB
64
-O)B
66
-(&) A62
-(&) A44
.... (2.35)
2.4.4.
Hydrodynamic Forces
The first order, external oscillatory fluid forces acting on a ship can be divided
into two linearly superimposable components, that is, wave-induced (or excitation)

7/26/2019 1992djatmikophd.pdf
http://slidepdf.com/reader/full/1992djatmikophdpdf 58/507
forces and motion-induced (or reaction) forces, as shown by Seren et al (1985). The
first force consists of the incident wave force calculated on the assumption that the
presence of the body does not distort the wave which can be derived from the Froude-
Krylov theory, and the diffracted wave force, which accounts for the scattering of the
incident wave by the presence of the body.
The reaction force, as has been described in the foregoing section, is considered
to be a property of the structure and consists of three components which directly relate
to the three components of hydrodynamic excitation. The three components are: a
quasi-static (or buoyancy) restoration in heave, roll and pitch modes and a body-
generated hydrodynamic force which is subdivided into an inertial (added mass) force
and damping force as a result of the circumfusion of energy from the body in radiating
surface waves, which are linearly proportional to the body acceleration and velocity
respectively. This force is calculated with the assumption that the body undergoes the
same motion in calm water as in waves. This is called a radiation problem.
It should be borne in mind that the excitation and reaction forces possess viscous
components caused by the wave-induced viscous fluid damping and the body-induced
viscous fluid motion, respectively. Both components are combined into a single
viscous force resulting from the relative velocity of body and fluid.
2.4.4.1. Problem Formulation with Forward Speed. The body fixed axis (0-
xyz) which coincides with the space-fixed co-ordinate system (O-XYZ) at time t=O,
moves along the X-axis with a steady forward speed U. The relationship between the
fixed and translating co-ordinate system as used by Seren et al (1985) can be written as
follows:
X = x + Ut; Y = y; Z = z
(2.36)
whereas the relationship between the wave frequency and the frequency of encounter,
roe' is given by :
(2.37)
kO
g
=
the incident wave frequency at zero speed
= the wave heading angle, which is defined so that J.l=0 indicates
following or overtaking seas directly from astern
=
the wave number
=
roo2/g, and
= the acceleration due to gravity.
where roo
J.l
Chapter
2 • J
ly dr odynam ic F eat ure s o f SWATHs
3S

7/26/2019 1992djatmikophd.pdf
http://slidepdf.com/reader/full/1992djatmikophdpdf 59/507
In a reference frame (G-xyz) moving with steady forward motion the incident
wave potential which generates the wave is expressed as :
(2.38)
with
' ( .k ) __
ig~A (koz) (ikosin~)
't'I y.z;
0,11 -
e e
C O o
(2.39)
where
~A =
wave amplitude.
If the influence of the phase shift, due to the longitudinal location of the strip section
relative to the crest of the incident wave through the body axis, is omitted until the final
calculation for the force on the body, then the expression of the incident wave velocity
potential given in eq. (2.39) can be written in its odd (0) and even (e) parts as follows:
(2.40)
2.4.4.2. The Froude-Krylov Component.
When the body fixed axis, G-xyz,
moves with a steady forward motion, the incident wave potential is identical to that at
zero-speed, except for the change in frequency of encounter.
In matrix notation, the Froude-Krylov sectional forces per unit wave amplitude,
fK(m)' in the in-plane modes of motion as given by Seren and Atlar (1984b), are
(omitting the time factor) :
K
sin
-dz
f(2)(x)
f(~)(x)
k z
(ko y sinJl)
dy
(2.41)
pg Je 0
cos
S(x)
f(~)(X)
sin
ydy+(z-zo)dz
where J = the contourwise integral at station x
S(x)
p = density, and
subscript (m) = denotes the dependence on the mode of motion

7/26/2019 1992djatmikophd.pdf
http://slidepdf.com/reader/full/1992djatmikophdpdf 60/507
Integrating the foregoing sectional forces along the ship length, taking into
account the phase angle, yields the resultant Froude-Krylov forces and moments per
unit wave amplitude, FK(m) :
K
if(~)(x)
dx
F(2)
K
i f(~)(x)
dx
F(3)
K
[ei k O X C O S J . 1
if(~)(x)
dx
(2.42)
F(4)
=
L
K
i f(~)(x)
-dx
F(5)
K
if(~)(x)
xdx
F(6)
where I
= the lengthwise integral for the component.
L
Whenever a product with the imaginary unit i is involved, only the real part of the
product will be recognised.
2.4.4.3.
The
Diffraction Component.
The sectional sway, heave and roll-
exciting forces and moments due to diffraction, fD(m)' are given by :
fg)(x)
( 0)
-dz
PD(y.z.k.u)
D
ipro I
cp~)(y,z,k,Jl)
dy
(2.43)
(3)(x)
=
Sex)
f(~)(x)
cI>~)(y.z.k.Jl)
ydy+(z- zo)dz
where cl>o(o)
=
the odd complex diffraction velocity potential which corresponds
to cl>lo),and
cl>De) = the even complex diffraction velocity potential which corresponds
to c p l e ) .
The diffraction velocity potential CPocan be expressed as a function of Green's
theorem and the complex source strength. By taking the normal derivative of the
function as :
Chapter 2 -H ydrodyn am ic F e atures o f SW AT Hs
37

7/26/2019 1992djatmikophd.pdf
http://slidepdf.com/reader/full/1992djatmikophdpdf 61/507
where Qj
=
the G reen's function at any segm ent j
Iij,Jij = term ed as th e 'influence coefficien ts' [S eren et
al
(1985)].
By separating the right hand side of eq. (2 .44) into its real and im aginary part, the
odd function can be w ritten as :
and the even function as :
T he even functions for both the incident and the diffraction produce w ave exciting
forces in heave, w hile the odd functions produce sw ay and roll forces.
T aking into account the phase angle. the resultant diffraction forces and m om ents
per unit w ave am plitude, FD (m ) :
F(~)
Fe~)(k)
0
fg)(x)
D
Fg)(k)
0
D
F(3)
f
(3
)(x)
D D
0
r
D
(2.45)
F
(4)
= F
(4
)(k)
+ +
f
(4)
(x )
D
Fe~)(k)
U
D
-fg)(x)
e s
)
iooP(3)(k)
D
Fe~)(k)
D
F(6)
U D
- f(2)
(x )
- io oF (3 )(k )
with
r U
ikoxcosll
=-.-e
l OO
The elements of the first m atrix in the right hand side of eq. (2.45), pD (m )(k), are
independent of speed, but depend on encounter frequency . The elem ents of the second
m atrix are the so-called speed dependent term s w hich influence only the pitch and yaw
modes. The term s in the third matrix are the end term s. x refers to the longitudinal
distance from the origin of the co-ordinate system and:

7/26/2019 1992djatmikophd.pdf
http://slidepdf.com/reader/full/1992djatmikophdpdf 62/507
IL
indicates
I
;:r
with I e and la' respectively, the distance of the forwardmost and aftermost sections from
the origin of the co-ordinate system used in the calculation.
The resultant wave exciting force per unit wave amplitude acting on the SWATH-
type ship proceeding in regular oblique seas is obtained by adding the Froude-Krylov
force, eq. (2.42), and the diffraction force. eq. (2.45).
Lee and Curphey (1977) introduced the phase relationship by taking a cosine and
a sine component (in phase with the acceleration and velocity, respectively) of all the
quantities involved in the calculation.
2.4.5. Hydrodynamic Coefficients
The three-dimensional added mass/inertia and wave damping coefficients, Aij and
Bij respectively, as given in Table 2.1. are expressed in tenus of the corresponding
sectional coefficients which are assumed frequency dependent. aij' b
ij
, with I the
. L
lengthwise integral for the component.
When the areas of the end-sections are zero, the end terms vanish. The remaining
terms, if any, in a certain mode mode of motion are the speed dependent terms which
are characterised by U. The subscripts of the coefficients denote a coefficient in i
th
force or moment equation due to motion in jth mode. The superscript '0' denotes terms
evaluated at zero speed. The expressions in Table 2.1 are only the potential part of the
motion coefficients of an un appended SWATH ship. To obtain reasonable predictions
of SWATH ship motions alternative formulations, which include both the hull viscous
effects and the hydrodynamic effects due to the fins contribution, ought to be applied.
Such formulations can be found in the reference by Lee and Curphey (1977).
2.4.6. Hydrostatic Restoring Forces
Based on the hydrostatic considerations, the restoring forces in the equation of
motions are given in Table 2.2. Where GMT and GM
L
are the transverse and
longitudinal metacentric height, respectively, MAW is the moment of the waterplane
area about the y-axis, and V is the volume of displacement.
Chapter 2· / lyd rodynamic Fea tu re s o fSWATl ls
39

7/26/2019 1992djatmikophd.pdf
http://slidepdf.com/reader/full/1992djatmikophdpdf 63/507
2.5. SOME METHODS OF SWATH SHIP MOTION ASSESSMENT
As for conventional monohull ships and offshore structures, there are three main
methods which can be applied to estimate the wave induced loads and motions on a
SWATIl ship. These methods are well known as :
a. Morison's Formula
b. Strip Theory
c. Three-dimensional Sink-source Technique.
The application of Morison's formula is justified when three assumptions relating
to the submerged body can be satisfied. Firstly, the diameter of the SWATH hulls
should be small compared to the wave length. When the hulls are subdivided into
several small cylinders, the ratio of the hull diameter to the wave length should be less
than 0.2. Furthermore, Morison's formula requires the potential damping attributed by
waves to be ignored. Secondly, the hulls are assumed to be deeply submerged and,
thus, unbounded ambient fluid can be used for added mass and damping. The third
assumption is the hulls are not closely spaced. This implies that the hull spacing should
be large with respect to the cross-sectional element dimensions so that the
hydrodynamic interference between the elements may be neglected. These assumptions
lead to restrictions in the application of Morison's formula particularly for SWATH
ships. Therefore, this method is considered to be inappropriate.
By using the strip theory, the solutions are found basically in the same way as for
Morison's formula, that is, the submerged hulls are sliced into several elements. Each
element is considered individually, thus, the hydrodynamic interference between the
elements can be neglected and the forces on each element calculated utilising the two-
dimensional Close-fit technique developed by Frank (1976). There is an assumption in
the application of strip theory, i.e. the submerged hulls should satisfy the longitudinal
slenderness. In this theory the SWATIl vertical struts are considered as surface-
piercing extensions of the hulls and included in the two-dimensional beamwise strip
sections. The hydrodynamic interference between the hulls and the struts is treated
separately. This theoretical approach has been successfully applied for SWA TIl ship
designs by Nordenstrom et al (1971), Kim and Chou (1973), Lee (1976), and Seren
and Atlar (1984a).
For some types of large twin-hull semi-submersibles, such as pipelaying barges,
with relatively short columns and cross-sectional dimensions which are similar to the
hull separation, Morison's formula and the strip theory approach are no longer suitable.
Therefore, calculation of wave loads should be determined by the three-dimensional
Chapter
2
-Hydr odynam ic F eat ur es o SWAT lls
40

7/26/2019 1992djatmikophd.pdf
http://slidepdf.com/reader/full/1992djatmikophdpdf 64/507

7/26/2019 1992djatmikophd.pdf
http://slidepdf.com/reader/full/1992djatmikophdpdf 65/507
Some input data required to run the program and this can be classified as
processed input data and pure input data, as described by Drysdale (1986a). The
processed input data is the geometry data from, e.g. SWl1.DAT and the mass data
from SWIIMAS.DAT, where SW stands for SWATH, and 11 stands for SWATHI
model with geometry configuration 1. By running the program SWATIlL and inputing
SWl1.DAT the hydrostatic data of the model can be obtained, whereas inputing
SWIIMAS.DAT results in mass distribution data of the model.
The pure input data required is wave frequency, model characteristic length and
draught, model speed, water density and the model heading angle towards wave trains.
Additional input data, i.e. the mass of the deck and the deck beam are required to obtain
dynamic structural loads. The number of wave frequencies in radians/second input into
the running program varies from 1 to 30 and this input influences the running time.
Variation of the model position with respect to wave propagations is between 0° and
180°.
The output data obtained from running the main program is motion induced
coefficients, wave exciting force/moment and phases, motion amplitudes and phases
and bending moments and shear forces at the midpoint of crossdeck and phases.
2.6.2. Computer Program Based on the Three-dimensional
Sink-Source Technique
The computer program to assess the motions and dynamic loadings of SWATH
ships based on the three-dimensional sink-source technique is called SHIPM1.0, and
was written to run on the VAX Cluster computer system at the University. This
computer program was developed from a basic understanding of ship hydrodynamics
by Zheng (1985,1986,1988) and then gradually improved to solve the problem of six-
degree of freedom of ship motion and dynamic loads.
The SHIPM1.0 computer program comprises three routines, namely, SHIPMIA,
SHIPM2A and HFORCE. The SHIPMIA routine calculates the hydrodynamic forces
imposed on a floating body without the effect of free surface. Whereas the SHIPM2A
routine takes into account the free surface effect or viscosity which are frequency
dependent, and consequently to run this computer program more time is consumed
than for running SHIPMIA. The HFORCE computes the hydrodynamic forces.
motions and wave loads, and creates graphs of motion and structural responses.

7/26/2019 1992djatmikophd.pdf
http://slidepdf.com/reader/full/1992djatmikophdpdf 66/507

7/26/2019 1992djatmikophd.pdf
http://slidepdf.com/reader/full/1992djatmikophdpdf 67/507
unaffected by the forward motion, thus some restrictions must apply to forward
speeds. In order to place no restrictions on the frequency of oscillation and the forward
speed of the ship, the three-dimensional unsteady forward motion problem ought to be
first solved by some mathematical order, as described by Chan (1989). In spite of the
accuracy offered when the translating pulsating source is implemented, the amount of
computational time and processing memory is substantially large. The program is
therefore also furnished with a correction formula on forward speeds (similar to that
explained in section 2.4.4.1) to be associated with the pulsating source only, so that
computational costs may be reduced.
The MARCHS program was initially developed to cater for the motion problems
of monohull ships. However, the versatility of the approach adapted makes it possible
to tackle the problems of twin-hull ships. Chan (1991) has reported this latest
modification on the MARCHS program. Some other features that can be analysed using
this program include the second-order drift force, added resistance and structural loads
on both mono- and twin-hull ships.
The program itself was written on the IBM/3090 main frame at the University of
Glasgow's Computer Centre. The input data required and output data produced by the
program is similar to that for SHIPM1.0. To generate the hull mesh of a certain
SWA TIl hull configuration, the STATION program written on the VAX Cluster is to
be incorporated. The resulting mesh data is then transferred to the mM to be formatted
by HULSURF routine for the computation using MARCHS. The characteristic hull
parameter of the designed vessel is to be generated by the HULDAT routine. The
output data which comprises the response amplitude of the six-degree of ship motion,
hull pressure distribution, wave forces, and so on, are transferred automatically to the
file storage.
To obtain the wave load values of SWATHs a separate program called the
WVLOAD is to be used. Pressure data generated by the motion program is above is
used in the execution of WVLOAD. For further details on running the program see
reference by Chan (1990b). The required CPU time to run the MARCHS program for a
single wave heading and considering the pulsating source only is around 20 hours for
the input data containing approximately 25 regular wave frequencies. The total CPU
time for running is also dependent on the number of panels of the hull facets. The
1
MARCHS program is used in the present study to generate theoretical predictions of
SWATIl motions and wave loads to be compared with experimental findings.
Chapter
2
-Hydrodynamic Fea tu re s o fSWATlls
44

7/26/2019 1992djatmikophd.pdf
http://slidepdf.com/reader/full/1992djatmikophdpdf 68/507
2.7. EXPERIMENTAL INVESTIGATION OF SWATH SHIP MOTIONS
The need for model testings to observe motion behaviour of a vessel is evident.
Particular reasons for this are, firstly, observation of ship motions by way of full scale
trials to obtain a realistic seakeeping information is extremely expensive. In addition,
such a full scale trial is exceptionally difficult for the experimenter to control, especially
sea states and directional wave spectrum that occur naturally during measurements.
Moreover, as scrutinised by Lloyd (1989) and Hutchison (1990), the results of full
scale tests on a given ship are not practically useful for predicting the behaviour of a
newly proposed design.
An analytical model to predict motion behaviour of a vessel is the most favoured
design tool since its deployment is not at all expensive on top of the design flexibility
that is offered. Nonetheless, development of a sophisticated analytical model requires a
vast amount of effort and time and substantially large budgets. The argument follows
that the level of accuracy which can be expected from a newly developed analytical
model remains apprehensive due to the incompetence of the assumptions imposed as
well as some restrictions, hence, uncertainties in the mathematical formulations.
Secondly, model tests will be a useful approach to provide data for the validation of
analytical models. The importance of analytical model validation is even more important
with novel concept, such as SWATH, where past experience is limited or non-existent,
is dealt with. Even then, in the presence of a reliable analytical model which sometimes
has been well calibrated by operational experiences, the need of model test data in
practical designs is imperative. Classification societies and ship owner surveyors
usually specify the requirement of model test data in contract designs.
In recognition of the above considerations, experimental programmes on SWATIl
vessels have been comprehensively planned worldwide since early in the 1970s. The
most notable effort was in the USA, e.g. by Kallio and Ricci (1976) and McPherson
and Voight (1983). Seakeeping experimental programmes in Japan, the worlds largest
SWA TIl operator to date, have been reported by Oshima et al (1979) and Mabuchi et al
(1985). In these papers they also clarified the necessity of performing model tests in
actual SWATH designs. Another example of a model test, as required in actual design
of the largest SWA TIl ever built Rad is so n D iamo n d (11740-tonne), is contained in
Marine Report (1990).
The motion experiment programme on SWATH models were started as early as
the development of analytical studies in the NA&OE Department. The earliest version
of the family of SW ATIl models procured at the Hydrodynamic Laboratory was a
three- hulled configuration, rather than twin-hulled, which has been subjected to
extensive investigations by Smith (1982,1983). The next generation of SWATH
Chapter 2 -
llydrodynamic
Fea tu r es o /SWATl ls
45

7/26/2019 1992djatmikophd.pdf
http://slidepdf.com/reader/full/1992djatmikophdpdf 69/507
models available in the Laboratory are tandem-strut type models SWATH-1 and
SWATH-2. The former is of circular hull configuration, which has been seakeeping
tested in various headings and forward speeds by Djatmiko (1987) and with the effects
of stabilising fins by Wu (1985). The SWA TIl-2 model has rectangular hulls and was
made available in particular for resistance observations by Chun (1988), besides some
seakeeping evaluations by Djatmiko (1987). Later the SWATH-1 model was converted
to become the SWATH-3 model, which is a single-strut type model. SW ATH-3,
together with the latest Fishing SWATH model (SWATH-FV), are studied in the
present research.
In the following sections several important points in experimental procedures and
test data analysis will be clarified. Some instrumentation used in the model test are
indicated. For a more detailed explanation of the seakeeping experiment on SWATH
models see Djatmiko (1987).
2.7.1. Measurement of SWATH Model Motions at Zero Speed
All the seakeeping tests described herein were carried out in the 76m x 4.6m x
2.5m towing tank at the Department's Hydrodynamics Laboratory. There is practically
no limitation to the wave heading that can be generated in the towing tank as far as the
motion test at zero speed is concerned. However, due to cost and time considerations a
programmed test would be restricted to wave headings which is counted to be most
important. Normally five wave headings, namely, head, bow quartering, beam, stern
quartering and following seas, are selected to represent the 180 degree range of wave
headings. The general instrumentation set up and running of the test is explained as
follows.
2.7.1.1. Measurement Devices. The model is first equipped in the workshop
with any necessary devices. Principal instruments for the measurement of model
motions could be either linear variable displacement transformers (LVDTs) or selspots,
or may be a combination of both, as is used in the present study. The use of LVDTs is
suitable for measuring the motions of the model in vertical modes (heave, roll, and
pitch) whereas, for the horizontal modes (surge, sway, and yaw), selspots are probably
more appropriate. Djatmiko (1987) observed that the SWATH model horizontal
motions are much restricted by the presence of string wires which connect between the
model and the LVDTs, therefore using selspots this problem could be overcome. The
positions of these instruments are as illustrated in the test arrangement sketch of Fig.
2.4.
Chapter 2 -L ly dro dynam ic F eatu re s o f SWAT l s
46

7/26/2019 1992djatmikophd.pdf
http://slidepdf.com/reader/full/1992djatmikophdpdf 70/507
As shown in Fig. 2.4, which is the general test set up in oblique waves, four
LVDTs were mounted on the model. A combination of these, i.e. summation and
substraction of the electronic signals generated, would give the heave, pitch and roll
amplitudes as appropriate. Two selspot systems, each comprising a camera detector and
one or more light emitting diodes (LEDs), were used for measuring horizontal motions.
A combination of signals from LED I and LED2 would provide amplitudes of sway and
yaw. Whereas LED3, which was associated with camera detector 2 (CID2), measured
the surge oscillations. As shown, the model is moored to the tank side to maintain its,
intended heading to the wave propagation. If the model is tested in head or beam seas
only two LVDTs are needed for measuring the vertical motions, that is, heave and pitch
or heave and roll, respectively. Horizontal mode in these cases is, respectively, surge
or sway, which may be measured by a single selspot system.
The wave elevations generated by the parabolic wavemaker at the top end of the
tank were measured by wave probes. A wave probe generates electronic signals based
on the submergence of the capacitor metal bar in the water. Three wave probes were
positioned on the bridge across the tank well away from the model upstream from the
wavemaker. The spreading of the wave probes was made, i.e. at B/2, B/3 and B/4
from the tank side wall where B is the tank width, so that any changing in the wave
patterns across the tank could easily be identified. Another wave probe was situated in
the vicinity of, and parallel to, the bowline of the model. This arrangement made it
possible to observe the phase difference between the wave excitation and the model
motion.
2.7.1.2. Amplifier and Data Acquisition Devices. The amplifier is used to
convert the signals from measuring instruments into codes readable by data acquisition
devices. In the amplifier signals from various sources each will be treated differently
according to the nature of the signals. For instance, the amplifier decodes the signals
sent by the LVDT so that they can be read by the recorder. The signals sent by the
strain gauges in the case of the wave load test, which are mostly very small and
therefore unreadable to the recorder, need to be amplified and decoded. Each of the
measuring instruments is connected to an allocated channel in the recorder devices as
illustrated in a diagrammatic arrangement in Fig. 2.5.
There were two types of recording (data acquisition) devices used during the test,
that is, a pen recorder and a computer terminal Macintosh ITICi which accommodates a
software package named LabView. Although a pen recorder is a reliable device its
capability is limited by the number of channels that can be connected to it. The use of a
computer is more flexible even when a relatively large number of electronic channels is
required. Moreover, the use of a computer is more convenient when a complicated data
Chapter
2
- Llydrodynamlc Featur es o /SWATJ ls
47

7/26/2019 1992djatmikophd.pdf
http://slidepdf.com/reader/full/1992djatmikophdpdf 71/507
analysis is to be carried out Computer data analysis is much less time consuming than
the analysis which should be done manually when data acquisition is performed using
pen recorders. The benefit of computer data analysis is most appreciated when tackling
the problem of hydrodynamic observations in random waves. The amplifier and data
acquisition devices are shown in the photographs of Fig. 2.6.
2.7.1.3. Running the Test. Before the first run of the day was commenced,
calibrations were conducted to eliminate any changes in signal levels caused mainly by
atmospheric state surrounding the devices, i.e. temperature, humidity, static current,
etc. The calibration factor generated is automatically stored in the computer to convert
the electronic signals from any measuring devices. This gives the resulting quantity of
the measured motion or wave elevations as the actual magnitude corresponding to the
appropriate units (ems or degrees).
In general, the model test was conducted in the wave frequency range from 0.3
up to 1.6 Hz with intervals of 0.05 Hz. In the vicinity of the heave, roll and pitch
natural frequencies the interval was decreased. This allows the motion behaviour of the
model to be well investigated in the critical frequency region. In order to anticipate the
range of wave frequencies needed to be run during the test it is necessary to observe the
natural frequencies of the model in the three purely oscillatory motions, i.e. heave, roll
and pitch. Djatmiko (1987) shows in detail the procedure of measuring these natural
frequencies on SWA111 models.
A recording of motions and wave patterns in each test was taken after the
established wave train had passed the model and when the model had drifted from its
original position to a new mean position about which it was oscillating steadily.
Besides the variation to the frequency, the amplitude of wave elevations were in some
cases also altered. Normally two different wave heights were generated during the test,
namely, 5 ems and 10 ems, but the former is more frequently used. By generating two
different wave heights for the same frequency it is then possible to observe the non-
linear effect on the motion that has been caused, if any.
2.7.2. Measurement of SWATH Model Motion with Forward Speeds
Because the restrictions of the towing tank dimensions only head and following
sea tests could be made on the model which underway with forward speeds. For this
type of experiment the model was located under the mobile main carriage, as shown in
Fig. 2.7. Two LVDTs for measuring heave and pitch oscillations of the model were
mounted on the gantry. These LVDTs were used to measure the rate of sinkage and
Chapter 2 -Hydrodynamu: F eatu re s o f SWAT lis
48

7/26/2019 1992djatmikophd.pdf
http://slidepdf.com/reader/full/1992djatmikophdpdf 72/507
static trim of the model, which is important in studying the model resistance
characteristics. The only connecting line used had two functions, first to drag the model
along the tank and second to connect the model with the dynamometer where the surge
oscillations and the resistance of the model were recorded. Four guide rods, two on
each side of the model, were installed to maintain the model in the right course, so that
there was no yaw, roll or sway.
Each of the models studied was tested at four speeds, Le. O.5rn/s, 1.0rn/s, 1.5rn/s
and 2.0mls which correspond, respectively, to the Froude numbers on average of 0.13,
0.26, 0.39 and 0.52. These characteristic speeds conducted in the experiment are
associated with a medium speed SWATH. The model was run in a given speed which
was controlled by an operator from the control desk at the mobile carriage. The data
acquisition was taken on a pen recorder, computer terminal, and the dynamometer.
Calibration procedure and other measurements are as orchestrated for the stationary
tests. Photographs of a SWATIl model underway in progressing waves are seen in
Figs. 2.8 and 2.9.
2.7.3. Test Data Analysis
Most of the test data analysis was carried out on the VAX Cluster computer
system therefore the recorded data needed to be transferred from the Macintosh IIICi to
the main frame by KERMIT software. A data analysis program was available for the
analysis in the VAX cluster. The program was generally used to process the digital data
to obtain, for instance, the average amplitudes of any mode of the model motion.
As mentioned earlier. most of the data has been converted in the amplifier to the
appropriate units for any mode of motion by sum and difference process, as well as by
taking into account the calibration factor. For example, the heaving motion at the centre
deck of the model is determined by the oscillation of the four LVDTs. Let Xl' x2' x3'
and x4 be the elevations, and Cl' c2' c3' and c4' the calibration factors of LVDTl,
LVDTI, LVDT3 and LVDT4, respectively. Thus the heaving amplitude is calculated in
the program in a loop as :
(c
X
+ c x +c
X
+
C X )
Heave elevation
= 1 1 2 2
3 3
4
4 (ems)
4
and so on for other modes of motion. Figure 2.10 shows the sum and difference unit in
the amplifier.
Chapter 2 -L lydrodynamlc Fea tu re s o SWATl ls
49
7/26/2019 1992djatmikophd.pdf
http://slidepdf.com/reader/full/1992djatmikophdpdf 73/507

7/26/2019 1992djatmikophd.pdf
http://slidepdf.com/reader/full/1992djatmikophdpdf 74/507
2.8. COMPARISON OF EXPERIMENTAL RESULTS AND
THEORETICAL PREDICTIONS
In this section correlation between experimental and theoretical predictions on
SWATH model motions is observed. As mentioned earlier, during the period of the
present study two SWATH models of single strut per hull configuration, namely,
SWATH-FV and SWATH-3, have been extensively tested. Nevertheless, for the sake
of completeness, experimental data for tandem strut SWATH model (SWATH-I)
provided by Djatmiko (1987) are also considered in validating the predictions from
MARCHS. The main particulars of these SWATH models are listed in Table 2.3, and
the underwater hull forms are presented in Figs. 2.12a,b and c.
2.8.1. Head Seas
Comparison of theoretical assessment and test data in stationary condition is
presented in Figs. 2.13 through 2.17. The motion characteristics of SWATH-FV in
head seas (180 deg), as shown in Fig. 2.13, can be described in the following manner.
The theoretical prediction agrees well with measured data for surge mode of motion in
the supercritical region (frequencies higher than the resonance), but underestimate the
response values at the resonance and subcritical frequencies. Chan (1990a) suggests
that this is due to the effect of water depth. Investigations on monohull ships operating
in restricted water depth indicate the same pattern of surge response as on SWATH
model, that is, the rise of the response curve to infinity at low frequency zone.
In the resonance frequency, in particular, the surge response is influenced
strongly by the pitch motion. As shown in the Figure pitch response is also smaller
than the measured one when the viscous effect is taken into account. Reducing the
viscous damping may lead to a better correlation for pitch, but not so with the surge.
The quality of measured data for the subcritical region of surge and pitch might not be
too convincing. However, much better correlation of surge and pitch responses for
other models (SWATH-l and SWATH-3) is evident, as presented in Appendix A,
together with the rest of the motion data.
The correlation of heave responses from the two sources is excellent. The
discrepancy of predictions based on the potential wave damping and with the inclusion
of viscous damping is apparent at the critical frequency. The former also demonstrates
clearly the coupling effects among the three modes of motion. This account is accepted
due to the fact that the small waterplane are the deeply submerged main hulls of
SWATHs contribute much smaller wave damping than those for conventional
monohulls. The viscous damping effects were taken into account for the present
prediction by a semi-empirical iterative method, as given by Thwaites (1960). As can

7/26/2019 1992djatmikophd.pdf
http://slidepdf.com/reader/full/1992djatmikophdpdf 75/507
be seen, the viscous damping is more dominant than the wave damping at the resonance
frequency vicinity. The viscous damping effects in subcritical, and similarly in the
supercritical regions, however, is not so significant.
2.8.2. Beam Seas
In beam seas (90 deg), as shown in Fig. 2.14, the theory predicts good heave
motions as in head seas. A satisfactory correlation is also found for the surge and roll
responses. The highly tuned roll response in the resonance frequency (00'=1.15) may
be reduced by introducing higher viscous damping. However, this leads to the penalty
of reducing the pitch response even further. The coupling effect of rolling on the sway
motion is also clearly indicated at the first resonance peak. The second peak of the sway
response at 00'=3.1-4.0 is considered by Zheng (1988) to bring about the presence of
standing waves in the hollow space between the SW ATIl struts. This phenomenon is
also observed for SWATIl-I and SWA TIl-3 models (see Appendix A).
2.8.3. Quartering Seas
Theoretical predictions and measured data for three SWATIl model motions in
bow-quartering seas (135 deg) are plotted in Figs. 2.15 to 2.17. Confirmation of the
results are fairly good in most cases. The correlation of surge responses is best for
SWA TIl-I (Fig. 2.17), even though the theoretical prediction does not show the high
tuned response at the resonance frequency (00'-1.25). The theoretically predicted sway
motion is most closely related for SWA 11-1-3(Fig. 2.16). The SW ATH-l measured
data for this mode is lower than the predicted. This may be due to the restrictive motion
induced by the mooring line since the model was tested by LVDT for measuring the
horizontal motions. The effect of viscous damping varies for different models
especially for pitch and roll motions, although the same damping coefficient was taken
for the three models. The heave motion predictions agree well with the measured data.
For all three models, as expected the yaw responses are dominantly influenced by the
sway. The trend is similar for different model configurations.
2.8.4. Head Seas with Forward Speeds
Examples of the correlation between theoretical predictions and measured data of
SWATH model motions in head seas with forward speeds are as plotted in Figs. 2.18
and 2.19 for SWATII-I, respectively, at the Froude numbers (Fn =V I{g[, where V
is model speed in mls and L is the model length) of 0.39 and 0.52. In both Figures the

7/26/2019 1992djatmikophd.pdf
http://slidepdf.com/reader/full/1992djatmikophdpdf 76/507
theoretical curves trace the measured data quite closely. The scatter of surge data in the
subcritical region may be attributed to inadequacy in controlling the test, which might
also be due to the model contouring the wave surface at low frequencies. The
dominance of heave coupling on other mode of motions is also apparent. The non-
linearity of the motions due to different wave heights (measured 1 and measured 2
correspond respectively to the wave heights of approximately 5 and 10 erns) is not
clearly indicated in those cases. The same phenomenon applies also to SWATH-l
model motions in stationary conditions. Other data in head seas with forward speeds
can be found in Appendix A, where correlations are mostly found to be satisfactory.
2.S.S. Following Seas with Forward Speeds
Only SWA TH-FV among those models has so far been tested in following seas.
The experimental results of the model tested at Fn of 0.13 up to 0.26 are presented,
together with the theoretical curves, in Figs. 2.20 to 2.23. In these Figures good
agreement is found for heave motion. On the pitch motion, discrepancies become larger
at lower frequencies, i.e. below <0of approximately 3.0 rad/sec, Lee and Curphey
(1977) observed a similar behaviour for a SWATH 6A model tested at the DTRC,
which was explained as being caused by the uncontrolled constant speed of the model
when running at low frequencies. With the increase of forward speeds (Fn=0.39 and
0.52) theoretical predictions on surge motions become uncertain. A new pattern of
heave and pitch motions at these speeds arises with magnified peak responses in certain
frequencies, Le. approximately at <0=6.5 rad/sec and 5.0 rad/sec for Fn=O.39 and
0.52, respectively. These incoming wave frequencies correspond to the encountering
frequencies approaching zero. Hong (1986) suggests that in such a frequency the
predicted hydrodynamic coefficients decrease substantially, hence the motions are
magnified. Overall, the scattering of experimental data presented herein shows a similar
tendency to those found in the papers by Hong (1986) and Fang (1988).
Considering the satisfactory correlation between the theory and experiment data of
SWATH motions in head and following seas, it might also be interesting to observe the
trend of forward speed motions at different wave headings. Bow quartering seas may
represent these other headings, as shown for SWA TH-FV in Fig. 2.24. As expected,
the peak responses shift from higher incident wave frequencies to the lower regimes
due to the encountering phenomenon. The peak values of heave and pitch response tend
to enlarge with the increase of the speeds. The heave coupling effects on pitch motion,
and hence on the surge, fortify in parallel to the speed increase. Thus, as shown, the
peak of pitch and surge responses occur at the resonance frequency of the heave
motion. Despite the strong influence of heave motion on the surge, a gradual decrease
in the response magnitude over most of the frequency range is evident. This account
similarly applies to the sway mode of motions. A rapid fall off in response magnitude is
7/26/2019 1992djatmikophd.pdf
http://slidepdf.com/reader/full/1992djatmikophdpdf 77/507
even more pronounced in the case of rolling. The attenuation of roll response in higher
speeds was also recognised by Lee and Curphey (1977), which was mainly due to the
increase in effectiveness of viscous damping. The attenuation of yaw responses at
lower frequencies (m=3.0 rad/sec or less) is eventually affected by the roll mode.
However, a new peak at m=5.0 rad/sec for Fn=0.52 which simultaneously appears on
surge and yaw response is noted. This cannot be explained and requires further
investigation.
In general, the theoretical predictions correspond very well with the measured
data as seen in the above comparisons. The discrepancies in following seas is simply
explained due to the limitation of the theory which is, as mentioned by Chan (1991),
based on the assumption of high frequency oscillation. This implies that predictions at
very low frequency (approaching zero), such as in following seas at high speeds,
would not be justified. Viscous damping plays an important role in generating the
correct response magnitude of heave, roll and pitch mode of motions for SWATH
ships. The evaluation presented here has basically validated the motion assessment tool
so developed.
Comparisons of experimental data for SWATH-t. SWATH-3 and SWATH-FV
with the earlier predictions generated using the program by Zheng (1988) can be found,
respectively, in papers by McGregor et al (1988), Chun et al (1990) and Djatmiko et al
(1990). Whereas comparisons of experimental data with the predictions by the two-
dimensional theory was presented by Atlar et al (1987).
2.9. SWATH PERFORMANCE IN SEAWAYS
Failure to maintain effectiveness in carrying out a mission of ships in adverse seas
is probably the main concern in seakeeping studies. Hoffman (1976) has earnestly
addressed the seakeeping impact on ship operations with main emphasis on the
associated economic merits. In that paper is cited the first level by which the ship
operational cost has been substantially increased due to the prevalent speed reductions,
hence operational delays, that were caused by severe weather. In the second level,
seakeeping quality affects the lifetime cost by virtue of additional requirements of
repairs on structural damages brought about by excessive environmental loads.
Moreover, safety of onboard items, such as cargo and equipment, as well as
passengers and personnel, should be accounted for as endangered by the degradation of
seakeeping effectiveness.
Because of this, one of the ultimate targets in seakeeping studies is. the ability of
the designer to predict the behaviour of ships when severe seas ought to be

7/26/2019 1992djatmikophd.pdf
http://slidepdf.com/reader/full/1992djatmikophdpdf 78/507
encountered. Further, the outcome of such evaluation is documented as part of the ship
operational guidances.
The seakeeping effectiveness of a vessel, or widely known as the seaworthiness,
may be measured by the rate of operability that can be attained when operation is made
in a prescribed sea environment. Systematic procedures of ship operability evaluations
have been introduced by many, e.g. McCreight (1987) and Graham (1990). The
common way to assess the ship operability is by integrating the motion responses, as
described in the previous sections, into a real sea system. This is followed by the
introduction of operational .constraints designated as the seakeeping criteria. In this
respect operability is acquired when the limit criteria is not violated by any individual
element involved in the characterisation of ship response to the seaway. On the other
hand, the conditions where anyone or more constraints set up within the criteria is
infringed would fall into the category of mission failure or down time.
The characterisation of ship responses to the real sea environment was first
introduced to the naval architect community by Pierson and St. Denis (1953). Order
statistics were used to describe the random nature of seaways. Accordingly, the ship
response to seaways should be represented in stochastic manners.
If
the randomness of
sea waves is defined by the sea energy spectral density function S(ro), then, adopting a
linear superposition relationship, the variance of ship motion of a particular mode is
obtained by :
_ [ I ~] 2
E
= J -= L S(ro)
dco
= mo
o
~w
(2.49)
where [ 1 ~ N ~ w ] 2 is the response amplitude operator (RAO). The variances for velocity
and acceleration of the
i
h
mode of motion can also be obtained by :
_ [ I~
] 2
Ev = J 00
2
_i
S(ro)
doi
= m
2
o
~w
(2.50)
and
(2.51)
Since the sea energy spectra density function of waves and ship motions are
assumed narrow banded, the distribution may then be described by a Rayleigh
probability density function. Under this assumption, the statistical averages of ship

7/26/2019 1992djatmikophd.pdf
http://slidepdf.com/reader/full/1992djatmikophdpdf 79/507
responses can be expressed in the form :
'Average' amplitude
=
C {(E)
a
(2.52)
Here
((E)
is referred to as the Root Mean Square (RMS) of a particular motion
amplitude and Ca is the constant of the average value; C
a
=1.25 gives the average;
C
a
=2.0 gives the one-third highest average or significant value; C
a
=2.55 gives the one-
tenth highest average.
Considering a ship in transit at speed
U
and at a heading angle
1 1
to the dominant
direction of the waves, then it will 'encounter' the waves at a frequency different from
that which it would meet if
it
were at rest The encounter frequency is then written as in
eq. (2.37). The energy of the wave remains the same whether it is expressed in terms
of e o or roe ' so that:
00
E [~2] = J S(ro) dro
=
J S (w ) dco
wee
o 0
(2.53)
where
S
c o _
S(ro)
( e) - I d c o I d c o I
e
(2.54)
Finally the wave encounter spectrum is rewritten as :
S( )
_ S(ro)
roe - 2Uw
11- --
cos
III
g
(2.55)
There are a number of mathematical formulations for sea spectra which have been
developed from the analysis of extensive wave data. The wave spectra most commonly
used include the deep water (fully aroused and fetch unlimited) and the fetch limited
spectra. The spectral forms developed by Bretschneider (1959) and Pierson and
Moskowitz (1964) are examples of deep water spectra. In coastal waters, where the
fetch may be limited. the JONSWAP (Joint North Sea Wave Project) spectrum
provided by Hasselman et al (1973) is recommended.
For the present study, seakeeping evaluation is made on SWA TIl ships operating
in the North Atlantic. The aforementioned spectral forms are basically amenable for the
present analysis. Nevertheless, there is now available sea spectra established
specifically for the North Atlantic region. The six-parameter wave spectra, as it is
known, was developed by Ochi and Huble (1976). The formulation was developed to

7/26/2019 1992djatmikophd.pdf
http://slidepdf.com/reader/full/1992djatmikophdpdf 80/507
cover the shape of spectra which varies considerably depending on the growth-decay
stage of storms and existence of swell. From a statistical analysis of the parameters, a
family of 11 members has been established for a given sea severity. Of these 11
spectra, one is the 'most probable spectrum' for a given significant wave height, and
the remaining 10 spectra are those expected to occur with 95 percent confidence. More
on the six-parameter spectra is presented in Chapter 3.
Ideally, seakeeping analysis should be performed by prescribing the intended ship
route within a particular sea environment. In addition, the expected operational speeds
ought to be defined. It will then be possible for the designer to assess the probability
level of speeds and wave headings in which the ship is to operate. In the present
evaluation combinations of four wave headings (head, bow-quartering, beam and
following seas) and five different speeds corresponding to the Froude number of 0.0,
0.13, 0.26, 0.39 and 0.52 are assumed to be equally likely to be encountered by the
ships. Three 2500-tonne SWATHs (main particulars as listed in Table 2.4) scaled up
from the models are investigated. The main objective is to compare the seaworthiness
of these SW ATHs operating in the same seaways with the long term wave probability
distribution, as shown in Table 2.5.
The seakeeping criteria for oceangoing ships are now widely available. The
developed criteria generally is based on the considerations of personnel workability
(safety), structural safety and specific functions, such as aircraft take off and landing.
The selected SWATH naval vessel criteria as proposed by Olson (1978) is adopted for
the three vessels operating in the North Atlantic, as given in Table 2.6. The criteria is
not appropriate for passenger vessels where the requirements of passenger comfort is
stringent, as discussed by Dallinga (1992).
Computations on the motion characteristics of the three SWATHs have been
performed for all combinations of wave headings and ship speeds. Any single response
value derived from the spectral analysis was compared with the appropriate criteria.
Matrices as shown in Tables 2.7a and 2.7b, corresponding with the general, and
general and helicopter criteria, respectively, were then composed. The numbers printed
in the first matrix of each table represent the criteria which was first exceeded by the
motion value. The second matrix lists maximum significant wave heights where
operations can be safely executed. The third matrix shows the level of probability
where operation can be properly performed. The probability of operation was weighted
by the probability of ship heading, operational speed, sea spectrum and occurrence of a
particular significant wave height as printed in the second matrix.
The operability of those SWATHs are found to be the summation of the
probability values as listed in the third matrix of Table 2.7a and 2.7b. The results of the

7/26/2019 1992djatmikophd.pdf
http://slidepdf.com/reader/full/1992djatmikophdpdf 81/507
operability analysis is given in Table 2.8. Regarding the same criteria imposed on those
vessels, SWATH-I seems to override the other two SWATHs in terms of their
operability rates (OR).
If
only the general criteria (1-4) is considered, the ORs of
SWATH-I, SWATH-3, and SWATH-FV are expected to be, respectively, 0.896,
0.843 and 0.817. Considering the general and helicopter criteria (1-7) the ORs are
mostly reduced by some 24 ....25% from the former to 0.671, 0.632, and 0.618,
respectively.
The down time of these vessels mostly occurs due to the limiting 3 degree single
amplitude average pitch motion (criteria 2) for the first case, and the limiting 2.55
metres double amplitude significant vertical displacement at the flight deck (criteria 6).
The OR is in general lower at Fn=O.Oand 0.52, but steadily better at Fn between 0.13
and 0.39. With respect to the wave headings, those vessels are mostly debased in
following or head seas, due to larger pitch motions associated with criteria 2. The
SWATHs perform very well, however, in beam seas even at the highest speed. The
down time distributions as the function of forward speeds for SWATH-FV are
presented in Figs. 2.25a-b. Generally those SWATHs could be expected to perform
well up to sea state 6.
Comparison of the seakeeping quality of those vessels with other SWATHs of
similar size would be interesting. Nevertheless, such information derived by a similar
criteria and wave data as adopted here is not yet available. Chilo and Santos (1983)
have investigated the operability of 2500-tonne SWATHs for operation in the North
Atlantic. Their finding is that OR of the SWATH could attain as high as 0.978 or
0.995. These figures seems to be very optimistic, which is, however, believed to be
due to the different wave data selected. Chilo and Sartori (1979) provide the wave data
for the North Atlantic, as shown in Table 2.9. Comparing this to the wave data used in
the present study (see Table 2.5), then it is clear that the difference of cumulative
probability of wave occurrence is quite large. For the wave height up to three metres
alone, Chilo and Sartori (1979) give the cumulative probability as high as 86%,
compared to 58% in Table 2.5. Any other differences could possibly be brought about
by the spectral forms which have been selected for the evaluation.
2.10. SWATH SHIP RESISTANCE
In this section resistance data of the SWATII-FV model collected in conjunction
with the motion tests in head seas with forward speeds is presented. The measurement
of SWATH model resistance was made by using a dynamometer available on the main
carriage (see Fig. 2.7). The total resistances were measured for a wide range of Froude
numbers both in calm water and in waves at a certain frequency corresponding to the

7/26/2019 1992djatmikophd.pdf
http://slidepdf.com/reader/full/1992djatmikophdpdf 82/507
7/26/2019 1992djatmikophd.pdf
http://slidepdf.com/reader/full/1992djatmikophdpdf 83/507
increase of wave height, and the interference effects between the struts combined with
some motion aspects of the model are those
that
need to be examined to develop the
understanding on negative added resistance.
2.11. DISCUSSION
Several important aspects of SWATH hydrodynamics have been thoroughly
addressed. Excellent seakeeping characteristics of SWATHs compared to monohull
vessels are obtained from the concept of deeply submerged hull and slender surface
piercing struts. As reflected in many proposed seakeeping criteria, vertical motions
(heave. roll and pitch) are of utmost importance in the hydrodynamic design of
seagoing vessels. Attention should therefore be prominently given to these modes of
motions if a better seakeeping performance is to be achieved.
In the early design stage. the first action needed to be taken regarding the motion
of SWATHs is to aptly determine correct natural frequencies for those vertical motions.
Lamb (1988) describes an approach to this problem by considering a typical SWATH
response curve, as shown in Fig. 2.29. Lets tuning factor be defined as the ratio of the
frequency of encountering waves to the SWATH's natural frequency. The largest
motion response would then be expected to occur when the value of the tuning factor
becomes unity. As the tuning factor decreases, the motion responses become smaller.
In this designated supercritical region the ship is expected to run at a platforming mode.
In the subcritical region where the tuning factor is larger than unity the ship movements
will be in phase with the oncoming waves (contouring behaviour), thus the heave
amplitude, for instance, will have a magnitude of relatively the same as the wave
amplitude. An attempt therefore has to be made to avoid the natural frequency of the
ship coinciding with the predominant modal frequency of the sea waves where the ship
is to be operated. The best design is envisaged if the ship could operate most of the time
in the supercritical region.
It is best to design the natural frequency of ships as low as possible so as not to
resonate with the wind generated waves. which is known largely to oscillate at
relatively high frequency. There are two possible ways to depress the heave natural
frequency
Olz
without changing the ship displacement, that is. referring to eq. (2.1). by
increasing the heave added mass A33 or by reducing the waterplane area. The former
may be accomplished by designing the hull sections so as the horizontal diameter of the
hull is larger than the vertical diameter. Options to this are elliptical hulls. or
alternatively, rectangular hulls. Another solution is by introducing canard and/or
stabilising fins. The governing factors where reducing waterplane area should be

7/26/2019 1992djatmikophd.pdf
http://slidepdf.com/reader/full/1992djatmikophdpdf 84/507
limited are the roll static stability requirements as well as the structural strength and
access to the lower hulls considerations.
The pitch natural frequency can be decreased by either increasing the longitudinal
mass inertia
I s s
or reducing longitudinal metacentric height GM
L
(see eq. 2.3). The
I s s
could be increased by distributing the ship mass near the fore or aft ends of the
SWATIl. As presented in Table 2.3, due to this mass distribution effect,
I s S
for the
tandem strut model SW ATIl-I is appropriately larger than the single strut SW ATII-3.
The increase of GM
L
contributes to reducing pitch motion because of the increased
restoring moment. In general a shorter strut and longer hull combination provides a
longer pitch period (lower pitch frequency) with the help of the decreased GM
L
. In the
same way as for heave, fins would provide a favourable effect in increasing pitch
period.
In general. a wider hull spacing results in a greater roll inertia 144 and hence
provide a lower roll natural frequency. A smaller GMT gives a lower natural frequency
(see eq. 2.2) but this is penalised by larger roll response owing to the reduced restoring
moment as shown in Table 2.2. MacGregor (1989) has compiled a number of
algorithms related to SWA TIl motions which would be useful in initial seakeeping
design.
SWATH ships with an improved seakeeping characteristic is obviously
favourable for high speed operations, especially when adverse sea is concerned. The
finding on negative added resistance is promising in view of the high speed aspects.
Nevertheless, the observation is merely based on model scale, which to some extent
must be proved by actual experience. A particular issue of most concern to SWATIl
designers is the tendency of such a vessel to suffer from larger static trim at high
speeds. The munk moment effect, as it is known, is inherent to SWATHs due to the
smallness of the waterplane area, hence lower hydrostatic restoring capability. The
problem is identical to that on a slender aircraft, as was discussed by Munk (1924). As
mentioned earlier, applying canard fins forward is one solution to this problem.
Another remedy for static trim is by designing the so called slashed bow, where the
fore part of the lower hull bottom is flattened. An example of such a design was
presented by Chun et al (1988).
A versatile tool for predicting the motions of SWATH type vessels is now
available in the NA&OE Department Some additional experimental data might need to
be collected to assure the validity; especially experiments in oblique waves with
forward speed. The theoretical prediction so developed can actually deal with other hull
configurations, that is elliptical and rectangular hulls. However, for the former,
experimental data is not yet available. Experimental data on rectangular hull SWATHs

7/26/2019 1992djatmikophd.pdf
http://slidepdf.com/reader/full/1992djatmikophdpdf 85/507
has been provided by Djatmiko (1987), but the existing hull mesh generator remains to
be enhanced.
Various parametric studies regarding SWATIl motions should be studied further
in future. Aspects of different hull configurations should be thoroughly investigated in
an attempt to generate a data base for design optimisation. The so called seakeeping
indices approach is generally used to study this particular aspect. Lloyd (1991) and
Sarioz et al (1992) have recently exemplified the seakeeping evaluation by such a
method. The main hindrance in accumulating too large a data base is the requirement of
storage memory needed in the computing process. The management of this data base,
and its acquisition in design, is probably best orchestrated by an expert system.
2.12. CONCLUSIONS
Extensive experimental data on SWATIl motions has been presented. The data
was derived from the seakeeping tests of three SW ATIl models conducted at the
Department's Hydrodynamics Laboratory. One model has a tandem strut per hull
configuration, while the other two are of single strut configuration. Some problems
associated with experimental arrangement, which in tum affect on the quality of the
measured data, are indicated. Alternative arrangement, with the use of different
measurement devices, to overcome such problems are described.
Efficiency in conducting seakeeping tests is the primary concern in both saving
the tank time and experiment cost. Well planned model tests should be capable of
simultaneously collecting the data for several type of measurements. This are now
possible with the availability of more sophisticated data acquisition system using
computers. Subsequently, test data analysis can be performed much more rapidly, and
accurately, than reading from record papers as was done in the past.
Comparison of experimental data with theoretical predictions from MARCHS
computer program was then performed. Test data measured at several important wave
headings, which includes head, beam, bow quartering and following seas, has been
collected. For the former three headings, at stationary conditions, the theory predicted
motion values excellently close to the measured data. This good correlation is also
found for model motion in head seas with forward speeds. In the following seas at low
speeds the theory gives a reasonably good agreement with experimental data, but
discrepancies, notably in surge and pitch, become apparent at higher speeds.
Nevertheless, such discrepancies are acceptable with regard to the limitation of the
theory which was built upo~ the assumption of s~rt p~od_~aves. Regardless these
slight discrepancies correlation between the two
+
is generally excellent. hence
\, II '.
Chapter 2 «Hydr odynam ic F eatu re s o f
sw
ATJI s ~ r 6 2

7/26/2019 1992djatmikophd.pdf
http://slidepdf.com/reader/full/1992djatmikophdpdf 86/507
validation is adequately achieved. The tool developed is reliable for a wider range
motion study which needs to be pursued in future.
A further seakeeping performance analysis was made on three 2500-tonne
SWATIls scaled up from the three models. The results of motion predictions were
integrated into a spectral analysis to assess the motion characteristics of the vessels
operating in the North Atlantic. A seakeeping criteria was incorporated to weigh the
operability rate of such vessels and rates between 82% and 89% are achievable by the
present design. Another SWATIl with about the same displacement designed elsewhere
shows a higher operability rate (some 98%) for operation in the same sea region.
Nonetheless, this higher operability rate is due to the different wave data, and might as
well the spectral formulation, that has been adopted. The rate of operability can be
substantially improved when the SWA TIls are appendaged with stabilising fins. This
particular aspect has been comprehensively investigated by Wu (1985).
In addition, SWATIl resistance data derived from the test on a Fishing SWATIl
model is also presented. Comparison with analytical prediction has been made. An
interesting observation especially is on the finding of negative added resistance that
arises when a certain frequency of wave is encountered. This finding confirms the
earlier observations made on the other models. However, further investigation is
required, preferably from actual experience, before the issue can be considered to be
conclusive.
Chapter
2
-Hydrodynam ic F eatu re s o f SWAT lis
63

7/26/2019 1992djatmikophd.pdf
http://slidepdf.com/reader/full/1992djatmikophdpdf 87/507
Table 2.1. Motion induced coefficients (potential)
Table 2.2. Hydrosatic restoring forces
C33
= pgAW
C35
=
C35
=
-pgMA W
C44
=
pgV(GMT)
C44
=
pgV(GML)

7/26/2019 1992djatmikophd.pdf
http://slidepdf.com/reader/full/1992djatmikophdpdf 88/507
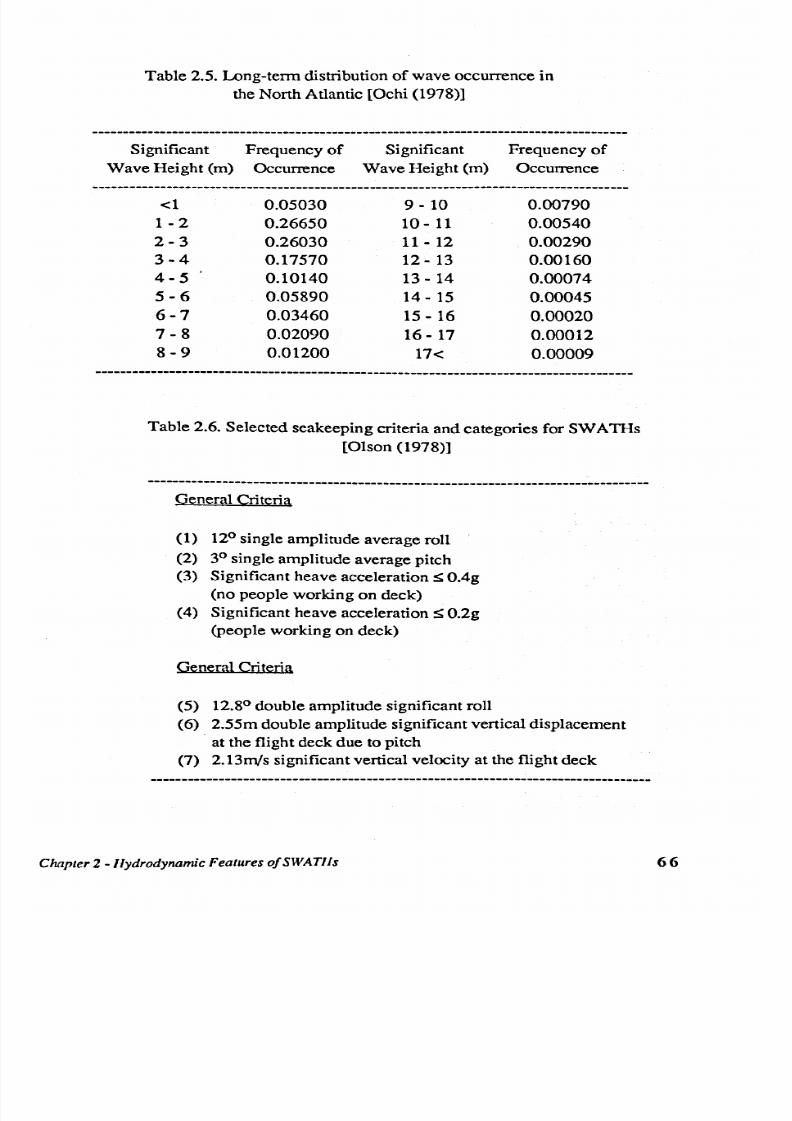
7/26/2019 1992djatmikophd.pdf
http://slidepdf.com/reader/full/1992djatmikophdpdf 89/507

7/26/2019 1992djatmikophd.pdf
http://slidepdf.com/reader/full/1992djatmikophdpdf 90/507
0 ~
3' 0
10 10
I'
10
10
:I:~
..0
-
~~
10 10 10 10 10
~~
0-
~
~~
10 10
10
10 10
~~
.n
.n
co
.5 ~
~ Cl)
10
10
M
10
M
0' 0
N
N
=0
&
If
~
< ' I
10
o\M
. . . .
< i t ' 1
0
0
000
~~
M M M M M
:I:~
. . . .
~
~.
M M M
I Vl
M
~< ' I
S-
~~
-
~ ~ ~ ~
~~
CO
.5 f ? :
~ Cl)
MM
M M M
0' 0
=0
&
If
8~
10 0\
N
N
< ' I
Vl
00000
O~
~
8
s
~
~
: 1' 0
~~
< ' I
C 'i
~
< ' I
< ' I
-
~~
~
88
~
~
Vl
..t ..t
< ' I
< ' I
< ' I < ' I
0-
~
~ ~
~
8
~ ~
~
I)'O
,::Q~
~
vi
~
< ' I < ' I
CO
.5 ~
8
~~
88
Cl)
0' 0
N
..t
N
0
MVl
&
If
8~
100\ M
< it ' 1
00
00
0
e
'-'
'0
t
8
s
s
8 8
' 0
:I:~
~
10 Vl
..t
~
. . . .
~
~
88
~
Vl
I()
..t
< ' I
Vl
00
~
S-
~~
8
~
888
~~
I()
00 00
0\ 0\
CO
.~ ~
~
8
~~ ~
' 0
=0
< ' I
..t
Vl Vl M
&
Cl
8~
10 0\
N
MM
Vl
IL o
00
000
Clmpler 2. /lydrodynamic Feature of SWAT lis
N
0
10
~
8
II )
-
~
Vl 00
-
Vl
-
- -
-
-
IC
00000
=
0 ~
0\
00
10
0\
0\
~
' 0
00
Vl
I' 00
00
~
. . . .
S
~
s
:I:~
0
-
-
0
00000
~ ~
0\ 10
10
0\ 0\
00
~~
00
I'
I'
00 00
. . . .
s
S S
N
s
10
~~
q
-
-
0
0
0
000
~
J
10
~
10 0\ 0\
I'
I' I'
00 00
Vl
M
; : i
S
s
s
I'
q
-
\
00
0
0
00
co
.5 ~
00 0\
1'10
00
~
Cl)
Vl 00 MI' Vl
0' 0
-M
C S
-
0
0
-0
000000
&
II
tf
~q
10
0\
~9
it '
00 00
o~
-
s
Vl
g
~
N
~
0\
I'
00 r-IO
-
-
- -
-
00
00
0
00
=
' O t
0\
I'
~
10
0\
I'
00
~
r-
OO
~
~~
~
$
s
-
. . .
00
000
0
~
;; t
I' 10 10
-
~
r--
I'
M
; : i
C
$
S
. . . .
I
Vl
N
~M
0
0
00
00
S-
~~
I'
~
;;t
~
0
~~ ~
~~
0
0000
0
CO
.5 ~
0\
10
~ ~
0\ 00
~~
~
I' 000
M
~~
=0
0000
00
&
8~
II
~
10 0\
~g
it '
00
00
o~
67

7/26/2019 1992djatmikophd.pdf
http://slidepdf.com/reader/full/1992djatmikophdpdf 91/507

7/26/2019 1992djatmikophd.pdf
http://slidepdf.com/reader/full/1992djatmikophdpdf 92/507
f
Forces due to
viscousity, FV
FLUID FORCES (or MOMENTS)
I
First order oscillatory
forces
I
Second order steady
forces
t
Forces due to
fluid pressure
I
.r;
force, Fe
l
Hydrodynamic
f o r
t
Wave-induced force
(Wave-exciting force, FW)
+
Body motion-induced force
(Radiation force, F
R
)
I
Incident Wave force
(Froude-Krylov force, FI)
Velocity force
(Damping force, P
BR
)
I
Diffracted wave force
PD
Inertial force
due to
added mass, FA
Viscous force due to
wave-induced fluid
motion,FVW
u e
to
d u e
to
potential damping, FB
viscous damping, FVB
t
Viscous force due to
body motion-induced fluid motion
Figure 2.2. Fluid forces and m om ents diagram [A tlar et al (1987)]
z
•
..
~
. . . . .
z
F ig ure 2 .3 . Co-o rd in ate sy stem
Chapter 2 -Tlydrodynamic Feature of SWATIIs
69

7/26/2019 1992djatmikophd.pdf
http://slidepdf.com/reader/full/1992djatmikophdpdf 93/507

7/26/2019 1992djatmikophd.pdf
http://slidepdf.com/reader/full/1992djatmikophdpdf 94/507
r----....._-i
~
LVDT3
I
Lvon I
I
t-.'--
~I
LVDT4
I
... - - - - - - - - - - - - - - - - - - - - - - - - - - - - - - - - - - . - .
,::~ •• I arOl arG2J ::)
. . . - - - - , . . . . - - - - - - - - - - - - . . . - - - - - - - - - - - I : r . - _ . ._ -
r - - T · : . r = = = ~ = = ~ = = = = l I - ~ .
:: r-i LEDIX I : :
r---f : W ~
r-J
LEDIY
I '
~G I
,..-I' 1 ' \. .1 ~ LEDlX I .,
I • • ,
: : LED2yJ ::
• • • •
. . . . - •• - . . ~ - '. - . - • - - - ; ( ~ ;~ I - - - - - - - '- . . '- - - - - - - -~
~-- ~:nG4
I
LED3Y arOl
L . . . . . )
I ' \ . . I p - - : -I -; : -I - - - - - - - - - - - - - - l - ·
..__
. . .
I
LVDTI
I
I
WP3
I
PEN RECORDER'
(8Channels)
r l - - - - - -~
PEN RECORDER 2
(5 OIanncls)
ANALOGUE TO
DIGITAL CONVERTER
I V A X Hmo
I
.... 00 ~ 0
- - - N
AMPLIF IER 1
I
AMPLIFIER
:I
l
AMPLIFIER 3
I
I L ~ _ _ ....Ir , l . . , )
l_ L___ j
Chapter2. /lydrodynamic Feature ofSWA1Us
I
P EN R EC OR DE R 3
I
(6 Channels)
Figure 2.5. D iagrammatic arrangem ent of instrum ent connections for
SW A TIl m odel m otion and w ave load tests
71

7/26/2019 1992djatmikophd.pdf
http://slidepdf.com/reader/full/1992djatmikophdpdf 95/507

7/26/2019 1992djatmikophd.pdf
http://slidepdf.com/reader/full/1992djatmikophdpdf 96/507

7/26/2019 1992djatmikophd.pdf
http://slidepdf.com/reader/full/1992djatmikophdpdf 97/507

7/26/2019 1992djatmikophd.pdf
http://slidepdf.com/reader/full/1992djatmikophdpdf 98/507

7/26/2019 1992djatmikophd.pdf
http://slidepdf.com/reader/full/1992djatmikophdpdf 99/507

7/26/2019 1992djatmikophd.pdf
http://slidepdf.com/reader/full/1992djatmikophdpdf 100/507

7/26/2019 1992djatmikophd.pdf
http://slidepdf.com/reader/full/1992djatmikophdpdf 101/507

7/26/2019 1992djatmikophd.pdf
http://slidepdf.com/reader/full/1992djatmikophdpdf 102/507

7/26/2019 1992djatmikophd.pdf
http://slidepdf.com/reader/full/1992djatmikophdpdf 103/507

7/26/2019 1992djatmikophd.pdf
http://slidepdf.com/reader/full/1992djatmikophdpdf 104/507

7/26/2019 1992djatmikophd.pdf
http://slidepdf.com/reader/full/1992djatmikophdpdf 105/507
0
0
0
0
~
r
~
1 9
l a
~
~6
~~
•
i ~~
:t~
•
i ~1f
•
~;; e : .
• t
•
~ ~ '- 6 -
•
~ 1 ~ ·
•
C D ~ ~
i i i ~
e~
•
]~
r
~ : x : . 5
~ 1 : x : · 5
... ~f-o~
... ~f-o~
~
<0
<. g
J ~
~~;s
•
~~;s
l)
•
~.S
~
eo.S
•
~
•
N
~
•
N
~
l E
III
• t
-
It
Cf')
-
. . . . . .
0
\0
o::i
d
0
0
N
0
II'
0
II)
0
II'
Cl
II)
0
II'
Cl
II)
d
•
CO)
c .;
N N
-
-
ci
ci
II
N
ci
ci
~
II
QSuod~ll'P1 d 'U lJP-U ON
Q Su od s;lll'P 1 d 'U lJ p-UON
~
l)
~
Cl)
0
~
Cl)
0
0
b .O
0 Cl)
0
0
c ::
. . .
b .O
i
. . . . .
l
c ::
t J
~
. . . . .
:1
~
jg
0
~
0
I~
~
~
. . . .
: : =
I~
~
8.....
- -
- -
1)
01)
~
1\0
. . .
~
c ::
... ( 'o j
i~ t
. . . . .
• i
U
?
c : :
• t
Cl)
• t
~I . . . . .
c ::
o
I) c : :
Cl)
o u '
0
ui ......x : e : .
c ::
i ......J :: _ .
pi
0 g
r~
0
_
8 ~
. . . .
e III e
~
eo
se o
• ~.~ '0
~ j:'s
..,~
-
0
~<~
'8
<. 9
'8
.2 e
•
~~:a
s
l)
~.S
eo.s >
0
N
~ ~
N
. 5
>
. c : :
~
i E ~
. l
I
'
~
~
Cl
~ ~
~
~
~
~
g~
~
II)
~ ~ ~ ~
gO
~
C 'f
- -
0 0
0
ci
0 0 0
ci
Cl)
osuods ;l ll ~A1I; IH 'W P-UON
llSUods; ll l ; lA1I ;IH'WJP-UON
Cl)
d
.
N
-
N
~
e
0
N
0
0
0
:l
9
l
bJ)
i
I....
:
III
b .O
~
•
u
u :
J ~
~
l a
~
l - - -
1)
01)
e~
:t~
~~
'i
ud
'iud
• t
~
;~
• t
Io ~
:3 ,
C D ........ Cl) ._,
c o . . .. .. ..Cl) ._,
r~
f f i
...
8 ,
o
eo Seo
. : X : ' i
~ i5 .
5
... ~0
..,~
~~=
~<~
.2
~.a
~
~.s
0
~.s
•
N
: m
N
: m
. l
. l
'
'
~
~
II'
0
0
0
~
0
II'
Cl
d
0°
ci
c .;
N
-
ci
~l l
~lbns
U l J P o U O N
QSuods~'lf
~'Jns
'UIJP-UON

7/26/2019 1992djatmikophd.pdf
http://slidepdf.com/reader/full/1992djatmikophdpdf 106/507
C
C
0
0
r
r
~
rl
~
'
l
1 5
: g
j~
C
i a
~c;-
C D
~ N
:2 ~
6lV'l
....... f' l
i~1t
• t
~~
• t
]'~ If
~t~~
~ J ~ i
G r =
~u
e~
~:,
C ~,s
C
~,5
-.t ~
' I t ~ ~
~ <
0
< . 9
~~~
~~;§
•
0
~,s
•
0
~,s
N
~
N
I:
; . e
l E
, l
-.
-.
~
N
0\
II )
0
C l
C
d
8
It)
0
I/)
~
I/)
: i i ;
It)
8::i
d
C l
C l
C l
~
C l
00
II
~ Ii C '
d
C '
II
It)
'I t
CO)
0
c:
N
-
-
-
0 0
0
b
osuod~lI1p1 d 'W P-UO N
~
o su od s:llI q :lt d 'W P -U ON
Cl)
fIl
(1$
(1$
0
0
fIl
0
fIl
0
b .O
0
01)
0
c :
. . . . . .
l
-
c:
i
~
r J
.~
~
'
0
0
i N
. . . . . .
1 5
: g
1 i
. . . . . .
C
. . . . . .
C
.B
& . . . . .
. . . . .
11 0
~
C D
c:
, , ~
~ O \
~V'l
. _
• i
:;f' l
c:
i~1t
Cl)
• t
>0
. . . . . .
• t
c :
o~ '~
Cl)
o lB & : ;
0
c D . . . . . ~ : : .
c:
c D . . . . . . .
:I:.._,
. _
0
. . . .
J - ~
. . . . . .
r l ~
0
. . . .
a
~~
0
o SOlI
e
oleoo
. . . . . .
0
• : r : ,5
. . . . . .
• ~,5
]
~ ( ~
]
~ < ~
~~:::I
~~:::I
.a
.s
~
~,s
~
0
~,5
<'I
~
N
~
I
l E
, l
f 5
~
~
0
0
~
~ ~
a ~ ~
~
8::i
C l
~
0
Ii
Cl
Ii
0
0
CO)
N
0
0
-
0 0
0
0
Cl:)
osuods :l lI : lA l r: IH 'WJP-UON
Cl:)
O ftJ od ~J :lA ~H '1 D p -U ON
M
N
N
N
N
C
N
0
~
0
. . . .
0
ci
: : s
i
bl)
~
b .O
'
ir:
ir:
~
a
1 ~
D
& . . . . . .
0
c D
& . . . . . .
r J O \
r J N
. . . . . . . . . .
:2~
o
4
~ c g
. . . . . .
. .
)
•
~ ~~
O] 3C
.g _ _ e n : :: .
c D . . . . . e n : :: .
r =
r =
8~
'8~
o SolI
•
o SOlI
• ~'i
' i = ,5
<
0
' I t ~
~~=
•
~ < ~
•
.g
~.g
•
C l
~,5
0
~,5
•
N
~
N
~
l E
lE
0
Cl::i
0
Cl Cl Cl
C l
Cl C l
0
Cl
C l
Cl
0
0
It)
' I t
CO)
N
0
c D:;
C D
' I t
N
0
:ll uo dt: lll :l 1.I ns 'w lP -UON
o su od s:llI a llJ ns 'w lP oU 0N

7/26/2019 1992djatmikophd.pdf
http://slidepdf.com/reader/full/1992djatmikophdpdf 107/507
~ - - - - - - - -
:~-.:-.-
4...... - ...
- -
. . . . .
· t
'I
8~r4
OO~
• • •
If If If
o
~_' ~~~~~~~~~8°
a ~ ~ ~
o
0 0
d
osuod~lI
' < 8 1 A S
'I lI P·UON
~
..
~~~~~~~~~~~
~ ~ ~ 8°
o
0 0 d
o su od s:llI :llb nS 'W lp ·u ON
l
'
~
I
I
. - _ . . ._
..
4 . . _ . . . . . . . . . . ~
. . . .~ - - - . - -
'
.
. . .
. . .
. . . .
o
,.............,,.......-.,..,..,.........,,...,..........10
t
t

7/26/2019 1992djatmikophd.pdf
http://slidepdf.com/reader/full/1992djatmikophdpdf 108/507
100
~I
I \,
(a) Criteria 1-4
- - - 1 3
5
. . . . . . .
~
'-
4)
~
50
i
.
.
8
All Headings •••••••••
~.
5
' . : . . . . . . . . .
. . .
.f'.
~
. .
0
0
5 10 15
20
25
Ship Speeds (knots)
100
(b) Criteria 1·7
~I
~3
5
~
'-
4)
~
50
~
.'
25
. . . . . . . .,.
- , . . . . . . . . . .
, . . . . . . . .
0
0
5
10
15 20 25
Ship Speeds (knots)
Figure 2.25. Distribution of the down time for SWA TII-FV
operating in the North-Atlantic
13.0
~.
2.0
e,
~
c =
. g 1 .0
t------
~
Subcritical
(Contouring)
0.0 L . . . . . . .. . . ._ _ . L . . . . . & . . . . .L - . ._ _ . ._ . . _ . .- . 1 . .. . . . . . . . . . .-=::&:::I:::;:::~::.i:::I
0.0 0.5 1.0 1.5 2.0
(Oe I (On
Figure 2.29. Typical variations of SWATII vertical motion responses
(heave, roll, pitch) vs tuning factor [Lamb (1988)]

7/26/2019 1992djatmikophd.pdf
http://slidepdf.com/reader/full/1992djatmikophdpdf 109/507

7/26/2019 1992djatmikophd.pdf
http://slidepdf.com/reader/full/1992djatmikophdpdf 110/507
CHAPTER3
PREDICTION OF WAVE LOADS ON
SWATH SHIPS

7/26/2019 1992djatmikophd.pdf
http://slidepdf.com/reader/full/1992djatmikophdpdf 111/507
CHAPTER3
PREDICTION OF WAVE LOADS ON SWATH SHIPS
3.1. INTRODUCTION
A rigorous investigation by Burke (1981) indicates the many possible causes that
has led to serious damage on ship structures. Ranked at the top of the most frequent
causes of structural damage was contact with other structures and collisions between
vessels in operation. Damage due to extreme waves or heavy weather ranked fifth. An
interesting cause of damage as recorded, however, is the design fault. It was reported
that, even though design fault did not rank at the top, it has the largest average repair
cost index compared to the others. Accordingly, the repair time consumed due to design
faults is found to be the longest of all. One may therefore suspect that crucial structural
damage due to design faults and extreme sea loads is interrelated.
The nature of design fault cannot be easily characterised, but some are due to
applying new, insufficiently tested technology, some due to compromises made with
construction methods, and some may be identified purely due to errors. It is therefore
quite fair at this point to mention that the designer should first of all be concerned with
the basic source of such problems, namely, the appropriateness in determining the
design loads. The above quotations are appropriate to new concepts such as SWATH,
which is dealt with here.
Like many other floating structures, it is obvious that wave is the main contributor
to the external load acting on SWATHs. Hence, this primary load might solely
represent the maximum load to be considered in the structural design of SWA 111 ships.
Because of this, hydrodynamicists have been studying this subject for long time, and
various methods to approach the prediction have been developed.
Various investigations on physical model and full scale SWATH ships, as
reported by Meyerhoff et al (1988), show that the most critical wave loads were
experienced when the ship is operating in beam seas with zero speed. This critical
structural load is found in the form of vertical bending moment at the mid point of cross
structure. The main contributor on such a load is the side force excited by the beamwise
wave actions. This type of wave load is worse on SWATHs compared with
catamarans, as the former usually requires greater box clearance to avoid slamming
impact on the bottom of the deck. As suggested by Lee and Curphey (1977) and
Chapter 3 -Prediction o/Wave Loads on SWATII Ships
87

7/26/2019 1992djatmikophd.pdf
http://slidepdf.com/reader/full/1992djatmikophdpdf 112/507

7/26/2019 1992djatmikophd.pdf
http://slidepdf.com/reader/full/1992djatmikophdpdf 113/507

7/26/2019 1992djatmikophd.pdf
http://slidepdf.com/reader/full/1992djatmikophdpdf 114/507
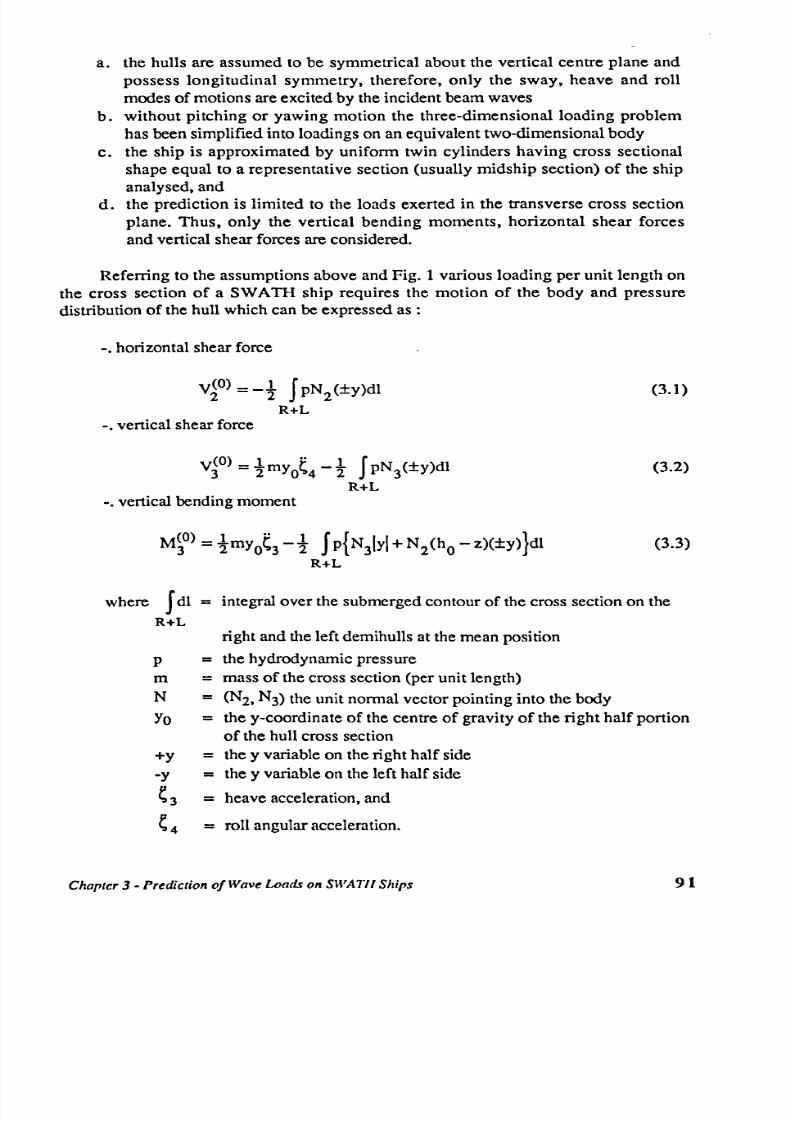
7/26/2019 1992djatmikophd.pdf
http://slidepdf.com/reader/full/1992djatmikophdpdf 115/507
a. the hulls are assumed to be symmetrical about the vertical centre plane and
possess longitudinal symmetry, therefore, only the sway, heave and roll
modes of motions are excited by the incident beam waves
b. without pitching or yawing motion the three-dimensional loading problem
has been simplified into loadings on an equivalent two-dimensional body
c. the ship is approximated by uniform twin cylinders having cross sectional
shape equal to a representative section (usually midship section) of the ship
analysed, and
d. the prediction is limited to the loads exerted in the transverse cross section
plane. Thus, only the vertical bending moments, horizontal shear forces
and vertical shear forces are considered.
Referring to the assumptions above and Fig. 1 various loading per unit length on
the cross section of a SWATH ship requires the motion of the body and pressure
distribution of the hull which can be expressed as :
-. horizontal shear force
v i a ) = -t J pN
2
(±y)dl
R+L
(3.1)
-. vertical shear force
v~o)
=
mYO~4 -t J pN
3
(±y)dl
R+L
( 3 . 2 )
-. vertical bending moment
M~O) =
tmyoe3 -t J P{N
3
Iyl+N
2
(h
o
-z)(±y)}dl
R+L
(3.3)
where
J
dl =
integral over the submerged contour of the cross section on the
R+L
right and the left demihulls at the mean position
p
=
the hydrodynamic pressure
m
=
mass of the cross section (per unit length)
N
=
(N
2
, N
3
) the unit normal vector pointing into the body
Y o
=
the y-coordinate of the centre of gravity of the right half portion
of the hull cross section
+y
=
the y variable on the right half side
-y
=
the y variable on the left half side
~3
=
heave acceleration, and
~4
=
roll angular acceleration.
Chapter 3 - Prediction of Wave Loads on SWATIl Ships
91

7/26/2019 1992djatmikophd.pdf
http://slidepdf.com/reader/full/1992djatmikophdpdf 116/507

7/26/2019 1992djatmikophd.pdf
http://slidepdf.com/reader/full/1992djatmikophdpdf 117/507

7/26/2019 1992djatmikophd.pdf
http://slidepdf.com/reader/full/1992djatmikophdpdf 118/507
3.2.5. Brunel University
Research into wave loads on SWATH type vessels at BruneI University has
adopted an almost completely different approach to those discussed in the foregoing
sections. At Brunel the theoretical approach based on a general linear hydroelasticity
theory has been used to analyse the structural response (ie. displacement, distortions,
bending moments, shearing forces, torsional moments and stresses) of an idealised
flexible SWATH travelling in regular waves [Price et al (1985), Bishop et al (1986),
Price et al (1987), Keane et al (1988)].
The hydroelasticity theory, as described by Clayton and Bishop (1982), proposes
that a marine vehicle seldom performs an absolutely steady motion since some other
parasitic motions, such as structural distortion, will certainly occur following the
external (wave) excitation. From this idea, in analysing a flexible SWA TIl it therefore
requires the detailed information of the mass, damping and stiffness properties of the
structure in the dry or in vacuo mode. So that the dry structural properties can be
generated rapidly, especially when a three dimensional structure is to be analysed, it is
preferable during the process to use a suitable finite element model. For this particular
requirement an FEM package called PAFEC 75 is utilised by Price et al (1985) at
BruneI. Having defined the SWATH dry structural properties, the dynamic
characteristics of the structure in the absence of external forces can be determined.
For further analysis, i.e with respect to the assessment of SW ATIl structural
responses under wave excitation, the above in vacuo properties are included in the
calculation of steady motion. This process is called the wet analysis. For this purpose
the generalised fluid loads experienced by the SWATH in waves are evaluated by
adopting a three-dimensional singularity distribution panel method which considers the
influence of forward speed. Later the analytical prediction was extensively improved by
Price and Wu (1987) to account for the non-linear fluid forces effect. and extended to
assess the response behaviour in time domain.
The analytical method developed at BruneI University is one of the most
sophisticated and could be expected to produce fairly accurate wave load predictions.
Price and Wu (1987) consider the only hindrance to using the hydroelasticity theory for
SWATIl structural response analysis is because considerable computational effort is
needed in development of the program. Moreover, a skilful operator is required for data
preparation and even to run the program
Chapter 3·P rediction o f W ave Lo ads o n SW ATII Ships
94

7/26/2019 1992djatmikophd.pdf
http://slidepdf.com/reader/full/1992djatmikophdpdf 119/507

7/26/2019 1992djatmikophd.pdf
http://slidepdf.com/reader/full/1992djatmikophdpdf 120/507

7/26/2019 1992djatmikophd.pdf
http://slidepdf.com/reader/full/1992djatmikophdpdf 121/507

7/26/2019 1992djatmikophd.pdf
http://slidepdf.com/reader/full/1992djatmikophdpdf 122/507
7/26/2019 1992djatmikophd.pdf
http://slidepdf.com/reader/full/1992djatmikophdpdf 123/507

7/26/2019 1992djatmikophd.pdf
http://slidepdf.com/reader/full/1992djatmikophdpdf 124/507

7/26/2019 1992djatmikophd.pdf
http://slidepdf.com/reader/full/1992djatmikophdpdf 125/507
believed to be more reliable in measuring the correct vertical force signals. Due to the
fact that vertical force signals were substantially low, a proper amplifier was also used
to provide a more readable record.
The loading test on each model was carried out in regular waves at frequencies
ranging from 0.3 Hz up to 1.6 Hz. As suggested by Lee and Curphey (1977), the
maximum transverse bending and side load responses on SWATHs are expected to
occur at wave frequencies which correspond to wave-length/centre hull separation ratio
(AlBa) around 3.0 and 4.0. But it very much depends on the configuration of the
model. Some SWATH models may experience peak bending at lower values of AlBa.
Several additional tests were made at around the peak frequencies to generate a
smoother data. The peak value of vertical force commonly occurs at around the roll
resonant frequency, thus a smaller frequency increment was carried out The calibration
procedures and test data analysis are similar to that for motion tests, as explained in
Chapter 2.
The presentations of structural loadings on SWATH are in the form of non-
dimensional loads (forces or moments) against wave-length/characteristic beam ratio, as
above. The axial forces are non-dimensionalised as :
V. L
V.'=_~I-
I g ~ ~
w
(3.22)
and the moment responses as :
where
V·
I
i
~
j
L
~
g
M.
M.'= J
J
g~~
w
(3.23)
= force responses at i
th
mode
(N)
= 1, 2, 3 for, respectively, longitudinal shear, side force and
vertical shear
= moment responses at
jth
mode (Nm)
=
4, 5, 6 for prying, pitch torsional, and yaw splitting moments,
respectively
= characteristic length of the model (m)
= displacement of the model (kgs), and
= acceleration due to gravity.(= 9.81 rn/s
2
).
From the wave frequency generated in the experiment, the wave-length in metres can be
calculated as follows :
Chapter 3 -P redictio n o f W ave L oads o n SW AT II Ships
101

7/26/2019 1992djatmikophd.pdf
http://slidepdf.com/reader/full/1992djatmikophdpdf 126/507

7/26/2019 1992djatmikophd.pdf
http://slidepdf.com/reader/full/1992djatmikophdpdf 127/507

7/26/2019 1992djatmikophd.pdf
http://slidepdf.com/reader/full/1992djatmikophdpdf 128/507

7/26/2019 1992djatmikophd.pdf
http://slidepdf.com/reader/full/1992djatmikophdpdf 129/507

7/26/2019 1992djatmikophd.pdf
http://slidepdf.com/reader/full/1992djatmikophdpdf 130/507

7/26/2019 1992djatmikophd.pdf
http://slidepdf.com/reader/full/1992djatmikophdpdf 131/507

7/26/2019 1992djatmikophd.pdf
http://slidepdf.com/reader/full/1992djatmikophdpdf 132/507

7/26/2019 1992djatmikophd.pdf
http://slidepdf.com/reader/full/1992djatmikophdpdf 133/507

7/26/2019 1992djatmikophd.pdf
http://slidepdf.com/reader/full/1992djatmikophdpdf 134/507

7/26/2019 1992djatmikophd.pdf
http://slidepdf.com/reader/full/1992djatmikophdpdf 135/507
described as the family spectra. The values of the six parameters for the family
consisting of 11 members are presented as functions of significant wave height Hs and
are given in Table 3.2.
A computer program (SIXP AR) was written to of compute the sea spectra as well
as other calculations to generate lifetime load described within this section. Figure 3.17
shows a sample plot of the family spectra resulting from the program for significant
wave height Hs=3.0 metres. The solid line curve indicates the most probable spectrum
and the others are those with
95%
confidence. From any single spectrum curve can be
clearly traced the two distinct peaks at lower and higher frequency zones as expected
which represent the effect of swell and locally generated wave.
The next step of the procedure in determining the lifetime load of a vessel is to
generate the response spectra. As shown in Fig. 3.14, the response spectra is calculated
by multiplying the load RAO (eg. square of the response values in Fig. 3.15) and the
wave spectra. Since there are 17 increments of significant wave heights (see Table 2.5)
to be evaluated, 187 response spectra corresponding to a single set of heading angle
and forward speed will be generated. A sample plot of the response spectra correlating
with a significant wave height Hs=3.0 metres is presented in Fig. 3.18. These figures
explain even better the effect of different sea spectra on the resulting responses. From
Fig. 3.17 it can be seen that the leftmost curve is one of the spectra with largest peaks.
However, the corresponding response spectrum (in Fig. 3.18) shows a lower curve
(containing less energy).
Hence, it can be said that the wave is expected to amplify the response when the
two peaks of wave spectrum and RAO closely coincide in a given encounter frequency.
Therefore, thorough experience in selecting the most suitable spectral formulation for
such a case is absolutely necessary. Otherwise arbitrary selection of spectral might lead
to an over-estimation of the wave load predicted which in turn could lead to a high
redundancy of the structure. On the other hand under-estimating the maximum load will
increase the risk of the structure inherent to the increase in high probability of failure.
3.5.1.4.
Lifetime Load
Distribution.
Having obtained the response spectra of
any operational mode embodied in the analysis, a further stage to determine the number
of load cycles experienced by the ship can then be performed. The following equation
defines the average number of responses per unit time (n) using the information given
from the response spectrum:
(3.31)
Chapter 3 -Prediction o Wove Loads on SWATII Ships
111

7/26/2019 1992djatmikophd.pdf
http://slidepdf.com/reader/full/1992djatmikophdpdf 136/507

7/26/2019 1992djatmikophd.pdf
http://slidepdf.com/reader/full/1992djatmikophdpdf 137/507
The load histogram which correlates to any particular response spectrum is
obtained by applying the actual number of response cycles for this operational mode
onto the corresponding probability distribution function. In tum, the lifetime load
histogram is obtained by adding up all the components of load histogram from each
sub-block in the operational mode.
3.5.2. Description of the Result on Long-Term Analysis
Figure 3.20a presents the lifetime load histogram for a 20 year SWATIl operation
in the North Atlantic resulting from the present analysis. Since the number of cyclic
responses for higher load magnitude is not readable another histogram with a
logarithmic y-axis is then provided, as shown in Fig. 3.20b. The histogram is divided
in the bin interval of 10 MNm. From the computation the total number of cycles to be
experienced by the vessel in its lifetime will be in excess of 8.0 x 10
7
•
Munse et al
(1982) suggest that for fatigue design the number of wave cycles costumarily is taken
as about 10
8
for a 20 year lifetime of a ship.
From the evaluation of the results it is found that the bending moment magnitude
to be expected to occur once in a lifetime is 490 MNm, 385 MNm, and 365 MNm for
SWATH-I, SWATH-3, and SWATH-FV, respectively. The largest number of load
cycles however is observed between the zero load magnitude up to 100 MNm. In this
range the portion of load cycle are in excess of 90% of the total number of cycles to be
experienced in 20 years. SWATIl-3 experiences the largest load cycle
in
this range, that
is, some 95-96% of the total. At this stage the criteria to define the significance of the
lifetime load with respect to the number of cycles is rather vague. Nevertheless, it is
obvious that the contribution of the response load in the lower side is extremely
important for consideration in fatigue design. More on this aspect will be presented in
Chapter 6.
To be compatible with most of the existing structural fatigue data the load
histogram needs to be transformed into the load exceedance curve. Using a cumulative
distribution process values of any given response being equalled or exceeded can be
obtained. Figure 3.21 depicts the load exceedance for the SWATII-3 derived from the
corresponding load histogram. In this Figure is also shown the component of load
cycles computed for head, beam, bow-quartering, and following seas, and the total
exceedance added up from these components. It is interesting also to observe the
difference between the number of load cycles derived by accounting for various sea
headings and by only considering the beam sea, as presented in Fig. 3.22. As is seen,
Chapter
3 -
P re dictio n o f W ave L oads o n SW A Tll Ships
113

7/26/2019 1992djatmikophd.pdf
http://slidepdf.com/reader/full/1992djatmikophdpdf 138/507

7/26/2019 1992djatmikophd.pdf
http://slidepdf.com/reader/full/1992djatmikophdpdf 139/507

7/26/2019 1992djatmikophd.pdf
http://slidepdf.com/reader/full/1992djatmikophdpdf 140/507
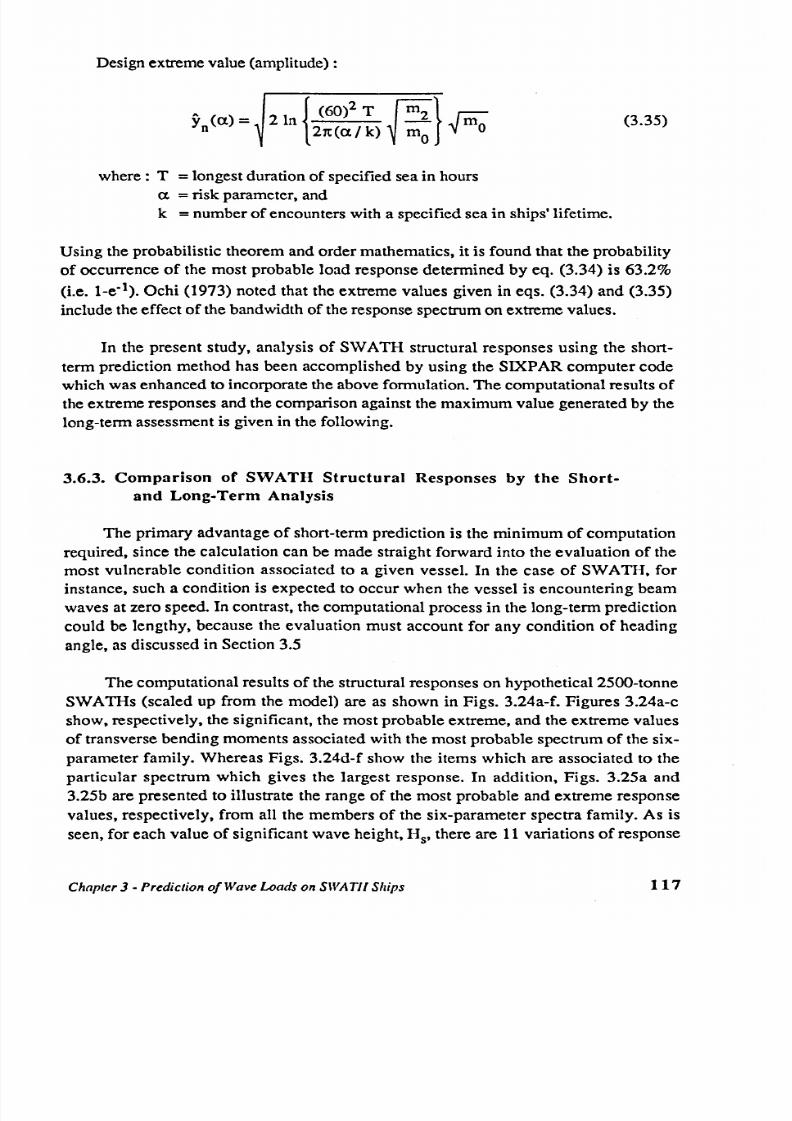
7/26/2019 1992djatmikophd.pdf
http://slidepdf.com/reader/full/1992djatmikophdpdf 141/507

7/26/2019 1992djatmikophd.pdf
http://slidepdf.com/reader/full/1992djatmikophdpdf 142/507
7/26/2019 1992djatmikophd.pdf
http://slidepdf.com/reader/full/1992djatmikophdpdf 143/507

7/26/2019 1992djatmikophd.pdf
http://slidepdf.com/reader/full/1992djatmikophdpdf 144/507

7/26/2019 1992djatmikophd.pdf
http://slidepdf.com/reader/full/1992djatmikophdpdf 145/507

7/26/2019 1992djatmikophd.pdf
http://slidepdf.com/reader/full/1992djatmikophdpdf 146/507

7/26/2019 1992djatmikophd.pdf
http://slidepdf.com/reader/full/1992djatmikophdpdf 147/507

7/26/2019 1992djatmikophd.pdf
http://slidepdf.com/reader/full/1992djatmikophdpdf 148/507
Evaluation of design loads for SWATHs was conducted by applying the short-
and long-term stochastic wave approaches. The generated design values from the two
approaches were found to be in good agreement. For instance, the transverse moment
with 99% confidence for SWATH-FY of 459 MNm was obtained from the long-term
analysis compared to 470 MNm from the short term analysis. When only beam sea
heading is considered in the long-term analysis then a value of 495 MNm is derived,
which is some 4% larger than that predicted by the short-term analysis.
Comparison of design side loads by rigorous analysis was also compared with
those values predicted by simple algorithms. The former generally overpredict the
design load by as much as 50%, and sometimes even larger. These large values were
derived by imposing a design significant wave height of 17 metres (corresponds to a
sea state 9), which is cited by Lloyd (1989) as 'hypothetical' in its occurrence. A
reasonable agreement is obtained, however, by restricting the evaluated SWATHs to
operate in sea state 6.
Chapter
3 -
P re dictio n o f W ave L oads o n SW A TII Ships
124

7/26/2019 1992djatmikophd.pdf
http://slidepdf.com/reader/full/1992djatmikophdpdf 149/507

7/26/2019 1992djatmikophd.pdf
http://slidepdf.com/reader/full/1992djatmikophdpdf 150/507
Table 3.3. D esign side loads (in kN ) by various m ethods
SWAm: J . = 2 50 0 to nn es
SW Am-1 SW Am-3 SW Am-FV
M PE V-ST (50% conf. spectrum )
M PE V -S T (M ax. spectrum )
M PE V -ST (M ean)
E V -ST (50% conf. spectrum )
E V-S T (M ax. spectrum )
EV -ST (Mea n)
Lifetime-LT
EV-LT
VCL
A BS (Sikora et a11983)
Sikora 1990
RMI (1.2 J.)
Aronne (0.6 J . )
19451.0
24252.0
19942.0
24745.0
30837.0
25357.0
23000.0
28500.0
17278.0
19150.0
16548.0
29430.0
14715.0
31539.0
39217.0
32019.0
40203.0
49985.0
40808.0
36600.0
46250.0
32204.0
27795.0
28994.0
29430.0
14715.0
27947.0
34734.0
28436.0
35587.0
44222.0
36202.0
33000.0
41650.0
32204.0
19759.0
17946.0
29430.0
14715.0
Notes:
M PE V : M ost probable extrem e value (63.2% probability of occurrence)
EV : Extrem e value
(1
% probability o f o cc urre nc e)
L ifetim e: E xceeded once in lifetim e of the structure (20 y ears)
ST : S ho rt-te rm a naly sis
L T : L ong-term analysis
The m ean extrem e values have a COY o f av era gely 1 6% -1 7%
Chapter
3-
P redictio n o f W ave L oads o n SW A TII S hip s
126

7/26/2019 1992djatmikophd.pdf
http://slidepdf.com/reader/full/1992djatmikophdpdf 151/507

7/26/2019 1992djatmikophd.pdf
http://slidepdf.com/reader/full/1992djatmikophdpdf 152/507
10.0
20.0
• Measwed 1
• Meuured
o
Meal\lted 1
8.0
-- MARCJlS (Vi ,,)
~
-- MARClIS (VIse)
~
~
15.0
~
]
]
6.0
~
. .
10.0
:g
III
III
. d
. I i i
1
5.0
1
•
.0
S I
0.0
0.0
0.0
5.0 10.0 15.0 20.0 0.0 5.0 10.0 15.0
20.0
Wave
Leng1h/Bo
Wave
Leng1h/Bo
S ide forces on theS WA TH -3 m odel
S id e f or ce s 0 the S W A TH -3 m odel
in bea m sea s (F n= O.O O)
in
qua rte ri ng s ea s (Fn=O .OO )
Figure 3.3. S ide forces (V2) on SW A TIl-3 m odel in beam
an d b ow -q ua rterin g se as
2.0
1.2
• Meuured
. . . .
-- MARCJlS (Vioc)
. . . .
1.0
~
. . ,
1.5
~
J
J
0.8
III
III
S
1.0
i
0.6
'b
>
>
0.4
i
. I i
0.5
j
0.2
Z
5.0
10.0 15.0
20.0
• Meuured
-- MAROIS (Vi ,,)
Wive Length/Bo
V ertic al she ar fo rce s o n the F ish ing S WA TH m odel
in
beam
s ea s (Fn=O .OO)
Wave Leng1h/Bo
V ertical shear forces on the Fishing S WA TH m odel
inqua rte rin g s ea s (Fn=O .OO )
Figure 3.4. Vertical shear forces (V 3) on SW ATIl-FV m odel in beam
an d b ow -q ua rterin g se as
Chapter
3·
P re dictio n o f W ave L oads o n SW A TII Ships
128

7/26/2019 1992djatmikophd.pdf
http://slidepdf.com/reader/full/1992djatmikophdpdf 153/507
• M easured 1
o Mcaauredl
-- MAROIS (Vise)
2.0
00
.5
' 5 1.5
III
~ 1.0
f : :
.§
i
o
o
o
0.0 u . . . . . . J . . . o . & ~ ~ : : : = : : : i : : : = = : r : ; : : : ; d
U.O 2.5 5.0
7.5 10.0 12.5 15.0 17.5 20.0
W ave L en gt h/B o
Transverse bending moment at the mid cross-deck of
the SWATH-l model in beam seas (Fn=O.OO)
2.0 •
• M easured 1
o
Meaauredl
-- MAROIS (Vise)
•
2.5 5.0 7.5 10.0 12.5 15.0 17.5 20.0
W ave L e ng th /B o
Transverse bending moment at the mid cross-deck of
the SWATH-l model in quartering seas (Fn=O.OO)
Figure 3.5. Transverse bending moments (M4) on SWATH-l model
in
beam and bow-quartering seas
r-
3.0
('
1.50
. .
• Measured 1
s
o Measured 1
. . . . . . . .
~
2.5
~
1.25
~
-- MAROIS (Vise)
~
~
2.0
~
1.00
.5
.5
]
1.5
]
III
III
j
1.0
j
~
0.5
~
a
s
0.0
~
U.O .
5.0
, 0.0
15.0
20.0
W ave L en gt h/B o
Transverse bending moment at the mid cross-deck
of the SWATH-3 model inbeam seas (Fn=O.OO)
• Measured
-- MAROiS (Vise)
15.0 20.0
W ave L en gt h/B o
Transverse bending moment at the mid cross-deck of
the SWATH-3 model inquartering seas (Fn=O.OO)
Figure 3.6. Transverse bending moments (M4) on SWATH-3 model
in beam and bow-quartering seas
~ 3.0
~
1
~
~ 1.5
j
• M euured
-- MAROIS (Vise)
.5
2.0
5.0 10.0
20.0
5.0
(' 1.25
r-'O'-..-_ .......- . - . . ,. . . . . ,r I ' - . - . . ,. . . , ,. . . . . . .. . , . . . . . . . . . .. . . . . .. . . .
~
J
.5
l
j
i
1.00
• M easured
-- MAROIS (Vise)
0.75
0.50
0.25
•
5.0 20.0
W ave L en gt h/ Bo
Transverse bending moment
al
the mid cross-deck of
the fishing SWATH model in quartering seas (Fn=O.OO)
W ave L en gt h/ Bo
Transverse bending moment at the mid cross-deck of
the Fishing SW ATH model in beam seas (Fn=O.OO)
Figure 3.7. Transverse bending moments (M4) on SWATH-FV model
in beam and bow-quartering seas
Chapter
3 -
P redictio n o f W ave Lo ads o n sw ath Ships
129

7/26/2019 1992djatmikophd.pdf
http://slidepdf.com/reader/full/1992djatmikophdpdf 154/507

7/26/2019 1992djatmikophd.pdf
http://slidepdf.com/reader/full/1992djatmikophdpdf 155/507

7/26/2019 1992djatmikophd.pdf
http://slidepdf.com/reader/full/1992djatmikophdpdf 156/507

7/26/2019 1992djatmikophd.pdf
http://slidepdf.com/reader/full/1992djatmikophdpdf 157/507

7/26/2019 1992djatmikophd.pdf
http://slidepdf.com/reader/full/1992djatmikophdpdf 158/507

7/26/2019 1992djatmikophd.pdf
http://slidepdf.com/reader/full/1992djatmikophdpdf 159/507

7/26/2019 1992djatmikophd.pdf
http://slidepdf.com/reader/full/1992djatmikophdpdf 160/507

7/26/2019 1992djatmikophd.pdf
http://slidepdf.com/reader/full/1992djatmikophdpdf 161/507

7/26/2019 1992djatmikophd.pdf
http://slidepdf.com/reader/full/1992djatmikophdpdf 162/507
5.0e+7
4.5e+7
4.0e+7· :.
c : :
3.5e+7
..:
B
3.0e+7
J
2.5e+7· ;
. . . .
0
2.0e+7
1 1.5e+7
.I~
1.0e+7
T ra ns ve rse B en din g Momen t (MNm )
(a )
10
8
10
7
, .
10
8
c : :
~
~
10
5
~~
o
10
4
. ' P 1
&j
~
.'
10
3
~ ,
i
.'
,
.'
Z
10
2
/
.'
. .
~.
..
. .
10
'
.
'
.
'
. .
: ' l . ~ n ~ . e 1
.'
. .
10
0
~~~~~~~~~~~~~~~~~~~~~~~~~~~~~~~~~~~~~~
-NM~~~~~mo-NM~~~~~mo_NM~~~~mo_NM~~~~
- - - - - - - - - -NNNNNNNNNNMMMMMMMM
T ra ns v. B en din g Moment (MNm )
(b)
Figure 3.20. Transverse bending moment histogram of the 2500-tonne
SWATH-FV operating in the North Atlantic
(a. linear vertical axis; b. logarithmic vertical axis)
Chapter
3 -
P rediction o f W ave Loads on SW ATH Ships
.
138

7/26/2019 1992djatmikophd.pdf
http://slidepdf.com/reader/full/1992djatmikophdpdf 163/507

7/26/2019 1992djatmikophd.pdf
http://slidepdf.com/reader/full/1992djatmikophdpdf 164/507
['I I ''''T'''' rrn Y'I'T........,rTn'T?''l ................... ~
I
II)
E l
. • . . • • . • • • • • ~ . - _ . • . . . . . . • • . . . . n . . . . ~ l g
t--+-~-+Jlt-t-+-~...:J :;;
e] ~
\ t ~ ~ ~~
.................. ~
~~l
~ ~ ~ ~§~
I--+-t-+~~I-'~~t-_.j..-lll) .. u
E l
~ . , . . :e ~ £
\..~ o~~g
1-•••••.1-• -••
1-•.....1-._-_
~ . _ b : ~ ~ .~
1i
L.o.&...... ,. .4..to.. . .r . .~L...o.. .. .L .. .. . . L.....:J C ~
~ ~ ~ ~ ~ ~ 0) ~
(w NW ) llQ WO W 1I1J ~ u
·AstnlJ~JO
:ln18A :lm:lJIlI3
(WNW) lUOUIOW
''' JlU'>8
·AstnlJ~
JO :l
n18A
:lW:lJllC3 ·qOJd
lSOW
(WNW)1U:IWOW
lIu PlQ8
·AIU8J.L
JO :l
n
lllA
: lW:l lIlC3 .qoJd lSO
W
Chap ter
3 -
Predictio n o f W ave Loads on SW ATII Ships
140

7/26/2019 1992djatmikophd.pdf
http://slidepdf.com/reader/full/1992djatmikophdpdf 165/507

7/26/2019 1992djatmikophd.pdf
http://slidepdf.com/reader/full/1992djatmikophdpdf 166/507

7/26/2019 1992djatmikophd.pdf
http://slidepdf.com/reader/full/1992djatmikophdpdf 167/507
CHAPTER4
PREDICTION OF SLAMMING ON
SWATH SHIPS

7/26/2019 1992djatmikophd.pdf
http://slidepdf.com/reader/full/1992djatmikophdpdf 168/507

7/26/2019 1992djatmikophd.pdf
http://slidepdf.com/reader/full/1992djatmikophdpdf 169/507
longer than the bottom slamming force which is considered as significant on ordinary
monohull ships. It is obvious, therefore, that it might not be appropriate to predict
slamming on SWATH type vessels by conventional methods which have been well
developed largely on the monohull bottom slamming. It is apparent that box clearance is
an important dimension in determining slamming occurrence and further, the magnitude
of impact pressure on the bottom of the cross-structure of SWATH ships is affected by
the relative vertical velocity, the local section shape (flat or flared) and the ramp angle
[Lee et al (1973), Giannotti (1975), Kaplan (1987)].
Slamming is expected to be most critical in head seas, and for a monohull the
superposition of the resulting whipping stress and the basic wave-induced longitudinal
bending stress will increase the total stress significantly, e.g. as observed by Nagai and
Chuang (1977) and Ochi (1958). For SWATHs, on the other hand, where the
maximum wave induced bending stress occurs in beam seas, such a superposition is
unlikely to occur. However, Stirling et al (1988) suggest that in bow quartering seas,
although the transverse bending load is generally lower than in beam seas; when this
occurs simultaneously with slamming loads at speeds then the resulting loads could be
more severe than those predicted in beam seas. As in the case of reducing vertical
motions, slamming can be reduced by employing motion control fins. To reduce
slamming by increasing the wet deck clearance should be considered with great care
since this at the same time increases the bending loads
in
the cross-deck.
Generally slamming loads on SWATH are much lower than primary loads, but
locally they can severely damage the structure, such as at the haunch, strut or the
wetdeck. Experience on the SSP Kaimalino (220-tonne) shows that in the early days
of its operation substantial damage was discovered by personnel of the DTRC.
According to Hightower et al (1985) the damage on the framing at the port prow, which
can be observed from inside the cross structure, was caused by slamming in rough
weather. Another structural part which was also damaged, although only by a small
deformation, was observed in the wet deck under the diesel generator compartment.
This is thought to have been caused by large wave slamming, but other causes, like
welding distortion, could also be possible. From such experiences, therefore,
Loscombe (1989) claims that slamming loads should be treated as important as primary
loads, especially for small SWATHs.
To date, knowledge of slamming phenomenon on SW ATHs is limited, therefore
one may not be certain as to how to deal with the practical problems of predicting
slamming, or reducing slamming. This is not as simple as merely increasing the
wetdeck clearance for the reason given earlier.
Chapter
4 -
P re dictio n o f S lam min g o n S W AT II Sh ips
144

7/26/2019 1992djatmikophd.pdf
http://slidepdf.com/reader/full/1992djatmikophdpdf 170/507
SWATIl slamming investigation can, to some extent, be built upon past
experience of other advanced marine vehicles, or even conventional monohull vessels,
that is, by developing theoretical or semi-empirical predictions and/or by experimental
methods. The former can be gained by modification of the existing motion prediction,
i.e. to generate the prediction of relative vertical motion combined with slamming
pressure data from the open literature. The experimental methods which are expected,
by Meyerhoff et al (1988), to dominate SWATIl slamming research in the near future,
can be carried out in three different ways, namely, drop tests on 2-D models, drop tests
on 3-D models and seakeeping tests.
The seakeeping model tests on SWATIl slamming can be divided into two
categories, that is, one dealing with measurement of relative motion and the other with
the measurement of slamming impact pressure. The former describes slamming
behaviour of a marine craft in probabilistic terms. The latter, which some may consider
to be more important, is aimed at generating the data on the magnitude of impact
pressure. The two findings will later be combined to derive the so called lifetime
slamming load for design by way of spectral analysis.
This chapter will first present a review on different analytical methods of
prediction of slamming for advanced marine vehicles. This is followed by selection of
the appropriate method to be considered in the future development of a time-domain
motion program to predict slamming on SWATHs. In the first approach the problem is
restricted to head seas. Further developments in assessing post slamming behaviour
which should take into account the buoyancy force due to the cross deck immersion,
are outlined. Advantages of adopting a time-domain approach in preference to a
frequency-domain approach will be mentioned. Further, the measured data from
slamming tests on a small SWATH model carried out at the Hydrodynamics Laboratory
will be presented. Some simplified formulations for predicting design pressure due to
slamming on advanced marine vehicles are put forward. These are then evaluated with
the principal aim of finding an alternative approach to estimate slamming pressure for
SWATHs, at least in the early design stage.
4.2. ANALYTICAL APPROACHES FOR SLAMMING PREDICTION
For structural design purposes, the governing parameter required in determining
the local (deck bottom) scantlings is the maximum impact pressure arising from
slamming. This peak slamming pressure can be written in the general form of the
pressure-velocity relation as :
(4.1)
Chapter
4·
P re dictio n o f S lamm in g o n S lVAT Il S hip s
145

7/26/2019 1992djatmikophd.pdf
http://slidepdf.com/reader/full/1992djatmikophdpdf 171/507

7/26/2019 1992djatmikophd.pdf
http://slidepdf.com/reader/full/1992djatmikophdpdf 172/507

7/26/2019 1992djatmikophd.pdf
http://slidepdf.com/reader/full/1992djatmikophdpdf 173/507
7/26/2019 1992djatmikophd.pdf
http://slidepdf.com/reader/full/1992djatmikophdpdf 174/507
The maximum relative vertical displacement of the point from the wave surface can be
obtained by :
Zdrel
(x)
=
Zdabs
(x) - ~(x) (4.16)
where ~ denotes the wave elevation from the calm water and
Zdabs
is the absolute
vertical motion of the point which is caused by a train of regular head waves as :
(4.17)
4.2.2.2. Instantaneous Relative Vertical Velocity. Once it has been
established that an impact had occurred it is necessary to compute the relative vertical
velocity at the impact point when slamming occurs. The formulation of relative vertical
velocity on the wet deck surface of SWA TI-Is that has been applied, is a combination of
both procedures given by Graham (1988) and Kaplan (1987). In the present
computation, eq. (4.9) is modified to take into account the pitch angle at each time step
as follows:
Vns(t) = [ro~ocos(Kx + roet) +U]sin{
a. -
~5(t)}
- [(J)~osin(Kx +«,» +Vsz(t)]cos{
0-~5(t)}
(4.18)
with the vertical velocity component of SWATH, V
SZ
taken as :
(4.19)
where the minus sign of the pitch angle is attributed to the definition of pitch being
positive when the bow is down.
The planing velocity given in eq. (4.11) is then modified into the form of:
(4.20)
Accordingly, the calculation of impact angle should also include the pitch angle,
as illustrated in Fig. 4.3, and is given as :
(4.21)
Chapter
4·
P re dictio n o f Slam min g o n SW A TII Ships
149

7/26/2019 1992djatmikophd.pdf
http://slidepdf.com/reader/full/1992djatmikophdpdf 175/507

7/26/2019 1992djatmikophd.pdf
http://slidepdf.com/reader/full/1992djatmikophdpdf 176/507
1. For 0~~<2.2 deg :
kl =0.37~/2.2+0.5
2. For 2.2~~<11 deg :
kl = 2.1820894 - O.9451815 ~ + O.2037541 ~2
-0.0233896~3 + 0.0013578~4 -0.00003132~S
3. For 11~~<20 deg :
kl = 4.748742
-1.
3450284 ~ + O.1576516~2
_ 0.0092976 ~3 + 0.0002735 ~4 -0.00000319864 ~s
4. For 20 deg~~ :
kl = (1+ 2.4674 I tan2~) 0.76856471/288
(4.24)
4.2.2.4. Post Impact Behaviour. After a slam (impact occurs) a period of time
elapses in which part of the cross deck structure becomes immersed before the vessel
rises out of the waves. This post impact, buoyancy effect, results in a pressure loading
on the cross deck structure. Although the effect is likely to be small in magnitude,
relative to the impact pressure, and may not affect the local strength of the cross deck, it
will influence the overall loading on the cross deck, and must
be
included in a thorough
investigation of slamming effects. The buoyancy force can be evaluated by calculating
the instantaneous submerged volume of the cross deck, VCD' for the duration of
immersion, and is given as follows:
(4.25)
where g is acceleration due to gravity.
The pressure loading can be assumed to be evenly distributed over the wetted
surface, A
CD
' and so the average pressure due to the effect is given as :
(4.26)
4.2.2.5. Structure of Program SLAMTIME. A computer program,
SLAMTlME, say, to simulate the occurrence of a slam, and evaluate the impact
pressure and buoyancy force on the wet deck of SWATH ships using the
aforementioned theory, is now proposed for development. The structure of the program
is outlined in the flowchart diagrams, as shown in Figs. 4.4a-d. Fig. 4.4a shows the
main time solver program.
Chapter
4·
P re dictio n o f Slam min g o n SW A TII S hips
151

7/26/2019 1992djatmikophd.pdf
http://slidepdf.com/reader/full/1992djatmikophdpdf 177/507

7/26/2019 1992djatmikophd.pdf
http://slidepdf.com/reader/full/1992djatmikophdpdf 178/507
position, at time t - 1, then this must be the point of first impact and routine PIMP
ACT
is called.
4.2.2.7. Routine PIMPACT. Figure 4.4c shows routine PIMPACT which
calculates the peak impact pressure on first impact of each wave on the cross deck
structure. The cross deck ramp angle is input, if it exists. The vertical velocity
component is calculated, using the motion velocities and forward speed as in eq. (4.19)
and fed in to calculate the relative vertical velocity, i.e. eq. (4.18). The instantaneous
wave slope and impact angle are calculated using eqs. (4.22) and (4.21), respectively.
Using eq. (4.24) the value of kl is evaluated; from which the form factor in terms of
normal impact velocity, k, can be found by using eq. (4.23). An option to apply the
form factor from other references is reserved in the program. Finally the peak impact
pressure (Pi) is solved by eq. (4.2).
4.2.2.8. Routine POSTS LAM. If contact has occurred at this position, at time t -
1, then this is the starting point of the post impact submergence (see Fig. 4.4d). The
routine then enters a second loop, testing whether or not contact has occurred to
determine the extent of the submergence, and the depths of submergence, of the cross
deck at each point.
Once these have been established the projected area of submergence and resultant
buoyancy force can be calculated. The resulting impact force and post impact buoyancy
can be output to the time solver to give a slamming force time history over the duration
of a run.
Output Data The expected output data from the time-domain motion/slamming
program is listed below:
1.Heave elevation (~3)
2. Pitch elevation
(~5)
3. Wave elevation (~w)
4. Absolute motion elevation of any given point at the bow wet deck (~dabs)
5. Relative motion elevation of any given point at the bow wet deck (~drel)
6. Slam motion elevation of any given point at the bow wet deck
(~drcl-
Zc)
7. Relative velocity elevation of any given point at the bow wet deck (~vrcl)'
8. Impact angle (~), and
9. Slamming pressure elevation of any given point at the bow wet deck (~sp)
Chapter
4 -
P re dictio n o f Slam min g o n SlVA TU Ships
153

7/26/2019 1992djatmikophd.pdf
http://slidepdf.com/reader/full/1992djatmikophdpdf 179/507

7/26/2019 1992djatmikophd.pdf
http://slidepdf.com/reader/full/1992djatmikophdpdf 180/507

7/26/2019 1992djatmikophd.pdf
http://slidepdf.com/reader/full/1992djatmikophdpdf 181/507
For an impulse wave, the phase speed C
w
is :
C
2
= ~ g~
w 1t
2
(4.32)
The resultant speed of the approaching body is :
V
2
=V
2
+V2
R n t
(4.33)
where Vnand V
t
are the relative velocity components, respectively, normal and
tangential to the impact surface. When the resultant body speed, V
R'
is equated to wave
phase speed, the threshold velocity becomes:
(4.34)
Considering the threshold velocity, the probability occurrence of 'actual
slamming' can then be calculated by inserting the velocity term into eq. (4.27) as :
{
Z 2 V 2 }
P {slam impact}
=
exp -
_g_ - _Jb_
r 2Ed 2Ev
(4.35)
From a design practice point of view it is very important to evaluate the largest
(extreme value of) impact pressure a ship may encounter in a certain operating time and
region. It is, therefore, suggested that this extreme value is applied as a design criteria,
instead of the average or significant values, as in its operation a ship must be capable of
withstanding such high impact loads which may induce failure on the bottom structure.
The magnitude of extreme slamming pressure, with a probability of exceedance
a.
throughout Ns slamming observation in a certain operation time T, can be predicted by
the following equation from Ochi and Motter (1969.1973) :
(4.36)
where
P o
is the threshold pressure given by:
P
= 1 P k V
2
o
2 Th
(4.37)
To apply eq. (4.36) the designer must first define the small probability of
Chapter
4 -
P re dictio n o f Slam min g o n SW A TII Ships
156

7/26/2019 1992djatmikophd.pdf
http://slidepdf.com/reader/full/1992djatmikophdpdf 182/507

7/26/2019 1992djatmikophd.pdf
http://slidepdf.com/reader/full/1992djatmikophdpdf 183/507
main particulars of the PVC constructed fishing SWATH model (see technical drawing
in Fig. 4.5), which has been subjected to an extensive test programme on motions,
resistance and wave loadings, can be found in Chapters 2 and 3. The model is not
scaled for structural response, that is, the material of the model was not scaled to
vibrate and resonate as the full scale ship does. At this stage, therefore, the experiment
emphasis the investigation of pressure-velocity relationship in accordance with the
slamming impacts on the underdeck structure.
4.3.1 Measurement of Relative Motions
The measurement of relative motions was conducted on a fishing SWA
11-1
model
using seakeeping test techniques, as discussed in Chapter 2. Detailed procedures and
instrumentations peculiar to the measurement of relative motions only will be mentioned
in this section.
The relative motions of the SWA
11-1
model were measured at four different
positions, designated as P(point)l, P2, P3 and P4, at the forward part of the model at
the wet. deck, as shown in Fig. 4.6. Selection of those locations was based on
monohull experiences and on logical expectation that severe slamming on a marine
vehicle will occur at the bow. The relative motion elevations were detected by means of
capacitance wave probes located at those points. The wave probes which were fixed on
the model followed the vertical motion of the model and detected the changing of
submergence in water levels. Relative motion of each single location can then simply be
derived by substracting these water elevations from the local deck clearance. Ideally the
wave probes should be arranged in such a way that the relative motion elevation
recorded -represents the situation of perpendicular to both wave and cross-deck
surfaces. Nevertheless, such an arrangement was very difficult because
it
should
consider the angular movement of the model and the progressing movement of the
water surface, which change with the elapsed time. To minimise the error arising from
the relative elevation of the wave surface and the wet deck the wave probes, thought to
be the best arrangement, were then mounted perpendicular to the underdeck plane.
The model was tested in head seas at four different forward speeds, that is, 0.5,
1.0, 1.5 and 2.0 mls which correspond to the Froude number of some 0.13, 0.26,
0.39 and 0.52, respectively. Over 20 frequencies of regular waves in the range of
0.3Hz up to 1.4Hz with increments of 0.5Hz were generated for each forward speed.
Shorter wave frequency intervals were generated at the critical (resonance) frequency
region as visually observed. The undisturbed wave elevations were detected by using
three wave probes mounted on the bridge at the far end of the towing tank close to the
wave maker.
Chapter
4 •
Prediction of Slamming on SWATll Ships
158

7/26/2019 1992djatmikophd.pdf
http://slidepdf.com/reader/full/1992djatmikophdpdf 184/507

7/26/2019 1992djatmikophd.pdf
http://slidepdf.com/reader/full/1992djatmikophdpdf 185/507

7/26/2019 1992djatmikophd.pdf
http://slidepdf.com/reader/full/1992djatmikophdpdf 186/507

7/26/2019 1992djatmikophd.pdf
http://slidepdf.com/reader/full/1992djatmikophdpdf 187/507

7/26/2019 1992djatmikophd.pdf
http://slidepdf.com/reader/full/1992djatmikophdpdf 188/507
impact velocity, which adopts a different method from the one used in the present
study. The measurement of slamming in irregular waves as conducted by Graham
(1988) may add to such uncertainties, as opposed to the measurement in regular waves
carried out in the present study.
The maximum k values in each local point, as given in Figs. 4.17c, 4.18c and
4.19c, are approximated from the average of one-tenth largest data points. This of
course is only the first approximation which may need to be evaluated further by
possibly taking the least square fit from all the scattering data. The largest k value is
yielded at local point 2, Le. about 32.0, and less for the two other positions, that is,
26.0 and 9.0 for local points 3 and 4 respectively. The maximum k of 32.0 is
significantly lower than that suggested by Graham (1988), which is approximately
70.0. This is almost certainly due to scaling problems arising from the size of the
pressure transducer.
The results of measurement by using load-cell equipped panels is now described.
First of all, considering the time history of slamming impact as shown in Fig. 4.20, the
panel measurement yields a typically longer period of time. This type of persistence is
similar to the slamming force on the bow flare of monohull ships, e.g. as reported by
Yamamoto et al (1985). It is believed that such an integrated pressure applied to a larger
area of the bottom plating would induce a more serious damage than a much larger
pressure applied only in a much smaller area.
The average impact pressure over each panel was further derived by dividing the
measured maximum force with the area of the panel. The results of the test data analysis
are given in Figs. 4.21 and 4.22, for panel A and panel B, respectively. As is seen, the
scatter of the impact pressure data is not as large as the point pressure measurements,
which can be explained as follows. In the point pressure measurement it is possible that
the maximum registered value was not the actual peak pressure. This is so because the
instrument has only a small surface area, hence it is quite likely that the peak pressure
may occur at a small distance from the location of transducer, but the fluctuation of
pressure was still detected by the transducer. For the panel measurement, on the other
hand, any maximum registered pressure was almost definitely the peak value because
the panel covered a sufficiently large amount of area of the deck bottom. The peak
pressure which occurred anywhere along the length of the panel would be detected.
4.4. SOME METHODS FOR ESTIMATING DESIGN SLAMMING
PRESSURES
In this section some methods are presented to assess maximum (design) pressure
due to slamming available in the open literature. Some of these methods, which were
not necessarily developed specifically for SWATIl ships, are explored with the
particular aim of obtaining an alternative approach which may be applicable for
Chapter
4 -
P redictio n o f S lam min g o n SW A TII Ships
163

7/26/2019 1992djatmikophd.pdf
http://slidepdf.com/reader/full/1992djatmikophdpdf 189/507

7/26/2019 1992djatmikophd.pdf
http://slidepdf.com/reader/full/1992djatmikophdpdf 190/507

7/26/2019 1992djatmikophd.pdf
http://slidepdf.com/reader/full/1992djatmikophdpdf 191/507

7/26/2019 1992djatmikophd.pdf
http://slidepdf.com/reader/full/1992djatmikophdpdf 192/507

7/26/2019 1992djatmikophd.pdf
http://slidepdf.com/reader/full/1992djatmikophdpdf 193/507

7/26/2019 1992djatmikophd.pdf
http://slidepdf.com/reader/full/1992djatmikophdpdf 194/507

7/26/2019 1992djatmikophd.pdf
http://slidepdf.com/reader/full/1992djatmikophdpdf 195/507
7/26/2019 1992djatmikophd.pdf
http://slidepdf.com/reader/full/1992djatmikophdpdf 196/507

7/26/2019 1992djatmikophd.pdf
http://slidepdf.com/reader/full/1992djatmikophdpdf 197/507
has been written on the VAX Cluster to accommodate the analysis using both
formulations.
The Bretschneider two-parameter spectra takes the following form :
H ; (-1949J
S(oo) = 487.3 4 5 exp 4 4
T m T m
m m
(m2-s) (4.63)
where: S(m)= spectral density (m
2
-sec)
Hs = significant wave height (m)
Tm = modal period (sec)
= 1.296T a
=
1.41
T
z
Ta = average period (sec)
T
z
=
mean zero up crossing period (sec)
m
=
wave frequency (rad/sec).
The JONSW
AP
spectral formulation is a modification of the two-parameter
spectra above specifically for the North Sea region, by including the peakedness
correction parameter. The modified spectral form is written as :
S(ol)
=
0.658 C { 487.3 ~~5
exp (
~9~~
J } (mz-s)
where:
(4.64)
e x p [ - = . . ( I D Tm _ 1 ) 2 ]
2 y 2
2n
C=3.3
(4.65)
y
=
0.07 for m<21trr m
y
= 0.09 for m>21trr m
4.5.1 Probability of Slamming Occurrence
To estimate the probability of slamming occurrence in a given period of operation,
information on the relative vertical motion, that is, the response amplitude operator, is
required. Information on the deck clearance (Zc) for a given location along the wet deck
and the threshold velocity (V
th
), if it is available, is then used to predict slamming
characteristic of a SWATH statistically using the formulation developed by Ochi (1964)
as described in Section 4.2.3.
Chapter 4· P re dictio n o f S lam min g o n SW A TH S hips
172

7/26/2019 1992djatmikophd.pdf
http://slidepdf.com/reader/full/1992djatmikophdpdf 198/507

7/26/2019 1992djatmikophd.pdf
http://slidepdf.com/reader/full/1992djatmikophdpdf 199/507
As shown in Figs. 4.24b-e, different effects of parameters may be evaluated as
follows. For the first condition (see Fig. 4.24b), evaluation was made without
considering the threshold velocity, hence the probability of slamming is derived by
taking into account the corrected deck clearance term only. In this circumstance the
down time rate has increased significantly to about 20.5%, either analysed on the basis
of JONSWAP or Bretschneider spectrum. In the second circumstance, as shown in
Fig. 4.24c, initial (uncorrected) deck clearance is considered, and gives a down time of
some 5%. Nevertheless, this evaluation is unrealistic, as static trim and sinkage are
always present at high speeds. A similar account was found on monohulls, as
forwarded by van Sluijs (1974). Using the second criterion (see Fig. 4.24d) for the
first condition, the down time is found to differ quite significantly when analysed by
the Bretschneider and JONSWAP spectra, that is some 19.9% compared to 5.15%,
respectively. The operation of SWATII-FV in the region JS02 (Fig. 4.24e), for the
first condition and the first criteria, is expected to experience a down time of some
14%.
It is clear from the above comparison that the modal period significantly affects
the rate of slamming occurrence. In some cases spectral formulations could give quite a
large difference in the result, hence suggest the spectral formulation to be properly
selected. The difference is significant when only the deck clearance is considered and if
the threshold velocity is taken into account. The rate of operability in different
operational areas differs solely due to the joint probability of wave occurrence, apart
from those aspects as stated previously.
4.5.2 Extreme Slamming Pressure
The extreme slamming pressures are computed for local points 2, 3 and 4 at the
wet deck of the 2500T SWATH by using eq. (4.62). The form factors derived from
experimental data of point pressure measurements are used for the corresponding
locations. The two extreme pressures based on the risk parameter cx.=1(most probable
extreme value) and cx.=0.01(extreme value with confidence of 99%) are derived
similarly for the operational areas of JS01 and JS02. The computational results are
presented in Figs. 4.25a-4.26c. These results are calculated at the largest value of
significant wave height for each group of modal period (see Table 4.la-b) using both
spectral formulations.
As observed from those Figures, the prediction based on the two-parameter
spectra generally provides higher extreme values than predicted by the JONSWAP
formulation. At location JSOl the highest slamming pressure (cx.=O.Ol)appens to be at
local point .Z, which is on the ramp, and approaches 4500 kPa. Further, this highest
Chapter
4·
P re dictio n o f Slam min g o n SW A TII Ship s
174

7/26/2019 1992djatmikophd.pdf
http://slidepdf.com/reader/full/1992djatmikophdpdf 200/507
pressure is predicted when the significant wave height of approximately 13.0 metres is
imposed, whereas in larger significant wave height the pressure attenuates. The same
argument is given, that is, the extreme value is largely related to the magnitude of modal
period. At location JS02 the largest pressure predicted is even more severe than at
JS01, Le. approaching 10,000 kPa at a significant wave height Hs=11.6m. The
calculation has also been carried out in the case of the most probable wave at the two
locations. At station JSO1 the most probable wave is Hs=3.05m and Tm=9 .87 with the
joint probability of occurrence close to 17.5%. For this condition the extreme slamming
pressure based on risk parameter (l=1.0 calculated by two-parameter and JONSWAP
spectral forms is about 387 kPa and 168 kPa, respectively. For station JS02 where the
most probable wave (17% of occurrence) is Hs=3.05m and T
m
=9.07, the extreme
slamming pressure is accordingly found to be about 572 kPa and 270 kPa. These
values are somewhat more reasonable for design pressure load, for example, when
compared to the design pressure for T-AGOS (35001').
Referring to the slamming characteristics of the 2500-tonne SWATH-FV it can be
concluded that the predicted slamming occurrence, as well as the extreme slamming
pressure which might be experienced by the vessel during its operation, depend almost
entirely (not to mention the seakeeping quality of the vessel) on the environmental
condition and the spectral formulation to be applied. It is, therefore, necessary for
SWATH designers to select the appropriate wave data and spectral formulation for the
analysis so that a correct prediction can be achieved.
4.6. COMPARISON OF ESTIMATED DESIGN SLAMMING
PRESSURES
Calculation of design slamming pressure has been made on the
Halcyon (60
tonnes) and the notional 2500-tonne SWATH-FV using several formulations, as
described in Section 4.4, in order to evaluate the applicability of these methods for
SWATHs. The observation of these methods for only two vessels may be disputed.
Nevertheless limited information on any other SWA111s has restricted wider evaluation
to be conducted at present. It is expected, however, that evaluation on both vessels
could represent the trend of design slamming pressure for small and large SW A111s.
The results of the calculations carried out on these vessels are as presented in Table 4.3
and Fig. 4.27. Slamming pressure data from other sources are also included in the table
and graph so that the validity of the comparison might be attained.
For small SWATHs (the
Halcyon),
with one exception the formulations from the
three classification societies give reasonably close answers with the data provided by
the designer. Loscombe's algorithm, as can be seen, gives a substantially larger
Chapter
4·
P re dictio n o f S lam min g o n S W AT II S hips
175

7/26/2019 1992djatmikophd.pdf
http://slidepdf.com/reader/full/1992djatmikophdpdf 201/507

7/26/2019 1992djatmikophd.pdf
http://slidepdf.com/reader/full/1992djatmikophdpdf 202/507
PsI
=
258
+
0.21~
Ps2
=
175 + 0.15~
Ps3 = 166 + 0.10~
(4.66a)
(4.66b)
(4.66c)
The last expression is probably the most reasonable for obtaining the pressure design
value for SW ATlls, and hence might be used in the early design stage. To be
consistent with the pressure data available, nevertheless, the use of this equation should
be limited for vessel displacement up to 6000 tonnes. Beyond this size the design
pressure value is rather uncertain by virtue of the lack of information. There is a
possibility that lower pressure magnitudes are acceptable for larger SW A11-1s. For
instance, as forwarded by Pieroth and Lamb (1983) a design pressure of some 350 kPa
may be adopted for a SWAm of approximately 15000 tonnes. Arguments can be
advanced which suggest that for larger vessels slamming pressure should reduce with
increasing displacement. The equation also ignore forward speed which is surely
important.
4.7. DISCUSSION
A preliminary study of SWAm slamming characteristics has been addressed in
the previous sections. The study develops gradually from the review of existing
publications related to ship slamming in general, and converges to the slamming
problems on SWATH vessels. Analytical solution to the problem was further
forwarded, in which time-domain simulation format is preferred for the accuracy of the
slamming prediction. Experimental investigation was then conducted to characterise
SWAm slamming in terms of relative motion and impact pressure measurements. The
experimental data obtained was finally used in the evaluation of slamming behaviour of
a notional full scale SWATH.
Further experimental study related to SW ATH slamming may be directed to the
observation of surface wave swelling up which takes place before initial impact. Such a
phenomenon is known to give rise in the severity of slamming impact, hence limiting
the operational capability of monohull ships. This account might apply also to SWATH
ships and ought to be accounted for in the analytical assessment. Other issues which
need to be pursued in future are on the aspects of slamming in structural design and
further slamming investigation by way of drop test technique, as shown as follows.
4.7.1. Slamming Aspects of S\VATH Structural Design
A consideration of slamming impact pressures in structural design may be divided
into two categories, namely, the hull girder response and the local structural response to
Chapter
4 -
P re dictio n o f Slam min g o n SW A TII Ships
177

7/26/2019 1992djatmikophd.pdf
http://slidepdf.com/reader/full/1992djatmikophdpdf 203/507

7/26/2019 1992djatmikophd.pdf
http://slidepdf.com/reader/full/1992djatmikophdpdf 204/507

7/26/2019 1992djatmikophd.pdf
http://slidepdf.com/reader/full/1992djatmikophdpdf 205/507

7/26/2019 1992djatmikophd.pdf
http://slidepdf.com/reader/full/1992djatmikophdpdf 206/507
detailed study of SWATH slamming by the seakeeping technique was further
advanced.
A small SWATH model was used in the present study. SWATH slamming
characteristics were investigated by measurement of relative motions and impact
pressures. The measurement of impact pressure was first made by using pressure
transducers located at discrete locations over the fore part of the wet deck. Further
measurement was made by a load cell equipped panel attached on the wet deck.
Slamming form factors, which correlate the amount of slamming pressure and relative
impact velocity, were then extracted from the accumulated data. A large difference of
form factor value was obtained from the point pressure and from panel pressure
measurements, that is in the order of about 4 : 1.This is of course will vary with panel
size, which should be chosen to represent plate panels.
Slamming characteristics were also evaluated for a hypothetical SWATH using
the measured relative motion and slamming pressure data. SWATH operability related
to slamming occurrence and weighted by certain criteria was identified by a
probabilistic analysis. Using the form factors developed from the test, design slamming
pressure of this particular SWATH was then derived. A design pressure value of some
1800 kPa was obtained, when the form factor from point pressure data is adopted,
compared to 518 kPa from the panel pressure measurement. The latter seems to be a
reasonable value as compared to the design values derived using other simplified
formulations available in the open literature. In addition, such a design value is within
the range of 200 to 620 kPa as that suggested by Sikora and Dinsenbacher (1988) for
typical 2000 to 6000 tonne SWATHs.
Comparative evaluation was then performed on the existing design pressure data
accumulated so far. The trend in the increase of design slamming pressure with the
increase in SWATH displacement is uncertain due to the substantial scatter of the data.
Nevertheless, a regression analysis has been made and yields a simple pressure-
displacement correlation pertinent to SWATHs. The expression developed is acceptable
for first estimation of design pressure for SWATH ship displacements up to 6000
tonnes.
The results of the present study will be useful in the development of a further
study on SWATH ship slamming. Areas which need to be pursued in future are first of
all, the development of a mathematical model for SWATH slamming assessment,
preferably a time-domain simulation. Secondly, the development of structural design
procedure for SWATH deck bottom scantlings based on slamming impact. The
accumulation of slamming data from model tests remains necessary to validate any
analyticalprediction that may be available in the future.
Chapter
4 -
P redictio n o f Slam min g o n SW AT II Ships
181

7/26/2019 1992djatmikophd.pdf
http://slidepdf.com/reader/full/1992djatmikophdpdf 207/507
T able 4.1a. Joint probability of significant w ave height and period at grid point JSO 1
59.92· N . 2.29· W [C hen & Mav ra kis (1 988)]
Modal Period. Tm (sec)
Hs(m) 4.23 7.05 9.87 12.69 15.51 18.33 21.15 23.97 26.79 Marginal
0.61 0.95 10.15 10.13
2.85
0.99 0.21
0.05
0.02
0.02
25.38
1.83
-
13.70
11.25
2.99
0.76 0.16 0.04
- -
28.91
3.05
-
0.22
17.47
2.58
0.49 0.07
- -
-
20.84
4.27
- -
7.80
3.91
0.30 0.04 0.01
-
-
12.06
5.49
- -
0.21
6.24 0.28
0.03 0.01
-
-
6.77
6.71
- -
-
3.10 0.35
0.01 0.01
-
-
3.46
7.92
-
-
-
0.70
0.89
0.01
- -
-
1.60
9.14
-
-
- -
0.56
0.02
-
-
-
0.58
10.36
-
-
-
-
0.27
0.02
- -
-
0.29
11.58
-
-
- -
0.05 0.01
-
-
-
0.06
12.80
- -
-
-
om
0.01
-
-
-
0.02
14.63
- - - -
-
om
-
-
-
om
Margina]
0.95 24.08 46.88 22.38 4.95
0.60
0.12 0.02
0.Q2
100.00
T able 4.1 b . Joint probability of significant w ave height and period at grid point JS02
59.92· N . 0.91· W [C hen
&
Mav ra kis (1 988)]
Modal Period_,_Tm (sec)
Hs(m)
3.89
6.48
9.07 11.66
14.62 16.85
19.44 22.03 24.62
Marginal
0.61
2.50 14.21 10.21
4.62
1.42 0.41
0.08
0.01
0.01 33.48
1.83
-
17.60 12.07
2.61
0.74
0.21
0.04
-
-
33.28
3.05
-
0.08 16.90
1.92
0.39
0.06
-
- -
19.35
4.27
-
-
3.93 4.46
0.18
0.04
0.02
-
-
8.63
5.49
- -
om
3.05
0.28
0.02
- - -
3.36
6.71
-
-
-
0.67 0.63
-
- - -
1.30
7.92
-
-
-
0.01 0.36
0.01
- - -
0.38
9.14
-
-
-
0.01 0.13 0.01
- -
-
0.15
10.36
-
-
-
0.01
0.Q3
0.02
-
- -
0.06
11.58
-
-
-
0.01
-
-
-
- -
0.01
Marginal
2.50
31.90
43.13
17.37
4.16
0.78
0.14
0.01 0.01
100.00
Chapter
4 -
P re dictio n o f Slam min g o n SW A TII Ships
182

7/26/2019 1992djatmikophd.pdf
http://slidepdf.com/reader/full/1992djatmikophdpdf 208/507
§
' 6 ' 0
~
-
0
Cl)
. . . . .
~
. 5
b .O
. s
~
~
. . .
)
Cl.
0
Cl)
~
0
I
e l
~
~
~
~
Cl)
' '
0
en
~
e
b .O
. 8
1
-
S il)
~
.S
~
j
Q)
~
M
. § f a
] 1
. . ~
] Ii
~ .~
•. g ~
o S ~ . . . .
> '-' ..
.• e
~ ': d
o......
.
~
£ ~ ~
a-
~
t'
I I
I I .
·
· · · ·
·
0
N
c :i
e --
~
a-
. . . . .
· · ·
·
·
·
c :i
. , . ,
~
~
~
I
~
.
· ·
· ·
·
·
:: i
c :i 0
c: i
0
~ ~
~ ~ ~
~
i
•
-
~
~
. ,
. . , . , . ,
e --
. . ,
. . . .
~
. ,
§
8
00
o C
8 0
s
-
0
0
0 0 0 0
c :i c : i c : i c : i c : i c :i
i
~
~ ~ ~
N
~
00
N
~
8
a-
-
. . . .
00
a-
. , . ,
§
N
I'>
8
. . ,
r-
.: z
1
§
8
r-
S
. , .
·
~
. , . ,
0 C S 8
-
c: i
c : i c : i c : i c : i
c :i c :i c :i c :i c :i c : i
~ ~ ~ ~
a-
00
. , . ,
'
t e l §
~
-0
0
· ·
•
·
·
§ q
8 l
-
o
0
o
0
o
0
0
~ ~
N
00
-
, . ,
. . ,
00
t o
§ ~
F = :
,
· · · · · ·
\
C S
c :i c : i c : i c : i c : i
~
I~
§
•
.
• • • •
·
•
·
'
. . c :i
. .
'0
'0;
~
. . . .
~
. . . .
.
.
.
. .
·
·
·
·
· ·
el
•
.
c :i
]
:0
.. ,
~ ~
'
r : ;
N
~
-0
00
0
.. ,
e:§
. , .
a - :
. . ,
1
00
'C l
c :i
-
. . . .
. , .
o n \0
t'
0\
: :
-
~
. , .
. ~ : X l
-
-
U
Chapter
4·
P re dictio n o f Slam min g o n SW A TH Ships
'
I
•
·
. . . .
·
•
· ·
·
S;
~
.
·
.
. .
•
· ·
· ·
·
. ,
N
es
. , . ,
~
~
~
~ ~·
,
·
·
·
·
·
N
0
c :i
0 c :i c :i
~
~
~
~
~
~ ~
. , . ,
. . . .
f O
. , . ,
. . ,
. . ,
~ ~
~
r--
-e-
~
. ,
§
C
-
0
c:i c : i
0 c :i 0 c :i c : i c : i c :i
c :i c :i
c :i
i
I
~ ~ ~
0
'
00
§
0
s : .
-
t'
b
~
\f)
1
§
-
. , . ,
. . : : :
§§
§
. . ,
'
·
~
on
0
C S
-
c :i c :i c :i c :i c :i
c :i
c :i
c :i
c : i c : i
~~
~ m
N
~
0
'
~
. , . ,
-0
~
. , . ,
§
. . . .
·
·
· ·
·
-
0
o 0 c :i c : i
c :i
c :i
~ m
~
. , . ,
N
00 00
t o
-
00
-
§
·
•
·
·
·
· ·
\
8
c :i c :i
c :i
c :i c :i
~
~~
E
, . ,
•
.
•
,
· ·
· ·
·'
8
o 0
c :i
II.
<
~
~
~
. . ,
. . ,
.
•
. .
·
.
·
· ·
·
.
Q
•
.
c :i
E
~
i
. . . .
. . . . .
~
'
~
~
. , .
-0
00
0
. . ,
1:§
C
f;
-
r<)
1
00
\0
0
-
. . . .
•
. , . ,
t--
0\
~
-
M
•
- -
-
~:t1
183

7/26/2019 1992djatmikophd.pdf
http://slidepdf.com/reader/full/1992djatmikophdpdf 209/507

7/26/2019 1992djatmikophd.pdf
http://slidepdf.com/reader/full/1992djatmikophdpdf 210/507

7/26/2019 1992djatmikophd.pdf
http://slidepdf.com/reader/full/1992djatmikophdpdf 211/507

7/26/2019 1992djatmikophd.pdf
http://slidepdf.com/reader/full/1992djatmikophdpdf 212/507
c ..
g
0
c o .
~~
~
;~
~
~
~
: s
Q
III
e
'
Cl)
E - o
Cl)
0
~
Cl)
. S
. . . .
:::I
f f i
0
~
~
~~
I l : I I I
~
~
~~
~ f f i
~ ~
~o
~
~
i
aei
:; ~
0
~~
> -
OJ)
g
. . . . .
~a
Z
~
0
IQ
~~
~~
~
I ~
; 1
~
r s
<
u
u
~
: i
~
b
<
~
~
c ..
c ..
Cl)
0 0
· s
':::
~g
I i
~
III
:::I
~
0
~~
i~
~
~
0
~~
'< : t
0
~
~
- . : i
z
~~
~tj
~
~~
~i
~
I
OJ)
1 6
I i
~
u : :
~~
u
Chapter
4 -
P redictio n o f Slam min g o n SW A TII Ships
187

7/26/2019 1992djatmikophd.pdf
http://slidepdf.com/reader/full/1992djatmikophdpdf 213/507

7/26/2019 1992djatmikophd.pdf
http://slidepdf.com/reader/full/1992djatmikophdpdf 214/507

7/26/2019 1992djatmikophd.pdf
http://slidepdf.com/reader/full/1992djatmikophdpdf 215/507
Figure 4.8. Photographs of SW ATH -FV m odel subjected to severe slam ming
(a.
fro nt v iew;
b.
p lan view)
Chapter
4·
Prediction o f S lamming on SW ATH Ships
190

7/26/2019 1992djatmikophd.pdf
http://slidepdf.com/reader/full/1992djatmikophdpdf 216/507
Run 24451 f=O.55I1z. l.OVolt ; V=l.Om/s
15.0
12.5
10.0
i
~
7.5
'I
.5
8.
5.0
'0 1
l
1 :
~
: a
~
0.0
I
;oj
. .
·2.5
.§
5
e
·5.0
: 5
e
I
~
·7.5
. I
i
~I
il
V
ll:
·10.0
·12.5
·15.0
0
Local point 1
L ocal point 2
L ocal point 3
Loca l po in t4
.I
,I
~
,
I
'oj'
I
I
~
~
~
.I
i·
1
,
'1
F
N
, 1
,.~
~
~I
il
~~
r i
. ,
I I
II
V
,
, ,
J
'I
V
V
I
Y
~
I
2 3 4
5 6 7 8 9 10 12 13 14 15 18 17 18 19 20
t(seconds)
Figure 4 .9 . Typical record of relative m otions at four local points
Run 24684 ; Local Point 3 ; f=O.6Hz • 1.2Volts ; V=1.0mls
15.0
Impact
presl.
R eI. m o tio n :
12.5
~
I ,
~
I I
f a
,I
I
I
,
I:
,
I
,
'I
r \
I
,
II
10.0
J
I
,
II
II
1 \
'I
,
,
d
'I
,I
:I
J I
I
I:
I
/ :
' I
I
I
It
I'
II
7.5
J ~
II
,
J
I
I I
\
I I
I I
I :
' I
' I
I \
I
' I
1I
I I
I~
II
I
I\
J '
I \
:
\
I
:
\
I
I
8
\
I ,
I
I \
I
I
I I I
5.0
I ,
I ~
. .
, I
,
I
I
I
I l
I
I
~
I
' I
I
I I
,
,
I I
I
I
I
I
\
H
2.5
I
I
I
I
I
I
I ,
I
, I
i
I
i
,
I I
0.0
I
.
,
i
I
,
·2.5
, ,
,
,
I
,
.§
I
I
I
,
I
1
I
I
,
I
I
I
I
·5.0
,
I
I
I
E
,
I
I
,
I
I
,
I I
I
I I I
. : .
I
I
,
,
I
I
I
I
c:
·7.5
I
I
I
I
I
I
I
Ig
I
I
I
,
I
I
I
I
I
I
I
I
I
~
·10.0
,
I
,
I
I
II
I
I
I
I
I
I
I
I
, I
· 1
I
I
I
I
I
I
,
I
I
I
I
:I
,
,
I
,
,
,
I
I
I
12.5
,
II
I
,
I
I
I
I
,
I
II
,
I
I
II
I
I
,
II
,I
'I
I
I ,
ci
,
,
,
II
I I
I,
I
I
I
Ill:
·15.0
I
I
I
d
,
u
\ ,
,
,
II
I
I,
~
I'
\ ,
~
,I
I'
'/
f
I J
•
V
~
,
17.5
'I
Y
~
¥
C
,
V
~
~
~
·20.0
0
2
3
4
5 6 7
8
9
10
11 12 13
14 15 16
17 18 19
20
t(seconds)
---.~-----
Figure 4.10. Typical record of slam ming pressure and the corresponding

7/26/2019 1992djatmikophd.pdf
http://slidepdf.com/reader/full/1992djatmikophdpdf 217/507
o Me_d
Local Point 1
1'D.0.13
1.0 2.0 3.0 4.0 5.0 8.0
Non -d im . Encount er F re quon cy (we')
i
~
3.0
.~
)1
~ 2.0
~
~ 1.0
~
o M O M U f t I d
Local Point 3
1'D.0.13
O.O ~ ~ .............
0.0
1.0 2.0 3.0 4.0 5.0 8.0
N on-dim . E ncou nter Frequ ency (_ ')
5.0 ,............,...,...........,..............,..........
T . . . . . . ._ , . , , . . . . . . . .. . . . . . ,
i
~ 4.0
' i
1
3.0
~
2.0
~
~ 1.0
~
o
Meuun.d
Local Point
:&
1'D.0.13
1.0 2.0 3.0 4.0 5.0 8.0
Non-dim.
Encounter
P n o qu e n c : y ( _ ')
i
~
3.0
· 1
:t
~ 2.0
~
~ 1.0
~
o . o ......a ~ ~
0.0 1.0 2.0 3.0 4.0 5.0 8.0
N on -d im . E ncoun ter F re quen cy (_ ')
Figure 4.11. Relative vertical motion at four local points of SWA TH-FV (Fn=O.13)
(a. Point 1 ; b. Point 2; c. Point 3; d. Point 4)
5.0,............,...,.............,..............,..........
T - , _ , . , , . . . . . . . . . . . . . . . ,
o MeMUftld
Local Point 1
PD.O.16
o Me_d
Local
Point 3
PD.O.16
5.0 8.0
Non -d im . E nc ou nte r F re qumc y
(we')
5.0 ,............,...,...........,..............,..........
T - - , . . . . . . . . . . . . . . . ,
o Meuured
Local
Point :&
1'D.0.16
o
Mea ........
Local Point 4
1'D.0.26
~
s
4.0
~ 3.0
2.0
0.0 ........................... .. ..a. . .. .. . .~ ... . .. .. . .. .. .. . .. .. .. . .. .. . . ,_._ .. .. .. .. . .. .. . .. ..
0.0 3.0 4.0 5.0 8.0
N on-dim . E ncou nter Frequ ency (_ ')
Figure 4.12. Relative vertical motion at four local points of SWATH-FV (Fn=O.26)
(a. Point 1 ; b. Point 2; c. Point 3 ; d. Point 4)

7/26/2019 1992djatmikophd.pdf
http://slidepdf.com/reader/full/1992djatmikophdpdf 218/507

7/26/2019 1992djatmikophd.pdf
http://slidepdf.com/reader/full/1992djatmikophdpdf 219/507
,
i\
'
i\
~
~
I
/
\
s
,
-
-
-
o
cl
. . . .
o
cl
lI)
N
•
lI)
. . . .
(\I
-0
0
~
. . . .
0..
(\I
E
'.-4
lI)
S
en
0
en
(\I
a)
~
. . . . .
0
t: :
•.-4
0
0
C\I
S
~
lI)
. . . . .
en
a>
13
.
..-
1
8
0
'l:j
a>
-
~
. . .
en
en
a)
1-0
lI)
0..
co
ol)
. . . .
. S
0
~
co
-
n
..-
to
-
I)
~
, . . . .
~
. . . .
•.-4
0
~
, . . . .
~ . . . .
lI)
.

7/26/2019 1992djatmikophd.pdf
http://slidepdf.com/reader/full/1992djatmikophdpdf 220/507
;r
. . . . . .
. . . . . .
0
0\
0\
-
...
C
~
~
. . . . . .
t-
~
O r : .
0
. . . .
. . . . . .
: E
5
-
J
u
.§
II
a . . F
s
. . . .
. . . .
0
a
u
.~
C IS
-
0
~
\ l S
-
.;
~
u : :
C
. . . .
II)
':
o
o
~
o
11) '
~
o
o
M
5 I
~~
o
II)
.-
o
o
.-
ci
II)
C
o
o
o
III C :;
o 0
I
s
•
I
I
•
•
i
I
~
••
I
<;
•
I
. .
'-
~
. .
:.
I .
. ,~.
]
le .: •
.• '~ :l
•••
I~
+ . . · 1 ' . . i ·····: t··· .....
. .. .. . ; § ;.
:....l.......,..'M ..
r · · · ~ . .
·l
.
I le:.:
I .,,~•
•• I H +++-I
I
1
r n m : * ~ ~ 'W ~ ' - . .
m .
>
~ ·i ;· · ·· · r' ..... .;
I I
ttt+..
t-i+Hi-I-....
r ' . . .M
o
. . . .
. :
I
TI
i
i i
:~
'~ '''''l t .
' '~:
:
:
. ~ • :
i
J ~ < ~ ~W•t= IIlliW ~ :::t .... ' ; : : -
~~~ F =
:
:: ~ -
: · · · 1 · . • · . · . .
•

7/26/2019 1992djatmikophd.pdf
http://slidepdf.com/reader/full/1992djatmikophdpdf 221/507
o
..;
It)
~
o
o
~
o
It)
~
o
o
C)
OM
It)~
ci:
~~
o
It)
. . . .
o
o
. . . .
o
It)
o
o
o
o
It)
0::)
cl cl
I
i
s
i
~
•
•
r-,
. . . . . .
I
I
1 ' - '
•
•
. .
••
.~
~
_~
l'
~
~
•
I .:
t+· 1 -
t: .
. . . .
I
n
i
.5
I
n
i
o f
I
I
] 1
I I
I
i
illl.l
I
0
:
. . . .
(were
Id
I
Qsd)Id
It)
cl
It)
~
o
o
~
o
~
o
o
C)
~~
j
o '-'
oZ
>
o
It)
. . . .
o
o
. . . .
o
It)
C
o
o
o
0::)
cl
~.
I
~
. . . . . . . . .
_
.. .
. M · · ·. . r - - · ·
. . . . . . . . .
I
. . . . . . . . . . . . . . . . .
~ · r - · ·
. . . . . . . .
•
-~
•
. . . . .-
. . . . _ .
__ M
~--
. .
_
. • .
•
I \
1- .
· · . s . . · ·
. . . . .
-
. . . . . _ .
- - r - -
••..
o f
~
]
I
r : tr r : ;. : 'l ~ . ~. . : : : :.
· · : : m l l ' ' : 'o o i · ~ · ~ · : r . :. E . . ~. ~ ~ ~ · . i · ~ : r . · ~ j . : , : : - : 'l · ~. ~
1 1 I
Ii .:
..ii
u i
· 1
II
n u .
.,.
II
I I
i
I
lill
:
q
(,td)
Id

7/26/2019 1992djatmikophd.pdf
http://slidepdf.com/reader/full/1992djatmikophdpdf 222/507
. . ,
e
Irl
0
-
-
:1~
. . . .
. .
E
It)
ci
C?
ci
N
ci
It)
I'
~
0
I'
~
N-
ci ci
,
o
ci
0
C?
N
It)
N
N
0
N
N
It)
. . . .
N
0
~
N
It)
0
N
'
0
1
N
It)
._
. . .
0)
~
0
0)
~
It)
to
~
0
to
~

7/26/2019 1992djatmikophd.pdf
http://slidepdf.com/reader/full/1992djatmikophdpdf 223/507

7/26/2019 1992djatmikophd.pdf
http://slidepdf.com/reader/full/1992djatmikophdpdf 224/507
3.0
2.5
2.0
'iii'
E
,8.
1.5
0
~
e n
1.0
0.5
3.0
2.5
2.0
'iii'
eo
~
.~
1.5
f-4
0
'::3
g
1.0
til
0.5
I I I
I
Calm water
/
-'-- --
Lw/Ul=0.75
<,
V
i' ' '
_ ...•...
Lw/Lh= 1.00
, . . - ; ; c A
V I
. 1 /
/J
~.
~ : ' : ' T
~
4'
l,6~
. . . . . .
~;
1
l&
-~
.0
0.00 0.05 0.10 0.15 0.20 0.25 0.30 0.35 0.40 0.45 0.50 0.55
Fn=VrJgL
Figure 4.23a. Sinkage of SW A TH -FV m odel in calm w ater
and in w aves at forw ard speeds
I _ ,
Calm water
I
I
I
r - '
. .-
Lw/Lh=0.75
~ 1 .
,
I I I
. . . . . . . . . . .
t·
- _
.•.
_ -
LW/Lh: 1.0
~~
V
'\
. . . . /
i f
I
' ~
4
~ . .
-/
,
til
i
l f o
. 4
~
./
,.
~
0.0
0.00 0.05 0.10 0.15 0.20 0.25 0.30 0.35 0.40 0.45 0.50 0.55
Fn=VrJgL
Figure 4.23b. Static trim of SW A TII-FV m odel in calm water
and in w aves at forw ard speeds

7/26/2019 1992djatmikophd.pdf
http://slidepdf.com/reader/full/1992djatmikophdpdf 225/507
o
1 '.........~::.n'I ........ -..,....,~--- .... . n
. . .
8
. . .
o
............r- rI '..-r ....................- . . . n
. . .
•
5.
l~
'¥.-t~...pa..,..-::::.._,..I
_ll~~~
1i lJ i
l~--I-i~~
.caO
~
.
';
iJlII ...
............ ,;.,,_..Jo.o.s....a. .........................
, _ , O
.-;0
. . .

7/26/2019 1992djatmikophd.pdf
http://slidepdf.com/reader/full/1992djatmikophdpdf 226/507
. : . : .
i
i
_ ~
~
i
,,~
~ . , .
,
.t:
r -
p
IT
- i a
I
i'
~
Ao; Q
-i:
i'
I
J
~;
. . .
..· i·-·
.
.
. .
_
1 \ . .
~
1\
1\
\
\
l-r-
-
c-
I~~
I
6,..:0'
c
-r
1'~
I
P
i ' -
I
'
. . . .
_ .
_
_
.
.:.~
N ~
-.~
.
. .
. . . . .
0
Cl)
. . .
N
. . .
0_
. . .
_ -
._
~
s
..;-~~
:0-- .
j,
'I
j
Ii
. . . . . . . . .
. .
_
. . . .
. . . . _ . .
. . . . . . . . . . . . .
t -
. . _ . .
,i I
l
,I
I
I
I -~
6.l~'
. . . . .
1 ' ~
. . .J ~ . .- - .
. . . . . . . . .
- - i ? l
oQ
Jt·......
·_.........· ..
1ft
. . .
. . .
. . .
o
. . .
-
o
Cl)
'
:
o
. . . .
bJl
~
c:
. . . .
. . ,
t')
N
~~~~~~~~~~0
N
o
(WdlI ) Id
~
.
-
.J .
. . t . .
l
, ;~
. . . . . . .
. - . _ .._ .-
i~ '
I
I'
l U
\
\
\
.~
1 \
~~
, , ' ,
8 s
1\
\
,
8 -..:
1
f ~
0 I.
i
1~~
. . .
1 ; : - : ;
~
' i i i -
_
~.
. . .
i q -
O f
t
t
t
~
~ , 1 \
~
I
Cl)
. . .
1ft
. .
. .
.
t')
. .
N
. . .
. .
-
..3.-·
. . . . 1 . -
. _
. -
_
. .
._ .
ii
-.~.
q
/
. . . . . .
1.
~
.ifii
l-
I-
. e . '
,
~
J E
_
'
,
.~
1 \
,
. .
- \
. . . .
~.
.........
r r
. . . .
. . . . .
. .
·b:f
j\~
~
~ .
.
_
_
.
~
~ ~
J i
~i -
..t'
~
. . . .
.
_ .
.-.
..--t ....
t\:
. . . . . . . .
. . . .
f'
I
I
, ~
I
Cl)
. . .
P - . 1 . _
•
I-~
= :-
1 -
i
-
t - . . . .
3
-
...;
~
~
0-
H+-
l-
I
1 ~
-
I
i
I
6
~
....~.
. . . .
. . . . . . . . .
. . . ' : ' : '.
~
~
j ' : ' :
. :~
Ao I Q
~
1 '
J:
- : : l .
ii i
I
1ft
. . .
t')
-
N
-
.
.
0-
...
C I > = =
ID
II)
. . ,
N
. . .
. . .
. . .
o
. . .
Chapler
4 _
Prediclion
0/
S lamming on SW ATII Ships 20
1

7/26/2019 1992djatmikophd.pdf
http://slidepdf.com/reader/full/1992djatmikophdpdf 227/507
,-..
N'
-
: i.
c : i .
<l
<l
s
I<
6
e
-
In
.
M
-
-
. s
.
.
~
~
~
g
0
'
£
~
£
00
In
S o
~
~
e
~
In
r--
V)
5
-
S
0
. . .
l
M
-
-
~
=
>
V)
~
~
.s
II
~
~
=
c ::
c ::
~
~
. . . .
~
<
Q
Q
s 0 ~
'
'
.
til
Ilo.
Ilo.
Ilo.
0
•
•
~
)C
lit
+
4 III
•
0
•
I
I
-
0
0
0
. . . .
ti l
~O
~
~
Cl)
............ .
~
•
. . .
- . - . - . ~ . - . -
~
~
= : s
~
ti l
0
ti l
1 - ; - . i 5
0
~
~~
. . . .
-.
b .O
il
§
.S til
Ml)
E '8
g
~-5
. . . .
-~
::
tilE
~
G b t l l
5
. _ = : s
~
tIlO
El
.g'~
-
~
~>
• ~o
~.
0
0
. _
o~
•
0
0
g o O
. . . .
en
0
' f a
-.-.-~-.~.-.
..._ . _ .
i
+
. .. _ ._ ._ .1 . '. ' .
~
0
U
>.
r . . :
.)
~
~
: : z : :
< :t
~
. -
~
0
0
0
0....
0
0
0
. . . .
0
0
. . . .
0
. . . .
. . . .
(~cPI)Sd'~lnSS~ldU~ S~a
Chapter
4 -
Prediction of Slamming on SWATII Ships
202

7/26/2019 1992djatmikophd.pdf
http://slidepdf.com/reader/full/1992djatmikophdpdf 228/507
CHAPTERS
PRELIMINARY SWATH STRUCTURAL
DESIGN

7/26/2019 1992djatmikophd.pdf
http://slidepdf.com/reader/full/1992djatmikophdpdf 229/507
CHAPTERS
PRELIMINARY STAGE IN SWATH STRUCTURAL DESIGN
5.1.
INTRODUCTION
The relatively limited demand on SWATIls by commercial operators as well as by
governments (the Navy) is widely recognised due to the comparably higher capital
expenditure required for construction. Betts (1988b) suggests that the higher
construction (structural) cost of a SWATIl is due to the larger size of the ship
(approximately 20 to 30%) compared to a monohull with an equivalent capability in
carrying out a certain mission. The criterion applied in the scoring of equivalent mission
is, in this case, governed by the capability of the vessel to carry an amount of payload,
Le. main cargo and/or operational equipment. Whilst the structural weight of a SWA TIl
ship is approximately 40% of its fun load displacement, thus the amount of payload
which can be transported by a SWATIl is less than that by a monohull.
There is practically no other way to put an appreciable increase inpayload without
attempting to reduce the structural weight. A report by Sikora and Dinsenbacher (1990)
on the design study of a notional 9000 tonne SWATH suggests that a 10% structural
weight reduction could be the expected result in a 16% increase in range, or a 24%
increase in payload. Realising this, various efforts were then undertaken by SW ATIl
researchers worldwide to solve the problem of effective structural design by examining
all possible alternatives on the general and detailed structures.
Several attempts suggested as viable to reduce SWATIl production cost and/or
structural weight are extracted as follows. Improving the producibility of structural
components which in general may be acquired by slightly modifying the initial
structural arrangement into a much simpler configuration, as shown by Covich (1986)
or DeVries (1991). For this special case the involvement of production engineers in the
earliest design process is therefore necessary if a further reduction in the production
cost per tonne structural weight is to be achieved.
The selection of longitudinal framing, which tends to be avoided by conservative
designers, is also a potential arrangement which could provide weight saving compared
to the commonly used transverse framing in SWA TIl ships. A thorough design study
on a 500 tonne SWATIl by Gupta and Schmidt (1986) reveals that longitudinal framing
configuration could be 3 to 12% lighter than a transverse one. Sikora (1988) points out
Ch ap te r 5 • P re lim in ary SWATII S tru ctu ral D e sig n
203

7/26/2019 1992djatmikophd.pdf
http://slidepdf.com/reader/full/1992djatmikophdpdf 230/507
another concept for weight saving that is, firstly investigating the proper arrangement of
transverse bulkhead spacing and the use of partial bulkheads in high shear areas.
Secondly, evaluating the use of high strength steels designed to elasto-plastic criteria
for wetted shell plating and, thirdly, adopting lightweight lower hull configurations .
.
Even though the above weight saving concepts are feasible to apply in the design
of larger SWATIIs, further considerations still need to be explored for smaller vessels.
Structural weight fraction of small SWA TI-Is tends to be higher than for larger ones
[Betts (1988b)]. Fortunately, research on lighter construction materials nowadays is
well advanced and has offered many alternatives for marine structure applications.
Light weight material has a substantial impact on the operational cost, although
it
usually imposes higher initial production cost. Lighter structure means higher payload
which might be carried by a vessel. Thus, even if the freight rate is brought to a
relatively lower value, the rate of return could still be expected to be acceptably high.
It is not surprising, therefore, that most small SWA TIls which are presently in
operation were constructed using aluminium alloys, hybrid (steel-aluminium
combination) and even glass reinforced plastics (GRP), as shown in Fig.
5.1.
A fuller
investigation on alternative materials to be adopted for SWATIl construction is reported
by Loscombe (1987, 1988, 1989). Besides aluminium alloy or GRP, high tensile
strength steel is also popular in the construction of larger SWATIl. Aronne et al (1974)
indicate HTS will lead to some 10% weight reduction on SWATB structure.
In general the structural design method applied to SWATBs will follow that
traditionally practised in monohull ships. This may involve the extrapolation from
previous successful designs or may commence from scratch and evolve gradually.
Even if a designer is able to find a parent ship for comparison, modification to achieve
an optimum structure in line with the ship missions is mandatory. The next step of
design will then consist of a stepwise process in which the designer performs an
analysis of the structure in order to evaluate its performance,
If
necessary, scantlings
are revised until the design criteria is met. The resulting configuration is then modified
in a way that is expected to lead to an improvement in performance or cost. Figure 5.2
illustrates the ship structural design process where, on the left hand side is shown the
key steps of the design and the right hand side is the criteria. A detailed explanation of
the design philosophy can be found in a report by Moan et at (1991).
5.2. SWATH STRUCTURAL DESIGN CRITERIA
From structural perspective, the overall hull geometry of a SWA TB ship requires
that the two widely separated displacement hull/struts be rigidly tied to a central semi-
monocoque deck structure. Critical hull loading response is in the transverse bending
mode where the transverse main deck and wet deck plating is subject to in-plane forces
Chapter 5 - Preliminary SWAT II S tr uc tu ra l D e sig n
204

7/26/2019 1992djatmikophd.pdf
http://slidepdf.com/reader/full/1992djatmikophdpdf 231/507
resulting from bending loads induced through lateral components of hull/strut
hydrodynamic forces. High transverse load suggests a system of transverse framing to
take the bending loads. Transverse framing, however, must be spaced in a way to
reduce production fit-up and cost. The wet deck, in addition to participating in
transverse bending, must also be able to sustain high local impact loads. Regional
normal panel loads
are
expected to be especially severe near the bow where slamming
pressure may be quite high. This in tum drives main deck plating thicknesses upward
to maintain a balanced section to resist transverse pressure loads.
Owing to the critical side force on SWA11Is transverse bulkheads, together with
main and wet decks
are
the primary structures which act in resisting the bending so
resulted. Additionally, transverse bulkheads represent the primary component that
sustain shear stresses which present simultaneously under bending loads.
Unfortunately the small of SWATHs gives rise to considerable shear lag effects and
local stress concentration that do not behave conventionally. Shear lag effect is well
recognised to reduce the effectiveness of plate strip that sustain the loadings. Chalmers
(1989) suggests the amount of effective side shell (be) of about
50
times plate thickness
is expected to act with the bulkheads in resisting bending. Sikora (1988) shows that
effective width of the plating varies over the decks and strut sides. In some cases the
effective width may be approximated by :
b =at~
e V-' -y
( 5 . 1 )
where a is a constant and t is the plate thickness. Faulkner (1992) gives a factor of 1.9
for a, whilst Aronne et al (1974) suggest a factor of 2.0.
To ease these prevalent peak and shear stresses in the bulkhead one can fit partial
transverse bulkheads midway between the existing bulkheads. Investigated by Sikora
and Dinsenbacher (1990), show that inserting partial bulkheads could be expected to
reduce the peak stresses at the critical haunch-wetdeck intersection by 20% and the
shear stress in the upper comer of the transverse bulkhead by 40% (because of the
added shear area). The use of partial bulkheads also results in more uniform stress
distribution in the hull plating due to less critical shear lag effects.
Another problem which the designer should pay attention to is that SWATHs are
potentially vulnerable to failure in the region of strut/sponson to cross structure
attachment. The attachment must be thoroughly designed to eliminate stress
concentrations. Clearly, this is an area of opportunity for future design development.
The cross structure/sponson structure is composed of a series of closed cells which are
expected to have a high degree of torsional rigidity. This rigidity is essential.
Longitudinally varying hull/strut loads will induce a torsional moment along the cross
Chapter 5 -Prelim inar y SWATII S tr uc tu ra l De s ign
205

7/26/2019 1992djatmikophd.pdf
http://slidepdf.com/reader/full/1992djatmikophdpdf 232/507
structure/sponson structure. Accordingly, large penetrations in the main deck above the
sponson must be thoroughly analysed during later design, particularly for comer stress
concentrations in way of the engine box cutouts.
Longitudinal hull girder bending is not typically a significant factor in SWATH
design. In this respect, panel stiffener strength characteristics normally reflect only local
panel pressure loads. Scantlings designed to these loads are normally sufficient to resist
any longitudinal bending and the two maximum conditions of longitudinal and
transverse bending are assumed not to occur simultaneously. Also, since the hulls are
cylindrical, substantial reduction in plate thickness may be obtained, and the combined
plate and stiffener scantlings can be comparatively light. The strut acts like a large
stiffener attached to the lower hull. The overall effect permits use of relatively light
scantlings. Although strength requirements may permit a light structure, consideration
of deflection and vibration may call for higher plate and shape inertias.
Basic design criteria requires material properties and construction standards which
meet current monohull design practice. This objective suggests the use of classification
society standards (or other practices, e.g. the Royal Navy or US Navy criteria) to guide
overall structural design assumptions. However, given the ship's unusual form,
conventional monohull design techniques cannot be applied blindly, and hence some
judgement is necessary in their application. The designer may sometimes have to be
more conservative to acquire a safe design. Malakhoff et al (1991) for instance presents
an analysis on SWA111 ultimate strength which exceeds the maximum lifetime load by
a factor of 2.5. This compares with a factor of 1 .5 for monohulls, but such
conservatism is justified because of the lack of service experience of SWATHs.
Further, it might as well of interest in the following to look at the difference between
the Royal Navy (RN) and US Navy (USN) criteria in SWATH structural design as
described by Stirling et al (1988).
Essentially the difference between the two criteria is that USN approach is
developed on the basis of the working stress design (WSD), whilst the RN apply the
ultimate limit state design (ULS). However, the determination of initial design load for
both criteria is actually adopting the same algorithm which was provided by Sikora et al
(1983). This algorithm gives a side load magnitude for SWATHs which thence to be
transformed into the design extreme expected lifetime transverse bending moment on
the cross structure in order to be compatible with the criteria. For the USN criteria this
design bending moment Mde is factored down by 0.67 to correspond to the
'characteristic' load of monohull which is derived from static balance on wave height
equal to 1.1...j[ (ft), Adopting this condition the corresponding hull girder stress should
not be higher than 40 % of the yield stress of the material
(O.4a
y
).
Lets My denotes the
Chapter
5 -
Pre lim inar y SWATI I S tr uc tu ra l De sign 206

7/26/2019 1992djatmikophd.pdf
http://slidepdf.com/reader/full/1992djatmikophdpdf 233/507
bending moment that incite the material yield stress, hence the WSD criteria may be
written as:
Md
s
M
c
y
(5.2)
To meet the ULS criteria, the same value of Mde as above is factored up
statistically by approximately 1.6 to attain an extreme bending moment value with a
99% confidence (1% probability of exceedance). Such a load factor was derived from
considerations of possible errors which might arise from:
-. the determination of design load algorithm
-. differences in ship life and operability
-. experimental procedures
-. the statistics of the sea and mission profile.
The uncertainties of the above possible errors has been determined by Stirling et al
(1988) which gives a total standard deviation of some 0.255 at 0.99 total mean of the
variables. Further, the 1% probability of exceedance value corresponds to 2.33
standard deviations above the mean value, and may
be
written as
Mdc(a=O.Ol) = 0.99 + (2.33 x 0.255)M
dc
= 1.584M
de
Similar to the reasoning as forwarded by Malakhoff et al (1991) where lack of
experience owing to the novelty of SW ATIl concept thus additional margin of safety
should be given. The RN suggest a 10% safety margin above the design extreme value
will be appropriate. The actual design load confined by the ULS criteria is then given
by:
(5.3)
where Mu is the ultimate bending moment which corresponds to the ultimate strength of
the structure. A brief remarks to the ultimate strength concept may be described by
referring to Rutherford and Caldwell (1990) as belows.
It is believed that the concept of ship girder ultimate strength has been brought
into the attention of naval architect community by Caldwell (1965). The cogitation
behind this concept is to replace the conventional longitudinal strength calculation
which relies solely on the elastic response of the hull girder to a prescribed condition of
wave loading. In this manner the primary measure of hull girder strength is thus
embodied by the section modulus of the structure. Nonetheless, the elastic modulus by
itself might not always be the correct criterion of strength, because structural stability is
also characterised by the resistance to buckling of the compressed members which
highly possible to differ from one structure to another. Therefore, the maximum
resistance of ship structure to applied bending moments should be established on the
Chapter
5 -
Pr elim ina ry S lVAT II S tr uc tu ra l De s ign
207

7/26/2019 1992djatmikophd.pdf
http://slidepdf.com/reader/full/1992djatmikophdpdf 234/507
basis of ultimate strength of the structure in order to obtain the true 'margin of safety'
of a given structure.
The description of ultimate strength on a ship structure may be idealised by the
box girder under longitudinal sagging moment as illustrated in Fig. 5.3. In the course
of the gradual increase in bending moment due to the persistence of , say, progressing
wave, three important stages of structural behaviour will develop. Firstly, when the
magnitude of bending moment reaches a certain yielding will then occur at the deck and
bottom of the structure. In this circumstance the stress distribution at the midship
section will be as shown in Fig. 5.3b. A further increase in bending will lead to the
gradual spread out of yield stress on the side members of the structure. The
corresponding stress distribution, in this designated elasto-plastic zone, will be as
displayed in Fig. 5.3c. Should the load increases even further, subsequently yielding
takes place all over the structure (see the stress distribution in Fig. 5.3d). At this stage
the structure incurs a plastic failure which leads to a total collapse. It should be noted
here that the neutral axis of the cross section similarly changes it positions in
conjunction with the changing of structural characteristics starting from the yield stage.
The three stages can also be presented in a curve of moment M against structural
deflection < p as shown in Fig. 5.3e.
In actual condition the behaviour of the structure under bending moment will not
be as described above. The major difference in this case is that the compressed part of
the structure will experience buckling. In sagging condition the buckled parts of the box
girder will be across the deck structure. The stress distribution at the structural part
above the 'plastic neutral axis' will behave differently, and is characterised by an
irregular distribution of stress as exhibited in Fig. 5.4a. To a certain extent this irregular
stress distribution can be represented by an average uniformly distributed stress as
shown in Fig. 5.4b. In doing so a designated 'knockdown' factor should be introduced
to transform the yield stress into the uniform stress magnitude that represent the
irregular stress distribution. Lets
~D
and
~S
denote the knockdown factors for the
uniform stresses on the upper deck and the side structures, respectively, then the
ultimate bending moment of the structure may be expressed as
(5.4)
where A
=
total area of the cross section
D
=
depth of the hull girder
(lD = ratio of deck sectional area (AD) and total sectional area
= AdA
(ls
=
ratio of side structure sectional area (AS) and total sectional area
= AsIA
Chapter 5 - P relim in ary S W AT II S tru ctu ral D esig n
208

7/26/2019 1992djatmikophd.pdf
http://slidepdf.com/reader/full/1992djatmikophdpdf 235/507
The knockdown factors of T stiffened plate grillages with various slenderness
parameter under longitudinal compression have been forwarded by Faulkner (1965).
Later on Faulkner (1975a) has provided much more information on the compression
strength of plate grillages which can be selected for most practical application in ship
structures.
Further, the resulting ultimate failure of hull girders in the presence of grillage
buckling will be different from that in pure plastic collapse as shown in Fig. 5.3e. It is
as well explained by Rutherford and Caldwell (1990) the ultimate bending moment Mu
will be different in sagging and hogging conditions. The possible moment-curvature
relationships of ultimate failures on ship hull girders can be illustrated as in Fig. 5.4c.
As indicated in that figure, various types of hull girder response are possible as the
curvature is increased, and the maximum moment of resistance can vary
correspondingly between quite wide limits.
The development of analytical study on ultimate strength of ships has rapidly
evolved since the 60s. In the UK development is notably at DRA (formerly ARE)
Dunfermline, e.g. by Smith (1977), Dow et al (1982), and Chalmers and Smith
(1992). The remarkable development of ultimate strength approach in recent years has
been made possible by the wide availability of versatile FEM packages. The
incorporation of reliability method in ultimate strength design has been proposed by
Mansour and Faulkner (1973). The use of reliability method has now become a
common practice in ultimate strength design of ship structures, e.g. as presented by Lee
(1992) and Beghin (1992).
5.3. SWATH STRUCTURAL DESIGN PROGRAMS
Most of the SWATIl structural design programs available are claimed to be useful
only in the early stage of design. In this respect those programs are developed primarily
to synthesise the initial scantlings. In the actual preliminary design these initial
scantlings need to be evaluated further by a more sophisticated design approach, such
as finite element analysis. In addition to those programs, initial scantlings may also be
developed from past experience of a similar craft. Appendix D of this thesis contains a
number of SW ATIl structural arrangements which may provide useful information to
those who intend to design a SWA TIl ship when initial design programs are not
available.
Chapter 5 -P re lim in ar y SWATII S tr uc tu ra l D e sig n 209
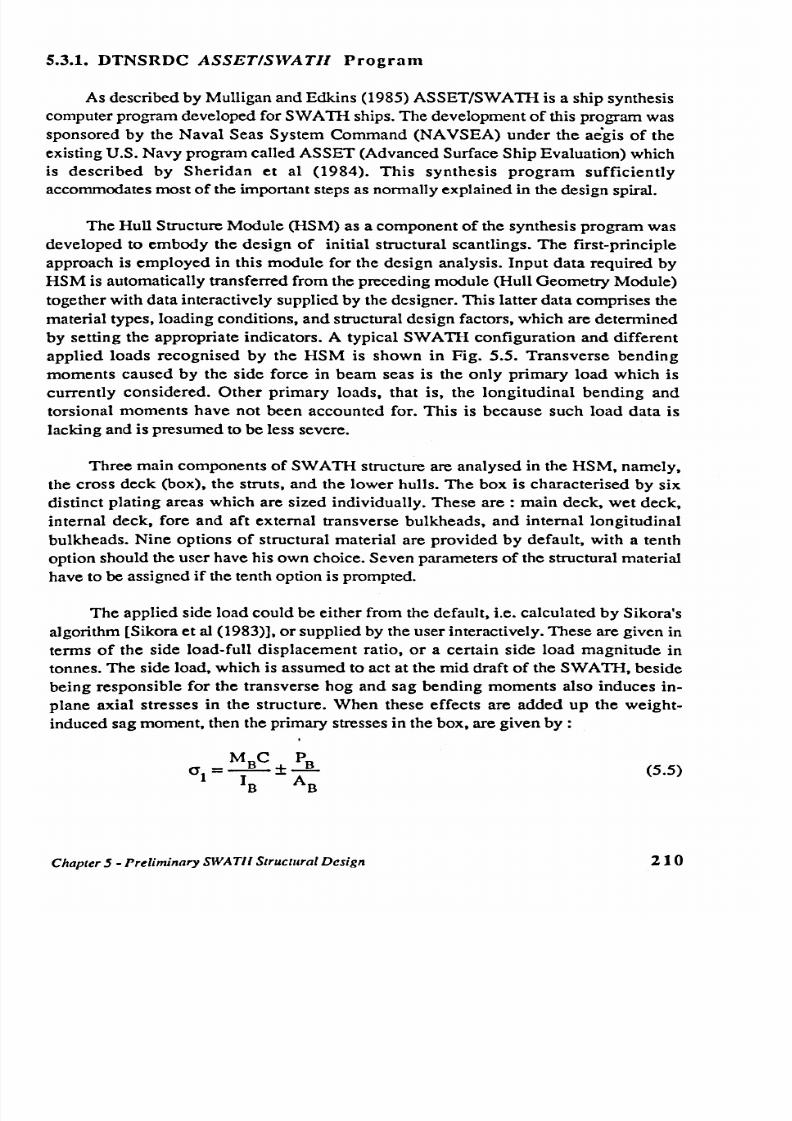
7/26/2019 1992djatmikophd.pdf
http://slidepdf.com/reader/full/1992djatmikophdpdf 236/507
5.3.1. DTNSRDC
ASSET/SWATH
Program
As described by Mulligan and Edkins (1985) ASSET/SW ATIl is a ship synthesis
computer program developed for SWA111 ships. The development of this program was
sponsored by the Naval Seas System Command (NAVSEA) under the aegis of the
existing U.S. Navy program called ASSET (Advanced Surface Ship Evaluation) which
is described by Sheridan et al (1984). This synthesis program sufficiently
accommodates most of the important steps as normally explained
in
the design spiral.
The Hull Structure Module (HSM) as a component of the synthesis program was
developed to embody the design of initial structural scantlings. The first-principle
approach is employed in this module for the design analysis. Input data required by
HSM is automatically transferred from the preceding module (Hull Geometry Module)
together with data interactively supplied by the designer. This latter data comprises the
material types, loading conditions, and structural design factors, which are determined
by setting the appropriate indicators. A typical SWATH configuration and different
applied loads recognised by the HSM is shown in Fig. 5.5. Transverse bending
moments caused by the side force in beam seas is the only primary load which is
currently considered. Other primary loads, that is, the longitudinal bending and
torsional moments have not been accounted for. This is because such load data is
lacking and is presumed to be less severe.
Three main components of SWATH structure are analysed in the HSM, namely,
the cross deck (box), the struts, and the lower hulls. The box is characterised by six
distinct plating areas which are sized individually. These are: main deck, wet deck,
internal deck, fore and aft external transverse bulkheads, and internal longitudinal
bulkheads. Nine options of structural material are provided by default, with a tenth
option should the user have his own choice. Seven parameters of the structural material
have to be assigned if the tenth option is prompted.
The applied side load could be either from the default, i.e. calculated by Sikora's
algorithm [Sikora et
at
(1983)], or supplied by the user interactively. These are given in
terms of the side load-full displacement ratio, or a certain side load magnitude in
tonnes. The side load, which is assumed to act at the mid draft of the SWATH, beside
being responsible for the transverse hog and sag bending moments also induces in-
plane axial stresses in the structure. When these effects are added up the weight-
induced sag moment, then the primary stresses in the box, are given by :
(5.5)
Chapter 5 - P relim in ary SW AT II Stru ctural D es ign
210

7/26/2019 1992djatmikophd.pdf
http://slidepdf.com/reader/full/1992djatmikophdpdf 237/507

7/26/2019 1992djatmikophd.pdf
http://slidepdf.com/reader/full/1992djatmikophdpdf 238/507
5.3.2. US Navy Structural Synthesis Design Program (SSDP)
The structural synthesis design program (SSDP) which was initially developed
for monohull combatants, e.g. as described by Wiernicki et al (1983), has been adapted
.
by Aronne et al (1974) to provide rapid estimates of primary structure weight of
SWATHs. The principal design tool incorporated within the SSDP is a design
computer program developed at NSRDC to optimise the weight of midship section
structures according to accepted US Navy criteria. The program, designated as the
MIDSHIP, employs an iterative procedure and selects spacings for supported structure,
panel sizes, and all scantlings suitable for the applied loads. For SWATH design
purposes, the program was modified to generate an arrangement of transverse section
and a longitudinal section through the bridging structure. Use of the program allowed
assessment of many more design approaches and structural concepts than would have
been possible through manual methods.
Parametric studies have been carried out using the MIDSHIP program on three
different SWATHs, namely, SWATH A,
D,
and C. Several design factors governing
SWATH structural weight were investigated at various levels, as described by Aronne
et al (1974). The initial evaluation on the SWATH-A (4000 tonnes) was directed
toward gaining an understanding of the effect on 'basic' structural weight of varying
transverse web frame spacing and of changing the primary construction material (steel
grades). The study resulted in a 2 ft fram~ spacing and the use of HTS being the
lightest structure, as summarised in Table 5.1.
Referring to the findings from SWATH A the frame spacing for SWATIl B
(4500 tonnes) was fixed at 2 ft spacing and HTS structural material was selected.
Parametric evaluations were then performed by varying the slamming pressure, external
hydrostatic head, distance between strut centres, and transverse bending moment to
attain the least basic weight. The use of hybrid and aluminium as structural materials for
the box component was also examined. Following this a study was made on SWATH
C (5250 tonnes), which was aimed at comparing the structural weight obtained by
different design approaches from other agencies. Detailed observations and results can
be found in a paper by Aronne et al (1974).
Apart from the capability of evaluating the influence of several applied loads and
construction materials, as indicated above, the MIDSHIP program was also organised
to tackle other design aspects as follows. The program allows for variation of geometric
configuration, such as the number of decks and bulkheads, deck heights, strut
thicknesses, and so on. The analysis of tandem strut configuration is also available.
Design of structural segments can be accomplished either with or without stiffeners
taken into account. The program allows for modifications such as the incorporation of
grillage inner bottom design.
C hap te r 5 - P re lim in ary SW AT II S tru ctu ra l D es ig n
212

7/26/2019 1992djatmikophd.pdf
http://slidepdf.com/reader/full/1992djatmikophdpdf 239/507
Another design study using the SSDP was performed by Stevens (1972) on a
4300-tonne SWATH. The versatility of the SSDP and ASSET/SWATH has attracted
other agencies, e.g. in the UK where, according to Pattison et al (1988), these two
programs are currently under evaluation for use within the MoD.
5.3.3. DREA CEM Program for SWATH Ships
A design suite program designated as the Concept Exploration Model for
SWATH ships (SWACEM) was developed by Nethercote and Schmitke (1982) at the
Defence Research and Establishment Atlantic (DREA) in Canada. The earlier version of
CEM has been successfully utilised in this institution for the design of small warships,
as described by Eames and Drummond (1977). SWACEM is a simplified form of ship
synthesis model which addresses the earliest phase of ship selection process. The
model takes as input a set of primary SWATH ship discriptors and simple operational
requirements and calculates from this, ship geometry, stability, performance and other
capabilities. The basic computational blocks are hull definition and stability analysis,
resistance and propulsion, weight estimation and performance analysis. Algorithms are
mostly used in the computational process. The latest refinement of the SWACEM was
reported by Koops and Nethercote (1988).
The structural evaluation contained within SWACEM is limited to the
determination of structural weight A structural density approach is adopted for the box,
strut and lower hull portions of the SWATH. The algorithms for computing the
structural densities have developed from calculations of the weights of plating,
bulkheads, decks, stiffeners and other structural members for a number of SWATH
designs using the US Navy's SSDP. For the box, the structural weight is due to the
outer shell, longitudinal bulkheads. intermediate decks and transverse bulkheads. For
each of these categories an empirical expression has been derived from weight data.
Summation of these individual densities yields the total box structural density. A similar
procedure is followed in the derivation of the lower hull structural density.
Strut structural weight is due to the shell, transverse bulkheads and internal
platforms. An empirical expression gives basic strut structural density as a function of
strut geometry and the number of platforms. Stresses in the strut due to compressive
and side loads are calculated and are used to decide if the prescribed minimum shell and
transverse bulkhead thicknesses (3/8 in and 3/16 in, respectively) need to be increased.
The full expression of structural weight (in tons) for steel structure is written as :
Chapter
5 -
P re lim in ary SWA T il S tru ctu ral D es ig n 213

7/26/2019 1992djatmikophd.pdf
http://slidepdf.com/reader/full/1992djatmikophdpdf 240/507
where wsrn is structural weight margin (an optional input). V
BT'
V
ST
and V
H
are total
box, strut and lower hull volumes. d
BT
,
d
ST
and d
H
are box, strut and hull structural
densities.
5.3.4. UCL SWATH Structural Design Program
A preliminary structural design program adopting a similar approach as utilised in
ASSET/SWA TIl has been developed by Walker (1984) at University College London
(UCL). Smeared thicknesses and weight of major structural elements are outputs of the
system. Only primary wave load is taken into account in the computation, so scantling
sizes, which call for secondary loads, cannot be generated. It is, therefore, the effect of
different framing systems, as well as frame spacings, on structural weight cannot be
examined. Nonetheless, the program facilitates alternative examination of construction
materials for users to select, in addition to the approximation of structural cost which is
determined by using the Carreyette (1977) method.
To allow for realistic stresses at various SWATIl critical regions to be properly
predicted, correction algorithms developed by Sikora and Swanek (1982) are
employed. The correction algorithms to obtain the actual peak stresses account for the
effects of shear lag between bulkheads, stress concentrations due to haunch geometry,
and the combination of shear stress developed locally in the transverse bulkheads. The
peak stress is related to the nominal stress by considering the stress magnification
factor which is written in general form as:
( 5 . 9 )
where coefficients A, B, C, x and m are functions of locations on a SW ATIl cross
section, as shown in Fig. 5.6, and their expressions are given in Table 5.2.
5.3.5.
USCG Small SWATH Structural Design
Holcomb and Allen (1983) adopted the predominantly local pressure loads
in
their
design of small, lightweight structure SWATH OPVs. A computer program was
developed to cater for initial scantling design based on the panel area 'densities'
approach for plating under uniformly pressure loads, as shown by Hadler et al (1978).
The initial scantlings were then checked by applying transverse bending loads and, if
stresses proved excessive, extra material was added at extremities.
Chapter 5.P re lim in ar y SWAT Il S tru ctu ra l D e sig n
214

7/26/2019 1992djatmikophd.pdf
http://slidepdf.com/reader/full/1992djatmikophdpdf 241/507
S.3.6.
Loscombe's Small SWATH Structural Design
Loscombe (1987, 1988. 1989) has focused his work at Southampton on small
SWATIl crafts. i.e. 250 tonnes or less. Specific interest in this study is
primarily
in the
exploration of alternative construction materials other than steel. Aluminium alloy and
GRP are light weight materials which are thought to be the most suitable for small
SWATIls
in
terms of both economics and structural strength.
A set of three computer programs was developed by Loscombe (1987) to
integrate the load calculations. structural design and economic merit evaluations for
small SWATHs. A convenient feature of this is that it can be used on a personal
computer. Rather than using a single maximum lifetime side force for small SWA Tlls,
as suggested by Allen and Holcomb (1982). a side force RAO default is used. A single
design (maximum) global load is then calculated by using the design sea method based
on a two-parameter Bretschneider spectrum. The secondary (slamming) load for
determining the wet deck and haunch scantlings is derived using the method given by
Allen and Jones (1978) or by Sellars (1976). In addition, hydrostatic pressures are
incorporated to determine the scantlings of other structural parts.
The design of SWAm plate thicknesses is treated by small deflection theory
which may be modified by use of a 'large deflection' stress reduction coefficient. This
is then followed by the scantling design in which the required section modulus of plate-
stiffener combinations (PSC) is calculated by treating the component as a built in beam.
subject to a uniformly distributed load. The effective width of the plate flange is
obtained from Faulkner (1975b) as :
~_ 1.1 x 0.85
b -1+2(bxO.85/0.583L)2
(5.10)
where b is the stiffener spacing and L is the stiffener span.
The stress on the primary structures (box, haunch and strut) under a given global
loading is determined, as in eq. (5.5). Should the obtained primary stress exceed a
prescribed design value then the structural dimension(s) is increased. The scantling
sizes are then scrutinised for their secondary and tertiary stresses. The secondary
(stiffener) stress is calculated as :
(5.11)
Chapter
5·
P relim in ary SW A TII S tru ctu ral D esig n
21S

7/26/2019 1992djatmikophd.pdf
http://slidepdf.com/reader/full/1992djatmikophdpdf 242/507
and tertiary (panel) stress as :
(5.12)
where cri = primary stress as calculated by eq. (5.5)
c r2 (c r3 ) =
bending stress under design head on stiffener (plate)
cr'er (o er )
=
elastic buckling stress of stiffener (plate).
The allowable secondary and tertiary stress is defined as the limit stress (yield,
proof or ultimate) divided by safety factor (set at 1.1 for metal and 3 for GRP). If again
the maximum stresses exceed that allowed, plate or stiffener scantlings are incremented
and the calculation repeated.
As inmost SWATIl structural design programs, the option for structural geometry
(arrangement) is restricted. Loscombe (1987) has allotted standard arrangements as
seen in Figs. 5.7a and 5.7b, respectively for small SWA TIls made from, steel or
aluminium and GRP. The structural arrangement for steel or aluminium shown in Fig.
5.7a is typical for small SWATIIs (see Halcyon's design described by Luedeke et al
(1985». Longitudinal framing of the lower hulls and struts is adopted for ease of
construction. Transverse framing of the box is adopted chiefly to sustain the
predominantly transverse nature of primary loads. A non-integrated haunch-box
connection is adopted to facilitate hybrid construction. Single skin construction for the
GRP box was selected due to the uncertainty of assessing the skin-core bond in what
was the critical region of the ship. Elsewhere, sandwich construction was adopted to
give the lightest structural weight
The third (evaluation) program accommodates computations of components of
light weight (structural, machinery, etc) and costings. From some design evaluations
Loscombe (1990) found that structural design of small SWATHs is governed more by
the secondary slamming load rather than the global loads, which is in agreement with
Holcomb and Allen (1983). Encouraged by this aspect, Loscombe (1990) has
developed a simple algorithm for SWATIl design slamming pressure. In general, the
algorithm is suitable to approximate design pressure for small SWATIl, even though to
some extent it also gives a reasonable prediction for larger SWATHs, as examined in
Chapter4.
Chapter
5 •
P relim in ary S W AT II Stru ctu ral D esig n
216

7/26/2019 1992djatmikophd.pdf
http://slidepdf.com/reader/full/1992djatmikophdpdf 243/507
5.3.7. Rule-Based S\VATII Structural Design
Classification rules are undoubtedly the most important guidelines for designers
to consider in their vessel designs. Two aspects in particular are important in structural
design. Firstly, any commercial vessel must have approval from a classification society
before
it
can operate. Therefore, referring to the classification rules in the vessels )
design assures approval is given. Secondly, as a guideline these rules normally contain \
information required in the design, such as loadings, scantlings, criteria, etc. Most of
this information is given in simple algorithms, thus computation can be carried out
rapidly. The introduction of these algorithms, which have to a certain extent been
extensively examined through sophisticated model analysis as well as from real
experience, would obviously ease the design process.
In spite of the convenience offered, one may not always find classification rules
which are intended for a specific design. This is especially so when a novel concept,
such as SWAruships, is to be dealt with. In these circumstance either rules are not
available or they are incomplete. Faulkner (1992) notes that this situation is primarily
brought about the classification societies do not always keep up with new
developments.
Despite the fact that 20 years have elapsed from the time when the concept was
first introduced, there is only one classification rule on SWA Tl'Is available now. Even
so, this rule from ABS (1990) is only a provisional one and is still not extensive for
designers to apply in practical designs. The ABS SWATH-rules will be best if used
together with the 'first principle' structural design procedures such as those described
in the previous sections. These rules indicate loading requirements, adapted from
algorithms developed elsewhere. For example, the primary load derivation is based on
Sikora's algorithm, while the secondary load is derived from the well known Allen and
Jones (1978) method.
Formulation of some structural scantlings is also given, but designers should be
aware of the definitions incorporated. For determining the bulkhead plating, for
instance, a variable is defined as 'distance from the lower edge of the plate to the
bulkhead deck at centre'. For a monohull ship this definition is clear enough. For
SWATIl, on the other hand, 'lower edge' of the bulkhead could be from the bottom of
the lower hull, but
it
may also be from the flat wetdeck or from the bottom of the strut.
Likewise the 'bulkhead deck at centre' is not very clear as to whether this is at the
centreline of the vessel or at the centre line of the lower hulls or struts.
The application of other classification rules are viable provided some restriction is
recognised. Small SWATHs to some extent may be designed using either Dn V (1991)
rules for high-speed and light craft or LR (1990) provisional rules for high-speed
Chapter 5 -Pre lim in ar y SWATII S tr uc tu ra l De sig n
217

7/26/2019 1992djatmikophd.pdf
http://slidepdf.com/reader/full/1992djatmikophdpdf 244/507
catamarans. The susceptibility of small SWATHs' to slamming impact can be
considered as similar to other high-speed small craft. This could be because smaller
SWATHs are normally operated within a limited route of relatively less severe seas,
hence the prevalent side load might not be so crucial as to affect the global strength of
the structure.Therefore scantling requirements as set by those rules might not differ for
SWATHs.Design checks against global loading, however, are strongly recommended.
It is worth noting that most existing small SWATHs now in operation have been
designed, at least by referring to the high-speed craft rules.
5.4. INITIAL SCANTLING DESIGN FOR SWATH SHIPS
5.4.1. Computer Program for Initial Scantling Design
In this section structural design study is put forward emphasising the
determination of the initial scantlings of SWATHs. A case study given shows the
structural analysis of a 2500-tonne SWATH operating in the North Atlantic. A
computer code was written for the purpose of the design study based on the work by )f
Walker (1984). An iterative process is used in the program to allow repetitive .
computations on SWATH scantlings to meet the prescribed criteria. An additional
feature of the program is the capability to examine both analysis based on stress
concentration corrections from Sikora and Swanek (1982) and effective width
approaches. A flowchart of the developed program is shown in Fig.5.8.
In the present computation a SWATIl structure is divided into six main regions,
as shown in Fig. 5.6. The structural breakdown is imposed to separately evaluate the
effect of stress distribution over the individual member of the transverse section of the
SWATH. The stress magnification factors are then applied, depending on the structural
locations, so that the strength criteria is met. The magnification factors are applied to
compensate the effectiveness of the wet deck and main deck platings. In this way
calculation of the sectional properties can then be made by accounting for the actual
dimension of the structure. A design check was also made by considering only a certain
amount of plate strips of the decks and side shells which effectively contribute to resist
transverse bending and shear loads. For this latter approach magnification factors are
not accounted for.
Further assumptions in the present design are as follows. The superstructure is
considered non-effective in sustaining the primary loads. Hence the superstructure
scantlings are designed based on the local load criteria. The box is idealised as a simply
supported beam. Two longitudinal bulkheads are assumed to be positioned over the
Chapter
5 -
P re lim in ar y SWAT II S tr uc tu ra l D e sig n
218

7/26/2019 1992djatmikophd.pdf
http://slidepdf.com/reader/full/1992djatmikophdpdf 245/507
strut haunch/box intersection. The number of strut bulkheads equals that in the box plus
an extra bulkhead forward and aft for damage stability reasons. All box bulkheads are
positioned directly over the strut bulkheads. Fore and aft flares are not calculated,
together with the mid structure, even though 10% extra is given to the final weight due
to these structural members. The haunch angle is taken to be 45 degrees throughout.
Secondary load due to slamming is not taken into account in the present program.
~
The input data required to run the program comprises the main dimensions of the
vessel. Selection of structural material is facilitated for different regions of the structure.
The primary load considered in the analysis may be either interactively given by the
user, or optionally calculated using the algorithm by Sikora et al (1983). The primary
stress calculation is then made by the formulation as shown in eq. (5.5). Variables are
taken as appropriately for the box deck or the struts. Further options are given to the
user once computation is completed. These allow the user to carry out further analyses
for different structural configurations, structural materials, wave load values or
combinations of these. A sample of output data is given in Table 5.3.
5.4.2. Sensitivity Evaluation of Structural Weight
Using the design load derived by Sikora's algorithm, together with the
magnification factors on member stress, yields an overall structural weight of about 954
tonnes for the 2500-tonne SWATH-FV. Whereas computation by imposing the
effective width of deck and side platings results in a substantially higher structural
weight of approximately 1120 tonnes, which some 17% higher than the former. As
mentioned earlier, even though the first approach accounts for stress magnification
factors, the actual scantling dimensions are included in the calculation of sectional
properties. Nonetheless, the structural weight derived by considering the effective
width correlate better with another SWATIl of similar size. For the design of a 2500-
tonne Sonar Support Vessel by Smith et al (1987) was found the structural weight was
found to be 1055 tonnes. The structural weight fraction (ratio of structural weight to
full displacement) for the 2500 SWA TIl-FV is about 0.45 compared to 0.42 for the
SSV. As observed by MacGregor (1989) these values are within the range typical to
SWATIl vessels, i.e. between 0.41 to 0.52. Parametric study by Stirling et al (1988) in
structural design on RN SWA TIl a using three different programs apparently support
this account.
The corresponding value of 0.38 was obtained when the magnification factor
approach is applied. Figure 5.9 illustrates the comparison of structural weight by the
two approaches for various load magnitudes. The relationship is quite linear for both
cases. A change of primary load by ±30% results in an average of only 12.5% change
in structural weight.
Chapter 5·P re lim in ar y SWAT II S tr uc tu ra l D e sig n
219

7/26/2019 1992djatmikophd.pdf
http://slidepdf.com/reader/full/1992djatmikophdpdf 246/507
The effect of different construction materials on the structural weight has also
been examined. The combinations of construction material studied is as listed in Table
5.4. Figure 5.10 presents the computational results in which the percentage of the
weight variation is plotted against the primary load. The reference weight in this case is
taken to be the one obtained by imposing the side load using Sikora's algorithm for
material combination 1 in Table 5.4. As is shown, structural weight decreases only
about 2% when the superstructure is constructed from GRP while retaining B quality
steel for the rest of the structural members. The corresponding structural cost for this
combination (2), as shown in Fig. 5.11, increases by some 12%. Structural
combination 3, for which high stress regions are fabricated out of HY80 steel, only
reduce the structural weight of by around 5%. Unfortunately, the structural cost in this
case increases by around 200%. A significant weight reduction of 37% can be attained
by combination 4 where aluminium is used in the regions 1,2 and 3A. The additional
cost required for this combination 4 is in excess of 60%. Retaining aluminium for the
construction of those regions, and combining with HY80 steel for high stress
members, may result in a 39% weight reduction. However, this is only 2% less than
the former one while structural cost becomes 120% higher than the reference cost.
These comparisons suggest structural combination 4 should be the best choice for
designers.
Another interesting comparison is seen from the effects on structural weight by
modifying the vessel particulars. It is not the intention here to suggest any modification
of ship's main parameter to achieve an acceptable weight saving, rather it is to
emphasise that such action is prohibitive. The reason is obvious that modification in
ship's parameter could likely jeopardise its hydrodynamic performances and possibly
other main features without much benefits, as demonstrated in the following.
The two parameters to be altered are the maximum beam of the vessel and the
deck clearance. For the first case, the computational output has been plotted, as shown
in Fig. 5.12. It is seen from this figure that altering the maximum breadth of the vessel
is quite beneficial. To acquire some 8% reduction in structural weight the designer
would need to reduce the maximum breadth by approximately 5 metres. This means
around 540 m
2
of useful deck area (about 21% of the initial area) has to be sacrificed.
The corresponding useful deck volume loss in this case is about 710 m
3
, and can be up
to 983 m
3
if the volume under the double bottom is considered. The gain in minimising
structural cost is equally unpromising. Cost saving attained by 8% weight reduction
may not be higher than 10%.
Similar results unfortunately apply when box clearance alteration is attempted. as
can be seen in Fig. 5.13. An approximately one metre deck clearance reduction (22%
from original) gives only 9% less weight, with cost saving gained is about 11%. On
Chapter
5 -
P re lim in ar y SWAT II S tr uc tu ra l D e sig n
220

7/26/2019 1992djatmikophd.pdf
http://slidepdf.com/reader/full/1992djatmikophdpdf 247/507
top of that, reducing deck clearance would increase the susceptibility of the SWATH to
slamming loads. There is then a trade off in increase of wet deck scantlings. From a
further evaluation, the same amount of weight saving (8-9%) is shown to be achievable
by the addition of transverse bulkhead, as shown in Fig. 5.14. Moreoyer, such
additional bulkhead will improve shear lag characteristic of the structure. Hence this
method is favourable for the designer.
5.5. DISCUSSION
The study presented in the foregoing could only be expected to be useful in the
very early design process. Many more improvements still need to be pursued in future.
The present code is only developed to tackle the design of SWATHs with single strut
per hull configuration, hence modification to account for tandem strut forms is
necessary. A further improvement ought to be made by including the secondary
slamming loads for the determination of wet deck scantlings. The pressure design can
be obtained by empirical methods, as given in Chapter 4. The pressure data is then to
be associated with various plate strength criteria, e.g. as introduced by Clarkson
(1956). The plate and stiffener sizings are finalised to satisfy the corresponding criteria
in relation to modes of plate panel collapse. Many high speed craft designs have
adopted such an approach, as well as by referring to the society rules. Examples of
bottom structure design by the first principle can be found in papers by Heller and
Jasper (1961), Spencer (1975), Drummond et al (1976), and Henrickson and Spencer
(1982).
The lower hull design calls for a more reliable tool if a realistic solution is to be
gained. Some approaches practised for semi-submersible offshore structures generally
are in favour with the scantling design of SWATH lower hulls. Some design methods,
as developed by Bose (1982) or Penney and Riiser (1984), may be considered in
commencing a more rigorous SWATH design. The cost analysis incorporated in the
present program is also limited to the data for 1984. More updated information is
therefore necessary if accurate structural cost estimation is to be achieved. Recent cost
data for steel structure, as provided by Buxton (1987), may be considered to revise
those presently adopted. Loscombe (1988) has made cost data available for other
structural materials. The development of cost analysis for the latter is based on the work
by Smith and Monks (1982).
As important as those rigorous approaches is information in the form of
simplified algorithms which may be applied in the early stage of structural design.
MacGregor (1989) has diligently gathered SWATH structural data and analysed this to
derive simple expressions of various parameter correlations for SWATH structure.
Chapter
5.
P relim in ary S WA TII Stru ctu ral D esig n
2 21

7/26/2019 1992djatmikophd.pdf
http://slidepdf.com/reader/full/1992djatmikophdpdf 248/507
These expressions include, among others, structural densities, stiffened area densities
for wet decks, and simplified lower hull weight formulation. Also found in that
reference are the compartment lengths, transverse frame spacings, wet deck scantling
proportion etc, which are normally applied to SWA111 designs.
One of the best examples that ought to be targeted within SWATH research is an
integrated hydro-structural design tool as was established at JAMSTEC/Mitsui.
Takeuchi et al (1985) present this design program, which eventually incorporate
various sophisticated analysis. The package program pertinently contains sub programs
for determining the global-structural loads by a 3-dimensional theory, a finite element
package for stress analysis, and a versatile program for the evaluation of ultimate
strength. In addition to this, a sub-program to generate the secondary slamming load is
also embodied in the design suite. The determination of relative vertical velocities and
the corresponding impact pressures are synthesised in a ship motion program which
includes also algorithms of pressure loads from various sources.
5.6. CONCLUSIONS
A SWATH structural design study has been presented in this chapter by first of
all indicating generic attributes of this type of vessel. Design procedures for such
vessels should not differ from those traditionally practised for monohull ships. Some
design criteria may also be adapted from monohull, but further evaluation is necessary.
A review of SWA TIl design methodology evolved at some institutions was made to in
developing the study.
A computer program was subsequently written to facilitate structural calculation
which is iterative in nature. Some of the early findings have been presented. The
primary comparison was to identify the differences between the magnification factor
and effective width approaches on the resulting design values. A relatively large
difference in structural weight (around 17%) is found from the two computations.
Nevertheless, the effective width approach yields a comparatively better estimate of
structural weight fraction when referring to another design of SWATIl. A value of 0.45
is obtained in the present design on the SWA 11I-FV compared to a 0.42 for the SSV.
Note that both vessels are 2500 tonne in displacement. The corresponding value
derived by the magnification factor approach is of the order 0.38.
A parametric study has been conducted in which the primary load is altered by
±30% from a given standard maximum value. In this wayan average change of 12.5%
in structural weight results. The discrepancy is quite large if compared to the
observation by Aronne et al (1974). From their study it was found that altering the
primary bending moment by ±50% only resulted in approximately 5% change of
Chapter 5 -P re lim in ar y SWATII S tr uc tu ra l D e sig n
222

7/26/2019 1992djatmikophd.pdf
http://slidepdf.com/reader/full/1992djatmikophdpdf 249/507
structural weight. This is obviously an area which needs to be pursued further. The
parametric study follows with an investigation of the use of lightweight materials in
SWA111 construction. Aluminium-steel hybrid structure seems to be the best choice for
the designer. By adopting such a combination some 37% weight saving is achievable,
while the increase in structural cost is acceptable. An attempt to attain a respectable
weight saving by the conversion of the primary configuration (maximum breadth or
deck clearance) would not be beneficial. Additional transverse bulkheads would gain
some weight reduction, in parallel to the improved shear lag characteristics.
Chapter
5 -
Pre lim in ar y SWATII S tru ctu ra l De sig n
223

7/26/2019 1992djatmikophd.pdf
http://slidepdf.com/reader/full/1992djatmikophdpdf 250/507
Table S.la. Summary of 'Basic' weights and densities for Ship A,
HYlOO and different frame spacings
Nominal Weight in Tons Density (lbs/cu
It )
Transverse
(Steel-HY100)
Frame Spacing
Bridge
Struts
Lower Total Bridge
Struts
Lower
Total
(feet)
Structure Hults Structure
Huns
16.20
1128.00
664.00 634.00 2426.00 6.61
9.46 11.81 8.24
5.00
1121.00 536.00 319.00 1976.00 6.56 7.65
5.95 6.71
4.00
1001.00
483.00
303.00
1787.00 5.86 6.89
5.65
6.07
3.00
982.00
444.00 298.00
1725.00 5.75
6.33
5.56 5.86
2.00
1032.00 405.00 301.00 1738.00
6.05 5.78
5.60 5.90
Table 5.1b. Summary of 'Basic' weights and densities for Ship A,
3-foot transverse frame spacing and different materials
Type
Weight in Tons Density (lbs/cu ft)
of
Material
Bridge
Struts Lower Total
Bridge Struts Lower
Total
Structure
Hulls
Structure Hulls
MS 870.00 533.00 379.00 1782.00 5.09 7.60 7.06 6.05
HTS
843.00
470.00
326.00
1639.00
4.94
6.70 6.08
5.56
HTS (2 ft)
811.00 420.00
299.00
1530.00 4.75
6.00
5.55
5.19
HY80
878.00 451.00
308.00 1637.00
5.14
6.43
5.73
5.56
HY100
982.00
444.00
298.00
1725.00 5.75
6.33
5.56 5.86
Table 5.4. Combinations of structural material for
structural weii:ht observation
Combination
1
2
3
4
5
Region
1
Ml
M2
Ml M3 M3
Region
2
Ml Ml
M4
M3
M3
Region 3A
Ml Ml
M4
M3
M3
Region 3B
Ml Ml
M4
Ml
M4
Region 4
Ml Ml M4 Ml
M4
Region
5
Ml
Ml Ml
Ml Ml
Region
6
Ml Ml
Ml
Ml Ml
Ml : B Quality Steel
M2: GRP
M3: Aluminium NP8N
M4: HY80 Steel
Chapter 5 - P re lim in ary S lV AT II S tru ctu ral D esig n
224

7/26/2019 1992djatmikophd.pdf
http://slidepdf.com/reader/full/1992djatmikophdpdf 251/507
Table 5.2. Magnification factors to the nominal stress for several critical locations
on SWA
TI-I
cross structure [Sikora and Dinsenbacher (1990)]
Point A - Centreline longitudinal bulkhead-transverse bulkhead-main deck.
Factor
=
A(mx
C
+
b)R
where x = 0 at centreline. y = 0 at transverse bulkhead (spacing TBS)
A = 0.831 + 2.803 (fBS/BHC) where BHC is hull centreline spacing
m
= 0.41 - 0 . 6 2 5 . . J y
b
=
0.579 - 0.194y
R = 0.99 - 0.14y2
C=2
Factor A
=
0.573 (0.831
+
2.803 TBS/BHC)
Point n -Transverse bulkhead-main deck (inboard of outboard longitudinal bulkhead)
Factor = A(mx
C
+ b)R
x
= 0.8, Y = O. C = 2.
m
= 0.41, b = 0.579. R = 0.9004
Factor B
=
0.757 (0.831 + 2.803 TBS/BHC)
Point C - Outboard longitudinal bulkhead-transverse bulkhead-main deck
Factor
=
APR
o
this factor allows for the effect of an insert plate where
t
= thickness of insert plate.
t o =
thickness of parent plate. and
t l t o =
1.5 is assumed
P
= 1.96 - 0.96
Vtlto
R O
= 0.85
A = 1.831 + 2.803 (fBS/BHC)
Factor C
=
0.667 (0.831
+
2.803 TBS/BHC)
Point D - Outboard longitudinal bulkhead-transverse bulkhead-wet deck
Factor =A(mx
C
+ b)R
A = 1.829 + 6.114 (fBS/BHC)
x
= O. y
=
O. C
=
2
m
= 0.716.
b =
0.276.
R =
1.15
Factor D = 0.317 (1.829 + 6.114 TBS/BHC)
Point E - Transverse bulkhead-wet deck (inboard of outboard longitudinal bulkhead)
Factor
=
A(mx
C
+ b)R
A
=
1.829
+
6.114 (fBS/BHC)
x =
0.8. y
=
O. C
=
2
m =
0.716. b
=
0.276. R
=
0.958
Factor E
=
0.703 (1.829
+
6.114 TBS/BHC)
Chap te r
5·
P re lim in ary S W AT ll S tru ctu ral D esig n
225

7/26/2019 1992djatmikophd.pdf
http://slidepdf.com/reader/full/1992djatmikophdpdf 252/507
Table 5,2 Contd,
Point F -
Outboard longitudinal bulkhead - transverse bulkhead-wet deck
Factor
=
APRo
A
=
1.829 + 6,114 (fBSIBHC)
t
=
thickness of insert plate, t o
=
thickness of parent plate, and tlto
=
1,5 is assumed
P = 0.784, RO
=
0,91
A = 1.831 + 2.803 (TBS/BHC)
Factor F = 0.714 (1.829 + 6.114 TBS/BHC)
Point G -
Outer haunch/strut knuckle - strut platform deck - transverse bulkhead
Factor =APRo
A
=
1.198 + 1.784 (TBS/(T+BC+DB-DH)}
t
=
thickness of insert plate, t o
=
thickness of parent plate, and tlto
=
1.5 is assumed
P = 0.784, R O = 1.14 - 0,09 (rffS)
rrrS = 0.5 where r is the radius of the strut inner shell
A = 1.831 + 2.803 (TBS/BHC)
FactorG
=
0.858 (1.198 + 1.784 TBS/(T+BC+DB-DH)}
Point II -
Outer strut sideshell- transverse bulkhead (below strut platform deck)
Factor =A(mx
C
+ b)R
A
=
1.198 + 1.784 (TBS/(T+BC+DB-DH)}
x = 0.8, y = 0, C = I, b = 0, m = 0.923, R = 1.149
Factor H = 0.848 (1.198 + 1.784 TBS/(T +BC+DB-DH)}
Point K - Inner haunch/strut knuckle - strut platform deck - transverse bulkhead
Factor =APRo
A
=
4.212 - 0.182 (TBS/(Strut Depth)}
t
=
thickness of insert plate,
t o =
thickness of parent plate, and tlto
=
1.5 is assumed
P
=
0.784, Ro
=
1.17
Factor K = 0.917 (4.212 - 0.182 TBS/(Strut Depth)}
Point L - Inner haunch/strut knuckle - transverse bulkhead (below platform deck)
Factor =A(mx
C
+ b)R
A
=
4.212 - 0.182
(TBS/(Strut
Depth)}
x
=
0.8, y
=
0, C
=
1, b
=
0, m = 0.996, R
=
1.19
Factor L
=
0.951 (4.212 - 0.182 TBS/(Strut Depth»
Chapter
5 -
P re lim in ar y SWAT II S tr uc tu ra l D e sig n
226

7/26/2019 1992djatmikophd.pdf
http://slidepdf.com/reader/full/1992djatmikophdpdf 253/507
Table
5.3.
S am ple of output data from initial scantling design program
* *
I NI TI AL STRUCTURAL DESI GN F OR SWATH
* *
NAME OF THE VESSEL
MI SS I ON
OPERAT I ONAL AREA
SWATH - FV
OCEANO RESEARCH
NORTH ATLANT I C
* * * * *
SWATH CONF I GURAT I ON NO
SWATH PARTI CULARS -
DI SPLACEMENT -
OVERAL L L ENGTH -
MAXIMUM BEAM -
DRAUGHT
=
BOX DEPTH -
1* * * * *
2 467. 00 t onnes
57. 2 0
m
2 5. 60 m
8. 2 0
m
3. 60
m
BOX CLEARANCE - 5. 10 m
STRUCTURAL WEI GHT FRACTI ON - 0. 40
SUPERSTRUCTURE LENGTH - 20. 00 m
SUPERSTRUCTURE BREADTH - 18. 00 m
NUMBER OF AI C HANGERS - 1
NO. OF DECKS I N BOX
=
1
NO. OF TRANSV. BKHDs i s 7 at 9 . 53 m spac i ng ( I NCLUDI NG ENDS)
NO. OF LONGT. BKHDs I N BOX - 3
LENGTH STRUT NOSE - 4. 60 m
LENGTH STRUT CENTRE - 36. 40 m
STRUT THI CKNESS
LENGTH STRUT TAI L -
NO. DECKS I N STRUT -
- 3. 00 m
4. 60 m
3
NO. TRANSV. BKHDs STRUT - 7
L ENTI CULAR STRUT NOSE
DI AMETER OF HULL - 5. 10 m
LENGTH OF HULL - 54. 65 m
MATERI ALS SELECTED
»»»»»»»»»
REGI ON 1 ( SUPERSTRUCTURE) BQUAL I TY STEEL
REGI ON 2 ( BOX UPPER DECK AND I NTERNAL STRUCT) BQUAL I TY STEEL
REGI ON 3A ( LOW STRESS REGI ON OF BOX WET DECK) BQUAL I TY STEEL
REGI ON 3B ( HI GH STRESS REGI ON OF BOX WET DECK) BQUAL I TY STEEL
REGI ON 4 ( HI GH STRESS REGI ON OF STRUT AND HAUNCH) BQUAL I TY STEEL
REGI ON 5 ( LOWER STRUT) BQUAL I TY STEEL
REGI ON 6 ( HULL ) BQUAL I TY STEEL
WARNI NG- MATERI AL SEL ECTED MAY RESUL T I N STRUCTURAL WEI GHT
FRACTI ON EXCEEDED I N BUI LD
Chapter 5 - P re lim in ar y SWATII S tr uc tu ra l D e sig n
227

7/26/2019 1992djatmikophd.pdf
http://slidepdf.com/reader/full/1992djatmikophdpdf 254/507
T able 5.3 C ontd.
RESULT OF THE I NI TI AL DESI GN ANALYSI S
»»»»»»»»»»»»»»»»»»»>
DESI GN SI DE FORCE F
=
15. 09 MN
TRANS. B. M. OCCURS I N SAG CONDI TI ON AT BOX CENTRE
=
186. 11 M N m
TOTAL STRUCTURAL WEI GHT = 953. 82 t onnes
SUMMARY OF SMEARED THI CKNESSES AND STRESSES
REGI ON
TSM
( mm)
STRESS MAX. PRI MARY
(MPa)
ALLOW WORKI NG
2
3A
3B
4
7. 00 - 117. 2 0
23. 00 46. 17
23. 00 143. 23
18. 00 125. 08
147 . 00
147 . 00
147. 00
147. 00
2 62 . 00
2 62 . 00
2 62 . 00
2 62 . 00
- - - - - - - - - - - - - - - - - - - - - - - - - - - - - - - - - - - - - - - - - - - - - - - - - - - - - - - - - - - - - - - - - - - -
OTHER SCANTL I NGS :
BOX TRANS BULKHEADS . . .
STRUT TRANS. BULKHEADS -
5. 0
mm
6. 0
mm
BOX LONGI TUDI NAL BULKHEADS' 8. 0 mm
BOW TRANSOM, SI DES -
BOX AND STRUT DECKS -
LOWER STRUT SHELL -
HULL PLATI NG -
10. 0
mm
6. 0 mm
10. 0 mm
10. 0
mm
WEI GHT OF STRUCTURAL ELEMENTS :
SUPERSTRUCTURE -
BOX -
STRUTS-
HULLS-
32 . 8 t onnes
412 . 5
t onnes
42 0. 1 t onnes
88. 4 t onnes
COST -
COST . .
COST
=
COST -
0. 7 Mil.
Pds.
5. 4
Mi l .
Pds.
3. 1 Mi l .
Pds.
1. 1 Mi l .
Pds.
BREAKDOWN OF STRUCTURAL WEI GHT
PRI MARY - 848. 9 ( 86. %
SECONDARY - 104. 9 ( 11. %)
MI NOR -
33. 0 ( 3. %)
APPROXI MATE COST OF STRUCTURE -
10. 3
Mi l l i on Pounds
N. B . Based on pr oc ur ement and l abour c os t s - I nc l udi ng mar gi ns .
Cos t r es ul t s s houl d onl y be us ed as a bas i s f or c ompar i s on
bet ween s t r uc t ur al and mat er i al opt i ons dur i ng par amet r i c
s t udy.
Chapter
5 -
P re lim in ar y SWAT II S tr uc tu ra l D e sig n
228
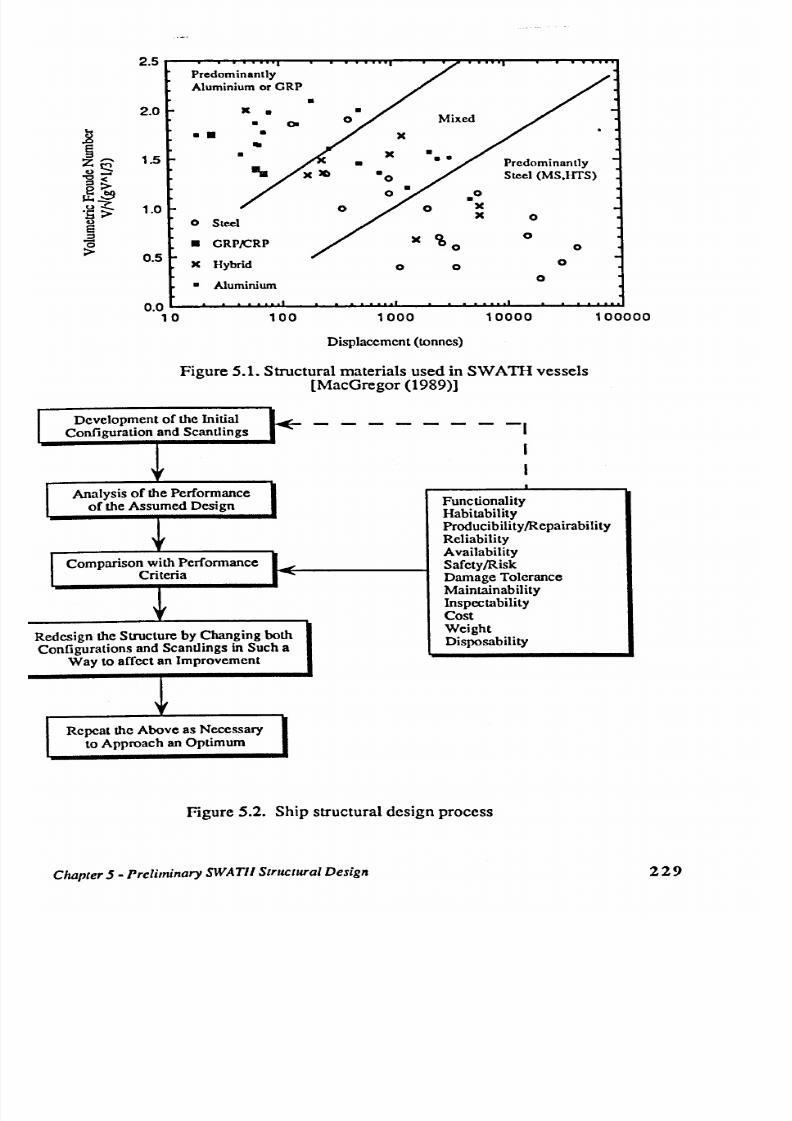
7/26/2019 1992djatmikophd.pdf
http://slidepdf.com/reader/full/1992djatmikophdpdf 255/507

7/26/2019 1992djatmikophd.pdf
http://slidepdf.com/reader/full/1992djatmikophdpdf 256/507
c:
0
';:I
]
~
l:I
. .
~
: a
. .
:g
g
. . . .
o
0
. . .
g ~
u
~
U
';:I
. .
~
~ 'ii
: a
~
~
1 ,~
.?;o
§,;
~
g
• Q
. . . . . . .
~~
: s . .
Cl)
-
~
1 1 . 1
u,a
. .
J
~
. . . . . . .
i
g
';:I
bI)
0..
> -
.8
.~
~
~
'~
: a
bI)__..
. .
~V)
i
... \0
a)0\
u
0 ....
';:I
c::--
. . .
: : 2 : : : l
.
g.
' a)
a
. g : : t
f 3
. 6 b ~
1
. . . . . . .
..:u
.s
0......
~
00
~
,B
vi
00
00
> - {
~
:I
S I
I
\
.~
f~
r . . I . o
,
,
,
- ' I
,~
,
v '
,to
.§
00
IC
l:I
•
c 8
,~
,
.
•
. . . . . . .
. .
•
~
. .
u
•
iii
•
u
.
';:I
.
.
=
,ij
e ;
Chapter 5.P re lim in ar y SWATII S tr uc tu ro l D e sig n
230
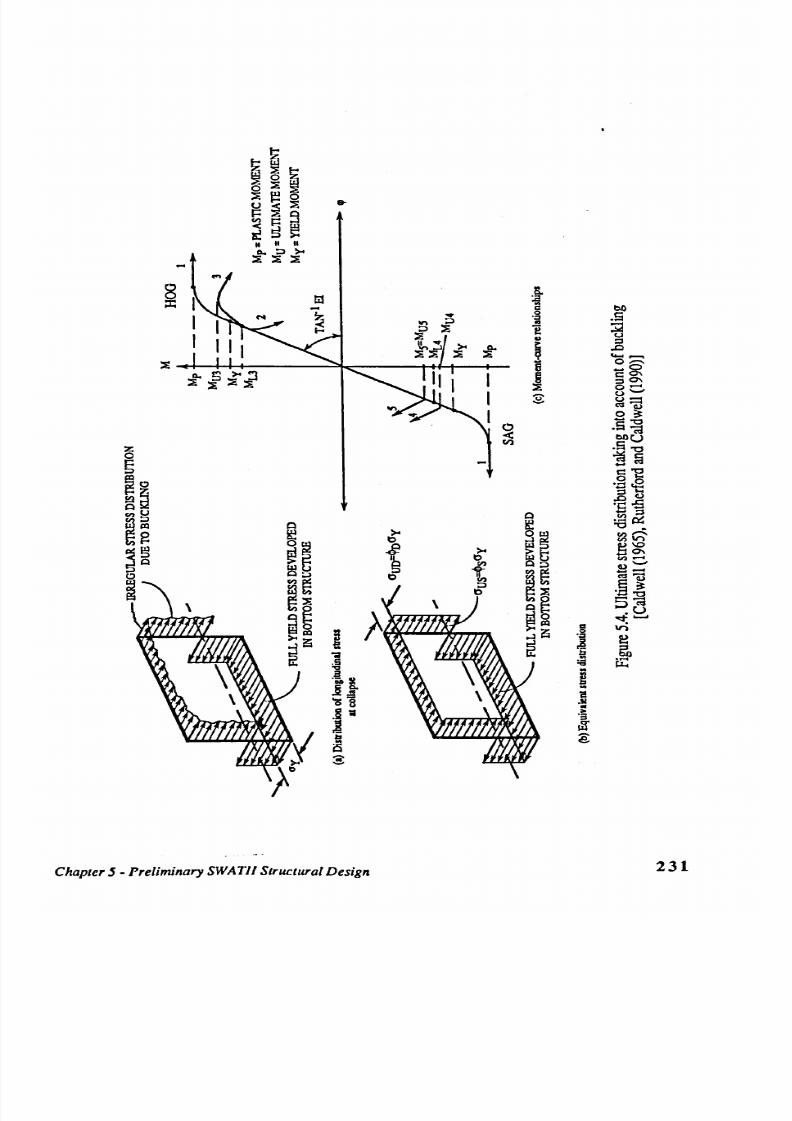
7/26/2019 1992djatmikophd.pdf
http://slidepdf.com/reader/full/1992djatmikophdpdf 257/507
~ E
~ 8 ~
c 5 : : s ~
: : s ~
0
•
~ : : s
E i 1 = 9
~ 5 ~
n II
C o . :J > -
. . .
: : s : : s
: : s
8
S o
~
: a
. .
C l
bI)
o g
. S
~
= B
)
i
::l
.0
: : s
. . . . . . . . . .
0........
~~
I
30\
0-
s
u-
u::=
~ Cl)
o ~
0
'0
- e
.s~
: z :
V)
bIlU
0
.S '0
§
' M f a
~~
§'E
· a . g
, S C I )
C l ) g
e : : l
'E~
~ g
e : : l
~
: a ~
8 :
> -
Cl ) . . . . . . . .
~~
\:)
~~
Cl ) 1 r )
~~
1
~~
Cl) ... .
u-
~
~L~
~
. . . . . . . . .
CI)~
e
~ . . . . .
.§ ~
~ : : s
~~
s~
~~
.U
~ . . . . . . .
I
Cl
vi
..J~
0
0 :1
~
..J~
~
.§
~
. .
: J
6 h
0 5
. .
~
: a
o ~ l
. .
.
~
j ..
. .
'38
i
.J I
o ~
'iii
. .
.
0 3
,;
M
~
~
i s
8
Chapter 5 - P re lim in ar y SWATII S tr uc tu ra l D e sig n
231

7/26/2019 1992djatmikophd.pdf
http://slidepdf.com/reader/full/1992djatmikophdpdf 258/507
BULKHEAD
STIFFENE S
I f '
BOXfEPTH
H
(a) ST RU CT UR AL C ON FIG UR AT IO N
WL
SIDEFW:O
MS
~~S
(b) PRIM ARY LOADS AND FORCES
1 1 ( . . F
WL
(c) SECO NDARY LOAD S
Figure
S.S.
S W ATH structural co nfig uration an d load ing co nd itio ns
[M ullig an an d E dk in s (1985)]
Chapter 5 - P re lim in ar y SWATII S tr uc tu ra l D e sig n
232

7/26/2019 1992djatmikophd.pdf
http://slidepdf.com/reader/full/1992djatmikophdpdf 259/507
r-
l
A
~-----------------BB------------------~~
u
Definitions;
1. Superstructure
2.
Box weatherdcck andintemal structure
3A. Low stress region of box wet deck
3B. High stress region of box wet deck
4. High stress region of upper strut and haunch
S.
Lower strut
6. Lower hull
a
=
{BB-O.2(BB+llTS)}12
b = (O.I(BB+llTS)-1.STS}12
c
= O.2(BC+ T -DH)+O.8TS
d
=
O.7DH-O.2T+O.8(BC-TS)
F igure 5.6. D efinition of structural regions and location in
cro ss structure of po in ts of stress calculation
[W alker (1984), S ikora and D insenbacher (1990)]
Chapter 5 - Pre lim in ary SWATIl S tru ctu ra l De sig n
233

7/26/2019 1992djatmikophd.pdf
http://slidepdf.com/reader/full/1992djatmikophdpdf 260/507
B R I DC I NG S T R U C T UR E ( T RA NS VE RS E L Y r R A NE D)
( 1) BRA C K
t
T
r
RA
- - S T R U T ( L O . C I T UDI . A L L I ' R A NE D)
L OV E R R UL L ( L ON C I T U DI NA L L Y r R A N E D)
0000
PLATE rRAME
( 2 ) P L A T
t
F R A H
t
V E B F R A NE
Figure S.7a. Standard arrangem ent for sm all SW ATIIs constructed out of
steel o r alum inium [L os c om be (1987)]
<,
C R P t ophat at l r r ener
( oyer non- a t r uc t . ur el r or . er )
C R P V E B F R A H E ( t ophat oyer non- at r uc t ur al r or . a r )
Sandwi c h c onat . r uc t l on
F igure S.7b. Standard arrangem ent for sm all SW A TH s constructed
out ofGRP [Loscom be (1987)]
Chapter
5 -
P re lim in ar y SWAT II S tr uc tu ra l D e sig n
234

7/26/2019 1992djatmikophd.pdf
http://slidepdf.com/reader/full/1992djatmikophdpdf 261/507
IN PU T SW A TIl C ON FIG UR A nO N
e a .
Dim .ion ••
No. orbkhds.
etc
YES
CALCULAl l WAVB
INDUCED
LOADING
B Y S IK OR A'S A UlO Rm 1M
I
~ ...
.......-..~.I
I
ES
I
I
I
I
I
I
IN CR nM B NT S CA NT LIN G S
NO
C ALC ULA TE W EIG l ITS A ND C OSTS
ADDmONAL
CALC.
USING
ALTllRNATIVB
MATERIAL
Figure
5.8.
Flow chart diagram of the program to determ ine
initial scantlings o f S WA TH vessels
Chapter 5. P re lim in ar y SWATII S tr uc tu ra l D e sig n
235

7/26/2019 1992djatmikophd.pdf
http://slidepdf.com/reader/full/1992djatmikophdpdf 262/507
1400
DTRC stress cone. correction
•
Effective width approach
1300
. . . . . .
~
1200
g
. . .
. c : :
. : l
~
1100
~
~
C,)
1000
. 6
Cl)
900
800~~~~~~~~~~~ _~~~~~~~~~~~
t S O O O 10000 16000
20000
2000 14000
18000
Side Force
(leN)
F igure 5 .9 . Compa ris on o f s tru ctu ra l we ights from stre ss concentra tion
and e ff ec tive width approaches
120
. . .
110
c
bI)
~
v
100
,)
5
~
~
90
. . . .
0
~
80
. S
. . .
.c
bI)
~
70
~
60
,)
. 6
Cl)
i
. . . . . . . . : : : : : :
b@
~
I
i
~
~
~
-
.
~
)t
......
.- . . . . .
_
. . .
., . ....
. . . -'
..... .- ...... C
o-.-~ r--
. . . . . . . .
_ _ .. - . . . . . . .
. . . . . . . . .
::
- --
C
I
i
: :
:.-. . . . .
i
50
HOOD
1 0000 1 2 000
14000 16000
18000 20000
Side F o r c e (kN)
Figure
5.10.
E ffe ct o f construction mater ia l combina tions
on the stru ctu ra l we ights
Chapter 5 - P re lim in ar y SWATII S tr uc tu ra l D e sig n
Combination 1
Combination 2
- - .. - Combination 4
M
Combination 3
- - .. - Combination 5
236

7/26/2019 1992djatmikophd.pdf
http://slidepdf.com/reader/full/1992djatmikophdpdf 263/507
400
. . . .
~
u
8
300
c:
~
~
Q)
~
. . . .
0
~
200
. 5
. . . .
Cl)
8
~
100
u
E
Cl)
0 -
u
98
~
~
Q)
~
. . . .
0
96
~
-
. .
~
U
~
94
. .
.c
bI)
~
'E
92
:I
. . .
U
g
Cl)
~
~
,:._.,c.
~
~
~
. . - _ .
...
JI
. . . . . . . .
. , . _
. .
1- . . .. . .
- - -
1-- ,
- -
----.
•
- - , , -
,
~
. .
_. . . - . .
. _ r r r
--. . . . . . . .
--..---
•
:
-
,
·
•
:
o
8000
16000
2000 14000 18000
0000
Side Force (kN)
F ig ure 5 .11 . E ffe ct o f co nstruc tio n ma te ria l c omb in atio ns
o n th e structural costs
90L- _' - - ~~- - ~~- - ~~~~~~~- - ' _- L- - ' _~
19
20
21
25
2 23 24
Max imum Breadth , Bmax (m )
Figure 5.12. E ffect of change in m axim um breadth to
structural w eigh t an d co st
Chapter
5·
Prelim ina ry S lVAT lI S tr uct ural De s ign
Combination 1
Combination 2
- - • - Combination 4
M Combination 3
- - • - Combination 5
20000
26
237

7/26/2019 1992djatmikophd.pdf
http://slidepdf.com/reader/full/1992djatmikophdpdf 264/507
110
III
Weight
•
Cost
g
100
e
1
£
0
t : t : : :
. . . . .
0
1-
t +
90
. S
1;;
8
< . I i
. . .
.c
80
I)
~
100
-
98
~
~
~
96
. . .
0
~
-;;
94
8
~
. . .
fa
92
'i)
~
]
90
E
til
I
,
I
eight
Cost
/.
-
/
Y
~
/
II
.
-
V
-
.
~
88
3. 8
4. 0
4. 2
4. 4
4. 6
4. 8 5. 0
5. 2
Box Clearance (m )
Figure 5.13. Effect of change in box clearance to
structural w eight and cost
70~~~~~~- - ~~~~~~~~~~~~~~
tiOOO
10000 12000 18000 200004000 16000
S id e Forc e
(kN)
F igure 5.14. E ffect of additional one transv erse bulkhead
to structural w eight and cost
Chapter
5 -
P relim in ary S W A TII S tru ctu ral D esig n
238

7/26/2019 1992djatmikophd.pdf
http://slidepdf.com/reader/full/1992djatmikophdpdf 265/507
CHAPTER6
FATIGUE PERFORMANCE OF
SWATH SHIPS

7/26/2019 1992djatmikophd.pdf
http://slidepdf.com/reader/full/1992djatmikophdpdf 266/507
CHAPTER6
FATIGUE PERFORrvfANCE OF S\VATH SHIPS
6.1. INTRODUCTION
Fatigue performance of a structure generally is measured by its capability to
sustain predominantly cyclic loads. Under such loads. many engineering structures will
fracture after a sufficient number of cycles even though the alternating stress amplitude
is much less than the static yield stress of the structural material. Marine vehicles are
highly susceptible to this type of loads because of the nature of the sea waves which are
substantially cyclical. Besides that other operational factors would to a certain degree
incite additional cyclic loads. which in some cases can be profoundly critical. Munse
(1983) indicates four main categories of cyclic loads involve in characterising the
fatigue performance of a marine vehicle. namely
a. the low frequency cyclic load (quasi-static). which is primarily due to repeated
of wave action to the structure. The number of cycles experienced during a lifetime of
ship (normally around 20 years) is some 10
7
up to 10
8
. Some factors affecting the
intensity of wave load are as described in Chapter 3.
b. the high frequency (dynamic) cyclic loads. which can further be classified
according to the nature of their excitations into the transient and steady state loads. The
former is identified due to slamming. i.e. water impact on the bottom of a vessel. which
manifests its effect into a vibrational response on the structure. and is known as the hull
whipping. The steady state dynamic loads are those generated by the ship's machinery
or propeller. The response of the structure to this type of load is usually referred to as
hull springing.A ship in its operational life could experience as much as 10
6
cycles of
this dynamic loads.
c. still water incites cyclic loads to a floating vessel in virtue of fluctuating in the
ship weight and buoyancy. as well as the self-generating waves. The fluctuating weight
and buoyancy is mainly in effect of the decrease in fuel and provision consumed. as
well as the fluctuation of the loaded and unloaded cargoes. In addition to this the wave
generated by a vessel in high speed operation has a quite significant load impact to the
hull structure. The number of load cycles in this category is. however, quite small. that
is only in the order of 340, and
d. the fourth cyclic load is that caused by the irregular thermal gradient on the
ship structure. This is primarily brought about the everchanging of environmental
weather. the sea-air temperature differential, and exposure to the sun. In addition to
these environmental consequences, temperature fluctuation is also experienced by
Chapter
6•
Fatig ue P e rfo rman ce o f SWATIl S hip s
239 .

7/26/2019 1992djatmikophd.pdf
http://slidepdf.com/reader/full/1992djatmikophdpdf 267/507
vessels carrying certain cargoes that requires specific air conditionings (e.g. reefer
ships).The level of load cycle incited by the thermal gradient is approximately 7000.
The degree of the marine vehicle's proneness againsts cyclic loads is globally
depending on its overall form or configuration, hence its behaviour in response to the
loads especially that due to the waves. The hull configuration of a conventional ship,
for instance, is closely resembled by a long slender beam. In head waves with a
characteristic length comparable to the ship length a ship may be modelled by a simply
supported beam at both ends (sagging) or on its centre (hogging). In those
circumstances a beam is of in most critical condition since maximum bending apply on
to its centre point. The accumulation of such load reversals on ship hulls, even though
they are not excessive in magnitude, would gradually deteriorate its structural strengths.
It is not surprising, therefore, if many fatigue defects on the structural members are
found in the midship part and its vicinity. Petershagen (1982) reported most fatigue
damages on midship of tankers are in forms of cracks at brackets, bulkheads and
notches. Thus it is clear that primary wave loadings instigate fatigue failures on
structural members of a floating structure depending on the predominant mode of
structural response inherent to the configuration of the structure.
With the growing interest on advanced marine vehicles (AMVs) worldwide
designers are now exposed to unconventional problems on their structural designs,
unexceptionally to fatigue. A short cut approach to resolve such problems is by
adopting past experiences from monohull vessels on top of identifying peculiar
structural characteristics of the newly designed AMVs. This approach should apply also
to the design of SWATIl ships. As it is obvious that wave loads on a SWATH are
largest in beam seas (see Chapter 3) then the primary structural members designed to
resist these are subjected to fatigue damages. The vulnerability of SWATIls to fatigue
failures is rather uncertain. Gore (1985), for instance, suggests that fatigue is not
expected to be a problem for SWATIl ships constructed of ordinary ship building
material. In practice, however, the use of ordinary shipbuilding material might not be
appropriate in the interest of reducing structural weight.
The drawback of SWATHs owing to the larger structural weight is well
recognised to be one of the obstacles for SWATHs to become commercially
competitive. This drawback has a two fold generic effects, namely lower sum of
payload and higher construction cost. If it is considered that increasing the payload is
more important in expense of, probably, a little increase in construction cost, then
lighter shipbuilding material should be used. Alternatively, employing lighter material
and different structural configuration (longitudinal framing) as proposed by Gupta and
Schmidt (1986) might satisfy both requirements. Nevertheless, these two solutions
probably not the best solution from the fatigue point of view. Regarding the first type
Chapter
6 •
Fatig ue P erfo rm an ce o f SWATII S hip s
240

7/26/2019 1992djatmikophd.pdf
http://slidepdf.com/reader/full/1992djatmikophdpdf 268/507
of solution light weight materials that can be selected for SWATH structure are
Aluminium-Alloy, Glass Reinforced Plastic (GRP) and High Tensile Steel (HTS).
The first two alternative materials need much more care as far as fatigue is
concerned, simply due to the inadequacy of their strength to this mode of excitation.
HTS undoubtly appears to be the best alternative, because it has a comparably
formidable strength especially in the persistence of longitudinal stresses. Even though,
Skaar et al (1987) hinted that the use of HTS to carry a higher dynamic design stresses
might not be in favour with fatigue considerations. The second solution of adopting
longitudinal framing with a carefully arranged web frames and transverse bulkheads is
quite promising. The matter is how to assure the stress concentrations on the reduced
transverse members would not exceed a certain level which could jeopardize their
fatigue resistances. In view of these considerations fatigue problem on SWATHs ought
to be promptly explored.
Further importance of performing fatigue analysis to SWATH structures is clearly
expressed by some maritime authorities. Malakhoff et al (1991) suggests that the US
Navy would impose a fatigue criteria on their newly designed naval SWATHs. It is
clarified that in the vessel's design the load spectrum is used in conjunction with S-N
fatigue curves for a typical structural detail, assuming linear cumulative damage to
determine the design allowable stress through an iterative process. For this analysis,
mean life minus one standard deviation was used for the S-N curve, providing 16%
probability of crack initiation in 30 years. American Bureau of Shipping (1990) has
indicated that fatigue analysis should be included as one of primary requirements upon
the submission of the document of SWATH structural design. Despite these strong
requirements by outstanding maritime institutions only a limited number of research has
been done on this subject.
The study on the assessment of SWATH fatigue lives was pioneered by Sikora et
al (1983 & 1986) where the weighted sea method (spectral analysis) is applied. The
minimum input data required include a response amplitude operator for side load in
beam seas, and operating speed and heading probabilities for the ship in consideration.
The output data includes a listing of response (side load) magnitudes and number of
cycles exceeding each of these magnitudes. Lifetime stress exceedance curves were
developed for several nominal design stresses. This information was used with linear
cumulative damage theory to predict expected fatigue life as a function of design stress.
Existing small specimen data for HTS, HY-80, and HY-l00 were used as a basis for
fatigue life calculations.
That study by Sikora et al probably is the only extensive reference on SWA TIl
fatigue so far. Other studies on SWA TIl fatigue notably at ABS are presented by Liu
(1989). The study addressed within this chapter attempts to contribute further
Chapter 6· Fatig u« P erfo rman ce o SW AT II S hip s
241

7/26/2019 1992djatmikophd.pdf
http://slidepdf.com/reader/full/1992djatmikophdpdf 269/507
inform ation related to fatigue design on SW A 111s. The adopted design m ethodology is
discussed. and a case study associated to SW ATH ships operating in the N orth A tlantic
is p ut fo rw ard .
6.2. PREDICTIONS OF SHIP FATIGUE LIFE
6.2.1. Full Spectral Analysis
For the case of welded structures. the m ost w idely used method for perform ing
fatigue checks at the design stage is to refer to S-N curves for the relevant w eld details.
and this is also the basis of fatigue design rules [M addox (1991)]. The slope of S-N
curve, e.g . Fig . 6.1 from Gurney (1976). in the high cycle range is com monly plotted
in log-log coordinates and is approxim ated by the follow ing function:
NSm=A
(6.1)
w here A is a function of the m aterial, joint geom etry and type of w eld from appropriate
data sources (m ostly developed from fatigue tests). m , which is the inverse negative
slope of the log-log S-N curve, is usually derived w ith A by regression analysis of log
S vs log N plots from acceptable test data or, m may chosen from theoretical fracture
m ech an ics con sid eration s and on ly A established b y test d ata regression .
In certain circum stances w here the S-N data of an intended structural detail is not
available. one m ay then use the data of a sim ilar geom etry and weld joint by im posing a
certain correction factor. The UK DEn Guidance Notes suggest a modification of
fatigue strength based on predictions w ith a reference structure of different thickness
giv en b y:
SIS
= (t
It )
-0.25
ref ref
(6.2)
The application of S-N test data to a ship 's hull girder requires a relationship
between the characteristic value of wave induced random stress and the constant
am plitude stress of the S-N curves. The analysis necessitates to call upon a m ethod to
which these two inform ation to be combined. hence to work out the state associated
w ith fa tig ue fa ilu re s.
T here are several m ethods of fatigue live estim ations developed m ainly in the field
of m echanical engineering which can be adopted to marine vehicles. One classical
m ethod. but still is irreplaceable todate, is that w hich w as developed by M iner (1945)
know n as the cum ulative dam age approach. By the M iner hypothesis, it is assum ed that
Chapter 6 • Fatig ue P erfo rman ce o f S lV AT II S hip s
242

7/26/2019 1992djatmikophd.pdf
http://slidepdf.com/reader/full/1992djatmikophdpdf 270/507
one cycle of the randomly varying stress, having an amplitude Si' causes an amount of
fatigue in the following proportion:
1
a D . = -
I
N.
1
(6.3)
Here, Ni is the number of cycles of a sinusoidally varying stress of amplitude Si
required to cause failure.
The cumulative damage due to fatigue during exposure to the random stress
environment will then be given by:
b
n
D= L
_i_
. 1 N.
1= 1
(6.4)
where ni is the number of cycles of stress of level Si during the period of exposure and
the summation is taken over all level of stress experienced, i.e. over the total blocks b,
during the period of time in question. Failure of the structure is then presumed to take
place when the length of exposure is sufficient for this sum to equal to unity. According
to this criterion failure is defined by the initiation of crack on the member or weld. The
effect of different plate thickness to the fatigue life of a detail can be evaluated by
substituting eqs (6.1) and (6.2) into eq. (6.4). The increase of plate thickness by a
factor of
a,
say, will reduce fatigue damage D by a factor of
a-
O
•
75 m
•
For the purpose of evaluating the fatigue life of a vessel, the number of cycles ni
corresponding to a given stress block Si can be derived by applying the long-term
spectral analysis as demonstrated in Chapter 3. To commence such an analysis the
stress transfer function (stress RAO) on the structure need first to be developed. Liu
(1989) suggests that stress RAOs connected to at least eight wave headings (head, bow
quartering from port and starboard, stern quartering from port and starboard, beam
from port and starboard, as well as following seas) are required by ABS.
Using stress RAOs and a selected wave energy spectra, the mean square value of
the fatigue stress process for each seastate is observed. The mean square value is then
used to define the distribution of fatigue stresses (commonly assumed to be Rayleigh
distributed) such that the number of cycles in each stress block is obtained. The lifetime
distribution of fatigue stress is then developed by accounting for the combination of the
probability of occurrences of sea-sate, wave spectrum, forward speed and wave
headings. A worked example for this can be found in Chapter 3. A diagramatical full
spectral fatigue analysis is as shown in Fig. 6.2.
Chapter
6 •
Fatig ue P erfo rm an ce o f S lVAT II S hip s
243

7/26/2019 1992djatmikophd.pdf
http://slidepdf.com/reader/full/1992djatmikophdpdf 271/507
6.2.2. Simplified Approach in Fatigue Analysis
Instead of evaluating the fatigue performance of a structure rigorously as above
one may apply a simplified approach. This method is now well accepted ~ithin the
maritime community, e.g. as addressed by Almar-Ness (1985), Chen (1989) and
Faulkner (1991). In this way the spectral representation of the seaway and, thus, the
stress environment involved, the fatigue damage summation may be expressed in a
more compact form, Let peS)be the probability density function for the stress, which is
defined so that the quantity, P(Sl) dS equals the fraction of all the oscillatory stress
peaks whose values lie within the the interval dS centered on the mean value S1.
Further, taking that the average frequency of the randomly varying stress and that the
total time of exposure are f and T, respectively. The incremental damage caused by all
of the stress oscillations of amplitude S1occurring during interval T is then given by :
dD =
Tfp(St) dS
N(Sl)
(6.5)
Here N(Sl) is the number of cycles to failure at stress Sl as obtained from the S-N
curve for the material or the structuralcomponent
The expected value of the total damage during time period
T
is then given by the
integral of
eq. (6.3)
as follows:
00
E(D) = Tf J peS) dS
o N(S)
(6.6)
or by using the total number of cycle no' that is the multiplication of frequency and
period, and replacing N(S) by A and Smas in eq. (1) the above expression becomes:
00
EeD) = no J Srn peS) dS
A 0 NeS)
(6.6a)
From various observations it is found that the long
term
distribution of sea-state
can be represented by the two-parameter Weibull distribution. Accordingly the
structural stresses induced by sealoads on a vessel can be approximated by the
same distribution. The Weibull probability density function for stress peS) may be
written as:
Chapter
6·
Fatig ue P er fo rm an ce o f SWATII S hip s
244

7/26/2019 1992djatmikophd.pdf
http://slidepdf.com/reader/full/1992djatmikophdpdf 272/507
~ (S ) ~ - l [ (S ) ~ ]
(S)
=
A A
exp -
A
(6.7)
where A is the scale parameter and ~ is the shape parameter which is a function of the
type of the structure and the sea region.
If
Se is the expected extreme stress occurring
once in a lifetime of no wave encounters the scale parameter can then be given by :
A =
S (In n )-1/~
e 0
(6.8)
Substituting eq. (6.7) into eq. (6.6a) we find the expected value of damage E(D), or
simply the damage ratio Das :
n - ~ (S ) ~ - l [ (S ) ; ]
D =
~
m A A exp - A dS
(6.9)
This integral expression is further simplified by employing the gamma function T(x)
and substituting eq. (6.8) to become:
(6.10)
6.3. EVALUATION OF S\VATH FATIGUE BEHAVIOUR
6.3.1. Identification of SWATH's Fatigue Susceptible Regions
As is implied in Section 6.1 structural optimisation on SWATHs should look
extensively at the problem of fatigue in order to achieve a reasonable competitive
expenditure. For this reason SWATH designers are obliged to identify various areas in
which their designs should be carefully checked so that the risk of fatigue failures could
be minimised without imposing much redundancy to the structure. Several factors
which are generally considered in the identification of fatigue susceptible areas on
marine structures would be applicable to SWATHs. The identification of fatigue
susceptibility on a structure may be classified into those induced by the design
constraints and by fabrication factors. These two aspects are basically interrelated,
which to some extent need to be jointly resolved. Fatigue susceptibility due to design
constrains are mostly introduced by specific requirements of the structure
configuration.
Chapter 6• Fatig ue P erfo rm an ce o f S lVAT Il S hip s
245

7/26/2019 1992djatmikophd.pdf
http://slidepdf.com/reader/full/1992djatmikophdpdf 273/507
A sem i subm ersible 's configuration. for exam ple. necessitates the designer to
arrange som e additional bracings in order to sustain extrem e environm ental loads. To
the structure as a w hole these bracings w ould provide a sufficient additional strength
ag ainst ultim ate load say. Ind iv idual b racing especially at th e jo int to th e m ain structure,
however, w ill suffer from a concentrated stress flow . This is made worse when
fabrication procedures on it are not carefully perform ed. A lthough this has som etim es
perform ed w ell but because of the aw kw ard location of the m em ber m ake it d ifficult for
welder to work on it. That is to say bad accessib ility to the location m ay result in poor
workmanship. O ther structural areas where fatigue failure would persevere are at
transition of different structural m embers (or change in geometry). cut outs for
equipm ents, port holes. attachm ents for equipm ent and so on.
In most cases if fatigue criterion on a structure are not satisfied A lm ar-N ress
(1985) suggest the follow ing actions. Firstly . changing the layout (geom etry) to reduce
concentration of the stress flow . Secondly. increase plate thickness in areas of high
local stress. or introduce stiffeners w hichever is thought m ore effective. C om bined this
w ith . th irdly, sm oothing local geom etry (brackets, fully penetrated w elds than fillet
w elds. grinding butt w elds and the tow s of fillet w elds. O verall these im ply the need of
a better understanding betw een structural designer and production engineer. E arly in the
design designers should have take a full consideration on the geom etrical tolerances
during fabrication. e.g . the possibility of m isalignm ents from the distortions due to
w eld in g, etc.
Under the consideration of the m ain factor affecting fatigue perform ance, that is
structural com ponents w here stress concentrations persist. a SW A T Il m ight be divided
into several fatigue regions. As shown by Sikora (1988) the haunch-deck and strut-
haunch intersections. as w ell as the deck-outer shell in tersection are the prim ary regions
w here high stress concentrations. so as the position of the hotspots. are found (see Fig.
6.3). A t th is locations discontinuity of transverse fram es is unavoidable. thus require
special cautions. O ther structural regions that is viewed to suffer from a stress
concentration would be along centreline of the m id-cross deck structure, when it is
subjected to a beam waves. Torsional stress due to a differential p itching of the side
structures (hulls) when a bow wave is encountered could further increase the stress
range in this particular region. Fabrication factor m ay affect significantly to the haunch
area, especially on small SW ATHs, mainly due to the poor accessib ility in the strut
space. Such a poor accessib ility is also a major obstacle to requisite inspections.
Fatigue problem on the superstructure connection onto the main deck of SW ATHs
probably is quite sim ilar to m onohull ships. A num ber of references. e.g . Peters hagen
(1986). Hugill and Sumpter (1990), C larke (1991), address this aspect quite
extensively. thus recom m ended to SW A TII designers.
Chapter 6 - Fatig ue P erfo rman ce o f SWAT II Sh ips
246

7/26/2019 1992djatmikophd.pdf
http://slidepdf.com/reader/full/1992djatmikophdpdf 274/507
Cyclic loading excited by the primary wave actions may not severely influence the
wet deck at the bow. Nevertheless, exposure to frequent slamming loads on this
structural part would possibly incite local fatigue damages. Strut to lower hull
intersection is a major geometrical changing on SWATHs, however, it is unlikely that
this part will introduce any fatigue failure as the primary cyclic loads due to waves are
not directly apply on it. Only in special cases where a local source of repeating loads
presents within the vicinity, e.g. vibrations due to the machinery located in the lower
hull, then fatigue damage may persist. Care should be taken in such cases because,
even though the magnitude of the load excitation is relatively low but much higher
frequency may critically affect the local structure.
Having observed several areas where fatigue damage is expected to arise on
SWATHs the remaining task is to propose a solution(s) to this problem. The first
alternative is by using insert plate on the haunch-deck and haunch-strut intersections.
Increasing plate thickness at the haunch should not be allowed since this is
contradictory to the idea of reducing the structural weight. Another way to ease stress
concentration in this part is by designing a shallower haunch angle at the wet-deck. As
observed by Sikora (1988) introducing rounded knuckle might not be effective if it is
only in a fraction of a meter, but larger than that would be beneficial. The optimum
from stress concentration viewpoint would be to replace the entire haunch with one
large arc of a circle which is tangent to both strut and wet deck. Chalmers (1989)
advises to pay a full attention in designing details and structural discontinuity at the
haunch. Transverse framing with additional partial bulkheads in the corner region
remains the best configuration for SWATHs to sustain cyclic stress due to predominant
transverse loads.
6.3.2. Determination
of
SWATH Ship Structural Stress
Early in the design stage nominal stress on SWATIl may be approached by the
beam theory as was established by Mulligan and Edkins (1985). The method idealises
the cross-deck structure as a simply supported beam, and the struts as cantilever rigidly
fixed to the cross-deck. Bending moments on the cross-deck and struts result from side
load which is assumed to act perpendicular to the centreline at mid draft. Peak stresses
at critical locations can be obtained by applying correction coefficients to the nominal
stress, even though the result tends to be conservative. Recognising this fact it may not
be appropriate to assess structural stress on modern sophisticated ships, such as
SWATlls, by a simple calculation model.
A more versatile approach, such as the well known finite element analysis,
therefore, has to be employed. Even though, the accuracy of the results predicted by the
Chapter 6· Fatig ue P erfo rm an ce o f SWAT II S hip s
247

7/26/2019 1992djatmikophd.pdf
http://slidepdf.com/reader/full/1992djatmikophdpdf 275/507
application of FEM still depends very much on the adequacy of the structural mesh
arrangement. This is the case especially in way of structural details which embodies a
dominant influence on the fatigue strength of the structure. The stress analysis for
fatigue assessment requires much more effort and is even more costly than say for the
.
ultimate strength prediction.
The matter is clear as indicated in Section 6.2.1 that stress transfer functions have
to be established for a number of sea headings at various wave frequency, not to
mention the amount of structural details that ought to be investigated. In order to reduce
the cost and time spent on the analysis a global analysis using a three-dimensional
coarse mesh FEM is necessary. Using a 3-D FEM one would then be able to pin point
approximate locations of the stress concentration on a SWATH, which can further be
used for a reference in the detailed analysis. Quite a number of 3-D FEM package now
available, in which MAESTRO-FEM being the one widely employed within the
SWATH community. The Department's SWATH Research Group has recently
exercised the package for the analysis of the Patria as reported by Tolikas et al (1992).
As a sequel to the use of a 3-D FEM the stress analysis on any structural detail
may now be commenced utilising a two-dimensional fine mesh model. This is preferred
because such modelling generally provides more accurate prediction especially
regarding the peak stress. Liu (1989) has suggested a way in which this time
consuming analysis can be relaxed. Instead of obtaining all stresses for any wave
frequency increment at a certain wave heading a single reference value of stress on the
transfer function is determined. It is recommended to determine the magnitude of stress
related to the value of wave load at vicinity of modal (peak) period. Using the reference
stress thus calculated, the entire transfer function may then be assembled following the
pattern of the load transfer function. A few more stress values may be determined if it is
felt that a single value is not too convincing.
6.3.3. Fatigue Performance of SWATH Ships - A Case Study
Within the limited information on SWATH fatigue performance it is attempted to
identify certain important factors related to this aspect by a hypothetical study. Two
notional SWATH vessels are selected for evaluation, namely SWA TH-FV and
SWATH-3, both of which are approximately 2500-tonne in displacement. Analysis
was first made by employing the Miner's linear cumulative damage rule, which was
then followed by the application of the simplified assessment as is clarified in the
following.
Chapter 6 - Fatigue Perfo rm ance o f SW ATII Ships
248
}
r

7/26/2019 1992djatmikophd.pdf
http://slidepdf.com/reader/full/1992djatmikophdpdf 276/507
6.3.3.1. Assessment of SWATH Fatigue Life. In order to calculate the
cumulative damage ratio the number of cycle ni pertinent to a given stress range Si is
taken from the long-term load response analysis as in Chapter 3. The stress range value
corresponding to each block (i) is determined by assuming that: a) the. structural
behaviour is essentially within the limit of elasticity, and hence b) the stress magnitude
can be considered to correlate proportionally to the structural response (Le. bending
moment or side load). In this particular study the Class-D weld joint S-N data provided
by Gurney (1976) is selected.
The selection of c1ass-D weld joints for the example in this evaluation merely is
based on the consideration that most structural connections in a ship are the typically of
butt joints or fillet welds. Especially the former, moderate workmanship would be
expected to produce weld joints for the structure that can be categorised to have the
quality of this class. The damage initiation equation of this Class-D weld joint for two
standard deviation with a 97.7% probability level of survival is given in metric unit as:
N S3 = 1.5136 x 10
12
(6.11)
The calculation may be carried out by first setting up a given lifetime (expected
extreme) stress range, say 200 N/mm2, and the stress distribution of which can be
derived linearly from the loading information, as exemplified in Table 6.1 for SWATII-
FV. The fatigue life of this SWATH corresponding to each lifetime stress range is then
derived by multiplying the expected life of the vessel to the fraction of the cumulative
damage ratio so obtained. The same procedure has been performed to evaluate the
fatigue life of another hypothetical vessel (SWA TH-3), for comparison. The computed
results are further presented in Fig. 6.4, in which the fatigue life is plotted against the
lifetime stress (single amplitude). As shown in this Figure, the difference of the fatigue
life between the SWATIl-FV and SWA TH-3 is insignificant. Nonetheless, it should be
recognised that such a small difference is merely due to the same maximum stress range
imposed, which will only be the case when the structural section of one SW ATIl is
different from the other. If, however, it is accepted that any level of load response on
the two SWATHs should correspond to a certain stress magnitude (Le. the cross
structure having an equal section modulus say) then the difference in fatigue life is
apparent (see Fig. 6.5).
It is clear from Fig. 6.5 that for a given stress level SWATH-FV would maintain
a longer lifetime than SWA TH-3, or, in other words, the load carrying capacity of
SWA TII-FV from the fatigue point of view is greater than SWA TII-3. It is worthwhile
to mention an interesting point here that SW ATII-FV has in fact experienced a larger
number of cyclic load than SWATII-3 (in the order of 8.40xl0
7
compare to 8.24xl0
7
),
yet the former has a better fatigue characteristic. Such a phenomenon is highly possible
Chapter
6 -
Fatig ue P erfo rman ce o SW AT Il S hip s
249

7/26/2019 1992djatmikophd.pdf
http://slidepdf.com/reader/full/1992djatmikophdpdf 277/507
if one consider that there exists a dominant effect of wave period over the responses of
different structures (see Chapters 2-4). Moreover, fatigue life is also substantially
governed by the stress distribution during the lifetime of the structure as is discussed
below.
To some extent the simplified approach in predicting fatigue life of a vessel is the
most convenient method that should be applied by a structural designer. By applying
such a method predictions can be made rapidly (even manually), which is of importance
requirement when a wider range of sensitivity study ought to be performed. A crucial
problem, nonetheless, has to be well understood before an analysis could be
proceeded. As is indicated in eq. (6.10) the damage ratio is governed by the total
number of cyclic load no' characteristic values of the selected S-N data (A and m),
extreme stress range (Se), and the Weibull-shape parameter l;. It is the latter which
proves to be the most difficult to determine, especially for those dealing with a new
type of vessel as past experience is very limited (if non-existent). Even for conventional
ships this parameter could not be easily chosen from other vessel of a similar size
without carefully evaluating various factors pertinent to the vessel so designed. One of
the most apparent factors which strongly instigates the Weibull parameter is the sea
region, i.e. the severity of the seawaves, and others such as the prevalent wave
headings and operational speeds.
In the early design stage a rule of thumb is given by Munse et al (1983), where
shape parameters of roughly 0.7 up to 1.0 and 1.0 up to 1.3 are typical to, respectively,
larger ships (eg Tankers, Bulk Carriers) and smaller ships (eg General Cargo vessels).
A similar finding by Nordenstrom (1973) reveals that long-term distributions of waves
and wave-induced structural response can be closely approximated by Weibull
distributions with shape parameters close to unity (l; ±1.0), that is approximately
exponential distribution. It is suggested by Almar-Neess (1985) to be cautious with the
approach of selecting the Weibull parameter
l;
if it is not supported by significant
quantitative experience of similar ships.
In the almost non-existent information it is quite interesting to explore such
Weibull parameters peculiar to SWA TIl vessels by the following procedure. Using an
available lifetime load (stress) data a damage ratio D corresponding to a given extreme
stress range can
be
calculated by Miner's rule as above. An iterative computation is then
performed on the simplified damage equation (eq. 6.10) by first setting an initial value
of
l ;
and further imposing an increment value of
L \ l ;
to finally obtaining the damage ratio
which is equal to the one obtained from Miner's rule. The l; which correlates to this
damage ratio D is selected as the value that will closely represent the stress lifetime
distribution. Table 6.2 presents the results of the iterative computation on
l;
for the
notional SWATH-FV. Similarly, computation has been performed for SWATH-3
studied herein. Weibull shape parameters l;of 0.94 and 0.945 are obtained from the
Chapter
6 -
Fatigue Per fo rmance
0/
SWAT I S hip s
250

7/26/2019 1992djatmikophd.pdf
http://slidepdf.com/reader/full/1992djatmikophdpdf 278/507
calculation represent the lifetime response distributions of SWATII-FV and SWATII-3,
respectively. Once such a nearly exact value of ~ is derived various sensitivity study,
especially the extreme stress range effects on the fatigue life can be made.
For the sake of comparison the same procedure as above has been employed to
investigate an idealistic condition where those SWATIIs are operated in dominant beam
sea waves. The computation of the fatigue damage of Class-D weld joints using the
Miner's rule by assuming a lifetime mean stress range of 200 N/mm2 in beam sea
dominated condition for SW ATH-FY and SW ATH-3 has been made. The
corresponding iterative calculation in obtaining the Weibull-shape parameters ~ is also
exercised. The parameters derived are in the order of 1.226 and 1.265, respectively, for
SWA TII-FY and SW ATII-3. Fig. 6.6 provides the plot of lifetime stress histories of
the two SWATHs which show their dependence on Weibull-shape parameters.
6.3.3.2. Sensitivity Evaluation. A convenient feature from the explicit
expression for D once the ~ is obtained is that early in the design stage the maximum
allowable extreme stress range for any likely critical structural detail can be assessed as
suggested by Munse (1981) as :
[
]
1 Im
_ A a
1~
Sea -
or(m/~
+
1) (In nO)
(6.12)
Where for any acceptable damage ratio, or preferably referred to as the damage index, B
the allowable stress range Sea is found as a function of the detail S-N variables, the
expected lifetime stress cycles no' and the Weibull shape parameter ~. Assuming a
damage index B = 1.0 and based on the lifetime stress cycles for SWATH-FY and
SWA TH-3, it is found that the allowable extreme stress range in a 20-year period for
the Class-D weld joints of the two vessels are 292 N/mm2 and 291 N/mm2,
respectively. These stress magnitudes are slightly higher than that put forward by
Sikora et al (1983). From fatigue analysis of several SWATH designs it was observed
design stresses of9 tsi (140 N/mm2) to 18 tsi (280 N/mm2), depending upon material
and conditions, result in acceptable expected fatigue lives.
An evaluation of allowable stress range for a 30 years lifetime by imposing a
damage index
8
=
0.67 has also been made, and gives an Sea value of about 255
N/mm2 (37 ksi). Sikora and Dinsenbacher (1990) presents a relatively lower amount of
allowable stress range for the T-AGOS (3500-tonne) than those two SWATHs, i.e.
about 28 ksi (193 N/mm
2
). It is deceptive to take a full account on the previous value
for SWATH-FY or SWATH-3, which is some 30% larger than for the T-AGOS,
Chapter
6 -
F atig ue P er fo rman ce o f S WAT II S hip s
2S1

7/26/2019 1992djatmikophd.pdf
http://slidepdf.com/reader/full/1992djatmikophdpdf 279/507
because other factors of safety, e.g. due to stress concentration, fabrication tolerances
etc, have not been taken into account.
The plate thickness correction should not crucially affect fatigue performance of a
given structural joints as long as the designed material has a thickness less than that of
the material tested to derive the applied S-N curve. Berge (1984) has clearly mention
this account, with the reasoning that should two structures with different thicknesses
experience an equal stress gradient then the thicker plate would tend to fail more rapidly
under fatigue persistence. The expression in eq. (6.2) shows this phenomenon. In this
respect the currently evaluated SWATHs are believed not to have plate thicknesses
thicker than that used in the fatigue test by Gurney (1976), which is typically some 22
mm in thickness or more.
In an actual design it is hardly found that 8 is taken to be 1.0. Sometimes a
damage index value of even much less than 1.0 (as low as 0.3) should be taken,
especially if the fatigue failure of the designed member will lead to a catastrophic
collapse of the system. Nevertheless, when a member failure is not significantly affects
the whole structure (or any major structural segment) then the value of
8
may be
relaxed. In defining this factor other aspects related to the fatigue quality of a member
has to be accounted for. These are, for instance, fabrication difficulties including
accessibility, exposures to sea water, level of difficulty for inspection, redundancy and
so on.
Clearly. setting up 8 to be less than 1.0 is aimed at allowing a sufficient survival
before fatigue fracture on any detail could be detected in a regular inspection. In other
words it is intended to render an adequate residual strength against load reversals in
damage condition. This sort of precaution is recommended although it is a common
sense to believe that total failure is quite unlikely to occur due to only local damages.
Another format to assure margin of safety for fatigue for fatigue not to be
exceeded one may also adopt the concept of partial coefficient. This concept is similar
to that usually considered in static loading suggested by most Classification Societies.
A specific form of partial coefficients inclusion in the fatigue damage equation as given
by Almar-Ness (1985) is given as :
b
L
(Si 'Y L ) m n
i
~(SJ'YSN)m
Ni
i=l
(6.13)
where
'Y L
is the partial (safety) coefficient on loading and
' Y S N
is the partial coefficient
on S-N data. These partial safety coefficients are suggested to be attained by advanced
Chapter
6 -
Fatig ue P e rfo rman ce o /SW ATII S hip s
252

7/26/2019 1992djatmikophd.pdf
http://slidepdf.com/reader/full/1992djatmikophdpdf 280/507
probabilistic analysis, thus the uncertainty of the different parameters may be
reasonably accounted for. Inspite of the urgent need in introducing such safety
coefficients on fatigue assessment this has not so far been carried out. In this respect
the concept of damage index would remain the only appropriate alternative in fatigue
safety for a few years ahead.
As mentioned earlier one of the factors that influences the accuracy in fatigue
prediction is the precision of the Weibull-shape parameter adopted in representing the
stress distribution (see eq. 10). In order to gain a clear insight on the importance of the
parameter a sensitivity evaluation is performed on SWA TH-FV as shown in Table 6.3.
In this particular case the Class-D weld joint S-N data is selected, and calculation is
made with a constant stress range of 200 N/mm2 and a total stress cycle no in a lifetime
of 8.4 x 10
7
•
The Weibul-parameters evaluated are set between 0.85 and 1.05, in
which the parameter ~=O.94 is taken as the standard that will give a 20 year fatigue life.
It can be readily seen from the corresponding table as to how fatigue life differ due to
the small change in ~. As shown, with only a relatively small changes in the parameter
(± 10% from the standard) a difference in fatigue life between 40% up to 70% is
obtained. Fig. 6.7 is provided to supplement this evaluation, where five parameters are
selected and the fatigue lifes are calculated for different stress values.
Considering the above evaluation one can easily judge the difference in fatigue life
would be much too large when comparing between the all heading (~=O.94) and beam
sea dominated (;=1.224) operations. As presented in Table 6.4 the difference of the
fatigue lifes for the two conditions can be as much as 260%. It is clear fatigue analysis
will not be valid if developed based only on a limited sea condition, although if it is
considered to be the most critical (beam seas in case of SWATHs). Chen (1989)
observe a further aspect which might arise from this sensitivity is that a seaway may
produce a larger extreme stress range but less fatigue damage, and vice versa (see
comparison of SWATH-FV and SWATH-3 in Fig. 6.2). This kind of observation
brings out two interesting phenomena, namely, the severity of a given wave
environment can be measured in at least two ways, i.e. the stress range severity and
fatigue vulnerability. The latter is most closely related to the Weibull shape parameter of
the stress range long term probability of exceedance
A sensitivity evaluation is further made on the effects of weld classes toward the
fatigue life of SWA TII-FV, as shown in Table 6.5. There is nothing so special about
this evaluation as it is easily guessed that the higher the weld class (quality) the longer
life they will endure. The main intention here, however, is to further emphasis the
significance in maintaining proper workmanships as strongly suggested in Section 6.3,
so that fatigue damage could be reasonably minimised. As can be seen, for instance, a
degradation of weld quality from class-D down into class-E would lessen the fatigue
life of about 30%, and so forth.
Chapter
6 -
Falig ue P erfo rm an ce o f SWAT II S hip s
253

7/26/2019 1992djatmikophd.pdf
http://slidepdf.com/reader/full/1992djatmikophdpdf 281/507
6.3.4. Errects or Stress Concentration Factor (SCF)
So far the fatigue analysis on the two SWATHs are presented on the basis of the
nominal stress, that is on the structure where experiences stress fluctuation proportional
to the load excitation. Nonetheless it should be accepted that fatigue damage on a
structure persists initially on members where stress flow is somewhat blocked
(concentrated). Such a circumstance may be brought about the discontinuity of details,
the presence of openings. and change of geometry. In the assessment of fatigue life to
any particular member in which stress concentration present a correction to the selected
S-N data should then be implemented. because these data are mostly developed based
on the nominal stress. A correction coefficient referred to as the stress concentration
factor (SCF) usually are adopted in this case. This SCF is defined as the ratio of the hot
spot stress SmIDtand the nominal stress Sn :
(6.14)
For any particular detail an SCF value can be determined both theoretically or
experimentally. The former usually are now established by employing the finite element
analysis. Experimental method generally are carried out to provide the data for the
validation of theoretical approach, usually when a complex structural detail or geometry
are concerned.
Recognising the fact on the importance in defining stress concentration. Sikora
(1988) has carried a parametric study on this aspect specifically for SWATH ships. The
governing factor observed in that observation is the effect of variation in transverse
bulkhead spacing for SWATHs with a 45 degree haunch angle. The results of this
study were extracted into design algorithms for predicting the peak stresses in several
locations on the transverse bulkhead. These algorithms can be used to determine the
relative SCF as functions of ship geometry as follows.
Haunch-wet deck intersection (knuckle) :
SCF
=
1.83 + 6.11 Sa/Bd
(6.15a)
Haunch-Inner Strut intersection:
SCF I: 4.21 - 0.18 Sa/Sh
(6.15b)
Main Deck-Long. Bulkhead intersection:
SCF :: 0.83 + 2.80 Sa/Bd
(6.15c)
Chapter
6-
Fatigue Performance o f SW ATII Ships
254

7/26/2019 1992djatmikophd.pdf
http://slidepdf.com/reader/full/1992djatmikophdpdf 282/507
Platform-Outer Shell intersection:
SCF = 1.20 + 1.78 SB/H
• (6.15d)
where SB is the longitudinal spacing between transverse bulkheads, Bd is the total span
of the upper box structure, Sh is the height of the strut above the lower hull, and H is
the height of main deck above the lower hull (see Fig. 6.8). The range of validity of
those algorithms are, 0.31<Sn/Bd<0.61, 1.38<SB/Sh<3.12, and 0.54<SB/H<1.08.
Using the above algorithms the SCFs for SWATII-FV on those locations are found to
be 3.0, 4.0, 1.4, and 2.0, respectively.
Using the nominal allowable stress range value Sea=292 N/mm2, the other
allowable stresses for those critical parts on SWATH-FV are obtained by imposing the
SCFs as 97 N/mm2, 73 N/mm2, 208 N/mm2, and 146 N/mm2, respectively. These
allowable stress ranges are considerably lower than for the nominal structures, hence
certain actions to enhance fatigue endurance of those critical members are necessary to
be performed, Otherwise more regular inspections ought to be made so that fatigue
damages can be detected as early as possible hence the risk of extensive failure can be
minimised.
6.4. RELIABILITY AGAINST FATIGUE FAILURES
The method of fatigue analysis described in the foregoing sections can be viewed
as the deterministic approach. In that way any variable involved in the formulation are
assumed to be constant (unbiased). In actual situations this assumption may not valid as
there are discrepancies between the design values so applied and the statistical
properties of those variables, usually referred to as the uncertainties. These particular
facts imply that those results derived deterministically can not be absolute justified for
their accuracies. This issue then should be sought as a crucial consideration into the
problem of safety.
In general structural design the uncertainties can be brought about the randomness
of loadings, simplifying assumptions in the strength analysis, material properties, etc.
The randomness of loadings on marine structures is obvious because the wave which
acts as the primary source of external loads is naturally random. The simplification in
prediction method usually is due to the limitation in modelling the physical phenomena
generic to complexity of the problem concerned. The uncertainties regarding material
properties mostly are related to the bias in data collection, such as the measurements of
Chapter
6·
Fatig ue P erfo rm an ce o f SWAT II S hip s
2 S S

7/26/2019 1992djatmikophd.pdf
http://slidepdf.com/reader/full/1992djatmikophdpdf 283/507
yield stress, fatigue strength, notch toughness, and corrosion rates. In addition
uncertainties due to fabrications and constructions have a strong influence on the
strength of a structure.
.
To tackle the problem which arises due to uncertainties then a probabilistic
analysis ought to be called for. The major benefit of the probabilistic design, or widely
known as the reliability-based design, approach is that a designer will be able to
generate an engineering system which is both efficient and reliable to the level
specified. Faulkner (1987) quotes that in deterministic analysis it is common to make
conservative assumptions with respect to modelling. This apparently includes the
assumption in safety factors, which are mostly developed from past experiences
without thorough examination on the effects of various uncertainties. Although the
majority of safety factors would assure the strength of a structure will not be exceeded
by the applied loads, but they are not necessarily give the best approximate of optimum
structure. In reliability assessment the aim should be for a model which on average will
be unbiased. This way would enable a designer to anticipate proper allowances for each
of important design, fabrication and service variables.
In the concept of reliability design a problem can be contemplated as one of
supply and demand correlation. Failure can then be defined to occur when the supply
(the resistance or strength of the system) is less than the demand (the loading imposed
onto the system). Hence, the risk of failure is the probability of a load (L) reaching or
exceeding the resistance (R), which can be written as :
Probability of Failure =Pr =P (R <
L)
(6.16)
It follows that the safety (reliability) of a structure is the converse of the probability of
failure or
Safety
=
P
(R
>
L)
=
1 -
Pr (6.17)
which can be represented diagrammatically as shown in Fig. 6.9. Faulkner (1981)
expresses the probability of failure, provided Rand L are uncorrelated random
variables and both are time invariant, in the the following equation:
00
P r = J
{PR
(x)}
PL
(x) dx ,
or
o
00
(6.18)
P
r
=-
J{PL(x)}PR(x)dx
o
where P(x) and p(x) are probability distribution and density functions respectively for
Chapter
6 -
Fatig ue P erfo rm an ce o f SWAT II S hip s
256

7/26/2019 1992djatmikophd.pdf
http://slidepdf.com/reader/full/1992djatmikophdpdf 284/507
the Rand
L
curves. The above formulation is referred to as the 'fully probabilistic
approach' (or level 3 approach) in which complete probability distributions of all
relevant quantities (load, resistance, and limit values) are included in calculating the
probability of failure. However, those quantities required for the calculation are not
widely known, especially due to the lack of data available. Another alternative is
therefore to use a simpler safety concept which combines conventional determinism
statistics. This latter approach is hence known as the 'semi probabilistic', or the level 2
approach, which can further be classified into the partial safety factor method and
second moment method. The former is as briefly mentioned in Section 6.3.3.2 (see eq.
6.13). The latter which is widely used at present is as described below.
In the second moment method the degree of structural safety is directly related to
the margin (Z) between the actual magnitude of the resistance and load:
Z=R-L
(6.19)
and failure takes place when the margin
Z
becomes negative or
P c = prob
[Z
<
0]
(6.20)
Since both resistance and load variables are random, likewise the margin Z which has a
probability density function Pz(Z) as shown in Fig. 6.9b. It follows, therefore, that
safety is not only dependent to the rnean value of the rnargin
(Z),
Le. the distance
between mean values of resistance
(R)
and load
(L),
but also on the inverse of the
spread between the two curves as rneasured by their coefficient of variations (COY). If
the coefficient of variation of Z (denoted as COY z) is large then the degree of safety
will be correspondingly less, and vise versa. Substracting Z from both sides of the
inequality and normalise this using the standard deviation O'zIeq (20) becomes:
[
Z -
Z
Z ]
P c = prob O'z < - O'z
(6.21)
or by using the COYeq. (6.21) converts to:
[ Z - Z 1 ]
c
=
prob
< ---
0'
COY
z z
(6.21a)
The left-hand term within the bracket is the normalised margin, for which the
distribution has zero mean and unit variance. It is clear from eq. (6.2la) that the safety
is governed by the inverse value of the
COY
z. Lets denotes the probability distribution
Chap te r
6·
F atigue P erfo rm an ce o /SW AT JI Sh ips
257

7/26/2019 1992djatmikophd.pdf
http://slidepdf.com/reader/full/1992djatmikophdpdf 285/507
of the norm alised m argin as < I > and the inverse of COY z. Le. the reliability index. as ~ .
th en th e p ro bab ility o f failure may
be
rew ritten as :
P r
=
< I > ( - ~ )
(6.22)
6.4.1. Analysis by AFOSM Method
For the present fatigue safety analysis an enhanced approach so called the
A dvanced First O rder Second M om ent (A FO SM ) is em ployed ind eterm in in g th e safety
index. In this approach the the margin of safety is considered to be the function of
independent variables involved in the design. Lets n variables Xl' x2' .....• xn are
ac coun te d fo r inth e calculation then th e lim it static equation for the structure is :
(6.23)
w here the nature of g depends on the structural type and lim it state under consideration.
A t this point the failure surface is due for Z
=
O . T he linear approxim ation to this can be
derived b y app lyin g the T aylo r series ex pan sion :
n
- .. · L .,.
=g(x
1
.x
2
•.••••.••••
x)+ (x.-x.)g .(x)
nil 1
I
(6.24)
where
, ( . ) a
g
g.
x =-
1
a x .
1
h len
desi . • (. • .)
valuated at t e un own esign
point
x = x
l
x
2
• •.• ......• x
n
.
If
x i
and O 'irepresent the m eans and standard deviations of the basic variables xi'
the mean value of Z is :
n
- L · ·
= = (x. - x. ) g '. (x )
1 1 1
I
(6.25)
a nd its sta nd ard d ev ia tio n:
(6.26)
C hapter6 - F atigue Petfo rm an ce o /SW AH I Ships
258

7/26/2019 1992djatmikophd.pdf
http://slidepdf.com/reader/full/1992djatmikophdpdf 286/507
er
z
may be expressed as a linear combination of eris as follows:
n
(J
=~ a.g'.(x*)er.
z ~ 1 1 1
1
(6.26a)
where
(6.27)
which are referred to as the sensitivity factors since they reflect the relative influence
each of the design variables has on the strength model.
Ifthe reliability index p of the design is defined as Z/er
z
' then from eqs. (6.25)
and (6.26a) we find:
n
~ (x. -
x~) g', (x*)
~ 1 1 1
P
=
---n-----
~ a. g'. (x*)er.
~ 1 I I
1
(6.28)
from which it follows
n
~ g'.(x·)(x.-x~ -a.per.)=O
~ I I I I I
1
(6.29)
The solution of this equation is:
* -
A
x.
=
x. - a .....er.
I 1 I 1
for all
i
(6.30)
in which x~ is referred to as the 'design point'. This design point corresponds to the
1
point of maximum probability density of failure when all the variables are normally
distributed.
A computer code has been developed by Pu (1992) to accommodate the above
AFOSM formulations. More on the features of this code, such as the treatment of non-
normal distributed variables. are fully described in that report. The generalised
approach adopted in the developed program makes it suitable to be used in most
engineering design. such as for fatigue analysis described below.
As given in eq. (6.10) fatigue damage is governed by the variables in S-N
equation. the number of cycle experienced by the structure and the extreme stress. In
Chapter
6·
Fatig ue P e rfo rman ce o /S lVAT II S hip s
259

7/26/2019 1992djatmikophd.pdf
http://slidepdf.com/reader/full/1992djatmikophdpdf 287/507
the reliability analysis those variables on the right-hand side of eq. (6.10) are treated as
random variables. Lets ~ denotes the fatigue strength (damage index at failure) then the
failure occurs when ~ <D. Hence the safety margin for fatigue can be written as :
(6.31)
The uncertainties on the variables involved in the above equation are taken from various
sources. The S-N data considered herein is for the Class-D weld type, where from the
listed data given by Gurney (1976) the COVs of A and m can be calculated and found
on average to be 31% and 3%, respectively. The other COVs for Se, no and ~ are taken
from the paper by Guedes-Soares (1991) as 20%, 5% and 5%, respectively. The
statistical values of these variables are relisted in Table 6.6. Some of the type of
distributions pertinent to those variables are given by referring to Yang and Lee (1991).
The reliability analysis on SWATH-FV has been performed by varying the
nominal stress ranges between 160 N/mm2 and 320 N/mm2. By imposing this variation
it is expected to allow for the effect of different stress levels on fatigue safety to be
observed. Two particular stress ranges of 290 N/mm2 and 250 N/mm2 are noteworthy
here since those two values are deterministically derived as the allowable stress ranges
for a 20 year and 30 year lifetime. As a reminder the latter has been compared to the
allowable 30-year lifetime stress of the T-AGOS. Hence it would be very interesting to
observe whether or not the reliability approach justify these deterministically derived
stress values.
The results from the reliability analysis are presented as in Figs. 6.10 and 6.11,
for the change of safety index and probability of fatigue damage as functions of
operating year, respectively. From various investigations Lee and Faulkner (1989)
suggest that the safety of marine structures can be assured if the safety index P for
ultimate strength of components can be kept within the ranges of 3.0 and 4.0. The
values for fatigue initiation could, however, be accepted between 2.0 and 3.0.
Referring to Fig. 6.10 the lowest stress range (160 N/mm2) would assure the safe life
of SWA 11I-FV approximately up to 25 years. Nonetheless, it would be unreasonable
to expect that a vessel such as SWA11I-FV which is designed to operate in the North
Atlantic will not be excited by waves much larger than that.
Regarding the the allowable stress for a 20-year lifetime (290 N/mm2) the fatigue
safety of the vessel may
be
preserved up to three years, although the probability of
failure in 20 years is very high (see Fig. 6.11). This information would necessitate a
Chapter
6-
Fatigue P erfo rm an ce o f SW AT II Ships
260

7/26/2019 1992djatmikophd.pdf
http://slidepdf.com/reader/full/1992djatmikophdpdf 288/507
thorough inspection to be performed at least in the first 3 years of the vessel's
operation. Excessive stress range (320 N/mm2) would definitely unfavourable to the
vessel because of the likelihood of fatigue damage. Focusing onto the stress range of
250 N/mm2 a slightly longer period (5 years) before the first inspection ought to be
carried is attained. Overall it seems that a lifetime stress range of 200 N/mm2 is the
most reasonable as the criterion for SWATI-I-FV. Considering this, the first extensive
fatigue check may be performed within a period of 10 years without too much risk.
This stress range apparently confirms that allowable stress imposed in the fatigue
design of the T-AGOS. Further checks, however, still need to be carried out before
design values can be firmly proposed.
6.4.2. Analysis
by
\Virsching's Method
As for deterministic analysis reliability against fatigue failure will be more
convenient to be evaluated by a simplified formulation. Using such a formulation safety
checks can be performed fairly quickly, especially when a large number of structural
component ought to be dealt with. An expression of fatigue reliability for offshore
structure has been derived by Wirsching (1984). The use of this fatigue reliability
format has been made for various type of structural member of offshore structure, e.g.
as presented by Wirsching (1986), and Wirsching and Chen (1987,1988). Eventually
the various evaluations using this reliability format has been fairly successful, and a
report by Wirsching (1985) was then accepted by the American Petroleum Institute
(API) in effect to be recommended in the code for design practice.
The derivation of the fatigue reliability expression by Wirsching (1983) was
performed using the simple lognormal format for multiplicative limit state functions.
Accordingly, lognormal distribution is adopted for the number of cycle to failure N as
in eq. (6.1), rather than Weibull distribution. In this respect fatigue strength coefficient
A is defined as random variable describing the inherent variability of the fatigue
strength. The median A defines the median S-N curve, and the coefficient of variation
(COV), C
A
, is the COY of N given S. Bias and uncertainty in Miner's rule are defined
by fl, i.e. the damage index at failure; the event of failure is D ~ fl. B is defined as the
parameter which describe the stress modelling error. fl, B and A are assumed to have
lognormal distribution with median (6, n, A) and COVs (C~.CB'CA)' respectively.
f
I
I
In order to calculate the probability of failure as in eq. (6.22), the reliability index
has been formulated by Wirsching (1983) which is:
Chapter
6 -
Fatigue Perfo rmance o f SW ATII Ships
261

7/26/2019 1992djatmikophd.pdf
http://slidepdf.com/reader/full/1992djatmikophdpdf 289/507
~=
In
(TITS)
OInT
(6.32)
where TS is service life in seconds and T is the median time to failure. that is ;
- X X
T=---
(Bm
n)
(6.33)
and
(6.34)
The stress parameter
n
in eq. (6.33) is defined to be the product of lifetime average
zero crossing period fo times the expected 'once in a lifetime' stress range. and may be
written as:
(6.35)
where fo = nJf
T
=
the time of exposure (seconds)
A computation has been performed to evaluate the fatigue reliability of class-D
weld joints as assumed for SWATH-FV using the above formulation. The same
uncertainty values for t:. and A as adopted in AFOSM analysis (see Table 6.6) are used.
The stress modelling uncertainties which was accounted for directly to the stress range
value in AFOSM analysis. is now given by
B =
0.90 and the corresponding coefficient
variation, CB
=
0.25. The results of this analysis are plotted together with that from
AFOSM fatigue reliability format as presented in Fig. 6.12.
As seen in that figure a fairly good correlation between the two results is evident.
especially for lower stress ranges. The discrepancy in the predictions for larger stress
range values probably is brought about the difference in the uncertainties of stress
modelling parameter. Nonetheless. this discrepancy is witnessed to take place below
the safety index value ~ of less than 2.0. that is the zone of unacceptable for fatigue
criteria as forwarded in the previous section.
Itmight be interesting also to explore the effect of applying different median
values of fatigue strength coefficient
X .
As shown in Table 6.6 the value of
X
adopted
in the above analysis is taken as the mean minus two standard deviations
(X=1.52·10
12
), i.e. as suggested by most design codes. If it is allowed to adopt
median value
X=3.99·10
12
•
that is the mean value for S-N curve of class-D weld
Chapter
6.
Fatigue Per fo rmance
0/
S lVAT II Sh ip s
262

7/26/2019 1992djatmikophd.pdf
http://slidepdf.com/reader/full/1992djatmikophdpdf 290/507
joints, then the reliability curves are as presented in Fig. 6.13. A substantial difference
with the former results is obvious. According to the latter results a once in life stress
range of 290 N/mm2 can
be
accepted for minimum criteria of safety index equal to 2.0,
and under the condition thorough inspection after 10 years operation have to be
performed. Interestingly, this value is the same as the allowable stress range Sea as
derived from the deterministic evaluation, even though the mean minus two standard
deviations value for A was used in this case. A remark to be made with the use of
Wirsching's fatigue reliability format is simply that this particular model is adaptable
and is recommended for a quick check in fatigue design for SWATIIs.
I
i
The reliability analysis adopted herein may be checked against other approaches
which are becoming available in recent years. Those reliability codes which are
developed specifically to tackle the fatigue problem on ships are by, among others,
Munse et al (1981), and White and Ayyub (1987).
6.5. DISCUSSION
Various important aspects in fatigue analysis for SWAruype vessels have been
studied. The specific aim of this study is to contribute further information regarding
fatigue design and performance of SWA111 ships. Of special consideration in SWA111
design is to attain a sufficiently safe structure but with a reasonably light weight.
Fatigue considerations would not only affect the initial design but should also be
beneficial during the operational life of a vesse1. Hence proper fatigue analysis and
design are not only beneficial in creating initial confidences but also as important in
reducing the service cost. In repaired ships most damages, as inspected by Jordan and
Cochran (1978), are found in the form of structural cracks. This type of damage is
likely caused by fatigue. A thorough fatigue evaluation will be important for SWA11Is
to enhance their commercial competitiveness.
The study was performed by first identifying several structural areas where
fatigue damage would likely to develop. Following this an evaluation of fatigue damage
is carried out by adopting the Miner's approach. In the next stages evaluations were
made by firstly deriving the WeibuU-shape parameter pertinent to the SWA Tlls so
studied. Those parameters are further incorporated in a simplified fatigue damage
formulation, which would allow different sensitivity studies to be made rapidly. A first
approximation to the allowable stress range has also been derived by employing the
simplified formulation. Design check was treated by means of the probabilistic
approach using two different formats, namely AFOSM and Wirsching's reliability
methods. A more reasonable value of stress range which should be adopted in the
design has been obtained by the later analysis.
Chapler
6 •
F atig ue re rfo rmn nce o f
sw
AT II S hip s
263

7/26/2019 1992djatmikophd.pdf
http://slidepdf.com/reader/full/1992djatmikophdpdf 291/507
The study rem ains inconclusive because certain inform ation needed is not yet I
J
available. This is the S-N data for the structural parts of SW ATHs where fatigue / ;;'
dam age is expected to be severe.
Furthermore,
fatigue damages concerned w ithin the ~
study are only lim ited to the level where initial crack on any particular part of the
structure takes place. In practice, how ever. fatigue analysis should also be concerned
I , /
w ith the problem s of crack propagation as addressed below s.
6.5.1.
Fracture Mechanics for Crack Propagation Analysis
Structural designers should realise that failure on a structural m em ber hardly
occur instantly after an initial crack. H ence it m ay be of concerned in the evaluation of
the required operational tim e before any repair ought to be perform ed. Such an analysis
requires the inform ation on crack grow th rate.w hich is characterised by the stress strain
fields at the vicinity of the crack tip and the range of the stress intensity factor. The
appropriate approach in solving this problem is by em ploying the fracture m echanics
analysis. This aspect is actually beyond the scope of the present study. but a brief
remark fo r fu tu re in vestig atio n sh ou ld be made .
Consider a single m em ber under axial tension fatigue as show n in Fig . 6.14. The
total fatigue life N t can
be
considered as :
N t =N . +N
I P
(6.36)
where N i = cycles to in itiate a crack. e.g. from fatigue S-N tests where
Ni=A/Sm
Np
=
further cycles to propagate a crack to a critical failure crack depth
a r
which may be determ ined from fracture mechanics (FM ) or
from ductile UTS failure of remaining material. or some other
criteria (depending on the nature of the structure and the load).
Upon the utilisation of FM analysis. the crack grow th is norm ally defined by the
Paris and Erdogan (1963) law as illustrated in Fig. 6.15. which is :
(6.37)
where C
=
crack g rowth rate p arameter
~K
=
the stress intensity range w hich is given by :
~K
= yea)
Seq
{ita
(6.38)
Chap te r
6-
F atigue P erfo rm an ce o f SW AT II Sh ips
264

7/26/2019 1992djatmikophd.pdf
http://slidepdf.com/reader/full/1992djatmikophdpdf 292/507
Y(a) = the geometry correction factor which can usually be assumed
con stant (and Y=1.12 o ften assum ed )
a = current crack depth
Seq = equivalent constant fatigue stress range. and is w ritten ~s :
S
Seq
= e
(r(m/ ~
+ l)l/m
(In n
)1/~
o
(6.39a)
or
(
)
l/m
S
=
AD
eq
nO
(6.39b)
If
one apply the Paris-E rdogan crack grow th law as in eq. (6.37) w ith further
assumptio ns :
-. no sequence effects
-. Klh
=
O .
i.e. no thresho ld level
-. a
o
is th e in itial crack size
it th en follows that in teg ratin g eq. (6.37) gives:
where
(6.40)
which. as we would expect (w ithin the assumptions made) is of sim ilar form to the
crack in itiatio n law NSm=A .
Taking the Class-D weld connection for the wet deck plate of SW A TIi-FY as an
exam ple (see Fig. 6.16). the crack propagation at position X can be analysed as in the
follow ing. Considers the lifetim e stress cycle and so on as given in the previous
sections. the allowable stress range for 20 year operation is found to be 290 N /m m2.
For th is. the equivalent constant stress for n
o
=8 . 7 .10
7
is :
Chapter
6·
F atig ue P erfo rman ce o f S WAT II S hip s
265
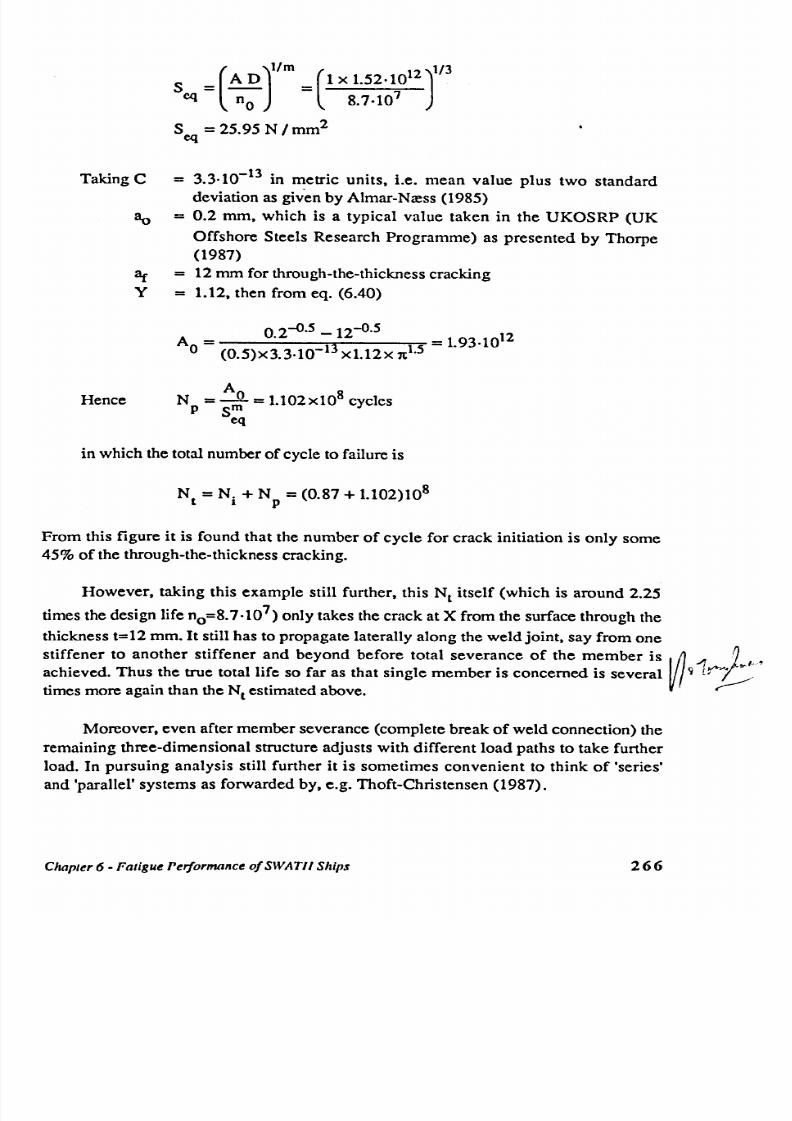
7/26/2019 1992djatmikophd.pdf
http://slidepdf.com/reader/full/1992djatmikophdpdf 293/507
( )
lIrn 1/3
S = AD =(1 x 1.52.\0
12
)
eq
c 8.7·10
S = 25.95 N /mm2
eq
Taking C = 3.3.10-
13
in ~etric units. i.e. mean value plus two standard
deviation as given by Almar-Nress (1985)
a a
= 0.2 mm, which is a typical value taken in the UKOSRP (UK
Offshore Steels Research Programme) as presented by Thorpe
(1987)
3 t = 12 mm for through-the-thickness cracking
Y
=
1.12. then from eq. (6.40)
°
2
-0·5 12-0.5
A = . - = 1.93.10
12
o
(0.5)x3.3.10-
1 3
xl.12x 1t1.5
Hence
A
N = rn
O
= 1.102xl0
8
cycles
P
S
eq
in which the total number of cycle to failure is
Nt = N. + N = (0.87 + 1.102)10
8
1
P
From this figure it is found that the number of cycle for crack initiation is only some
45% of the through-the-thickness cracking.
However. taking this example still further. this Nt itself (which is around 2.25
times the design life n
o
=8.7·1 0
7
) only takes the crack at X from the surface through the
thickness t=12 mm. It still has to propagate laterally along the weld joint. say from one
stiffener to another stiffener and beyond before total severance of the member is I~.,., .r J . , 1 _ '
achieved. Thus the true total life so far as that single member is concerned is several V
I
'1
L~
times more again than the Nt estimated above.
Moreover. even after member severance (complete break of weld connection) the
remaining three-dimensional structure adjusts with different load paths to take further
load. In pursuing analysis still further it is sometimes convenient to think of 'series'
and 'parallel' systems as forwarded by, e.g. Thoft-Christensen (1987).
Chapter
6·
Fat ig ue P e rfo rmance
0/
SW A TII Ships
266

7/26/2019 1992djatmikophd.pdf
http://slidepdf.com/reader/full/1992djatmikophdpdf 294/507
A series system, as exemplified by Faulkner (1983), is like a link chain or a series
of drill pipes screwed together to form a single tether or tendon in the Hutton TLP. A
through crack and severance represents the total failure of the chain or of that tether.
But, if as with the
TLP,
there are several structural system, then a failure in one tether
.
does not itself represents the total loss of capacity. For example, the remaining three
tethers in one corner (leg) of the
Hutton
TLP, would take further load, together with
some being transferred to the 12 intact tethers in the other three legs.
The same sort of arguments apply to stiffened 'continuous' plated structures,
such as the flat grillages and stiffened cylinders that make up ships and offshore
structures. Any crack which initiates has to propagate until a large section of the whole
structures is cracked. In many structures this may not happen as the crack may lie
'dormant' - stop propagating.
In view of these remarks it will be clear that there will generally be a significant
'reserve strength' beyond initiation of a fatigue crack (D>I). In summary this comes
from
-. further propagation of a crack through the plate surface, i.e. Nt=Ni+N
p
-. further propagation along or around (in case of cylinders) the plate
-. the stopping of the crack in redundant structures because other load
paths develop.
Hence the safety index 13
i
or initiation of fatigue can and should be much lower than
the ultimate strength.
Considering further, if lower bound values A (mean minus two standard
deviation) are used with Nsm=A, as most design rules require, then an 'annual' value
for safety index 13iof about 2.0 should be acceptable for most structures where the
reserve strength potential is significant. Nonetheless, a higher lifetime safety index, say
13
i
=3.0,is more appropriate for a critical member. Although this is sti1lless than the
safety index 13=3.7 (10-4 probability of failure) per year as required by Norwegian
Petroleum Directorate (NPD), but with careful monitoring the safety can be adequately
maintained as will be described later in Section 6.5.3. This account is in favour with the
fatigue criteria as proposed by Wirsching and Chen (1988) for TLP structure as listed
in Table 6.7.
6.5.2. Aspects of Fatigue Design on Light Weight Material (GRP)
As is forwarded in the previous chapters the need to explore further the use of
light weight material for SWATH constructions is obvious. Composite material is one
of the promising choice for such applications. As is described by Spaulding (1966) the
Chapter
6·
Fatig ue P erfo rm an ce o f SWAT II S hip s
267

7/26/2019 1992djatmikophd.pdf
http://slidepdf.com/reader/full/1992djatmikophdpdf 295/507
use of glass-reinforced plastics (GRP) in m arine structures was pioneered by the US
Navy for boat constructions. The significant grow th of GRP boat constructions
between 1955 to 1972 is notably from 4% to 80% . At that tim e the application ofFRP
was mainly intended to replace the use of woods as the traditional boat build ing
m aterial. Sm ith (1990) clarifies the attributes of G RP in preference to woods in boat
co nstructio ns as :
a. competitive first cost, particularly where many hulls are built to the same
design, enhanced by the increasing cost of wood and scarcity of skilled
woodworkers;
b . trouble-free perform ance and low m aintenance costs resulting from the leak
proof, rot-proof qualities of GRP hulls, their resistance to marine boring
organism s and low cost of repair;
c. the ease w ith w hich com plex shapes, w hich m ay be required for hydrodynam ic
an d structural p urp oses o r for aesth etic reaso ns, can be fabricated .
Larger ship constructions using GRP in recent years are mainly for m ine counter
m easure (M CM ) vessels. In this respect low m agnetic signature of such m aterial is the
m ain attraction. M ore on the prospective applications of GRP in m arine activ ities are
discussed by Sm ith (1990) and G ullberg et al (1991).
W ith respect to the ship structural design w ith the use of com posite m aterials
G ullberg et al (1991) suggest that the designer m ust establish w hat tangible factors that
interact to influence the behaviour of such m aterials. T hese factors ranging w idely from
the chem ical compositions of the material, reinforcement method, etc right to the
possible m ode of failure of the constructed structures. C halm ers et al (1988) considers
that for general m arine applications the use of sim ple isotropic theory for structural
design is acceptable. E ven though, it is also em phasised that the m aterial is essentially
anisotropic, and for design of details and for an understanding of m odes of failure m ore
sophisticated design m ethods ought to be em ployed. In the follow ing discussion is
focused on the failure m ode of G RP as associated to fatigue loadings.
Unlike steel structures where vast fatigue data is now available, fatigue
information on GRP is much scarce. W ithin lim ited information on fatigue of GRP
some findings on the mode of failure follow ing cyclic load persistence has been
established. Fatigue failure on FR P is different from m etallic m aterial w here a crack, as
it extends, carries w ith it a severe stress concentration at its tip and is therefore likely to
propagate until it reaches a low stress region. Sm ith (1990) reveals fatigue failure in
GRP lam inates containing bidirectional and m ultid irectional fibres is less highly
focused: fibres parallel to the direction of tensile load provide a crack-arresting action
and fatigue damage takes the form of a diffuse patch of resin cracking and fibre
debonding, possibly including som e fibre fractures. L ocal m oduli in the dam age zone is
lik ely to atten uate th e stress co ncen tratio n th ereb y in hib itin g d amag e p ro pag atio n.
Chapter
6-
F atig ue P er fo rman ce o /S WAT II S hip s
268

7/26/2019 1992djatmikophd.pdf
http://slidepdf.com/reader/full/1992djatmikophdpdf 296/507
Typical S-N curves for marine-type GRP laminates as compiled by Smith (1990)
are shown in Fig. 6.17. Two types of laminates, namely woven rovings (WR) and
chopped strand mats (CSM), are depicted in this figure. The full lines refer to complete
failure under fully-reversed loading with zero mean stress, whereas the dotted lines
indicate the onset of initial damage, that is fibre-debonding and resin cracking.
Appropriate S-N data of GRP laminates such as this can be incorporated in fatigue
analysis employing the Miner's cumulative damage law together with histograms of
irregular cyclic loading as described in the previous sections. An alternative, quadratic
version of this cumulative damage criterion has been found to give improved results for
CSM GRP laminates. This quadratic version was introduced by Howe and Owen
(1972) which is expressed as:
(6.41)
where A and B are empirical constants. Cumulative damage expressions of this type
may be related by either to initial fibre-debonding or to final laminate failure.
6.5.3. Fatigue Inspection and Repair Strategy
Up to this point the study has concerned mainly on the development of
understandings necessity in ship design level without considering the lifetime process
of ship operation. In this case the term of lifetime process may be narrowed to the
maintenance of the ship. This might sound reasonable, since the current practice
regards the two matters as a separate issue which ought to be dealt with by different
specialists. Moreover, the hindrance of dealing with the two subjects as an integrated
problem chiefly due to the difficulties in formulating the maintenance strategy as a
scientific discipline. However, Skaar et al (1991) pointed out the growing research in
the field of scientific maintenance method designated the 'terotechnology'.
It is not the intention of this section to discuss that immature technology, but the
recent research development may indicate the way towards the future trend of ship
maintenance strategy. Theft-Christensen (1987) has recently shown the necessity of
transferring reliability method into the scope of ocean structure inspections, which in
tum could be of use to formulate the repair/maintenance planning. The adoption of
probabilistic method in repair and maintenance activities should not be interpreted as to
increase the reliability of structures, but to guarantee that the predefined safety level is
maintained. Moreover, maintenance may be related to preventive actions necessary to
Chapter
6 •
Fatigue Per fo rmance
0/
SWAT II S hip s
269

7/26/2019 1992djatmikophd.pdf
http://slidepdf.com/reader/full/1992djatmikophdpdf 297/507
keep up the safety level, while repair is the same as corrective maintenance, which
means actions to restore the safety level when lost for some reason.
Maintenance of ocean systems generally, as required by classification societies, is
preceded by regular inspections throughout the life of the systems. Madsen et al (1987)
has presented the methodology to incorporate probabilistic method in fatigue inspection
of an offshore platform. Information from regular survey and inspection has been used
in this matter. The inspection of fatigue cracks in this case was performed by Magnetic
Particle Inspection (MPI) which is far more accurate than visual inspections. The
probability of detecting a crack is a function of its surface crack length. Accounting for
uncertainties in fatigue life predictions and reliability of the inspection method in the
mathematical model, the fatigue reliability can be then updated according to Bayesian
theory.
The above implies that if no failure has been identified the current probability of
element failure may be reduced (current reliability increased), with a factor reflecting the
quality of inspection method. This factor is the ratio between conditional probability of
not detecting a failure with the present inspection technique given that a failure is
present, and the current reliability of the member. The updated fatigue reliability for a
fixed inspection interval is shown in Fig. 6.18. Inspection interval can actually be
optimised while maintaining a prescribed minimum reliability level. If no cracks are
detected during inspection interval is increased as function of service life, as illustrated
in Fig. 6.19.
In the case where fatigue cracks have been detected, the decision is then to be
made as wether or not a repair should be performed. This particular decision concerns
especially if difficulties and costs to underway the works are of stubborn, inaddition to
the consideration of the importance of such member on the integrity of overall structure.
In case the decision should call upon repair works, then remedial actions may be
performed by selecting one or more of the five choices belows :
-. local repair of cracks
-. replacement of part of the structure
-. reinforcement of the structure
-. repair of protective coating
-. repair of cathodic protection.
For small fatigue defects normally the first choice will be considered. Skaar et al
(1991) indicates that direct weld repair of a structure which has cracked because of
fatigue loading is never very satisfactory because the weld quality will, almost
invariably, be worse than the original. The repaired weld will thus fail even earlier than
the original one unless certain treatments are made to reduce stress concentration at that
Chap te r
6-
F atigue P erfo rm an ce o f SW AT II Ships
270

7/26/2019 1992djatmikophd.pdf
http://slidepdf.com/reader/full/1992djatmikophdpdf 298/507
repaired member. The most significant method to fulfil this need is by as much as
possible reducing the primary load that governs fatigue performance of the structural
member. It is suggested then to avoid dominant waves, and other extreme load such as
slamming, during ship operation. Nevertheless, such a method is hardly practical for
actual operation.
The most practical way in an attempt to reduce local stress concentration probably
is by certain reinforcements, e.g. using insert plate or additional support. In recent
years the application of metal adhesives for crack repair has spread out significantly.
The advantages of using adhesives are, for examples, that lagging, cables and pipes etc
at ambient of the repaired member do not have to be removed as they do for weld
repairs, as well as possibly much reduced residual stress. Allan et al (1986) describes
in detail the aspects of metal adhesives utilisation in ship repair. The Department has in
recent years involves with the research on metal adhesives for use in ocean structures,
e.g. as presented by Winkle et al (1990). The study of metal adhesive for SWATH
fabrication may be of interest for future research.
6.6. CONCLUSIONS
A preliminary analysis of fatigue behaviours on SWATH type vessels is put
forward. Design procedures, involving a full spectral analysis followed by the
simplified approach, commonly practised by conventional ship and offshore structure
designers are adopted. Some aspects of SWATH fatigue performance has been
addressed, although much more remains to do. Case studies on two hypothetical
SWATHs, size of approximately 2500-tonne, operating in the North Atlantic region
have been performed to illustrate the implementation of the design procedures.
One of an interesting results drawn from the analysis is the newly introduced
Weibull shape parameters ~ pertinent to those SWATHs. Parameter values of 0.94 and
0.945 were derived for SWA TH-FV and SWATH-3, respectively. These figures fall in
the range of those normally applicable to monohull ships, i.e. between 0.7 and 1.3.
Although Munse et al (1983) suggest that lifetime stress distributions for most
monohulls of this size (2500 tonnes) are typically represented by the parameter values
in the order of 1.0 to 1.3. Further, Clarke (1991) indicates an exponential cyclic load
distribution, in which ~ = 1.0, has been widely practised in the Royal Navy warship
designs. Such values, however, remain open to further refinement, especially if a wider
range of wave scatter data representing the operational areas has been examined.
The allowable stress range as one of the most important measure in fatigue design
has been evaluated. Stress ranges of approximately 290 N/mm2 and 250 N/mm2 have
been detenninistically derived for a 20-year and 30-year lifetime, respectively. The
Chapter
6·
Fatig u« P er fo rman ce o f SWATII
Ships
271

7/26/2019 1992djatmikophd.pdf
http://slidepdf.com/reader/full/1992djatmikophdpdf 299/507
latter was compared with the design stress for the T-AGOS, in which a design stress
range of some 190 N/mm2 is adopted for 30 years operation. The difference of the two
values eventually is quite large, hence necessitated design check by way of probabilistic
approach to be performed.
Two different reliability methods have been implemented for the analysis. The
first method is a general advanced first order second moment (AFOSM) code which
was developed in the Department by Pu (1992), and the second is fatigue reliability
format by Wirsching (1984). The results from both analysis correlate fairly well for
most stress ranges that have been investigated. These results suggest that a design
stress range value of some 200 N/mm2, which is close to that adopted for T-AGOS,
should be acceptable and would give an adequate fatigue safety for SW ATIl-FV for a
30-year operation provided thorough inspection can be performed every la-year
interval.
The corresponding safety index after 10 years operation for the above stress range
is approximately 2.0. It is initially from the rule of thumb that safety index of 2.0 to 3.0
is acquired for fatigue failure, that is based on the recognition that crack initiation on a
structural members would not bring a catastrophic failure of SWATIl structure. Later
on a calculation regarding fatigue crack propagation was performed which conclude that
much larger cyclic number (in the order of 2.25 times that for crack initiation) is
required to bring a through the thickness cracking. This finding thus confirm the safety
index so adopted. Another confirmation on the above target safety index is provided by
Wirsching and Chen (1988) as shown in Table 6.7.
Full analysis on SWATIl has yet not been able to be performed because of the
limited information which is currently available, especially for the S-N data pertinent to
the critical members of SWATIl structure. Nonetheless, future direction to the research
on SWATH fatigue performance, which involve fracture mechanics for crack
propagation analysis and maintenance strategy, has been adequately pointed out.
Chapter 6 - Fat ig ue P e rfo rmanc e 0/ SW A TII Ships
272

7/26/2019 1992djatmikophd.pdf
http://slidepdf.com/reader/full/1992djatmikophdpdf 300/507
Table 6.1. Fatigue life of the 2500-tonne SW A TH -FV com puted
by Miner's rule (fo r C lass-D weld)
BM(MNm)
ni Stress (MPa)
Ni
nifNi
5.00
48082523.80 2.74
73602016400.00
0.000653
15.00
15556294.60
8.22 2726000607.41
0.005707
25.00 8117786.20 13.70 588816131.20
0.013787
35.00
4772118.40
19.18 214583138.19
0.022239
45.00 2860000.00 24.66 100962985.46
0.028327
55.00 1739176.60 30.14 55298284.30
0.031451
65.00 1072957.20
35.62 33501145.38
0.032027
75.00 668399.80
41.10 21808004.86
0.030649
85.00 419379.80 46.58 14981073.97 0.027994
95.00 264852.00 52.05
10730721.15
0.024682
105.00
168182.80
57.53 7947523.64
0.021162
115.00
107227.20 63.01 6049315.07 0.017726
125.00 68534.00
68.49 4710529.05
0.014549
135.00 43852.60
73.97
3739369.83
O.oI1727
145.00
28060.60
79.45 3017836.58
0.009298
155.00 17940.80
84.93
2470612.48
0.007262
165.00
11453.40 90.41
2048084.60
0.005592
175.00
7298.80
95.89
1716665.11
0.004252
185.00
4640.60
101.37
1453063.32
0.003194
195.00
2944.40
106.85
1240783.16
0.002373
205.00
1863.20
112.33
1067918.58
0.001745
215.00
1175.80
117.81
925730.02
0.001270
225.00 740.40
123.29
807703.88
0.000917
235.00
464.60
128.77
708918.22
0.000655
245.00
291.20
134.25
625606.82
0.000465
255.00
182.00
139.73
554854.59
0.000328
265.00 113.00
145.21 494381.38
0.000229
275.00 70.00
150.68
442386.27
0.000158
285.00 43.00
156.16 397434.12
0.000108
295.00 26.40
161.64
358371.68
0.000074
305.00
16.20
167.12
324265.10
0.000050
315.00
10.00
172.60
294352.73
0.000034
325.00 5.80
178.08 268009.16
0.000022
335.00 3.80 183.56 244717.66 0.000016
345.00 2.20 189.04
224048.71
0.000010
355.00
1.20
194.52 205643.35
0.000006
365.00
1.00 200.00
189200.00 0.000005
375.00 0.20 205.48 174464.04 0.000001
385.00
0.00 210.96 161219.49
0.000000
395.00
0.00
216.44
149282.34
0.000000
405.00
0.00
221.92
138495.18
0.000000
D= 0.320742
F atigue L if e ( yT s).,.
62.355347
Chapter
6•
Faligu~ Performance of SWATII Ships
273

7/26/2019 1992djatmikophd.pdf
http://slidepdf.com/reader/full/1992djatmikophdpdf 301/507
Table 6.2. Iterative computation of Wei bull-shape parameter (~) for SWATII-FV
D = 0.3207 (from D=}:(n/Ni) calc.}
Se = 200
N/mm2
A = 1.5136'10
12
no
=
8.4019'10
7
m
=
3.0
m/~+
1
r(m/~ + 1)
D (damage)
0.9000
4.3333
9.2605
0.2571
0.9100 4.2967
8.8166 0.2722
0.9200 4.2608
8.4032 0.2879
0.9300 4.2258
8.0179 0.3042
0.9350 4.2085
7.8447
0.3129
0.9360 4.2051 7.8093 0.3146
0.9370 4.2017
7.7764 0.3164
0.9380 4.1982
7.7391 0.3180
0.9390
4.1948
7.7070 0.3198
0.9400
4.1914 7.6667 0.3213
0.9500 4.1578
7.3380 0.3391
0.9600 4.1250
7.0354 0.3577
0.9700 4.0927
6.7477 0.3767
0.9800 4.0612
6.4785
0.3964
0.9900
4.0303
6.2345
0.4173
1.0000 4.0000
6.0000
0.4385
Table 6.4. Comparison of the fatigue lives of SWA TH-FV for all heading
weighted (A) and beam sea dominated (B)
- - - - - - - - - - - - - - - - - - - - - - - - - - - - - - - - - - - - - - - - - - - - - - - - - - - - - - - - - - - - - - - - - - - - - - - - - - - - - - - - - - - - - - - - - - - - - - - - - - - - - - -
Se (N/mm2)
D (All heading)
Life-A (years) D (Beam)
Life-B(years)
- - - - - - - - - - - - - - - - - - - - - - - - - - - - - - - - - - - - - - - - - - - - - - - - - - - - - - - - - - - - - - - - - - - - - - - - - - - - - - - - - - - - - - - - - - - - - - - - - - - - - - -
100.00 0.04017 497.95
0.14564 137.32
120.00 0.06941 288.16 0.25167 79.47
140.00 0.11021 181.47
0.39964
50.05
160.00
0.16452
121.57
0.59655 33.53
180.00
0.23424
85.38
0.84938 23.55
200.00
0.32132 62.24
1.16513
17.17
220.00
0.42768 46.76
1.55079
12.89
240.00
0.55524
36.02 2.01335
9.93
260.00
0.70594
28.33 2.55980
7.81
280.00
0.88170
22.68
3.19713 6.26
300.00
1.08446
18.44
3.93233
5.09
320.00 1.31613 15.19 4.77239 4.19
340.00
1.57865 12.67
5.72430 3.49
360.00
1.87394
10.67 6.79506 2.94
380.00
2.20393
9.08 7.99165
2.50
400.00
2.57056 7.78 9.32107
2.15
- - - - - - - - - - - - - - - - - - - - - - - - - - - - - - - - - - - - - - - - - - - - - - - - - - - - - - - - - - - - - - - - - - - - - - - - - - - - - - - - - - - - - - - - - - - - - - - - - - - - - - -
Chapter
6•
Fatigue Perfo rmance o f SW ATH Ships
274

7/26/2019 1992djatmikophd.pdf
http://slidepdf.com/reader/full/1992djatmikophdpdf 302/507
Table 6.3. D ependance of the SW A TH -FV 's fatigue life on
the We ibull-s hape par ame te r
C lass-D W eld S-N data
Se = 200 N/mm2; no = 8.4'10
7
F atig ue L ife (y ears)
Sensitivity
(%)
0.850 33.7604
+
68.8018
0.860 31.7270
+
58.6349
0.870 29.8472
+
49.2362
0.880 28.1070
+
40.5348
0.890
26.4922
+ 32.4610
0.900
24.9975
+ 24.9873
0.910 23.6065
+
18.0327
0.920 22.3200
+
11.5999
0.930 21.1278
+
5.6390
0.940
20.0000 0.0000
0.950
18.9536 - 5.2320
0.960
17.9677 - 10.1617
0.970
17.0607 - 14.6963
0.980 16.2134
- 18.9330
0.990
15.4011 - 22.9946
1.000 14.6550
- 26.7249
1.010 13.9549 - 30.2255
1.020
13.2957
- 33.5217
1.030 12.6788
- 36.6059
1.040 12.0928
- 39.5361
1.050
11.5478
- 42.2612
Chapter 6- Fatigue P erfo rm nnce o SW AT JI Ships
275

7/26/2019 1992djatmikophd.pdf
http://slidepdf.com/reader/full/1992djatmikophdpdf 303/507
Table 6.5. Effect of different weld classes to the fatigue life of SWATII-FV
(Allowable extreme stress range, Sca=290 N/mm2)
.
- - - - - - - - - - - - - - - - - - - - - - - - - - - - - - - - - - - - - - - - - - - - - - - - - - - - - - - - - - - - - - - - - - - - - - - - - - - - - - - - - - - - - - - - - - - - - - - - - - - -
Weld Class
A m
Damage Fatigue Life Sensitivity
(0)
(years)
( %
- - - - - - - - - - - - - - - - - - - - - - - - - - - - - - - - - - - - - - - - - - - - - - - - - - - - - - - - - - - - - - - - - - - - - - - - - - - - - - - - - - - - - - - - - - - - - - - - - - - -
B
1.01E+15 4.0 0.000069 291869.86 1459249.3
C
4.23E+13
3.5
0.007668 2608.36 12941.8
D
1.51E+11 3.0 1.000000
10.00
0.0
E
1.04E+12 3.0 1.461539
13.68
-31.6
F
6.32E+l1
3.0
2.405064
8.32
-58.4
F2
4.31E+ll
3.0
3.526683 5.67 -71.6
G
2.48E+ll 3.0
6.129035 3.26
-83.7
W
1.57E+ll
3.0
9.681532 2.07 -89.7
Table 6.6. Data for fatigue reliability analysis
Variable
Mean
mv
Dist type
- - - - - - - - - - - - - - - - - - - - - - - - - - - - - - - - - - - - - - - - - - - - - - - - - - - - - - - - - - - - - - - - - - - - - - -
6 1.0
0.50
Log-Normal
no
8.40 x 10
7
0.05 Log-Normal
A 1.51 x 10
12
0.31
Log-Normal
m
3.0
0.03
Normal
S Varying
0.20
Log-Normal
~
0.94
0.05
Log-Normal
Table 6.7. Fatigue design criteria for TLP deck and hull structure
- - - - - - - - - - - - - - - - - - - - - - - - - - - - - - - - - - - - - - - - - - - - - - - - - - - - - - - - - - - - - - - - - - - - - - - - - - - - - - - - - - - - - - - - - - - - - - - - - - - - - - -
Target Safety
Index,l3
o
Application
Target Damage
Level,l\o
2.0 The structure is redundant and cracks are easily inspected 0.55
and repaired; used for deck structure, mating joints, main
body of cylinders and pontoons, and production risers
2.5 For redundant and non-critical structure which is non- 0.35
inspectable, i.e., non-inspectable deck structure
3.0 The structure is critical and, while inspection is possible, 0.22
repairs are expensive; used for pontoon/cylinder interface,
main braces, and for tension pile pullout
- - - - - - - - - - - - - - - - - - - - - - - - - - - - - - - - - - - - - - - - - - - - - - - - - - - - - - - - - - - - - - - - - - - - - - - - - - - - - - - - - - - - - - - - - - - - - - - - - - - - - - -
C hapter6 - Fatigue Performnnce o f SW AT II Ships
276

7/26/2019 1992djatmikophd.pdf
http://slidepdf.com/reader/full/1992djatmikophdpdf 304/507
c·
I
I'
I'
0
I
,
-
.
,
[ I f
0
.
I
I
Y i J
' J I
ID
G J
. . . .
0
'-
[
I
a. J
/
0
I J
~ I
-
II':
II I
0
~ ( J
. . . .
s:
. . . .
'-
0
-
U
<
I
I
I
I
J J , J I
/ 1
' J I I
Vii J
N
V l
7
IOUOW ~lL..( ):J
I
J .
. . ,
II
,I
I,
1/1
\ I
7111
~
1 / /I )
' h
Y h
I
/ /
J/
.IJlfI
'I
Iff
rl
~
.
~ r h
I
,I
v
II
m IT
I
v V V V
III
•
,
0
_>-
o
. . . .
o
'-
•
.C l
0 5
....z
o
. . .
'0
. . . .
· 0
. . .
':0
-
o
o
o
. . .
o 0
o ...
. . . .
OdW
e6uoJ sseJ l S
. . .
Chapter
6 -
Fatig ue P erfo rman ce o f SW AT II S hip s
.
-'
I.d
a
bf)
. . . .
~
277

7/26/2019 1992djatmikophd.pdf
http://slidepdf.com/reader/full/1992djatmikophdpdf 305/507
'8
.c
-
l)
E
c : :
0
. . . . .
-
o
_
0
Cl)
1-0
c,
Cl)
::3
.~o
. . . . .
~
c.-.
0
u
_
. . .
~
E
Cl)
.c
u
V,l
c - 4
0
\0
. . . .
Cl)
1-0
::3
b
00
_
-
~
0
~
~
-
;>
:;
~
b
lJ..
. . . . .
;;J
-
0
U
<II
~
~Z
>. •
. . . .
o
Cl.)
~
-
. . . .
0
-
00
. . . .
SS~J1SUa ~a
t
A
(
'\
0
. . . .
b
:g
-
:;:J
0
~
. . . .
. . .
E o -
u
U
.)
c : :
~
b<'J
-]
~
Cl.)
u
Cl.)
~~
Cl.)
. . . .
~
~
E o -
Cl.)
. . . .
0
. . . .
00
-
SS~J1S SS~J1S
Chapter
6.
F atig ue P er fo rman ce o f S WAT II S hip s
278
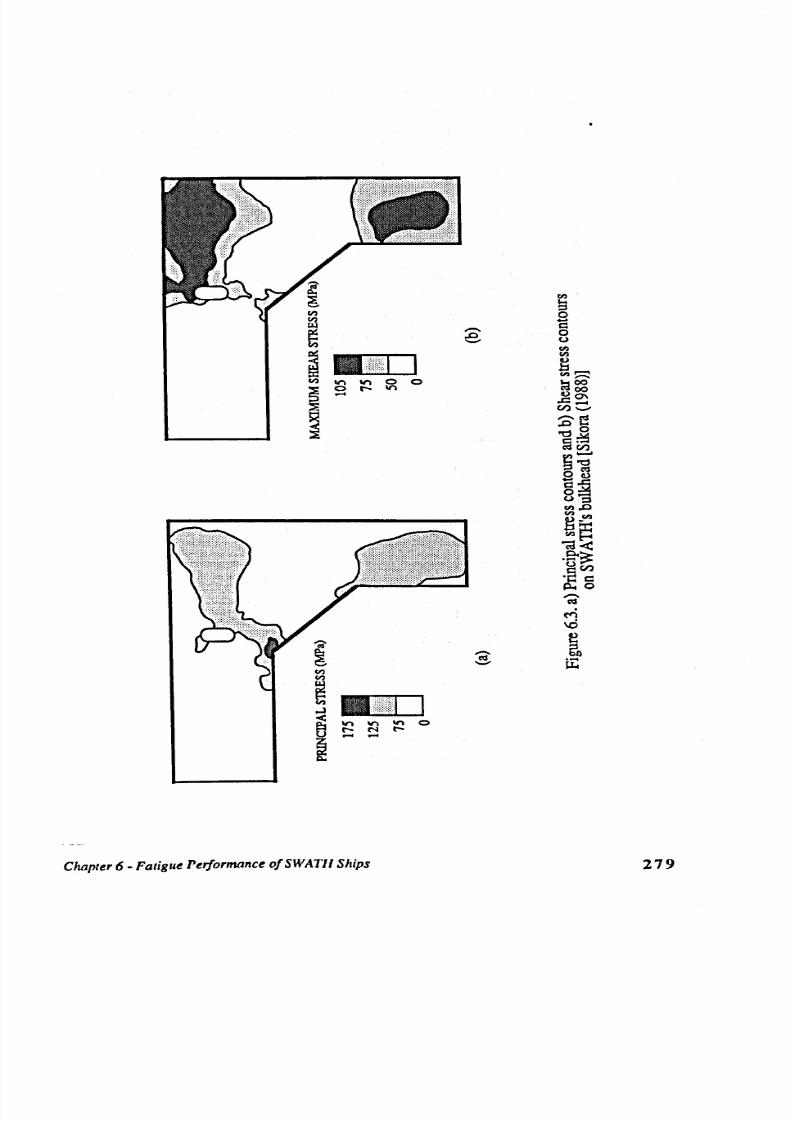
7/26/2019 1992djatmikophd.pdf
http://slidepdf.com/reader/full/1992djatmikophdpdf 306/507
m
m
~
0
la
. . . .
c ::
~
.-
0
.0
- -
U
~
m
m
g
m~
II)
0 0
~ ? ; 5
i
0
e-
1 1 1
. . . .
_ g ~
U)C
. - ~
.0
0
~~
~; '
o~
....
g~
U:;l
mo
mm
g-
t n~
c ; 1 <
.e-~
UU)
~g
.-
~
~
\c i
'2
~o
~
2
. . . . .
- -
~
m
II)
~
..J
;
1 1
0
r - -
N
r - -
. . .
. . . .
Chapter
6 -
F atig ue P er fo rman ce o f S WAT II S hip s
279

7/26/2019 1992djatmikophd.pdf
http://slidepdf.com/reader/full/1992djatmikophdpdf 307/507
200
180
N -
<
e
160
g _
~
~
140
til
~
: : s
120
1)
.§
~
100
200
180
N -
e
160
b
~
g
140
til
H
: : s
120
1)
e
.p
~
~
100
SWA&-3
I I
.......
SWAlH-FY-
i\
-,
i'..
<,
-
. . . . . . . . .
i '--
~
80
o
40 60 700 20
30
50
Fatigue LiCe(years)
Figure 6.4. Fatigue life of tw o SW A TIl vessels in the N orth A tlantic
based on the m ean lifetim e stress and C lass-D w eld joints
SWA'&-3
I
I
.-.-
...
SWAlH-FY-
,\
\\
~.
r o - . . .
~
.
.
. .
. .
. . . .
~
. . . . . .
~
. . . . . . . .
. . . . .
.
80
o
10 20 30 40
60 70
0
Fat igue Life (yea rs )
Figure
6.5.
Fatigue life of two SW A TIl vessels in the N orth A tlantic
(equal stress range proportion for the tw o vessels)
Chap te r
6 -
Fa tig u e P e rfo rmanc e
0 /
SW A TII S hips
280

7/26/2019 1992djatmikophd.pdf
http://slidepdf.com/reader/full/1992djatmikophdpdf 308/507
-
0
0
0
<0
I : t ;
C\I
0-
0
0
0
0
Chap te r
6 -
Fatigue P erfo rm ance o f SW ATll Ships
N
o
~
I
~
d
<'2
0
~.g
. . . . .
~
cn~
0
d
]§.
~
ff I'd
0
~~
~
0
<·S
d
0
~.g
0
.... t':S
K
00
0
. . , < 1 1
0
.~~
eo
~ . M
f a
..... 0
. . . .
~£
ell
C<II
ell
: . a £
~
t':S0
Cl)
~ . 8
~e
~
. . . . .
~
281

7/26/2019 1992djatmikophd.pdf
http://slidepdf.com/reader/full/1992djatmikophdpdf 309/507
220
200
~
180
e
~
6
160
~
til
~
140
: : s
c >
.~
120
~
. . . : I
100
I
1 '
I
(
~=O.8S
•
· '-
'\ \
\\
- - - - - - - - ~=0.90
, j
I
I
•
I
~',
~=O.94
l \ \~
•
•
· .-
\.
-
....._
...
~=1.00
\
•
•
•
•
----
~=
LOS -
~\\
,\
- ,
r-,
\
' .
'\.
'
. .
,,
r-
'. . . . .
r-,
,
~ ''''
. . . .
~ . .
,.
. . . . . .
,
. . . . . . .
'''_
.
. . ._
. . . .
-,
.
. . . . .
- -
. .
--
,
. . . . . . . . . . . . . . .
- . . . . . . .
. . .
~
. . . .
. . .
. .
_
~ .
. .
.
.
80
o 10 20 30 40 50 60 70 80 90 100 110
Fatigue L ife (y ea rs )
Figure 6.7. Fatigue life of SW ATH-FV in the North Atlantic
(fo r d ifferent Weib ull shap e p aram eters)
2nd D EC K
~l
SECTIO N 1
l~
M AIN D ECK
LONGBLKD
W ET D ECK
SECTION2
SECTION3
H IG H S TR ES S = •
....EIF--- F
Figure 6.8. SW A TH notation for the dctcnnination of SC Fs
[Sikora (1988)]
Chapter
6·
F atig ue P etfo rman ce o f S WAT II S hip s
282

7/26/2019 1992djatmikophd.pdf
http://slidepdf.com/reader/full/1992djatmikophdpdf 310/507
f
LOAD
RESISTANCE
o
f
SAFETY MARG IN
Z=R- L
o
Figure 6.9. Probability distributions of load (L) and resistance (R)
Chapter
6 -
Fatig ue P erfo rman ce o f SW AT II S hip s
283

7/26/2019 1992djatmikophd.pdf
http://slidepdf.com/reader/full/1992djatmikophdpdf 311/507
4. 0
-------
Se-2ooMPa
I
Se-250MPa
I
3. 0
Se=290MPa
I
. g
..
. _ . _ .
Se-320MPa
o S
~
2 . 0
. . . . .
...._.
. . . . . . . . .
Cl)
. . . . . .
. . . . . . . . . . .
. . . . . . .
. .
_ - -
. . . . . . . . - . .
1. 0
- - - - - - - - -
Operatin g Y c ar
F ig ure 6.10. C han ge o f fatig ue reliab ility
with
ope ra tin g time
for
SWATH-FV
10
0
10.
1
jt
~
10.
2
~
Cl
~
10.
3
.
~
I.I.
. . . .
0
10.
4
;-
a
~
10.
5
' : : : : . ' : : : : ::
...
- _
...
-
.::::::.::: . .~
. _ . - _ ..._ .
-----
....
_ - -
,,_ . .
. , , . .
- , .
f o '
,
- - -
- - - - - - - - -
. r , .
V
. - - _
...
---
-
.
,
,.,
- - - _ . - -
- - - -
/
- -
._ _ _ _
.
. 1 . . . - - -
, . -
f
~
. . . . . . .
,
, . . . . . . . .
,
V
Se-160MPa
,
I
I
,
. ..
Se .. 200 MPa -;
I
I
I
Se-250MPa
I
I
----
Se - 290 MPa -;
I
I
I
...........
Se=320MPa
I
I
5
10
15
20
25
Ope ra tin g Yea r
Figure 6.11. Probability of fatigue dam age on SW A TIl-FV
(C lass-D weld jo in ts)
Chapter 6- Fatigue Perfo rmance o f SW ATH Ships
30
284

7/26/2019 1992djatmikophd.pdf
http://slidepdf.com/reader/full/1992djatmikophdpdf 312/507
o. o~~~~~~~~~~~~. _~~~~~~~~~
o
5
10
15 300
25
Ope ra tin g Yea r
Figure 6.12. Change of fatigue reliability w ith operating tim e for SW A TH -FV
as predicted by A FO SM (A ) and W irsching
\W)
methods
6. 0
S . O
4. 0
~
'0
.s
3. 0
~
~
Cl')
2. 0
1. 0
0. 0
0
. . . . . . . .
-
-200 N/nm2·Al
--- . - -
...,....-
........
- . . . . . . . . _ _
. . . . .
. .
5
10
25
30
5
20
Ope ra tin g Yea r
Figure 6.13. Change of fatigue reliability w ith operating tim e for
SW A TII-FV as predicted by W irsching's m ethod
Chap te r
6-
F atigue P erfo rm an ce o f SW AT II Ships
S-160 N/nm2·A 1
S0-200N/nm2·Al
S0-150 N/nm2·A 1
80-290 N/mm2·A1
80-320 N/nm2·A 1
8e-150 N/nm2·A2
8e-290 N/mm2·A2
Se-320 N/nm2·A2
Al=3.99E12
A2=l.S2E12
285

7/26/2019 1992djatmikophd.pdf
http://slidepdf.com/reader/full/1992djatmikophdpdf 313/507
- - - - - - - - - - - - ~
~
]
~
( joI)
NP/nP
'~llr~ t{1MOJD '1:llrJ:)
~
+ 1
Chap te r
6·
F atigue P erfo rm an ce o /SW AT II Sh ips
0
. . .
bl)
~
5
0
0
c a
~
- s
~
~
0
u
th ~
~
>.
~~
. < ; ; :
e ~
ll
c : :
Cl)
-
ObJ)
o S
6'00
ut
'0 E
ll
U
~~
: 1
til
... J,
~
C l
~.~
u
'O~
1)
N
a
]
-
l l : : :
~ §
bl)
c:
<
t o Q C
'0
~
vi
.S e r r
-
10 4 0
0..
-
~ ~
~
\d
j > . 1 0 4
0
(I)
~
ut u
'0
~ e
~
~
ti:
u ._
~
]
~
til
I
C
~
0
~
'0
-
'
(I)
~
~
. . .
. .
::J
..0
0
-
s -
. . . .
N
en
I
c a
c
. . . . .
.c:
~Q)
. . .
~
~
il
~
0
8
\d
-
d
~
bl)
. . . . .
~
286

7/26/2019 1992djatmikophd.pdf
http://slidepdf.com/reader/full/1992djatmikophdpdf 314/507
- FIN A L FA ilU RE
- - - - IN IT IA L D A M A G E
WR ...
. . .
'
'
'
. . . . . .
W R
C S M - _ - _
_ _ _
-
_ _
C SH
- _
------
10 10' 10. 10
S
C Y C L E S
Figure 6.17. T ypical S-N curves for m arine-type G RP lam inates
[Smi th (1990) ]
~
6
c : o .
. . . . .
M
. . . . .
ill
<,
C S
. . . . .
.9
4
. . . .
,
. . . .
>.
. . . . .
+J
. . .
. . . .
_
. .
-
. . . . . . .
-
_
- -
-
0
. . . .
r o
-
-
_
2
- _
-
-
- _
-
ll
~
----
o
4
24
8
12
16
20
Years in service
F ig ure 6.18. U pdated fatig ue reliability fo r fracture m ech an ics b ased an alysis
w ith M PI at regular intervals [M adsen et
a 1
(1987)]
. . .
. . . .
'-
- -
. . .
. . . .
- - -
-
-
- - _
-
-
-
---
. .
. . . . . . . . . . . . . . .
4
Yea~s in sJr-\'ice
16
20
24
F igure 6.19. U pd ated fatigue reliab ility fo r fracture m echan ics based analysis
w ith M PI at optim ised intervals [M adsen et al (1987)]
Chapter
6-
F atigu e P erfo rman ce o f S WA T II Sh ip s
287

7/26/2019 1992djatmikophd.pdf
http://slidepdf.com/reader/full/1992djatmikophdpdf 315/507
CHAPTER 7
CONCLUDING REMARKS

7/26/2019 1992djatmikophd.pdf
http://slidepdf.com/reader/full/1992djatmikophdpdf 316/507
CHAPTER 7
CONCLUDING REMARKS
7.1. GENERAL
The primary objective of the current research presented in this thesis was to
generate e~l data on hydrodynamic behaviour and wave-induced dynamic
loadings of SWATH ships. Such experimental data was used to validate the
mathematical model which has been developed in the Department recently. Evaluation
of SWATIl performance in actual seaways is subsequently made based on the acquired
experimental data and the analytical predictions. Procedures for such an evaluation to
identify the seakeeping quality of a given SW ATIl vessel, as well as the derivation of
its primary and secondary design loads are fully described. The statistical approach is
an important aspect which has been adopted throughout the evaluation.
A further stage of this study was chiefly concerned with the application of the
dynamic load information in structural design of SW ATIl ships. Preliminary structural
design is the first topic that has been dealt with. It is then followed by an observation of
SW ATIl fatigue performance where a characteristic lifetime load distribution is the
main element required in the analysis. To this extent, the study extensively
demonstrates the implementation of theoretical and experimental data in practical
design. Moreover, the study presented has served in bridging the gap between
hydrodynamicists and structural engineers.
7.2. HYDRODYNAMIC PERFORMANCE
The nature of SWATIl low motion characteristics was first advanced to give an
insight in the need of pursuing research in this particular aspect. The underlying
theoretical formulation of SWATIl ship motions was presented. The limitation of two-
dimensional strip theory led to the need to develop a more reliable three-dimensional
analytical model. Descriptions of the motion programs evolved within the Department
in recent years are given. The most recent motion program MARCHS by Chan (1990a)
has been established based on the pulsating-translating source technique which has a
capability to tackle forward speed and finite water depth effects more accurately.
Conc lud ing Remarks 288

7/26/2019 1992djatmikophd.pdf
http://slidepdf.com/reader/full/1992djatmikophdpdf 317/507
Extensive experimental data on SWATIl motions has been presented. The data
was derived from the seakeeping tests of three SWATIl models conducted at the
Department's Hydrodynamics Laboratory. Some problems associated with the
experimental arrangement, which in tum affect on the quality of the measured data, are
indicated. Alternative arrangements, with the use of different measurement devices, to
overcome such problems are described.
Efficiency in conducting seakeeping tests is of primary concern in both saving the
tank time and experiment cost. Well planned model tests should be capable of
simultaneously collecting the data for several types of measurements. These are now
possible with the availability of more sophisticated data acquisition system using
computers. Subsequently, test data analysis can be performed much more rapidly, and
accurately, than reading from record papers as was done in the past.
Comparison of experimental data with theoretical predictions from MARCHS
computer program was then performed. Test data measured at several important wave
headings, which includes head, beam, bow quartering and following seas, has been
collected. In general correlation between theoretical prediction and the measured data is
excellent, hence validation to
thenewly
developed analytical model is adequately
achieved. The tool developed is rellable fora Wider ·ran.~e.O.fm.otion studies which need
to be pursued in future. \_ JUlf ~
I
A seakeeping performance analysis was made on three 2500-tonne SW ATIls
scaled up from the models. The results of motion predictions were integrated into a
spectral analysis to assess the motion characteristics of the vessels operating in the
North Atlantic. A seakeeping criteria was incorporated to weigh the operability rate of
such vessels and rates between 82% and 89% are achievable by the present design. The
rate of operability can be substantially improved when the SWATIls are fitted with
stabilising fins. This particular aspect has been comprehensively investigated by Wu
(1985).
Identification of SW ATIl motion characteristics necessary in the earlier design
stage was discussed. Vertical modes of motion, namely, heave, roll and pitch, are the
primary concern in achieving better seakeeping quality. Initial sizing and selection of
underwater geometry have to be properly analysed. Basic parameters which govern
motion performance of SWATIl vessels should be determined so that low natural
frequency of motions is obtained in order not to resonate with most sea waves.
SWATIl resistance data derived from the simultaneous seakeeping test on a
Fishing SWATIl model have also been presented and compared with analytical
predictions. An especially interesting observation is the finding of negative added
resistance that arises when a certain frequency of wave is encountered. This confirms
Conc luding Remarks
289

7/26/2019 1992djatmikophd.pdf
http://slidepdf.com/reader/full/1992djatmikophdpdf 318/507
the earlier observations made on the other models available at the Laboratory.
However. further investigation is required, preferably from actual experience. before
the issue can be considered to
be
conclusive.
7.3. PRIMARY DYNAMIC LOADS
The basic aspects of dynamic loads acting on SWATIl structure have been
thoroughly studied. A review is given of the efforts undertaken by a number of
research institutions worldwide in the development of wave load peculiar to SWATIl
ships. In parallel theoretical backgrounds to this problems are briefly outlined. The
enhan~ment to the motion program MARCHS to tackle the primary load on SWAnls
is described.
A procedure for generating wave load data by a seakeeping experimental
technique on SWATIl models was fully described. Devices and instrumentation set up
specifically were applied to measure structural responses. The most important element
to achieve reliable experimental data stems from the accuracy and sensitivity of
measuring devices which are used during the test.
The measured data from three SWATIl models. comprising side force. vertical
force and prying moment on the bridging structure of the models, are further compared
with predictions from the analytical model. Very good correlation between the two is
observed. hence. validation of the developed analytical model is attained. Further
validation requires measured data of other load responses. namely. longitudinal shear.
pitch torsional and yaw splitting moment. In addition. experimental data of load
response for SWATIl with increasing speeds should also be pursued.
Evaluation of design loads for SWA TIls was conducted by applying the short-
and long-term stochastic wave approaches. The former is primarily used in deriving the
extreme loads as required in the ultimate strength design of SW ATIl structure.
Adopting the long-term analysis. on the other hand. the designer are then able to
generate information on the distribution of structural load over the lifetime of the vessel
so designed. This type of load distribution which can represent the number of cyclic
loads in specified ranges is then used in fatigue analysis and design of SWATIl
vessels. From the present analysis it was found that in terms of the number of cycles
for fatigue damage. the lower amplitude wave loads contribute the largest portion. It is
~le therefore that, as with monohull ships. the low magnitude wave loads
govern fatigue life of SWATIl structure. rather than the higher loads.
Although the main application of long-term analysis is to derive the lifetime cyclic
load distribution it also of course gives directly the extreme lifetime load. By using
Conc luding Remarks
2 90
r ;
I,
I J - ,
, 1
I
'I
j
i
V

7/26/2019 1992djatmikophd.pdf
http://slidepdf.com/reader/full/1992djatmikophdpdf 319/507
statistics of extreme values this can also be determined from the short-term distribution.
Present evaluation shows that the two approaches were found to be in good agreement.
For instance, the transverse moment with 99% confidence for SWA TH-FV of 459
MNm was obtained from the long-term analysis compared to 470 MNm from the short
term analysis. When only beam sea heading is considered in the long-term analysis then
a value of 495 MNm is derived, which is some 4% larger than that predicted by the
short-term analysis.
The design side loads for SWATIl ships determined by the short- and long-term
analysis was also compared with the values predicted by simple algorithms available in
the open literature. The former generally overpredict the design load by as much as
50%, and sometimes even larger. These large values were derived by imposing a
design significant wave height of 17 metres (corresponds to a sea state 9), which is
cited by Lloyd (1989) as 'hypothetical' in its occurrence. A reasonable agreement is
obtained, however, by restricting the evaluated SWATIls to operate in sea state 6.
7.4. SLAMMING INVESTIGATIONS
A review on the theoretical and experimental methods to predict slamming on
marine vehicles has been reported in order to study this phenomenon on SWATH type
ships. An analytical approach was then formulated which suggests the preference for
time-domain simulation in view of its greater accuracy in slamming prediction. A
detailed study of SWA TIl slamming by the seakeeping technique was also conducted.
A small SWATH model was used in the present study. SWATH slamming
characteristics were investigated by measurement of relative motions and impact
pressures. The measurement of impact pressure was first made by using pressure
transducers located at discrete locations over the fore part of the wet deck. Further
measurement was made by a load cell equipped panel attached on the wet deck.
Slamming form factors were then extracted from the accumulated data. A large
difference of form factor value was obtained from the point pressure and from panel
pressure measurements, that is in the order of about 4 :
1.
This is of course will vary
with panel size, which should be chosen to represent plate panels.
Slamming characteristics were also evaluated for a hypothetical SWATH using
the measured relative motion and slamming pressure data. SWA TIl operability related
to slamming occurrence and weighted by certain criteria was identified by a
probabilistic analysis. Using the form factors developed from the test, design slamming
pressure of this particular SWATIl was then derived. A design pressure value of some
1800 kPa was obtained, when the form factor from point pressure data is adopted,
Conc lud ing Remarks
291

7/26/2019 1992djatmikophd.pdf
http://slidepdf.com/reader/full/1992djatmikophdpdf 320/507
compared to 518 kPa from the panel pressure measurement. The latter seems to be a
reasonable value as compared to the design values derived using other simplified
formulations. In addition, such a design value is within the range of 200 to 620 kPa as
suggested by Sikora and Dinsenbacher (1988) for typical 2000 to 6000 tonne
SWATHs.
Comparative evaluation was then performed on the existing design pressure data
compiled so far. The trend in the increase of design slamming pressure with the
increase in SWATH displacement is uncertain due to the substantial scatter of the data.
Nevertheless, a regression analysis has been made and yields a simple pressure-
displacement correlation pertinent to SWATI-Is.The expression developed is acceptable
for first estimation of design pressure for SWATH ship displacements up to 6000
tonnes. A proper pressure correlation, however, should include the effect of ship speed
because of the significance of this parameter. It is also preferable to incorporate
characteristic wave height function in the expression of design slamming pressure of
SWATI-I ships.
7.5. PRELIMINARY STRUCTURAL DESIGN
A preliminary SWATH structural design study has been presented by firstly
indicating generic attributes of this type of vessel. Design procedures for such vessels
should not differ from those traditionally practised for monohull ships. Some design
criteria may also be adapted from monohull, but further evaluation is necessary. The
difference in structural design approaches between the Royal Navy and the US Navy is
highlighted. The former essentially adopts the ultimate limit state design (ULS)
concept, which is based on the criteria of ultimate collapse a ship structure. The US
Navy, on the other hand, regards yield stress of material as the governing criteria
known as the working stress design (WSD).
A computer program was written to facilitate structural calculation which is
iterative in nature. Some of the early findings have been presented. The primary
comparison was to identify the differences between the shear lag stress magnification
factor and effective width approaches on the resulting design values. A relatively large
difference in structural weight (around 17%) is found from the two computations.
Nevertheless, the effective width approach yields a better estimate of structural weight
fraction when compared with other SWATIl designs developed elsewhere. A value of
0.45 structural weight fraction is obtained in the present design on the SW ATH-FV
compared to a 0.42 for the SSV. Note that both vessels are 2500 tonnes in
displacement. The corresponding value derived by the magnification factor approach is
of the order 0.38.
Conc lud ing Remarks
292

7/26/2019 1992djatmikophd.pdf
http://slidepdf.com/reader/full/1992djatmikophdpdf 321/507
A parametric study has been conducted in which the primary load is altered by
±30% from a given standard maximum value. In this wayan average change of 12.5%
in structural weight results. The discrepancy is quite large if compared with the
observation by Aronne et a1 (1974). From their study it was found that altering the
primary bending moment by ±50% only resulted in approximately 5% change of
structural weight. This is obviously an area which needs to be pursued further. The
parametric study follows with an investigation of the use of lightweight materials in
SWATIl construction. Aluminium-steel hybrid structure seems to be the best choice for
the designer. By adopting such a combination some 37% weight saving is achievable,
while the increase in structural cost is acceptable. An attempt to attain a respectable
weight saving by changes in the primary configuration (maximum breadth or deck
clearance) would not be beneficial. Additional transverse bulkheads would gain some
weight reduction, in parallel with the improved shear lag characteristics.
7.6. FATIGUE PERFORMANCE
Analysis of fatigue behaviour of SWATH type vessels has been put forward.
Design procedures, involving a full spectral analysis followed by the simplified
approach, commonly practised by conventional ship and offshore structure designers
are adopted. Case studies on two hypothetical SWATIls, size of approximately 2500-
tonnes, operating in the North Atlantic region have been performed to illustrate these
design procedures.
One of the interesting results drawn from the analysis is the importance of the
Weibull shape parameters ~ pertinent to those SWATHs. Parameter values of 0.94 and
0.945 were derived for SW ATIl-FV and SWA TH-3, respectively. These figures fall in
the range of those normally applicable to monohull ships, Le. between 0.7 and 1.3;
although Munse et al (1983) suggest that lifetime stress distributions for most
monohulls of this size (2500 tonnes) are typically represented by the parameter values
in the order of 1.0 to 1.3. Further, Clarke (1991) indicates an exponential cyclic load
distribution, in which ~ = 1.0, has been widely practised in the Royal Navy warship
designs.
The allowable stress range as one of the most important measures in fatigue
design has been evaluated. Extreme stress ranges of approximately 290 N/mm2 and
250 N/mm2 have been deterministically derived for a 20-year and 3D-year lifetime,
respectively. The latter was compared with the design stress for the T-AGOS, in which
a design stress range of some 190 N/mm2 is adopted for 30 years operation. The
difference of the two values is evidently quite large, hence necessitating design check
by way of the probabilistic approach to be performed.
Conc lud ing Remarks
293

7/26/2019 1992djatmikophd.pdf
http://slidepdf.com/reader/full/1992djatmikophdpdf 322/507
Two different reliability methods have been implemented for the analysis. The
first method is a general advanced first order second moment (AFOSM) code which
was developed in the Department by Pu (1992), and the second is fatigue reliability
format by Wirsching (1984). The results from both analysis correlate fairly well for
most stress ranges that have been investigated. These results suggest that a design
extreme stress range value of some 2 0 0 N/mm2, which is close to that adopted for T-
AGOS, should be acceptable and would give an adequate fatigue safety for SWATIl-
FV for a 3D-year operation provided a thorough inspection can be performed at ID-year
intervals.
The corresponding safety index after 10 years operation for the above stress range
is approximately
2.0.
From initial rule of thumb a safety index of
2.0
to
3.0
is
acceptable for fatigue initiation failure. This is based on the recognition that crack
initiation on a structural member would not constitute a catastrophic failure of SWATIl
structure. A later calculation based on fatigue crack propagation was performed which
shows that a much larger cyclic number (in the order of 2.25 times that for crack
initiation) is required to cause a through the thickness cracking. This finding supports
the safety index adopted.
7.7. FUTURE WORK
More experimental investigations on SW ATIl motions and dynamic loads with
increasing forward speed remains necessary. Collaboration is preferred with other
research institutions where facilities to perform forward speed seakeeping tests in
oblique waves are available. Yaw splitting and pitch torsional moments load data in
oblique waves are further information that need to be accumulated. Construction of new
SWATIl models with elliptical section and contoured hull configuration seems to be
necessary to enhance the experimental data base on both hydrodynamic and structural
responses. All these experimental data are required to further validate the developed
analytical model MARCHS.
The existing sophisticated motion and wave load prediction program MARCHS,
supported with present experimental data, has undoubtedly broadened the opportunity
to explore hydrodynamic design optimisation. Parametric studies of SWATH
hydrodynamic performance can now be initiated. The seakeeping index method which
has emerged in recent years might
be
adopted in such an exploration study.
The results of the present study will be useful in the development of a further
study on SWA TIl ship slamming. Areas which need to be pursued in future are first of
all, the development of a mathematical model for SWATH slamming assessment,
Conclu din g Rema rk s
294

7/26/2019 1992djatmikophd.pdf
http://slidepdf.com/reader/full/1992djatmikophdpdf 323/507
preferably a time-domain simulation. Secondly, the development of structural design
procedure for SWAm deck bottom scantlings based on slamming impact. The
accumulation of slamming data from model tests remains necessary to validate any
analytical predictions that may be available in the future.
Full fatigue analysis on SWAm is not yet possible because of the limited
information which is currently available. Explicit fatigue characterisation of SWATH
structure should be developed in the near future. Suitable finite element programs are
now available in the Department, and some experience has already been gained.
SWAm structural stresses under various loadings have been evaluated and, in due
course, these will provide accurate information required in fatigue design. Further
fatigue S-N data pertinent to the critical members of SWATH structure, e.g. haunch-
deck and strut-haunch details, should be explored. To a certain extent structural tests
may be necessary for such a study. Moreover, future research on SWAm fatigue
performance should also include fracture mechanics for crack propagation analysis and
for maintenance strategy. Reliability aspects are to be fully incorporated in future
developments.
7.8. CLOSURE
The study presented in this thesis constitutes the first stage in the development of
the Integrated SWATlLStructural Design Study programmed in the NA&OE (
Department. The prog;.amme is ~tthe development of rationally-based structural
design method for SWATIl type vessels. It is hoped that the work presented within this
thesis will be useful, at least to the SWAm Research Group in the Department, in
pursuing further research and in the development of SWATIl technology.
Conc lud ing Remarks
295

7/26/2019 1992djatmikophd.pdf
http://slidepdf.com/reader/full/1992djatmikophdpdf 324/507
REFERENCES

7/26/2019 1992djatmikophd.pdf
http://slidepdf.com/reader/full/1992djatmikophdpdf 325/507
REFERENCES
Aertssen, O. (1968), Laboring of Ships in Rough Seas with Special Emphasis on the
Fast Ship ,
Proc. Diamond Jubilee Int. Meeting,
SNAME, Paper No. 10, New
York, USA, June
Aertssen, G. (1969), Service Performance and Trials at Sea ,
Proc. 12th Int.
Towing Tank Conf., fITC
Aertssen, G. (1972). Service Performance and Seakeeping Trials on a Large
Container Ship ,
Trans. RINA,
Vol. 114, pp. 429-447
Aertssen, G. (1975). The Effect of Weather on Two Classes of Container Ships in the
North Atlantic ,
Journal of the Royal Institution of Naval Architects
Allan, R.C., Bird, J. and Clarke, J.D. (1986), The Use of Adhesives in the Repair of
Cracks in Ships , Proc. Structural Adhesives in Engineering, IMechE, Bristol
Allen, RG. and Holcomb, RS. (1982), The Application of Small SWATH Ship to
Coastal and Offshore Patrol Missions ,
Proc. Symp, on Small Fast Warships
and Security Vessels,
RINA, London
Allen, RO. and Jones, RR. (1978), A Simplified Method for Determining Structural
Design-Limit Pressure on High-Performance Marine Vehicles ,
Proc.
AIAAISNAME Advanced Marine Vehicles Conf.,
Paper No. 78-754, San
Diego, USA, April
Almar-Neess, A. (1985), Fatigue Handbook: Offshore Steel Structures ,
Tapir
Publishers,
Trondheim, Norway
American Bureau of Shipping (1990), Preliminary Guide for Building and Classing
Small Waterplane Area Twin Hull (SWATH) Vessels , USA, Sep.
Ando, S. (1989), Cushioning of Slamming Impact by Elastomeric Layers , Journal
of Ship Research,
SNAME, Vol. 33, No.3, pp. 276-283, Sept.
Aronne, E.L., Lev, P.M. and Nappi, N.S. (1974), Structural Weight Determination
for SWATH Ships ,
Proc. AIAAISNAME Advanced Marine Vehicles Conf.,
Paper No. AIAA 74-326, San Diego, Ca, USA, Feb.
Arthur, E.K. (1988), Time Domain Simulation of SWATH Ship Motions ,
MSc
Thesis,
Dept. of NA&OE, University of Glasgow, UK, May
Attar, M. (1986a), Method of Solution for 5 Degrees of Freedom Coupled Equations
of Motions of a SWATIl Ship ,
Department Report,
No. NAOE-86-36, Dept. of
NA&OE, University of Glasgow, Nov.
Atlar, M. (1986b), The SWATIl Wave Load Program - Some Aspects of Computer
Program SWATHL ,
Department Report,
No. NAOE-86-55, Dept. of NA&OE,
University of Glasgow, Dec.
References
296

7/26/2019 1992djatmikophd.pdf
http://slidepdf.com/reader/full/1992djatmikophdpdf 326/507
Atlar, M., Lai, P.S.K. and McGregor, R.C. (1987) On Hydrodynamic Aspects of a
Two-Dimensional Prediction of Loads and Motions of a Twin-Hull Semi
Submersible ,
IMAEM 4th Int. Congress,
Paper No. 25, Varna-Bulgaria, May
Atlar, M., Seren, D.B. and Validakis, J. (1985), The Effect of Tilt and Interference
on the Hydrodynamic Coefficients of SWATH-Type Sections , Proc. Int.
Conf, on SWATH Ships and Advanced Multi-Hulled Vessels, RINA, London,
April
Beghin, D., Huther, M. and Parmentier, G. (1992), The probabilistic Approach: A
Tool for Ship Rules Improvement Proc. Int. Conf. on Practical Design of Ships
and Mobile Units,
PRADS 92, Vol. 2, pp. 2.847-2.859, Univ. of Newcastle
upon Tyne, May
Berge, S. (1984), Effect of Plate Thickness in Fatigue Design of Welded Structures ,
Proc. Offshore Technology Conf., OTC-4829, Houston, TX, USA
Betts, C.V. (1988a), Some UK Developments in SWATH Design Research ,
Proc.
Int. High-Performance Vehicle Conf.,
CSNAME, Paper VI-I, Shanghai, China,
Nov.
Betts, C.V. (1988b), A Review of Developments in SWATH Technology , Proc.
Int. Conf. on SWATH Ships and Advanced Multi-Hulled Vessels II, RINA,
Paper No.1, London, Nov.
Bhattacharyya, R. (1980), Dynamics of Marine Vehicles , John Wiley & Sons Inc.,
New York
Bishop, R.E.D., Price, W.G. and Temarel, P. (1986), On the Hydroelastic Response
of a SWATH to Regular Oblique Waves , Proc. Advances in Marine
Structures, ARE, Paper No.5, Dunfermline, Scotland, May
Boericke, H. Jr. (1959), Unusual Displacement Hull Forms for Higher Speeds , Int.
Shipbuilding Progress, Vol. 6, No. 58, pp 249-264, June
Bose, N. (1980), A Computer Program to Obtain Preliminary Structural Scantlings
and Steel Weights for Circular Hulled Semi-Submersibles with Bracing ,
Department Report, No. NAOE-HL-80-22, Dept. of NA&OE, University of
Glasgow
Bretschneider, C.L. (1959), Wave Variability and Wave Spectra for Wind-Generated
Gravity Waves , Beach Erosion Board, US Army Corps of Engineers, Technical
Memo No. 118, USA
Burke, R.J. (1982), The Consequences of Extreme Loadings on Ship Structures ,
Proc. Extreme Loads Response
Symp.,
SSC/SNAME, pp. 5-14, Arlington,
VA, USA, Oct.
Buxton, I.L. (1987), Engineering Economics and Ship Design , British Maritime
Technology Ltd.,
UK
Caldwell, I.B. (1965), Ultimate Longitudinal Strength , Trans. RINA, Vol. 107,
pp.411-430
Carreyette, I. (1977), Preliminary Ship Cost Estimation ,
Trans. RINA,
Vol. 119,
pp.235-258
References
297

7/26/2019 1992djatmikophd.pdf
http://slidepdf.com/reader/full/1992djatmikophdpdf 327/507
Chalmers, D.W. (1989), Structural Design Aspects of SWATH Ships ,
10th
WEGEMTon High-Speed and Pleasure Craft,University of Genoa, Italy, Oct.
Chalmers, D., et al (1988), Composite Structures , Proc. 10th Int. Ship
&
Offshore
Structures Congress, ISSC, Report of Committee V.8, Vol. 2, pp. 291-327,
Lyngby, Denmark, Aug.
Chalmers, D.W. and Smith, C.S. (1977), The Ultimate Longitudinal Strength of a
Ship's Hull , Proc. Int. Conf. on Practical Design of Ships and Mobile Units,
PRADS 92, Vol. 2, pp. 2.745-2.763, Univ. of Newcastle upon Tyne, May
Chan, H.S. (1989), Green Function in the Theory of Unsteady Forward Motion ,
Department Report, No. NAOE-89-22, Dept. of NA&OE University of
Glasgow
Chan, H.S. (1990a), A Three-Dimensional Technique for Predicting First- and
Second-OrderHydrodynamic Forces on a Marine Vehicles Advancing
in
Waves ,
PhD Thesis, Dept. of NA&OE, University of Glasgow, Aug.
Chan, H.S. (1990b), User Manual for MARCHS ,
Department Report,
No. NAOE
90-28, Dept. ofNA&OE, University of Glasgow, Oct.
Chan, H.S. (1991), Prediction of Motion and Structural Responses of Mono- and
Twin-Hull Ships Advancing in Waves ,
Department Report,
No. NAOE-91-16,
Dept. of NA&OE, University of Glasgow, July
Chan, H.S., Djatmiko, E.B., Miller, A.F. and Caldwell, L.B. (1992), Structural
Loading Aspects in the Design of SWATH Ships ,
Proc. 5th Int. Symp. on the
Practical Design of Ships and Mobile Units,
PRADS'92, Vol. 1, pp. 1.346
1.359, Newcastle on Tyne, UK, May
Chapman, R.B. (1972), Spray Drag of Surface Piercing Struts , P roc.
AIAAISNAME Advanced Marine Vehicles Meeting,
AIAA Paper No. 72-605,
Annapolis, Maryland, USA, July
Chapman, R.B. (1977), Wave Resistance and Kelvin Wake of Generalised Semi
Submersible , SAl, Report No. 77-980-U, LajoUa,USA.
Chen, Y.N. (1989), Fatigue Analysis and Assessment of Ship Structures ,
TAPS
Meeting,
ABS, May
Chen, Y.N. and Mavrakis, S.A. (1988), Closed-Form Spectral Fatigue Analysis for
Compliant Offshore Structures , Journal of Ship Research, SNAME, Vol. 32,
No.4, pp. 297-304, Dec.
Chilo, B. and Santos, R.T.C. (1983), Seakeeping Assessment and Criteria of Naval
Combatant SWATH Vehicles , Proc.lnt. Conf. on High Speed Surface Craft,
London,May
Chilo, B. and Sartori, G. (1979), Seakeeping Merit Rating Criteria Applied to Ship
Design , Int. Shipbuilding Progress, Vol. 26, No. 304, pp. 299-313, Dec.
Chuang, S-L. (1966), Experiments on Flat-Bottom Slamming , Journal of Ship
Research, SNAME, Vol. 10, No.1, pp. 10-17, March
References
298

7/26/2019 1992djatmikophd.pdf
http://slidepdf.com/reader/full/1992djatmikophdpdf 328/507
Chuang, S-L. (1969), Theoretical Investigations on Slamming of Cone-Shaped
Bodies , Journal 01 Ship Research, SNAME, Vol. 13, No.4, pp. 276-283,
Dec.
Chuang, S-L (1974), discussion of Hadler, J.B. et al, Ocean Catamaran Seakeeping
Design, Based on the Experience of USNS Hayes , Trans. SNAME, Vol. 82,
pp. 151-152
Chun, H.H. (1988), Theoretical and Experimental Studies on the Resistance of
SWATIl Ships , PhD Thesis, Dept. ofNA&OE, University of Glasgow
Chun, H.H., Djatmiko, E.B., McGregor. R.C. and Ferguson, A.M. (1989),
SWATH Resistance in Waves with Associated Steady and Dynamic
Responses ,
Proc. 22nd American Towing Tank Conf.,
ATTC, St-John's,
Newfoundland, Canada. Aug.
Chun, H.H., Djatmiko, E.B.and McGregor, R.C. (1990). A Wide Ranging Study on
the Motions of SWATH Ships with and without Forward Speeds , Proc. 9th
Int. Conf. on OMAE,
ASME, Houston, Texas, USA, Feb.
Chun, H.H., Grygorowicz, M. and Kobylinski, L. (1988). Small Model Experiments
of SWATH Concept , Proc. of Int. Conf, on SWATH Ships and Advanced
Multi-Hulled Vessels II, RINA, Paper No.8, London, Nov.
Chun, H.H. and McGregor, R.C. (1989), Added Resistance of SWATH Models in
Uniform Waves ,
Proc. Intersociety Advanced Marine Vehicles Conf.,
Paper
No. 89-1474-CP, Arlington, VA, USA, June
Clarke, J.D. (1991), Fatigue Crack Initiation and Propagation in Warship Hulls ,
Proc. of the Int. Conf. on Advances in Marine Structures-Z;
ARE, Dunfermline,
Scotland.May
Clayton, B.R. and Bishop, R.E.D. (1982), Mechanics of Marine Vehicles , E.&F.N.
Span Ltd., London
Combat Craft (1985a) RMI's Prototype SWATH on Sea Trials at San Diego ,
May/June
Combat Craft (l985b)''The Viability of Naval SWATH Ships , Sep./Oct.
Comstock, J.P. (1977). Principles of Naval Architecture , SNAME, New York,
USA
Conolly, lE. (1974), Standards of Good Seakeeping for Destroyers and Frigates in
Head Seas ,
Proc. Int.
Symp,
on the Dynamics of Marine Vehicles and
Structures in Waves,Office of Naval Research/RINA/lMechE, London, April
Covich, P.M. (1986), SWATIl T-AGOS : A Producible Design ,
Proc. AIAA 8th
Advanced Marine Systems Conf.,
Paper No. AIAA 86-2384, San Diego, USA,
Sept.
Covich, P.M. (1987), T-AGOS 19 : An Innovative Program for an Innovative
Design ,
Naval Engineers Journal,
ASNE, Vol. 99, No.3. pp. 99-106. May
References
299

7/26/2019 1992djatmikophd.pdf
http://slidepdf.com/reader/full/1992djatmikophdpdf 329/507
Creed, F.O. (1946), Floating Structure ,
U.S. Patent,
No. 2,405,115
Curphey,R.M. and Lee, C.M. (1974), AnalyticalDetermination of Structural Loading
on ASR Catamaran in Beam Waves ,
DTNSRDC,
Ship Performance Dept.
R&D, Report No. 4267, Bethesda, Maryland, USA, April
Curphey, R.M. and Lee, C.M. (1977), Theoretical Prediction of Dynamic Wave
Loads on Small Waterplane Area, Twin Hull Ships , DTNSRDC, Report No.
77-0027, Bethesda, Maryland, USA
Dallinga, R.P. (1981), SeakeepingTests for a Small Waterplane Area Twinhull Ship ,
NSMB,
Report No. 43755-2-2T, The Netherlands, Nov.
Dallinga, R.P. (1992), Operability Characteristics of Monohulls and SWATIl
Vessels ,
Proc. of MARIN Jubilee Meeting,
Workshop A - Advanced Vessels,
MARIN, Wageningen, the Netherlands, May
Dally,
I.M.
and Riley, W.F. (1978), Experimental Stress Analysis , McGraw Hill
Book Co., New York
Det norske Veritas (1991), Rules for Classification of High Speed and Light Craft ,
Hevik, Norway, Ian.
DeVries, R.L. (1991), Producibility Benefits of the SWATIl Configuration ,
Marine
Technology,
SNAME, Vol. 28, No.1, pp. 23-29, Jan.
Djatmiko, E.B. (1987), Experimental Investigations into SWATIl Ship Motions and
1 1 1
Loadings ,
MSc thesis,
Dept. ofNA&OE, University of Glasgow, Nov. ('
Djatmiko, E.B., Chun, H.H., McGregor, R.C. and MacGregor, I.R. (1990),
Hydrodynamic Behaviour of a SWATH Fishing Vessel ,
Proc. CSME
Mechanical Engineering Forum, Paper No. SOD-I, University of Toronto
Campus, Canada, June
Dow, R.S., Hugill, R.C., Clark, 1.0. and Smith, C.S. (1981), Evaluation of
Ultimate Ship Hull Strength ,
Proc. Extreme Loads Response Symp.,
SSC/SNAME, pp. 133-148, Arlington, VA, USA, Oct.
Drummond, T.G., Mackay, M. and Schmitke, R.T. (1976), Wave Impacts on
Hydrofoil Ships and Structural Implications ,
Proc. 11th Symp, on Naval
Hydrodynamics,
University College London, UK, April
Drysdale, L.H. (1986a), Solution of Linear Motion Equation for Coupled Heave and
Pitch for a SWATIl Ship (including programming manual) ,
Department Report,
No. NAOE-86-53, Dept of NA&OE, University of Glasgow
Drysdale, L.H. (1986b), Effect of Active Control Fins on the Vertical Plane Response
of SWATH Ships ,
Department Report,
No. NAOE-86-61, Dept. of NA&OE
University of Glasgow, Dec.
Drysdale, L.H. (1987), Structural Loads Acting on a SWATH Ship ,
Department
Report,
No. NAOE-HL-87-45, Dept. of NA&OE, University of Glasgow, Dec.
Eames, M.C.and Drummond, T.O. (1977), Concept Exploration - an Approach to
Small Warships Design , Trans. RINA, Vol. 119, pp. 29-54
References
300

7/26/2019 1992djatmikophd.pdf
http://slidepdf.com/reader/full/1992djatmikophdpdf 330/507
Evans, J.H. (1982), Preliminary Design Estimation of Hull Girder Response to
Slamming ,
Trans. SNAME,
Vol. 90, pp. 55-83
Faltinsen, 0 .• Hoff. J.R., Kvalsvold, J. and Zhao. R. (1992), Global Loads on
High-Speed Catamarans ,
Proc. 5th Int. Symp. on the Practical Design of Ships
and Mobile Units,
PRADS'92, Vol. I, pp. 1.360-1.373, Newcastle on Tyne,
UK, May
Faltinsen, O. and Svensen, T. (1992), Behaviour of Catamarans. Foilcatamarans and
SES in Waves ,
Proc. MARIN Jubilee Meeting,
Workshop A : Advanced
Vessels, Wageningen, The Netherlands, May
Fang, M-C (1988), The Motions of SWATH Ships in Waves . Journal of Ship
Research, SNAME. Vol. 32. No.4, pp. 238-245, Dec.
Faulkner, D. (1965) discussion to Caldwell, J.B. (1965), Ultimate Longitudinal
Strength ,
Trans. RINA,
Vol. 107. pp. 411-430
Faulkner, D. (1975a), Compression Strength of Welded Grillages in Ship Structural
Design Concepts, Evans, J.H. (ed), Cornell Maritime Press
Faulkner, D. (1975b), A Review of Effective Plating for Use in the Analysis of
Stiffened plating in Bending and Compression , Journal of Ship Research,
SNAME, Vol. 19, No. I, pp. 1-17, March
Faulkner, D (1981), Semi-Probabilistic Approach to the Design of Marine Structures ,
Proc. Extreme Loads Response Symp.,
SSC/SNAME, pp. 213-230, Arlington,
VA, USA, Oct.
Faulkner, D. (1983), On Selecting a Target Reliability for Deep Water Tension Leg
Platforms , Proc. 11th IFIP Conf. on System Modelling and Optimization, pp.
490-513. Copenhagen, Denmark, July
Faulkner, D. (1987), A Brief Introduction to Structural Reliability ,
Proc. Seminar
on Reliability Methods in Fatigue, Fracture and NDT, the Welding Institute,
Opening Lecture, Newcastle, UK, May
Faulkner, D. (1991a) discussion to Djatmiko, E.B., Estimation of Long-Term
Dynamic Load Characteristics of SWATH Ships , Research Student
Colloquium,
Dept. of NA&OE, Univ. of Glasgow, Jan.
Faulkner, D. (1991b), What is Wrong with Offshore Design Codes 7 , Extraordinary
Meeting, IESIS, Paper No. 1512, Glasgow, Feb.
Faulkner, D. (1991c), New Technologies for Ship and Offshore Structural Analysis
and Design , Proc. Int. Symp. on Marine Structures, ISMS'91, Shanghai,
China, Sep.
Faulkner. D. (1992). Structural Design Philosophy for Small and Large High Speed
Multi-Hull Ferries ,
Proc. Int. Corf. on Safety for High-Speed Craft - The Way
Ahead, RINA, London, May
Faulkner, D. and Sadden, J.A. (1979), Toward Unified Approach to Ship Safety .
Trans. RINA. Vol. 121
References
301

7/26/2019 1992djatmikophd.pdf
http://slidepdf.com/reader/full/1992djatmikophdpdf 331/507
Faulkner. D.• Incecik, A. and Prince-Wright.
R.
(1989). Toward Improved Loading
Model for Design of Offshore Platforms , Proc. ICOSSAR'89. San Fransisco,
USA, Aug.
Faulkner,D., Warwick. D.M. and Incecik, A. (1986). Integrated Structural Design of
SWATIl Ships ,
SERC Proposal.
Dept. of NA&OE. University of Glasgow
Faust. J.G. (1932), Marine Vessel , U.S. Patent, No. 1,861.338
Frank, W. (1976), On the Oscillations of Cylinders In or Below the Free Surface of
Deep Fluids , DTNSRDC, Report No. 2375, Bethesda. Maryland, USA, Oct.
Gallagher. P. (1985). Slam Simulations: An Application of Computational Fluid
Dynamics , PhD Thesis, Dept. of NA&OE, University of Glasgow, May
Geers. T.L. (1982), A Boundary-Element Method for Slamming Analysis , Journal
0 /
Ship Research,
SNAME, Vol. 26, No.2. pp. 117-124, June
Geritsma,
1 .
and Beukelman, W. (1972), Analysis of the Resistance Increase in
Waves of a Fast Cargo Ship ,
Tnt.Shipbuilding Progress,
Vol. 19, No. 217
Giannotti. J.G. (1975). Prediction of Slamming Loads for Catamarans , Proc. 7th
Offshore Technology Con/., Paper No. OTC 2281, Houston. Texas. USA, May
Gore, J.L. (1985). SWATH Ships ,
Naval Engineers Journal,
ASNE, Special
Edition, Vol. 97, No.2. pp. 83-112, Feb.
Graham. R. (1988). Slamming Experiments with a Radio-Controlled SWATIl
Model , Proc. Int. Coni. on SWATH Ships and Advanced Multi-Hulled
Vessels II,
RINA, Paper No.9, London, UK, Nov.
Graham, R. (1990), Motion-Induced Interruptions as Operability Criteria , Naval
Engineers Journal, ASNE, Vol. 102, No.2, pp. 65-71, March
Guedes Soares. C. (1991). Model Uncertainty in the Long-term Distribution of Wave-
Induced Bending Moments for Fatigue Design of Ship Structures ,
Marine
Structures, Vol. 4, pp. 295-315
Gullberg,
0.,
et al (1991). Composite Structures ,
Proc. 11th Int. Ship & Offshore
Structures Congress,
ISSC, Report of Committee V.8, Vol. 2, pp. 317-360,
Wuxi, China. Sept.
Gupta. S.K. and Schmidt. T.W. (1986), Developments in SWATH Technology ,
Naval Engineers Journal,
ASNE, Vol. 98, No.3, pp. 171-188, May
Gurney, T.R. (1976). Fatigue Design Rules for Welded Steel Joints , The Welding
Institute Research Bulletin, Vol. 17, No.5, May
Hadler, J.B., Lee, C.M., Birmingham, J.T. and Jones, H.D. (1974), Ocean
Catamaran Seakeeping Design, Based on the Experience of USNS
Hayes ,
Trans. SNAME, Vol. 82. pp. 151-152
Hadler, J.B., Hubble, E.N., Allen, R.G.and Blount, D.L. (1978), Planing Hull
Feasibility Model - Its Role in Improving patrol Craft Design , Proc. of Symp.
on Small Fast Warships and Security Vessels, RINA, London, March
References
302

7/26/2019 1992djatmikophd.pdf
http://slidepdf.com/reader/full/1992djatmikophdpdf 332/507
Hasselman, K., et al (1973), Measurement of Wind-Wave Growth and Swell Decay
During the Joint North Sea Wave Project (JONSWAP) ,
Deutschen
Hydrographischen Zeitschrift, Vol. 13, No. A
Heller, S.R. and Iasper, N.H. (1961), On the Structural Design of Planing Craft ,
Trans. RINA, Vol. 103, pp. 49-65
Henrickson, W.A. and Spencer, I.S. (1982), A Synthesis of Aluminium Crewboat
Design ,
Marine Technology,
SNAME, Vol. 19, No. I, pp. 52-72, Jan.
Hightower,
I.D.
and Seiple, R.L. (1978), Operational Experiences with the SWATH
Ship SSP
Kaimalino , Proc. AIAAISNAME Advanced Marine Vehicles Conf,
Paper 78-741, San Diego, USA, April
Hightower, J.D., Parnell, L.A., Strickland, A.T. and Warnshuis, P.L. (1985),
SWATH Technology Development at the Naval Ocean System Center , Proc.
Int. Conf. on SWATH Ships and Advanced Multi-Hulled Vessels,
RINA, Paper
No.14, London, April
Hoffman, D. (1976), The Impact of Seakeeping on Ship Operations ,
Marine
Technology,
SNAME, Vol. 13, No.2, pp. 241-262, July
Holcomb, R.S. and Allen, R.G. (1983), Investigation of the Characteristics of Small
SWATH Ship Configured for United States Coast Guard Missions ,
DTNSRDC,
Report No. DTNSRDC/SSD-83-3, USA, June
Hong, Y.S. (1986), Heave and Pitch Motions of SWATH Ships , Journal of Ship
Research, SNAME, Vol. 30, No.1, pp. 12-25, March
Hosada, R., Kunitake, Y, Koyama, H. and Nakamura, H. (1983), A Method for
Evaluation of Seakeeping Performance in Ship Design Based on Mission
Effectiveness Concept ,
Proc. 2nd Int. Symp. on Practical Design of Ships
and Mobile Units, PRADS'83, Tokyo & Seoul, Oct.
Howe, R.I. and Owen, M.J. (1972), Cumulative Damage in Chopped Strand
Mat/Polyester Resin Laminates , Proc. 8th Int. Reinforced Plastics Congress,
British Plastics Federation, London
Hugill, P.N. and Sumpter, I.D.G. (1990), Fatigue Crack Prediction at a Ship
Deck/Superstructure Intersection ,
The BSSM Journal 'Strain',
Vol. 26, No.3,
Aug
Hutchison, B.L. (1990), Seakeeping Studies: A Status Report ,
Trans. SNAME,
Vol. 98, pp. 263-317
Incecik, A. (1982), Design Aspects of the Hydrodynamic and Structural Loading on
Floating Offshore Platforms Under Wave Excitation , PhD Thesis, Dept. of
NA&OE, University of Glasgow
ISSC Committee II.3 (1979), Impact on Novel-Type Vessels , Proc. 7th Int.
Ship Structures Congress, ISSC, Vol. 2, Paris, France, Aug.
References
303

7/26/2019 1992djatmikophd.pdf
http://slidepdf.com/reader/full/1992djatmikophdpdf 333/507
Jones. A.H.• Chun, H.H. and McGregor. R.C. (1990). SWATH Ship Motion
Simulation in the Time Domain .
Proc. CSME Mechanical Engineering Forum
1990, Paper No. SOD-2, University of Toronto Campus. Toronto. Canada,
Iune
loosen. W.P.A. (1966). Added Resistance of Ships in Waves , Proc. 6th Symp. on
Naval Hydrodynamics,
ACR 136, Office of Naval Research, Washington.
D.C., USA
Jordan. C.R. and Cochran. C.S. (1978). In-Service Performance of Structural
Detail , Ship Structure Committee, Report No. SSC-272, Washington D.C.,
USA
Kallio, J.A. and Ricci. J.1. (1976). Seaworthiness Characteristics of a Small
Waterplane Area Twin Hull (SWATH IV) Part II , DTNSRDC, Ship
Performance Department. Report No. SPD 620-02. Bethesda. Maryland. USA,
May
Kaplan. P. (1987). Analysis Prediction of Flat Bottom Slamming Impact of Advanced
Marine Vehicles in Waves , International Shipbuilding Progress. Vol. 34. No.
391, pp. 44-53, March
Keane, A.J., Price, W.G., Temarel, P., Wu, X-J and
w «.
Y. (1988), Seakeeping
and Structural Responses of SWATH Ships in Waves , Proc. Int. Conf. on
SWATH Ships and Advanced Multi-Hulled Vessels II, RINA, Paper No. 13.
London. Nov. 1988
Kennell. C. (1985), SWATH Ship Design Trends ,
Proc. Int. Conf. on SWATH
Ships and Advanced Multi-Hulled Vessels.
London. April
Kerr. G.D.•Anderson. T.A. and Kennell. C.G. (1978). SWATH Ship Design State
of the Art ,
Proc. AlAAISNAME Advanced Marine Vehicles Conj.,
Paper AIAA
78-737, San Diego. Ca. USA. April
Kim, C.H. and Chou. F. (1973). Motions of a Semi-Submersible Drilling Platform
in Head Seas , Marine Technology. SNAME. pp 112-123.April
Kobayashi. M. and Shimada. K. (1990), Wave Loads on Small-Waterplane-Area
Twin-Hull (SWATH) Ship with Forward Speed , Proc.19th Int. Towing Tank
Conf., ITTC, Vol. 2. pp. 330-334. Madrid. Spain. Sep.
Kobayashi. M., Shimada, K., and Nishimura. K. (1990). Wave Loads on a Semi
Submerged Catamaran (SSC) with Forward Speed , Journal of the Soc. of
Naval Architect Japan. SNAJ. Vol. 168. pp. 159-170
Koehler. B.R. and Kettleborough.CF, (1977), Hydrodynamic Impact of a Falling
Body upon a Viscous Incompressible Fluid , Journal of Ship Research.
SNAME, Vol. 21, No.3, pp. 165-181, Sept.
Koops, A. and Nethercote, W.C.E. (1988). An Extended SWATH Concept
Exploration Model , Proc. Int. Conf. on SWATH Ships and Advanced Multi
Hulled Vessels II,
RINA, Paper No.4. London, Nov.
Lamb, G.R. (1988), Some Guidance for Hull Form Selection for SWATH Ships ,
Marine Technology,
SNAME, Vol. 25, No.4, pp. 239-252, Oct.
References
304

7/26/2019 1992djatmikophd.pdf
http://slidepdf.com/reader/full/1992djatmikophdpdf 334/507
Lang. T.G. (1971). High-Speed Ship with Submerged Hulls ,
U.S. Patent,
No.3,623,444, Nov.
Lang, T.G. (1989), SWATH Evolution: From Ideas to Ships , Proc. Intersociety
Advanced Marine Vehicles Cord.; Paper No. 89-1520-CP, Arlington, VA,
USA, June
Lang, T.G. et al (1971), Naval Feasibility of the NUC Semi-Submerged Ship
Concept , Naval Under Sea Research and Development Center, TP 235
Lang, T.G. et al (1973), Design and Development of the 190-ton Stable
Semisubmersible Platform (SSP) , ASME, Winter Annual Meeting, Paper No.
73-WNOct.-2, Nov.
Lang, T.G. and Higdon, D.T. (1974), Hydrodynamics of the 190-ton Stable
Semi submerged Platform (SSP) ,
Proc. AIAAISNAME Advanced Marine
Vehicles
cs«,
Paper No. AlAA 74-328, San Diego, CA, USA, Feb.
Lee, C.M. (1976) Theoretical Predictions of Motion of Small-Waterplane Area, Twin
Hull (SWATH) Ships in Waves , DTNSRDC, Report No. 76-0046, Dec.
Lee, C.M. and Curphey, R.M. (1977), Prediction of Motion, Stability, and Wave
Load of Small-Waterplane-Area, Twin-Hull Ships , Trans. SNAME, Vol. 85,
pp.94-130
Lee. C.M., Jones, H.D. and Curphey, R.M. (1973), Prediction of Motion and
Hydrodynamic Loads of Catamarans ,
Marine Technology,
SNAME, Vol. 10,
No.4, Oct.
Lee, K.Y. et al (1988), On the Design Technology of SWATIl High Speed Passenger
Ship ,
Proc. Int. Conf, on SWATH Ships and Advanced Multi-Hulled Vessels
II,
RINA, Paper No. 17, London, Nov.
Lee, J-S (1992), Reliability Based Limit State Design Format of Ship Structures ,
Proc. Int. Conf, on Practical Design of Ships and Mobile Units,
PRADS 92,
Vol. 2, pp. 2.820-2.833, Univ. of Newcastle upon Tyne, May
Lee, J.S. and Faulkner, D. (1989), Reliability Analysis of TLP Structural Systems ,
Proc. 8th OMAE ConJ
The Hague, March
Lee, J-S and Faulkner. D. (1989), System Design of Floating Offshore Structures ,
Paper No.8, RINA Spring Meeting, London, April
Leopold, R. (1969a), Marine Vessel ,
U.S. Patent,
No. 3,447,502
Leopold. R.
(I
969b). A New Hull Form for High Speed Volume Limited
Displacement Type Ships , Spring Meeting, SNAME, Paper No.8, Beverly
Hills, May
Lewis, E.V. and Zubaly, R.B. (1981), Predicting Hull Bending Moments for
Design , Proc. Extreme Loads Response Symp., SSC/SNAME, pp. 31-62,
Arlington, VA, USA. Oct.
References
305

7/26/2019 1992djatmikophd.pdf
http://slidepdf.com/reader/full/1992djatmikophdpdf 335/507
Lewison, G. and Maclean, W.M. (1968), On the Cushioning of Water Impact by
Entrapped Air , Journal of Ship Research, SNAME, Vol. 12, No.2, pp. 116
130,June
Liu, D. (1989), Development and Analysis of SWATH Ships , A Paper presented at
the Hellenic Institute of Marine Technology, Pireaus, Greece, Oct.
Lloyd, A.R.J.M. (1989), Seakeeping: Ship Behaviour in Rough Weather , Ellis
Horwood Ltd., Chichester, West Sussex, UK
Lloyd, A.R.J.M. (1991), The Seakeeping Design Package (SDP) - a Technique for
Designing Hull Forms for a Specific Seakeeping Performance , RINA Spring
Meetings,
London, April
Lloyd's Register of Shipping (1990), Provisional Rules for the Classification of High
Speed Catamarans , London, Aug.
Lloyd's Ship Manager (1992), Radisson Diamond - A Revolutionary Cruiser
Development , Vol. 13, No.2, Supplement, pp.
S5-S7,
May
Loscombe, R. (1987), An Exploratory Study of Alternative Structural Materials for
Small SWATH Craft , Ship Science Report, No. 34, Dept. of Ship Science,
University of Southampton, May
Loscombe, R. (1988), An Exploratory Study of Alternative Structural Materials for
Small SWATH Ships ,Int. Shipbuilding Progress, Vol. 35, No. 404, pp. 331-
347, Dec.
Loscombe, R. (1989), Key Aspects of the Structural Design of Small SWATH
Ships , PhD Thesis, Dept. of Ship Science, University of Southampton, Dec.
Loscombe, R. (1990), Initial Design Stage Slam Pressure Prediction for Small
SWATH Ships ,
Ship & Boat International,
RINA, Issue
10108,
Oct.
Luedeke, G. Jr. and Montague, J. (1984), RMI's Small Waterplane-Area-Twin-Hull
(SWATH) Boat Project ,
Branch Meeting,
SNAME, San Diego Section, USA,
Nov.
Luedeke, G.Jr., Montague, J., Posnansky, H. and Lewis,
Q.
(1985), The RMI SD
60 SWATH Demonstration Project ,
Proc. Int. Corf, on SWATH Ships and
Advanced Multi Hulled Vessels, RINA, Paper No. 10, London, April
Lundborg, C.G. (1880), Construction of Ships , U.S. Patent, No. 234,794
Mabuchi, T., Kunitake, Y. and Nakamura, H. (1985), A Status Report on Design and
Operational Experiences with the Semi-Submerged Catamaran
(SSC)
Vessels ,
Proc.lnt. Conf, on SWATH Ships and Advanced Multi-Hulled Vessels,
RINA, Paper No.5, London, April
MacGregor, J .R. (1986), An Analysis of SW ATH Design and Performance Data ,
Department Report,
No. NAOE-86-30, Dept. of NA&OE, University of
Glasgow, Nov.
MacGregor, J.R. (1989), A Computer Aided Method for Preliminary Design of
SWA 111 Ships , PhD Thesis, Dept. of NA&OE, University of Glasgow, May
References
306

7/26/2019 1992djatmikophd.pdf
http://slidepdf.com/reader/full/1992djatmikophdpdf 336/507
MacGregor, J.R., Bose, N. and Small, G. (1988), Design and Construction of a
Small Waterplane Area Twin Hull (SWATH) Fishing Vessel ,
Proc. W orld
Symp, on F ishing G ear and F ishing Vesse l D esign , St John's, Newfoundland,
Canada, Nov.
Maddox,
S.l.
(1991), Fatigue Strength of Welded Structures , Abin gto n P ub lis hin g,
Cambridge, UK
Madsen, H.O., Skjong, R. and Kikermo, F. (1987), Probabilistic Fatigue Analysis of
Offshore Structures - Reliability Updating Through Inspection Results , Proc .
3 rd In t. Symp. on In tegrity o f O ffshore Structures, pp. 361-374, University of
Glasgow, Sept.
Malakhoff, A., Thomas Packard, W., Engle, A.H. and Sielski, R.A. (1991),
Towards Rational Surface Ship Structural Design Criteria ,
Proc. o f the In t.
C on f, o n A dvan ces in M arin e Structure s-Z, ARE, Dunfermline, Scotland, May
Mansour, A.E. (1981), Combining Extreme Environmental Loads for Reliability
Based Designs , Proc. Extreme Loads Response
Symp.,
SSC/SNAME, pp.
63-74, Arlington, VA, USA, Oct.
Mansour, A. and d'Oliveira, J.M. (1975), Hull Bending Moment Due to Ship Bottom
Slamming in Regular Waves , J ournal o f Sh ip Research, SNAME, Vol. 19, No.
2. pp. 80-92, June
Mansour, A. and Faulkner. D. (1973), On Applying the Statistical Approach to
Extreme Sea Loads and Ship Hull Strength , Trans . RINA , Vol. 115,
pp.277-314
Mantle,
P.l.
(1980), A Technical Summary of Air Cushion Craft Development ,
DTNSRDC , Report No. 80/012 (4727 revised), Jan.
Marine Report (1990), Model Tests for a SWATH Cruise Liner , Maritime Research
Institute Netherlands. No. 41, Nov.
Maruo, H. (1957), The Excess Resistance of a Ship in Rough Seas , Int .
S hip bu ildin g P ro gre ss , Vol. 4, No. 35
Mathisen, J. and Carlsen, C.A. (1980), itA Comparison of Calculation Methods for
Wave Loads on Twin Pontoon Semi-Submersibles , Proc. In t.
Symp,
on
O ce an E ngin ee rin g an d Ship H an dlin g, Gothenburg, Sweden.
McCreight, K.K. (1987), Assessing Seaworthiness of SWATH Ships , Trans.
SNAME, Vol. 95, pp. 189-214
McGregor, R.C. (1983), An Illustration of Some SWATH Vessel Characteristics ,
P rocH igh-Speed Surface C raft C on f., London, May
McGregor, R.C., et al (1988), Comparative Study of SWATH Seakeeping , Proc .
In t. H igh-Perfo rmance Vehicle C on f., CSNAME, Paper No. VI-4, Shanghai,
China, Nov.
References
307

7/26/2019 1992djatmikophd.pdf
http://slidepdf.com/reader/full/1992djatmikophdpdf 337/507
McGregor, R.C., Chun, H.H., Djatmiko, E.B. and Jones, A.H. (1990), On
Modelling the Hydrodynamic Behaviour of SWATH Vessels , Proc.lnt. Conf.
on Modelling and Control of Marine Craft, Paper No. 21, pp. 336-357, Exeter,
UK, April
McPherson, J.L. and Voight, B.D. (1983), An Experimental Comparison of Zero
Speed Seakeeping Characteristics of Single and Double Strut SWATHs , US
Naval Academy, Div. of Engg. and Weapons, Report No. EW-15-83,
Annapolis, Maryland, USA, April
Meyerhoff, W.K. et al. (1988) Novel Design Concepts - SWATH ,
Proc. 10th Int.
Ship & Offshore Structures Congress, ISSC, Vol. 2, Report of Committee VA,
Lyngby, Denmark, Aug.
Milgram, I.H. (1976), Waves and Wave Forces ,
Proc ..Int. Con/. on Behaviour of
Offshore Structures, BOSS'76, Norwegian Institute of Technology, Trondheim,
Norway, Aug.
Miller, A.F. (1991a), A Review of Techniques Employed to Predict Wave Induced
Global Loadings on SWATH Ships ,
Department Report,
No. NAOE-91-29,
Dept. of NA&OE, University of Glasgow, July
Miller, A.F. (1991b), Aspects of SWATH Design and Evaluation , MSc Thesis,
Dept. of NA&OE, University of Glasgow, Sept.
Milner, R. (1990), The World's First 30-knot Fast Displacement Catamaran
(SWATH) Ferry ,
Proc. 7th Int. High Speed Surface Craft Conf.;
London, Jan.
Miner, M.A. (1945), Cumulative Damage in Fatigue ,.Tournalof Applied Mechanics,
ASME, Vol. 12, p. A-159
Moan, T. et al (1991), Design Philosophy , Proc. 11th International Ship & Offshore
Structures Congress, ISSC, Report of Committee IV.l, Wuxi, China, Sep.
Moskowitz, L., Pierson, W.J. and Mehr, E. (1965), Wave Spectra Estimated from
Wave Record Obtained by OWS
Weather Reporter ,
New York University,
College of Engineering (I) 1962, (II) 1963, (III) 1965, USA
Mulligan, R.D. and Edkins, J.N. (1985), ASSET/SWATH - A Computer Based
Model for SWATH Ships ,
Proc. Int. Conf. on SWATH Ships and Advanced
Multi Hulled Vessels, RINA, London, April
Munk, M.M. (1924), 'The Aerodynamic Forces on Airship Hulls ,
National Advisory
Committee on Aeronautics,
NACA, Report No. 184, USA
Munse, W.H. (1981), Fatigue Criteria for Ship Structure Detail , Proc. of the
Extreme Loads Response Symp., SNAME, Arlington, VA, USA, Oct.
Munse, W.H. et al (1983), Fatigue Characterization of Fabricated Ship Details for
Design ,
Ship Structure Committee,
Report No. SSC-318, Washington D.C.,
USA
Nagai, T. and Chuang, S-L (1977), Review of Structural Response Aspects of
Slamming , Journal of Ship Research, SNAME, Vol. 21, No.3, pp. 182-190,
Sept.
References
308

7/26/2019 1992djatmikophd.pdf
http://slidepdf.com/reader/full/1992djatmikophdpdf 338/507
Nelson, A. (1905), Vessel , U.S. Patent, No.795,002, July
Nethercote, W.C.E. and Schmitke, R.T. (1982), A Concept Exploration Model for
SWATH Ships , Trans. RINA, Vol. 124, pp. 113-130
Newland, D.E. (1986), An Introduction to Random Vibrations and Spectral
Analysis , Longman Inc., New York
Nordenstrom, N.(1973), A Method to Predict Long-term Distributions of Waves and
Wave-Induced Motions and Loads on Ships and Other Floating Structures , Det
norske Yeritas, Publ. 81, April
Nordenstrom, N., Faltinsen, O. and Pedersen, B. (1971), Prediction of Wave
Induced Motions and Loads for Catamarans , Proc. Offshore Technology
Conf.,
Paper No. OTC-1418, Houston, Texas, USA
Ochi, M.K. (1958), Model Experiment on Ship Strength and Slamming in Regular
Waves ,
Trans. SNAME,
Vol. 66
Ochi, M.K. (1964), Extreme Behaviour of a Ship in Rough Seas - Slamming and
Shipping of Green Water , Trans. SNAME, Vol. 72
Ochi, M.K. (1973), On Prediction of Extreme values ,
Journal of Ship Research,
SNAME, Vol. 17, No. I, pp. 29-37, March
Ochi, M.K. (1978), Wave Statistics for the Design of Ships and Ocean Structures ,
Trans. SNAME, Vol. 86, pp. 47-76
Ochi, M.K. and Bales, S.L. (1977), Effect of Various Spectral Formulations in
Predicting Responses of Marine Vehicles and Ocean Structures ,
Proc. 9th
Annual Offshore Technology Conference, OTC, Paper No. OTC-2743,
Houston, Texas, USA, May
Ochi, M.K. and Hubble, E.N. (1976), On Six-Parameter Wave Spectra ,
Proc.15th
Coastal Engineers Conf.,
ASCE, USA
Ochi, M.K. and Motter, L.E. (1969), Prediction of Extreme Values of Impact
Pressure Associated with Ship Slamming ,
Journal of Ship Research,
SNAME,
Vol. 13, No.2, pp. 85-91, June
Ochi, M.K. and Motter, L.E. (1971), A Method to Estimate Slamming Characteristics
for Ship Design , Marine Technology, SNAME, Vol. 8, No.2, pp. 219-232,
April
Ochi, M.K. and Motter, L.E. (1973), Prediction of Slamming Characteristics and Hull
Responses for Ship Design , Trans. SNAME, Vol. 81, pp. 144-176
Ochi, M.K. and Motter, L.E. (1974), Prediction of Extreme Ship Responses in
Rough Seas of the North Atlantic ,
Proc. Int. Symp. on Dynamics of Marine
Vehicles and Structures in Waves,
IMechEIRINA, pp. 187-197, London, April
Ochi, M.K. and Wang, S. (1976), Prediction of Extreme Wave-Induced Loads on
Ocean Structures , Proc., Int. Conf. on Behaviour of Offshore Structures
(BOSS76), Norwegian Institute of Technology, Trondheim, Norway, Aug.
References
309

7/26/2019 1992djatmikophd.pdf
http://slidepdf.com/reader/full/1992djatmikophdpdf 339/507
Olson, S.R. (1978), An Evaluation of the Seakeeping Qualities of Naval
Combatants , Naval Engineers Journal, ASNE, Vol. 90, No.1, pp. 23-40, Feb.
Oshima, M., Narita, H. and Kunitake, Y. (1979), Experiences with 12 Meter Long
Semi-Submerged Catamaran
(SSC) Marine Ace
and Building of
SSC
Ferry for
446 Passengers ,
Proc. AlAAISNAME Advanced Marine Vehicles Conf.,
Paper No. 79-2019, Baltimore, Maryland, USA
Papanikolaou, A,.Schellin, T.E. and Zaraphonitis, G (1990), A 3 D-Method to
Evaluate Motions and Loads of Ships with Forward Speeds in Waves , Proc.
5th Int. Congress of Marine Technology, HIMT, pp. 452-457, Athens, Greece
Paris, P. and Erdogan, F. (1963), A Critical Analysis of Crack Propagation Laws ,
Journal of Basic Engineering, ASME, Vol. 85, pp. 528-534
Pattison, D.R., Rose, P.H.A. and Harris, S.A. (1988), SWATH-The UK MOD
Design and Assessed Programme ,
Proc. Int. Conf, on SWATH Ships and
Advanced Multi Hulled Vessels II,
RINA, Paper No.6, London, Nov.
Paulling, LR, and Hong, Y.S. (1977), Analysis of Semi-Submersible Catamaran
Type Platforms , Proc. Offshore Technology Conf., Paper No. OTC-2977,
Houston, Texas, USA
Pegg, N.G., Gilroy, L.E. and Cumming, D.W. (1990), Load, Motion and Structural
Response Trials of the SWATH Vessel 'Frederick G. Creed' , Proc. Symp, on
the Dynamics of Marine Vehicles and Structures in Waves, IUTAM (Int. Union
of Theoretical and Applied Mechanics), Brunel University, U.K., June 1990
Penney, P.W. and Riiser, R.M. (1984), Preliminary Design of Semisubmersibles ,
Trans. NEC/ES, Vol. 101
Petershagen, H.G., et al (1982), Ferrous Materials ,
Proc. of the 8h Int. Ship
&
Offshore Structures Congress,
Report of Committee 111.1,Gdansk, Poland
Petershagen, H.G., et al (1986), Fatigue Problems in Ship Structures , Proc. of the
Int. Conf, on Advances in Marine Structures,
ARE, Dunfermline, Scotland, May
Petty, W. (1660), Manuscripts concerning Ye Double Bodyed Shippe , National
Maritime Museum SPB/16
Pieroth, C.G. and Lamb, G.R. (1983), The SWATH Option as V/STOL Aircraft
Carrier , Proc. 7th Intersociety Marine System Conf., AIAA/SNAME/ASNE,
New Orleans, USA, Feb.
Pieroth, C.G. and Lamb, G.R. (1985), The SWATH Option as a V/STOL Aircraft
Carrier , Branch Meeting,SNAME, Hampton Road Sect., March
Pierson,
W.I.Ir.
and Moskowitz, L. (1964), A Proposed Spectral Form for Fully
Developed Wind Seas, Based on the Similarity Theory of S.A. Kataigorodsky ,
Journal of Geophysical Research, Vol. 69, No. 24, pp. 5181-5190, Dec.
Pierson, W.I. Jr. and St. Denis, M. (1953), On the Motions of Ships in Confused
Seas , Trans. SNAME, Vol. 61, pp. 280-357
References
310

7/26/2019 1992djatmikophd.pdf
http://slidepdf.com/reader/full/1992djatmikophdpdf 340/507
Price, W.G., Temarel, P. and Wu, Y. (1985), Structural Responses of a SWATIl or
Multi-Hull Vessel Travelling in Waves ,
Proc. Int. Conf. on SWATH Ships
and Advanced Multi-Hulled Vessels,
RINA, Paper No. 15, London, April
Price, W.G., Temarel, P. and Wu, Y. (1987), Responses of a SWATH Travelling in
Unidirectional Irregular Seas , Underwater Technology, SUT, Vol. 13, No.4,
pp.2-10
Price, W.G. and Wu, Y. (1987), The Influence of Non-Linear Fluid Forces in the
Time Responses of Flexible SWATH Ships Excited by a Seaway , Proc.8th Int.
Conf. on OMAE, pp. 125-135, the Hague, the Netherlands, March
Pu, Y. (1992), Reliability Analysis of Stiffened Plates ,
Annual Report,
Dept. of
NA&OE, University of Glasgow, (in preparation)
Reilly, E.T., Ingram, T.J. and Arntson, S.G. (1990), SWATH Vessels for Naval
Applications Design and Analysis , A Paper, ABS,USA
Reilly, E.T., Shin, Y.S. and Kotte, E.H. (1988), A Prediction of Structural Load and
Response of a SWATH Ship in Waves ,
Naval Engineers Journal,
ASNE, Vol.
99, No.3, pp. 251-264, May
Routa, T. (1985), Application of the SWATIl Principle to Passenger Vessels ,
Proc.
Int. Conf. on SWATH Ships and Advanced Multi-Hulled Vessels, RINA, Paper
No.3, London, April
Rutherford, S.E. and Caldwell, J.B. (1990), Ultimate Longitudinal Strength of Ships
: A Case Study ,
Trans. SNAME,
Vol. 98, pp. 441-471
Salvensen, N., et al (1985), Hydro-Numeric Design of SWATH Ships , Trans.
SNAME, Vol. 93, pp. 325-346.
Sarioz, K., Hearn, G.E. and Hills, W. (1992), Practical Seakeeping for Design: An
Optimised Approach ,
Proc. of 5th Int. Symp, on Practical Designof Ships and
Mobile Units, PRADS'92, Newcastle upon Tyne, UK, May
Schellin, T.E. and Papanikolaou, A (1991), Prediction of Seakeeping Performance of
a SWAm Ship and Comparison with Measurements ,
Proc. lst Int. Conf. on
Fast Sea Transportation,
FAST'91, pp. 811-827, Trondheim, Norway, June
Seascape (1987), Many Hulls Make Light Work , Seascape, Int. Maritime Magazine,
No.2, p. 21, June
Seidl, L. (1992) discussion to Band, E.G.U. et al, Novel Design Concepts - High
Performance Vehicles , Proc. 11th Int. Ship
&
Offshore Structures Congress,
ISSC, Vol. 3, pp. 233-241, Wuxi, China, Sep.
Sellars, F.H. (1976), Water Impact Loads , Marine Technology, SNAME, Vol. 13,
No. I, pp. 46-58, Jan.
Seren, D.B. (1983), SWATH - the Shape of Ships to Come ,
High-Speed Surface
Craft, Dec.
References
311

7/26/2019 1992djatmikophd.pdf
http://slidepdf.com/reader/full/1992djatmikophdpdf 341/507
Seren, D.B. and Atlar, M. (1984a), The SWATH Wave-Load Program, Progress
Report No 6; An Overview of the Concepts Employed to Predict the
Hydrodynamic Forces Imposed on an Unappended SWATIl-ship Proceeding in a
Seaway ,
Department Report,
No. NAOE-84-63, Dept. of NA&OE,
University of Glasgow
Seren, D.B. and Atlar, M. (1984b), An Overview of the Concepts Employed to
Predict the Hydrodynamic Forces Imposed on An Unappended SWATIl Ship
Proceeding in a Seaway ,
Department Report.
No. NAOE-84-63, Dept. of
NA&OE, University of Glasgow, Dec.
Seren, D.B. and Leitch. E. (1982), The SWATH Wave-Load Program, Progress
Report No 1; The Wave Input ,
Department Report,
No. NAOE-82-30, Dept. of
NA&OE, University of Glasgow,
Seren, D.B .• Leitch. E. and Miller. N.S. (1983a), The SWATH Wave-Load
Program, Progress Report No 3; Manual for Structure Geometry Description ,
Department Report, No. NAOE-83-38, Dept. of NA&OE, University of
Glasgow
Seren, D.B., Leitch. E. and Miller. N.S. (1983b). The SWATH Wave-Load
Program, Progress Report No 4; Program for Offshore Structures Hydrostatics
(POSH) , Department Report, No. NAOE-83-35, Dept. ofNA&OE, University
of Glasgow
Seren, D.B., Leitch, E. and Miller, N.S. (1984), The SWATH Wave-Load Program,
Progress Report No 5; A Package to Compute and Control the Weight
Distribution. Dynamic Properties and Static Loads of Floating Offshore
Configurations (MAD) ,
Department Report,
No. NAOE-84-32. Dept. of
NA&OE, University of Glasgow,
Seren, D.B. and Miller, N.S. (1982), The SWATH Wave-Load Program, Progress
Report No 2; The Tentative Outline of the Treatment of the Geometry .
Department Report, No. NAOE-82-31. Dept. of NA&OE, University of
Glasgow
Seren, D.B., Miller, N.S., Ferguson, A.M. and McGregor, R.C. (1985), Some
Motion and Resistance Aspects of SWATH Ship Design , Proc. Int. Corf, on
SWATH Ships and Advanced Multi-Hulled Vessels,
RINA, Paper No. 10,
London. April
Sheridan, D., Clark, DJ., Jones, R. and Fein, J. (1984), The ASSET Program - A
Current Navy Initiative ,
Proc. SNAME STAR Symp.,
Los Angeles, USA,
April
Shin, Y, Kotte, E., Thayamballi, A. and Unger, D. (1989), Analysis Procedure of
Hydrodynamic Load and Fatigue Life Prediction for SWATH Ships in Waves .
Proc.Lntersociety Advanced Marine Vehicles Conf., Paper No. 89-1477-CP,
Arlington, VA, USA. June
Sikora, J.P. (1988a), Some Design Approaches for Reducing the Structural Weight of
SWATH Ships , Proc.lnt. Con . on SWATH Ships and Advanced Multi
Hulled Vessels II, RINA, Paper No. 18, London. Nov.
References
312

7/26/2019 1992djatmikophd.pdf
http://slidepdf.com/reader/full/1992djatmikophdpdf 342/507
Sikora, J.P. (1988b), discussion to Lee, K-Y, et al (1988), On the Design
Technology of SWATIl High Speed Passenger Ship , Proc.lnt. Conf. on
SWATH Ships and Advanced Multi-Hulled Vessels II, RINA, Paper No. 17,
London, Nov.
Sikora, J.P. and Beach, J.E. (1986), Automated Method for Predicting Maximum
Lifetime Loads and Fatigue Lives of Ships , Proc. of the 9th Annual Energy-
Sources Technology Conf.
&
Exhibition : Current Practices and New
Technology in Ocean Engineering, ASME, New Orleans, USA, Feb.
Sikora, J.P. and Dinsenbacher, A.L. (1988), SWATH Structure: Navy R&D
Design Applications , Branch Meeting, SNAME, Chesapeake Section, Oct
Sikora, J.P. and Dinsenbacher, A.L. (1990), SWATH Structure: Navy Research and
Development Applications , Marine Technology, SNAME, Vol. 27, No.4, pp.
211-220, July
Sikora, J.P., Dinsenbacher, A. and Beach, J.E. (1983), A Method for Estimating
Lifetime Loads and Fatigue Lives for SWATH and Conventional Monohull
Ships , Naval Engineers Journal, ASNE, Vol. 95, No.3, pp. 63-85, May
Sikora, J.P. and Swanek, A.D. (1982), SWA TIl Preliminary Structure; Design
Considerations and Stress Calculation Method , Enclosure to DTNSRDC letter
173 ADS, 5605,82-173-55, April
Skaar, K.T., Valsgard,
S.,
Kohler, P.E. and Milrer, C. (1987), How Low Can Steel
Weight Go with Safety and Economy 1 , Proc. of the 3rd
Symp,
on Practical
Design of Ships and Mobile Units, PRADS'87, Trondheim, Norway, June
Skaar, K.T., et al (1991), Inspection, Monitoring, Maintenance/Repair , Proc. 11th
Int. Ship & Offshore Structures Congress, ISSC, Report of Committee V.2,
Vol. 2, pp. 41-86, Wuxi, China, Sept.
Smith, C.S. (1977), Influence of Local Compressive Failure on Ultimate Longitudinal
Strength of a Ship's Hull , Proc. Int. Conf. on Practical Design in Shipbuilding,
PRADS 77, Tokyo & Seoul
Smith, C.S. (1990), Design of Marine Structures in Composite Materials , Elsevier
Science Publishers Ltd., London and New York
Smith, C.S. and Monks, E.H. (1982), Design of High Performance Hulls in FRP ,
Proc. of 2nd Symp. on Small Fast Warships, RINA, London, May
Smith, D.L., Cuthbertson, W., MacGregor, J.R. and McGregor, R.C. (1987),
SWATH Sonar Support Vessel (SSV) , Contract NSS 41A/1800, Concept
Study Report, Yarrow Shipbuilder Ltd., July
Smith, S.N. (1982a), Design and Hydrodynamic Assessment of a Small Semi
Submersible SWATH-Type Vessel , PhD Thesis, Dept. ofNA&OE, University
of Glasgow
Smith, S.N. (1983), Design and Hydrodynamic Performance of a Small Semi
Submersible (SWATH) Research Vessel , Trans. RINA, Vol. 125, pp. 69-91
References
313

7/26/2019 1992djatmikophd.pdf
http://slidepdf.com/reader/full/1992djatmikophdpdf 343/507
Spaulding, K.B. (1966), A History of the Construction of Fibreglass Boats for the
Navy ,
Naval Engineers Journal,
ASNE, Vol. 78, April
Spencer, J.S. (1975), Structural Design of Aluminium Crewboats ,
Marine
Technology, SNAME, Vol. 12, No.3, pp. 267-274, July
Stavovy, A.B. and Chuang, S-L (1976), Analytical Determination of Slamming
Pressures for High-Speed Vehicles in Waves ,
Journal of Ship Research,
SNAME, Vol. 20, No.4, pp. 190-198, Dec.
Stenson, R.I. (1976), Full Scale Powering Trials of the Stable Semi-Submerged
Platform, SSP
Kaimalino ,
DTNSRDC, Report SPD-650-01, April
Stevens, R.M. (1972), New Dimensions for Naval Catamarans ,
NSRDC,
Report
No. 3830, Bethesda, Maryland, USA, May
Stirling, A.G., Jones,G.L. and Clark, J.D. (1988), Development of a SWATH
Structural Design Procedure for Royal Navy Vessels ,
Proc. Int. Conf. on
SWATH Ships and Advanced Multi Hulled Vessels II,
RINA, Paper No. 19,
London, Nov.
Strom-Tejsen, J., Yeh, H.Y.H. and Moran, D.O. (1973), Added Resistance in
Waves , Trans. SNAME, Vol. 81
Suhrbier, K.R. et a1.(1990), Report of the High-Speed Marine Vehicles Committee ,
Proc. 19th Int. Towing Tank Conference, rrrc,
Vol. 1, pp. 289-378, Madrid,
Spain, Sept.
Takeuchi, M., Takagawa, S., Miyanabe, R. and Watanabe, T. (1985), Structural
Design of the Semi-Submerged Catamaran-Type Underwater Work Test Vessel ,
JAMSTEC,
Technical Report No. 15
Thoft-Christensen, P. (1987), Application of Structural Systems Reliability Theory in
Offshore Engineering, State-of-the-Art ,
Proc. 3rd Int. Symp, on Integrity of
Offshore Structures,
pp. 1-23, University of Glasgow, Sept.
Thorpe, T.W. (1987), A Simple Model for Fatigue Prediction and In-Service Defect
Assessment of Tubular Joints ,
Proc. 3rd Int. Symp, on Integrity of Offshore
Structures,
pp. 285-326, University of Glasgow, Sept.
Thwaites, B. (1960), Incompressible Aerodynamics , Oxford University Press, pp.
405-421
Tolikas, C, et al (1992), Integrated SWATH Structural Design ,
Department Report,
No. NAOE-14-92, Dept. ofNA&OE, University of Glasgow, April
van Sluijs, M.F. (1974), Ship Relative Motions and Related Phenomena , Proc.Lnt.
Symp, on the Dynamics of Marine Vehicles and Structures in Waves,
Office of
Naval Research/RINA/lMechE. London, April
Verhagen, J.H.G. (1967), ''The Impact of a Flat Plate on a Water Surface ,
Journal of
Ship Research, SNAME, Vol. 11, No.4, pp. 211-223, Dec.
Wahab, R., Pritchett, C. and Ruth, L.C. (1971), On the Behavior of the ASR
Catamaran in Waves .
Marine Technology,
Vol. 8, No.3, pp. 334-360, July
References
314

7/26/2019 1992djatmikophd.pdf
http://slidepdf.com/reader/full/1992djatmikophdpdf 344/507
Walker, M.A. (1984), SWATH vs Monohull Initial Design , MSc Dissertation,
University College London, Oct.
Watanabe, I. (1987), Effects of the Three Dimensionality of Ship Hull on the Wave
Impact Pressure ,
Journal of Society of Naval Architect Japan,
SNAJ, Vol. 162,
pp. 33-47, Dec.
White, G.J. and Ayyub, B.M. (1987), Reliability-Based Fatigue Design for Ship
Structures , Naval Engineers Journal, ASNE, Vol. 99, No.3, pp. 135-149,
May
Whitman, A.M. and Pancione, M.C. (1973), A Similitude Relation for Flat-Plate
Hydrodynamic Impact , Journal of Ship Research, SNAME, Vol. 17, No.1,
pp. 38-42, March
Wiernicki, C.J., Gooding, T.G. and Nappi, N.S. (1983), The Structural Synthesis
Design Program - Its Impact on the Fleet ,
Naval Engineers Journal,
ASNE,
Vol. 95, No.3, pp. 87-99, May
Winkle, I.E., Cowling, M.J. Hashim, S.A. and Smith, E.M. (1990), What Can
Adhesives Offer to Shipbuilding ,
Proc. Ship Production Symp.,
NSRP 1990,
SNAME, Milwaukee, USA, Aug.
Wirsching, P.H. (1983), Fatigue Reliability for Offshore Structures , Journal of
Structural Engineering,
ASCE, Vol. 110, No. 10, pp. 113-120, Oct.
Wirsching, P.H. (1985), Probability Based Fatigue Design Criteria for Offshore
Structures , Final Report API-PRAC-15, American Petroleum Institute, Dallas,
TX, USA, Jan.
Wirsching, P.H. (1986), Probability Based Fatigue Criteria for TLP Tendons , Proc.
5th Int. Symp. on OMAE,
ASME, New York,
Wirsching, P.H. and Chen, Y-N. (1987), Fatigue Design Criteria for TLP Tendons ,
Journal of Structural Division, ASCE, Vol. 113, No.7, pp. 1398-1414, July
Wirsching, P.H. and Chen, Y-N. (1988), Considerations of Probability-Based
Fatigue Design for Marine Structures , Marine Structures, Vol. I, No. I,
pp.23-45
Woolaver, D.A. and Peters, J.B. (1980), Comparative Ship Performance Sea Trials
for the U.S. Coast Guard Cutters 'Mellon' and 'Cape Corwin' and the U.S.
Navy Small Waterplane Area Twin Hull Ship Kaimalino , DTNSRDC, Report
80/037, Bethesda, Maryland, USA, March
Wu, J.Y. (1984) A Study of Effects of Fin Size on the Pitching and Heaving of a
SWATIl Ship , Department Report, No. NAOE-84-55, Dept. of NA&OE,
University of Glasgow, June
Wu, J.Y. (1985a), Experimental Investigation of Vertical-Plane Response of a
SWATIl Ship with and without Aft Fins in Head Seas , Department Report,
No. NAOE-85-31, Dept. of NA&OE, University of Glasgow, Jan.
References
315

7/26/2019 1992djatmikophd.pdf
http://slidepdf.com/reader/full/1992djatmikophdpdf 345/507
Wu, J.Y. (1985b), SWATH Vertical Motions with Emphasis on Fixed Fins Control ,
PhD Thesis,
Dept. of NA&OE, University of Glasgow,
Wu, J.Y. and McGregor, R.C. (1986), SWATH Seakeeping in the Presence of
Control Fins , Proc. 5th Int. High-speed Surface Craft Conf., Southampton,
UK, May
Yamamoto, Y., et al (1985), Structural Damage Analysis of a Fast Ship Due to Bow
Flare Slamming ,
Int. Shipbuilding Progress,
Vol. 32, No. 369, pp. 124-136,
May
Yang, P.D.C. and Lee, J-S. (1991), Safety Assessment of Double Skinned Hull
Structure Against Ultimate Bending and Fatigue Strength , Proc. of SNAK'91
Spring Meeting, Soc. of Naval Architect Korea, University of Ulsan, Korea,
April
Zheng, X. (1985), Calculation of Potential Flow about Arbitrary Three-Dimensional
Bodies, Part I - Free Surface Flow ,
Department Report,
No. NAOE-85-54,
Dept. of NA&OE, University of Glasgow,
Zheng, X. (1986) Calculation of Potential Flow about Arbitrary Three-Dimensional
Bodies, Part II - Flow about Submerged Bodies , Department Report, No.
NAOE-86-52, Dept. ofNA&OE, University of Glasgow
Zheng, X. (1988), Prediction of Motion and Wave Load of Mono and Twin Hull
Ships in Waves , PhD Thesis, Dept. of NA&OE, University of Glasgow, June
Zheng, X. (1989), User's Guide of Program 'SHIPM1.0' - For Twin Hull , A
Manual Report,
Dept. of NA&OE, University of Glasgow
Zheng, X. and McGregor, R.C. (1987), Prediction of Force and Motion
Response in Crane Vessels ,
Proc. of Marintec China
87
Corf.,
Shanghai, Dec.
References
316

7/26/2019 1992djatmikophd.pdf
http://slidepdf.com/reader/full/1992djatmikophdpdf 346/507
APPENDIX A
FURTHER SWATH MOTION DATA

7/26/2019 1992djatmikophd.pdf
http://slidepdf.com/reader/full/1992djatmikophdpdf 347/507
_.J
1
0
0
..r-
-
.r-
I
z;
Lf'I
~~
I
In
..-
_J
~ II
W
CI ) .
Z
c . ., .. , . .. .. .
-c
0
0
0
c::§
I
lL.
.g~
l-
D
<C
~
~O
: : : z
w
'l:j ....
If')
00
w
~ - e
:
=: l
Z
. _
~
QZ
.-
-
«
~
u :
Appendix A
A-l

7/26/2019 1992djatmikophd.pdf
http://slidepdf.com/reader/full/1992djatmikophdpdf 348/507
r
-
. . . .
~
1 1 . ~
•0
• 0
r
. . . . : E .
ll~
•0
L . a . . ~ . . . .. a . . . . .. . . .. . .. . .L.a...........................
..J
0
0::)
o
l
. . .
r
. . . . . . : E .
1 1 5
:E~~
•0
. 0
o
Appendix A
A-2

7/26/2019 1992djatmikophd.pdf
http://slidepdf.com/reader/full/1992djatmikophdpdf 349/507
C l
' '
r
I t
- N ~
CO)
1 1 5
n
C l r :
)1)1~
CO)
8.......
•0
'J ~
:::l~
0 1 . 1 . 0
o C C : . . .. ..
N '~~
I t i . : ~
- Z
•
C l ~~
- ~
1 1 ' 1
Cl)
0
0
-.
q q q q
q
0
Cl
0
0
8
. .
CD 1 1 ' 1
•
CO)
N
-
0
o su od s:llIllO li 'U I P -UON
c I f
~
ell
t ' : S
0
ell
i
~
N ~
] 1 5
~......
.0
s : :
)1~
. . . . .
G l8
ell
•0
: J
p 1
s
'0
~ 1 . 1 . 0
~
: :C . .. .. .
N '~~
-
t 1 e i
0
•
•
]Zoo;'.8
C l i s ,8
. . . . - 0 4
- 4(
~
1 1 ' 1
~
0
Cl)
C l
~
q
~
Cl
III
Cl
III
0
0
V
CO)
N
-
0 0
M
osuodS: ll l : lAr .l ll ' II I P -I I0N <
a
C l
u : :
' '
i
I t
N ~ .
Cl)
) 1
6
•
1
l
)1~
Cl)
•0
1 1 ' 1 i~~
N ~~
o
1 ~ 5 ,
, -:J
-
Ni~~
0
~z ~j
::; ~,a
~
I t
til
0
0
~ ~ ~ ~ ~
gO
-
0 0 0
ci
osuodr.lll
'<UIS
'UlJp-UON
Appendix A
A-J
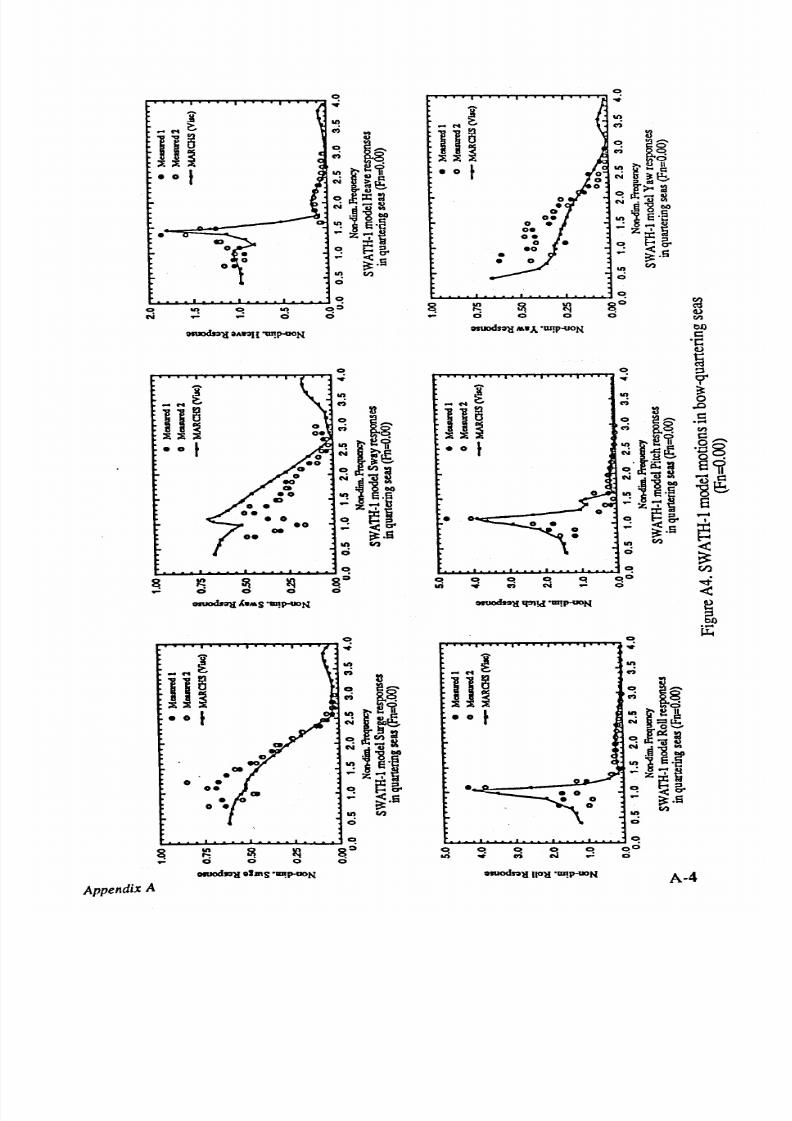
7/26/2019 1992djatmikophd.pdf
http://slidepdf.com/reader/full/1992djatmikophdpdf 350/507
r
II
_ N ~
N ~
CO)
. . .
1 1
8
:l
1 1
8
4)
o ~__
~~
~~~
l'i 8
~~~
~ f ' i i
• 0 t
1It>.~1I
• 0 t
• ~ c : :
N ~~
N ~
e : .
01
o ~~
o l> - : a
N .
-0 ~
N
i
0 ~
.Ii ' 8 e . G
' ' 8 e . G
It
1e· §
II e'2
•
. . z -
- z ; ' S
't
::t:;:I
C i: g.
C
~O'
... <s
•
~.s
~.
•
It
'
I
I/)
0
0
0
C
~
0
C
lit
0:)
~ ~
~ ~
gO
Q)
C \i
0
0
0 0 0
0
fI)
osuods:»~ aA~H '1 II p -u<lN
~M·J..·1IIJ1I-UON
bJ)
(:l
.t::
Q)
~
C
C
~
. . .
. . .
0'
r
r
I
II
II
~
N : E -
CO)
t t
_ N : E -
CO)
.0
1 1
8
1 1
8
:l
C
1 - -
o l . . . . . . .
(:l
~i~
.p04
~~~
:i~
~~~
fI)
• 0 t
• 0
t
8-
. > .@ .
N § e : .
'l:l8
N ..
.0
~
o· ~ B
§ 1 f
o
'8
N il:o
NiDO
-(:l
eo
.g~
.0
: z ~ ' i
lit e·
S
G
: z ; ' ~
8
•
o.
o i:g.
-
0
~ ~ 0'
I
.0
..: ~.s
~
oe
~.a
lit
'
1ft
'
t
et
0
0
V
~
~
~
lq
~::i
C
0
q
C
q qci
~
II
~
CO)
N
-
0
-
0 0
0
0
- e
0I1J0dnl{
'<.MS '1II JHX>N
0I1J0dnl{
1pl ld '1D p-uDN
~
. . . .
~
C
C
. . .
. . .
_ ~ l
It
r
It
CO)
r J
_ ~ : E -
CO)
1 ] 8
C
1 ( s -
l]~
~ii
~
;i~
0
I
• 0
t
o ( 1 ) : 1
o ~:I
N
'U~
N d - . s ~
i'8 DO
. 8~
~ z ~ ' ;
lit
1
e.
:z ;'i
0
o
i: g.
~g.
C
..: <a
~.a
.
1ft
(I)
It
(I)
et
0
0
0
~
In
~ ~
g::i
q q q
~
q
oci
c i
0
0 0
lit . . .
n
-
0
otUOdlDl l o lJ IIS '1D JHX>N o m o c m ~ I IO~ '1D JHX>N
A·4
Appendix A

7/26/2019 1992djatmikophd.pdf
http://slidepdf.com/reader/full/1992djatmikophdpdf 351/507
IM AG ING SERVICESNORTH
B o sto n S p a, W e th erb y
W e s t Y o rk sh ir e, lS23 7 BQ
www.bl.uk
PAGE MISSING IN
ORIGINAL

7/26/2019 1992djatmikophd.pdf
http://slidepdf.com/reader/full/1992djatmikophdpdf 352/507
~
~
c o c o
'i
0
r
0
_ . . .
~
, . . :
- . . . ~
r-
1 1
8
WI
1 1
8
'
u
~il~
~
>.~
~~~
~~~
ID
g
~N'
o 0 J
~l~~
o 0 ~
o
r
Vl
v i u . . = c i
o n B
II
B
II
)1'-
s : :
)1'-
I::
: J ~ i
~ f : e : .
. . g ~
o
e '
o .
e.;
~ . I i --:-g
~ .Ii --: ;J
' i5
l
' : : I : . =
o e 5 o 81- 5
NZ<'
. Z<'
~
N ~
~
U
~
U
0
0
. . .
~
0
0
0
-
0
C
0
~
C
0::1
C C C
~
C
C'I
ID
a n
. .
ri
. .
0
o n
. .
CO)
-
0
'0
-
1 f
ruodnll 'Plld 'IIJ P oU ON
0'1
o suo d~ lI 'P lld '1II P -U 0N
~
1 f ~
~
/)
0 0
c a
c O
c o
0
/)
'i
ell
_...
c a
- g
0
- . . . ~
~
r-
III
r-
0
1 1
6
tl
d
1 1 5
tl
.c
~[i~
~
: ; ; l
c :
~~~
.c
:i:i~
. . . . .
tlN'
/)
o •
t
°lue<}
. S
o • t
o [ ..
on
c :
v i fif
v i
~ 1 f
0
/)
'p
c:
~ J ~ ~
~
I : : I : ~
0
. . . . . .
.. l~
. . . .
.. i1 B
-
8 . . .
0
~ i t
s,;
~ ·s
]
O) ..... .,
-
CO) . I i i . . . . . ,
l ' J
0
o
1 . J
~ z~.a
]
Nz~.a
.-4
~
.-4
~
~
~
I
~
U
. .
~
. .
0
0
~
C
~
C lit C lit
0
0
C
0
0
V,l
CO)
'
. . . .
0
0
CO )
0
00
V,l
<
llUDClnll0A1t2J{ 1IJ IHION
r - - :
OIU~ OAWH '1IJ P UO N
~
0
~
u :
c O
u :
_...
'i
~
- . . .
~
-
r J
:l
ll~
:I~~
ll~
o ~
~I~
'
o •
t
o .. e<}
o 0 t
o e )
v i
~l
v i ~o
)I~~
: J ~
B
o
J
U
.. i1 :1
8 u
~ S'i
~ . e ' ;
CO)i ....
u
CO) J i l . . .
;J
' . =
1~'=
i5.a
0
Nz<
~ z<·5
0
~
0
~
~
U
~
U
0
0
. .
0
~
0
lit
C
II
0
0
&
~
~ ~
gO
N
. .
. .
0
0
. .
0
0
0
0
osuods~lI ~IJI1S 1D p-uDN osuods~lI olms 1U PoUON
A pp en dix A
A-6
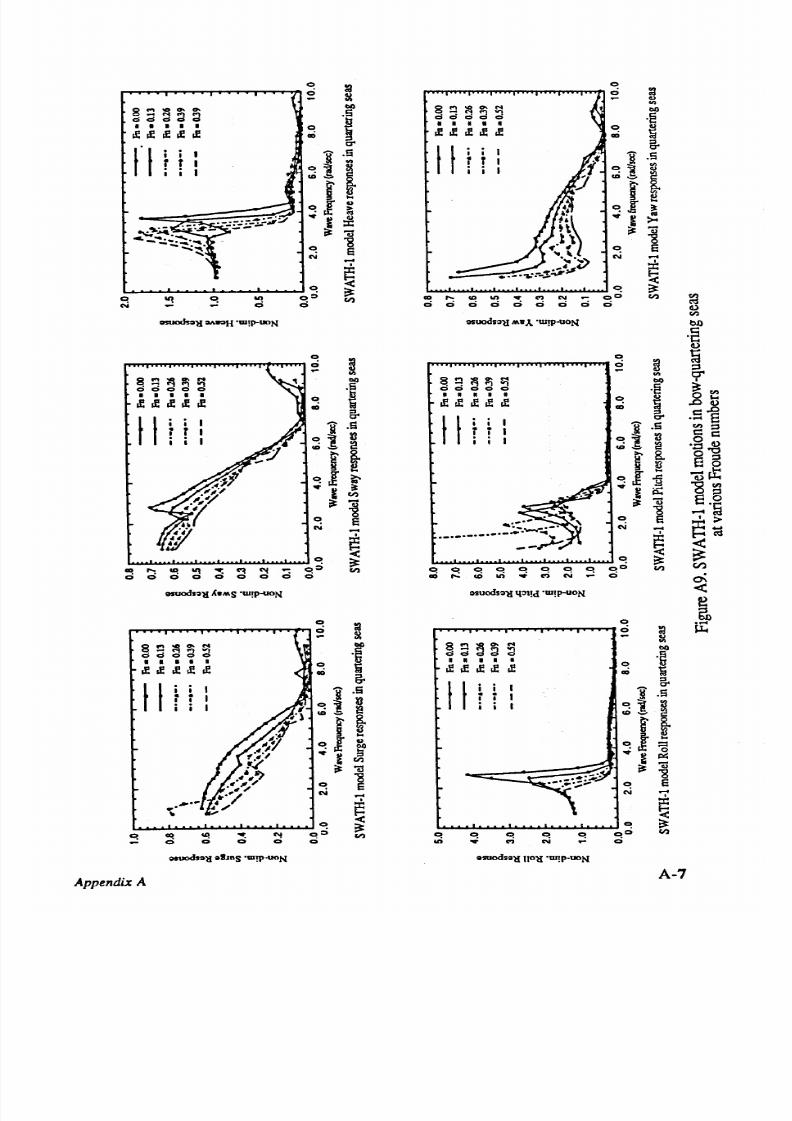
7/26/2019 1992djatmikophd.pdf
http://slidepdf.com/reader/full/1992djatmikophdpdf 353/507
~ ..
.
~
aq
o
'
o
A pp en dix A
N _
:I :
~
o ~
CO. .. .. .. , .. .. .. .. .. .. CO. .. .. .. . . .. .. .. .. .. .. .. .. .. . . ., . . .. .. .. . N . .. .. . . . a . _ . . . . . . . . O 0 Cl)
o
0 0 0 0 0 0 0 0
-.::.~. . . . . .
................ _.... '''IiI
--~
t t
o
co
Cl
.
Cl
N
A-7

7/26/2019 1992djatmikophd.pdf
http://slidepdf.com/reader/full/1992djatmikophdpdf 354/507
C
. . . . .
C
. . . .
~
~
~
. . . .
. . . . . . . .
l
<
In
«
II'
.§
')
._.
C')
U
. . . .
I
r
I S
~I~
~
q
In ~
~l~~
m
N ...
~I
lIi~
. §
O J ~
~
N ~~
: ~
II' • l<
. . . : 9 8~
o e
. . .
o e . c : ~
.;z
.
~
';Z.gO
. S
'5.
II'
~
II'
U
'
0 ~
c:
III
0
: : t :
. . . . .
. y
. . . .
0
0
~
~ ~
~ ~
8:)
i:i:
8
0
In
~
In
sQ
. .
0
0
N
d
0 0
0 0 d
0
- a
9 9
9 9
9
s~v
o
,E~PIl1lSEY
.~
>
. . . . .
' '
M
0
. . 9 , . . . . . , .
?
~
1
~
( f I
~
. . . .
;..
l
1-
II'
«
II'
.§
c: .
j
C')
C')
.~'?
I
. . . .
I
r
I S
u c:
~i~
~i 8,...
S~
UM
8-
. . . . . .
- II'
1~
~l~1
~ '8
...
~I
° r ~
E e
. .
s
.
~
. . . .
0_
'C l
N '
:;~
n
1 6
' ]~
- ~ j
§
. ; . 6 g.~
§<
. . .
1 8
m
~~
.
~
o . c : . . . .
';ZB
O
e ~
l
'5.
II'
II'
,
'3
0
~
0
0
~
:g
m
I
0
~
0
<
~
I I I
II ~
I
~: )
: : t :
~
a
~
~
a
~
NQ
0
. .
0
0
0 0
0
~
0 0 0 0 0
q q
-
EE Y
,l~PIl1lS1V
<
. . . . .
~
C
M
C
.
. . .
. . . .
~
~
1
~
-
; : . , : . .
I
<
II'
« II'
.§
C')
C')
I S
l
. . . .
l r
,
~i~
o 8
c ? i uB
II'
I ~
~~1 i
...
r~
J . i
t
~ ~~
•
-g ~
I S
•
: 1 8 - <
1
8
•
J
. 8~
C
Z ~
o u
. Z
>
0
... e
... :l
II'
l
II'
i =
u
0
0
t> O
3
u
0
m
0
r;
~
8
~
~
a
~ ~
8:)
l
~
o n
0
~
~
.
0
, Q
m
~ ~
8
~ ~
d
d
0
0
0
0
d
~
0 0 0
0 0
0
9
q
q
,IIV
.1EYpUW,EtV
Appendix A
A-8

7/26/2019 1992djatmikophd.pdf
http://slidepdf.com/reader/full/1992djatmikophdpdf 355/507
·99Y
~~. ~· 8~. ~~~~~~~. ~~S~. ~~~~
000 0 0 0
•ttV
II
o
~~~~~~~~~~~o
~0~~~~~~~~
~ ~ ~ • ~ N~ 0 ~
.rzv
A ppe ndix A
. 1 > 9 V pU l l . 9 ' V V
1
r
l
o
. . .
o
.
. . . . .
. . . . .
- e
~
u :
A-9

7/26/2019 1992djatmikophd.pdf
http://slidepdf.com/reader/full/1992djatmikophdpdf 356/507
Appendix A
A-lO

7/26/2019 1992djatmikophd.pdf
http://slidepdf.com/reader/full/1992djatmikophdpdf 357/507
r
~
I i
• t
Appendix A
~
Q
. .. .. .. &l. I. I.~ ... .. .. .~I.&.Y .................................. Q
~ ~ § ~ 0~~~
~Q
(3~p)~I UY~SlIIId
A-II

7/26/2019 1992djatmikophd.pdf
http://slidepdf.com/reader/full/1992djatmikophdpdf 358/507
0
0
C
I
0
I C
I
0
0
III
~
III
0
III 0
0
N
ci
til
'
CIf
. . .
. . .
0
C 'f :
I
C 'f C
C ' : S
. . .
. . .
0 0 0 0
0
osuod~ OAWn UI JHION
osuodl~'U MWAm tHK'N
til
bJ)
, 2
~
~
9 -
l
l
III
~
?;
l~
tl
l i
tl
0
:IIi
~
~8
.0
'
8.,
,S
• t
• t
~
e~
til
I
c ::
N
~ e : : .
N
.e:u..
0_
~
~'-
ss
o 1 1 ) 1
o· ~:J
•
•
N
'U
• _ ILl
~'if
• ILl '
i 8 e o
. I l 8 e o
~ z ~ ' 1
1e'E
.g~
z C ? ~
~ ~ go
•
~
~ s -
8
•
~
. .
~,a
. ~,s
I
•
~
III
Cl)
III
II)
0
0
0
0
~
~ ~
s
~ ~
~o
C C C C C
0
0
Cl')
.
~
C'I
N
. .
ci
~
-
-
0
0 0
~'WMS~N
orvod~'U 'l:J\ d 'lII p-uoN
-
<
0
0
~
. .
it
l
i
'
~
C'I
1~
tl
J ~
. . .
~
~
. . . . . .
0
~ . . . . . .
'
t~
~
~~
• t
r
9
• t
rt ~
CIf ~
CIf =u..
0.......
~ I ~ B
o
1 ~ : J
• 'U ~
CIf 1 ILl '
C l f l 8 e o
8 e o
•
II
a.s
III e · e
• •
' z f ' l U
• f' I
i
'Z'
'ii
~ ~ s -
~
~g.
. .
- ~.a
,a
Cl)
.
Cl)
.
0
0
~
~
~
~
~ ~
gO
C C C
~
C
~
~
C
0
0
OD
, . . .
Cl)
~
-
ci
0
0
0
ci
osuod~'U ol.lllS '1D P-UON osuod~'U II
O
'U'III p-uGN
A-I2
A pp en dix A
~
~
l
II
'
l a
tl
~
~
. . . . . .
~~
'
8.8
• t
.
i ~ 1 f
N
~~
~l~ B
CIf §
III '
. - g e o
II
1e'~
- z C ? 1 ; I
~ is 6 -
... <a
~.
.
Cl)
0
•

7/26/2019 1992djatmikophd.pdf
http://slidepdf.com/reader/full/1992djatmikophdpdf 359/507
'ii
~
8
~
'ii
~
e
~
1
~
:i:
~
~
. ,
~
. . ,
~
~8
~ ~
. . ,
~,...
/).
. . ,
I / ) ~
1ft
i£~
J , l l ~
'O~
N ....u.
1
§~
o.._.,
~
.~
~
~ .~~
•
°
J I e N)
NE l 0
~1~ · i
1
e
N)
-z:l
~ ~.ij
::I:::I 'Z> a
o tI cr
~
~g.
.; -S .s
. . . .
..-
'0.
5 1
1ft
0
0
.s
~
u
00
0
Co
i
Ii
0
~
v
~o
0
~
~
§
~
0
~
~
~
~
~
8
5 1
0
0
~
0
~o
~
;
'9
1ft
Cl..
-
..-
.
(bp)
~'uvIIntId
t'llp)
I ll S U Y 1 1 51 1 11 d
1ft
f';I
M
~
~ ~8
., 1/).
J ~ l
°
~ .~~
Ni ° N)
. e ~
ft >,.
. . .
. . .~
1/)::1
~
~cr
..-
.....5
°
tI
0 Co
ij
~
§
~
5 1
§
~
0
I i ;
~
~
~o
If
.-
(1:)p)
\ If 'U V 0 I1 II Id
'ii
C
1
~
f';I
C O)
~
C
~8
'l
I / ) •
~
i~l
C l.~~
N1 °
00
. eift v'
• 00
Z5
11)::1
o vcr
..; -S S
. . . . .
°
ft
~
f ,j
C
~
~
§
~
0
I i ;
~
~
~o
..-
;
(bp)
: If 'UV
' , I . .
tk
A ppendix A
~ ~ §
5 1 0
I i ; ~
t'llp)
I l l 'U Y 1 15 1 11 1d
j
.
I-
r
.
. .
en
c:
. 1 : :
o
la
g .
~
. . 8
c:
. . . .
A-13

7/26/2019 1992djatmikophd.pdf
http://slidepdf.com/reader/full/1992djatmikophdpdf 360/507
Appendix A
L o . & . I o a J . . & . . . . . . . . . . . . . . . J .& . o. o . .. .. .. .. .. .. .. .. .. .. .. J .& . o. o . .. .. ..
ouJ°
8 ~
°
51 8 51 8°
~ , ~ ~
:'
(1 3p)
Oilluy
OSlnfd
~ ~ § 51 ° I i ; ~ ~
(lI:1p) Oilluy
OSlnfd
. . . .
o
~
~ L o . . . . . . ~ . a . . . . . . . § . a . . . . . . . : i . a . . . . . . . o L . o . . . . . . o . : i. . . . . - § . . . . . . .. . . ~. . . . . .
ouJ~~
J
(lI3p)
Ol2uy
QSlnfd
A-14

7/26/2019 1992djatmikophd.pdf
http://slidepdf.com/reader/full/1992djatmikophdpdf 361/507
~
Ql
8
,
E
r
II
II
t l
e,
I
Cl)
Cl)
=
5
rl
(
~
~
. . . . . . .
~
~
. . . . . . .
~
Cl)
8.~
Cl)
( I ) ~
III ~
~'i
III
i~lr
l
· =
N
. . . =
8~~
o~
o l i : t ~
o I
I S ~
N . Ql ~
.
. _ ~
N . -
i 8 01)
. e ~
01)
III E'S
III
1 . c ·
5
·
~
.
~
- z~~
- Z ~~
o i : . s
~
~ . s
· < S i
~.
....5
0
II
( I )
III
~
0
f a
0
0
~
0 0 0 0
C o
0:;
~
li 8 li
0
~
8
0
~o
i
o n
•
~ N
ci
III
f
. . . . . . . . .
. . . . . . . . . .
Cl)
. .
0
o suo dtl)lI 'P 1 d 'I1I P-U 0N
( l)p)
O(lIuy
1lS1IlId
. . . . . .
en
@
G 3
0
Cl)
~
~
'8
~
.,
.,
E
. s : : : :
0.
III
II
~
' O_
M
Cl)
=
~8
1 8
~
Cl) •
0
~
~ 8
g c : r r
Cl)
~~~
u c : i
'0 c : :
II
i
S ~
8~
>Ll..
N
'eLl..
: 1 ' - '
1
6
'- '
...... coj
~ = 5
~ '. : l ~
. g ~
d-'
N•0V
II llr
.§ e
01)
e~
II 1
u . S
. > ~
.~
- Z t l O
-zg3o
('t'\~
~;§
::t:::::
'0
~ ~
u . s
i 5 ~
~.s
o S
.S
<~
. .
II
0
~.s
ft
( I )
U
0 0
'C o
Cl)
;j
r - - :
~
1
II C o
III
0
0
~
~
li
~o
-
o
III C o
~
li
§
li
<
l)
N
N
-
0
ci
. . . . .
, . . . .
Cl.
0
o su od s~ lI O I\ nl l'W P -UON
( l)p)
O(lIuy
OS1llld
~
Ql
u :
~
~
1
,
- . - ,
. . , .
i
~
t l
II II
.
~
::t:
l)
tl
Cl)
(
5
o ~ . . . . . . .
-.....
~
~8
~
M ~~
I'--.
Cl)
( I ) .
IIIi
lr
>.~
'i
l
• . . , c : :
II
~....J:OOi . J .
N
0-,
~' - '
i
l S l 3
i ( l ) : i
N
. ii ~
: :C ~
i 8 W
. e Cl)
II E'
III u , S
• bI) ~
' z t l o
... Z S . . 9
~~
,
~
U'O
C o
0)'
~ . E i
o S .5
. . . .
0
II
U
III
. :
0 0 bI)
f a
~ ~
0)
a
~
~
~
8::»
~
~ ~
li
0
~
~
li
~o
. 2
ci
. . . . .
Cl.
0
0
.
o su od sl)lIl)tm S 'W P 'U ON
~p )
o(lIuy
osWtld
Appendix A
A-1S

7/26/2019 1992djatmikophd.pdf
http://slidepdf.com/reader/full/1992djatmikophdpdf 362/507
o
,..:
r
- . . ~
1 1 1
• 0 t
o
r ' ...... ...., .......,......P T ............ ' T , . . . . .. . . . . .. , ~
_..l
li~
• 0 t
• 0
• 0
• 0
~~~~~~~~~~~o
~ ~ ~ 8:;;
o
0 0 0
osuod':IlI
olJns 'llIlp-UON
A pp en dix A
•0
•
o
~~~~u. . .~~~~~8°
l < l ~ ~ ~ ~
o 0 0 0
osuodso~ ollJns 'WlP-uON
en
~
o
en
g
o
,t::
c :
. . . .
A-16

7/26/2019 1992djatmikophd.pdf
http://slidepdf.com/reader/full/1992djatmikophdpdf 363/507
0
0
,: ;
0
S ~ ' ' ' '
~
S ' ~ ' ' ' '
la
c i d o d d
~
c i d c i d d
~
• •
• •
•
'i
• •
• • •
~
I f I f I f I f I f
~
J
I f I f I f I f I f
~
Cl)
Cl)
_ g
} I
.
,5
I i
t
·
..... ,S
•
i
•
r
•
~
i
~
i
I~
I~
§
o : a
c c
' ~
~ ~
-
'lit
iJ
~1
~1
~
;I
~
;I
'
~
'
: : c
~
~
~
0
U)
0
U)
0
0
0 0 0
~ ~
o::i
0 0
~
0 0 0 0
~
0
0
,.;
ui
vi
~
c o ;
'
. .
,:;
ID
,.;
C D
iii
~
c o ;
N
. .
0
otuod~ 1 f . ' 1 d
'UI p-UON
CIl
0111005011
1 1
011 'UI P-UON
~
~
V
V
ell
ell
ell
0
-0
~
~
~
0
:Q
~
V
V
. .
.t=
S ' ~ ' N
~
.0
S ~ ' N
~
. S
c i d o d d
~
c:
i d Od d
'i
•
•
• •
•
•
•
•
•
•
ell
ell
I f l f . e l f l f
~
.8
. . . .
CIl
. e l l I I I I I I
~
J
c: M
Cl)
<II
M
Cl)
OV ,S
c: V
. S
'00
il
00
I I
r
i
:I
I
~§
i
'0 e
r
:1
~a
:
•
- v
_0
. g o g
~
. g g
I~
U
~~
e~
, : : c
~ : c
~<II
~ l
'<II
~.~
~ ~
, : : s
i 5 . ~
e
~
C 'I
~
;I
~~
>
N
'
~
~
Il~
CIl~
~
~
.
~
0
..-I
0
U)
0
0
U)
N
0)
'I
~
'I
~
U'l
'I
~
'I
0
'I ~
'I
N
N
0
ci
<
CO)
CO)
N
N
0
ci
~
a
su0ds01l
a A . o n 'UI P' UON
oruocls01{ OAWOH'w P uoN
~
. . . .
I J . 4
0
~
0
0
. .
B
. .
: Q
S ~ ' N
S ' : £ I ' N
0,)
c i d dd
'
c i d o d d
'
• •
• •
•
~
1
• •
•
•
•
~
j
e l l . e l l £
Cl)
.Cl
. e £ I I . e . e
Cl)
I I r
·
, S
I I r
,5
•
:I
I
i
rl
r
~1
~
•
8.
~ J
~
o
I~
~
~
(I)
.. U)
~
;
~1
~
1
~
C 'I
~
;I
'
~
'
~
0
~
~
~
U)
CI l
a
U'l
~
~
g : )
~ ~ a
U'l
~
Iq
g O
~
~
0
0
0
ci
0 0 0
0
omocIsoll otms 'UI p-uoN
osuo dS Oll'< .M S 'W lP-U 0N
Appendix A
A-17

7/26/2019 1992djatmikophd.pdf
http://slidepdf.com/reader/full/1992djatmikophdpdf 364/507
~ 5 ~ a a
•
•
• • •
If If If If If
i t
r r
Appendix
A A-1S

7/26/2019 1992djatmikophd.pdf
http://slidepdf.com/reader/full/1992djatmikophdpdf 365/507
M
,
C
0
~
r
~
~
'
f';I
';.,
~
<
III
~
«
III
Cl)
CO)
CO)
. . . .
i
t r
0
C
~
C
l
~
CO) Cl)
CO)
.~
. . . .
.. g
. ~ :
III ~
. . . .
N
1 5
:1
8
· 1 3
I.)
o 1 5
III
la
N . .
§
N.~
e
I l l 1 . j
I l l 1
: 8
....z
....z
1 1
-
C
1
C
'2
. . . .
. . . .
'a.
8
• III
~
III
~
0
; : s :
.~
0 0
8:i
OC
u
~
0
0 0
0
§
.
0
.
~
en
~
~
N
C
a
C
C
N
0
Cl
C
0
0 0
0 0
0
0
'j>
9
'j>
'j>
:I:
0
s >v
zsv pllW sty
'0
0
8
f';I
c a
C
C
~
V
I
~
~
'f
;.,
f';I
' : . .
~
0
< III
~
= «
III
Cl)
>
. . , CO )
. . . .
~
l
i
0
Ja-
0
~
r
C
.~
l8
'i
Cl)
C')
. . . .
I
I.)
C •
: p
III
i]
.~1r
N
v C
C s f l a
S~
o 1 5
8-
N. 8
N• e
V
O
• III 1 l a
It)i~
8
.
..:z ~
'e 8
...z e
O(f \
C
'2
C
'2
~~
§
. . . .
- g .
{
•
.
U
•
III
8
I a <
ci
j
•
0
~
~~
C
C
~
8~
§
s
~ ~
r
.
0
a
§
a
0
.,,0
; 0
'Eo
I :
C C C C
Cl)
0
0
0
0 0
0
0
0
C l'
C l'
C l'
:g
,ttv
,I
> V
pllW StV
- e
f';I
(f \
C
C
~
N
•
~
< :
-
' : . .
~
~
(
I t
t?
: ( <
I t
Cl)
C')
~
CO) . . . .
bJ)
l
t
0
. . . .
C
~
C
{ @
~
. . ,
Cl)
CO )
· 0
. . . .
IQ
.
I t
>.
. . . .
N ' 5
N
8
8
C o)
1
·1 3
C
1 ~
1 5
N
I i
§
N• e
\
.2
I t 1
~
...z ..:z ~
C
l
\
C
~
. . . .
•
g -
.
U
•
I t
8
ci
eo
•
u
;
0
~
CI l
~
C
~
@
0
§
o = = >
N
ij §
NO
U
~
~
C
C i
a
8 8
~
0
0
0
0
0 0
q
0
0
0
q q
Cl)
,ltV .1tyPIJW,ttV
A pp en dix A
A-19

7/26/2019 1992djatmikophd.pdf
http://slidepdf.com/reader/full/1992djatmikophdpdf 366/507
. f Y ) V
.rzv
A pp en dix A
.t9V pUll 9tV
\ \
.l9V
pUll
9LY
\
A-20

7/26/2019 1992djatmikophd.pdf
http://slidepdf.com/reader/full/1992djatmikophdpdf 367/507
~
.-..
>0
~
•
C'I
'
. . .
,
•
' '
~
, §
1 1 ' 1
:( ~ \
1 1 ' 1
e o i ~
C )
~
'?
i
,
IE
~
5
o 8
C )
<
M
i
,....
Ul~
~I ~
1 1 ' 1
l~o
N ....
N
r~~
: 1
0
,~
o ~- '
C I
N 01'
IE
1 1 '1 ] ~
~l
~ 1 8 ' ~
1
Uti)
'il
~ z . y ' ( )
, ~
.~
~
l
~
u
0
0
5
: : t :
0
. y
0
til
1 1 ' 1
0
1 1 ' 1
0
1 1 ' 1
~ c i
~
I
g
. c i
c ::
<'
<'
. . .
d
~
C : i : ~
q
q
0
0
0
0
0
0
0
q
q
q
q
'0
s~v
, fSVPUWS£V
e
a
o
C
G )'
C
'f
•
C i
•
0
1
' : . .
>
. . .
J ~
:(
~
«
J
c E-
C )
C )
\0
\
: : J ~
\ r
IN
o ....
c : : •
e o i i§~
.~'?
1 1 ' 1
;: t
UC::
1 1 ' 1
I~O
S~
tI)
c -i
e :
I ....
g-
o
1 1 ~
o li~
~ . g
c -i
'u
' ' i C l
:::
:
]~
'B 6
: ·l
o~
.:
-~
:;~
o
J ~
8 ( 1 )
C z ='()
~ l a
. . . J :
a<
l
1 1 ' 1
'i'
~~
0
0
~
r oCl )
u
tI)
6~
0
5
C
~o
~
1 1 ' 1
~ ~
g c i
~
~
~
8
I
8
IQ
~
: : t :
q
0 0
0
:g
. . .
0
0
0
0
Q Q Q
0
0
ci ci
q q
,tty
,1~ PU W S IV
<
v- )
N
, . . . .
C
<
~
>0
•
0
•
C i
f . \ :
}
, §
~
1
<:(
i ~
b1)
. . . .
C )
s
~
C )
'-'
\ r
,
C ?
J i 5
,
~i§~
( ) <
\
lit
;: t
.
~l~i
tI)
. . . .
.. _
I ....
. . . .
r~
~I
~ ~~
j
'1 3
. . . . . -
IS
:
fg.<
: 1
§
.,.,
. o~
,.
uti)
~
Q u....
.
. z > 0
~z
... ~ :
l
~
~
lit
U
Q
1)1)
0
9
tI)
0
fa
Q
~
~
. . .
g : i
:I
~
~
~
~
Nc i
~
q
C
ci
tI)
ci
0
0
c ; >
c ; >
0
0
Q
0
,1lV
,1£VpUW.tlV
A pp end ix A
A-21

7/26/2019 1992djatmikophd.pdf
http://slidepdf.com/reader/full/1992djatmikophdpdf 368/507
~
. . . . . .
\0
. . .
C
~
It
J
e
Cl)
'-
l
?
:i~
I t l ~
....
oI~
.§
:.'
~
i
III
l
t
0
~
Cl
III
Cl
d
0
I l l = »
N
c: i
9
> -
.99V
o
. . .
~~
'I
i
t
~ 1
,
_)
'~,
. . .
.
. . . . -
.
o o o : ; ; ; ; ; . ; . . . _
~
- - . .~
,
•
, t
-
.
.
§
o
.~VPta 9'PV
~
. . . . . .
~
0
. . .
C
~~
•
. . .
~
III
l
i
It
'J
~
•
Cl)
.§
l
: : I ~
o 1 8
. . I § G
It ~~
II ~
N
VI
N
e
I::
. . . .
~ J . i
1 1 1 1 . 1 .
~ J ~
i : : i : :
III
IE
II) . 2~
. : 1
§
.;i}~
~ z .~
o 8~
.;z~o
. S
It
l
It
~
0
0
:t
VI
0
:=
0
~
0
8
~
N
8 = »
0
III
Cl
III
Cl
III
Cl
III
Cl
ei
~
c:i
d
c:i
Cl
c:i
N N
. . .
. . .
0
0
9
. . .
0 0
.
.....V
:t9V pta 9T.V
0
. . . . . . .
~
0
. .
C
~~
. . .
III
1
It
I
Cl)
Cl)
5
f I
l i
o ~
:i~
I
~i8~
~~
~l~l
. . .
~
i
~I~~
a
:i
IIIi<
; 'a~
. 8 V1
~ ~
o . . . .
. z:= 0
. . . E l
... e
In
i
It
~
e t
0
~
VI
~
~
~
~
~
~
-
. .
. ltV
. ttV pta ...T.V
A pp end ix A
A-22

7/26/2019 1992djatmikophd.pdf
http://slidepdf.com/reader/full/1992djatmikophdpdf 369/507
~
t?
•
~
. ,
. . , '
In
. . . . .
~
II
t?
1 1 1 1 1 1
(')
Cl]
~
~
t
.
. . . .
0
~
r
~
')
~
i
5
l]
~
: 1
. . . .
~
i
.~
N
8
~l
~
bII
;j
IS
N •
. 5
8
.§
1
II
. 5
'0
P o .
i
~
~
. . .
8
c:
~
~
~
.c:
0
C l:
0
a
. ~
0
0
U
In 0
. . . .
0
. . . .
§:i
~
N
ij
§
ij
N
(')
•
InQ
5
~
C i C i
s
~
~ ~
~
s
:I:
0
0 0 0 0
ci
0 0 0 0
'i'
'i' 'i'
'i'
'i'
.m I
.tstlJlU8SEU
Cl]
e : :
0
~
t?
'~
•
~
~
.,
c . , : . . .
a
t?
iiiia
on
~
c a
~
M
Cl)
u
I
I
i
. . . .
'e-
0
0
08
~
r
M
~
')
i
.~
> .
Cl)
. . . . c r r
~r
,
: J
s
t E e : :
~ J
~
8
~~
•
~
c-
I
bII
00
N
i
•
; 1
. g _
' o o g
III ~
Ii
Ss
bII
... Z
.S
'0
8~
~
I
u'
~
b l ) t =
u
8
,5<
~
~
on
od
~~
0
~
.~
~~
~
~
. . .
S
~
8:i
~
~
s
C l
~
~
(
~o
, , 0
d
Cl)
et
0
ci
0
0
'i' 'i' 'i' 'i'
~
.ttU
.t~upuw StU
~
t?
0
~
.
•
~
f ro I :
;..
- . . .
~
~
iii
~
fO'I
1 1 1 1 1 1
(')
Cl]
(')
~
I r
. . . .
I
0
~
~
~
~
(')
.§
')
Cl]
In~~
In, ....
0
N f l
' 5
l'a
o
bII
~ Ifi
~
N . .
1 3
:i
_ ,
Ini~
,..:Z
'0
,..:Z .[
I
'3
~
1 S . .
~
~
I
8
u
. '
~
u
~
;'
0
1;
0
Cl]
~
0 u
~
§
NO
; 0
0
~
~ ~ ~
8 : : »
$
~ ~
Cl]
d
d
0
0 0 0
et
0
0
.I1U
.1Ea
P u w
.£lU
Appendix A
A-23

7/26/2019 1992djatmikophd.pdf
http://slidepdf.com/reader/full/1992djatmikophdpdf 370/507
L . . . . . . . . . . . . . . . . . . . . . . . . . . . . . .
. . & . . . . . . . . . . . . . . . . . . . . . . . . . . . . . . . . . .
...J
0
0:»
ci
o on
0
f'i N N
on
ci
Appendix A
l
i
r
i
r - r T l ' ' T ~ . . , . . , .. . . , . . . ,, . . , . . . . . . . . . ., . . . . . .. . . . . . . . . . . . ~
. . . .
i
r
i
on
o
z s a p o ws z a
. n a p o w • • e a
A-24

7/26/2019 1992djatmikophd.pdf
http://slidepdf.com/reader/full/1992djatmikophdpdf 371/507
0 . . . . .
. .
\0
'
i
;;,:..
. . .
i l r a
Q
l
~I~
~
N fI)
~I
. . .
0
. §
~j
J
. . .
1
C
1 1 0
. .
1
o n
0
J
n
~
~
~:i
C i ~
C i
~
a
d
0
0 0 0 0
q q
.£ta
.I~aput SHl
o n
0
0
N
~
~
~
~ ~
~:i
. . .
0
0
0
0
0
0
.lta
Appendix A
~
-,
l
h
: a r a
,
I
r
•
•
~
•
t
t
•
o
~ ~
-
•
,
•
~
t
.
•
,
. . .
. .
II)
d
o
.-
o
8
II)
• Cl
o q
o
.-
9
II)
. . .
9
.mlput ssa
o
~ .. ~ .. ~~~~~~~o
9
.1£8put .£18
A-2S

7/26/2019 1992djatmikophd.pdf
http://slidepdf.com/reader/full/1992djatmikophdpdf 372/507
In
o
~~~~~~MM~MM~O
~~0~~~0~~Q
~ ~ ~ ~ ~ ~ gino
.as
Appendix A
. .. .. . o J wo . . .. .. .. .. .. .
. . a - . . o . I . .. . . .a . . . . .. a . . - .. L . . . .. . .
In •
M~ _ 0 _ N M
.0
o 0000 0q q q q
.t9H pull 9lr8
.t98 pull
9Z8
A-26

7/26/2019 1992djatmikophd.pdf
http://slidepdf.com/reader/full/1992djatmikophdpdf 373/507
0
~
i3
~
' c l
]
~ 8
II
In
e
i~l
CO)
c . - .
CO)
I'?
:,t:
~~
C
;( ~
CQ. . .
CO) CO)
i
~~
II
II
(I) II
•
r
N g ~
N
1 5 ~
i I
C ~ ~ : i
o ~~ ~
N t ~
N 7 ~ ~
~ c B
§
~ 0
0 > 0
II . § ' I
II
6 · S
O > O I
'a ~
· 1 3 iii
C
~O
C
._ ::t
4 1 . 5
~O
~
: : . 5
II
~
II
~
0
4 1
0
~
~
~
0
: : r :
~
> =
- -
0 0
0 0
~
o:i
0
II ~
In 0
0
.g
C D
iii
•
N
0
N 0
0
g
(-VV' ' '7JI1£.:11
(vSwz)I9:I1
~
~
~
1
~
1
~
V)
e : : -
.- .
I'?
08
~8:
~8
( l ) 1 ?
(;:1
~~
~.
S e : :
1)0
N
c::~
1 5 ~
o~
.....0
o ~~i
8~
~ ~ rli
~l 5 ~
dO
\ : l · r
§ O > O
~~
II S ' 2
e : :
( I ) ' I =
~ :~l
O > O I
00
· 1 3
iii
~la
~
C
'1 3 ;::I
~. 5
1(0
'
: : . 5
b I l &
o n
~ II ~
'B ~
~
0
~
'00
. . c :
0
~
C
:i
>(,0
o:i
(I)
i:i:
0
~
~ ~ ~
0
~
In
':
. ,
C '
d
0
0
o.S
~ ~ ~
In
~
In
0 0
0
Cl
0
0
~
. . .
<-VV'wz)1l l :I1
(vlluz)/I~:I1
~
.
-
M
C
C
..(
•
~
. . . .
-
~
I 1
O)
e
. . . . .
i
c . - .
I'?
~
0
~8:
: : r :
.'
t;:g
'
'
III
~ c r r
~.
• (I) c : :
(I)~
N g l : : : : .
N
S::IJ.
O,_..
~ ~ f Q
O~:llQ
N l ~
Nli: ,
. . 0 > 0
In o > o . §
6 · 2
. · a ~
0 > 0 I
'1 3
· 1 3 iii
C
~g.
C
'1 3
::t
: . 5
1(0
. 5
'
v
In
~
In
~
ci
v
ci
~
~
; 0
~
: a
I)
p : :
~
~
a
II)
~
~
g::l
~ ~ a ~ ~
~
gO
~
0 0 Cl
0
0 0
Cl 0
<-VV'WZ>111:I1 (vlluz)l1t>:I1
Appendix A
A-27

7/26/2019 1992djatmikophd.pdf
http://slidepdf.com/reader/full/1992djatmikophdpdf 374/507
Appendix A
A-28
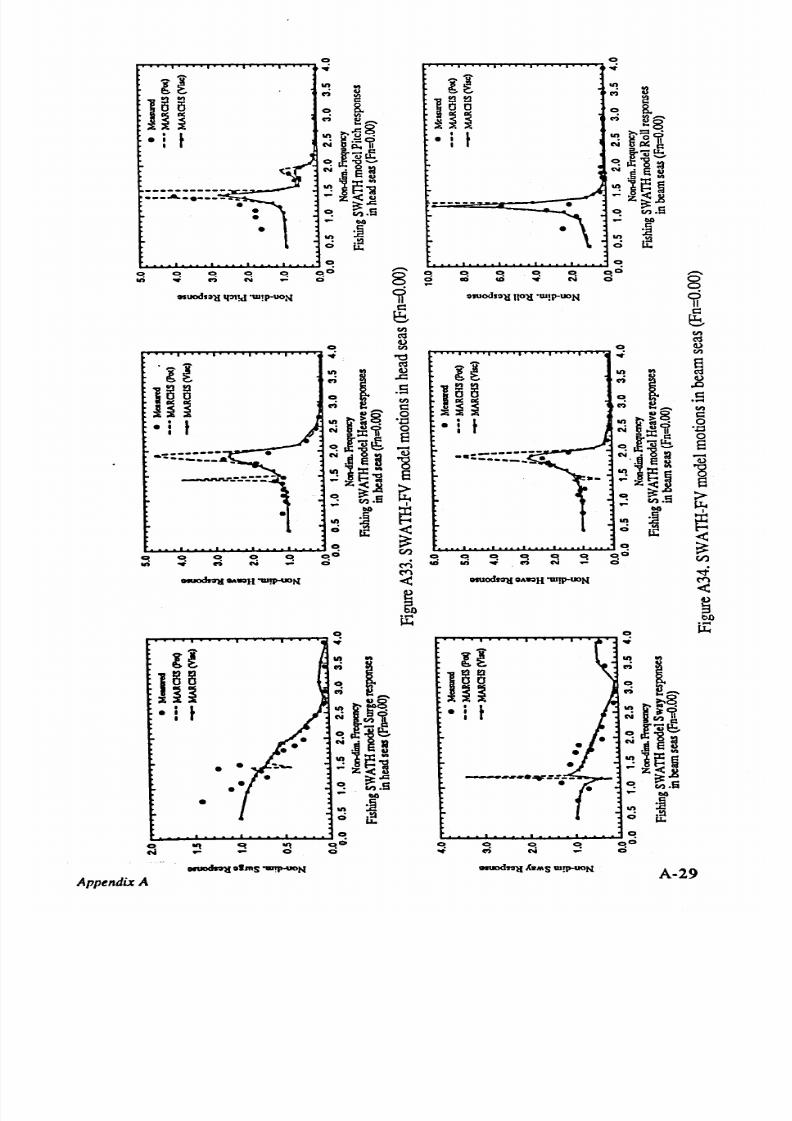
7/26/2019 1992djatmikophd.pdf
http://slidepdf.com/reader/full/1992djatmikophdpdf 375/507
• I
t
_ _ _ A . _ . _
•
~
on
- - - - - - - -
- - - - - - _ A . .
•
~~~~~~. q . . . . ~~~~q~
~ _ - 0 0
Appendix A
A-29
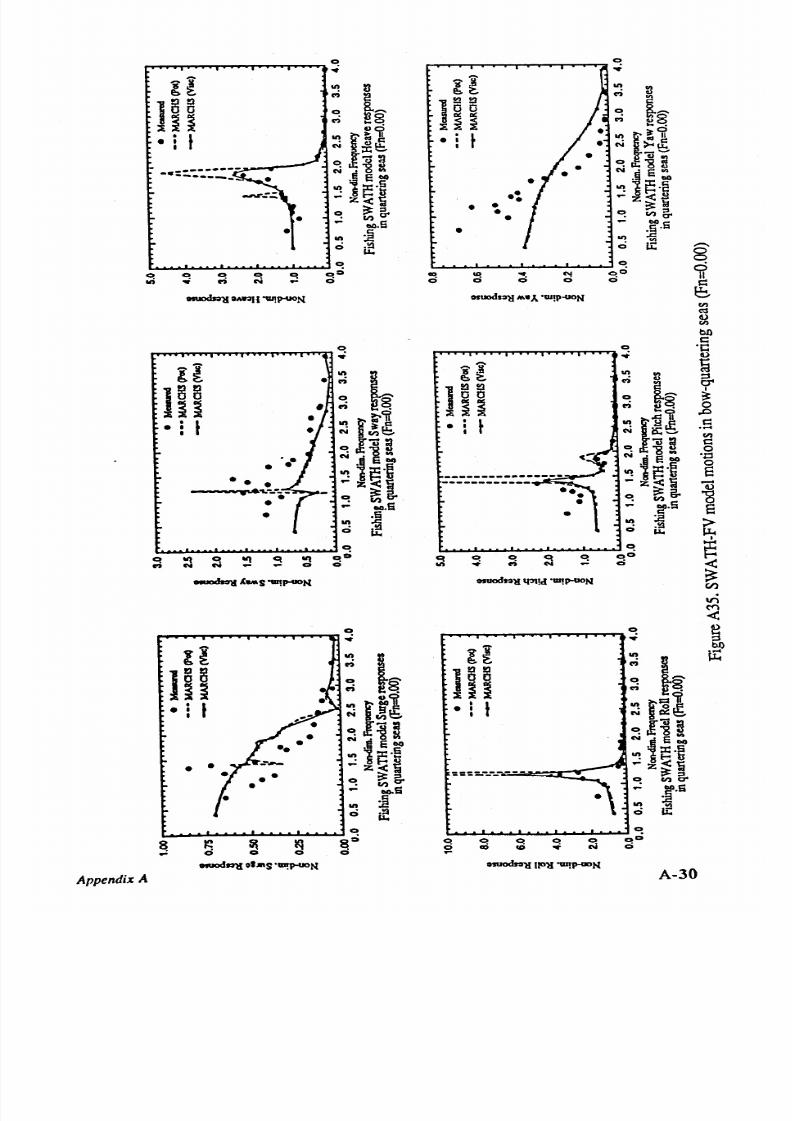
7/26/2019 1992djatmikophd.pdf
http://slidepdf.com/reader/full/1992djatmikophdpdf 376/507
•i
t
. . . . . . ' ' T _ . . . . . . . . . . . , . _ , . . , . . . .. . . . . .
.,.,C
•
A pp end ix A
• •
•
•
•
•i
t
A-30

7/26/2019 1992djatmikophd.pdf
http://slidepdf.com/reader/full/1992djatmikophdpdf 377/507
~
. .
II)
. .
.. ;
~
0
~8
.;
e .
II)
{ y 8
N
C S : ~
~l~~
N•
e ~
e
01)
II) 1 : : C ·
5
. i-- ~
. . <0
_
~
~:£
~.s
II)
]
0
Ii>
u :
0
0
0
0 0
~
0:;
-
ii
. . .
..;
N
0
8
o suodS~ lI l1 31 ld 'W lp -U0N
e r ?
d
~
Cl)
cd
4)
0
rn
~
. . .
bJ)
d
It)
r J
. . . .
6
..;
l
~
0
~
0
t § '
; g
.. ;
I.H
i ~ 1 f
d
l
II)
. . . .
N
~If
Cl)
: : c . . . . . . .
d
~IlB
0
'0
N
C l 6 :,
~
: 1 i5 '~
1
<o
o ~~
• VI
O I ) . S
II)
]
[t
ci
.~
I . ' L o
I
0
~
~
~
~
~
~
0:;
It)
'
0
osuods:lll
OAr.l l I ' I11 P-U0N
Cl)
~
C 'I
<:
e
0
G b
r
. .
u : :
~
II)
r J
8
.. ;
a
~
~
i § ;
')
l
II)
i1t
N
~~
o
l i i ~
N .
'8 ~
1
6
01)
II ~'i
- z<. 2
~
~:£
~.s
II)
~
0
Ii>
u :
0
III ~
It)
~;:;
ci
0
Ils uo dS lI lIl ll mS 'W lP -U ON
Appendix A
A-31

7/26/2019 1992djatmikophd.pdf
http://slidepdf.com/reader/full/1992djatmikophdpdf 378/507
0
C
c O
10
I I
C
rl
l
: 1
. . .
c g
l~
~~
C
r I a
~
ID
);~
~ I e ~
= \ ( )
•
t
• t
o B~
• I
o
@ B •
iii
il:
1 r
ii
._0
I
Q. , ~
r &
~ ~~
C
8 ' - '
· J e ~
• e ~
I:'
o :I:'
: i ~ ~
1 ~ 1
. =
~ . =
o VI,S
C Z V).S
s - - - - - - - - - - -
NZeo
N eo
- - - - - - - - . . . _ - .
~
~,,-----------
.
~
C
- - - - - - - ~ - - -
C
L E
• •
.
..-
..-
u . .
C
C
It
C 'f
10
•
00
~
III
~
III
0
0
..-
..-
0 0
0
-.
N
-
.-
0
0
-.
\0
~
. . . .
OSUodS~l Il j: ll d 'W l -uON
N
~ 'P1 d 'W l-IION
1 ?
1 ?
C l
C l
~
~
~
en
C
C
ro
10
~
10
Cl)
I I
r
V)
0
It
~
0
rl
~
ro
~
ro
l a B
~
~
1
6
~
Cl)
: ' 1
t
o
a
~
~~
. S
. r rl
. S
)i~
ID ..
. . , . . . .
en
'G'
en
•
t
o ~q C l
• t
o l~ N
c:
•
•
. 0
0
• t,) c:i
0
I
III
:I:I :
. . . . .
'p
III
:I:
. . . . .
:)li
0
:lli
~
a
. . . . .
. . . . .
~ i ~ i
1
~i~l
]
~ . =
~ . =
~ Z
V).5
it
~ Z V).5
it
o
eo
C
~
~
C
~
~
.-
.~
..-
. l
u . .
u . .
~
0
~
III
:
III
~
III ~
III
0
0
~
~
~
III
~
III ~
III
0
0
•
CO)
N
..-
.-
0
0
Cl)
•
CO)
N
..- ..-
0
0
Cl)
~ 1Io\~II'W l-UON
r . :
osuodS~lI
~ A ~ n
'W p UON
00
~
~
- e
< :
a
~
J)
0
i l : :
C
i l : :
ci
co
I I
;I
l
0
'
l a 8
) ~
~
~~
G r
~
..,G'
I
•
t
o eo...
• t
C
f 3 ~
•
•
•
• :i
c:i
I
:I~~
. 1 1 1
VII :
•
I - u . .
: 1 i
e ~
~ 1 ~ i
o i = '
c ?
.d <1
~ . =
. . , ~ . =
C
Z VI.S
~ ~ VI.S
N eo
•
eo
~
•
•
~
C
•
C
.-
• l
•
..-
L E
. .
0
C
It
C 'f
.q
~
0
0
It C 'f
«
~
0
0
-
0
0
0
..-
..-
0
0
osuodr.IlI ollns
'W P-UON osuods~lI
~lbns
'W P-uON
App en dix A
A-32

7/26/2019 1992djatmikophd.pdf
http://slidepdf.com/reader/full/1992djatmikophdpdf 379/507
•
•
•
~ ~ ~~~~~~~~~~~~~ ~
~ ~ 0 ~ 0
Appendix A
A-33

7/26/2019 1992djatmikophd.pdf
http://slidepdf.com/reader/full/1992djatmikophdpdf 380/507
~
0
0
0
. . .
t J
l
t J
l B
1
8
~
. .
~~
•
i ~ 1 t
~~
•
i ~ 1 t
•
~]:a:6
.
~
•
]-=
'-IJ.,
•
ID .... _
•
c a . ... ... ............,
t U :
i U : a
'8
u
•
'8~
s'
s..,
l
~ l::c·
s
~::c.s
. . . E r- ~
... E
r- ~
;.co
<0
1
8
j I : ~ : E
•
~ ~ : E
~ . E i
•
~.5l
•
~
•
~
:E ~
•
N
~
•
N
. 5
.c
-.
~
'
\0
• t
-.
L t:
~
N
.-4
1 f1 f
0
0
~
0
on 0
l
C
on
0:)
C l
C
.
oQ
c : :
•
..;
N N
- -
ci
ci
c : :
N
ci ci
I : : = -
DSUOd~' lI 1 PI d II J P UON
I : : = -
~ll q'3l d '1II tHJON
fIl
~
t ' : S
4)
~
fIl
bI)
0
bI)
0
e
0
c : :
0
. . . .
. . .
.~
. . .
~
l
t J
l
n
0
0
. . . . . .
. . . . . .
l~
. . . . . .
~
c B
l~
~
~
l~
~
8 . ,
0
ca
. S
. S
rJ\O
. . . . .
.. <'I
fIl
: 1 1
fIl
i ~ ~
c:
• t
c : :
• t
•
0
0
:l~~
. . . .
. .
'p
§
1 - B
§
r~
-
. g : t
. . . . . .
: ~'i
-
: ~ · w
1
;.c8
E;.c's
~.e
•
j I : ~ : §
~
..,.S
~
0
~.5
N
j
N
~
~
~
.~
'
IJ.,
0
0
~
~ ~ ~
J :;
~ ~
~:)
~ ~ ~
J :;
~ ~
~Q
v.l
-
-
0
0 0
0
til
-
.-
-
0
0 0 0
M
~ o;o.nn
'1IJ P UDN
.
.uodso'll OA~ 'lII P OO N
-4
. . - : t
. . - : t
- <
- <
~
~
0
0
0
l
u :
l'
u :
I B
. . .
~
•
'
l~
~
li
~
10
ca
e~
:I l
i u o
• t • t
~ f &
a (1)_
r
i
r~
. , l · i i
1 : : ,
~ ~.5
...~
. . . E ~
<0
jI:~8 jI:~:§
.e
I)
~.s
:i's
0
•
N
N
~
~
~
0
~
0
l
C
It
C :)
~
l
~
It
~
:
0
0
N
-
.- 0 0
N
.-
ci
onocIn'll
olms
'Ulw--N
O I1IO ds :Ill o lJ ns '1 D P «IN
A-34
Appendix A

7/26/2019 1992djatmikophd.pdf
http://slidepdf.com/reader/full/1992djatmikophdpdf 381/507
et
C
0
et
~
-
1
:l
~
:l
1
8
jg
l B
C
i N '
~~
10
:l~
~ . . C ' )
:l~
, . ,. e 1
• t
~ ' Y 1 r
.
~
~ ' f i 1 r
C
t
·-If
C ~fl5.
e t
ll
e r ~
8~
0 0 )
SOlI
~:,
C i:'S
C i s , s
• E ~
• E ~
<0
<_g
~~~
•
~~::§
et ~.s
•
~.s
•
C
•
N
]
.-..
•
s ::
0\
C\I
:E
<II M
. : a
.-..
u : :
c r f
'
N
lI')
et
~
0
d
8
on
~
o n
~
o n
~
o n
8:;
Cl Cl
~
Cl Cl
0
II
~
C 'f
d
C 'f
o n . . . .
N
-
c :i
~
,j
-
-
-
0
et c :i
fIl
osuodalJ 'PI d ... p-uGN
cd
osuodl:llll(~ d 'm p-UON
U
fIl
fIl
cd
e n
u
.~
fIl
et
0
en
0
0
c
-
.9
. . . .
. . . . .
l
i
~
tl
'0
~
n
0
~
_ . . .
l~
~
c:
1
8
a
_ . . .
C
t~
. . . . .
C
~ N '
t B
10
10
fIl
c:
c
:x ~
e V ' l
. . . . .
• 1 0 ) 1
0
1
r t f
fIl
• t
'0
• t
c
et
IS
~
o
t
If
0
.0
: z : . . .. . .
c O . . . . . : z : . . .. . .
.
. . .
. . . .
J l i
_ . . .
. J ~ i
~
. g
t ...,
et e ...,
_ . . .
-i
i:'~
e
-i ~.5
. g
~<~
~
E< ~
a
~ ; : : I
~.g
.g
~
C ~.5
~
C
~.s
C\I
~
N
j
I
<
if
i 5
u : :
~
et
et
<
~ ~ ~ ~ ~
~o
C I ' l
C
:l
C
III
C
III
C 0
~
~ ~
CO)
N
-
-
et
et
C I ' l
- -
et et
et et
~ lIA ll
' 1 I J p - U D N
'o:t
osuoch:u O A~ H 'U lW U ON
~
<
a
<
C
C
a
t
it
et
e n
-
J~
i
L £ :
~
. .
et
l~
C
a
•
GO
~N
et 4 ~lr
. . . . . . . . .
c O . . . . .
U ) 1 S
•
et 4 ~ ~
r
i
c O . . . . .
m e : : . .
r~
t 1 . . . ,
•
1~
-i
i:'i
et ...,
-i i:·i
E< 0
E< 0
~ ~ ; : : I
.g
~ ~ ; : : I
•
.g
•
C
O O . S
C
~.s
•
N
j
N
j
tt
<II
u : :
et
0:;
0
C
Cl
C
0
q
Cl Cl
0
Clo
on
•
. . ,
c,j
0
Cl
q
0
10 c D
. . . .
N 0
. . . .
eruodtolJ olms
'1II P~N
O IUOd IO lf o lb nS '1 II P
oV O
N
App en dix A
A-35

7/26/2019 1992djatmikophd.pdf
http://slidepdf.com/reader/full/1992djatmikophdpdf 382/507
s ...:s· ...
oddaa
• •
• • •
C £ C £ C £ C £ C £
il
t
t
o
, . , . . . . . . . , . .. . . . , 0
II t t
~~~~~~~~~~~~
. . .
8 ... :s .....
oddaa
•
• • • •
c £ c £ c £ c £ c £
1 1 t t
Appendix A
C l C l
CD I D
o
.......,., -0
II t t
, . . . . . , , . . , . . , I ' 1 ~ . . . . . . . . . , . . . . . . . , n - t . . . . . . . , . . . . ~ ~
. . .
II
t t
till
w . . .. . ' ' ' . -& . . 1 . . . .. . .. . .. . .. . .. . ..
.......L ........
. w . . . . . . ..
0 ]
0
0
~~
c : i -
I D
c : i
A-36

7/26/2019 1992djatmikophd.pdf
http://slidepdf.com/reader/full/1992djatmikophdpdf 383/507
~
B
~
~
OIl
~
0
DO
0
. ,
DO
S~'
8~'
. 5
ddd
dod
~
•
•
•
•
• •
~
c f c f c f
0
d 1 f 1 f
~
6 -
0
er
co
. 5
,,1
. 5
I
I
0/1
I
.
~
,. .
~
~
I
~I
~
-
.
•
~
I
I
1
I I
\
~ J
. .
: ;< . . . . . . .1
u
J ~
: . J
~
~
U
4
,
~ > -
. . . , . . .- - - - - - - - _ ... .
: x :
t
(
.-~ . .::
.
..I
U
~ ~ e 3
._.-.... ~ . . . .
~
1
,\
\
~1
....
. .
\
·'.t
~
'.
~
~
: x :
~
. .
N
~
'.
N
'.
~
~
. . .
.. .
Cl)
Cl)
DO
~
DO
~
~
Cl
III
Cl 'I
Cl
'I
Cl 'I Cl
o
. 5
'I
c l
~
C 'f
d
0
0
. c : :
. .
C O ) C O )
N
N
. . .
. . .
0
0
.~
0
0
0 ci
li
suod~
OA~II-w p-uoN
gsuods~
MIA. ·W P-UON
I
t
:I
0
~
0
· f
. .
S a '
d
•
•
•
E l f If
~
6 -
tD
. 5
I
t
.l
:11
I
.,.,~/
oI~
. I
• Cl)
c,-,,-'
. . E -
_ 4 . ,
~1
.'
}I
0
~
,
.
C Ii
'
,,
,
.
~
I
Cl)
0
DO
~
~
~
~o
: l l
0
0
0
tt
o s u o d s o l I
olJfts
I I I P U O N
App en dix A
Cl 'I C 'I C 'I Cl
. . . C' )
C'1 NN~...
A-37

7/26/2019 1992djatmikophd.pdf
http://slidepdf.com/reader/full/1992djatmikophdpdf 384/507
~ ~ ~ ~ ~ ~ ~ ~ M n ~ _ ~
. . .
~~~~~~~~~~~~
. . . .
•
~~~~~~~~~~~~
. . . .
-. I
----. ~
----.
- - - ,. . .< . . . .
- - - - - -
~,:
_-- r:
_ - - - - - . . . .- - 1 -
~:.-_._•.-.-.-.-'~.-' I
,
~-
. .
~ . .
,
.
,
...........' I
. . . . . . . . . . . . , , \
. . . . . . . .
.
'.~~
\
App en dix A
A-38

7/26/2019 1992djatmikophd.pdf
http://slidepdf.com/reader/full/1992djatmikophdpdf 385/507
APPENDIXB
FURTHER SWATH WAVE LOAD DATA

7/26/2019 1992djatmikophd.pdf
http://slidepdf.com/reader/full/1992djatmikophdpdf 386/507
0
0
c i
0
N
a3
N
i
r
~
i
U'I
1
, . . ;
~
, . . .
e
a
. . .
.
. . .
0
. . . .
~
~' '
,
~
~
~ r : s
. . .8
U'I
«.
U'I ~.
l
N o ~ 1 i '
l
N ~ Cl) 1 i '
' l e l ) ~
... Cl ~
C)(..L.
o
-S~
o
0 6 ' '
c i 8 ~
c i 6
(j
... Cl
... u I l ~
U'I B~
~ : 5 ~
';~~.8
,... § ~
e
~
l S
0
~.s
o n
iii
.~
1
~
;.::l
8
N
~
N
~
0
;>
0
1 f
o:i
~:i
C l
CO )
10
'Ot
~q
~
~
~
lq
. . .
c:i c: i
c:i
0
c: i
. . .
0
.:;
0
0
(m~)
1lQWOW . 'AaA ·W P-UON
e n
tEA>; :) JO:J J8 lRA 'UI P-UON
C l :
II)
e n
~
a
1
C l :
~
l
~
~
, . . .
, . . .
. . .
1
a
. . .
. . . .
~
. . . . .
~
~
~8
-
'I
~
o n
II)
. . .
-
. . . . . .
. . .
'8
'0
~.
;t~t
\
~ t e n 1 i '
a
N ~~
. . .
~
. . . . . .
o ~~
I
c i . § ~ : 1
~ . § 8 ~
i s
. . . 0 6
. . . I r A
~
~
o n
5 i
~
..; ~ §~
, . . .
. . . ~
en
~
g.s
~
~.s
4-4
U'I
. . , .
o n
.§
0
Cl
e n
:2
t :l
4)
~
Cl)
U'I
g
e n
N
N
~
0
~
~
8.
Cl)
0
0
0
~
:
0
0::)
~
~
C 'f
. . .
0;)
e
N
~
ci
N
.:;
0
0
c:i
c:i
. . .
'd
<.rh);:)JO:J
~ S 'W p-uoN
< '~W) l u: lWOW II IUO S JO~ 'W P -UON
C l :
.Q
4)
0
0
. . . . .
~
i
l
c i
0
N
N
. l o i s
:i
~
e
i
~
~ 1 f
.
~ - . . . . ~
~
-
. . .
-
, . . .
~
a
. . .
~' '
1 1
1 5
. . .
g~
~
~
e
~
U'I
U'I
~i
~
. .
~~
~~~
. . .
0
. _
U'I
V l 1 i '
• 0 t
~ ~ . s ~
~
1
~t~~
... .8
0
o ..,~
~ . § o ~ c i . §
-=.s
~ B ~
... Cl_
~ ~i
0
U'I ~
§ -&
I
. ~ e e
,... ].8
, . . . ~ . . . .
o
. S
0
~:i:
• III
iii
] <
II)
'« I
~
II)
1
~
~~
N
N
D e l )
' 6 0
i . s
. §
0
~
U'I
0
l :l
8::)
Cl
III Cl
l
Cl
l
Cl::)
~
. . .
. . .
. . ,
N N
. . . . . .
0
0
0
.:;
.:;
0
.:;
(,IA):nM>.J
IWU pnl 'W\I01·W P-UON
( .t >W) lU~WOW l IU PW
U
'ASU8J~ 'UI P-UON
A ppendix B
B-1

7/26/2019 1992djatmikophd.pdf
http://slidepdf.com/reader/full/1992djatmikophdpdf 387/507
o
,.......,..,...,.......,..,...,............,.............r ' 9' I 'IO
N
. . . .
.-
C o C C O
oeD
OQ-'N
,..
tu.) a : l J O : 1 ~ S 'lII p-tJON
A ppen dix B
B-2

7/26/2019 1992djatmikophd.pdf
http://slidepdf.com/reader/full/1992djatmikophdpdf 388/507
C
~
c
c
C
J
N
. S
I
, . . . III
~
5
. . . . :
C
'i
C
e
o n
'8
-
n
, =
1 1 ' 1 e
III
i 5 ' :
N ~
7 &
N
o~
1 3
.. =;9
. - J ( I ) ' 5
~0
. '5
C = ; ; .
~ ~;;.
~ ~~
I I jg ~
III
~ 5 ~
, . . .
~
. . . . :
~ E l III
· i j
0
C
1 '1 . . . .
~
o n
I I
;.Q
N
of j j
I I
~
71
N
~
0
.~
0
> <
8::)
~.
1 1 ' 1
5
III
~
1 1 ' 1
5
1 1 ' 1
8 =>
0
r - :
C \j
r - :
C \j
. . .
0
c
c 0
(.9 W) lW W OW V A . 'Wlp-U0N
C
c
. . .
C
~~~~~~~~~~~no
N
I I
, . . .
I Q
o
A ppen dix B
o
iii
C
~~~~~~~~~~~~O
N
I I
, . . .
( SW ) lU; lWOW 18UO lS JO~ 'W lP -uON
o
~~~~~~~~~ T~~O
N
1 1 ' 1
. . . . :
III
C I$
4.)
III
~
, . g
« =
. . . .
-
.)
8
8
Vo l
. . . . . .
~
~
E
4.)
C/.l
0
c . a
::l
~
ol
4.)
V ol III
s
8
es
~ : >
0
6
~eo;;.
-
.)
~
M
~
~
6 h
~
B-3

7/26/2019 1992djatmikophd.pdf
http://slidepdf.com/reader/full/1992djatmikophdpdf 389/507
~
~~~~~~~~~~~~o
N
~
, . . .
<'lA> a:wd ~ S 'W p-uoN
A ppen dix B
~
~~ T~~~~~~ T~~O
N
II)
, . . :
. S
~
a
. . . .
~
~Lf
I)
~gj
II)
0
I •~
CI)'~
~ s ~
c i
~
~
II)
01>1)
. ~ e 8
... 1>1)'
~
~~
II)
jg.
II)
~
N
~
~
i
8
~
a
~ a ~
8::1
~
..;
N
~
0
.; >
B-4

7/26/2019 1992djatmikophd.pdf
http://slidepdf.com/reader/full/1992djatmikophdpdf 390/507
o on
0
..; N N
0
0
N
~
~
'
e
B
. . .
0
C ?
~
~ ~8
l
;t~~
o ~~
o.§l:~
... 0~
~ e
' o S .8
C
~.s
on
. . c :
'
1
>
r
N~
'
G 1
1 ] 5
. . .
C
1n
:l ~
. . . M. . . . . .
ca
'8
•0
;t~l
o
.§~~
~ ~~
o n K I:j
~ 0
'
~
~ ~.S
Appendix B
~ ~ ~ : 2 l 0 & ~
( lJ:>p) :>l: luy :lSVIfd
.
t ~
.
~
\
.
.{
~
.
.
~
o
~ ~ ~ : 2 l 0 ~ ~ ~ ~~
(:l:>p) ~llJuy:lSVIfd
III
o
III
§
p.,
III
f :
~
o
-
B-S

7/26/2019 1992djatmikophd.pdf
http://slidepdf.com/reader/full/1992djatmikophdpdf 391/507
0
0
0
0
N
N
1
'U
r
'8
C .
. . . .
C .
. . . .
a
. . .
a
a
. . .
«'I
«'I
~
0
I
~~
0:: . .. . .
~
II)
~
o n
;C a
. .
. . .
II) < e r r
II) ~ e r r
t
r
l
N f . f
V ) I . I .
. . . '
. . . . . .
. . . £ ' i
~ o S ~
~ I':: '
o 5 '
o 0
II>
... OIl
. . . ' 5 0 1 1
~
~'5
-
~
e '5
. . . . ~;
~
.... 0;
J &
E=
-
~
i O
8
I)
on
, ,5
. ,5
1 f
P = l
f -
a -
N
'5
~
N
~ ~
>
>
II)
0
. . ,
0
C o
. .,
. . ,
0
C o
II) o=>
c < : i
(O J
N N
. . . . . .
0 N N
. . .
. . .
0 0
0
II)
t E A > ~
~pA)A 'W P-UON
< '9J'i)1~W OW .....eA. 'W P'UON
bJ)
r : :
' C
0
~
0
0
0
'g
N N
l
l
::l
II)
0
. . . .
. . . .
I
l a
. . .
ls
a
. . .
«'I
~
~ ~
~~
.8
) ; ~
II)
~
II)
... «'I'
. . .
. 5
•
. . , · e r r
.., ~8
• t
~t~~
.-
l
N t
V ) I . I .
0
. . .
' . . . . . .
]
.§ ~ ~
~.§~~
V ) 1 t
o
0
. . . £ 0 1 1
. . . 5 0 1 1
M
~
0 ' 1
~ ' I
I
::;~~
~
.... tl
0
~ ~&
~
'<iiI0
.., ~,a
II)
,§,s
~
§
en
. . ,
V )
. . ,
~
N
N
~
0
en
~
0
i : i : :
0
a : : >
II)
C o
0
C o
0
C o
o=>
~
. . ,
~
:
r : :
~
.0
'
•
N
0
. . .
0
0
0
0 0 0
~
<.lA>~:I ~ S 'W P-UON
(sw) l~WOW
1811O S.JO~
'W p-uoN
~
~
~
~
c < : i
-
0
0
1
0
0......-
N
N
l~
0
l
. . ,
i
. . ,
~
, . . :
C .
, . . :
~]
i s
. . .
C?
l a
. . .
~
~8
~ § ......
\Q
~
on
on
O~
. . .
~'
) ; ~
. . . ' E l '
~
III V ) e r r
t
N t ' L I :
• t
~ t ~ ' 1
~
. . o S . . . . . .
~ .§
s ~
lr:
o ~ II>
g.§5&
:I
' f
~ §,5
~e-
' : ~ j ~
. . . . 0 1 1 ' 8
0
,0
o ~E
o n
'<iii,S
o n
jC?
III
i
III
~~
N
'~
N
~~
~
.3
0
ij~
~
~
~
0:>
5 1 ~
a
~ 5 1
II)
SO F : o S
. ,
N
N
. . .
0
0
C '
. . .
0
0
0
0
< . I A > ; o . J O : J PU Pt'CI SUIY}'W p-UDN
<.\ 'W) 1U~WOW lIU pwg 'ASUlIJ~ 'W P-UON
Appendix B
B-6

7/26/2019 1992djatmikophd.pdf
http://slidepdf.com/reader/full/1992djatmikophdpdf 392/507
. .
-..,.
~
0
1 ;1
~
c :i
0
8
\I
~
C\I
~
~
~1
. . .
~- .
, . . .
. . .
. . .
6~
~8
0
~~1
iii
§~
. .
: : ; ; 0 1 1
1
N ' ' _ ' '
~ t a · ~
~ t ~ ·
C\I I:::~
.. 0
~ ~ ~
g 3 ~ g .
~ I f ' l
n
~-8
..c:.S
o n •
£-
.
~.-
r - : ~
i : 5 : . g
... III
g .
~ .£ 1 .5
Q ) E l
o
-5( f l
II)
. . . .
-
.
. . . .
.
Q )
II) ~ i s
) ' g
~
c o E l
o n
C I ) <
C\I
Iii
c,j
Iii~
~
OUCl )
0
0
~ . £ I
~ ~
§
~
0
~
8
~
~:i
e f
~
s
8
~
0
~
8
~
~:i
. . .
0 ;-
. . .
. . .
. . .
. , . . . , . .
. . .
(bp)
~I'UY
: I I 1 I t I c . I
(~) ~ISuV ; l S l I l J d
~
-.
0
~8;
1
0
. . . . .
c :i
C\I
~ 1 f
C\I
~
o n
j 1 f
. . .
8&
, . . :
e~
. .
~i
. . .
0
o 0~
iii
~'
iii ::;; ,
. . .
. . c : C I )
... Cl) 0 1 1
o n
IIl'
S
o n
l S
~til
't ~
1 = Q ' i i i
~ E
6 -
03·-
5
~3
~.5
. . 0 1 ) .
~~31
II) ~ : g
~ . £ I
r - : ~ ~
0
~
. . . 1 ; 1
~
. £ I ~
II)
0 =
o n
. . .
u~
o~
o n
00<
. <
1 1 i ~
o n
~~
,j
OUCl )
c,j
¥ I o u
~£
zf-5
~
~
8
s
0
~
~
~
~:i
. . .
~
:i
§
:i
0
~
8
~
r'
S : ' O
~
0
. . .
. , . .
. , . .
. . .
.
.
(J.,p)
~ISuv:l l1l t lc.l
('~p)
lliuy;)SVtId
AppendixB
B-7

7/26/2019 1992djatmikophd.pdf
http://slidepdf.com/reader/full/1992djatmikophdpdf 393/507
0
0
N
1
III
e,
~
a
. . .
f
~
~~
~
III
. . .
~f~
l
~ CI)~
o ~~
o 6 :g
... 5
u
III ~ .;
~ ~ ~~
o 1 > 1 ) . 5
vi
.~
~
~
e -
N
~
0
: : :
0
III
0
III
0
III
a : i
C O l
I I
. . .
. . .
~0
0
0 0
0
<'9W)1
IDWO
, 'i .A. 'W P-OON
~
. . . .
0
0
N
, l IoC
l
III
~§'
. . . .
la
. . .
~ 1 1
0
0
§~
~
vi
... ]:d
l
~ t , l j ~
W , 8
~
o 5.S
... , ~'U
~ ~ 'S
.... OIl e
.Sf
r
~
] ~
II
III
: ' J l <
r
~
N o~
;. u
0
;-s
~ ~ ~ ~ ~
III
0
: g
~Q
~
0
0 0
0 0 d d
0
0
< . . w )
~UIOW lu I'WO
.-J.
'W P-UON
~
.,
0
N
AppcndixB
~ ~ ~ ~ 0 ~ ~
( lbp ) QISUY:lSI It Jd
.,
-
-
~.
.[
. . . . . . . . _
- = : : : . : . .
.
III
N
o
vi
L t . o . . t . ' . . . .. . . . . . . . a . . . . . . . ~ ' ' ' . . . . . . . . .
......Jw......I 0
~ ~ ~ ~ 0 ~ ~ ~ ~Q
(bp) QISuy :l S8 lJ d
B-8

7/26/2019 1992djatmikophd.pdf
http://slidepdf.com/reader/full/1992djatmikophdpdf 394/507
0
C
C
0
. . . . . . . . .
(\I
1
(\I
~~
1
II)
II)
~ c n
: .
. . . :
. . . :
B
. .
ff\
. .
6 ~
~~
0
~
vi
s [ Q
. .
o ~
II) ~~
~ i ~ l 1
l
N ~I/)u..
. . ,~~
~ ~i
o ;.:l::=
o
5 '
c p .£
. . ~ 6 , E r
.. IllS
-~'
8
'-
~ ~ § ~
II ~>o~
1 f
:::
to. ~~
0
.£
~
0 0
C
....ff\
vi
,~,5
1 1 ' 1
0 '
4 ) =
-
.:l
bh~
I/)
II)
~
II
(I;j
N
~
(\I
ii~
Q)
~I/)
til
0
0
f~
bI)
II)
II)
8~
~~
c : : :
II)
0
0
~
~
8
~
0
~
~
0
'~
i
i
. .
. .
~
'
0
0
0 0 0
. . .
. . .
.9
<.9J'l)
IIDWOI'l . \' 'WJp'UON
(:I;)p) ; )l :luy : lS1RJd
. . . . . .
o B
C
C
. . . .
s : :
. . .
0
0
0 . . . . .
0
~g
,~
N
.w8
N
. . . . . .
r
~ 1 f
6'
Q)
1 1 ' 1
II
~l
~
: .
to.
to.
B
. .
~~
. .
C
t I [ Q
C
0 [ Q
rf')
~
II)
: g ~
1 1 ' 1
: : s ~
~
. . .
. .
0 0 0 0 1 )
l
~ t~,S
II t~,S
~
. . . ~
~ 5 ~
o 1 1 1 : 8
o I= Q ::=
t c . 5 i j o S
o . 5 ~.£
Cl')
... ~ ll,S
' + - <
: ~ §~
>
0
~ , , , , : ~ ~~
~~i~
I/)
Q)
( : : s
. . . . . . .
} ,S e
eo
C
] c < ; l
C
4 ) c < ; l
a
1 1 ' 1
=
It)
0 5 =
~~
O ~
Q)
II
til
II
~~
(I;j
~:
N
l:l~
N
. . c :
iI/)
iiI/)
0..
0
0
~~
'd
~ ~ ~ ~
II)
~
: l
8:»
( : : ~
~ ~ ~ ~
0
5 ; 1
8
~ ~~
§
. .
f
0
0
0
0
0 0 0 0
. . .
. . .
~
I/)
(,~W) ~;)woJ'l'u pu~U 'AS \N J l 'W P'UON
(:I;)p) ; )I 'UY :lS1RJd
Q)
V
c : : :
0
C
C
0..
~
til
'
'
0
0
~
N
~
l
II)
II
'd
. . . :
(I;j
11
to.
~
. . . . .
0
B
. . .
. . . . . .
C
'8
C
1 / ) 8
Q)
~
It)
Sg
It)
~lf
~
. .
c < ; l c : ; j
. . .
O l f
~
.; t~&
It) ,.....'-
l
N
t M
[ Q
0\
~
. . . . .
. . .
(:, ~
j: Q
C o S l /) ~
o
] 0 0 0
o 4 ) '
~ o S 'i
~
. . 0 5
II) ~
=
, E r
II) ~ ~ : 8
~
, o~
':~v.i.£
ti:
_
to.
g : 8
~,s
0
:5.£
C
vi
'iJ
~.s
It)
0 ' 8
~
II)
I/)
II)
~e
N
N
ii i
4 )
0 0
~
III
~
III
~ III
~ III
~::i
~
~
~
~
0
5 ; 1
0 0
~::i
f
. . ,
. . ,
N
N
. . . . . .
0 0
0
It)
. .
. . .
. . .
,
tu .> ~ ~ S 'W P-U ON
(:I:lp) ;)ISuv:lS1RJd
Appendix B
B-9

7/26/2019 1992djatmikophd.pdf
http://slidepdf.com/reader/full/1992djatmikophdpdf 395/507
i....
~
.ii ~~
It)
~~ i ~E~
N
' f a
;.
I
.
t
I
I •
.5§,
~I
r
r
I
C
f3.
i
I
I
I
~
1 f
~~
~. R~
<,5
~~
o~CI).c:
w i
8 ~
~;
t)
'
. . .
~
Cl)
0
C C C
0
C ::i
~
It)
S
wi
0
-
(ZN a : u D : J ~ S 'W JH IO N
• - .
AppcndixB
0
w i
,5
I I '
N
C
0
I I '
N
'§
0
i : l :
~::i
0
B-IO

7/26/2019 1992djatmikophd.pdf
http://slidepdf.com/reader/full/1992djatmikophdpdf 396/507
o
~~~~~~~~~~~no
N
1 1 ' 1
, . . ;
t t t r
A ppen dix B
8 , ~
\ ~
t I
odddd
•
• •
•
•
If If If If If
l~
~~
[ I :
i
I
o
~~LM~~~~ ~~~ ~
: q ~ ~ ~ ~
o 0
0 0
0
0
(.~W) lU;JWOW 18UO I.I()~ 'w p uON
I r
I i I
~ r r
i I
B-ll

7/26/2019 1992djatmikophd.pdf
http://slidepdf.com/reader/full/1992djatmikophdpdf 397/507
o
~~~~~~~~~TP~~O
N
&I)
. . :
i ,
r r
i ,
o
N
< . l A >
nlD d ;Jp S
'III JHIOI't
8 :l
: E l ' . . .
dd
dad
• •
•
•
•
If If If If If
App en dix B
1 II
r
r
t
,
r
,
q
N
B-12

7/26/2019 1992djatmikophd.pdf
http://slidepdf.com/reader/full/1992djatmikophdpdf 398/507
~~~~~~~~~~~~~
N
'I
, . .
.5
1
l t t
I I
r r
iI
'
o
l
o
. . .
ci
l
o
C '
o
. . .
c:i
Appe ndix B
B-13

7/26/2019 1992djatmikophd.pdf
http://slidepdf.com/reader/full/1992djatmikophdpdf 399/507
0
G)
~
0
N
1
e
r
II
~
~
~
, . .
~
1 ~
5
. . .
0
C
o n ~ . . . . . . .
~
It)
~
. . . . . . .
. . . V ) 8
. . .
~ 8
• t
: r r ' i l
l
~ ~]1f
... .la L f
... . a s : :
o
LI. _'
LI.~
~ ~I
~ .s ~
... 6 ~
1ft ~ 6 ~
~ ~ '5 ]
..:~ ~,8
o ,.5
C
~ .a
o n
~
1ft 0 0
-
I
-5
II
.§
8
N
1
N
; :l
1 f
l-
o
0
~
~
II
~
It)
0:;)
;>
N
0
Cl)
~
.,
N
8:;)
> -
,j
0
0
;;
. . .
~ ~
~
-
0
0 0
Cl)
( .9W ) l lQW OW ......A 'W p-WN
t'd
(.W~:J
1 r. ) lDA 'W P -UON 0
Cl)
C
0
I
§
0
0
_ g
N
l
II
~
l
II
~
,5
. .
, . .
5
. . .
e
a
. . .
-
0
C
~
. . . . . . .
C
~
8
~
1ft
~
. . ,
C I ) . . . . . . .
. . .
. . . 0 0 8
a
ft
~8
;t~~
~
N
~ C I ) ' T f
~
~
.. IlQ
s : :
C 00]&
o v~
~
' s L f : f
o , S o 5 : a
... 6
v
II l.sj
~
~
I ~
5
, . . 6
,.. e,8
Cl)
0
~
B,5
~
e,5
c . . . .
1ft
. . ,
';j
0
~
til
,§
0
II
- 8
. . ,
Cl)
N
V i
N
. §
§
~
0
'ti
~
~
~
~
III
~
o n
c~
N
~ ~ ~
~
8;)
l : i :
~
~
0
, . .
o n
c,j
0
;;
0
0 0
. .
0 0 0
d
< . t A >
~:l ~ S 'lII p oU ON (sw) lU~WOW
I.UO IJO~
'W p-UON
t'd
0
-
0
C
U
0
. . . .
~
0
1
0
0.......
~
N
~~
l
II
~
l
II
' E
- . : : t
. .
•
, . .
-
-
l~
. . .
~~
~
~
~
Cl)
~
~~
~
OI)~
. . ,
1ft
~ E
. . .
'5 '
::l
• t
II ~ v ~
b L l
l
~ ~ u .
~ 0 5 , 8
u : :
o
M~'_
o
OD
~.5
~ ' s 6 ~
. . § ' i : . . . .
o v~
~ jj
:
e
, ~ e : : c
, . . 0 0
~ ~,s
0
:ij~
. . ,
-5
o n
j ~
o n
]
o n
~r
N
]
i~
'~
0
~
~
~
a
~
C i
8~
.3
~
III
~
III ~ III
0;)
f : : : o S
0
CO)
N
N
. . .
. . .
0 0
0
0
0
0
0
0
(.IA>
~J (8U PIII '_ ' 'W p-uoN
(.tw ) 1U ~w ow IIU PU ~([ 'AlU8J~ 'W P-UON
Appendix B
B-14

7/26/2019 1992djatmikophd.pdf
http://slidepdf.com/reader/full/1992djatmikophdpdf 400/507
Appe ndix B
B-15

7/26/2019 1992djatmikophd.pdf
http://slidepdf.com/reader/full/1992djatmikophdpdf 401/507
~.
•
•
•
•
•
•
,
•
o
............... r r ...... ,.............. .,.... ..........................,O
N
A ppen dlx B
•
~ 1
o 0
B-16

7/26/2019 1992djatmikophd.pdf
http://slidepdf.com/reader/full/1992djatmikophdpdf 402/507
APPENDIXC
ON THE STUDY OF SHIP SLAMMING BY
DROP TEST MODELS

7/26/2019 1992djatmikophd.pdf
http://slidepdf.com/reader/full/1992djatmikophdpdf 403/507
APPENDIXC
ON THE STUDY OF SHIP SLAMMING BY DROP TEST
MODELS
Abstract
The s ign if icance
0 /
dro p te sts in th e de ve lo pm en t o f sh ip slam min g stu die s
d urin g th e la st th re e d eca de s is re vie we d w ith in th is re po rt. T hre e ty pe s o f d ro p
te st mode ls , n ame ly fla t-b o ttomed , w e dg e-s hape d, a nd s hip fo rm , a re d is cu ss ed .
T h eo re tic al s tu die s b as ed o n th e r es ults o f s ome e xp er im e nta l in ve stig atio n s a re
also h ig hlig hte d. E xam ple s o f im ple me ntin g dro p te st data in sh ip stru ctu ral
d e sig n a re g iv en t o demon s tr at e t he applicab ilit y o f s u ch dat a.
C1. INTRODUCTION
Slamming impact has long been recognised as one of the major sources of ship
structural damage resulting from operation in rough seas [Cl,C2]. Slamming damage
may develop in a small local area where the impact pressure persists, but it could also
extend to a larger area which, up to a certain level, brings about global structural
failures due to the so-called hull whipping. To explore the main pressure that affects a
local area, not considering the global response, remains a complex task despite
extensive investigations which have been performed in the past. It is not surprising,
therefore, that such a study on ship slamming is now pursued and continuously
updated.
A further aspect which, in most cases is over-shadowed by much concern for
ship safety (structural failure) and sometimes not so well realised by ship designers is
the degradation of economical operation of the ship caused by slamming. This
particular aspect is related to the speed loss by virtue of voluntary slowing down
ordered by the ship master. If, in moderate seas, the speed loss is mainly induced by
the increase in added resistance of the ship. then in more severe waves this
predominancy is replaced by the insistence of slamming that which to some level forces
the ship to divert its course headings [C3]. Such an effect is even pronounced in the
case of advanced marine crafts where high speed operation is much more susceptible to
surface wave slamming.
The study of ship slamming, like in any other branch of ship science, is
commonly performed both theoretically, by adopting hydrodynamic principles, and
App en dix C
C-l

7/26/2019 1992djatmikophd.pdf
http://slidepdf.com/reader/full/1992djatmikophdpdf 404/507
experimentally, i.e. by carrying out small scale model tests. Slamming measurements
on full scale ships are also made sometimes but, in view of the longer time as well as
the appreciable expenses incurred on such an investigation, it is less frequently
organised. Experimental study of ship slamming may be arranged in different ways,
namely, drop tests on a 2-dimensional model, a 3-dimensional model and a 3-
dimensional model seakeeping test. Drop test on a 2-dimensional model may be
regarded as the simplest method, yet it is the most appropriate in the first place to gain
insight of the ship slamming in general regardless of the peculiar performance of the
ship being investigated (e.g. slow and high speed ships), unless it is specifically
designed for a given ship form.
This report presents a review of ship slamming studies based on the drop test
approach. The review attempts to collect as much information as is available in the open (
literature for such a study and to summarise the state-of-art of the work in this particular
ship research area. Theoretical studies that were developed in conjunction with some of
the experimental work are an important topic for discussion. The experimental
investigations dealt with in this report are these three main types, namely, the drop tests
on flat-bottomed structures, wedge-shaped structures, and ship form models. The main
features of the tests put forward are those of the instrumentation and experimental set
up, impact parameters being explored, and discussion of the test results. The
significance of the drop test data for further development in ship structural design will
be indicated.
C2. DROP TESTS ON FLAT·BOTTOMED MODELS
C2.t. Chuang
During the mid 1960s Chuang performed an extensive experimental investigation
on ship slamming by way of a flat bottom drop test at the DTMB [C4]. The test was
carried out on a flat-bottomed steel model, size 20x26.5xO.5 in. (LxBxt) attached to a
steel box, which accumulated a total weight of 255 lbs. The flat bottom was stiffened
with four 0.5 in. x 3 in. therefore the model can be considered to be a rigid body. The
drop heights were 3 up to 7.5 in. with increment of l.5 in. Flat plates were mounted
vertically on the platform to provide two rigid sidewalls on the model box to ensure that
two-dimensional flow is maintained.
The instrumentation system used for this experiment consisted of quartz-crystal
pressure transducers, charge amplifiers, a dual-beam oscilloscope, and a high-speed
streak camera. Two transducers were installed, one at the the centre of the model and
the other near the edge at the middle of the longer side of the plate. The transducers
Appendix
C
C-2

7/26/2019 1992djatmikophd.pdf
http://slidepdf.com/reader/full/1992djatmikophdpdf 405/507
were rated to have a natural frequency of 200 kc and a rise time of 1 microsec. There is
no mention about the maximum pressure capacity of the transducers, even though,
from an existing ref. [C5], a maximum pressure of 70 psi was anticipated to excite the
model.
The main aim of this drop test was to generate a slamming parameter that
correlates between the impact pressure and the vertical drop velocity. Further, the
investigation was also directed to prove the presence of a certain factor, called the
acoustic pressure, which was believed at that time to contribute significantly to the build
up of the flat bottom pressure magnitude. The existence of acoustic pressure in
conjunction with the development of flat bottom impact can be explained as follows.
When a flat body strikes the surface of a fluid at an impact velocity Vo' the propagation
of the momentary increase of pressure in the fluid takes place at the speed of sound in
the fluid. designated by Cl [C6]. The mass of fluid accelerated in the time ~t is
(C2.1)
where p is the mass density of the fluid and A is the striking area of the flat body upon
the fluid surface.
Since the velocity of the mass of fluid is increased from zero to V0 in the time ~t,
the force F acting upon the falling body is therefore
(C2.2)
The pressure p (the approximate maximum value), which is the force per unit area. is
p
=
p C
I
V 0
(C2.3)
Although such an acoustic pressure is believed to exist during flat bottom
impacts, the experiment. however, has not been successfully generated to prove this.
So far it can only be explained, firstly, that the instrument was not sufficient to record
the event which takes place at only a fraction of instant
61.
Secondly. it was also
thought that the elastic deformation of the plate relieved the acoustic pressure. Thus, it
was finally presumed that the ship hull will response largely to the impact which
develops upon the formation of hydrodynamic pressures. Furthermore, the effect of
entrapped air should also be taken into consideration.
Appendix C
C-3
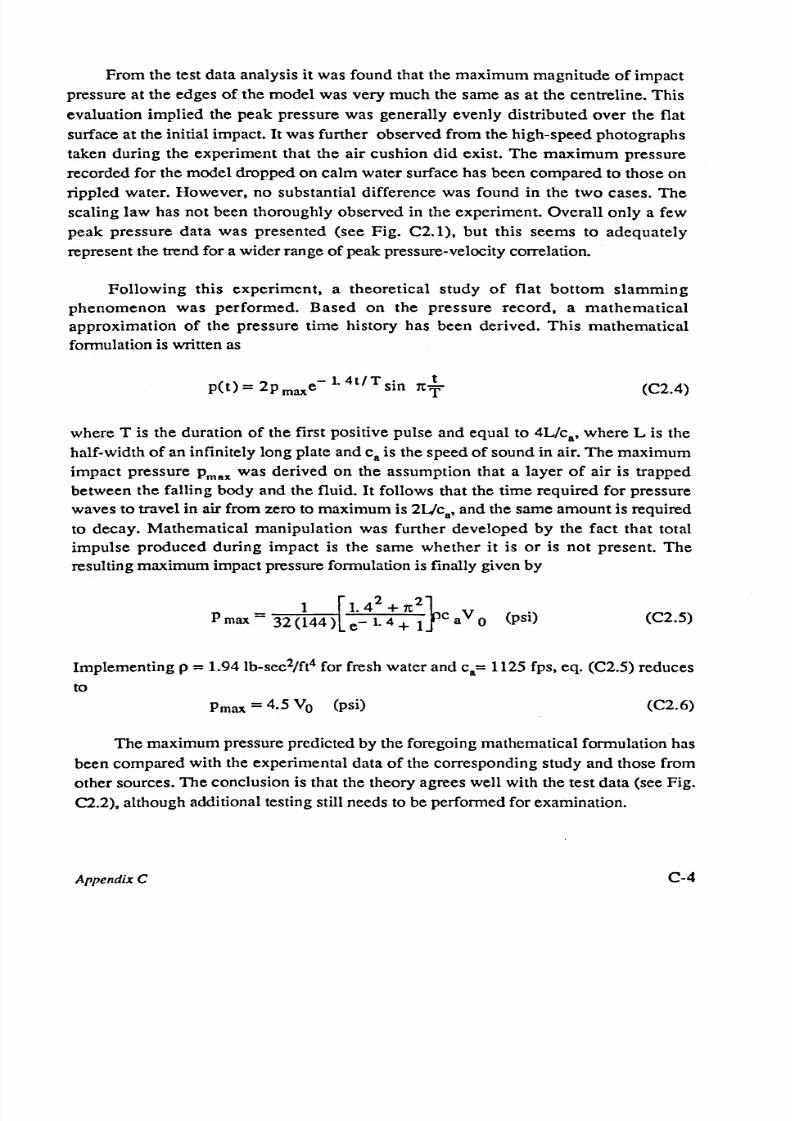
7/26/2019 1992djatmikophd.pdf
http://slidepdf.com/reader/full/1992djatmikophdpdf 406/507
From the test data analysis it was found that the maximum magnitude of impact
pressure at the edges of the model was very much the same as at the centreline. This
evaluation implied the peak pressure was generally evenly distributed over the flat
surface at the initial impact. It was further observed from the high-speed photographs
taken during the experiment that the air cushion did exist. The maximum pressure
recorded for the model dropped on calm water surface has been compared to those on
rippled water. However, no substantial difference was found in the two cases. The
scaling law has not been thoroughly observed in the experiment. Overall only a few
peak pressure data was presented (see Fig. C2.1), but this seems to adequately
represent the trend for a wider range of peak pressure-velocity correlation.
Following this experiment, a theoretical study of flat bottom slamming
phenomenon was performed. Based on the pressure record, a mathematical
approximation of the pressure time history has been derived. This mathematical
formulation is written as
(C2.4)
where T is the duration of the first positive pulse and equal to 4L/ca, where L is the
half-width of an infinitely long plate and ca is the speed of sound in air. The maximum
impact pressure Pmax was derived on the assumption that a layer of air is trapped
between the falling body and the fluid. It follows that the time required for pressure
waves to travel in air from zero to maximum is 2Uc
a
, and the same amount is required
to decay. Mathematical manipulation was further developed by the fact that total
impulse produced during impact is the same whether it is or is not present. The
resulting maximum impact pressure formulation is finally given by
(C2.5)
Implementing
p
= 1.94lb-sec
2
/ft
4
for fresh water and c
a
= 1125 fps, eq. (C2.5) reduces
to
Pmax
= 4.5 Vo (psi)
(C2.6)
The maximum pressure predicted by the foregoing mathematical formulation has
been compared with the experimental data of the corresponding study and those from
other sources. The conclusion is that the theory agrees well with the test data (see Fig.
C2.2), although additional testing still needs to be performed for examination.
Appendix
C
C-4

7/26/2019 1992djatmikophd.pdf
http://slidepdf.com/reader/full/1992djatmikophdpdf 407/507
Another flat bottom test has been conducted by Chuang
[C7 ]
on a larger scale
model, that is, a one-quarter scale representation of the bottom structure of a U.S.
Coast Guard ship (see Fig. C2.3). The model scantlings are arranged as on the actual
ship (with an overall size of 80 in. x 90 in.), and hence it can be regarded as a flexible
structure. The model was extensively instrumented with pressure transducers, strain
gauges, deflection gauges, velocity meters and an accelerometer which are located at
various positions over the bottom area. Although this large scale test was performed
near an exposed bay where the water surface is subjected to small waves, the condition
was regarded to be advantageous. From an impact characterisation point of view such a
test on rippled water closely resembled that on full-scale ships in which slamming
normally occurs on water surfaces which are highly irregular. Observation during the
test was made for the model dropped from three different heights, namely, 2,4 and 6
feet above the water surface. No testing beyond a 6 feet drop height was performed
because the bottom of the model had been dished-in approximately 0.8 in so that it was
no longer representative of a flat-bottom hull construction.
A typical test result on this large flat-bottom model is as seen in Fig. C2.4. An
evaluation of structural response of the flat-bottomed model reveals that the peak: strain
for the 2 ft drop is larger than for the 4 and 6 ft drop, although the former has suffered
approximately the same magnitude of impact pressure. It was found that the larger
strain for the 2 ft drop was induced by the pressure which has more persistent
dynamical characteristic than the other. The structural deformation of the model,
however, may be considered to linearly correlate to the drop height, that is, the
deformation will increase as the drop height is increased.
C2.2. Verhagen
The study by Verhagen was carried out to investigate the importance of the air
cushion in reducing the impact pressure intensity
[C8] .
Both theoretical and
experimental methods were adopted in this study on a drop test model.
The whole tests were carried out in a moderate aquarium 1000 mm x 405 mm x
400 mm with glass walls and bottom. The flat-bottomed model used in the experiment
was sized 400 mm x 400 mm x 20 mm, made of a cast of aluminium plate with a total
weight of approximately 8 kg. Perspex vertical strips were attached at the two parallel
edges of the model so that a two-dimensional flow condition could be simulated. The
model was restrained from rotation by a vertical shaft which slid down on a steel frame
support fixed over the aquarium.
Appendlx C
c-s

7/26/2019 1992djatmikophd.pdf
http://slidepdf.com/reader/full/1992djatmikophdpdf 408/507
One pressure transducer of barium-titan at crystal type was used in the test to
measure the impact pressure at the centre of the flat bottom of the model. Observations
were made of the model which was dropped from various heights up to 50 cm on a
smooth water. A photo-electric cell was used to detect the plate which had fallen to a
few mm above the water, which at the same time would activate an oscilloscope. The
pressure-time history for each drop was recorded on a high-speed photograph. Several
phenomena were able to be identified during the test, as follows. The water elevation
was at first noticeable at the plate edges just before the plate touches the water surface,
that is, the water touched annularly from its circumference and progressed to the centre.
In this instant the air cushion was rapidly formed and induced to an increase in
pressure. After the two surfaces touched the air layer broke up into bubbles, beginning
at the edges and extending to the centre of the plate with the speed approximately equal
to the velocity of sound in air.
The theoretical analysis within this study was developed to calculate the pressure
as a function of time during impact. The underlying assumption and the layout of the
procedure in developing the mathematical model can be described as follows.
Considering the flow in the air layer under the falling body to be a one dimensional
compressible flow of a perfect gas, the flow conditions are then calculated by the
method of characteristics. The disturbance of the water surface owing to the imposed
air pressure is solved by adopting the potential theory. Compressibility of water is
neglected, as the characteristic time interval for the impulsive pressure appears to be
large compared to Vc
l
• where 1is the half-width of the bottom plate. At the moment the
edges of the plate touches the elevated water surface an air cushion is trapped. This
volume of air is calculated. Assuming that the escape of air after that moment can be
neglected and that the downward velocity of the mean water surface under the plate is
independent of the place co-ordinate, the adiabatic compression of air layer is
calculated. The full mathematical derivation to predict the impact pressure time history
is given in ref. [CS]. which results in the following expression
With the initial condition P=Pl for t=t
1
the relation between pressure and time can
be solved numerically. The impulsive pressure becomes maximum when dp/dt=O, The
magnitude of P = P m a x follows from
A ppen dix C
C-6

7/26/2019 1992djatmikophd.pdf
http://slidepdf.com/reader/full/1992djatmikophdpdf 409/507
(C2.8)
The initial condition of the trapped air layer hIll, PI/PO' wIlco' and VI/CO can be
obtained from [C8].
A numerical evaluation has been made using the above expression for the
different values of drop height h, half width I and mass of the free falling body M, by
considering the normal atmospheric conditions. The results from the numerical
evaluation and the drop test are as shown in Fig. C2.5, in which the maximum impact
pressure is plotted against the drop height. The analysis on the effects of different plate
widths on the maximum impact pressure is as presented in Fig. C2.6. Comparison of
the pressure time history generated using the analytical formulation and from the
experiment is depicted in Fig. C2.7 where a fairly good agreement of the two results is
evident.
From those evaluations Verhagen has drawn the conclusion related to flat bottom
impact as follows. The air cushioning effect does exist under the bottom at the limit of
impact and the most significant pressure rise under the body occurs after the moment
the escape velocity of the air reaches the velocity of sound. The maximum impact
pressure Pmaxexerted on a flat bottom dropped on to a water surface is approximately
directly proportional to the drop height or to the square of the downward body speed
for a small value of M/pI2. With the increase of mass, there is a more or less linear
correlation between Pmax and impact velocity V. Nonetheless, the maximum impact
pressure seems to be independent of the plate size (see Fig. C2.6). Hence, to develop
the same impact pressure of two bodies falling from an equal distance above the water
surface, the mass of the body per unit bottom surface must be directly proportional to
the two-dimensional body width. In other words, the larger body must be relatively
heavier than the smaller one.
The pressure time history in Fig. C2.7 reveals that with the increasing value of
the maximum pressure the gradient of the pressure-time curve becomes steeper. The
theory of air entrapment is in good agreement with experimental data, even though, in
general the theory is valid only to relatively light models. Further, an important
pressure variation can occur in a small time interval compared to cat/l, such that the
Appendix C
C-7
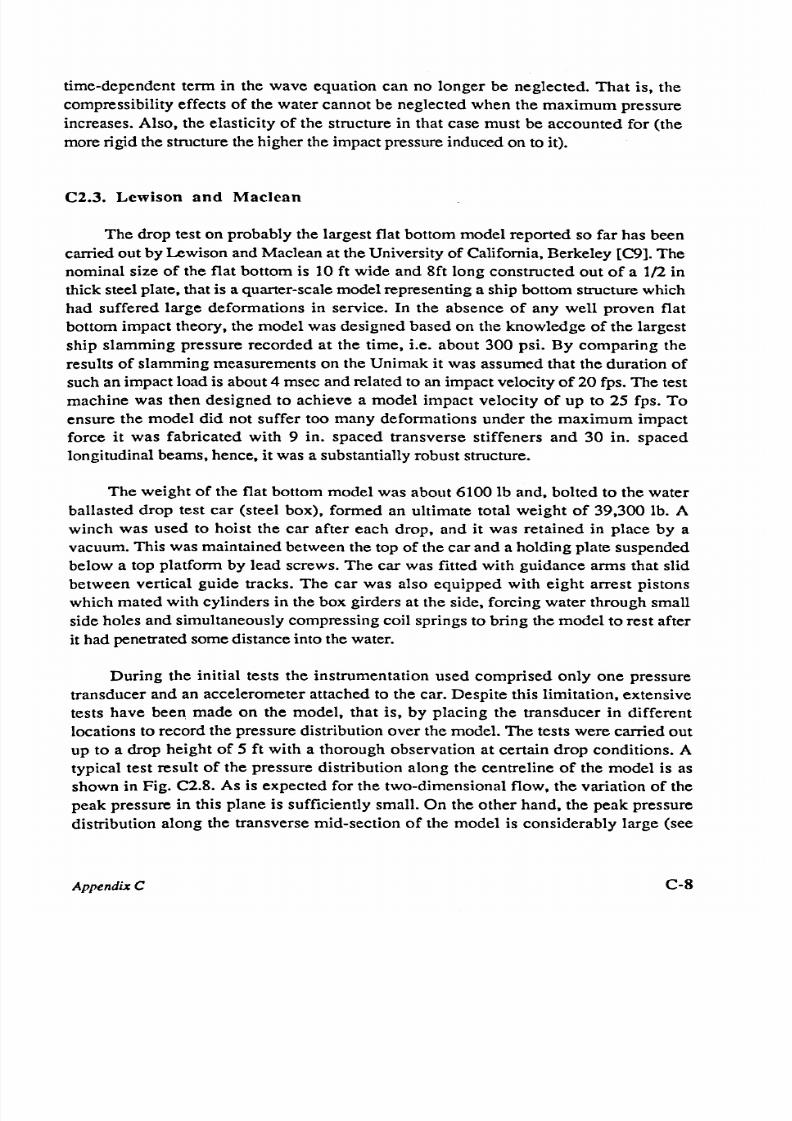
7/26/2019 1992djatmikophd.pdf
http://slidepdf.com/reader/full/1992djatmikophdpdf 410/507
time-dependent term in the wave equation can no longer be neglected. That is, the
compressibility effects of the water cannot be neglected when the maximum pressure
increases. Also. the elasticity of the structure in that case must be accounted for (the
more rigid the structure the higher the impact pressure induced on to it).
C2.3. Lewison and Maclean
The drop test on probably the largest flat bottom model reported so far has been
carried out by Lewison and Maclean at the University of California, Berkeley [C9]. The
nominal size of the flat bottom is 10
ft
wide and 8ft long constructed out of a 1/2 in
thick steel plate. that is a quarter-scale model representing a ship bottom structure which
had suffered large deformations in service. In the absence of any well proven flat
bottom impact theory, the model was designed based on the knowledge of the largest
ship slamming pressure recorded at the time, i.e. about 300 psi. By comparing the
results of slamming measurements on the Unimak it was assumed that the duration of
such an impact load is about 4 msec and related to an impact velocity of 20 fps. The test
machine was then designed to achieve a model impact velocity of up to 25 fps. To
ensure the model did not suffer too many deformations under the maximum impact
force it was fabricated with 9 in. spaced transverse stiffeners and 30 in. spaced
longitudinal beams, hence, it was a substantially robust structure.
The weight of the flat bottom model was about 6100 Ib and, bolted to the water
ballasted drop test car (steel box), formed an ultimate total weight of 39,300 lb. A
winch was used to hoist the car after each drop, and it was retained in place by a
vacuum. This was maintained between the top of the car and a holding plate suspended
below a top platform by lead screws. The car was fitted with guidance arms that slid
between vertical guide tracks. The car was also equipped with eight arrest pistons
which mated with cylinders in the box girders at the side. forcing water through small
side holes and simultaneously compressing coil springs to bring the model to rest after
it had penetrated some distance into the water.
During the initial tests the instrumentation used comprised only one pressure
transducer and an accelerometer attached to the car. Despite this limitation. extensive
tests have been made on the model, that is, by placing the transducer in different
locations to record the pressure distribution over the model. The tests were carried out
up to a drop height of 5 ft with a thorough observation at certain drop conditions. A
typical test result of the pressure distribution along the centreline of the model is as
shown in Fig. C2.8. As is expected for the two-dimensional flow. the variation of the
peak pressure in this plane is sufficiently small. On the other hand, the peak pressure
distribution along the transverse mid-section of the model is considerably large (see
AppendixC
C-8

7/26/2019 1992djatmikophd.pdf
http://slidepdf.com/reader/full/1992djatmikophdpdf 411/507
Fig. C2.9). The peak pressure distribution in this case reaches its maximum at the
centre and decreasing towards the edges, even though the peak pressure occurred
earlier at the edges and moved towards the centre. In view of the variation in impact
pressures for different drop heights itwas observed that the peak pressure increased
linearly with the increasing of drop height and therefore with the square of impact
velocity.
Based on the test results, a theoretical study was then performed to develop new
analytical approaches designated as one-dimensional theory and two-dimensional
theory. The study adopts the assumption that the falling body has an under surface flat
and parallel to the undisturbed water surface, that the model is rigid, and that the water
is compressible. For the one-dimensional theory further assumptions was made, i.e.
the model is so large compared with the air gap between it and the water surface so as
the sideways movement of the air can be ignored and the entrapped air is enduring an
adiabatic compression. Working out the relationship between the model surface and
water surface movements to the standard atmospheric conditions of air the following
second-order differential equation for the pressure is obtained.
1.715p2 l.4p1.71Sp 1.4p1.715
P -
+ °
715
+ °
71 5
x (p-
PA - mg) = 0
p
P A
bdC
P A
bm
(C2.9)
where b is the height of initial air-gap, C is the velocity of sound in water, d is the
density of water and m is the mass loading of the model. The numerical solution of eq.
(C2.9) is made by adopting the experimental values of m and V, with b as a parameter,
and setting out the initial conditions of t=O,P=PA'and x=V, hence P=1.4PAV/b. Figure
C2.10 shows the comparison of the theoretical and experimental results with the values
of b chosen from experimental observation. The conformity of the two results is rather
poor even though the peak pressure and the duration of pressure derived by the theory
seems to be in the right order. These are still much better than that given by Ogilvie
[CIa].
An improvement to the one-dimensional theory was then synthesised by taking
into account that the sideways movement of the air takes place during the flat bottom
impact. Another assumption adopted to this phenomenon is that the average pressure,
causing deceleration of the model, is essentially a constant fraction of the pressure on
the centreline. Allowing this effect, the modified differential equation for p can be
written as
. 1.4p1.71S{f(Pa:-PA) p}
O.4Vp- -g+-
1715 2 po.71S m dC
,,_. p +
A
P - P ------:..:'---b---O-.2-t V------
(C2.IO)
A pp end ix C
C-9

7/26/2019 1992djatmikophd.pdf
http://slidepdf.com/reader/full/1992djatmikophdpdf 412/507
with the initial conditions of t=O, p=p At and p
=
1.12p AV lb . In Fig. C2.11 some typical
results are shown, compared to the same experimental curve. The improvement over
the earlier formulation is marked, but the agreement between theory and experiment is
still only moderate.
In the two-dimensional theory the hydrodynamic movement of the water (which
is not dependent on its compressibility) is considered at the same time as the motion and
properties of the air which are thoroughly treated. The solution to the problem was
overcome by first contemplating the continuity of mass, conservation of momentum
and energy equations which yield to the differential equations in four variables, p, p,
wand U. i.e. the pressure, density, model's bottom-water surface distance and the
outward air velocity, respectively. Each of these variables can be further approximated
as a polynomial in Z (see Fig. C2.12) and is written:
p
=
Po - P2
z2
- P3z21~ .....
2
p = Po -P2
Z
•••••
U
=
U1z+ U
3
z
3
.....
_ 2
w-w
o
+w
2
z •....
(C2.11)
The coefficients in the above equations are assumed to vary with time. t. Moreover. it is
assumed that this expansion is valid for the area of the integration of interest and that
the polynomials are convergent.
The polynomial coefficients in eq. (C2.11) are computed from the following set
of five equations which are differentiated from the continuity, momentum and energy
equations as follows :
PoWo+woPo + wOPOU
I
=
0
. 2
wOPO(U
I
+ U
1
)+ 1.784
10
6(pow
2
- P2wO)
=
0
-w
O
P3 +3.74
10
-9PU1IUll = 0
Powo +0.7143w
o
PO.6 +U1POw
O
=
0
PO
w
2
- w
OP2 +0.7143(w2
P
o -woP2)+3woPOU3
- 2.4286U
1
(wOP2- w2
P
O)= 0
(C2.12)
(C2.13)
(C2.14)
(C2.15)
(C2.16)
The calculation is procured by setting up an initial value of the w terms which are then
revised after the p terms are obtained by imposing the boundary condition accounting
for the constant ratio of pressure at the edge and that on the centreline of the model. The
AppendixC
C-IO

7/26/2019 1992djatmikophd.pdf
http://slidepdf.com/reader/full/1992djatmikophdpdf 413/507
latter is executed with an iteration procedure on those equations, namely, if P o and P o
are estimated, eq. (C2.15) gives U
1
;
then eq. (C2.12) gives Po, eq. (C2.13) gives
P2'
eq. (C2.16) gives U
3
and finally, eq. (C2.14) gives
P3'
A rigorous mathematical
manipulation to derive the above numerical formulations is fully described in ref. [C9].
A typical example of the theoretical result is as shown in Fig. C2.13 and is plotted
together with the experimental result. The agreement between theoretical and
experimental pressure curves is very good, both in terms of the pressure duration and
the peak pressure value.
In the second experimental programme Lewison has conducted a further study on
slamming to explore the mechanism in reducing slamming impact on seagoing ships
[Cll]. One way in which slamming pressure reduction may be attained is by the aid of
a control mechanism in the form of two parallel external side keels that would activate
the air entrapment effect underneath the impacting surface. For this investigation the
drop test model was fitted with outside keels (flanges) of two different sizes, namely,
1.5 and 3.0 in. in height, positioned near the edges of the flat bottom. Experimental
results show the effectiveness of the flange attachment in the reduction of maximum
impact pressure, as shown in Fig. C2.14.
This encouraged Lewison to carry out a further slamming experiment at NPL on
the Mariner type ship model by seakeeping techniques. The Mariner form was chosen
for this investigation because it has already been extensively studied at NSRDC,
notably by Ochi [CI2], so that the slamming data is widely available for comparison. In
this particular test the model (1/55 scale of the real ship) was fitted with two forefoot
outside keels parallel to the centreline at a sufficiently concave bottom area which was
subjected to severe damage. Pressure transducers of range 0-10 psig (0-550 psig for
ship) were installed on the forefoot centreline. The first experiment was done in calm
water to scrutinise the flow lines over the forefoot so that the keels would not unduly
disturb the local flow pattern. The actual slamming observation was then conducted in
irregular head seas, with and without keels in position, in respectably severe
conditions. The results of this test suggests that the reduction in numbers of most
severe impacts is achievable on the model with fitted keels. The maximum impact
pressure recorded also showed a substantial reduction, that is, about 124-137 psig
compared to 55-69 psig for the bare hull and keels in position, respectively.
In conjunction with the above investigation a detailed study of flat bottom impact
was also explored, especially regarding the phenomenon of air entrapment and the
development of impact pressure, as follows. Until the model is within a few inches of
the water surface, no noticeable increase of pressure occurs on the underside, and it
accelerates downward under gravity. As the volume of air underneath the model
continuously diminishes, there is an outward airflow across the vertical planes into the
Appendix C
C-l1
7/26/2019 1992djatmikophd.pdf
http://slidepdf.com/reader/full/1992djatmikophdpdf 414/507
direction of the open edges. The flow velocity would be expected to vary across the
height of air gap but. if this is quite small, say 0.1 x the half-breadth of the model, then
the flow may be treated as uniform across the air gap. (The analysis is only valid when
the model is already close to the water surface, therefore when to start the analysis must
be chosen, along with some means of estimating the conditions at that instant). As the
model continues to descend the outward air velocity at the edges increases rapidly and
consequently a pressure difference occurs between the edges of the model and its
centre. Provided the velocity at the edges is subsonic, the pressure there will be
atmospheric and therefore there will be an increased air pressure towards the centre of
the model. A pressure gradient is also needed to oppose friction between the fast
moving air and the underside of the model and the water surface; this makes an
additional contribution to the pressure on the centreline of the model. At this stage, the
pressure time history is termed as progressing in the regime
I.
While the above process is taking place in regime I, the water surface under the
model has been experiencing the same rise of pressure and has started to move
downwards. This downward movement arises from two sources, namely, the
compressible movement in which the velocity of the water surface is proportional to the
pressure. and the hydrodynamic movement which would take place equally in the
absence of compressibility. The effects of both of these movements means the
depression of the water is greater under the centre of the model than at the edges;
consequently the height of the air gap decreases steadily towards the edge forming a
throat.
At some time the air velocity in the throat at the edge of the model will reach the
local speed of sound. As the air under the model continues to be compressed the throat
velocity must remain sonic. but the pressure will rise above the atmospheric pressure
and wave expansion will occur beyond the edge of the model. The process continues
where pressure rises rapidly, being greatest on the centreline and will fall off smoothly
towards the edge of the model. This stage of process is called regime II; as opposed to
the subsonic regime I.
The height of the air gap at the throat will continually diminish and at some time
the gap will close, although the air jet will delay its closure by blowing the surface
away to form spray. (This process cannot easily be represented analytically which is
one of the difficulties of the theory). As the closure takes place and the outward airflow
at the edges stops. a pressure wave travels inward in the direction of the centre of the
model. There are air bubbles trapped under the model and further compressed. This
process is called regime III.
As the air continues to be compressed the downward velocity of the water surface
will increase and will eventually equal the downward velocity of the model. When the
Appendix C
C-12

7/26/2019 1992djatmikophd.pdf
http://slidepdf.com/reader/full/1992djatmikophdpdf 415/507
velocity of the model and the water surface are equal, the local air pressure will be at a
maximum and. thereafter, as the water surface moves downwards more quickly than
the model, the pressure will decrease. The water velocity will accordingly diminish and
for the second time it will be equal to the model velocity, and the air pressure will be at
a minimum which. from experimental observation, is normally below atmospheric
pressure.
Based on this new admission Lewison attempted to modify the previous theory
by adopting boundary conditions which apply pressure to the edges instead of
considering a constant fraction of centreline-edge pressure ratio. In regime I the edge
pressure is essentially unity, i.e.
p(z
=
a)
=
1
In regime II the edge velocity is sonic and so
U(x = a) = C p(z = a)
a p(z = a)
In
regime III there is no outward flow and simply
U(z= a)
=
0
(C2.17)
(C2.18)
(C2.19)
These boundary conditions are used to solve the enhanced governing equations to
derive the coefficients in the polynomial equations of P. P. U and was below.
p
0
W o + woP
0
+ woP
0
U
1 =
0
P
O
W
2
-P
2
W
O
+w
2
P
O
-w
O
P
2
+3U
1
(P
O
w
2
-wOP2)+3U3POwO = 0
. 2
P
O
(U
1
+ U
1
)-1.784106P2
=
0
-w
O
P
3 +3.74
10
-9poU~ = 0
(t\ + U ~)(w 2PO -w
O
P
2
)+ w
O
P
O
(t\ +4U
1
U
3
)
-1.784
10
6(P2
w
2 +2P4wO = 0
woPo + 1.
4p
o
W o + 1.4U1POwO= 0
1.4(POW2-P2
W
O)+(w
2
Po -wOP2)+4.2Po(U lw2 + U
3
w
O
)
-3.4U
1
w
O
P
2 = 0
Appendix
C
(C2.20)
(C2.21)
(C2.22)
(C2.23)
(C2.24)
(C2.25)
(C2.26)
C-13

7/26/2019 1992djatmikophd.pdf
http://slidepdf.com/reader/full/1992djatmikophdpdf 416/507
P3(1.4w
O
-4.4w
O
U
1
)+P3
W
O +5.6U 4POWOUI
= 4.48
10
-9P
O
U:
(C2.27)
whereas the polynomial equations with some additional coefficients are rewritten as
follows:
p = Po - P2
z2
-
P3
z21z1
- P4z4.....
P =Po - P
2
z
2
- P3z2Izl .....
U =U1z+ U
3
z
3
+ U4z3Izl .....
_ 2
W-WO+W2Z .....
(C2.28)
The comparison of pressure histories from experimental and modified theory is
shown in Fig. C2.15. It is apparent that the theoretically predicted pressures are higher
than those measured and that the curves are more sharply peaked. Moreover, for the
centreline pressure, the estimation of the modified theory is not as good as that
predicted by the previous theory (see Fig. C2.13). The new theory. however. gives a
much better description of the underlying physical mechanism of two-dimensional flat
impact. As can be seen in Fig. C2.15, the theory predicts the correct ratios of the
pressures at the centreline and at the edge of the model, as regards with the maximum
values and also that before the peak pressure at the edge; the pressure is greater on the
centreline. Furthermore, the peak pressure at the edge is shown to occur before that at
the centreline, and the time differences are in the right order of magnitude. i.e. about 1-
2 msec.
C2.4. Ando
Many attempts to reduce structural damage due to ship slamming have been made
in the past, and one of the most recent studies was made by Ando [CI3].He suggests
that slamming force can
be
reduced by covering a certain area of ship bottom. which is
felt to be susceptible to such a load, with a kind of elastomeric material. To verify his
suggestion Ando has carried out experimental and analytical studies to evaluate the
effectiveness of elastomeric layers on a flat bottom model.
The model which was used in the drop test was 26.5 in. x 20 in. x 0.5 in.
(LxBxt) and was made of steel plate and attached to a steel box. Including the lead
ballast, guide rods, and other attachments, the total weight of the dropped structure was
about 275 lb. To ensure two-dimensional flow condition consistent with the analysis
Appendix
C
C-14

7/26/2019 1992djatmikophd.pdf
http://slidepdf.com/reader/full/1992djatmikophdpdf 417/507
two parallel rigid walls were erected from the bottom of the tank to a certain distance
above the water level. The only measuring instrument mounted on the model was a
piezo-electric type accelerometer, which was located on the bottom plate near the centre
inside the steel box. The signals from the accelerometer were fed into a spectrum
analyser and the display was plotted on a printer.
Three conditions of test were observed, namely, one rigid bottom and two layered
bottom conditions. The layer material used was a closed cellular rubber in two
thicknesses, 1 and 0.5 in. In this context the steel bottom is considered infinitely rigid
compared to the elastomeric layered bottoms, since Young's modulus of steel is 210
kN/mm2 while Young's moduli of the layer material was well below 1N/mm2. The
model was observed for the drop height of 3, 4.5, 6, 7 and 7.5 in. Several drops were
made at each combination of drop height and bottom plate configuration, and the
measured maximum impact accelerations were averaged to give the final results.
The pressure-strain relations for the closed cellular rubber sheets under static
loading were measured for the two thicknesses using test pieces whose surface areas,
10 x 13.2 in., were equal to a quarter of the bottom area of the model. The strain of a
test piece is the absolute ratio of the deflection (the change of thickness) to the
undeformed thickness. An analytical approximation derived from the measurement was
found as
(C2.29)
where p is pressure,
e
is strain, and Eo
=
124 kN/m2 is the initial Young's modulus of
the layer material.
The analytical model for flat bottom impact was developed by assuming that the
same mechanism for the formation of the air layer was in effect regardless whether or
not an elastomeric layer was applied to the under surface. Away from the immediate
vicinities of the bottom edges, the deformation of the free surface was considered
negligible, so that entrapped air was seen to form a layer of uniform thickness and of
width equal to that of the bottom
[C4,C8].
The differential equation governing the total
height 6 of the air and elastomeric layers (see Fig. C2.16) may be derived by taking
into account the difference in descending velocities of the flat bottom (V) and the water
surface (v) as follows
.. . 2b 2b
6.
= v-v =-(p-Po)+-(p-po)-g
m
M
(
m+M)
=
mM 2b(p-PO)-g (C2.30)
Appendix C
C-lS

7/26/2019 1992djatmikophd.pdf
http://slidepdf.com/reader/full/1992djatmikophdpdf 418/507
where b is the half-width of the bottom. g the acceleration of gravity, M and m the drop
mass and added mass per unit length, respectively. and Po the initial pressure of the
entrapped air. The added mass is given by assuming an irrotational flow condition at
the impact surface as [C6]
The above differential equation is valid from immediately the edges of the model contact
the piled up water (t =0) to at least the instant when p achieves its maximum.
By assuming that at t
=
0 the deviation of the pressure of the entrapped air from
the atmospheric pressure was negligible. and that the initial downward motion v of the
free surface beneath the bottom was consequently negligible compared with the
descending velocity of the bottom, then the initial conditions are set out as
6(0)
=
60
=
ho +do and
~(O)
=
Vo
=
-~2g(Ho - ho)
(C2.31)
where ho and do are the initial heights of the air layer and the elastomeric layer.
respectively. and Ho is the drop height. It follows that ho is equal to the height of the
elevated water measured from the calm surface level at t
=
O.
Let S.=f.(p) and Se=fe(P) denote the pressure-deflection relations for individual
layers of air and elastomeric, respectively. hence the total deflection S of the two layers
for given pressure p is found as
(C2.32)
Considering 1as denoting the function relating 0 to 6; that is.
S
= 1(6) = 60 - 6. then
pressure p can be expressed in terms of 6 via
p = CI(S)=Cl [1(6)] = F(6)
(C2.33)
where f-l denotes the inverse function of f defined in eq (C2.32) and F the composite
function of f-
1
and 1. The solution to eq. (C2.30) is achieved by substituting eq.
(C2.33). and gives 6 as a function of time
t.
The temporal variation of the acceleration
of the bottom in units of gravity, G=V/g can
be
obtained through
Appendix
C
C-16

7/26/2019 1992djatmikophd.pdf
http://slidepdf.com/reader/full/1992djatmikophdpdf 419/507
2b 2b
G= 1--(p-PO) = 1--[F(~)-PO]
Mg Mg
If G
max
is designated maximum impact acceleration of the bottom in units of gravity
then, by solving the initial-value problem
it
is possible to derive the following
functional relationship
(C2.34)
Ultimately the variation of G
max
as a function of Eo can be evaluated to demonstrate the
effectiveness of the elastomeric layer and to determine the optimal Eo for given drop
conditions.
Typical test results of flat bottom slamming for three different configurations are
as shown in Fig. C2.17. The graphs exhibit a substantial decrease in the maximum
acceleration when elastomeric layers are attached to the model. However, the peak
period of the layered model tends to be larger than that of the rigid bottom. The test data
for all drop heights are presented, together with the predicted value using the above
semi-empirical formulation, as shown in Fig. C2.18. The agreement between the
experimental data and theoretical approximation is essentially good. The correlation of
the maximum impact acceleration and Young's modulus of the elastomeric layer was
then deduced from the experimental data and pressure-strain equation, as presented in
Fig. C2.19. As can be seen, the curves reflect the fact that in the limit as
Eo-+O
or
Eo-+oo,
the cushioning effect of the elastomeric layer becomes negligible and the
maximum impact acceleration of the body approaches a value corresponding to that of
the rigid bottom.
C3. DROP TESTS ON WEDGE·SHAPED MODELS
C3.1. Chuang
As the sequence to his initial investigation on the impact pressure of flat-bottom
slamming Chuang carried out a further set of drop tests on the same flat-bottomed
model, as well as on wedge-shaped bodies [C14]. The primary reason for conducting
another flat-bottom test was to observe more closely whether the previously measured
impact pressures were generated by the compression of the trapped air or by the actual
contact between the bottom and the water surfaces. Such information is important to
clarify the assumption made in deriving the empirical estimations of flat bottom
slamming as given in eqs. (C2.4) and (C2.5), that is, the first positive pulse of the
Appendix C
C-17
7/26/2019 1992djatmikophd.pdf
http://slidepdf.com/reader/full/1992djatmikophdpdf 420/507
impact pressure occurred during the split second when the air was trapped momentarily
between the falling body and the water surface. In the case of wedge-shaped bodies,
the study was aimed at evaluation of the semi-empirical formulations in predicting
impact pressure as proposed by Wagner [CI5] and von Karman [C6] below.
The formulation of impact pressure distribution p(x) due to unsteady
hydrodynamic pressure exerted on a rigid wedge-shaped body penetrating a water
surface is written as
1t
x
2
L2 2z (2 2)112
-=~2
+
- ; - ; 2 L - x
I-~ V
L2
(C3.I)
The notations used within eq. (C3.1) are in Fig. C3.1. The maximum impact pressure
Pmax is obtained by setting dp/dx=Il and by assuming the acceleration of the falling
body
z
to be negligibly small. This gives:
1 [ 1t
2
]
max=_pV
2
1
+-2
2 4~
(C3.2)
which takes place at the point where :
(
2)112
x eL 1-~
(C3.3)
The velocity V adopted to compute the maximum pressure is not necessarily the initial
impact velocity
Yo,
because such a pressure generally occurs some time t after the
instant of impact to' The magnitude of pressure at the keel of the wedge is calculated by
substituting x
=
0 into eq. (C3.l). thus:
(C3.4)
or.
if z
can be neglected this equation reduces to :
(C3.5)
The above equation eventually resembles the formulation given earlier by von
Appendix
C
C-18

7/26/2019 1992djatmikophd.pdf
http://slidepdf.com/reader/full/1992djatmikophdpdf 421/507
Karman [C6] for the maximum pressure at the moment to when the keel makes first
contact with the water surface, i.e.
1 2
7 t
P
keel=
-pVo -
2 tan~
(C3.6)
The test facilities used in these later tests at DTMB were the same as those for the
flat-bottomed model [C4]. The tests were carried out for five different wedge-shaped
models with the deadrise angles ~ of 1, 3, 6, 10 and 15 deg. Modification to the flat-
bottomed model was made to construct the wedge-shaped models by cutting a 20-in.
side into two equal widths and then welding two pieces of plates to form a V-shaped
bottom with an intended deadrise angle. Three pressure transducers were positioned
transversely at three different locations, namely, at the keel, mid-span of the slope, and
near the upper edge of the wedge. The investigations were then performed on the
wedge models at four variations of drop heights, that is, 3 to 7.5 in. at 1.5 in.
increments.
Additional instruments, i.e. two very thin copper probes, were used in the second
set of flat-bottom tests in order to observe the effects of air trapped on impact pressure.
The two probes were located at a certain distance from one another at the flat-bottom so
that they were electrically isolated. Ifboth probes are electrically in contact because of
the mass of water, a certain level of electrical resistance will develop between them,
otherwise the resistance will be infinite. The result of this particular test shows that the
first positive pulse (maximum pressure) occurs about 13 msec before the water comes
into contact with the bottom surface of the model. It is therefore concluded that the
maximum pressure developed is when the air is momentarily trapped between the
falling body and the water surface. Observation of the effects of deadrise angle on the
trapped air was also made in the study. From the underwater photographs taken during
the tests it is revealed that only the flat-bottom and the 1-deg wedge models trapped a
substantial amount of air, whereas for larger deadrise models most of the air had
escaped at the instant of impact. Hence, in the later cases, the effect of trapped air on
the the magnitude of impact pressure may be insignificant, but it does exist
The test results can further explain the effect of deadrise angle on slamming
pressure. Several sample records show that the impact pressure histories at the keel
were quite different from those away from the keel. For the 3-deg deadrise angle or
higher, the pressure at the keel began with an impulse of short duration (less than 0.05
msec) and was followed by the so-called hydrodynamic pressure. On the other hand,
the maximum pressures persisted away from the keel were purely due to hydrodynamic
movement and generally take a longer period to decay. Another fact which could be
learned from the results is that the peak pressures measured away from the keel are
Appendix C
C-19

7/26/2019 1992djatmikophd.pdf
http://slidepdf.com/reader/full/1992djatmikophdpdf 422/507
larger (approximately twice) than those at the keel, except for the l-deg deadrise where
the magnitude is on average the same (see Fig. C3.2). The theoretical predictions by
Wagner and von
Karman
are also plotted on those graphs. In general the two theories
agree well with the experimental data for the case of maximum pressure at the keel.
With respect to the pressures away from the keel, Wagner's prediction shows much too
high values for low deadrise angles, especially on
l-deg
deadrise, but become closer to
the experimental data by increase of the deadrise angles. An explanation for this may
be
that the theory was developed without considering the air trapped which may affect the
magnitude of slamming pressure of small deadrise wedges. On the basis of the
experimental data Chuang proposes, a new general form of pressure equation may be
written as
(C3.7)
where Band n are arbitrary constant and n has a limit of 1 S n S 2. Figure C3.3 is
plotted from eq. (C3.7) for a wider range of impact velocity values and deadrise angles.
It is further claimed that the slamming pressure on the wedge-shaped ship bottom
might be closely approximated to the model results. This is because a one-to-one
scaling factor can be suitably applied as the deadrise angle of the model should equal
the deadrise angle of the full-scale ship. Nevertheless, tests with large scale models
over a much wider range of drop heights are needed before the results can be
considered conclusive.
In subsequent ship slamming research Chuang performed a larger scale test of a
wedge body represented by the ship bottom with 10 deg deadrise angle [C16,C17].
The model (size 80 in. by 90 in.) was designed for standard construction rules and in a
sense may be considered as a flexible structure. The model was tested for drop heights
of 6, 8 and 25 feet on an irregular water surface. A typical test result is as that depicted
in Fig. C3.4, which shows the time histories of impact pressures, structural strains,
plate deformation, velocities and model accelerations. Analysis of the test results
provides some useful information as summarised in the following.
When comparing a rigid and flexible bottom structure it is found that the pressure
time pulses of the flexible bottom are more highly irregular. Measurements on the
magnitude of peak impact pressures show that in lower drop heights (6 and
8 ft)
the
flexible model may experience local pressure of approximately 25% larger than that of a
rigid model, whereas, for
25
ft drop height the pressure is lower, i.e. only about 70%
of that measured on the rigid model. A similar situation is observed on the widths of the
pressure pulses. Comparison of a flat-bottomed model and a 10 deg deadrise angle
model of similar size shows that the latter produces substantially lower overall bottom
loadings but higher local plating pressures and stresses when dropped from the same
height.
Appendix C
C-20

7/26/2019 1992djatmikophd.pdf
http://slidepdf.com/reader/full/1992djatmikophdpdf 423/507
C3.2. Ando
In the second set of his experiments, Ando tested three wedge-shaped model
configurations with the deadrise angles of 6, 10 and 15 deg [C13]. The wedge bottom
plates were made by welding together a pair of 10 x 26.5 x 0.5 in. steel plates along the
long-edge for each deadrise angle. The elastomeric layers, instrumentation and the
testing procedure for the wedge models were the same as those applied to the flat
bottom model. However, no theoretical study has been developed in conjunction with
the wedge-shaped model test.
According to Wagner [C15] impact of a flexible wedge-shaped bottom is
comparable to that of a rigid cambered bottom. That is, the force of impact on an elastic
bottom is somewhat less than that for a comparable rigid prismatic bottom at the
beginning of immersion but becomes greater towards the end of the immersion, or the
instant when water reaches the edges of the bottom. This suggestion apparently is
qualitatively justified by the test data from Ando, shown in Fig. C3.4 [C13]. It is
obvious from this Figure that the smaller the deadrise angle the greater the effect of
elasticity of the bottom, even though
it
is interesting also to observe the larger
maximum load imposed on the bottom when the layer is applied compared to the rigid
plate. However, the maximum impact load imposed on the layered wedge-shaped
bottom remains respectably lower than that of the flat bottom.
In conclusion of his study Ando suggests that an elastomeric layer will be
effective as a means of reducing slamming impact force, and hence minimising the local
and structural damage, if it is applied to the flat areas of the ship bottom. A potential
application of elastomeric layer is also suggested for the prevention of slamming
damage to the under surface of cross-structures of SWATIl ships.
C3.3.
Hayman et al
The increase in demand of high-speed marine craft for passenger ferry operation
worldwide in recent years has led to a new trend of ship research. For instance, to keep
up with the latest requirements for high-speed structural safety. Being the leading
producer and operator of high-speed crafts, especially advanced catamarans, Norway
has undoubtedly acquired the latest technology for their development. Apart from the
capability of any individual shipyard or marine consultant company to adapt the new
developments, full support from the Norwegian classification society (OnV) in the form
of enhanced structural design guidance (rules) based on their extensive research has
eventually fostered the competitiveness of Norwegian marine companies. One of the
latest research programme set out by Dn V was the investigation of structural response
Appendix C
C-21

7/26/2019 1992djatmikophd.pdf
http://slidepdf.com/reader/full/1992djatmikophdpdf 424/507
of fast craft due to slamming loads [CI8]. During the earliest stage of this programme a
series of drop tests on stiffened aluminium and GRP models were performed.
The size of each model was 2000 mm wide and 1000 mm long with flat bottom
panels having a deadrise angle of about 30 deg, and ballasted to a total weight of 1350
kg giving a draught of approximately 0.73 m in sea water. The bottom panels of both
models were designed according to the 1985 DnV rules for High Speed Light Craft
with the following parameters :
Reference area
Vertical acceleration at
LCG
Longitudinal distribution factor
Draught
AR
= 60m
2
a
v
=
3.0
g
kl
=
1.0
T
=
1.0
m
In order to maintain
a
2-dimensional flow, the model was fitted with two large
aluminium end plates. In addition. the model was fitted with a deck plate, lifting frame
and trolley, which was bolted to one of the end plates and engaged to the vertical test
rig. The model was raised to a certain distance above the water level (drop height) by a
mobile crane fitted with a quick-release hook which held the lifting crane. The unique
feature of the model is that it can be rotated on a support axis so that the angle of impact
between the model bottom and the water surface can be set up prior to any test run.
Generally tilt angles from 0 deg to
25
deg have been used during the test to give impact
angles from 30 deg down to 5 deg. A more detailed description of the model and test
rig design and arrangement can be found in ref. [C19].
The measuring devices mounted on the model consisted of
4
accelerometers to
investigate global accelerations of the model in the vertical and transverse directions.
and one accelerometer at the centre of the bottom panel. A row of 6 pressure
transducers positioned transversely at the mid-length of the model, plus two additional
transducers off-centre. were used to measure the impact pressure distribution on the
model's bottom. Several strain gauges were also fitted to observe the bottom plate
responses due to slamming impacts. Signals from those electronic devices were fed into
a personal computer endowed with data acquisition software. 32 channels in all can be
stored in the computer with 2000 samples on each channel. Sampling intervals were
mostly made to give a total record of 30-100 ms. The primary test data which can be
readily plotted from the computer were pressure and plating strain time histories (eg.
Fig. C3.5). A preliminary data analysis of the pressure data for the aluminium model
has been made and compared with theoretical predictions.
There were two theoretical approaches. The one which was developed by Wagner
[CIS] (see section C3.1) and the one by Payne [C20], have been evaluated by DnV to
be used in the comparison with the experimental data. Payne suggests that the
maximum pressure of impacting wedge body can
be
calculated by
Appendix
C
C-22

7/26/2019 1992djatmikophd.pdf
http://slidepdf.com/reader/full/1992djatmikophdpdf 425/507
1
, , 2
Pmax = 2 P Y s
(C3.8)
where V. is the absolute stagnation line velocity, in which the stagnation line is located
somewhere in the splash-up water region probably at some fixed ratio 11of the splash-
up distance 11(see Fig. C3.6). The stagnation line velocity for an impact angle ~ is
given by
'12 = ( _ i _ ) 2 + [4ltl1 Z f(~)]2 + 2 _i_ 4ltl1 Z f(~)
s tan ~ cos ~ tan ~ cos ~
or simply
(C3.9a)
(C3.9b)
where the deadrise angle dependent correction factor f(~) can be approximated by 1-~/7t
and 11is approximately 0.05.
As is shown in Fig. C3.7, the maximum pressures measured on the aluminium
model dropped symmetrically (28.8 deg effective slamming angle) are plotted against
the drop height, H, which corresponds to the impact velocity of V=~J2gH. Theoretical
values derived by the formulation of Wagner and Payne are also shown, in which the
latter gives much better agreement than the former. The results of pressure analysis of
the GRP model are not presented in ref. [CI8], nonetheless
it
is mentioned that a
comparison of the two models has been made. The initial objective of comparing the
test data of the two models was to investigate the effects of the model flexibility onto
the maximum impact pressure, where it is in general presumed that the more flexible
structure will excite less impact pressure. Nevertheless, it was found that this difference
is rather scarce, and hence the comparison is inconclusive. It is further claimed that it
would be preferable to compare values of pressure integrated over a given area, as is
presented in [C2I], or a given period of time.
A more extensive analysis has been performed on the test data of a GRP model,
especially on the values of the strain of the GRP sandwich (core, inner laminate and
outer laminates). The results indicate that in the symmetric position (30 deg effective
impact angle) the greatest strains occur at the keel, while in the lower effective impact
angle (lO-deg) the maximum shear strain is experienced at the chine. From the strain
data it was then able to deduce the shear stress at failure, i.e. about 2.6 and 3.1 N/mm2,
which agrees well with the shear ultimate strength of
2.9 - 3.2
N/mm2.
The use of drop test data in the structural analysis using the finite element method
is also demonstrated in ref. [CI8]. Both dynamic and quasi-static analysis were
performed to develop a comparison of deformations and stresses induced by uniformly
Appendix
C
C-23

7/26/2019 1992djatmikophd.pdf
http://slidepdf.com/reader/full/1992djatmikophdpdf 426/507
distributed static pressure loadings. The finding reveals that the quasi-static analysis
reproduce the measured behaviour quite well, whereas the dynamic one gives spurious
oscillations due to lack of explicit damping on the model.
The tests described above prove to be very useful in giving insight into the way in
which slamming propagates over the hull surface, and into the structural deformations
that are generated. Investigations on the hull flexibility on the pressure distributions and
histories could also be performed, although a better evaluation method remains to be
established. In view of the development of simplified calculation methods, such as
those used in classification rules, combination of measured data with theoretical
predictions is of importance for validation.
C4. DROP TESTS ON SHIPFORM MODELS
C4.1. Ochi and Bledsoe
The drop tests conducted by Ochi and Bledsoe at the DTMB [C22] was directed
toward establishing the exact impact pressure velocity relationship as a function of ship
form. The model used in the experiment was a 1/20 scale of the Mariner section at
17.5% of the length aft of the forward perpendicular, which has been modified to a V-
form. The size of this two-dimensional model was 26.5 in. x 42 in. x 30 in. (L x B x
D) and was made of pine with a hull thickness of 2.5 in. normal to the hull surface,
which was covered with 3/4 in. plates. The ballasted weight of the model was 190 lb,
which corresponds to approximately 45% loading condition for the Mariner. The drop
tests were performed at five different drop heights covering the impact velocity up to 10
fps. This upper limit corresponds to an impact velocity of about 50 fps for a 520-ft
ship.
The test facility for this experiment was the same as that used by Chuang [C4].
The main instrumentation utilised for the test comprised of diaphragm type pressure
transducers with the capacity range from 15 to 50 psi, and their natural frequencies
were about 7000 cps. The transducers were mounted at seven positions around the
girth from the keel of the model at its mid-section. Two accelerometers, which were
used to measure the acceleration and velocity, were attached to the inside of the model's
base. The immersion of the model in the water was detected matching pinion which
travelled on the vertical track and at the same time activated a potentiometer. The output
of all measuring instruments was fed through carrier amplifiers and recorded on a
consolidated string oscillograph. In addition, a high-speed movie camera was used to
observe the piled-up water.
A pp en dix C
C-24

7/26/2019 1992djatmikophd.pdf
http://slidepdf.com/reader/full/1992djatmikophdpdf 427/507
The test data analysis of this particular experiment were performed to receive
information peculiar to ship-form slamming. which covered the primary impact
pressure-velocity relationship right to impact force and impulse behaviours. With
respect to the maximum impact velocity of 10 fps, i.e. corresponds to a 6 in. drop
height, only four out of seven transducers were found to have registered any impact
pressure, with the most outboard location of transducer at 6 in. and 4 in. abreast and
above the keel, respectively (see Fig. C4.1). The pressure-velocity relation obtained
from the test is shown in Fig. C4.2. Since the data for each transducer falls on a
straight line when plotted on logarithmic scale the pressures may be simply expressed
in the form of
n
P
- CV
- 0
(C4.1)
where C is a constant and n is the power velocity factor.
The time history of downward velocity from the instant of model release as well
as the time history of the model immersion into the water have also been extracted from
the test data. An interesting phenomenon was therefore learned as follows. Even
though the uppermost position of the transducer which has registered maximum impact
pressures is about 4 in. above the keel, observation indicated maximum impact pressure
persisted at those four transducers when the model was only immersed 2 in. into the
water for the maximum drop height of 6 in. This circumstance was explainable later on
having evaluated the manner in which calm water surface instigate after an initial contact
with model bottom. In only a few milliseconds after this contact water pile-up began to
develop and in effect the wetted breadth of the body increased. The wetted half-breadth
is defined as the distance of a spray root, that is, the point at which the (piled up) water
surface meets the model section from the centreline of the model. From the experiment
the rate of wetted breadth was measured. and it was found to be constant after a sharp
increase about 1.45 larger than the actual breadth. It seems obvious that impact pressure
was induced by the piled-up water and its location happens to be at the vicinity of the
spray root.
The pressure distribution at the bottom of the model was traced from the pressure
records at those four locations. For a 6 in. drop height the first peak pressure in the
order of 27 psi was detected on the transducer attached to the keel at t
=
0.4 msec after
impact. The next maximum pressure was measured at the transducer located 21/4 in.
outboard at t = 5.7 msec with the magnitude of around 3 psi, whilst at the same time the
pressure at the keel attenuated to as low as 1.2 psi. By 30 msec the peak pressure was
completed for all four transducers. and a pressure envelope was established around the
bottom at a magnitude of less than 1.0 psi. For any instant of time elapsed the average
pressure acting on the section can be derived by integration of the pressure and dividing
by the wetted breadth.
A ppen dix C
C-2S

7/26/2019 1992djatmikophd.pdf
http://slidepdf.com/reader/full/1992djatmikophdpdf 428/507
C4.2. Yamamoto et al
One of the real cases on fierce ship structural damage due to slamming when
operating in adverse seas has been reported by Yamamoto et al [C23]. The ill-fated ship
in question was a high-speed container ship with a loading capacity of 819 TEU, which
was on a west bound voyage in a fully laden condition on the North Pacific Ocean on
January 28, 1978. This ship suffered severe damage on its bow structure, that is, a
long crack and corrugations in the shell plating on the starboard side, as well as
buckling deformations due to shearing forces on the port side shell plating, when itwas
struck by slamming impact on the flare part on the starboard side. More than that, the
individual decks, flats, bulkheads, ship side members, and rib frames inside the long
forecastle showed plastic deformations, as well as deformations due to buckling or
breakdown, in many different locations.
A reconstruction of the slamming load that caused the damage to the ship has been
made following a thorough enquiry into the nature of the accident. Upon the study of
the damaging pressure loads the primary information required as the relative speed of
the hull and the wave surface at the fore body of the ship, as these two parameters
determine the relative velocity and hence the slamming pressure. This information was
further transformed into an input data for running a program [C24] to compute the
motion characteristics of the ship and ultimately estimating the impact load. For the sake
of simplicity the analysis was made by selecting a train of regular waves in which the
ship is advancing with a predetermined speed at a certain variation of heading angles.
The estimation of impact pressure itself was then made using von Karman's
formulation having determined the impact velocity and the impact angle from previous
analysis. This investigation has in the end resulted in enhanced guidelines of the design
and operation of high-speed container ships.
In conjunction with the investigation of the slamming load, especially to validate
the result as predicted using von Karman's formulation, a series of drop tests have been
carried out on a 2-dimensional small scale model of the bow-flare section of the ship
[C23]. The model, whose geometrical dimensions are 1/26 of those of the actual ship,
was equipped with 10 pressure transducers (capacity: 10 kgf/cm2) positioned at
various points along the girth of the mid-span of the model (see Fig. C4.3). The
aggregate weight of the dropped body, which comprised the model and the track, was
381 kgf. The attachment of the model to the track was designed in such a way that the
model could be tilted to ensure any practical impact angle between the model and the
water surfaces. Slamming impacts imposed on the model were observed in five
variations of tilting angles of the model at its centreline, namely, 15,22.5,30,40 and
4S-deg. It is not explicitly mentioned in ref. [C23], however, as to what extent of drop
height or impact velocity ranges the drop test was conducted.
Appendix C
C-26

7/26/2019 1992djatmikophd.pdf
http://slidepdf.com/reader/full/1992djatmikophdpdf 429/507
A typical plot of the recorded data which is as depicted in Fig. C4.4, shows the
time-series of the impact pressures on any individual location of the transducers. The
values of impact pressures derived by Wagner's formulation are also plotted on the
same graphs for comparison. The discrepancy is thought to be brought about by the
assumption adopted in the formulation, where the peak impact pressure is considered to
persist for a relatively short period, while the test shows otherwise. The overall test
data is as plotted in Fig. C4.5, together with the theoretical results from Wagner and
von Karman as well as with the analytical formulation by Stavovy and Chuang [C25].
On this Figure the pressure coefficient k is plotted against the corresponding impact
angle
1 3
on the flare part at which severe damage on the ship structure has been found.
The impact pressure, which is proportional to the drop velocity V, can be computed by
counting the pressure coefficient as
(C4.2)
The test data are in good conformity with von Karman's formula, which
represents the mean value of dynamic water pressure on a 2-dimensional wedge.
Nevertheless, this conformity remains questionable to some extent because the impact
angle
1 3
of the test data presented within the Figure is not actually the angle formed
between the model surface with the piled up water at a particular position where a
transducer is located, but is the angle between the model surface with the initial water
surface.
cs. DISCUSSION
A
general review on the study of ship slamming by drop test models is presented
in this report. Much has been revealed by previous investigators in this area of
research, yet some aspects of the phenomena remain uncertain, especially when dealing
with a specifically designed model. Understanding of the rigid model's drop over a
calm water surface, both of flat-bottomed and wedge types, is now quite well defined.
One of the most notable achievements is in the conclusion of the presence of air
cushioning effect in the case of flat bottom impact Such an effect is in large believed to
cause a significant reduction in the peak impact pressure in which it is previously
predicted to be infinite. Furthermore, it is realised that the pressure developed during
flat impact would not
be
evenly distributed over the flat surface as observation shows
pressure rise will begin at the edges of the model and travel inward to the centreline of
the model. On the evaluation of the effect of model weight variation it is generaIly
agreed that the heavier model (with the same geometrical size) will result in
a
larger
impact pressure. This observation also reveals that the maximum pressure-drop height
AppendixC
C-27

7/26/2019 1992djatmikophd.pdf
http://slidepdf.com/reader/full/1992djatmikophdpdf 430/507
correlation resulted from models having a characteristic weight within a normal range is
essentially linear, hence the pressure is directly proportional to the square of the drop
velocity [C8,CII]. At very high mass loading the peak impact pressure tends to fall
below the line of proportionality, and may bring about a linear relationship between
maximum pressure and drop velocity.
In contrast to the flat bottom impact, the pressure behaviour of wedge shaped
bodies is characterised by the larger peak pressure which occurs at a distance away
from the keel than along the keel. This larger peak pressure is explained as being
caused by the splashed up water after the instant of impact which carries a certain
amount of mass of spray sheet at a given velocity which is opposed by the downward
movement of the plate surface. The maximum pressure itself is believed to build up
along the so-called stagnation line (see Fig. C3.6). Experimental evidence [CI4] shows
the largest impact pressure away from the keel would be experienced on wedge shape
bodies with a deadrise angle of about 3 deg. The expectation of larger impact pressure
occurring at lower deadrise angles than 3 deg. is not satisfied due to the fact that at such
angles the cushioning effect of the entrapped air still exists although not as intense as in
the case of flat bottom impact.
In most theoretical treatments of the ship slamming problem the water is
considered to be incompressible and non-viscous. In the mathematical idealisation of
the problem it is assumed, moreover, that the velocity of the specified part of the free
water surface is increased instantaneously from zero to the downward speed of the
falling body. The slamming pressures resulting from such analyses are in good
agreement with experimental results as long as the deadrise angle of the ship's bottom
is not too small (e.g. as is presented in [CIS]). In the extreme case of a flat bottom,
however, the theory predicts infinitely high pressures at the instant of impact. The high
pressure predicted by these theories could not be verified experimentally.
The drop test of ship form models apparently shows similar behaviour as for
wedge shaped models in the way that the peak pressure occurs to be in the bottom area
covered by the splashed up water. In this case, however, the largest peak pressure is
notably developed along the keel rather than away from it. This situation is quite
understandable if one considers that the keel area of the ship form where the largest
impact persists normally has a flat shape, so the phenomenon will resemble that of flat-
bottomed impact. Slamming severity is further explained [C26] to be influenced by the
bottom portion of a section only rather than by the section shape up to LWL . A drop
test on ship form model could also be very useful to clarify specific cases such as the
one conducted in Japan in the investigation of bow flare slamming[C24].
AppendixC
C-28

7/26/2019 1992djatmikophd.pdf
http://slidepdf.com/reader/full/1992djatmikophdpdf 431/507
Other investigations regarding ship slamming which may be made by performing
a drop test is the study of mechanisms for slamming pressure reduction. Two reports,
by Lewison [CIl] and Ando [Cl3], address this particular subject for monohull ships
and advanced crafts, respectively. Their findings are principally promising although
further confirmation still needs to be pursued if
it
is to be implemented for full scale
ships. On the use of external keels, for instance, argument did arise regarding the more
practical way of enforcing the bottom structure to ease slamming damages, such as by
using thicker plate or by reducing the panel size [C27] ..
The ultimate objective of a slamming study by drop test model is of course the
implementation of the experimental data for ship bottom design. The usefulness of drop
test data in this study is obvious, for instance as is demonstrated in the design study of
hydrofoil crafts by Drummond et al [C28]. For this study the drop test data on wedge-
shaped bodies accumulated by Chuang [CI4] was combined with the statistical
approach by Ochi and Motter [C29] to estimate the design pressure for such crafts.
From the initial values of slamming impact pressures it allowed further to perform a
parametric study in order to quantify the influence of geometrical as well as operational
parameters. As a result of this sort of study Drummond was then proposing a simple
algorithm to calculate the design pressure as a function of those parameters specifically
for hydrofoils. Another example of the implementation of drop test data (of ship form
models) in predicting design pressure for monohull is fully reported in [C26].
In spite of the confidence in implementing drop test data as above, some may
consider that further refinements are still necessary to be explored so that more realistic
predictions can be made. There are some areas that have not been sufficiently
incorporated in the slamming investigation by a drop test model which, to some extent,
would improve the utility of such data, for instance, the effects of structural flexibility,
disturbed (irregular) water surface, and horizontal (forward) speed. Furthermore,
verification of drop test data should be made against the information from seakeeping
tests and/or full scale tests. Characterisation of impact pressure due to effects of the
structural flexibility and the disturbed water surface has been initiated in order to clarify
the viability of replacing equivalent static load criteria as widely adopted at present with
more realistic dynamic load criteria [C30,C31]. It is also suggested to estimate the time
and space distribution of impact pressure over the ship bottom [C32]. The concern over
forward speed effects arises primarily in the study of high speed craft behaviour.
Experimental data of high speed craft (see Fig. CS.I) shows that forward speed effects
are dependent on the magnitude of slamming pressure as the speed is increased outside
the range of conventional ship normal operations. In this respect, correction factors,
probably derived from seakeeping tests or full scale measurements, need to be
introduced into the pressure data from drop tests.
Appendix C
C-29

7/26/2019 1992djatmikophd.pdf
http://slidepdf.com/reader/full/1992djatmikophdpdf 432/507
C6. CONCLUSIONS
The importance of conducting drop tests in ship slamming studies is obvious.
Various information could be drawn by such an investigation ranging from impact
pressure to structural responses. To some extent drop test data of rigid bodies could be
directly applicable in ship structural design. Nevertheless, further observations
accounting for structural flexibility and disturbed water surface need to be pursued in
the interest of enhancing the accuracy of drop test data for practical uses. Some remarks
to the various predictions of impact pressure may be clarified as follows.
1. Maximum impact pressure on flat bottom plate would not be appropriate to be
predicted by classical theories such as those given by Wagner or von Karman. In this
particular case peak pressures is definitely reduced by the presence of air cushioning
effects which develop when the closing gap between flat bottom surface and the water
surface come to
a
certain limit.
2. The worst impact pressure for any impact velocity on the model bottom plate
would be expected to occur the wedge-shaped body with deadrise angle around 3-deg.
Drop tests have given a better insight towards slamming phenomenon on seagoing
ships which can
be
adopted in a further development of slamming study.
3. The measured pressures from drop tests may be regarded as the raw information
that would not directly applicable in ship structural design. A further analysis to process
such data by incorporating the rectifications, such as that due to the effect of surface
waves and so on must be taken into account to generate the correct values for design.
Further, it should be able to estimate the time and space distribution of impact pressure
over the ship bottom [Cl].
REFERENCES TO APPENDIX C
Cl. Townsend, H.S., Some Observations on the Shape of Ship Forebodies with
Relation to Heavy Weather Damage , SNAME, New York Metropolitan Section,
USA, Apr. 1960
C2. Townsend, H.S., Observations of Ship Damage Over the Past Century ,
Proc.,
SN A M E S hip Structure s Sym p., Washington D.C., USA, Oct. 1975
C3. Fukuda,
J.
and Shinkai, A., Speed Loss of Container Ship on the Different
Routes in the North Pacific Ocean in Winter ,
Proc., In t. Symp, on Ship
H ydro dyn am ics a nd E n erg y S avin g (IS SHES-8 3 ),
Madrid. Spain, Sept. 1983
C4. Chuang, S.L., Experiments on Flat-Bottom Slamming ,
J ournal o f Ship
Research, SNAME, Vol. 10, No.1, pp. 11-17, Mar. 1966
Appendix C
C-30

7/26/2019 1992djatmikophd.pdf
http://slidepdf.com/reader/full/1992djatmikophdpdf 433/507
CS. Keil, A.H., The Response of Ships to Underwater Explosions , Trans.
SNAME, Vol. 69, pp. 366 - 410, 1961
C6. Th. von Karman, The Impact on Seaplane Floats During Landing , National
Advisory Committee for Aeronautics (NACA),
Technical Note 321, USA, 1929
C7. Chuang, S.L., Experiments on Slamming of Ship Flat-Bottom Structural
Models , NSRDC, Report No. 2528, Feb. 1968
C8. Verhagen, J.H.G., ''The Impact of a Flat Plate on a Water Surface , Journal of
Ship Research, SNAME, Vol. 11, No.4, pp. 211-223, Dec. 1967
C9. Lewison, G. and Maclean, W.M., On the Cushioning of Water Impact by
Entrapped Air ,
Journal of Ship Research,
SNAME, Vol. 12, No.2, pp. 116
130, June 1968
C10. Ogilvie, T.F., Compressibility Effects in Ship Slamming , Schiffstechnik, Vol.
10,pp. 147-154, 1963
Cll. Lewison, G.R.G., On the Reduction of Slamming Pressures ,
Trans. RINA,
Vol. 112, pp. 285-306, 1970
C12.0chi, M.K., Extreme Behaviour of a Ship in Rough Seas - Slamming and
Shipping of Green Water , Trans. SNAME, Vol. 72, pp. 143-202, 1964
C13. Ando, S., Cushioning of Slamming Impact by Elastomeric Layers , Journal of
Ship Research, SNAME, Vol. 33, No.3, pp. 169-175, Sept. 1989
C14. Chuang. S.L., Experiments on Slamming of Wedge-Shaped Bodies , Journal
of Ship Research,
SNAME, Vol. 11, No.3, pp. 190-198, Sept. 1967
CIS. Wagner, H., HUber die Landung von Seeflugzeugen , Zeitschrift fur
Flugtechnik und
Motorluftschiffahrt,
Vol. 22, No.
I,
pp. 1-8, 1931
C16. Chuang. S.L., Slamming Tests of Structural Model Representing a Ship Bottom
with 10-Degree Deadrise Angle - General Outline of Tests and Test Results ,
NSRDC, Report No. 3007, Aug. 1969
C17. Chuang, S.L., Slamming Tests of Structural Model Representing a Ship Bottom
with 10-Degree Deadrise Angle - Analysis and Discussion of Test Results ,
NSRDC, Report No. 3008, Aug. 1969
CIS. Hayman, B., Haug, T. and Valsg rd, S., Response of Fast Craft Hull
Structures to Slamming Loads ,
Proc., lst
Int.
Conf,
on Fast Sea Transportation
(FAST'91),
Trondheim,
Norway, June 1991
C19. B~e, A , Haug,
T.
and Hayman, B., Slamming Drop Test Arrangement , Det
norske Yerltas, DnVC report No. 90-0051, Norway. Sept. 1990
C20. Payne, P.R., The Vertical Impact of a Wedge on a Fluid , Ocean Engineering,
TN, Vol. 8, No.4, pp. 421-436
C21 Allen, R.O. and Jones, R.R., A Simplified Method for Determining Structural
Design-Limit Pressures on High Performance Marine Vehicles , Proc.,
Advanced Marine Vehicles Conf., AIAA/SNAME, Paper No. 78-754, San
Diego, USA, Apr. 1978
C22. Ochi, M.K. and Bledsoe, M.D., Hydrodynamic Impact with Application to Ship
Slamming ,
Proc., 4th Symp. on Naval Hydrodynamics,
Ship Propulsion
and Hydroelasticity, Vol. 3, Washington, D.C., Aug. 1962
C23. Yamamoto, Y
et.al.,
Structural Damage Analysis of a Fast Ship Due to Bow
Flare Slamming , Int. Shipbuilding Progress, Vol. 32, No. 369, pp. 124-136,
May 1985
AppendixC
C-31

7/26/2019 1992djatmikophd.pdf
http://slidepdf.com/reader/full/1992djatmikophdpdf 434/507
C24. Yamamoto, Y., Fujino, M. and Fukosawa, T., Motion and Longitudinal
Strength of a Ship in Head Seas and the Effects of Non-Linearities ,
Journal of
the Soc. of Naval Architects of Japan,
Vols. 143-144, 1978
C25. Stavovy, A.B. and Chuang, S.L., Analytical Determination of Slamming
Pressures for High-Speed Vehicles in Waves , Journal of Ship Research,
SNAME, Vol. 20, No.4, pp. 190-198, Dec. 1976
C26. Ochi, M.K. and Motter, L.E., A Method to Estimate Slamming Characteristic
for Ship Design ,
Marine Technology,
SNAME, Vol. 8, No.2, pp. 219-232,
Apr. 1971
C27. Kendrick, S. discussion to Lewison, O.R.O., On the Reduction of Slamming
Pressures ,
Trans. RINA,
Vol. 112, pp. 285-306, 1970
C28. Drummond, T.O., Mackay, M. and Schmitke, R.T., Wave Impacts on
Hydrofoil Ships and Structural Implications ,
Proc., 11th Symp. on Naval
Hydrodynamics,
Univ. College London, UK, Apr. 1976
C29. Ochi, M.K. and Motter, L.E., Prediction of Slamming Characteristics and Hull
Responses for Ship Design , Trans. SNAME, Vol. 81, pp. 144-176, 1973
C30. Sharov, Y.F., Slamming Stresses in Ship Bottom Plates , Sundostroenie, Vol.
24, No.4, pp. 5-9, 1958
C31. Buckley, W.H. and Stavovy, A.B., Progress in the Development of Structural
Load Criteria for Extreme Waves ,
Extreme Load Response Symp.,
SNAME.
Arlington, VA, USA, Oct. 1981
C32. Lewis, E.V., Structural Dynamics of Ships ,
Proc., Int. Symp, on the
Dynamics of Marine Vehicles and Structures in Waves,
IMECHE, London, UK,
Apr. 1975
Appendix C
C-32

7/26/2019 1992djatmikophd.pdf
http://slidepdf.com/reader/full/1992djatmikophdpdf 435/507
S
&
• , 10
. 0
s
•
•
•
•
•
•
•
0
. .
:. 10
. . .
J
•
.
•
.
.
e
10
. .
. .
le
. .
.
l pl~t ••loclty_ rp· •.0
~ .•-',. Dro,
Melaht,
tn •• a
• . • ' . f
&.1
•• S
&
f.S
Figure C 2.1. M axim um im pact pressure vs various
im pa ct v elo citie s [C 4]
F igure C 2.3. Facility fo r a 1/4-scalc m odel droptcst [C 7]
Appendix C
'
. ,
. . . . M .
hl 'CU,. '._ '
, , , •• J at 10 ,. .. 't
N
II
III
•
I p - . ,
r n + m [ ; · i . i
: , J t . . . t '••• '~,
V
,/
-
s-:
J: .
.V
f - 6 ' .
•
'~ 'I'I -
.~ • ·1•. '.' ,,,, '1..... _ ... 1 _
- 0·..,........,•. .1 . ', 111.
-- 1.. ._
tt _ • . . ,. ....... - 11•• IIt' .......... • ..... to . .... , . . , .... u _ , _
9 ..... - ..... , . .. '1••lle ...... .,•••• n. ...... _)
- .f C U........ uu.............,...........
-
aU:\f I' .............
1_ •
:1.• u , . .. .
t i . t . .
,
I
e
iI
i i i ~ M
1 1 1 1 1
.
,
. .
. .
• 11 • .:.
.
• '10
• •
lO
. . .
, o o
Oo
'.'PI.fI·
F ig ure C 2.2 . C om pariso n o f th eo re tica l a nd e xp erim en tal
flat-b otto m im pa ct p re ss ure s [C 4]
~ ~ ~ - - ~ _ . - - ~ I : ~
l.L.
7
.............
_ , J U
•
TlMllm.,
FORE
PRUSUR'
GAGlS'PEI
• I . '0 .. , OlFlfC'tON
... '~~.'.t
GAGESIMDI
VIlOCITY METERS
IVUI A~O
AccrU OMITl lAce.
ROM ' ''ENCI 1121
Figure C 2.4. T est result for 6-foot drop test of n at-bottom ed
m odel [C 7]
C-33

7/26/2019 1992djatmikophd.pdf
http://slidepdf.com/reader/full/1992djatmikophdpdf 436/507
IIVI '\lIl~\l
; 1:1\ V 1\..1:; ~
Boston Spa, Wetherby
West Yorkshire,
LS23
7BQ
www.bl.uk
PAGE MISSING IN
ORIGINAL

7/26/2019 1992djatmikophd.pdf
http://slidepdf.com/reader/full/1992djatmikophdpdf 437/507
t.heory
~ QlI.per·lment
E
~
2
t
X-
C
_
L
1
)
. . .
. . .
U
L
Cl.
0
._ 5millis~ond,
1 : L a _ =0.5
/il.
L= 0.2 rn t r,
dropheight ~c.m
4
H.ory
. o r
7L7.o~
Qxperlme,nt.
~
3
it
C
•
:l
. .
2
'
11
. . .
a.
1
H
-0.5
-,-
i . L
,L
=0.2 mtr.
drop height: ~OGm
_-_time.
F igure C l.7 . P re ss ur e time h is to ry dur ing impac t [CS ]
P ..... .,.
,
- - -
F igu re C l.8 . D i st ri bu tion o f peak p re ss ur e a long F igur e C2 .9 . D is tr ibution o f p eak p re ss ur e a long tr an svers e
model centreline [C9] mod-plane of the model [C9]
Appendix C
C-35

7/26/2019 1992djatmikophd.pdf
http://slidepdf.com/reader/full/1992djatmikophdpdf 438/507
r.
i \ b - 02
I
i
j i
I .
. I
I .
. I
I .
. I
I .
i I
j
i
I
i
i
'0 /
p.psiq
P,ps,Cj
1ft.
267
v «
II.~
60 -
C2.10. Pressure-tim e curves on centreline as m easured and
predicted
by
the sim ple one-dim ensional theory [C9]
m-
267
Y·11.4
, I
, 'b.Ol
I , .
I ,
I ,
I ,
,
,
,
,
,
,
I
I
,
\
\
\
\
,
,
t,ms
Figure C2.11. Pressure-tim e curves on centreline as m easured and
predicted
by
th e mod ified o ne-d im en sio nal theo ry [C 9]
WO'fr
_ I
Figure C2.12. D iagram of falling body and control surface
en clo sin g air [C 9]
1ft.
354
D ro p • 511.
Y -176
r : 2
, : 085
l
I
I
I
I
/
'
'
.'
Figure C 2.13. Pressure-tim e curves on centreline as m easured and
predicted
by
th e tw o-d im en sio nal th eory [C 9]
A ppe nd ix C
C-36

7/26/2019 1992djatmikophd.pdf
http://slidepdf.com/reader/full/1992djatmikophdpdf 439/507
Fie.14.
Pre.. ure cum.:
III • 481,
nonancn
•00(\ 0( (.,
_l':'~(:_ _
0...... _I.
;.»
.
: ; 0 . . . .
.c..._-::,_-1-~----7'c_--::O '
4
. .
10
o
Fie. n.
Pre.. ure cvrve.:
III •
2 1 1 1 ,
1
1
.,
In.nancn
J
OO[l MOV[M[WT
r.u
'SlC
---o:-...
;r.-- -
10
70
Fie.
IS. Pressure curve': m •
481.
1
1
.z
In.nange•
,.
I--tO·.r----i
T
. . .
- :.
L . .- ' ; _ _ _ _ J j _
. . .
t - ~=- - - - - - ~~~~~~- ~~~- - - - ~
IO
. .
-
r - - C~- - - - - - ~~~~_ ~~~~o
aN
FiC.17. Pre.sure curves: m • 287.3 In.(lances
Figure C 2.14. V arious pressure curves w ith and w ithout flanges attached on
th e fla t-b otto med m od el [Cll)
A pp en dix C
C-37

7/26/2019 1992djatmikophd.pdf
http://slidepdf.com/reader/full/1992djatmikophdpdf 440/507
'. .
' . . .
'00
'
. .
100
10
to
00
HI
. . . , . ,
. . . . . . . . .
,
\
--- ~ '''I '
'\ H
\
,
F ig ure C 2.1 S. P re ssu re-tim e cu rv es as
measured
and
'P re dic te db y th e e nh an ce d two-d imen sio na l th eo ry [C ll]
~- 50~- - - - ~- - - - ' - - - - - - r - - - - ~- - ~r - ~
~ LAYER THEORY nsr
NOLAYER - •
121mm 4
25.4mm ------
. . . . . . . . . . . .
. .
~ . . . . . . . . . . . . . . -
. . . . . . . .
-----
. . . .
~. . . . . . . . .
- - - - - - - ~
. . . - - - _
.......
•
~-40
~
....-30
e
< t
I-
-20
o
~
~ -ID
>(
~
O~~~ ~~~~~~ ~ ~
5.0 7.5 lOO 12.5 15.0 17.5 20.0
O RO P HE IG HT (cm)
F igu re C 2.18 . C om pariso n of pre dicted a nd m ea su red
m axim um im pact acceleration of nat plate [C 13)
Appendix
C
Figure C 2.16. D iagram of descending flat plate and w ater
s urfa ce [C13 ]
40~~- r , - ~~~~~rq~~~r , - - . - - r , - ~- r , - ~
.
~ 20
2
«
. i o~-------.
~
. . . .
~ -20
<t
1 0 1
~- 40
.J
a.
Figure C2.t7. Typical plots of im pact acceleration for nat plate
(d ro p h eig ht = 7.S in .) [C13]
C-38

7/26/2019 1992djatmikophd.pdf
http://slidepdf.com/reader/full/1992djatmikophdpdf 441/507
z
o
H
~-30
a:
UJ
_J
UJ
~-20
et
. . .
U
~ -10
x
H
DROP
HEI GHT THE~Y TEST
S9.iCii - -.-
15.2cII
SS.2cII -
7.&e1l -
O~~WWL- ~~~~~~~UW~
1 10 10
2
10
3
10
4
I NI TI AL YOUNG' S MODULUS ( k Pa)
z
o
H
~ -30
a:
UJ
_J
UJ
~-20
et
. . .
U
~ -10
x
H
DROP
HEI GHT THEORY TEST
19. iCi - -;-
15.2c. •
U.2clII
7.Scli
•
OL- ~~~~~~W~LUUW~~~W
1 10 10
2
10
3
10
4
I NI TI AL YOUNG' S MODULUS ( k Pa)
Figure C2.19. Initial Young's m odulus of elastom eric layers vs
m axim um im pact acceleration of flat plate [C131
( a) la ye r th ic kn ess = 12.7 m m: (b) l ay er t hi ckne ss = 25.4 m m
Figure C 3.1. R epresentatio n o f w edge p en etration [C I4)
f
•
, J-_~
,..I' ,....,
,
. . . . . . . .
,. .
. . . .
• r l. J . .
,-y:
,,~ . . . .
' . . . . . . . .
l-
f---=t.1
_
. . . . . . . . . . . . . . . . . . . .
'F=.-
~I~
. : ; _
..
L:;7
i'.'•••'
r::;;: I~,
.
..
. .
•1..•
.•.-t...,
I
.,
I
i
I
i
. . . . . - - ,
(.r) Model.. I 'l s.de, de..trl... .1.
... n' . t
I ,
. . . . . . . . . . . . . .
,
f
~~~~L-~~~~~
........ ,..... ...... ' •••• 1'
I ~l •
•I.. •••••• 1-1--
;'
,
. . . . . . .
'
I
i
~--t-+-+--t-:.,..._~.+-I-f-
.
. . . .
II IIU . tll .
UC-U. ,.un'.'
. . . .
,
c . ) Model whh l-defl d •• d.i .. Inlli.
......... 1 ...... '
(ol) Mod.1 wi.h ,.d•• d••d,l ... nfll.
Figure C3.2. Experim ental results of m axim um im pact pressure due to
slamming of rigid wedge-shaped models [C14] .
Appendix C
....... , .. 111('
CA) Mod.1 whh lO·d.1t d • • d.i ••• nltl•
I
• • N . ' . . . . . .
a ,
. . .
,,,.
h .
j .. •
.
.
~.
~
•
~
._ .
rl•
. 11 e
I
I . . • ' . . ' : '
J..--
~
.I-~
,j----,
~
tt.
un. tn .. t. .
th.... _ullll,
i
•
I
I
I
i
C-39

7/26/2019 1992djatmikophd.pdf
http://slidepdf.com/reader/full/1992djatmikophdpdf 442/507
I
l
i
I
j
(6) Pt.IOUt ••• 1e ,,1
Figure C 3.3. M axim um im pact pressure due to rigid-body
slam ming of w edges vs im pact velocity [C14]
Figure C 3.4. Test results for 6-foot drop test of to-degree
d ca drise m od el [C 16 ]
Appendix C
C-40

7/26/2019 1992djatmikophd.pdf
http://slidepdf.com/reader/full/1992djatmikophdpdf 443/507
- - - - - - - - - - - - _ - _
-9
-4
~
na
. J . .A r t B . .
TEST
. .
N O LA YE R
•
e -3
N O LA YER
•
~-7
I
. .
12.7mm
. .
12.7mm
. .
Z5.4 mm
Z5.4 mm
9
•
Z
9
~
9
1
~
. .
ti
•
f f i
-5
•
f f i -Z
oJ
i d
I
IA l
0
. .
•
0
~
. .
~
1 3 -3
•
t; -I
I
~
. .
it
~
. .
~
•
X
X
~ -I
cl
0
~
~
( a )
+I~--~~~~--~~~~--~--~
5.0 7.5 10.0 12.5 15.0 17.S 20.0
DR OP H EIG HT
(cm)
( h )
+II....,.--. ,L,,--_,I...,,_--....I.....:_.....J'---...I--~
5.0 7.5 10.0 12.5 15.0 17.5 200
DR OP H EIG HT
(cm)
- Z' O~- - , _ - - ~- - - - ~- - ~- - - T- - ~
(c )
z
.J..Ar.t..B_
rm: •
--l5
NO LAYER
•
12.7mm
•
•
•
z
Z5.4 mm
•
•
0
t= ; -1.0
I
f f i
•
..J
IIJ
•
-O.S
I
cl
. . .
U
~
0
~
,.(
cl
~+O.5
+I.O~--:~ __ ~ __ _..._
_L__
..__..J
5.0 7.5 10.0 12.5 15.0 17.S 20.0
DRO P H EIG HT (cm)
Figure C 3.S. M easured m axim um im pact accelerations of w edge-shaped bottom s [C l3]
(a) deadrise. 6 deg.; (b) dcadrise -10 deg.; (c) dcadrise .. 15 deg .
..
-_._-_.
z
. 500
<
a:
. . . .
' 000
J')
0
a:
u
z:
500
0
- s a o
- ' 000
- ' 500
- 2 00 0
0
60
0
T I M E
'HSEC)
' s i - ~ - - - - - - - - ~ - - - - - - - - _ +
I :
'1---+-1+-t
o
20
( a>
20
0 60
T I HE (H SEC
(b)
Appendix C
Figure C 3.6. Slam m ing drop test on stiffened alum inium m odel; H =8.0m .
symmetric al p ositio n. (a ) P re ssu re sig nal.
(b)
p la tin g s tra in [C I8 ]
C-41

7/26/2019 1992djatmikophd.pdf
http://slidepdf.com/reader/full/1992djatmikophdpdf 444/507
ApptnduC
,-,,rr--- Stoqno',on
line
I)-ZI
~=------L.
F ig ure C3.7 . A n imp ac tin g wed ge lC20]
-
-
l<
•
D
-
. .
Cl<
: : : >
'
'
-
. .
Cl<
Q
M
•
c
::II
...- ... IAC.CI [0. (2.l)
~ PATI I C [ 0. ( 2 . 2)
6 JESTS AL. IIOttL
. . .
.
.,
...........
: :
:
: ~
.
· ;,'
. . .
.
,
.
· .
.';'
••• 0 •••••• : •••••
_o ••• ~ • • o ••••••• ~;~ •..-: •••••• : •••••••••••
.
. . .
,
, .
. . .
·
.
.. .
.
:
~;,
~ .
'
.
,,
-~------~------------~------~ _J
•
2
•
, • to
DR O P HE I C HT
( w)
F igur e C3 .S . Maximum recorde d p re ssur es p lo tt ed a ga in st d ro p h ei gh t [CtS ]
C-42
7/26/2019 1992djatmikophd.pdf
http://slidepdf.com/reader/full/1992djatmikophdpdf 445/507
A ppen dix C
32r - - - - - r - - - - - r - - - - -~- - - - . _- - - - , _- - ~
8
16
Half Br.adth in inch ••
F igure C4.1 . O ffs ets o f V - fo rm mode l and p re ss ur e tr an sduc er
locati ons [C22)
100
.S
r d -
. 1 , •
I-
~
I
6.
1<,,1 Gaq, •
_ Jj
~/
0
Ga9.locatian 2 * in.Outboard
: l f f j
Ga9' location ... il\ Outboard
l)
I
· - · f
GCIQ'location 6· in. Outboard
V
I
I
J
_L
I
I I
I
I
_i f .
p.evo
/
~
J
}1
V
/
V
I
:;
~J
~
·
•
t-
.
I
V
' { )
t- ? r
.
t- l
-
I
~~
._ 10
:
•
~
. .
.
C L
. .
i
C L
1.0
o
0 .1
10
V,'ocity, Vo in
'VleC
10.0
Figure C 4.2. Peak pressure as a fun ction of im pact velocity fo r
a V - Io rm mod el [C 22]
24
100
C-43
7/26/2019 1992djatmikophd.pdf
http://slidepdf.com/reader/full/1992djatmikophdpdf 446/507
. 92 . ... W L.
SS....WL.
SI,....WL .
• 'I'\.WL .
•~3'\,WL.
, ., . .. .w L.
m WL.
3 WL.
a
L....
t.
,
. .
P_regouge
F ig ure C4.3 . D ro p tes t mod el an d p ress ure g au ge lo ca tio ns [C 23 ]
-
j p . o j
•0
.ct :'oo ~
-
.01.
n
+ :
lime of enlry al
undislUfb~
wal.r .urface
. . . . .
Impulsi . Pre •• ur.
~
0
45'
•
40
•
30'
. .
22.S--
•
15'
~ ig ur eC4 .4 . D rop te st r es ult o f in clin ed s ec tio n mode l a nd
10 10 20 30 40 50 60
~rnparison with
peak
pressures
by
Wagner 's th eo ry [C23] _Ideo.)
i
Figure C4.S. M axim um p ressu re on the flare part vs im pact angle [C 23]
\
~
j
i
I. • • 10
vtRTlCAL IMPACT V£LOCny v, '''
RUN' 171-ItJA
~L'WEIGHT
.....Noro ..OPI
UAllle
R'GID
PRESSURE GAGE
LOCATIONS
TIST (SULT
IRIG'D
HOR. VIL.
0
, KNO TI
b-
II
D
II
0
III
0
15
0 30
0
JS
V
. .
0
• •
Appendix
C
F ig ure CS.t. M ax imum imp act p ress ure d urin g c alm -water impa ct o f 3 -D ,
1 0 d e g mod el w ith 6 d cg trim a nd v ario us h oriz on ta l v elo citie s [C 25 ]
C-44

7/26/2019 1992djatmikophd.pdf
http://slidepdf.com/reader/full/1992djatmikophdpdf 447/507
APPENDIXD
ON THE DESIGN OF A MULTIPLE·ANGLE
SWATH DROP TEST MODEL
I

7/26/2019 1992djatmikophd.pdf
http://slidepdf.com/reader/full/1992djatmikophdpdf 448/507
APPENDIXD
ON THE DESIGN OF A MULTIPLE-ANGLE
S\VATH DROP TEST MODEL
Abstract
T h« p re lim in ar y d es ig n o f a d ro p te st m o de l o f a ty pica l b as ic c on fig ur atio n
o f S W AT II sh ip fo rw ard s tru ctu re is de scrib ed in th is re po rt. S tru ctu ra l d es ig n
o f the m ode l w hich in clude s tile de te rm in atio n o f b ot/o m plate th ickn ess an d
s tiffe ne r s iz in g is e xp la in ed . S tr uctu ra l c he ck a ga in st vib ra tio n al e ffe ct d ue to
slamming is m ade . Specific features o f the m ode l pertin en t to SW ATH 's we t
d ec k c on fi gu ra tio n a rt d es cr ib e d a lo n g w it h t he i ns tr umen ta tio n t o b e app li ed .
DI. INTRODUCTION
It is reported from practical experiences with at least two full-scale SWATH
ships, i.e. the SSP Kaimalino and the Frederick G. Creed [Dl,D21, that wet deck
slamming which occured during their sea trials could seriously damage the bottom
structure. Further, slamming load is believed by some to be one of the most important
governing factors in the SWA TIl structural design, especially for smaller vessels, as
highlighted in ref. [D3]. In order to gain more information for efficient design well
calibrated SW A11 I slamming pressure data is, therefore, required. Despite this urgent
need it appears only four institutions [D4-D71 have so far attempted to generate
slamming data based on SWATIl model tests. The accumulated data from these
sources, however, remains inadequate to formulate an acceptable approach to predict
slamming pressures which can be readily adopted for design. Further slamming data is
therefore sought from drop tests in the near future.
This brief report contains the description on the preliminary design of a drop test
model of a typical basic configuration of SWATH ship forward structure. This test is
organised in a collaboration between the University of Glasgow and Yarrow
Shipbuilders Ltd. (YSL) [D8]. The former will be responsible for constructing the
model and for data analysis, white YSL wi1lprovide the test rig and site facilities.
Initially three small models, i.e. the model of the
Victorious
(T-AGOS
19),
Patria
and the Fishing S\VATH MV
Ali,
were proposed to be fabricated for the test
programme. Itwas later to construct only one slightly larger model which would allow
different impact angles to be tested and observed. This idea was based on experience
App en dix D
D-I

7/26/2019 1992djatmikophd.pdf
http://slidepdf.com/reader/full/1992djatmikophdpdf 449/507
gained from drop tests recently conducted at OnV [07]. During these tests the
m axim um im pact pressure was not found to occur on flat bottom m odels but rather at a
sm all tilt angle of approxim ately 5 deg [07]. This finding apparently confirm s that
reported in ref. [09].
The drop test to be carried out at YSL will of course be sim ilar to those conducted
previously by others (for instance ref. [09,010]). H ow ever. peculiar features inherent
to the
SWA TIl
configuration such as the presence of haunches w ill be introduced at a
later stage of the tests. The overall arrangem ent w ill be attem pted in such a way so that
s lamming cha ra cte ris tic s o f SW A 1 1 - 1 c an b e re aso na bly a cc ura te ly simu la te d.
D2. DESIGN IMPACT PRESSURE
The m axim um im pact pressure expected to be im posed on the m odel is derived
based on the m axim um im pact velocity of approxim ately 3.0 m ls w hich corresponds to
the drop height of about 2.0 feet. From various data of drop tests available elsew here
[D9-DI2] the m axim um im pact pressure generated under that m agnitude of velocity
could reach as high as 275 kPa (40 psi).This pressure value is adopted throughout the
design of the drop test m odel now described.
D3. nOTTOl\1 PLATE DESIGN
D3.1. Determination of Plate Thickness
The bottom of the m odel w ill be assembled by welding two pieces of steel plate
(size of lOOOx750m m each) w ith 160 deg inclining angle one to another. A stiffener
will be attached transversely at the m idspan of each panel to provide reinforcem ent on
the bottom structure as shown in the technical draw ing in the back pages. The bottom
plating of the m odel (a=l000m m. b=375m m and a=2.67) is designed to avoid yielding
and checked against C larkson's various plate design criteria. The design pressure P d is
as given above (275 kPa), the safety factor required is 1.5 and the panel is designed
using plastic collapse criteria. which further should satisfy the plate slenderness
param eter ~ S 2.5. This plate slenderness param eter is given by the follow ing equation.
b r a ;
P=T.JIt
(01)
By assum ing that the edges of the panel are rigidly clamped. the ultimate pressure
Apptnd i: c D
0-2

7/26/2019 1992djatmikophd.pdf
http://slidepdf.com/reader/full/1992djatmikophdpdf 450/507
P3h(=1.5Pd> to cause a 3-hinge collapse on the long panel can then be written as
(D2)
Substituting the panel width b=375 mm, the typical yield stress of material
O'y=245 N/mm2 and the modulus elasticity of material E=207 kN/mm2 into eq. (D2)
plate thickness of 7.25 mm is obtained.
A
value t=10mm was finally chosen for
unsupported panel which should then provide a reasonably rigid structure so that any
vibrational effect due to slamming is eliminated.
A further evaluation is then made towards the selected plate thickness as follows.
Substituting the plate thickness t=lOmm into eq. (01) the slenderness parameter Pis
found to be 1.29, which is less than the maximum allowed as above (=2.5). Using this
value and assuming that there will be some initial deflection given by
3 p ; .
-=02
b ay
(D3)
(which is about 55% greater than expected than mean value 0.1 p
2
t) then the pressure
parameter to cause further yield Py of approximately 2.0 is obtained from the data
sheet. Where
(D4)
From this equation py=580 kN/m2 (=2.10Pd) is obtained, which is a satisfactory
margin for a safe panel design.
D3.2. Natural Frequency Calculation
On the evaluation of vibrational characteristics the natural frequency of the model
rectangular bottom plate, with assumption of all edges being clamped, is determined by
[013]
' \ [ ] 1 / 2
\,.. Et
3
r _ lJ
ij- 2na
2
12 ') '(1 _
\)2)
(D5)
A pp en dix D
0-3

7/26/2019 1992djatmikophd.pdf
http://slidepdf.com/reader/full/1992djatmikophdpdf 451/507
in which fij is the frequency at ijth mode, i is the num ber of half w aves in mode shape
a lo ng th e h oriz on ta l a xis, j is the num ber of half w aves in m ode shape along the vertical
axis, ( is m ass per unit area of plate and
v
is P oiss on 's ra tio .
A ; j is a dim ensionless frequency parameter and is generally a function of the
boundary conditions applied at the edges of the plate panel, aspect ratio
Cl
and in som e
c ase s Po isso n's ratio v.
For a rectangular plate of aspect ratio
2.67
in th is case, the constant A . i j values
m ay apply that for general plate w ith aspect ratio of 2.5, as g ive n be low s.
1
147.80
Mode S eQu en ce
2 3
173.90 221.50
4
291.90
5
384.70
6
394.40
Substituting the values of A ; j and other param eters into eq.(D 5) the follow ing natural
fre qu en cie s fo r d iffe re nt mo de s
are
obtained.
Nat. freq. (cps) :
f1 1
363.0
N atura l F re qu en cy M o de s
f21 f31 f41
427.0 544.0 717.0
fS I
945.0
f1 2
969.0
Hence the resonance vibration on the plate could safely be avoided as those
natural frequencies for various mode of plate vibrations are much larger than the
frequency of exciting force due to slam m ing im pact, w hich ranges betw een 20 upto 50
cps.
D3.3. Stiffener Sizing
On the design of the siffeners a sym metric trapezoidal pressure loads as show n in
Fig. 01
a is applied . T he m agnitude of the to tal load
(Pt)
can then be approxim ated by
(06)
The equivalent uniform load distribution (w ) acting on the beam , as shown in Fig.
01 b, is then w ritten as
Appt,.di~ D
0-4

7/26/2019 1992djatmikophd.pdf
http://slidepdf.com/reader/full/1992djatmikophdpdf 452/507
b
P,
pb(a - 2:)
w=-a-= a
or
W
= P { I - 2b
a
) = O . 275x375 ( I - 2;{~)
= 83.79 N/mm
(D7)
By assuming that the beam is simply supported at both ends, the maximum
bending moment at the midlength of the beam, as shown in Fig. DIc, is calculated by
M
_ wa
2
_ 83.79xlcxxT
- 8 - 8
= 10473750Nmm
(D8)
Using a safety factor of 2.0 against yield, the allowable stress is derived as
(fallow = 245/2 N / m m
2
= 122.5 N / m m
2
•
lienee the required section modulus can be calculated by
___;_M_= 10473750
Zreq
= o
1 22. 5
allow
(D9)
=
85.5
cm
3
A tee steel profile provided from a mid-depth cut of a standard universal beam size of
203mm
x
102mm, with an effective panel width of 375mm gives a section modulus of
103 cm
3
is selected. The calculation to this section modulus is given in Table Dl.
Having determined the size, the actual allowable stress of the stiffener is found to be
10473750
N
I 2 -
101 ON
I 2
o actual
=
103696 mm -. mm
which provides a safety factor against yield of
245
SF
=
101
=
2. 42
A pp en dix D
D-5

7/26/2019 1992djatmikophd.pdf
http://slidepdf.com/reader/full/1992djatmikophdpdf 453/507
D4. DESCRIPTION OF TIlE l\10DEL
The drop test model will be constructed out of three major components, namely,
the steel box, the supporting web frame and the sliding frame, as shown in the technical
drawings. Most of the components will be fabricated using 10 mm thick steel plate
which yields to an overall model weight of approximately 775 kgs. The dimension of
the steel box will be 1500x1000xlOOO mm with 20 deg ramp angle at midlength of the
bottom. A top lid (steel cover) will be added to ensure no water spray can spill into the
box which may damage to the electronic instruments mounted inside. Another stiffener
made of a prefabricated steel profile (size of T 102mm x 153mm) will be welded
transversely at the midlength of the bottom plate to give an adequate rigidity on the
connection of the two bottom plate sections. The sliding frame, as can be seen in the
drawings, will simply be fabricated by welding 10 mm thick steel plate to form a
rectangular column of size 1400x200xlOO mm mounted onto the top flange of the web
frame. The two ends of the frame will be attached to the vertical steel column of the test
rig available at the drop test tank.
As is mentioned in the introduction the model is designed to allow different
impact angles to be investigated. For it to work the arrangement is made in such a way
so that one end (in this arrangement the aft end) of the model is fixed and the other end
(fore end) is free to move up and down. The aft end of the model which will function
as a hinge is fixed to the web frame by two aft pins at both sides of the model through
the aft pin supports (see drawings). The fore end of the model is connected to the web
frame by the detachable pins at both sides through the pin supports. To change the
tilting angle of the model, the fore pins are detached followed by positioning the model
in a desired impact angle and then replace the pins in the prescribed slot as depicted in
the drawing of detail 1.There are seven pin slots are provided which corresponds to the
tilt angles of 0,2,4, 5, 6, 8 and 10 deg. While the two pieces of the bottom plates
having 160 inclining angle one to another, hence there will be 14 variations of impact
angles between 0 and 20 deg can be investigated. Further, such an arrangement allows
two impact angles to be measured simultaneously by pressure transducers located on
the two faces of the bottom plate at each run of the test. For example when the model is
tilted down by 2 deg this means the fore portion of the bottom plate will decline into 18
deg towards the horizontal plane (water surface) whereas the aft bottom plate will rise
up by 2 deg, and so on.
The design of the fore and aft pins is done by using the force-area correlation. As
is seen in those drawings the pins are subjected to forces acting perpendicular to the
pins axis, hence the pins need to be designed to resist shear forces. The force-area
relation in this condition is written as
A ppendix D
D-6

7/26/2019 1992djatmikophd.pdf
http://slidepdf.com/reader/full/1992djatmikophdpdf 454/507
FI
't
=-
allow 2A
(010)
where tallow is the allowable shear stress of the material, Fs is the shear load and A is
the sectional area of the pin. The factor 2 on the right hand side of eq. (DID) is
introduced due to the fact that the pin supports and the web frame resist the load in
opposite direction thus creating two shearing surfaces on the pin. The average shear
stress properties of a material (t
ave
) is related to the yield stress in tension (ay) by
factor ofO.S upto 0.6 [D14]. The allowable shear stress in turn is derived by applying a
design safety factor to the average shear stress. In the present pin design a safety factor
of 2.0 and the worst possible average shear stress (O.Sa
y
)
are selected to produce an
allowable shear stress value of approximately 61.3 N/mm2. The design load for the
pins is taken as the maximum force generated by the maximum slamming pressure
acting on the flat bottom plate. It is assumed that the maximum force is evenly
distributed among the four pins and hence the load on each pin is found to be
S1.6
kN.
The diameter of the pin is then obtained using eq. (010) and is approximately 23.2
mm. Rounded up the value the final pin is selected as having a diameter of
1
inch
(2S.4
mm).
DS. SPECIFIC FEATURES OF THE SWATH DROP TEST MODEL
The proposed drop test is chiefly aimed at generating slamming pressure data
pertinent to SWATH ships. It is, therefore, necessary to formulate the model geometry
which represents specific features of SWATH underdeck configuration. Among other
geometries which characterised a typical SWArnunderdeck structure are the presence
of ramp angle. haunches and the struts. Ramp angle. as is applied to other twin hull
crafts like catamaran or SES, is widely believed to be one of the mechanisms which
could induce a reduction in the severity of wet deck slamming. Nonetheless, optimum
ramp angle for a particular vessel remains uncertain to the designer. Probably relative
impact velocity. which obviously should have taken into account the forward speed
effects, is the best parameter to be associated in the selection of ramp angle for wet deck
design. Observation of different angle of impacts on the model as is clarified in the
previous section can be directed towards the exploration of effective ramp angle to be
implemented for SWATHs.
The application of haunches on SWATHs is primarily designed to increase the
strength at the intersections of the struts and the cross deck which are vulnerable to the
side force. To a certain degree haunches are also expected to render beneficial effects to
the problem of wet deck slamming. The potential of haunches in reducing maximum
AppendixD
0-7

7/26/2019 1992djatmikophd.pdf
http://slidepdf.com/reader/full/1992djatmikophdpdf 455/507
slamming pressure may be sought from the aspect of the increase in vertical damping
due to the surface water disturbance before actual slamming is imposed on the flat wet
deck. The deflected water surface and the water swell up could further compress the air
into the middle of impact space thus creating an additional cushioning effect to the flat
bottom. The drop test on the model with haunches attached will follow after the plain
bottom test is carried out. Comparison will then be made between slamming on plain
flat bottom and bottom with haunches. The assembly of the prefabricated haunches
onto the model flat bottom will be arranged as shown in Fig. D2.
The possibility of impact pressure reduction with the presence of struts is quite
obvious. In case of SWATH bottom slamming the struts will behave like two side
walls which impede the transverse air flow beneath the wet deck thus providing an air
cushioning effect to the bottom structure [Dll,D15,D16]. The experimental set up
incorporating the presence of haunches and the struts is as sketched in Fig. D3. When
the model is tested without the haunches mounted the struts (side walls) will then
function as a boundary which will induce the 2-dimensional flow simulation as required
in item A of ref. [D8].
The main instrumentations to be employed in the drop test are as depicted in Fig.
D4. Impact pressures will be measured by means of 16 pressure transducers located
along the bottom plate. The positions of the transducers are arranged in such a way so
that the pressure distribution at any mode. i.e. in flat bottom or in tilting angle modes,
can be aptly recorded. In addition. the measurement of the pressure induced bending
stresses on the mid-span stiffener will also be taken. Two locations will be
investigated, that is. at the mid-length of the stiffener where maximum stress is
expected and the other near the edge. For this purpose strain gauges will be mounted on
the flange and the base of the stiffeners. In this way the average distributed load on the
bottom panel can be estimated.
D6. CONCLUSION
The design of the SWATH drop test model has been described within this report.
An attempt has been made to produce model that would reasonably simulate the
slamming characteristics of SWATHs. Detail arrangements. however. remain to be
fixed and alteration to the model will be made if necessary after a confirmation and
further considerations are given by Yarrow Shipbuilders Ltd.
AppendixD
D-S

7/26/2019 1992djatmikophd.pdf
http://slidepdf.com/reader/full/1992djatmikophdpdf 456/507
REFERENCES TO APPENDIX D
Dl. Hightower, J.D. et al, SWA TIl Technology Development at the Naval Ocean
System Center ,
Proc., Int. Conf. on SWATH Ships and Advanced Multi
Hulled Vessels,
Paper No. 14, RINA, London, U.K., Apr. 1985
D2. Pegg, N.G., Gilroy, L.E. and Cumming, D.W., Load, Motion and Structural
Response Trials of the SWATH Vessel 'Frederick G. Creed' t t , Proc., Symp,
on the Dynamics of Marine Vehicles and Structures in Waves, IUTAM, Brunel
University, U.K., June 1990
03. Loscombe, P.R., Key Aspects of the Structural Design of Small SWATH
Ships , PhD Thesis, Univ. of Southampton, Dept. of Ship Science, U.K., 1989
04. Graham, R., Slamming Experiment with a Radio-Controlled SWATH Model ,
Proc., Int. Conf. on SWATH Ships and Advanced Multi-Hulled Vessels II,
Paper No.9, RINA, London, U.K., Nov. 1988
05. Sikora, J.P. and Dinsenbacher, A.L., SWATH Structure: Navy Research and
Development Applications , Marine Technology, SNAME, Vol. 27, No.4,
pp. 211-220, July 1990
06. Djatmiko, E.B., Comparative Evaluation of Some Slamming Prediction Methods
for SWATII Type Vessels ,
Department Report,
No. NAOE-91-14, Dept, of
NA&OE, University of Glasgow, June 1991
07. Hayman, B.,
Haug,
T. and Valsgard, S., Response of Fast Craft Hull
Structures to Slamming Loads , Proc.,
lst
Int. Conf. on Fast Sea Transportation
(FAST'91).
Trondheim, Norway, June 1991
08. Djatmiko, E.B., Slamming Drop Test Programme , Notes of a Meeting Held at
YSL, Oct. 1991
09. Chuang, S.L., Experiments on Slamming of Wedge-Shaped Bodies ,
Journal
of Ship Research, SNAME, Vol. 11, No.3, pp. 190-198, Sep. 1967
010. Chuang, S.L .• Experiments on Flat-Bottom Slamming , Journal of Ship
Research, SNAME, Vol. 10, No.1, pp. 11-17, March 1966
011. Lewison, G. and Maclean, W.M., On the Cushioning of Water Impact by
Entrapped Air , Journal of Ship research, SNAME, Vol. 12, No.2, pp. 116
130, June 1968
012. Sellars, F.H., Water Impact Loads ,
Marine Technology,
SNAME, Vol. 13,
No. I, pp. 46-58, Jan. 1976
013. Blevins, R.O .• Formulas for Natural Frequency and Mode Shape , Van
Nostrand Reinhold Co., 1979
014. Gere, I.M. and Timoshenko, S.P., Mechanics of Materials , Van Nostrand
Reinhold (UK) Co. Ltd., UK, 1987
015. Verhagen, I.H.G., The Impact of a Flat Plate on a Water Surface , Journal of
Ship research, SNAME, Vol. ll,No.4, pp. 211-223, Dec. 1967
016. Ando, S., Cushioning of Slamming impact by Elastomeric Layers , Journal of
Ship research.
SNAME, Vol. 33, No.3, pp. 169-175, Sept. 1989
AppefldixD
0-9

7/26/2019 1992djatmikophd.pdf
http://slidepdf.com/reader/full/1992djatmikophdpdf 457/507
II'
~,
~
~
In
r - - -
M
I'
i'\
v I '
A
~
,~
/_
187.5
a)
b)
c)
w
/
,
,
~ ~
,~
,~,
~ ~
,
~
~
a=1000
,4.
~
. . .
Figure 01. Panel stiffener design
AppendixD
STEEL BO X
- - - - - - - - - - - - - - - - l I
P RE FA BR IC AT ED H AU NC HE S
Figure D2. Haunches assembly
0-10

7/26/2019 1992djatmikophd.pdf
http://slidepdf.com/reader/full/1992djatmikophdpdf 458/507
AppendixD
-\
\
\
-~----
\
\
\
,
I
I
I
I
- I
I
I
I
I
I
~~-----~'-- I
_
§
-
e
----)~
D-l1

7/26/2019 1992djatmikophd.pdf
http://slidepdf.com/reader/full/1992djatmikophdpdf 459/507
a)
S T I F F E N E R
S/G = = Stra in Gauge
P I r . . P r e s s u r e T r a n s d u c e r
b )
----fl.
/
; P ITS
. .
.
.
.
.
.
.
.
.
: . r r r . .
.t
. .
.
.
.
.
If ••
1 T 1 p r r 2
r n
p m : PIT13 FIT14::
• - . - 1 . - • •
t A - - - . _ --I....:__
:: mt . rrl0 ::
I • .,
f'
It
/
::
. .
t
,t
ITJFFENIR = : ~ .
PIT8.·. PlTf 1 : . : :
14 .:
. .
t ••
. .
. .
t'
I'
t. t'
., .,
I' ..
•• _f
It
•• It
1 1
PIT9 PIT16 ::
. .
.
.
t'
.
f
. .
f
of
.f
. .
f
of
.,
.f
.0
. .
.
. .
f
. .
.
AppendixD
,rru
Figu re D4 . Basi c instrumenta tion a rrangement
D-12

7/26/2019 1992djatmikophd.pdf
http://slidepdf.com/reader/full/1992djatmikophdpdf 460/507
oo>O <t
00
e- e - -
>0
~
M
>o 'r;:
00
M
'
M M < t
<t.
I:::
Mr - : o:
0
-
-0
K
>0
V)
'
r-
0.
'+
<t <t00
r-
M
>0
U
r;:-M
-
S
M
M 0
~
O;::;:t
>0 M
-
V) 00
o o g o o
Jl
II II
- 0-
--
~~
t
M M
<
<
M~~
E
E E
'
~ ~
E
E
E
:::
K
- ';0 ';:(
-
'
NN
r-~
.500
N
V)
M~r-
= :-
~ ~
M r-
V)
l i ':oO
et :
r
Z
F t
0
. . .
0
c : :
,£
~ <t>O
i:3-
S~
mt:
OMO
0....
u
~ <t
- 5 > (
K
- b~
-
~8
M;1,
mM
. 9 ( 3
::I'e
~o~
8
M
b
~~
~-
0-
r-
V)
< t
et :
. ~ ~
\ 0
f )
C '
c : : ~
:
~~
~
00M
00
·8,8
r- 0\ 0 r-
oo >0 -
>0
O
< t
U( 3
-
-
~
E
8 ' ' ' ' ' '
, lJl
-0
_ 0-
0>
9
.n:g8
E E
S ' g
.2
E E
-
- ';:(
'fa-
s
.0<
3~
et:z
._
z
>-
u,_
>
>-
Q~
IN
8 \ 0
00
~
\ 00
E ~
oo\i
. . , .
<
' r-
r-
E
r-..,.
-
§
M
VI
0
-
et :
~
E - e
8
00
~
E
M M
ci~o\
-
- 0-
-
-
0
E
8 ~~
~
,vi :
er-
0
_M
-
'
-MM
-
- -
~ ~
V) V) V)
AppendixD
r
. .
. . .
.. J
,
~
£q
. . .
Zq
-
Iq
~
<
I~~
I
I
-r-r-
I
I
4 1 '
I
I
I
~
I
I
f : J
:
..-
I
-
,
C ' : l
>.
hi
\
I
I
N
I
I
. . . :
I
L J -
U
0
I
_L..-
til
I
C ' ' I
I
..J
I
\
o)
z
Cl)
I_L..-
\
D-13

7/26/2019 1992djatmikophd.pdf
http://slidepdf.com/reader/full/1992djatmikophdpdf 461/507
.'
1400
... .
§
-
+--rnr------+-------::-----t
, ~ i SLIDIN G FR.A ME · ·· ..
: ; · I
: I l l SUPPOR.TING W E 8 f RA M E - _ j~:
.
SO
l l ' i l
I ,:.,
/ .. pI N 0 . . 2 5. 4
I
P I N 0= 25 .
l:
.,J:-r
I•••.R ;§j.... I . _- I- ,
_i_'~ . I ••••~ 00i:
T'- , 1 · · · · · · · · · · · · · · · · · · · · · · ; f t :· · · · · · · · · · T r ~ I U · · r t f u · · · · · · · · · · . .. .. .. . .. .. . ~l '
~ I \
0
+
0 I
I I REMO~ABLETOPCO~'t~cx ~SUPPORTS
J .
~
• ~ I I
I N OR E P IN SUP PO RT S
I'
AFTPINruI 'PORr~
i
I
I I
I I '
§l
i. LJ
I
I
I
'.
AfTPtNS{JPPORT
'~
. . . .,
,
R A M P L IN E I
.... .
MID.BOTIOMSn~
.//' (T
102x153)
' - _ .
STIFFENER.
e r
10~x101)
M I D· B 01 T OM S TI ff E NE R .
e r 10 -xlS3)
.
'.
STIFFENER.
(T 102xlOI)
<,
+
l o b o
I S O O
I
t
ELEVATION
AFT
50
FORE
PROfILE
y
1 + ' , _
Y . O d e
g
15 0
--~--.-
100
I O I
lISa
S O S O
100
- . - - ~ r E '
,,: ;::;; ::;F?i':~~:~,,:;; ':;'
~ i : : l ~ ~. : : ; ; : .
: , q ; ~ 4 ' i ; : T : : ' : ' : , , ,
e t
---
. f J ' . : : • • • _ .. .. • • • • • • • • • i
t t - I
l '. SUPPORTIl 0 : 'ES FR.At.(E • ......':
i PtN·O.lH n _ / _ ' / P( llO~~. :
-+
_talO
:' H LlDlNO fRAME ~
, ,.
..
+ , d ~
I
, _LD_
1 ' ~J6deg
:-'j
:1
·+.'Sd . ......
I ~, J
,I I
+'
4deg
· · · · · · ·. d X ~ : · · · · · · · · · · · · · - · · · ,
. I •
I ,I I 0.25.~
. . . . . . . . . . . .
.........
. .
j ~ : ~ : ' ± : :
.
TOP COVER
SUPPORT
. , . -
,
S T I F F E l ' - < E R
(T
102X10li
--f-_1 - - + - - la -00-+--
I
I
/
STIFFENER
e r
102x101)
I . . . ~ : . . .
I I
TT
I
ISOO
DETAIL 1 (Scal~. I:
.S )
POSIT IONS O f P IN SLOT AXIS
TiltAnsleXunml Y (DUn)
o deg 100.00 0.00
2 dtg 49.23 3.26
4 deg 96.83 90.68
5 deg 45.24 10894
6 deg 92.88 135.88
8 deg 37.84 173.
96
10 deg 80.25 225.74
D-14
MUL TIPLE-ANGLE
SWA TB DROP TEST MODEL
by E.B.D)almikO
D~.
of
N A& tO E •
Llm
v
. or
Glalg
o
'

7/26/2019 1992djatmikophd.pdf
http://slidepdf.com/reader/full/1992djatmikophdpdf 462/507
APPENDIXE
SWATH STRUCTURAL DESIGN AND
ARRANGEMENTS

7/26/2019 1992djatmikophd.pdf
http://slidepdf.com/reader/full/1992djatmikophdpdf 463/507
APPENDIXE
SWATH STRUCTURAL DESIGN AND ARRANGEMENTS
Abstract
A number of structural design and arrangement of SWATH vessels, ranging
from below 100 tonnes upto 15000 tonnes, compiled from open literature are
presented. Design approaches are to be highlighted along with the use of
alternative materials to gain a reasonable weight saving. Technical drawing of
the vessels arc provided as much as it is available. The reviewed information
should be useful for reference in the early design stage of SWATH ships.
El. INTRODUCTION
This Appendix contains descriptions of SWATH structural arrangements
extracted from those available in open literature. The descriptions attempt to be as
thorough as possible depending on the comprehensiveness of the source of
information. The structural configurations to be presented are not only those developed
in the actual SWATH designs, but also cover those in the hypothetical studies. The
wider range of information presented is viewed as being useful to aid SWATH
designers in establishing a firm base in the initial stage of design. Hence, the
infomation in this Appendix would be appropriate to be incorporated in the preliminary
structural design study, as is in Chapter 5.
Basic approaches in the structural design of each SWATIl vessel covered herein
are addressed, with examples of their outcome primarily in the form of structural
drawings. Nevertheless, most structural drawings that are available present only the
configuration of SWATH mid-ship sections because complete drawings are rarely
found at this stage. The use of construction material highlighted are there in which most
small SWA111s are fabricated out of aluminium material, whereas larger SWATI-Is are
mainly made of steel.
E2. STRUCTURAL DESIGN AND ARRANGEMENT OF
TilE HALCYON
The Halcyon (60-tonne SWA TIl boat) was built by RMI Inc., a small company
with objectives of pursuing advanced marine vehicles (AMVs) development and
AppendixE
E-l

7/26/2019 1992djatmikophd.pdf
http://slidepdf.com/reader/full/1992djatmikophdpdf 464/507
construction [El,E2]. The construction of the
Halcyon
was iniatially aimed at
providing a demonstrator to study the development of larger SWATHs within the
company. In 1985 the vessel was hired by the US Coast Guard for a technical
evaluation [E3]. Discussions on the design of the
Halcyon
(main particulars as listed in
Table El and configuration shown in Fig. El) are fully reported in refs. [El,E2], and
only the particular part in her structural design is extracted in following.
The design and construction of the
Halcyon
departed from the practice adopted in
monohull ship development. The vessel was designed using aluminium alloy, with all
primary hull structural elements continuously welded. The most significant loads were
expected to impose when the vessel encounters beam waves in its operational route.
Considering the study by the US Navy [E4], a maximum lifetime side load around 0.95
to 1.0 times the craft gross weight colud exist on a vessel of this size. A side load of
1.2
times craft gross weight was then selected in the design of the
Halcyon.
Longtudinal hull bending loads for the vessel, given the unique operating
characteristics of the SWATH concept, are relatively low even if simultaneous slam is
experienced by the vessel. Hence, longitudinal load could be ruled out as a substantial
source of global structural failures, unlike those on monohulls. On the other hand,
slamming load governs crucially in the design of local under deck scantlings. Maximum
plating pressure, given a wave impact forward of the knuckle, was estimated for a boat
speed of 20 knots at 20 psi, while pressures on the wet deck aft of the knuckle and
elsewhere were estimated at less than 5 psi for normal operation. Further, based on a
combination of side loads and V-line loads (the load originated from flooding after the
ship sustains underwater hull damage), sidehull and strut pressures were estimated to
be approximately 7.8 psi. The compartment boundaries, including the watertight
transverse subdivision bulkheds, watertight longitudinal bulkheads, side shell and vital
space boundaries were also designed to V-line loads equal to hydrostatic head of water
measured perpendicular to the most extreme flooded water line in the area of
compartment. The flooding level was determined by the conditions considering several
factors, such as the extension of hull damage, position of the damage, motion (roll
angle) of the craft and the list angle resulting from hull damage.
The resulting hydrostatic pressures were applied to either side of the compartment
boundaries as any individual compartment could be unflooded. In case of the shell
plating, the pressure was applied from outside only.
Primary hull bending, shear, and torsion loads for dry docking and hoisting of
the craft were also determined for lightship weight conditions. A load factor of 4 was
applied to the lightship weight and was considered to be appropriate for both dry
docking and hoisting operations. The
Halcyon
can be supported on keel blocks in dry
dock and can be hoisted from four lifting points designed into the main deck structure.
Appendix E
E-2

7/26/2019 1992djatmikophd.pdf
http://slidepdf.com/reader/full/1992djatmikophdpdf 465/507
In order to more fully explore the effects of transverse loads on the structure a
NASTRAN finite element model was developed. The model was representative and
limited
to
the hull structure between bulkheads at stations 37 ft, and 49 ft. This segment
of the structure was selected for analysis because of the large opening in the main deck
for machinery, and area likely to cause the most severe internal stress distributions and
concentrations.
Given the
lIalcyon's
beam sea loading assumptions, the average stress for the
NASTRAN section was calculated to be 3905 psi which was well within the material
allowance for the alloys selected. This calculated stress provided a good basis for
computing the total deck loads. Analysis indicated that relatively high stress peaking
would exist at the transverse bulkhead adjacent to the deck cut out. It also showed that
transverse loading resulted in compression in the wetdeck which would result in higher
stresses at frames and bulkheads since they would be carrying higher loads to take up
the slack. Table E2lists the safety factors used for the Halcyon structural analysis.
Five interior transverse watertight bulkheads were provided that continued into
the cylindrical lower sidehulls. Circular tee frames located at 36 in. centres stiffened the
lower hulls and were joined to the non-tight frames of the struts. Inboard of the shell
were three longitudinal watertight bulkheads located at the hull centreline and at 7.5 ft.
off centreline (port and starboard) at the inboard joint of the sponson and wet deck.
Longitudinal and transverse framing were of increased thickness in the areas of
machinery openings and at hull lift points.
The midship section, shown in Fig. E2, illustrated many of the design features of
the
Halcyon
structure. In particular, it shows the design approach taken at the cross
structure-sponson and sponson-strut joints to provide continuity at joint interface.
Continuous, double sided fillet welds were used throughout mitigate against fatigue
failure and stress concentrations at weld bead terminations. Only the
Halcyon's
lightly
loaded superstructure and pilot house used conventional 'skip' welding construction.
Longitudinal hull plating below the wet deck is primarily of 0.224 in. thick plating
stiffened by 3 in. x 0.224 in. flatbars (welded continuously) at 10 and 15 in. centres.
The wet deck is primarily 0.2 in plating inboard of7 ft. 6 in. and 0.281 outboard. The
deck is reinforced with 3/8 in. x 24 in. plate spanning the width of the ship at watertight
bulkheads. The main deck is generally 0.35 in. plating inboard of 6ft. 3 in. and 0.313
in. plating outboard reinforced at machinery openings by 0.375 plate. The wet deck and
main deck were also stiffened by continuous welded 3 in.
x
0.224 flatbars 15 in.
centres.
All plating and flatbars are marine grade 5456-Hl16 aluminium alloy. This alloy
provides the highest welded strength of any of the marine grade aluminiums while
Appendix E
E-3

7/26/2019 1992djatmikophd.pdf
http://slidepdf.com/reader/full/1992djatmikophdpdf 466/507
retaining good weldability and corrosion resistance. Extrusion materials are of 5456-
HIll aluminum alloy (as available) with alternates of 5083-Hlll or 5086-Hll1
alloys.
E3. STRUCTURAL DESIGN AND ARRANGEMENT OF
THE
VICTORIOUS
(T·AGOS
19)
The
Victorious
is the first large SWA TIl appraised by the US Navy to replace its
ageing monohull ocean surveilance
(T-AGOS
class) fleet. A SWATIl of this size (3500
tonnes) is viewed to be amenable for an operation to tow long sonar arrays at very low
speeds. Compared to its monohull counterparts, towing sonar arrays at, say, three
knots, was not particularly comfortable [E5], especially in rough seas, thus more stable
platforms such as SWATI-Is should be utilised.
The design of the
Victorious
was quite unique in which the development was
carried out by a team of personnel from NA YSEA, DTNSRDC, local naval
architectural firms and a large core of shipyard personnel selected from a list of
prospective shipbuilders [E6]. So the programme was basically a joint effort which was
envisaged to benefit the government as well as the industry. Because of the newness of
the SWA
rn
concept it was accepted that past Navy design practices were not generally
directly applicable in this particular task. Further, the designer also recognised the
major disadvantage of SWATHs because of their added cost and size over comparable
monohull ship size for the same mission. To offset these size and cost differences,
considerable effort was expended during the design to minimise the ship size
differences and to reduce the construction cost through enhanced producibility and
widespread use of commercial practice. The development of hull configuration, for
instance, has evolved from initially elliptical cross-section to the final form, ie a
combination of rectangular and circular section. The final configuration of the vessel
(see Fig. E3) demonstrates the key features of a producible design with emphasis on
reducing fabrication cost. The particular dimensions of the Victorious may be found in
TableE3.
The structural design of the SWATH was another area where considerable work
was done to arrive at the producibilty edge [E6,E7]. The initial design was based on
standard Navy practice (see ref. [E8]). This baseline was iterated before the final
commercial structural configuration was finally gained. Navy practice is distinguished
from commercial practice in that it generally optimises
structural
weight at the expense
of the uniformity of the structure or ease of construction. As an example, shapes or
plating thicknesses are more apt to be different in a Navy strcutural design since each
structural member is sized to develop its full strength. Commercial practice, on the
other hand, tend to use more of the same size shapes or sizes in the interest of
A ppendix E
E-4

7/26/2019 1992djatmikophd.pdf
http://slidepdf.com/reader/full/1992djatmikophdpdf 467/507
uniformity of the construction. This results in many reduced stresses on many of the
structural members.
To apprehend the above aspects more clearly it is best to refer to Fig. E4, ie
details of the T-AGOS 19 structure amidships for the Navy point, and the commercial
configuration for the same section at the end of contract design. The most apparent
difference in comparing the two sections is the widespread use of angles in the final
design versus the use of
T
shapes in the earlier Navy point design. Upon closer
examination, the structural differences are much more significant. The extensive use of
insert plates on the main deck of the final design has been minimised. Originally, the
main deck was fabricated with 12.75
#
plate and 20.4
#
inserts at the intersection of the
transverse and longitudinal bulkheads. These were eliminated and 15.3
#
plate was
installed over the entire main deck. The inserts were kept in case of the wet deck as the
weight penalty associated with their removal was considered to be significant. The
transverses at the main deck were initially 5 x 4 x 6
#
1ft
'T',
which were replaced by
6.6
# 1ft
angles (10% heavier). Although the change seems small, it eliminates half the
collars (clips or lugs) for all the stiffeners which penetrate members. This is
approximately 600 collars for the main deck alone. Conversely, fitted joint connections
were used extensively as opposed to the more common cost effective commercial
practice of lap joints, by virtue of fatigue considerations.
The modification from Navy type to commercial type of strcutural arrangement
was claimed to have not much effect on the increase in weight normally inherent in the
different practices. A rough approximation is that a commercial structure is normally
10% heavier than an equivalent Navy structure. Finally, the structure, based on model
test results confirmed by computer finite element analyses, has met the commercial
requirements of the American Bureau of Shipping classification +Al (Et Unrestricted
Ocean Service, +AMS, +ACCU and Class E ice strengthtening) [E5].
E4. STRUCTURAL DESIGN AND ARRANGEMENT OF A SMALL
SWATH FISHING VESSEL
ALI
MV
Ali
(principal dimensions as given in Table E4) is a small SWATH fishing
boat designed and built by a private bussiness enterprise in Glasgow [E9], and to be
operated in the Scotland's North West coast and Islands. The vessel was designed to
have an overall length less than 12 m. Multiples of standard plate lengths to form the
mid body combined with adequate entrance and run to set the length of the lower hulls
at 10.475 m. A circular hull (1 m in diameter) configuration was selected for ease of
fabrication, although asymmetric sections would allow greater sectional area useful in
providing sufficient buoyancy.
Appendix E
E-5

7/26/2019 1992djatmikophd.pdf
http://slidepdf.com/reader/full/1992djatmikophdpdf 468/507
Single short strut per hull was used to minimise structural weight and
construction time. Strut thickness of 0.6 m was dictated purely from considerations of
access during fabrication and operation. Nevertheless the strut thickness/hull diameter
ratio of 0.6 is still within the upper bound of the normal SWATH range [EI0]. The
design draught of the craft was governed by the desire to adequately submerge the
lower hulls to provide satisfactory resistance and seakeeping performance. Whereas the
separation of the demihulls was dictated principally by seakeeping considerations. A
hull centrelines separation of 4 m was adopted to guarantee that coincidence of the
natural periods of heave, pitch and roll was avoided.
The structural design of MY
Ali
was directed to meet the criteria of maximum
side load in beam seas at zero speed. The first estimate of the design side force was
taken from Fig. E5 [E4], combined with large factors of safety on allowable stress to
ensure adequate fatigue life. Local wet deck panels were designed to sustain maximum
slamming loads which were expected to impose in head seas at a certain forward speed
by the method given in ref. [Ell]. The uncertainty about the effect of shear lag and
stress concentrations which are mostly critical for large SWATHs is not considered as a
perplexity on the SWATHs of MY
Ali's
size.
The main load carrying structure (see Fig. E6 and E7) is formed by five
transverse bulkheads extending from the lower hulls through the struts to the cross
structure. Plating is supported by flatbar framing carried round the inner and outer shell
of the vessel with ring frames in each hull. In the cross structure the frames and
bulkheads are supported by three longitudinal webs. All corners are radiused a
minimum of 100 mm to mitigate stress concentration, especially in the inner haunch
area between struts and deck structure. With hindsight, greater continuity of stiffening
in this area could have been maintained in this small vessel by utilising a fully radiused
haunch. The overall design of this small SWATIl with the selection of the all mild steel
structure shows a thorough effort in achieving simplicity in fabrication with minimal
work force.
ES. STRUCTURAL DESIGN AND ARRANGEMENT OF THE
KAIYO
Most existing SWATHs nowadays were built and operated in Japan, but
publications addressing their sufficiently explicit structural design are rare. Among
these Japanese SWA TIls only the structural data of the
Kaiyo
is now available [E12-
E14] even then it is only very limited. The
Kaiyo
WAS put into operation in 1985 for
underwater support works, after an extensive sea trial proceeded the delivery from
Mitsui Engineering and Shipbuilding (MES) Co Ltd. The design of the
Kaiyo
was
commissioned by Japanese Marine Science and Technology Centre (JAMSTEC)
A ppen dix E
E-6

7/26/2019 1992djatmikophd.pdf
http://slidepdf.com/reader/full/1992djatmikophdpdf 469/507
involving universities. ship operators and institutions possessing technical knowledge
and experience in advanced marine vehicles. as well as industries. A full discussion on
the design and trial of the
Kaiyo
can be found in ref. [E12]. The main particulars of the
vessel are given in Table E5.
The Kaiyo is classified by the Nippon Kaiji Kyokai (NK) for steel ocean going
vessels. Although the NK regulations are among the most extensive rules available.
nonetheless they were not sufficient to assist in the structural design of the vessel.
Hence. the structural design and the scantling selections had to be established from the
first principles of structural design. The external forces due to wave were estimated by
calculations after the most careful investigations approved by the classification society.
A strength analysis was also carried out to decide the scantlings for the whole structure
with the solid framework structure model (FEM). Calculations. such as the wave load
analysis by strip method. structural analysis among the waves with solid framework
model. and the long-term prediction of stress in the structural members. have been
carried out consistently using the Offshore System Program developed jointly by MES
and NK [E13.E15].
Evaluation of the strength is made with respect to allowable stress. buckling and
fatigue to confirm the safety of the structure. As a SWATH has a uniquely shaped hull
form. the strut to deck connecting section is subject to particularly intensive stress in
beam seas. MES. therefore. assessed stress in the subject parts by FEM calculations
and reinforced the parts as required. Special attention was called for during construction
as well as at the design stage. The midship section of the Kaiyo with some scantling
sizes is shown in Fig. E8.
As it is seen in Fig. E8. the Kaiyo has a higher characteristic of hull to draught
ratio than normally adopted for most SWATHs. This diversion from the usual practice
is primarily because of the need of shallow draught for harbouring. Other particular
reasons for this design are. firstly. lower overall draught is favourable in view of
reducing frictional drag as a result of the decrease in wetted area without much affecting
the motion performance of the vessel [E14]. Secondly. lower draught is also beneficial
to reduce the amount of structural material in fabrication. On top of that. lower draught
will induce lower lever arms. hence reducing bending responses on a given transverse
section of the vessel [ElO].
All steel construction was selected because of building costs and hull
maintainability. Because of the relatively low design speed the weight increase. by
adopting steel as a hull material, does not vitally affect the ship's performance. High
tensile steel (yield strength 32 kg/mm
2
)
was used for bottom and side shell plate as well
as the longitudinal members of the lower hulls and the transverse webs below the upper
A ppe ndix E
E-7

7/26/2019 1992djatmikophd.pdf
http://slidepdf.com/reader/full/1992djatmikophdpdf 470/507
deck, while the deck house was constructed out of mild steel. The ship provides
sufficient deadweight of about 860 tonnes at the ship's draught of 6.3 m. Additional
information on other MES SWATH designs regarding the structural material is given
below [E12].
In the case of the
M arine A ce
(22 tonnes) and the
Seagull
(343 tonnes), anti-
corrosive aluminium alloy was used as hull material to reduce the structural weight and
accordingly use of less power to attain the design speed. For the hull material of the
Kotozaki (236 tonnes) three alternatives were considered, namely, Al-alloy, high-
tensile steel and a hybrid structure. The choice of Al-alloy for the entire hull showed an
unacceptably high building cost. High tensile steel necessitated bigger engines to attain
the design speed of 20 knots due to the larger displacement to sustain the required
payload. Consequently, a hybrid structure with high tensile steel hulls and anti-
corrosive Al-alloy was selected to allow for a reasonable design. To compare the use of
different structural material, however, Mitsui has provided data on the effect of
structural material on the manufacturing cost of a 400 tonne SWATH, as shown in
TableE6.
E6. STRUCTURAL DESIGN AND ARRANGEMENT OF THE
PATRIA
The
Patria
is an FDC400-Seamaster class built by FBM Marine Limited at
Cowes on the Isle of Wight. Although the class FOC stands for Fast Displacement
Catamaran, Patria is principally a SWATH type vessel or, more accurately, MW ATH
(Medium Waterplane Area Twin Hull), since its waterplane area is relatively larger than
most of the common SWATHs. This vessel, which is presently operating as a regular
ferry between Madeira and Porto Santo, was claimed in 1989 to be the fastest (at
maximum speed of 32 knots) amongst the existing SWATHs [E16].
The design of the FDC may be regarded as somewhat revolutionary by the
SWATH community. It could be explained that, having recognised one of SWATH's
drawbacks in which, due to its slender struts, the vessel is in a way rather vulnerable to
the so-called Munk moment effect. The Munk effect in SWATHs is basically the
tendency to plough in or nose dive caused by the inherent lack of natural pitch stability
in submerged hull design with narrow struts. The most common way to overcome such
an effect on SWATHs is by mounting canard fins forward of the underwater hulls.
What FBM Marine has set out to achieve in the FDC is to purposely design out the use
of 'active' fins which are required in order to maintain natural pitch stability at speed by
increasing the waterplane area. A parameter used in measuring the range of waterplane
area is designated as the waterplane area ratio
(WPA/fl
2
{3),
where this ratio is about 0.5
to 1.5 and around 1.5 to 2.5 for ordinary SWATHs and for FDC respectively. Further,
A ppen dix E
E-8

7/26/2019 1992djatmikophd.pdf
http://slidepdf.com/reader/full/1992djatmikophdpdf 471/507
such a concept is also beneficial to enhance the problem related to payload sensitivity.
hence, it requires a less substantial ballast system. From structural and constuction
viewpoints. larger waterplane area (wider struts) also means less stress in the strut-deck
intersection. and easier internal access for welding and maintenance. The main
particulars of the Patria are listed in Table E7.
What basic approach adopted in developing the structural design of the FDC is
not particularly revealed. Even so, it is mentioned [E17] that the vessel was built
according to the IMO Code of Safety for Dynamically Supported Craft A373(X) and
classified OnV +1A1 R90 Light Craft EO. The vessel was constructed of salt water
resistant aluminium alloy plates and specially designed extrusions welded by automatic
Robot Metal Electrode Inert Gas method. The use of lightweight extruded aluminium
planks with an integral T stiffener, as on the FOC, proves to be advantageous in
enhancing producibilty, especially in view of minimum welding and distortion during
construction [EI8.EI9]. Even though. it would not be appropriate to apply extruded
planks on any curved section of the structure, such as the hulls and strut ends of
SWATIls.
The
FOe
hulls were produced with a combination framing system of deep
transverse web frames at 1250 mm centres and closely spaced longitudinal extrusions.
Bottom plating is 6 mm, the deck plating is 4 mm and an aluminium channel rubbing
strake is fitted. An expanded aluminum mesh is also located over the foredeck wells.
Bolted panels in the decks over the main engines allow direct vertical removal of
engines and generators. Removal plates are also fitted for the gear boxes, generators
and other small machinery items. All tanks incorporate bolted inspection hatches. vent
pipes and drain cocks. Typical structural arrangements for the
FOC
are as shown in
Fig. E9 and E1O.
E7. STRUCTURAL DESIGN STUDY OF A 3000·TON SWATH
AT TilE NUC
A design study of an earlier SWATH designated as the 3000 S3 (see Fig. Ell)
was conducted at the Naval Undersea Reasearch and Development Center (NUC) in
1971 [E20]. The vessel was designed to reach a maximum speed of 35 knots. with an
operational speed of 25 knots to traverse an endurance of 3000 to 5000 miles. Both
theoretical and experimental investigations have been extensively carried out to
accomplish the preliminary design of the vessel, which was to provide substantial
improvements in operational capability with vertical/short takeoff and landing
(V/STOL) aircraft, weapons. sonar, and personnel through sea state 6. Circular hulls
with tandem strut configuration were selected for this particular SWATH (main
dimensions as listed in Table E8).
A ppen dix E
E-9

7/26/2019 1992djatmikophd.pdf
http://slidepdf.com/reader/full/1992djatmikophdpdf 472/507
Rigorous efforts were made in the structural design of the
S3
as it was firmly
believed the conventional naval-ship-design methods and the use of standard marine
structural steels were not applicable to the novel concept. As it was found, preliminary
estimates for the hull fraction (structural weight/6) indicate a value of around 0.6 for
bare hull structure if steel structure and conventional construction, technique, and
philosophy were adopted [E21]. On the other hand, the weight fraction can be reduced
to below 0.4 with light weight structural materials and advanced structural concepts,
which would create a payload capacity comparable to that of conventional high-
performance monohull ships. Extracts of this comparative study are presented in Table
E9, in which aluminum structure is preferable. Further, apart from lightweight, a
preference for aluminium can be seen to be come from considerations of formability,
corrosion resistance, and flammability. Aluminum is available in a wide range of
extrusions in the form of rib stiffened single- or double-wall panels, with outstanding
stiffness. Use of integrally stiffened panels in structural design generally results in an
additional10% overall weight saving. Corrosion resistance aluminium eliminates the
need for painting, which may result in an additional 1% overall weight saving.
Moreover, although aluminium melts and ignites at a lower temperature than steel, the
absence of paint and high thermal conductivity of the metal makes a bare aluminium
structure more resistant to initiation of fires.
The structural concept and the underlying assumptions adopted within the
S3
structural design are outlined as follows. The platform (cross-deck), which acts as a
box beam under simultaneous bending and twisting will be appropriately implemented
by the structural concept of a skin-stressed sandwich panel with the deck room
partitions acting as stressed cells of the sandwich. The vertical struts, which act as
restrained cantilever beams, provide a connection between the buoyancy-producing
hulls and the platform. These parts are best constructed as sandwich beams of lenticular
cross-section. Whereas the most efficient structural concept for the submerged hulls,
which act as shallow running submarines, will be a sandwich-constructed monocoque
hull (see Fig. E12). Representative marine-alloy selections for ship construction are
5454-H117 and 6061 aluminiums. The 6061 alloy in a T651 temper would be used
primarily in sandwich extrusions, while the 5454-Hl17 would be utilised in plate,
angles, I-beams, and integrally stiffened panels.
Aluminium-extruded cellular sandwich plates and integrally stiffened panels can
be used as structural building blocks. Use of extruded panels will significantly increase
the buckling resistance of the structural members without an increase in weight. The
structure should
be
of welded construction. Optimum use of extrusions will minimise
the amount of welding required which, in turn will reduce on-site labour costs. The
structure can be designed on a modular basis to allow parallel fabrication of sub-
asemblies and the use of similar modules in many areas of the vessel (see Fig.
E
13).
AppendixE E-10

7/26/2019 1992djatmikophd.pdf
http://slidepdf.com/reader/full/1992djatmikophdpdf 473/507
A detailed analysis on the above structural arrangements was made by dividing
the structure into 11 components and accounting for their interactions (as opposed to
independent substructures). These components or frame members comprised 2 hulls, 4
struts, 1 stabiliser,2 cross-deck members, and 2 axial deck members. The framework
was then divided into several two-dimensional sections and loads were applied. The
loads are related to individual component members (as shown in Table EI0). The two-
dimensional frames were then analysed by means of the moment distribution method.
Internal moments were calculated and a superposition was used to combine these
moment diagrams into a full three-dimensional framework. Once these moments were
known and all local loading conditions were added, a required cross-sectional moment
of inertia could be calculated from the flexure or combined stress formulae. To generate
the necessary moment of inertia, the double-walled cellular extrusion was used in all
beams, as shown in Fig. E12. Calculations were reduced by specifying that all platform
members would be circular and symmetrical in cross-section; including the submerged
hulls which are circular in any case (with elliptic extensions). The struts were
considered as twin panels of cellular form, and moment of inertia was calculated for the
flat sections rather than the actual slightly curved sections.
ES. STRUCTURAL DESIGN STUDY OF A 4300-TON SWATH
AT THE NSRDC
A comparative study of an ASR catamaran with a comparable size SWATH,
formerly referred to as LWP (Low Waterplane Area) catamaran, was performed at the
NSRDC in 1972 [E22]. Identification of the potential application of SWATH in naval
operation was recognised as an air support platform and, more specifically, as a new
generation Sea Control Ship. Most design aspects of the LWP (~=4300 tons) ranging
from hydrodynamic performances and powering selection have been observed to
certain depths to built up a milestone for a further detailed study.
One major problem area associated with the LWP catamaran has to do with the
development of efficient structures. Further, it was noted that, relative to its
displacement, an LWP catamaran will have substantially more enclosed volume and
deck area than monohuls. If the structural weight densities estimated and adjusted from
monohull practice are applied to LWP, it is soon evident that hull weights will exceed
acceptable values and that payload-carrying capability will be reduced (see Table Ell).
Hence, the designer is forced to reduced fixed weights wherever practicable and,
subsequently, propulsion installations which use lightweight marine gas turbine
engines become essential. Even then, such weight savings are not actually adequate and
every effort must be made to further reduce weight by using light but reliable
structures.
AppendixE
E-ll

7/26/2019 1992djatmikophd.pdf
http://slidepdf.com/reader/full/1992djatmikophdpdf 474/507
Based on the above consideration, it is apparent that if the LWP are to be
competitive with monohulls in payload weight-carrying capability, structural weight
must be reduced and held within closely controlled limits. As a consequence, this
requires reliable prediction of applied loads and precise design in the area where prior
knowledge is limited. Furthermore, selection of construction material has to be studied
conscientiously, e.g. by comparing steels and aluminium as an alternative.
The principal structural design tool was a design computer program developed at
NSRDC to optimise the weight of midship section structures according to accepted
Navy criteria [E23]. The program uses an iterative procedure and selects spacings for
supporting structure, panel sizes and all scantlings suitable for the applied loads. For
purposes of the LWP study, the program was modified to design a catamaran
transverse section and a longitudinal section through the bridging structure. Use of the
program allowed assessment of many more design approaches and structural concepts
than would have been possible through manual methods.
It was learned from the study that the bridging structure deserved prime
consideration inasmuch as more than one-half of the structural weight was in the
structure. Sea induced loads (which included transverse bending, vertical inertial effects
of dead and live loads.
axial/transverse
load on the bridge, and slamming on the bottom
panels) dominated the structural design in the transverse direction. In contrast, the
longitudinal structure was dictated by local loads (dead loads. hydrostatic loads, etc.)
with sea induced loads (i.e. longitudinal bending) contributing little to total stress. For
this particular study, the ratio of primary stresses in the transverse structure at the
centreline to those in the longitudinal structure were found to be approximately 10:
1 .
The relative levels of primary stress will vary with different hull geometries; the relative
importance of primary loads in these two directions will not
Thus far, a number of structural arrangements have been examined and their
corresponding structural weights and scantlings computed. It was not possible to know
a priori which structural arrangement would yield the lightest structure. Since an
adequate experience base was lacking, a large number of structural arrangements and
assumptions had to be tested. Some insight has been gained on the effect of major
variables (hull spacing, bulkhead, web and girder spacing. effective breadth of plating),
and sub-optimal structural designs have been developed. Figure El4 is representative
of the kinds of structure that were examined for the LWP. The design has an overall
structural density of 7.2Ib/ft
3
with the distribution as shown in Table E12. It is further
mentioned that structural density of 6 Ib/ft
3
was targeted for future investigation.
AppendixE
E-12

7/26/2019 1992djatmikophd.pdf
http://slidepdf.com/reader/full/1992djatmikophdpdf 475/507
E9. STRUCTURAL DESIGN STUDY OF A SWATH V/STOL
AIRCRAFT CARRIER
By the early 1980s an escalating confidence was seen among naval ship operators
towards the potential application of SWA TIls. This was mainly brought about by
promising evidence becoming available from operational experience of several
SWATIls. It is not surprising, therefore, that some research bodies have projected their
research on much larger size than those in existence. Such a development is on a large
SWATIl V/STOL aircraft carrier having displacement ranging up to 15,000 tonnes
[E24].
The design of this V/STOL was based on the common requirements of ordinary
naval aircraft carriers, as well as on specific requirements, hence a SWATH
configuration is in great demand. Specific requirements include providing the ability to
launch a single aircraft in the STO (short take-oft) mode and launch/recover multiple
aircraft in VTOL (Vertical take-off/landing) mode. V/STOL in turn defines the length of
take-off run and ship areas peripheral to actual launch and recovery operations, as well
as the maintenance and support areas (hangar, shops, elevators, etc.) and storage areas
(ordinance, fuel, etc.). Further, the design was initiated with preliminary estimates of
weight and deck areas to satisfy those functional requirements. The preliminary
estimates assumed a structural density range of 5.5 to 6.0 Ib/ft
3
of enclosed volume and
main deck area of the order of 75,000 ft2. The resulting displacement of the vessel,
which was thence named as SWATH 83 (see Fig. EIS), is in the range of 14,300 to
15,300 tons. The main dimensions of the SWA TIl 83 are listed in Table E13.
For structural design purposes various local loading and hull impact conditions
are taken into account, as given in table E14. Overall ship longitudinal bending cases
were also determined for hogging and sagging conditions, based on semi-uniform
weight distributions. The hogging condition produces maximum bending moment
amidships of 89,500 ft-tons. Based upon this moment and an average material
allowance of 27 ksi a section modulus of approximately 89,100 in
3
is required. Actual
modulus is at least twelve times that required resulting in calculated bending stresses at
the flight deck of 1,512 psi and at the keel of 2,188 psi. Longitudinal strength is not a
driving structural design criteria for SWATH 83. However, itis not clearly described to
what extent the transverse load criteria has been considered in the design. Typical
structural sections for SWATH 83 are shown in Fig. E16 for the forebody, Fig. E17
for midship sections, and Fig. E18 for the afterbody. Deck house structure is shown in
Fig. E19.
It is noticed from the former three figures that SWATIl 83 has a canted strut
configuration. According to the designer [E24], it was found that inclining or canting
AppendixE
E-13

7/26/2019 1992djatmikophd.pdf
http://slidepdf.com/reader/full/1992djatmikophdpdf 476/507
the basic strut plane inboard could provide required transverse stability. Moreover, this
would also provide a substantial increase added mass and damping, and hence
lengthening the natural period of motion and reducing the resonant peak. Another
advantage of canted struts is in enhancing the pitch stability, i.e. to counteract the Munk
moment inherent to slender body in forward speeds. From the structural point of view
canted struts are inferior due to the increase in static bending moment. However, the
dynamic moment by wave action is reduced dramatically with increasing cant angle.
The net result is that the combined static and dynamic lifetime loads
are
about the same
as those with vertical struts [E25].
EIO. STRUCTURAL DESIGN STUDY OF SMALL SWATHS
It has been repeatedly mentioned in the foregoing sections that the problem to be
overcome in SWATIl structural design is the reduction in structural weight. The matter
is so pronounced when a designer should deal with smaller crafts (displacement 250
tonne and below), where steel structure would be considered as the last choice.
Accordingly, exploratory studies of alternative SWATH structural materials has
evolved substantially, such as that reported in refs. [E26-E28].
Two alternative materials, namely, aluminIum alloy and glass reinforced plastic
(GRP), has been studied and compared with steel structure for SWATIl displacement
range from 30 to 250 tonnes [E26.E27]. with variation of structural arrangements as
shown in Figs. E20 and E21. A simplified approach of the design loads was adopted in
the preliminary design study in which the maximum side load (and hence transverse
bending moment) is derived from a default data and the peak slam pressure is obtained
by two methods given in [E29.E30]. The peak side force obtained was further used in
designing of shear area of SWATIl strut and haunch area. The transverse bending
moment was adopted in the design of cross deck and strut structures. Whereas peak
slamming pressure value governed the sizes of wet deck panels and haunch scantlings.
In addition. hydrostatic pressure was included in the design of panels of plating and
stiffeners where this is more appropriate than slam pressure.
Computer programs were developed to facilitate the above procedures and
combined with
an
evaluation program to finally appraise an economic measure of merit
of any given SWATH design. An example of the output of the structural design
program on a 70-tonne SWATH (main dimensions as listed in Table E15) is given in
Table E16. The structural weight of each material configuration for the scantlings
shown in Table E16. is 42.4 tonnes. 26.9 tonnes. and 25.9 tonnes, respectively, for
mild steel. aluminium alloy and GRP structures.
AppendixE
E-14

7/26/2019 1992djatmikophd.pdf
http://slidepdf.com/reader/full/1992djatmikophdpdf 477/507
Ell. STRUCTURAL DESIGN STUDY OF NAVAL SWATHS AT UCL
From many publications
DeL
is well known for its comprehensive studies in
monohull naval vessels, and also on SWATHs (see Table 1 of [E31]). Two of those
studies are on anti-submarine warfare (ASW) SWATH frigate [E32], and on a single
role minehunter (SRMH) SWA TIl [E33]. A thorough identification of naval mission
for such vessels in general has to be first developed to proceed in their design studies.
The primary role of an ASW frigate. for instance, is to give assurance of sea control by
providing support and escort to task forces or resupply and reinforcement (Re-Re)
convoys. These missions will in tum govern the payload requirements for the vessel,
such as weaponry and number of personnel on board, and further it is considered
in
the
initial sizing of the vessel.
The ASW SWATH studied (see Fig. E22) having a displacement of 4678 tonnes
with some other features, as given in Table E17, which has been established in part for
the improvement of its hydrodynamic performance. In the structural design, the
primary loading considered is the transverse bending moment in the box and haunch
due to the strut acting as a cantilever under lateral load. A computer program has been
developed at DCL and was used to assess the structural behaviour of the ASW, as well
as determining the scantling of the vessel.
The resulting midship section obtained by that analysis can be seen in Fig. E23.
Admiralty 'B' quality steel is used for the majority of the structure, while insert plates
in the haunch and strut are HY80. Longitudinals are spaced 1.4 m apart and transverse
framing 0.7 m to remain within the celularity philosophy and standards [E34]. the
helicopter deck was considered as a special structural case and plating here is 17 mm
thick. A detailed check on the structural loading and strength would be necessary for
the next design stage, as the present design is based on a simplified approach [E32].
The structural design of of the SRMH SWATH (see Fig. E24 and Table E 18 for
the main particulars) was developed in a similar manner as that on ASW frigate, where
transverse bending is recognised as the dominant load to result in structural stress. The
stress level due to this load was analysed at high stress points on the amidships section.
A safety factor of 4.0 was applied for fatigue consideration. The cross structure was
analysed in bending, shear, plate/stiffener buckling, and plate buckling. Primary
loading of the strut and shear analysis of the plate/stiffener combination in the strut
were considered. The hulls were analysed for elastic buckling [E35].
Transverse framing arrangement (with intercoastal longitudinal bulkheads) was
called for due to the consideration of dominant lateral loads. Structural material chosen
was GRP based on the contemplations of low weight (0.43 times of steel structure),
A endix E
E-15

7/26/2019 1992djatmikophd.pdf
http://slidepdf.com/reader/full/1992djatmikophdpdf 478/507
ease of production, satisfactory shock performance, and non-existent magnetic
signatures [E33]. Table E19 presents the structural scantlings as determined from the
above analysis.
E12. STRUCTURAL DESIGN STUDY OF A KOREAN FERRY
Learning from the success of SWATH operations in some countries, Hyundai
Heavy Industries Co., Ltd. (HHI) and Korea Institute of Machinery and Metals
(KIMM) in Korea commenced an extensive research on SWATH vessels in 1986. The
first design explored was on a high speed coastal passenger vessel [E36]. Parameteric
studies which followed the joint research contract have been made on four SWATIl
variants. Each size of the SWATHs was developed on the basis of a techno-economic
study regarding the operator requirements. As a sequel to the selection of the most
amenable variant an observation was then conducted in determining the type of
hullform aimed at optimising its hydrodynamic performance. Finally, the initial sizing
drawn the principal particulars for the SWATIl coastal ferry are given in Table E20.
Figure E25 depicts the general arrangement of the ferry.
The primary load assessment adopted in designing the structural members of the
SWATH ferry is the one developed by Sikora [E37], where the maximum side force is
estimated from the principal characteristics of the SW
A
TH. A prediction of wave loads
based on the strip method was also made to confirm the approximation given by
Sikora's algorithm. The secondary load (slam pressure), which is dominant to the
determination of underdeck structure, was estimated by the formulation given in [E30]
and a motion analysis as introduced in [E38].
The lightweight construction material selected for the design was alluminium alloy
A 5083-H321, which was considered to have a minimum deterioration in strength after
welding. Transverse framing system (at 0.5 m spacing) was chosen to sustain the
prevailing side load from sea waves. Cross structure and struts which are long and
slender type structure, were stiffened by solid floor instead of by angles, so that the
hull weight is reduced while an increase in strength can be attained. Web frames were
arranged in position at every third frame, and transverse bulkheads at every sixth frame
considering the slenderness of the structure. Figure E26 shows the scantling
arrangement amidships.
The analysis of the structural configuration was carried out by FEM model,
primarily on the midship section of the SWATIl ferry. In the analysis, transverse side
force and still water bending moments were considered as primary load and the result
indicated that the stress level of the outer shell is not too high (see Fig. E27). In a more
detailed analysis for the transverse members of the web section showed highly
A ppe ndix E
E-16

7/26/2019 1992djatmikophd.pdf
http://slidepdf.com/reader/full/1992djatmikophdpdf 479/507
concentrated stresses in the vicinity of the openings (see Fig. E28). So a reduction in
the size of the opening was called for. from 1020x170x130 mm to 900 x 170x130 mm,
and also stiffened by flat bar of 80x8 mm on the opening circumference. After this
modification the stress level was found to be significantly lower and much below the
allowable stress.
E13. STRUCTURAL DESIGN STUDY OF EODSC SWATH
As part of its overall programme. the Combatant Craft/Service Craft/Amphibious
Craft Acquisition Program Office of the US Navy (NAVSEA PMS300) authorised a
study to determine if the SWA11-1 concept could be used to satisfy requirements for an
Explosive Ordnance Disposal Support Craft (BOOSe) [E39]. The design was to be
configured to accommodate an enlarged payload relative to the 65-ft EODSC then in
design by the NAVSEA Combat System Engineering Station. Desirable attributes of
the SWATH concept which seem promising for the EOn mission included excellent
seakeeping. large deck area and good survivability.
The principal characteristics of the SWATH design which meet the operational
and performance requirements by the Navy are given in Table. E21. The general
arrangement of the EOD SWATH is shown in Fig. E29. The basic configuration
chosen is conventional for a SWATH. in which the relative sizes of the major
components. such as. box length and beam. etc .• all fall within a range that is normal
for this size of boat and payload. The structural design was made by first identifying
the most critical loading source and condition, followed by determining the scantling
arrangement to provide sufficient strength to the structure. Basic design criteria
developed within the Navy was adopted in the study where a stress level of around
18,000 psi was permitted for plating and 14,000 psi for transverse webs.
The midship section drawing, Fig. E30, indicates the basic hull structural
properties and illustrates the arrangement It is emphasised that no effort has been made
to optimise the use of shapes to minimise differences in scantlings. The structural
design of the hull and strut exploit the use of'T' sections to develop the requisite inertia
and beam load carrying ability. For the cross structure, comprising the wet and
dry
decks, longitudinal girders. stiffeners, and transverse webs form an orthotropic
grillage. The grillage supplies both upper and lower local panel strength and overall
transverse load carrying capability. Longitudinals segregate the cross structure
athwartship and render a support to prevent lateral transverse instability in lateral
bending.
Superstructure design was established by consideration of the stiffened panels of
bulkhead and 011evel plating. Stanchions and partial interior bulkheads form assemble
Appendix E
E-17

7/26/2019 1992djatmikophd.pdf
http://slidepdf.com/reader/full/1992djatmikophdpdf 480/507
the main interior support for the arrangement. Exterior bulkheads were designed to
resist wave slam loads, and 01 level deck scantlings were sized for 150 psf uniform
loads. This design pressure allows the structure to sustain ice loads.
E14. CONCLUSIONS
From the review of some SWAm structural design and arrangements above it
can be emphasised that the adoption of transvese load as being the primary design
consideration has firmly developed among SWAm designers. In addition, secondary
load due to slamming is recognised to govern local scantling designs, especially for
small crafts. Having mentioned that, nevertheless, the structural design criteria adopted
by different SWAm designers is very limited.
Most SWATH structural designs, as identified, are directed towards minimising
structural weight with the expectation of increasing the effective payload capability.
Correspondingly, alternative construction materials have been comprehensively
explored in parallel to optimising structural arrangements and configurations. Further
steps in SWATIl structural design are required to establish a more producible
configuration in the interest of reducing labour costs, but without violating the principal
strength of the structure. Alternative SWAm configurations for producible design may
be seen in Fig. E31 [E40] and Fig. E32 [E41].
REFERENCES TO APPENDIX E
El. Luedeke, G. Jr. and Montague, J. RMI's Small-Waterplane-Area-Twin-Hull
(SWATII) Boat Project , SNAME, San Diego Section, Nov. 1984
E2. Luedeke, G. Jr, Montague, J., Posnansky, H. and Lewis, Q., The RMI SD-60
SWATH Demonstration Project ,
Proc.lnt. Coni. on SWATH Ships and
Advanced Multi-Hulled Vessels,
RINA, Paper No. 10, London, Apr. 1985
E3. Coe, T.]., A Technical Evaluation of the 60-foot SWAm Ship Halcyon to
Determine Utility in Coast Guard Operations ,
Proc.Tntersociety Advanced
Marine Vehicles Conf.;
Paper No. 89-1443-CP, Arlington, VA, June 1989
E4. Allen, R.G. and Holcomb, R.S., The Application of Small SWAm Ships to
Coastal and Offshore Patrol Mission ,
Proc Symp. on Small Fast Warships and
Security Vessels, RINA, London, 1982
E5. MER (editor), SWATH
Yictortous -
a Firm Base for Towed Arrays ,
Marine
Engineering Reviews (MER),
IMarE Magazine, Aug. 1990
E6 Covich, P.M., T-AGOS 19: An Innovative Program for an Innovative Design ,
Naval Engineers Journal,
ASNE, May 1987
A ppen dix E
E-18

7/26/2019 1992djatmikophd.pdf
http://slidepdf.com/reader/full/1992djatmikophdpdf 481/507
E7. Covich, P.M., SWATH T-AGOS a Producible Design . Proc. AIAA 8th
Advanced Marine Systems Conf.,
Paper No. AIAA 86-2384. San Diego. USA.
Sept. 1986
E8. Malakhoff, A., Packard. W.T .• Engle. A.H. and Sielski. R.A.• Towards
Rational Surface Ship Design Criteria ,
Proc.lnt. Conf. on Advances in Marine
Structures-Z; TS-8. DREA. Dunfermline. Scotland. May 1991
E9. MacGregor, J.R., Bose, N. and Small. G.• Design and Construction of a Small
Waterplane Area Twin Hull (SWATH) Fishing Vessel , Proc.World Symp, on
Fishing Gear and Fishing Vessel Design. St. John's. Newfoundland. Canada.
Nov. 1988
EI0. Gore. J.L., SWATII Ships , Naval Engineers Journal, ASNE, Special Edition,
Feb. 1985
Ell. Allen. R.G. and Jones. R.R.• A Simplified Method for Determining Structural
Design Limit Pressures on High Performance Marine Vehicles ,
Proc.
Advanced Marine Vehicles Con/.. AIAA/SNAME, Paper AlAA 78-754. San
Diego, USA. Apr. 1978
E12. Mabuchi, T., Kunitake, Y. and Nakamura. H., A Status Report on Design and
Operational Experiences with the Semi-Submerged Catamaran (SSC) Vessels ,
Proc.lnt. Conf. on SWATH Ships and Advanced Multi-Hulled Vessels,
RINA, Paper No.5, London. Apr. 1985
E13. Takeuchi, M., Takagawa, S., Miyanabe, R. and Watanabe, T., Structural
Design of the Semi-Submerged Catamaran-Type Underwater Work Test Vessel .
JAMSI'EC.
Technical Report No. 15. 1985
E14. Ozawa. H., The Design and Operation of Catamaran Vessels , Trans.
NEC/ES,
Vol. 103, 1986-1987
EIS. Akita, Y. et al, On the Program System for Design and Analysis of Offshore
Structures ,
Journal of SNAME of Japan.
Vol. 126, Dec. 1969
E16. Milner, R., The World's First 30-knot Fast Displacement Catamaran (SWATH)
Ferry , Proc.; The 7th Int. High Speed Surface Craft Conf., London. Jan. 1990
E17. Editor ofFFl, First FBM Marine FOC 400 on Trials ,
Fast Ferry International,
Dec. 1989
E18. Milner, R. and Warren, N., Presentation by FBF Marine Ltd. , Proc. Int.
Conf. on SWATH Ships and Advanced Multi-Hulled Vessels II.
RINA, Paper
No. 20, London, Nov. 1988
E19. Blyth, A., SWATH Passenger Ship Development , Fast Ferry International,
March 1989
E20. Lang, T.G., et.al., Preliminary Design Study of a 3000-Ton S3 - A High
Performance Semisubmerged Ship for Naval Operation , Technical Report.,
NUC
TN
574, San Diego, CA, USA, Sept. 1971.
E21. Lang, T.G., et.al., Naval Feasibility Study of the S3 - A New Semisubmerged
Ship Concept ,
Technical Paper.
NUC TP 235, Part IV. San Diego. CA. USA.
Sept. 1970
E22. Stevens. R.M., New Dimensions for Naval Catamarans . NSRDC, Report
3830. Bethesda. Maryland. USA. May 1972
E23. Nappi. N.S. and Lev. F.M., Midship Section Design for Naval Ships ,
NSRDC. Report 3815, 1972
AppendixE
E-19

7/26/2019 1992djatmikophd.pdf
http://slidepdf.com/reader/full/1992djatmikophdpdf 482/507
E24. Pieroth, C.G. and Lamb, G.R., The SWATH Options as a V/STOL Aircraft
Carrier ,
SNAME,
Hampton Roads Section, March 1985
E25. Gupta, S.K. and Schmidt, T.W., Developments in SWATH Technology ,
Naval Engineers Journal,
ASNE, Vol. 98, No.3, pp. 171-188, May 1986
E26. Loscombe, R., An Exploratory Study of Alternative Structural Materials for
Small SWAm Craft ,
Ship Science Report,
No. 34, Dept. of Ship Science,
Univ. of Southampton, May 1987
E27. Loscombe, R., An Exploratory Study of Alternative Structural Materials for
Small SWAm Ships ,
Int. Shipbuilding Progress,
Vol. 35, No. 404, pp. 331-
347, Dec. 1988
E28. Loscombe, R., Key Aspects of the Structural Design of Small SWATH Ships ,
PhD Thesis,
Dept. of Ship Science, Univ. of Southampton, Dec. 1989
E29. Sellars, F.H., Water Impact Loads ,
Marine Technology,
SNAME, Vol. 13,
No.
I,
pp. 45-68, July 1991
E30 Allen, R.G. and Jones, R.R., A Simplified Method for Determining Structural
Design-Limit Pressure on High Performance Marine Vehicles ,
Proc.
AIAAISNAME Advanced Marine Vehicles Con ,
Paper No. 78-754, April 1978
E31. Betts, C.V., Some UK Development in SWATH Design Research ,
Proc. Int.
High-Performance Vehicle Conf.,
CSNAME, Paper VI-I, Shanghai, China,
Nov. 1988
E32. Betts, C.V.,
et.al.,
Design Study for an Anti-Submarine Warfare SWATH
Frigate ,
Proc. Int. Conf, on Anti-Submarine Warfare,
RINA, London, May
1987
E33. Henry, B.B., Figes, K.J. and Dunaud, P., SWATH Single Role Minehunter ,
Proc. WARSHIP'89,
RINA, Vol. 2, Paper No. 32, London, May 1989
E34. Gates, P.J., Cellularity : An Advanced Weapon Electronics Integration
Technique ,
The Naval Architect,
RINA, May 1986
E35. Smith, C.S., Buckling Problems in the Design of Fibreglass-Reinforced Plastic
Ships ,
Journal of Ship Research,
SNAME, Sept. 1972
E36. Lee, K-Y, Lee, D-K, Kim, E-S, Kim, J-O, and Kim, J-H, On the Design
Technology of SWAm High Speed Passenger Ship ,
Proc.lnt. Conf. on
SWATH Ships and Advanced Multi-Hulled Vessels II,
RINA, Paper No. 17,
London, Nov. 1988
E37. Sikora, J.P., Dinsenbacher, A. and Beach, J.E., A Method of Estimating
Lifetime Loads and Fatigue Lives for SWATH and Conventional Monohull
Ships ,
Naval Engineers Journal,
ASNE, Vol. 95, pp. 63-85, May 1983
E38. Hadler, J.B., et.al., Ocean Catamaran Seakeeping Design Based on the
Experiences of USNS 'Hayes'
I t , Trans. SNAME,
Vol. 82, pp. 126-161, 1974
E39. Schaffer, R.L., Kupersmith, J.A. and Valsi, T.J., Explosive Ordnance Disposal
SWAm Ship Design ,
Marine Technology,
SNAME, Vol. 28, No.4, pp. 181
196, July 1991
E40. Kraine, G.L., Producibility in Ship Design ,
Journal of Ship Production,
SNAME, Vol. 6, No.4, pp. 256-267, Nov. 1990
E41. De Vries, R.L., Producibility Benefits of the SWATH Configuration ,
Marine
Technology,
SNAME, Vol. 28, No.1, pp. 23-29, Jan. 1991
A ppen dix B
E-20

7/26/2019 1992djatmikophd.pdf
http://slidepdf.com/reader/full/1992djatmikophdpdf 483/507
A ppe ndix E
Table El. Main Particulars of the Halcyon fEll
- - - - - - - - - - - - - - - - - - - - - - - - - - - - - - - - - - - - - - - - - - - - - - - - - - - - - - - - - - - - - - - - - - - - - - - - - - - - - - - -
Length overall (LOA)
Maximum beam (Bmax)
Nominal draught (T)
Full load displacement (~)
Lightship displacement
Cargo deck area
No. of passengers
Cargo load
Crew
Maximum speed (Vmax)
Cruise speed (V)
60.00 ft
30.00 ft
7.00
ft
5710ngtons
4310ngtons
589.00 ft
2
20
5.25 longtons
3
>20.0 knots
18.0 knots
Table E2. Structural desien safety factors for the Halcyon [Ell
Condition
Yield strength
Operational
1.15
Ultimate strength 1.50
• local yielding is allowed
Emergency
1.00'
1.20
V-Line
No Req't
1.20
Table E3. T-AGOS 19 principal characteristics f E 71
- - - - - - - - - - - - - - - - - - - - - - - - - - - - - - - - - - - - - - - - - - - - - - - - - - - - - - - - - - - - - - - - - - - - - - - - - - - - - - - -
Length overall (LOA)
Beam on design waterline
Beam maximum (Bmax)
draught (T)
Full load displacement (~)
Lightship displacement
Transit speed (V)
Towing speed
Propulsive power
234.00 feet
80.00 feet
93.00 feet
24.75 feet
3380 tonnes
2680 tonnes
9.5 knots
3.0 knots
2 x
800 SHP
E-21

7/26/2019 1992djatmikophd.pdf
http://slidepdf.com/reader/full/1992djatmikophdpdf 484/507
AppendixE
Table £4, Principal dim ensions of M V 'Ali' rE9l
L eng th o verall (LOA)
B eam maximum (Bmax)
Draughtcn
H ull diam eter (d
H
)
Strut thickness (t
s
)
WP
A coefficient (C
w
)
Prisma tic coef fic ient ( ' 1 »
Disp la cemen t (~ )
M axim um speed
(V
max)
10.475 m
5,OOQm
1.600 m
1.000m
0,600m
0,920
0.820
21.00 tonnes
8 ,0 k no ts
- - - - - - - - - - - - - - - - - - - - - - - - - - - - - - - - - - - - - - - - - - - - - - - - - - - - - - - - - - - - - - - - - - - - - - - - - - - - - - -
Table E5, Principal dim ensions of the K aiyo rE12l
- - - - - - - - - - - - - - - - - - - - - - - - - - - - - - - - - - - - - - - - - - - - - - - - - - - - - - - - - - - - - - - - - - - - - - - - - - - - - - - - - - - - - -
Len gth o verall (LOA)
Length between perpend icula rs
(Lpp)
Beam mou lded
(B
m1d
)
Dep th mould ed
(Dmtd)
Max imum draug ht
(T
max)
Displa cemen t (~ )
Deadweight (OWl)
Normal speed (V)
M aximum speed (Vmax)
61.55 m
53,00 m
28.00 m
10,60 m
6.30/5,00 m
3000 - 3500 tonnes
1159 to nn es
1 3.2 5 k no ts
1 4.00 k no ts
- - - - - - - - - - - - - - - - - - - - - - - - - - - - - - - - - - - - - - - - - - - - - - - - - - - - - - - - - - - - - - - - - - - - - - - - - - - - - - - - - - - - - -
Table E6 Com parison of w eight and m anufacturing costs [E12l
Hull ma te ria l
- - - - - - - - - - - - - - - - - - - - - - - - - - - - - - - - - - - - - - - - - - - - - - - - - - - - - - - - - - - - - - - - - - - - - - - - - - - - - - -
Hul w eight
Index
Cost
Index
- - - - - - - - - - - - - - - - - - - - - - - - - - - - - - - - - - - - - - - - - - - - - - - - - - - - - - - - - - - - - - - - - - - - - - - - - - - - - - -
All H -T Steel
All Alumin um A llo y
H -T Steel and Alum. A llo y
1.00
0.55
0.70
1.00
3.10
2.10
E-22

7/26/2019 1992djatmikophd.pdf
http://slidepdf.com/reader/full/1992djatmikophdpdf 485/507
Table E7. M ain particulars of the Patria [E17]
L en gth o verall (LOA)
Leng th wa te rlin e
(L
W L)
B eam overall (Bm ax)
Depth
(D)
Full lo ad d rau gh t
(T
max)
D isp la cemen t (~ )
Maximum speed
C V
max)
C ruise speed (V )
36.40 m
21.70 m
13.00
m
5.80m
2.70m
±
180 tonnes
32.10 knots
30.00 knots
T able E 8. G eneral characteristics fo r a 3OOO -tonS 3 [E20l
- - - - - - - - - - - - - - - - - - - - - - - - - - - - - - - - - - - - - - - - - - - - - - - - - - - - - - - - - - - - - - - - - - - - - - - - - - - - - - - - - - - - - -
Disp la cemen ts (~ )
Length
(L)
Beam (B)
Maximum d rau gh t
(T
max)
U nde rdeck c learance
H ull diam eter (d
hu U
)
S trut thickness (t
s
)
M axim um speed (V m ax)
E ndurance at 25 knots
Endurance at 10 knots
3000 tons
315 feet
137 feet
28 feet
1 4 fe et
1 4 feet
5 feet
35 knots
3000 - 5000 nm iles
1 5000 nm ile s
- - - - - - - - - - - - - - - - - - - - - - - - - - - - - - - - - - - - - - - - - - - - - - - - - - - - - - - - - - - - - - - - - - - - - - - - - - - - - - - - - - - - - -
T able E 9. H ull fraction estim ates for the 3O OO -tonS3 [E20l
- - - - - - - - - - - - - - - - - - - - - - - - - - - - - - - - - - - - - - - - - - - - - - - - - - - - - - - - - - - - - - - - - - - - - - - - - - - - - - - - - - - - - - - - - -
SUbSJnl~tlJ~
Apw:oa~h 1
Appma~h
2
ApprOilkb
3
Subme rg ed h ulls
0.1
0.076
0.071
Vertic al s tru ts
0.2
0.157 0.130
Above-wa te r p la tfo rm
aa
aza
U22
Total 0.6
0.484
0.400
- - - - - - - - - - - - - - - - - - - - - - - - - - - - - - - - - - - - - - - - - - - - - - - - - - - - - - - - - - - - - - - - - - - - - - - - - - - - - - - - - - - - - - - - - -
~
A pproach 1 : C onventional approach, w ith plate and stringer com b. structure
A pproach 2 : C onventional approach, w ith alum inum and cellular structure
A pproach 3: Fram e analyis approach
AppendixE
E-23

7/26/2019 1992djatmikophd.pdf
http://slidepdf.com/reader/full/1992djatmikophdpdf 486/507
Table EIQ. List of structural components and loads rE201
- - - - - - - - - - - - - - - - - - - - - - - - - - - - - - - - - - - - - - - - - - - - - - - - - - - - - - - -
- - - - - - - - - - - - - - - - - - - - - - - - - - ~ - - - - - - - - -
Component
LQrul
Strength Crit~ria
- - - - - - - - - - - - - - - - - - - - - - - - - - - - - - - - - - - - - - - - - - - - - - - - - - - - - - - - - - - - - - - - - - - - - - - - - - - - - - - - - - - - - - - - - - - - - -
Fwd-Stbd Strut
Spreading Force, I-Flexure
and Wave Slap, Armour PIA Impact
Fwd-Port Strut
Column Load
I-Budding
Fwd Deck Cross
Spreading Force
I-Flexure
Member
Out of phase P
s(hear)
I-Flexure
Self Weight
I-Flexure
Deck Load
I-Flexure
Deck Housing
H-Torsion
Aft-Stbd Strut
Spreading Force,
I-Flexure
and
Wave Slap, Armour
PIA
Impact
Aft-Port Strut
Column Load
I-Buckling
Aft Deck Cross
Spreading Force
I-Flexure
Member
Out of phase
Ps
I-Flexure
Self Weight
I-Flexure
Deck Load
I-Flexure
Stbd Deck Member
Spreading Force
J-Torsion
and
Two-Point, Dry-Dock Load
J-Torsion
Port Deck Member
Self Weight
I-Flexure
Deck Load I-Flexure
Deck Housing
I-Flexure
Out of phase Ps
I-Flexure
Aft Stabiliser
Spreading Force
PIA
Axial
Tension,Compssn.
Port Hull
Hydrostatic Load
PR/t Membrane
and
PeR - Buckling
StbdHull
Spreading Force
J-Torsion
Buoyant Force I-Flexure
- - - - - - - - - - - - - - - - - - - - - - - - - - - - - - - - - - - - - - - - - - - - - - - - - - - - - - - - - - - - - - - - - - - - - - - - - - - - - - - - - - - - - - - - - - - - - -
Table Ell. Densities of primary bull stnlcnlre lE221
- - - - - - - - - - - - - - - - - - - - - - - - - - - - - - - - - - - - - - - - - - - - - - - - - - - - - - - - - - - - - - - - - - - -
Strucrure
Density (lb/ft
3
1
- - - - - - - - - - - - - - - - - - - - - - - - - - - - - - - - - - - - - - - - - - - - - - - - - - - - - - - - - - - - - - - - - - - -
Escort (monohull) 5.7
Helicopter Carrier (monohull) 4.9
ASR (catamaran) 7.5
Hydrofoil (aluminum)
2.3
Landing Sbip Dock (monohull) 5.5
- - - - - - - - - - - - - - - - - - - - - - - - - - - - - - - - - - - - - - - - - - - - - - - - - - - - - - - - - - - - - - - - - - - -
AppendixE
E-24

7/26/2019 1992djatmikophd.pdf
http://slidepdf.com/reader/full/1992djatmikophdpdf 487/507
T able E12 Structural density for the 43O Q-T on LW P £ E221
Structure
%
of Total Hull vol.
Br idg ing p la tform
Struts
Lower h ulls
6.5
8.2
8.0
58
24
18
Table E13. M ain dim ensions of SW AIR 83 £ E241
Len gth o vera ll (LOA )
Length b etween perp endicula rs (Lpp)
Beam maximum (Broax)
Depth (0)
Draught (T)
Displacement
(6)
Cru is in g spe ed (V)
M axim um speed (V
max)
Endurance at 20 knots
140.80 m
128.00 m
44.oom
26.33 m
11.58 m
15,0 67 tonn es
20.00 knots
28.00 knots
7 50 0 nmile s
- - - - - - - - - - - - - - - - - - - - - - - - - - - - - - - - - - - - - - - - - - - - - - - - - - - - - - - - - - - - - - - - - - - - - - - - - - - - - - - - -
Table E14. Hull applied loads for SW Am 83 fE241
- - - - - - - - - - - - - - - - - - - - - - - - - - - - - - - - - - - - - - - - - - - - - - - - - - - - - - - - - - - - - - - - - - - - - - - - - - - - - - - - - - - - - - - - - - -
Circula r hulls :
E xternal (crushing 38 ft head
+
4.5 psi w ave)
Internal (bursting) 8 8ft head (ballast in fuel tank
less 1 0.9 psi external p ressu re
Shell p la tin
I:;
Bow (u nd ersid e) cro ss stru ctu re
F lat (u nd dersid e) cro ss stru ctu re
D ead rise sectio ns o f cro ss stru ctu re
S tru t in sid e v ertic al fa ce
She er o utsid e flare
Bulkheads:
Head of salt water to m ain deck (68'.0 )
Fuel tank bulkheads head to flight deck (88'.0 )
Flight (02) and hangar (m ain) decks:
0 2 le vel (flig ht d eck )
NC area
concentra ted loads
C lear of
NC
parking
M ain (hangar) sim ilar to 02 level
AppendixE
3,024 PSF
4,060 PSF
7,368 PSF
2,105 PSF
2,575 PSF
1,065 PSF
1,368 PSF
4,350 PSF (max)
5,625 PSF (m ax)
27,7501bs
1,000 PSF
E-25

7/26/2019 1992djatmikophd.pdf
http://slidepdf.com/reader/full/1992djatmikophdpdf 488/507
Table E15, M ain dim ensions ora 70-tonne SW ATIl Feny lE26]
- - - - - - - - - - - - - - - - - - - - - - - - - - - - - - - - - - - - - - - - - - - - - - - - - - - - - - - - - - - - - - - - - - - - - - - - - - - - - - -
Length o ve ra ll (LOA)
Length of hull (4ul1)
D iam eter o f hu ll (d
huU
)
L ength of stru t
(Ls)
Beam (B)
Depth
(D)
Draught (1)
Displa cemen t (~ )
M axim um speed (V
max)
Cru is in g spe ed
(V)
Endurance
19,50 m
17.90 m
1.50m
18.50 m
9.20m
4.25m
2.20m
7 0.00 ton nes
24.00 knots
1 8,0 0 k no ts
4 00 nm iles
- - - - - - - - - - - - - - - - - - - - - - - - - - - - - - - - - - - - - - - - - - - - - - - - - - - - - - - - - - - - - - - - - - - - - - - - - - - - - - -
Table
E 17.
Genernl character is tics of the ASW SW A TIl rE321
- - - - - - - - - - - - - - - - - - - - - - - - - - - - - - - - - - - - - - - - - - - - - - - - - - - - - - - - - - - - - - - - - - - - - - - - - - - - - - -
Displacements (6)
Bolt length (Lbo
x)
Hu ll le ng th ~ull)
Str ut length (Ls)
Beam (B)
Maximum draug ht
(T
max)
Underdeck c lear ance
Hu ll d iamete r v ertic al (d
hull
-
v
)
Hull d iam eter h oriz .
(d
hutl
-
h
)
Str ut th ickness
(t
s
)
Maximum
speed
(Vmax)
4 67 8 to nn es
102.00 m
107.00 m
92,oom
28.oom
10.oom
4.90m
4.40m
6.60m
3.30m
2 8.0 0 k no ts
- - - - - - - - - - - - - - - - - - - - - - - - - - - - - - - - - - - - - - - - - - - - - - - - - - - - - - - - - - - - - - - - - - - - - - - - - - - - - - -
T able E 18, G eneral characteristics of the S RM H SW A TIllE 331
- - - - - - - - - - - - - - - - - - - - - - - - - - - - - - - - - - - - - - - - - - - - - - - - - - - - - - - - - - - - - - - - - - - - - - - - - - - - -
Displacements (6)
BOltlength
(Loox)
J
lu ll length (LhuU)
Str ut leng th
(Ls)
Beam (B)
Maximum d rau gh t (T
max)
Underdeck c lear ance
Hull d iameter vertical (d
hull
-
v
)
HuJJ diameter horiz. (d
hull
-
h
)
Strut th ickness (t
5
)
Maximum speed (V m ax)
9 25 to nn es
41.90
m
52.30
m
41.90 m
20.00m
4,60m
2.60m
2.87m
4.59m
1.60m
14.5 0 k no ts
. _ ..
- - - - - - - - - - - - - - - - - - - - - - - - - - - - - - - - - - - - - - - - - - - - - - - - - - - - - - - - - - - - - - - - - - - - - - - -
App~ndi%E
E-26
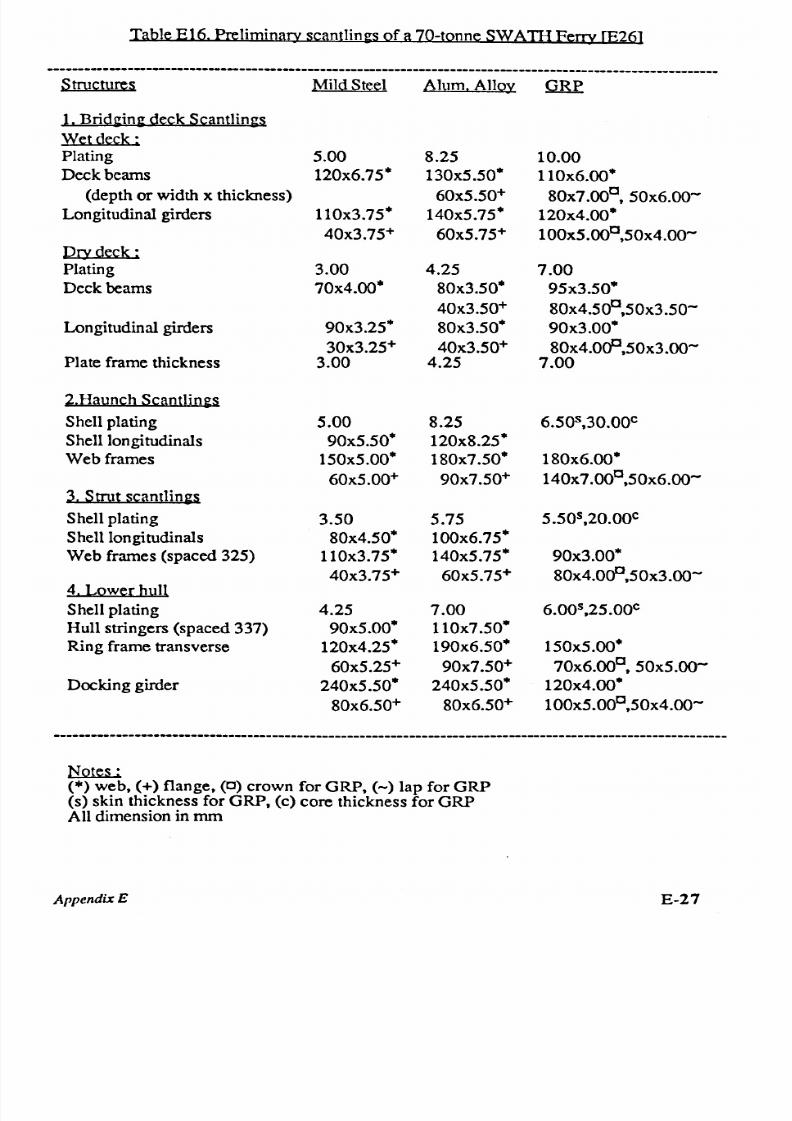
7/26/2019 1992djatmikophd.pdf
http://slidepdf.com/reader/full/1992djatmikophdpdf 489/507
Table E16, Preliminary scant1in~s of a 70-tonne SWATH Feny [£261
- - - - - - - - - - - - - - - - - - - - - - - - - - - - - - - - - - - - - - - - - - - - - - - - - - - - - - - - - - - - - - - - - - - - - - - - - - - - - - - - - - - - - - - - - - - - - - - - - - - - - - - - - - - -
Structures
MiIdSteel
Alum, Alloy
Q R £
1 .
Brict~in~ Q~~kS~i nt1ings
Wet deck :
Plating 5,00
8,25
10.00
Deck beams
120x6,75·
130x5.50· 11Ox6,00·
(depth or width x thickness) 60x5.50+
80x7,ooc, 50x6,OO-
Longitudinal girders 110x3.75·
140x5.75·
120x4,00·
40x3.75+
60x5.75+ 100x5,ooc,50x4,00-
Dzydeck:
Plating
3.00 4.25
7.00
Deck beams
70x4.oo·
80x3.50·
95x3.50·
40x3.50+
80x4.50
c
,50x3.50-
Longitudinal girders
90x3.25· 80x3.50·
90x3.00·
30x3.25+ 40x3.50+
80x4.0(fl,50x3.oo-
Plate frame thickness
3,00
4.25
7.00
2,Hi.um~h S~aD1lin~s
Shell plating
5.00 8.25
6.50
s
,30.00
c
Shell longitudinals
90x5.50· 120x8.25·
Web frames 150x5,OO·
180x7.50·
180x6,OO·
60x5.00+ 90x7.50+ 140x7.00
c
,50x6.oo-
3 ,
Stntt S~i nI1ings
Shell plating
3.50
5.75
5.50
s
,20.00
c
Shell Iongitudinal s
80x4.50· 100x6.75·
Web frames (spaced 325)
1l0x3.75· 140x5.75·
90x3.00·
40x3.75+
60x5.75+
80x4,0(fl,50x3.oo-
4, Lower hull
Shell plating
4.25 7.00
6.00
s
,25.00
c
Hull stringers (spaced 337) 90x5.00· 110x7.50·
Ring frame transverse
120x4.25·
190x6.50· 150x5.oo·
60x5.25+
90x7.50+
70x6.oo
c
, 50x5.oo-
Docking girder
240x5.50·
240x5.50·
120x4.oo·
80x6.50+
80x6.50+ 100x5.00
c
,50x4.00-
- - - - - - - - - - - - - - - - - - - - - - - - - - - - - - - - - - - - - - - - - - - - - - - - - - - - - - - - - - - - - - - - - - - - - - - - - - - - - - - - - - - - - - - - - - - - - - - - - - - - - - - - - - - -
Notes:
(*) web, (+) flange, (C) crown for GRP, (-) lap for GRP
(s) skin thickness for GRP, (c) core thickness for GRP
All dimension in
mm
AppendixE
E-27

7/26/2019 1992djatmikophd.pdf
http://slidepdf.com/reader/full/1992djatmikophdpdf 490/507
Table E19, SmJctllraI scant1in~s for SRMH SWATIi rE33)
Structural
Superstructure
Cross Structure
Struts
Hulls
Details
Equivalent thickness: 8,0 mm
Plate thickness : 20,0 mm
Transverse frame spacing: 8,0 m
Stiffener Specifications:
12 table reinforcement plies
16 stiffener plies
Longitudinal spacing:
in the double bottom 2.25 m
in the haunch 1.25 m
in the balance 2,20 m
Plate thickness: 31.0 mm
Stiffener spacing: 0,80 m
Stiffener Specifications:
10 table reinforcement plies
14 stiffener plies
Plate thickness: 20,0 mm
Stiffener spacing: 0,80 m
Stiffener Specifications:
10 table reinforcement plies
12 stiffener plies
- - - - - - - - - - - - - - - - - - - - - - - - - - - - - - - - - - - - - - - - - - - - - - - - - - - - - - - - - - - - - - - - - - - - - - - - - - - - - -
Table E20, Principal Particulars of the HHI SWAm
Eero'
[E36)
- - - - - - - - - - - - - - - - - - - - - - - - - - - - - - - - - - - - - - - - - - - - - - - - - - - - - - - - - - - - - - - - - - - - - - - - - - -
Displacements (~)
Length overall (LOA)
Length between perpendiculars
(Lpp)
Breadth moulded
(Bmtd)
Depth moulded (Dmtd)
Designed draught
(1)
Underdeck clearance
Crusing speed (V)
132 tonnes
21.70 m
23,60 m
12.40 m
5,30m
2,60m
1.70m
25,00 knots
- - - - - - - - - - - - - - - - - - - - - - - - - - - - - - - - - - - - - - - - - - - - - - - - - - - - - - - - - - - - - - - - - - - - - - - - - - -
Table E21. Principal particulars of the EODSe SWA11I [E39)
- - - - - - - - - - - - - - - - - - - - - - - - - - - - - - - - - - - - - - - - - - - - - - - - - - - - - - - - - - - - - - - - - - - - - - - - - - - - - -
Full displacement (~)
Light displacement
Length overall (LOA)
Length between perpendiculars CLpp)
Beam overall (B
max)
BeamatDWL
Depth to superstructure (Dmax)
Draught to DWL
(1)
Operational speed (V)
73,30 tons
59,90 tons
63-0 feet-in
58-0 feet-in
30-0 feet-in
26-0 feet-in
24-0 feet-in
6-7
1
/2 feet-in
12,70 knots
- - - - - - - - - - - - - - - - - - - - - - - - - - - - - - - - - - - - - - - - - - - - - - - - - - - - - - - - - - - - - - - - - - - - - - - - - - - - - -
A ppe ndix E
E-28
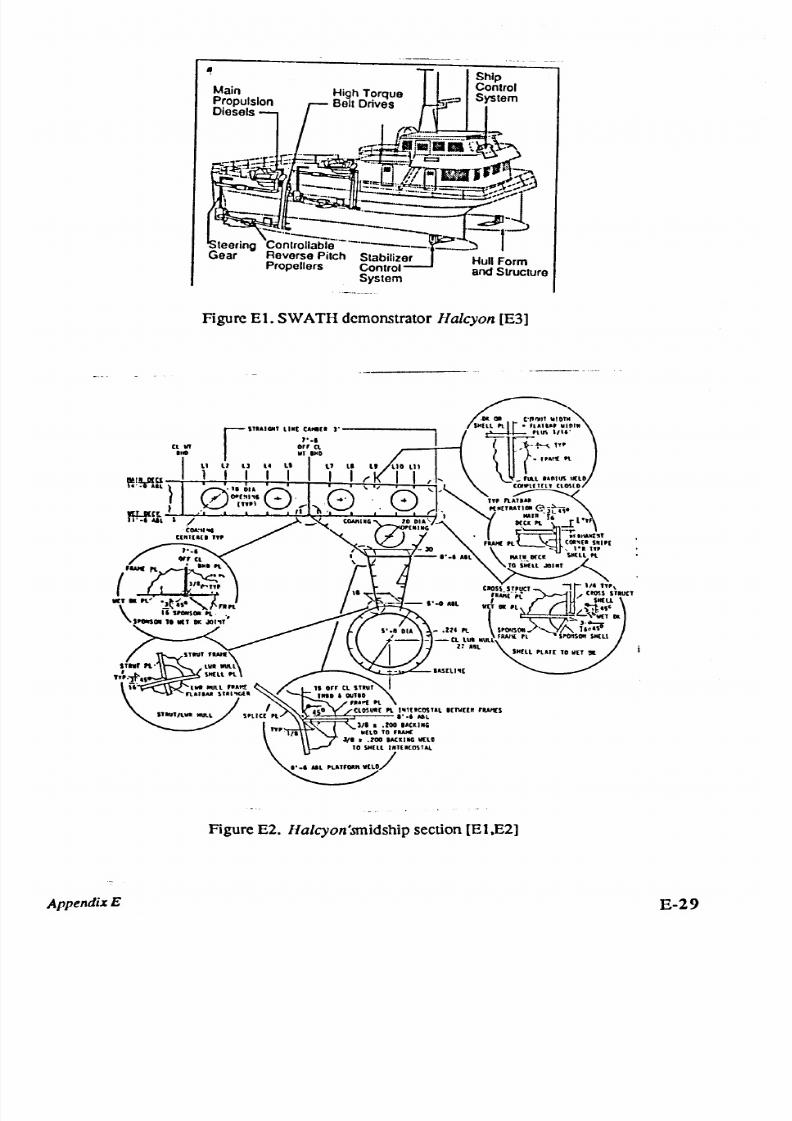
7/26/2019 1992djatmikophd.pdf
http://slidepdf.com/reader/full/1992djatmikophdpdf 491/507
Ship
Cont ro l
System
Figure El. SWATH demonstrator
Halcyon
[E3]
~ ¥lR}
Il[U(ct
- ' 1 ' r'-:-'-'-_......--L__.--'~~ --:~-:-'-_......:-:-'.:-:--+-I
IF~ I I
Figure E2.
Halcyon'.m1idship
section [EI
t
E2]
AppendixE
E-29

7/26/2019 1992djatmikophd.pdf
http://slidepdf.com/reader/full/1992djatmikophdpdf 492/507
Figure E3. T-A GO S 19 profile . p lan . bow and stem view s [E6.E7]
AppendixE
NAVY POINT DESIGN
Figure E4. M idship sections forT-A GO S 19 [E6,E7]
FINAL COUIolERCIAL DESIGN
E-30

7/26/2019 1992djatmikophd.pdf
http://slidepdf.com/reader/full/1992djatmikophdpdf 493/507
~' '.-> _ - .......-.-
1 . 3
E
Side
Force 16
z
z
-e
1 . 2
100
VI
,
:>
I
,
. .
l-
V
,.
-
Vl
. .
,
0
1.1
,
lJ.
,
80
c
,
QI
,
QI
'U
,' -t.lomenl
u
l-
V)
,
0
1.0
,
60
u.
QI
,
E
I
QI
I
'0
. . . .
I
V)
QI
0.9
,
L O
t2
I
..J
I
QI
,
:>
E
,
0
0 .8
,
j
,
2 0
E
,
c
,
QI
)C
,
E
0
~
0
z
0
2 0 0
600
1000
HOO
Drsprocement
( '.1 9)
Figure ES. D esign side load for small SWAT IIs [E 4]
:
\ /
: I,
: - o - . : : : _ - - - - - - - ~ I. ' '
._1.. I _' ....
I~_... '/.
It....
1 . - . .
F ig ure E6. F ish in g SWATH gen era l a rra ng ement [E9]
Al'ptndj~ E
E-31

7/26/2019 1992djatmikophd.pdf
http://slidepdf.com/reader/full/1992djatmikophdpdf 494/507
4 nun l ong it ud ln al bu lkhead
t
t
70
1 1 1 m x
5
mill I la ibnr
(583
mm
centres)
~
4 m m c ro ss struc ture
bulkhead
( 58 3 m il l c en tr es )
, 70mmx 5m lll
- ( Ilatbar '
-,
,
-,
-,
<,
70 nm l x 5 m m Ila tb ar
//
4 nu n sh ell platinj;
,
1
meire
70 m m x
S
n u n nalb:\ ' r i n g frames 70 I 1 I 1 I 1 X
5
1 1 1 1 1 1flatbar s t r i n g e r s
. ( 583 mm centres)
4 n u n she ll p la ti ng
Figure E 7. Fishing SW A TH m idship section [E9]
Ul.II-
:: ... -
3 _ : ;
'.1.·
F igure E 8. M idship section of the
Kaiyo
[E13]
A pp en dix E
E-32

7/26/2019 1992djatmikophd.pdf
http://slidepdf.com/reader/full/1992djatmikophdpdf 495/507
1111
t-I~I)
51~ :::HII 3Ll /
(.\1 CAn 11(12 J7~) . '.
planking type 1nl
9V1I f l f . 1 : >
3'1.tIO
f
b. HE3(I both sides
. 3'i I I I) fh
ffi:
30 botb sides
Figure E9. Typical framing section for the Pauia
----------_._- --_--
s nap ped nos
·1I1 i r b
- ....-_-,,-,-.L.,-,--.......:-:.
J.. 1I.L 1 . - I
1 . . J .. . . ..
I ~ : - r - ; - : . . .. I-
: i
I
j
I
I ;
i I : i I I I i
~- - ~- - . _ - J +- ~I - - ~- _ I _ - ~I _~~_~ _ _ I ~' _ J ~_ T . _ I ~I_~T__~r ~' _ T~I _ I ~: : ,
I I I _ ; , I
b =: '--- '0,0 snort j-a n e l tv re a c e r
I
I
I
';111:11 p lan k e srrusion members s toue d
1 - : - [
'Ii Cl Bh,J ~late
&
l\kl fIlled euc h side
I
T b8r~ su aped
at 4~ at e n ds
'01'.1 f b __
Lu n g l HI 3 0
'.
-'-
', III I 61:3
3~ '~,o
8x~ 3)
Tb HE30'Alcan 19'( '6)
Eu lk he ad suff'e ners
..' 7611 1~ .2L :g J o.I
0
s b f)lIlb bar
, cc liar filled ill >;lo'ay
f
bulb bar
I
i
cl;
I
I
I
Figure ElO. Bulkhead arrangement for the
Patr ia
Appendix E
E-33

7/26/2019 1992djatmikophd.pdf
http://slidepdf.com/reader/full/1992djatmikophdpdf 496/507
Figure Ell. Basic configuration of the 3000-ton S 3 [E20)
ABOVE·WATER PLATFORM
CONCEPT
-~c - .
~~U00'_'
. ~
. .
VERTICAL STRUT
CONCEPT
BASIC HULL
STRUCTURAL WEIGHT/DISPLACEMENT
RATIO -0.40
ALL ALUMINUM WELDED CONSTRUCTION
MARINE ALLOYS: 6061·T651
5454·H117
STRUCTURAL SHAPES
EXTRUDED CELLULAR SANDWICH
EXTRUDED TEE PANELS
MODULAR CONSTRUCTION
Figure E 12. Structural configuration of the 3000-ton S 3
Conceptual Subsystems [E20]
A ppendix E
E-34

7/26/2019 1992djatmikophd.pdf
http://slidepdf.com/reader/full/1992djatmikophdpdf 497/507
· 1
I.. •.•_. _
~ _•••• ~ ,•••
~ u ._ _ _ .
• _ . _ . . . . 0 ; . . . . . . . . . . . . . . . . . , _ _ _ . .
. . . . .
. ~ f ; : . : : : : ~ . .
. . . . . . . . . . . . . . . . . . . . . . . . . . . . . . . . . . . . . . . . . . . . . . . . . . . . . . . . . . . . . . . . . . . . . . . . . . . . . . . . . . . . . . . . . . . . . . . . . . . . . . . . . . _
- _
, _
_ _ -
_ _ . -
.
Figure E13. Modular construction as proposed for the 3000-ton S 3 [E20]
_ _ _ ---,.
Figure EI5. SWATH83. V/STOL Aircraft Carrier [E24]
A ppendix E
.•.
E-35

7/26/2019 1992djatmikophd.pdf
http://slidepdf.com/reader/full/1992djatmikophdpdf 498/507
-
':I
I:
. . . . .
( 1 )
'0
M
. . . . . . .
~
;) ;)
N
OJ OJ
N
. . . . .
u
6
0;)
I:
M
~
'
...l
t/),
00
. . . . l
«
I:
c : :
,
. . . . .
9
~
«
Ol)
8
'0
1: .....
c< 1
o M
.... XI
C < : I
~
U . . c :
. . . . . .
( 1 ) 0 0
0
t/)='
. . .
c : :
0
0
,
M
S
. . c :
~
0
OJ)
c : :
~
( 1 ) . . . . .
$.4'
~
u
e
l ) ( 1 )
---
-
.....II)
a
u,
u
S
Cl')
- . : i
. . . . .
U .l
~
'
5 'n
. 1
g
ii:
-'
'0
\i
~
~
N
' ,
C F J
c : :
0
. . . . .
. . ,
u
( 1 )
II)
J
0..
. . . . .
; : 1
.c:
. . .
t/)
. . . .
~
ApI tid
E-36

7/26/2019 1992djatmikophd.pdf
http://slidepdf.com/reader/full/1992djatmikophdpdf 499/507
I
I
•
0
'. ;
~
.
~
t
. .
. .
~
r
1
~
~
f
1
. .
.
~
,
~
i
,
;. u.
i:
~
~
'~
'
3
.
~
~
•
,
,~
;;
0
'i
.
•
,
. .
r
. .
~
' .
1.
i
:' ~
{
.
~
,
J :
~
~
;
:..
1
. .
I
I
i
;u
~
-
I
~
. .
i
~
.~
~
b
:.
;
. .
'i
1
•
i
. .
' .
~
. .
,
1
4
~
;
;
,
,
s
i
;
f
i
'j
,
2
•
4
\
I
·
.;
s
. ..
6
-------,-
.
. '
. ,
:-
: :
•
';
2
E -
t
:..
. .
:.
.
i
.
. .
i
.~
:..
: :
-
. .
:
~
. .
I
~
i
·
- :.
.
,
' .
1
~,~
.~
I
I
:.
J
:. u
: . : .
·
•
~
I
fj~ .~.
,·.~;:a
.
1
'''
·
·
.
:; :
';
·
: : .
,
·
j
~
A ppendix E
E-37

7/26/2019 1992djatmikophd.pdf
http://slidepdf.com/reader/full/1992djatmikophdpdf 500/507
•
.~
t
-
?
.
.
)
,
.
0
'0
;-~
.
.j
.
E -
e
'~
~'
. .
.
I
<
~
~
~
~
~.
i
:
• \I :
S
J
. ;:
)
I
; 1
. .
•
•
:
·
~
~;
e -
·
;
oJ
·
~
-
~
' .
2
•
~
-
•
1
>
. ;
}
' ,
.
i
~
: :
0
:. :
~
,
-
~
:;
•
.
' .
.;
·
, --.
: . --- i
--r- I
I
i
i
.-
.: .;
. . . . .
.
~
1
~
i
.~
.;
?
~
. .
;
.
.
c
•
c
I
~
':~
,
.= .
.:
.
1
;
~
.::
;..
.
.
: 1
' .
v
.
.
'~
. . .
.
;
. .
2
;..
.
;,
.
i
Appendix E
E-38

7/26/2019 1992djatmikophd.pdf
http://slidepdf.com/reader/full/1992djatmikophdpdf 501/507
J
J
l
}
'0
' .
4
'~
. .
•
r
;
~
~
.J
i
•
- =
. .
}
s
•
e
~
·
. .
\I
. . .
'0
0
~
~
•
·
-; ,
e
~
~
~
'_
•
~
9
to
e-
,
. . . .
: .
2
~
J
~
~
. .
~
v
:,
.J
. .
·
.J
. .
6-
~
;...
,
;
>
2
. .
. .
:..
>
•
t
. .
j
i
,
0
. .
:
-
0
. .
. .
. ;
•
i
i
~
. .4
' .
;...
~
:
;:
.
. :
. .
;
i
= :
~
:
~
' .
;
~~~I
~r
I~i
.
F
.
Q
3
':
. . . . .
~
. .
W ~ :
~ ) 1
' .
;;I
, . . . . . ,
:
~I
~
c
B
~
til
c : : :
0
'l:
U
~
til
>.
• •
~
;
,_ .
~
.
. .
~;:
C'f)
l·
00
~
1
I
~
-
tI)
.
.
I
•
00
£ . .
;
0
. . . .
7
:
~
S
--
~
. .
6 b
:.
.
u : ;
~
~
(\: ,
.;
,
. . '
• • . . . 1
. .
~.,
' .
j ; . . s :
.
-
~
}
. .. . & :
< 0:
'S
'~
,. .
0
0;
;:;
~
; : : ' I
. .
'J
. .
v
;
1
.
W·
::.
.
;.
, '
' '
~
.
~
~
•
' .
'.
c
d
' E
Appen IX
E-39

7/26/2019 1992djatmikophd.pdf
http://slidepdf.com/reader/full/1992djatmikophdpdf 502/507
A ppendix E
m
.
.
.
: : .___j ;
r:-- ...
r-:: :
t:. - •
. ._
,
-
.
,
.
.
.
,--
t, .__,
~. : .:
'-.........:
i
I
;
,:
i
.
;
ii
~
i
I
,
;'
:1
l
i(
i _ I ] ' , : ; :
,..t:
...
.~
. .
_ _
i i
1
~
. . -. . . . . .
~
., .
';
. .
,J
:~,,')
f 'J
04.
1
~ _ : _ J
[ ,
- 1
L
I I
..
i.
1
..
I.
I
'
.,
j
In
I:
II
4 ;. t
Ii
::II
jZ
.
I
, .
I
I
I
I
,
,
e
1
~~
. .
,
•
1
s
I
I
I
1 1
. . .
,·i
t..;
; q
~
I
I
. .
- ,
E-40

7/26/2019 1992djatmikophd.pdf
http://slidepdf.com/reader/full/1992djatmikophdpdf 503/507
Appendix E
BRI DGI NG STRUCTURt ( TRANSVERSELY FRAMED)
( 1) 8 RAC ~ E T F RAN E
( LONGI TUDI NALLY FRAMED)
LOWER HULL ( LONGI TUDI NALLY FRAMED)
00
( 2) P L ATE F R A H E
Figure E20. Structural
arrangement
for small SWATH
(steel or
aluminium
alloy) [E26]
<,
CRP t oph&t s t i f f ener
( over non- s t r uc t ur al ( or . er )
CRP WEB
FRANE
( t ophat over non- s t r uc t ur al f or . er )
Sandwi c h c ons t r uc t i on
Figure E21. Structural
arrangement
for small SWATH (GRP) [£26]
E-41

7/26/2019 1992djatmikophd.pdf
http://slidepdf.com/reader/full/1992djatmikophdpdf 504/507
Figure E22. Isometric view of the ASW SWATH [E32]
s.....
T i .... L ... ·•·
1---- _o,-teA . ''
Figure E23. ASW SWATH structural midship section [E32]
Appendix E
E-42

7/26/2019 1992djatmikophd.pdf
http://slidepdf.com/reader/full/1992djatmikophdpdf 505/507
------
-
....nwoo
~~- r~~~~=2~L_~~~ __~~ ==~~ ~~ ~ - =~
. . . . . .
I
I
x
_ .
I
IU
< D
I
C : O O O O . . ' ' ' ' ' •
_ .
I
_,
I
...0
I
.....I
I
. . . . . . . . '
I I
Figure E24. SWATH single role mine hunter (SRMH) [E33]
Figure E25. General arrangement of Korean SWATH Ferry [E36]
Appendix
E
E-43

7/26/2019 1992djatmikophd.pdf
http://slidepdf.com/reader/full/1992djatmikophdpdf 506/507
\01[8 SP AU : 1500 MH
).5
U P P . D E C K
. .
15 X .SO X S I.A
2Q.QL.j
__ou___.--
(S:1/5)
~
· U Y '\ _ . .
~
(S,1I51
v,
-r=
$290
Figure E26. Midship section of Korean SWATH Ferry [E36]
a) Ordinary Section
b) Web Section
n
l2.O
( 10.0·
f
8.0
G '.(1
4.0
Figure E27. Combined stress distribution
at midship section [E36]
Figure E28. Von Mises equivalent stress contour
of web frame [E36]
Appendix E
E-44

7/26/2019 1992djatmikophd.pdf
http://slidepdf.com/reader/full/1992djatmikophdpdf 507/507
B t l
.:t~ O/AE~:
fO~I ':'
81fT
_ '--' 5wEJ~--:
::lET ~IT
;.t-I(
J ' iOO~
fi \
0 ; 2 1 1 1
t=r; ----:
'-~u:;
a.1H;I't
:xJe;l
MAIN DECK
\
:;EC';~~~~~
, ~oGHTS
I
qE~.Jv 'Bl.(
s~ ,.o<() s
, ~IHR ~S-
~
I
I
- R A O A O
RE...av..a~E'
j
r HQRN
r : ; : . J , . . . d ' -
;>OT\.01
T
\