1992 annual report - s1.q4cdn.coms1.q4cdn.com/579586326/files/doc_financials/ar1992.pdf · 1992...
TRANSCRIPT
1992 Annual Report

10/14/99 3:05AM
2
F A I R F A XL O G O
1992 Annual Report
Contents
Eight Year Financial Highlights x
Corporate Chart x
Corporate Profile x
Chairman's Letter to Shareholders x
Fairfax Consolidated Financial Statements x
Notes to Consolidated Financial Statements x
Auditors' Report to the Shareholders x
Valuation Actuary's Report x
Management's Discussion and Analysis x
Fairfax Insurance Companies � Combined Financial
Statements x
Fairfax Consolidated Balance Sheets with Morden & Helwig Equity Accounted x
Morden & Helwig Group Inc. � Consolidated Financial Statements x
Ten Year Consolidated Financial Summary x
Corporate Information x
10/14/99 3:05AM
3
FAIRFAX FINANCIAL HOLDINGS LIMITED
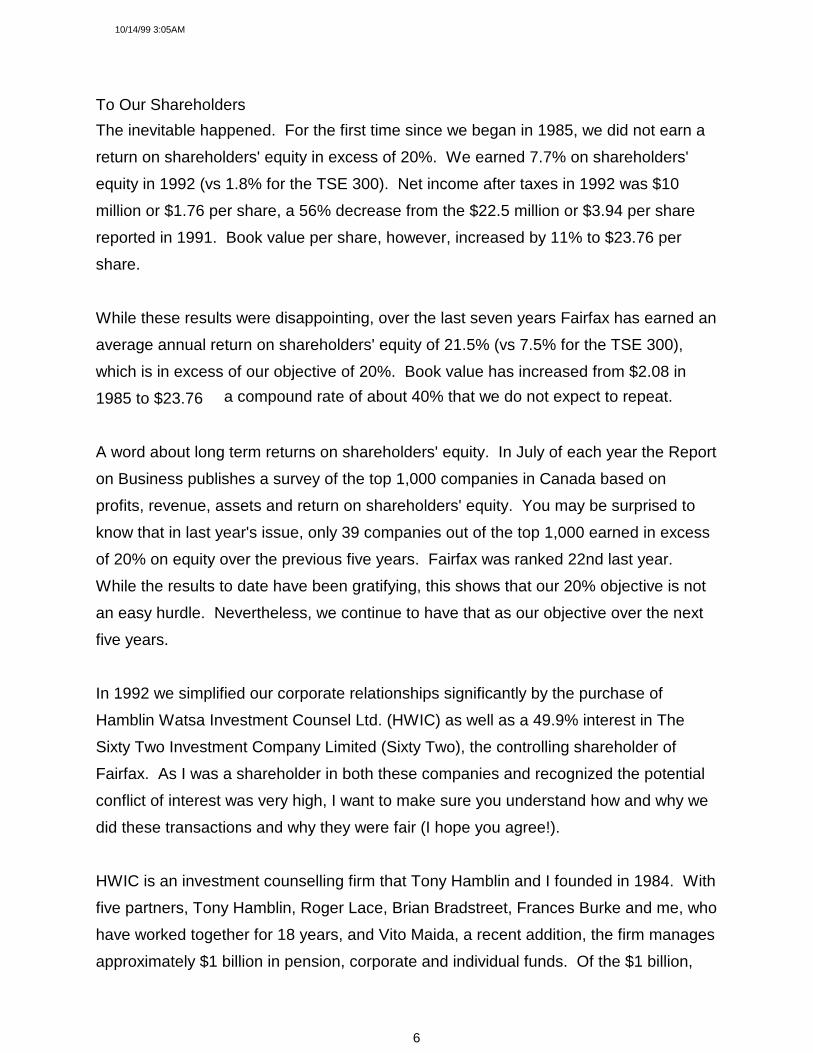
Eight Year Financial Highlights
(in thousands except per share data)
1992 1991 1990 1989 1988 1987 1986 1985
Total revenue 286,830 250,002 195,430 125,754 133,649 112,971 53,733 17,015
Net earnings 10,045 22,515 21,306 16,741 14,357 16,019 6,548 (910)
Total assets 590,548 516,564 535,987 248,065 246,786 185,413 129,845 41,477
Shareholders' equity 143,818 116,775 94,676 90,830 74,176 61,048 41,275 10,379
Shares outstanding � year-end 6,055 5,455 5,477 7,316 7,322 7,337 7,007 5,000
Return on average equity 7.7% 21.3% 23.0% 20.3% 21.2% 31.3% 25.4% �
Per share
Net earnings � fully diluted 1.76 3.94 2.92 2.25 1.94 2.23 1.35 (1.89)
Shareholders' equity 23.76 21.41 17.29 12.41 10.13 8.32 5.89 2.08
Market prices per share
High 30.00 22.50 21.63 19.00 15.13 17.50 14.13 6.00
Low 21.75 10.75 8.88 14.00 11.75 10.50 6.00 3.00
Close 25.00 21.25 11.00 18.75 15.00 12.37 12.75 6.00

10/14/99 3:05AM
4
Corporate Chart goes on this page

10/14/99 3:05AM
5
CORPORATE PROFILE
Fairfax Financial Holdings Limited is a financial services holding company whose corporate objective is to achievea high rate of return on invested capital and build long term shareholder value. The company has been underpresent management since September 1985.
Commonwealth Insurance, based in Vancouver, was acquired in November 1990. It offers commercial propertyand oil and gas insurance in Canada, the United States and internationally, and commercial casualty insurance inCanada. In 1992 Commonwealth's gross premiums written totalled $161.3 million. Commonwealth has been inbusiness since 1947 and at year-end there were 123 employees.
Federated was acquired in January 1990, and is based in Winnipeg. Its two companies market a broad range ofinsurance products primarily for commercial customers. In 1992 Federated's gross premiums written totalled $43.2million, consisting of $34.5 million of property and casualty business and $8.7 million of life and group health anddisability products. Federated has been in business since 1920 and at the end of 1992 had 227 employees.
Markel Insurance is one of the largest trucking insurance companies in Canada and has provided the Canadiantrucking industry with a continuous market for this class of insurance since 1951. The company also insures smallamounts of property and casualty risks and continues to run off its former reinsurance business. In 1992 grosspremiums written were $47 million and the group had 73 employees.
Wentworth Insurance Company was incorporated in 1990 as a captive insurance company domiciled in Barbados. The company had total assets of $8.3 million at year-end.
Morden & Helwig Group Inc., acquired in 1986, is engaged in providing claims adjusting, appraisal and lossmanagement services to a wide variety of insurance companies and self-insured organizations across Canada, theU.S. and the U.K. In 1992 revenue totalled $139.3 million. The company was established in 1923, and at year-endthe group had some 1,700 employees located in 334 offices.
Hamblin Watsa Investment Counsel Ltd., acquired in 1992, provides discretionary investment management,primarily to pension funds and insurance companies, including the insurance company subsidiaries of Fairfax. Hamblin Watsa was founded in 1984 and at year-end managed approximately $1 billion with 11 employees.
10/14/99 3:05AM
6
To Our ShareholdersThe inevitable happened. For the first time since we began in 1985, we did not earn areturn on shareholders' equity in excess of 20%. We earned 7.7% on shareholders'equity in 1992 (vs 1.8% for the TSE 300). Net income after taxes in 1992 was $10million or $1.76 per share, a 56% decrease from the $22.5 million or $3.94 per sharereported in 1991. Book value per share, however, increased by 11% to $23.76 pershare.
While these results were disappointing, over the last seven years Fairfax has earned anaverage annual return on shareholders' equity of 21.5% (vs 7.5% for the TSE 300),which is in excess of our objective of 20%. Book value has increased from $2.08 in1985 to $23.76 � a compound rate of about 40% that we do not expect to repeat.
A word about long term returns on shareholders' equity. In July of each year the Reporton Business publishes a survey of the top 1,000 companies in Canada based onprofits, revenue, assets and return on shareholders' equity. You may be surprised toknow that in last year's issue, only 39 companies out of the top 1,000 earned in excessof 20% on equity over the previous five years. Fairfax was ranked 22nd last year. While the results to date have been gratifying, this shows that our 20% objective is notan easy hurdle. Nevertheless, we continue to have that as our objective over the nextfive years.
In 1992 we simplified our corporate relationships significantly by the purchase ofHamblin Watsa Investment Counsel Ltd. (HWIC) as well as a 49.9% interest in TheSixty Two Investment Company Limited (Sixty Two), the controlling shareholder ofFairfax. As I was a shareholder in both these companies and recognized the potentialconflict of interest was very high, I want to make sure you understand how and why wedid these transactions and why they were fair (I hope you agree!).
HWIC is an investment counselling firm that Tony Hamblin and I founded in 1984. Withfive partners, Tony Hamblin, Roger Lace, Brian Bradstreet, Frances Burke and me, whohave worked together for 18 years, and Vito Maida, a recent addition, the firm managesapproximately $1 billion in pension, corporate and individual funds. Of the $1 billion,

10/14/99 3:05AM
7
approximately $240 million are funds that originate from Fairfax's insurancesubsidiaries. From inception the firm was set up to manage a small number ofportfolios with a long term value-oriented philosophy. All the clients agreed to anincentive fee, resulting in HWIC being more investment driven than marketing-oriented. The company's long term results have ranked among those of the top investmentmanagers in Canada.
How did we value the firm? Firstly, we created an independent committee of our Board,chaired by Robbert Hartog. Secondly, we consulted Sir John Templeton, the dean ofthe investment counselling business and also a large shareholder of ours. After arrivingat a price that both Robbert and Sir John felt was fair, we obtained written approval ofthis transaction from all of the more than 50% of our minority shareholders that wecontacted. Thus, the valuation of $14 million ($1.85 million in cash and 433,773 Fairfaxshares valued at $28 per share) was considered fair and approved by our Board ofDirectors, the majority of our minority shareholders and all the partners at HWIC.
Why did HWIC make sense for Fairfax? Mainly, for the following three reasons:
1) It was a very good investment for Fairfax. Under very reasonable assumptions(i.e. no incentive fees or additional funds under management), Fairfax couldachieve its 20% return on investment. Also, a multiple of 3.8 times revenue and8 times pre-tax earnings was reasonable compared to private transactions andpublic valuations of investment counselling firms. Furthermore, we paid for mostof the purchase by issuing shares of Fairfax at a fair price of $28 per share.
2) It brought proven investment management into Fairfax.
3) It removed my perceived conflict of interest and placed all of my interests in onepot.
While we think HWIC will be an excellent investment for Fairfax, our purchase price, asNote 16 shows, was essentially all goodwill. We are amortizing this over 10 years eventhough we do not think there will be any decrease in goodwill over the years.
10/14/99 3:05AM
8
HWIC will continue to be run as a separate subsidiary with Tony Hamblin as President. We have maintained the incentives at HWIC by a fair structuring of revenue sharing. Iwelcome the partners and employees of HWIC to Fairfax and we look forward to someexcellent long term returns from our investment.
The purchase of the 49.9% interest in Sixty Two was basically to provide liquidity to theoriginal investors who backed me seven years ago, on terms attractive to Fairfax. SixtyTwo's only asset is shares of Fairfax and it has no liabilities. The shares of Sixty Twowere valued on the basis of the market price of the Fairfax shares owned by it, less aliquidity discount of 15%. As disclosed in Note 9, in essence Fairfax issuedapproximately 680,000 shares to acquire indirect ownership of about 800,000 of itsshares. The net result was that Fairfax effectively repurchased approximately 120,000of its shares (with a market value of over $3.3 million at $28 per share) for no cost. Book value and earnings per share will be about 2% higher because of this purchase. Sixty Two will continue to be controlled by me as it has been in the past. This purchasealso was approved by our Board of Directors, the majority of our minority shareholdersand all the investors in Sixty Two.
With the completion of these two transactions, Fairfax is much simplified in itsrelationships and perhaps more focused. Also, the purchase of the Sixty Two sharesbrings to an end (at least formally) the original partnership that refinanced Fairfax (thenknown as Markel Financial) in those early days in 1985. Looking back, these investorsmust have been special to have financed an almost bankrupt insurance holdingcompany led by a chairman with no corporate experience at all. There may, after all, besome truth in the definition of an entrepreneur � "Unreasonable conviction based on
inadequate evidence"! Even though this group will continue to be shareholders forsome time, I want to take this opportunity to thank them for their invaluable support,without which Fairfax would not have existed.
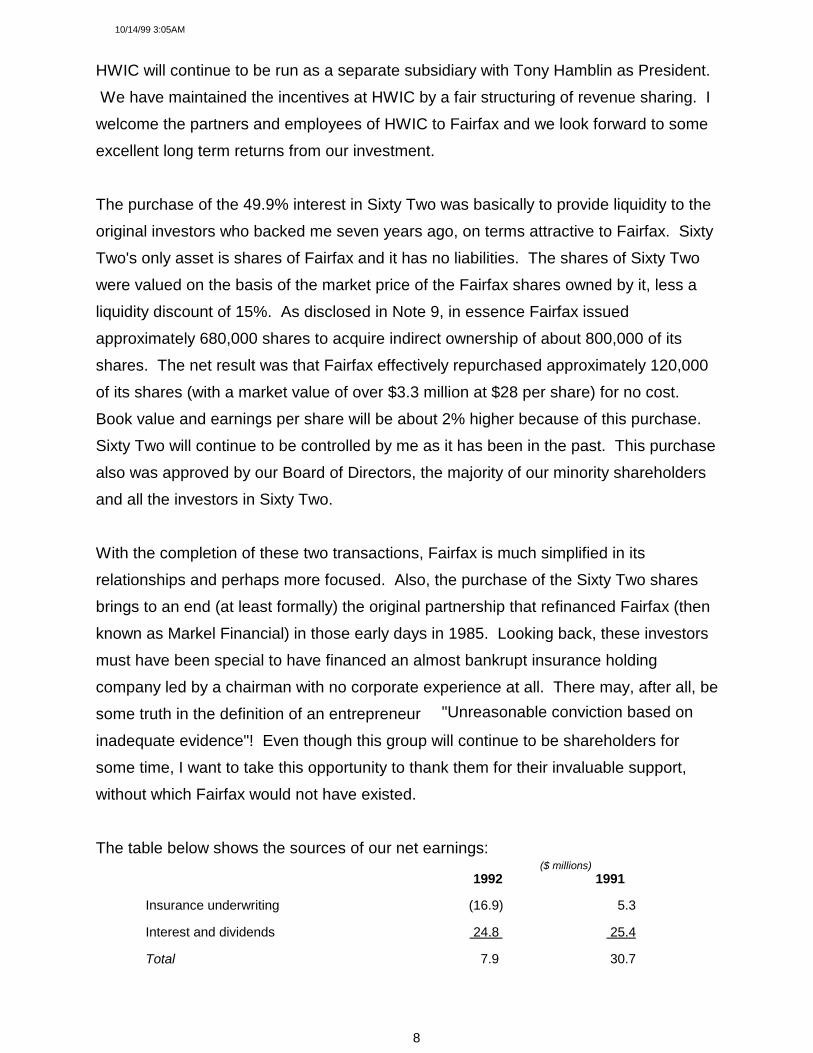
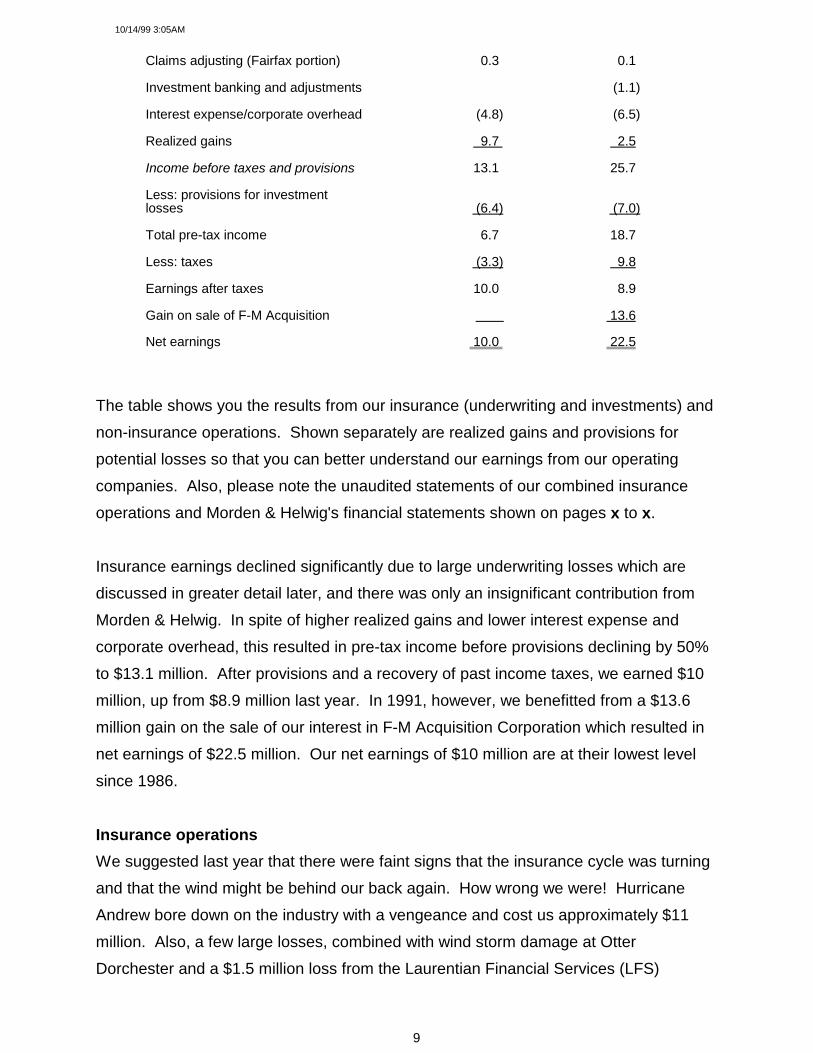
The table below shows the sources of our net earnings:($ millions)
1992 1991
Insurance underwriting (16.9) 5.3
Interest and dividends 24.8 25.4
Total 7.9 30.7
10/14/99 3:05AM
9
Claims adjusting (Fairfax portion) 0.3 0.1
Investment banking and adjustments � (1.1)
Interest expense/corporate overhead (4.8) (6.5)
Realized gains 9.7 2.5
Income before taxes and provisions 13.1 25.7
Less: provisions for investmentlosses (6.4) (7.0)
Total pre-tax income 6.7 18.7
Less: taxes (3.3) 9.8
Earnings after taxes 10.0 8.9
Gain on sale of F-M Acquisition � 13.6
Net earnings 10.0 22.5
The table shows you the results from our insurance (underwriting and investments) andnon-insurance operations. Shown separately are realized gains and provisions forpotential losses so that you can better understand our earnings from our operatingcompanies. Also, please note the unaudited statements of our combined insuranceoperations and Morden & Helwig's financial statements shown on pages x to x.
Insurance earnings declined significantly due to large underwriting losses which arediscussed in greater detail later, and there was only an insignificant contribution fromMorden & Helwig. In spite of higher realized gains and lower interest expense andcorporate overhead, this resulted in pre-tax income before provisions declining by 50%to $13.1 million. After provisions and a recovery of past income taxes, we earned $10million, up from $8.9 million last year. In 1991, however, we benefitted from a $13.6million gain on the sale of our interest in F-M Acquisition Corporation which resulted innet earnings of $22.5 million. Our net earnings of $10 million are at their lowest levelsince 1986.
Insurance operationsWe suggested last year that there were faint signs that the insurance cycle was turningand that the wind might be behind our back again. How wrong we were! HurricaneAndrew bore down on the industry with a vengeance and cost us approximately $11million. Also, a few large losses, combined with wind storm damage at OtterDorchester and a $1.5 million loss from the Laurentian Financial Services (LFS)

10/14/99 3:05AM
10
program (including termination costs), resulted in Markel having an underwriting loss of$5 million. The combined underwriting loss in our insurance operations of almost $17million was by far the largest loss we have had over the last five years (page x ]). On acombined ratio basis, we came in at 114%, way above our target of 100%. That's thebad news. The good news is that in the main we could not have prevented theselosses through better underwriting.
As suggested last year, Markel continues to focus on long haul trucking. By year-endMarkel had disposed of its farm business in Otter Dorchester to the North WaterlooMutual Insurance Company and cancelled its contract with LFS. Markel's businessincreased significantly in 1992 without any price discounting, partly because its largestcompetitor had financial problems. Markel had a combined ratio of about 115%excluding its discontinued lines. Bill Grant and his management team haveconsolidated Markel and focused it on long haul trucking. The trucking insurancebusiness, however, continues to be very competitive.
Since we bought it in 1990, Federated Insurance, under John Paisley's leadership, hasgone from a branch operation to an independent company with its own informationsystems. John and his management team continue to develop niche markets with acaptive sales force. Federated's property-casualty and life insurance operations'combined ratio was 104% in 1992, and the company is poised for achieving consistentunderwriting profitability.
Commonwealth, led by John Watson, had a difficult year in 1992 due to HurricaneAndrew which resulted in the company having a combined ratio of 122% � its worst
result in over five years. If not for Hurricane Andrew, Commonwealth's combined ratiowould have been 98%. Unlike Hurricane Hugo ($2.7 million) and the Oaklandearthquake ($1.4 million), Hurricane Andrew cost Commonwealth approximately $11million, even though gross losses for Hugo were somewhat larger. Commonwealthcontinues to realize price increases in many of its insurance lines and, barring anothermajor hurricane or earthquake, should contribute significantly to our earnings in 1993.
As mentioned in last year's annual report, there continue to be signs of a turn in theinsurance underwriting cycle. We may have the wind behind our back again after
10/14/99 3:05AM
11
having a headwind for five long years. While our insurance companies are writing morebusiness than in 1991, our operating leverage (net premiums to common equity)continues to be only 0.9:1 for Markel, 1:1 for Federated and 0.6:1 for Commonwealth,versus a potential of at least 2:1. Thus when the cycle turns we, unlike many insurancecompanies, have the capacity to increase our premiums manyfold.
As you know, since we began in 1985, we have had The Wyatt Company certify ourclaims reserves by company and in total. How accurate have we been in our estimationof claims reserves? Have we been consistently over-reserved or under-reserved? Tohelp you answer these and other questions, this year, for the first time, we haveprovided extensive disclosure on our total claims reserves in the section "Provision forclaims" beginning on page x. While this disclosure is mandatory in the U.S., it is not arequirement in Canada. However, we feel that this information will help you betterunderstand our insurance operations and we thus plan to disclose it annually. Whilethere are no guarantees, we continue to feel that we are adequately reserved.

10/14/99 3:05AM
12
Claims adjustingIn spite of Hurricane Andrew, Morden & Helwig had a disappointing year in 1992. While net income increased to $562,000 from $234,000 in 1991, the results are stillmuch below expectations. Ken Polley and his management team are working diligentlyto deal with the situations that arose from significant expansion in the U.S. while alsocoping with the poor claims environment in Canada. During 1992 Ken moved to theU.S., and we continue to be very confident that Morden & Helwig will return tosignificant profitability soon (to date I have been wrong!).
With the acquisition of the Renaud, Préfontaine group in Quebec, large capitalexpenditures for computerization and poor profitability, Morden & Helwig's long termdebt increased in 1992. However, with a long term debt to common equity ratio of0.4:1, Morden & Helwig continues to have a strong balance sheet � although less
strong than in the past.
Included in "Other assets" on the Morden & Helwig balance sheet on page x is goodwillamounting to $31.4 million as at December 31, 1992. This goodwill is consolidated intoFairfax's balance sheet. Most of this goodwill arose from the purchase of the originalLindsey & Newsom operations in Texas. As these operations continue to be veryprofitable and provide the base for the U.S. operations, we believe there is nodiminution of goodwill. Also, even at its low of $6-$7 per share, Morden & Helwig sellsat its book value per share of approximately $7.05, suggesting the goodwill is "good". We review the goodwill on Morden & Helwig's balance sheet on a regular basis andcontinue to feel comfortable that in a service business with 334 offices and 1,700people, the goodwill is justified. There is nothing like improved profits, though, to makeus (and you!) more comfortable.
Investment bankingThis is the last time you will read this section in our reports � and I'm sure you are very
happy (I am!). We will be closing down our investment banking area. While notobvious in the table on page x, we had to make good on our guarantees at Carbovanfor $5.75 million. We have used provisions from the past which have now proved to beunnecessary to offset the impact of this on our income statement. Includingguarantees, our half of Carbovan has cost us $14 million since 1988 � and we have

10/14/99 3:05AM
13
nothing to show for it. You can be sure we will never get into a venture capitalinvestment again. Unfortunately, it was a costly lesson � we prefer to learn from the
mistakes of others!
A management restructuring at Develcon resulted in our $1 million loan being settled forcash and Develcon shares. We have written down our Develcon shares to aninsignificant amount even though we have not sold the shares. We first invested inCarbovan in 1988 and in Develcon in 1987. It took us between five and six long yearsto exit from these investments � proving again that it is very easy to get into something
but extremely difficult to get out. On a cumulative basis, your Chairman's brilliance hascost the company about $18 million or $3.00 per share pre-tax. On the positive side,this is history and will not affect us in the future. We continue to work at liquidating ourreal estate investments and expect to recover our costs (please see Note 2).
Financial positionAs mentioned in previous annual reports, the best way to understand our financialposition is to look at our unaudited balance sheet with Morden & Helwig equityaccounted as shown on page x. Here is what it looks like compared to 1991: ($ millions)
1992 1991
Short and long term debt 47.7 30.8Contingent debt � Federated 20.4 20.4Common shareholders' equity 143.8 124.3 *
Total capital $211.9 $175.5 * Includes the convertible debenture that was converted into subordinate voting shares on February
14, 1992.
Our short and long term debt increased by approximately $17 million in 1992, mainlybecause we took almost no dividends from our insurance companies while financingthe purchase of Hamblin Watsa ($1.85 million), the repurchase of about 109,000Fairfax shares ($2.6 million), an investment in marketable securities at the Fairfax level($5 million), Carbovan and other miscellaneous items.
Our shareholders' equity increased by $19.5 million because of net income of $10million and net shares issued of $9.5 million ($12.1 million for Hamblin Watsa, less $2.6million spent to retire 109,000 shares of Fairfax at an average price of $24 per share
10/14/99 3:05AM
14
(Note 9)).
Our short and long term debt position at year-end was higher than we expected for thereasons mentioned. In 1993 we plan to bring this debt down to about $30 million, atwhich point our debt level would be very comfortable in relation to our earnings andshareholders' equity base.
In 1992 we renegotiated our banking lines and raised them to $75 million, all on arevolving five year term basis. While these lines provide us with flexibility, we plan toalways leave a significant portion of them undrawn.
As mentioned in last year's annual report, we have begun to finance our employeestock purchase loans at a bank (Note 4). During 1993 it is likely that almost all theseloans will be financed independently in this manner. We are also looking at moreefficient ways to make the key officers of Fairfax significant owners.
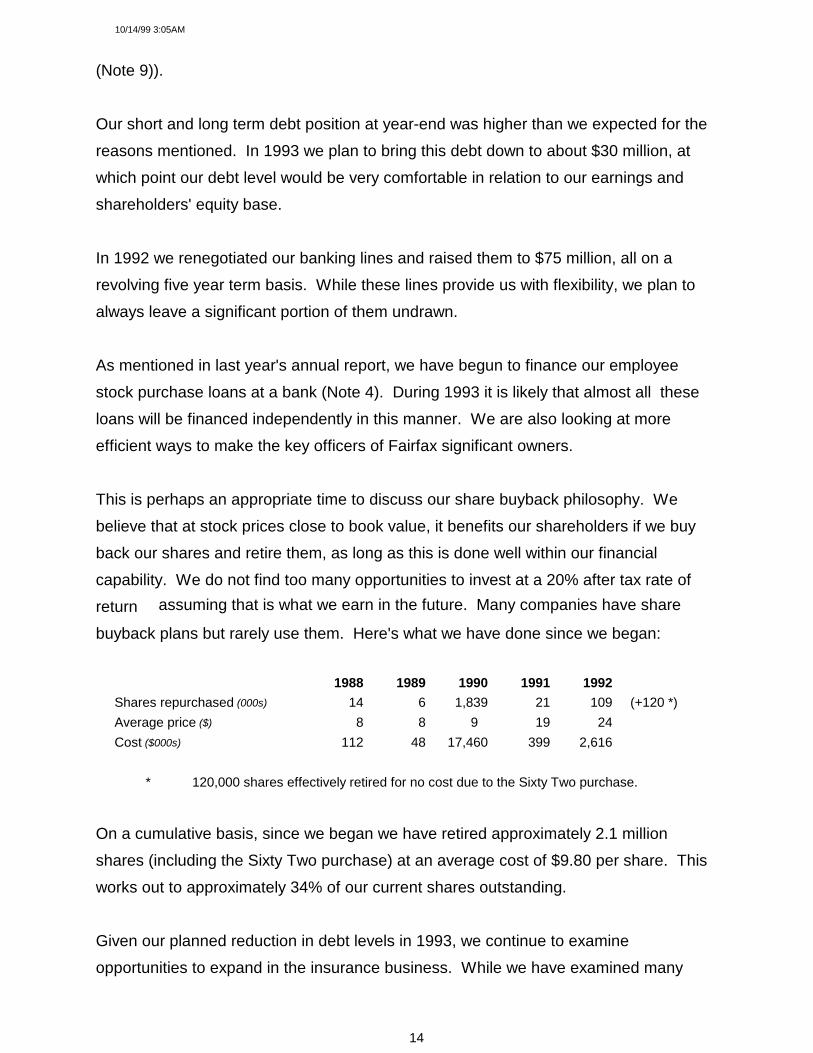
This is perhaps an appropriate time to discuss our share buyback philosophy. Webelieve that at stock prices close to book value, it benefits our shareholders if we buyback our shares and retire them, as long as this is done well within our financialcapability. We do not find too many opportunities to invest at a 20% after tax rate ofreturn � assuming that is what we earn in the future. Many companies have share
buyback plans but rarely use them. Here's what we have done since we began:
1988 1989 1990 1991 1992Shares repurchased (000s) 14 6 1,839 21 109 (+120 *)Average price ($) 8 8 9� 19 24Cost ($000s) 112 48 17,460 399 2,616
* 120,000 shares effectively retired for no cost due to the Sixty Two purchase.
On a cumulative basis, since we began we have retired approximately 2.1 millionshares (including the Sixty Two purchase) at an average cost of $9.80 per share. Thisworks out to approximately 34% of our current shares outstanding.
Given our planned reduction in debt levels in 1993, we continue to examineopportunities to expand in the insurance business. While we have examined many
10/14/99 3:05AM
15
situations, nothing has come of them.
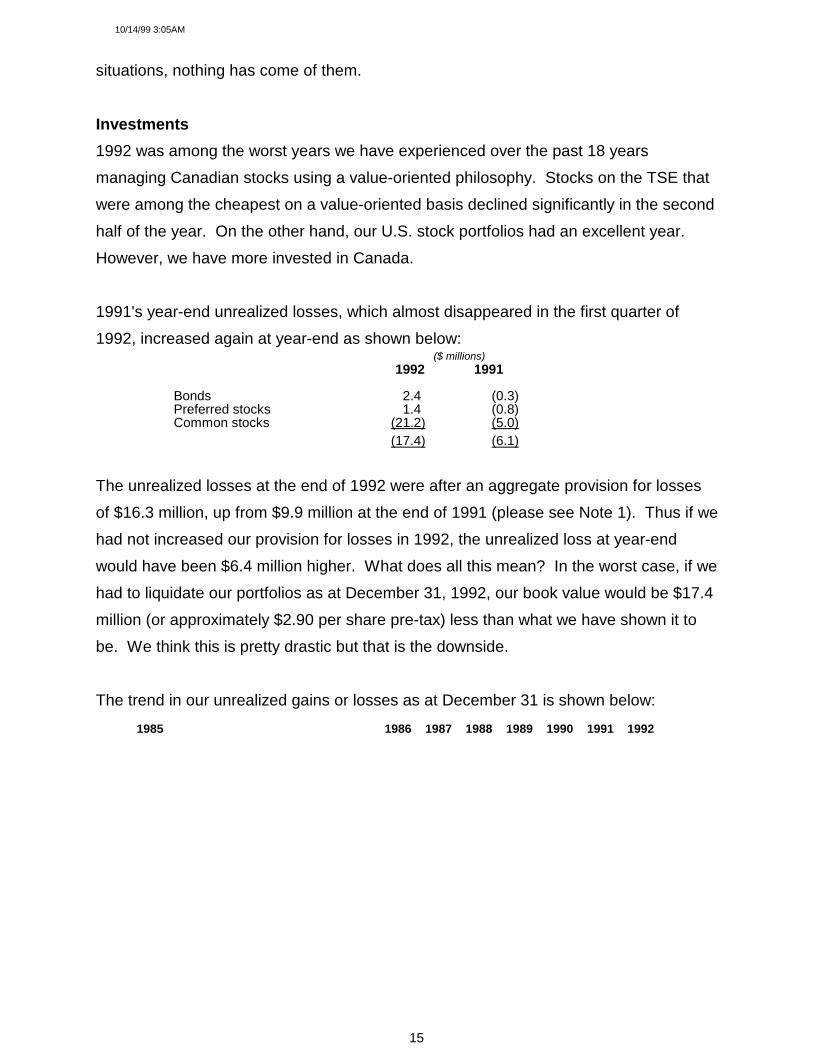
Investments1992 was among the worst years we have experienced over the past 18 yearsmanaging Canadian stocks using a value-oriented philosophy. Stocks on the TSE thatwere among the cheapest on a value-oriented basis declined significantly in the secondhalf of the year. On the other hand, our U.S. stock portfolios had an excellent year. However, we have more invested in Canada.
1991's year-end unrealized losses, which almost disappeared in the first quarter of1992, increased again at year-end as shown below:
($ millions) 1992 1991
Bonds 2.4 (0.3)Preferred stocks 1.4 (0.8)Common stocks (21.2) (5.0)
(17.4) (6.1)
The unrealized losses at the end of 1992 were after an aggregate provision for lossesof $16.3 million, up from $9.9 million at the end of 1991 (please see Note 1). Thus if wehad not increased our provision for losses in 1992, the unrealized loss at year-endwould have been $6.4 million higher. What does all this mean? In the worst case, if wehad to liquidate our portfolios as at December 31, 1992, our book value would be $17.4million (or approximately $2.90 per share pre-tax) less than what we have shown it tobe. We think this is pretty drastic but that is the downside.
The trend in our unrealized gains or losses as at December 31 is shown below:
1985 1986 1987 1988 1989 1990 1991 1992
10/14/99 3:05AM
16
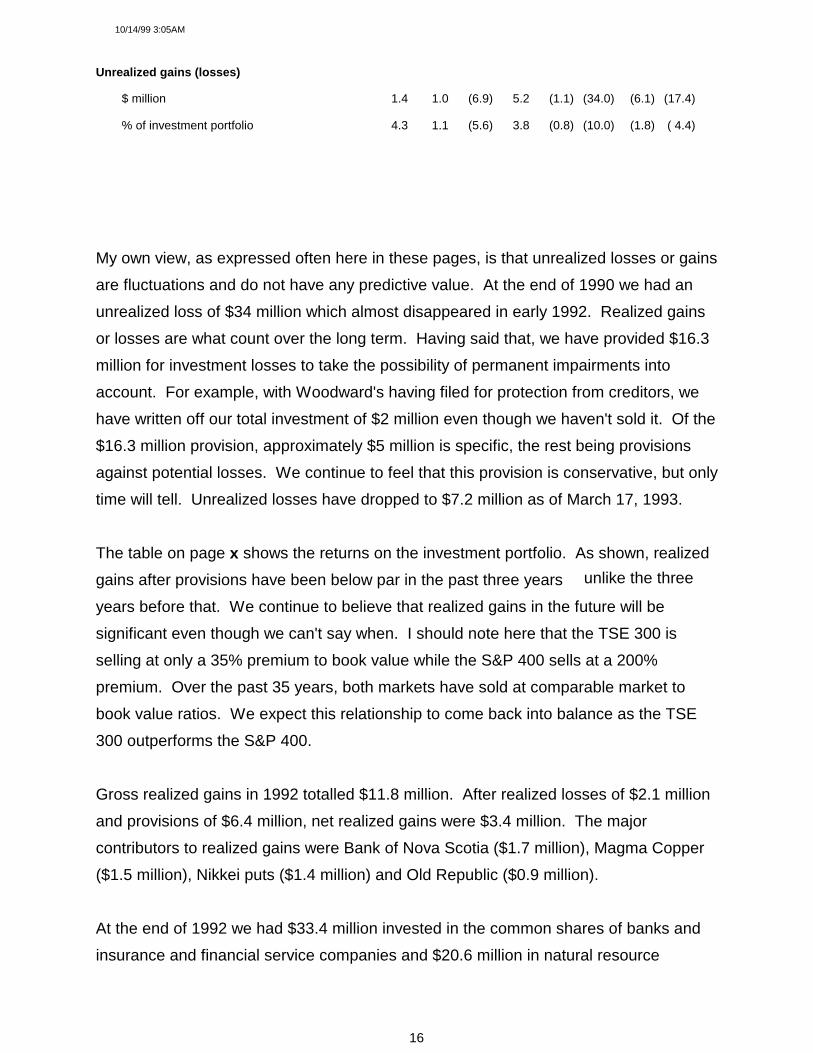
Unrealized gains (losses)
$ million 1.4 1.0 (6.9) 5.2 (1.1) (34.0) (6.1) (17.4)
% of investment portfolio 4.3 1.1 (5.6) 3.8 (0.8) (10.0) (1.8) ( 4.4)
My own view, as expressed often here in these pages, is that unrealized losses or gainsare fluctuations and do not have any predictive value. At the end of 1990 we had anunrealized loss of $34 million which almost disappeared in early 1992. Realized gainsor losses are what count over the long term. Having said that, we have provided $16.3million for investment losses to take the possibility of permanent impairments intoaccount. For example, with Woodward's having filed for protection from creditors, wehave written off our total investment of $2 million even though we haven't sold it. Of the$16.3 million provision, approximately $5 million is specific, the rest being provisionsagainst potential losses. We continue to feel that this provision is conservative, but onlytime will tell. Unrealized losses have dropped to $7.2 million as of March 17, 1993.
The table on page x shows the returns on the investment portfolio. As shown, realizedgains after provisions have been below par in the past three years � unlike the three
years before that. We continue to believe that realized gains in the future will besignificant even though we can't say when. I should note here that the TSE 300 isselling at only a 35% premium to book value while the S&P 400 sells at a 200%premium. Over the past 35 years, both markets have sold at comparable market tobook value ratios. We expect this relationship to come back into balance as the TSE300 outperforms the S&P 400.
Gross realized gains in 1992 totalled $11.8 million. After realized losses of $2.1 millionand provisions of $6.4 million, net realized gains were $3.4 million. The majorcontributors to realized gains were Bank of Nova Scotia ($1.7 million), Magma Copper($1.5 million), Nikkei puts ($1.4 million) and Old Republic ($0.9 million).
At the end of 1992 we had $33.4 million invested in the common shares of banks andinsurance and financial service companies and $20.6 million in natural resource

10/14/99 3:05AM
17
companies.
Finally, on pages x and x, you should note that over time the increase in our investmentportfolio has resulted in a rising stream of dividend and interest income. The decreasein 1992 is a result of a shift towards high quality preferreds (dividends are more taxefficient). On an after tax basis, dividend and interest income continued to increase in1992.
Please refer to our 1991 annual report for our press and/or investor relations policy. Itis not long.
As discussed in our 1991 annual report, our donations policy is to donate annually atleast 1% of our pre-tax income from operations to charities. Fairfax and its subsidiariesdonated approximately $150,000 in 1992 to a variety of charities across the country.
I have always believed that the stock market fluctuates in the short term but alwaysreflects economic reality in the long term. How about Fairfax? How has the markettreated us? Since we began over seven years ago, Fairfax has sold below book valuefor only 1� years � from March 1990 to September 1991 � i.e. for approximately 20%
of the time. The market has been pretty fair to us.
This also means that over time, every one dollar retained by Fairfax (as against payingit out in dividends) has resulted in at least one dollar of market value, with no taxes paidby our shareholders. As long as this test continues to hold (i.e. every dollar retainedresulting in a dollar of increased market value) and we continue to earn 20% on ourshareholders' equity, we won't be paying any dividends because it would be contrary tothe interest of long term shareholders � to whom we try to cater.
We continue to keep our holding company small. Brenda Adams, Sam Chan, PaulFink, Rick Salsberg, Ronald Schokking and John Varnell continue to show what can bedone with a small, exceptionally talented and hard working group of people.
So much for history! How about the future? It continues to be as uncertain and

10/14/99 3:05AM
18
unpredictable as it always was. However, with good people and good fortune, wecontinue to labour towards our long term objective of earning in excess of 20% onshareholders' equity by running Fairfax and its subsidiaries for the long term benefit ofcustomers, employees and shareholders.
On your behalf, I would like to thank the Board and the management and employees ofall our companies for their very significant contributions throughout the challenges of1992.March 22, 1993
V. Prem WatsaChairman and
Chief Executive Officer
10/14/99 3:05AM
19
Fairfax Logo
CONSOLIDATED FINANCIAL STATEMENTSFor the years ended December 31, 1992 and 1991
10/14/99 3:05AM
20
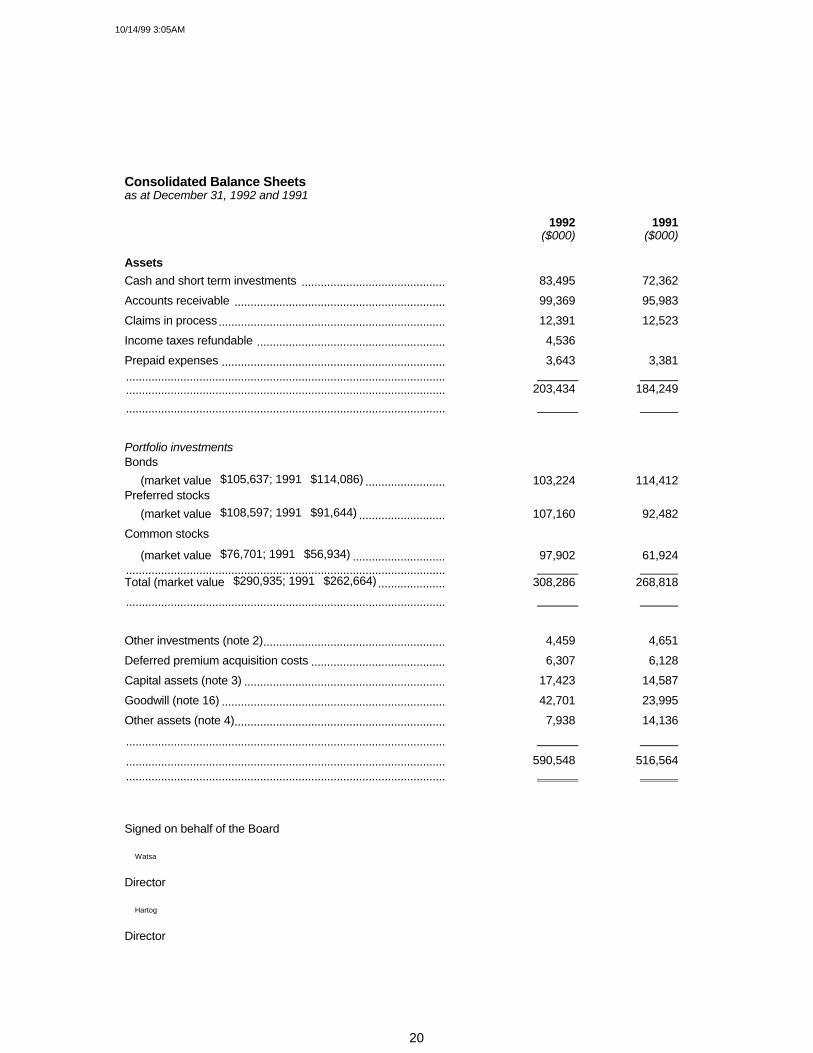
Consolidated Balance Sheetsas at December 31, 1992 and 1991
1992 1991($000) ($000)
AssetsCash and short term investments ............................................. 83,495 72,362Accounts receivable .................................................................. 99,369 95,983Claims in process....................................................................... 12,391 12,523Income taxes refundable ........................................................... 4,536 �
Prepaid expenses ...................................................................... 3,643 3,381.................................................................................................... .................................................................................................... 203,434 184,249....................................................................................................
Portfolio investmentsBonds (market value�$105,637; 1991�$114,086) ......................... 103,224 114,412Preferred stocks (market value�$108,597; 1991�$91,644) ........................... 107,160 92,482Common stocks
(market value�$76,701; 1991�$56,934) ............................. 97,902 61,924.................................................................................................... Total (market value�$290,935; 1991�$262,664) ..................... 308,286 268,818....................................................................................................
Other investments (note 2)......................................................... 4,459 4,651Deferred premium acquisition costs .......................................... 6,307 6,128Capital assets (note 3) ............................................................... 17,423 14,587Goodwill (note 16) ...................................................................... 42,701 23,995Other assets (note 4).................................................................. 7,938 14,136
....................................................................................................
.................................................................................................... 590,548 516,564
....................................................................................................
Signed on behalf of the Board
Watsa
Director
Hartog
Director
10/14/99 3:05AM
21
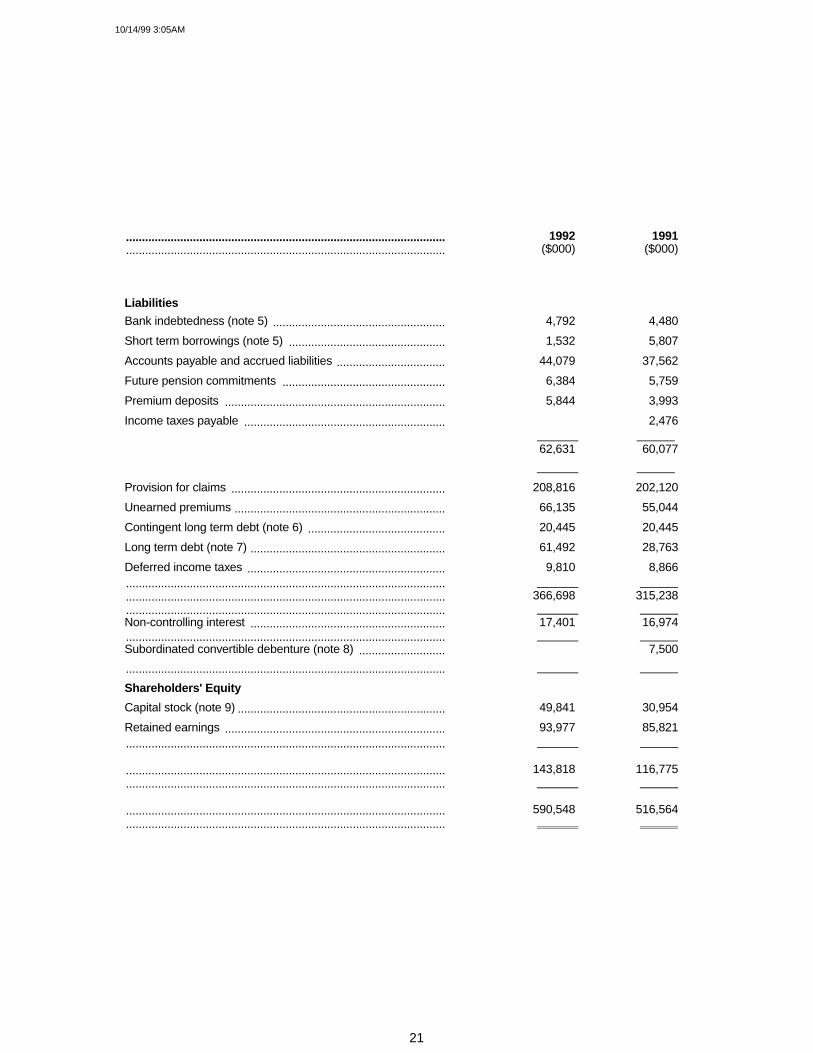
.................................................................................................... 1992 1991
.................................................................................................... ($000) ($000)
LiabilitiesBank indebtedness (note 5) ...................................................... 4,792 4,480Short term borrowings (note 5) ................................................. 1,532 5,807Accounts payable and accrued liabilities .................................. 44,079 37,562Future pension commitments ................................................... 6,384 5,759Premium deposits ..................................................................... 5,844 3,993Income taxes payable ............................................................... � 2,476
62,631 60,077
Provision for claims ................................................................... 208,816 202,120Unearned premiums .................................................................. 66,135 55,044Contingent long term debt (note 6) ........................................... 20,445 20,445Long term debt (note 7) ............................................................. 61,492 28,763Deferred income taxes .............................................................. 9,810 8,866.................................................................................................... .................................................................................................... 366,698 315,238.................................................................................................... Non-controlling interest ............................................................. 17,401 16,974.................................................................................................... Subordinated convertible debenture (note 8) ........................... � 7,500....................................................................................................
Shareholders' EquityCapital stock (note 9) ................................................................. 49,841 30,954Retained earnings ..................................................................... 93,977 85,821....................................................................................................
.................................................................................................... 143,818 116,775
....................................................................................................
.................................................................................................... 590,548 516,564
....................................................................................................

10/14/99 3:05AM
22
Consolidated Statements of Earningsfor the years ended December 31, 1992 and 1991
.................................................................................................... 1992 1991
.................................................................................................... ($000) ($000)
Revenue Premiums earned .................................................................... 118,854 90,507 Claims fees .............................................................................. 139,782 122,982 Interest and dividends ............................................................. 23,988 26,051 Realized gains (losses) on investments ................................. 3,400 (4,512) Other income ........................................................................... 806 1,338 Gain on sale of associated company ...................................... � 13,636.................................................................................................... .................................................................................................... 286,830 250,002....................................................................................................
Expenses Losses on claims ..................................................................... 90,868 54,267 Operating expenses ................................................................ 177,430 154,849 Interest expense ...................................................................... 7,650 8,772 Commissions, net .................................................................... 3,907 (351).................................................................................................... .................................................................................................... 279,855 217,537....................................................................................................
Earnings before income taxes .............................................. 6,975 32,465 Provision for (recovery of) income taxes (note 11) ................. (3,352) 9,832.................................................................................................... Earnings from operations ...................................................... 10,327 22,633 Non-controlling interest ........................................................... (282) (118).................................................................................................... Net earnings ............................................................................. 10,045 22,515....................................................................................................
Net earnings per share � fully diluted (note 15).................... $1.76 $3.94
Consolidated Statements of Retained Earningsfor the years ended December 31, 1992 and 1991.................................................................................................... 1992 1991.................................................................................................... ($000) ($000)
Retained earnings � beginning of year ................................ 85,821 63,556 Net earnings for the year ......................................................... 10,045 22,515 Excess over stated value of shares
purchased for cancellation (note 9) ...................................... (1,889) (250).................................................................................................... Retained earnings � end of year ........................................... 93,977 85,821....................................................................................................
10/14/99 3:05AM
23
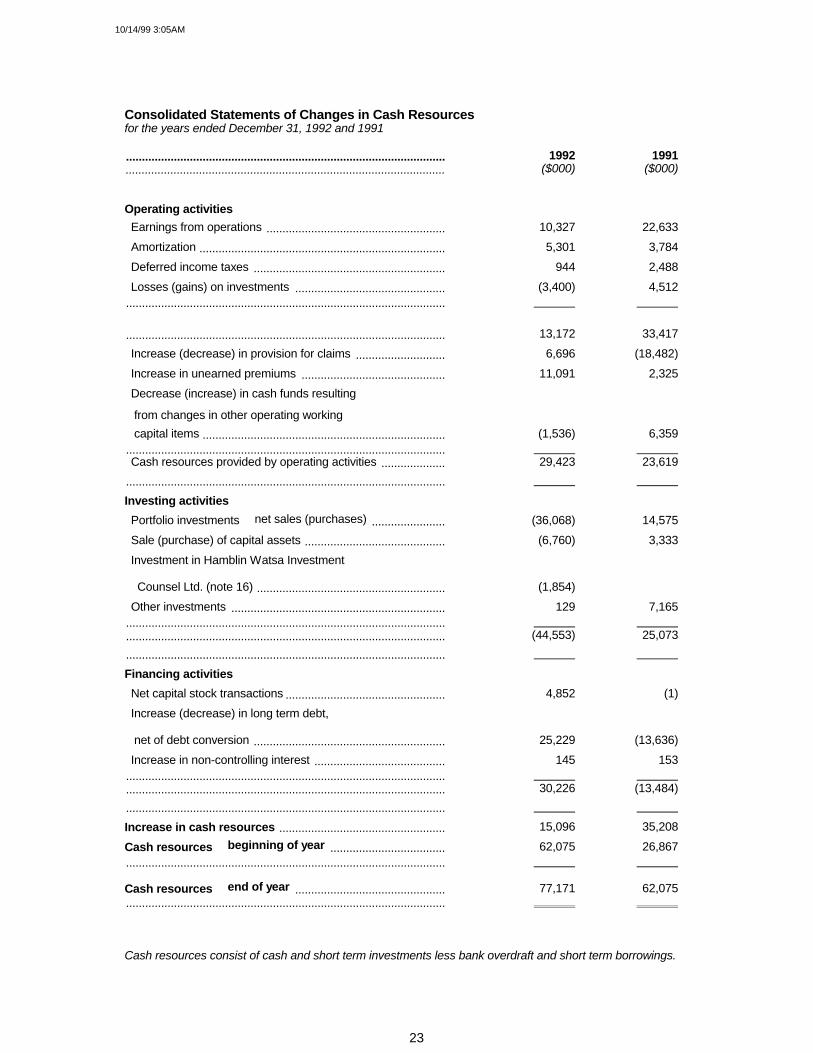
Consolidated Statements of Changes in Cash Resourcesfor the years ended December 31, 1992 and 1991
.................................................................................................... 1992 1991
.................................................................................................... ($000) ($000)
Operating activities Earnings from operations ........................................................ 10,327 22,633 Amortization ............................................................................. 5,301 3,784 Deferred income taxes ............................................................ 944 2,488 Losses (gains) on investments ............................................... (3,400) 4,512....................................................................................................
.................................................................................................... 13,172 33,417 Increase (decrease) in provision for claims ............................ 6,696 (18,482) Increase in unearned premiums ............................................. 11,091 2,325 Decrease (increase) in cash funds resulting
from changes in other operating working capital items ............................................................................ (1,536) 6,359.................................................................................................... Cash resources provided by operating activities .................... 29,423 23,619....................................................................................................
Investing activities Portfolio investments � net sales (purchases) ....................... (36,068) 14,575 Sale (purchase) of capital assets ............................................ (6,760) 3,333 Investment in Hamblin Watsa Investment
Counsel Ltd. (note 16) ........................................................... (1,854) �
Other investments ................................................................... 129 7,165.................................................................................................... .................................................................................................... (44,553) 25,073....................................................................................................
Financing activities Net capital stock transactions .................................................. 4,852 (1) Increase (decrease) in long term debt,
net of debt conversion ............................................................ 25,229 (13,636) Increase in non-controlling interest ......................................... 145 153.................................................................................................... .................................................................................................... 30,226 (13,484)....................................................................................................
Increase in cash resources .................................................... 15,096 35,208
Cash resources � beginning of year .................................... 62,075 26,867....................................................................................................
Cash resources � end of year ............................................... 77,171 62,075....................................................................................................
Cash resources consist of cash and short term investments less bank overdraft and short term borrowings.

10/14/99 3:05AM
24
Notes To Consolidated Financial Statementsfor the years ended December 31, 1992 and 1991(in $000s except per share amounts and as otherwise indicated)
1. Summary of Significant Accounting PoliciesBusiness operationsThe company is a financial services holding company which through its subsidiaries and affiliates is engagedin the insurance of commercial property, oil and gas, casualty and life risks and the provision of claimsadjusting, appraisal and loss management services in Canada and the United States.
Principles of consolidationThe consolidated financial statements include the accounts of the company and all of its subsidiaries: MarkelInsurance Company of Canada, Federated Insurance Holdings of Canada Ltd., Commonwealth InsuranceCompany, Wentworth Insurance Company Ltd. and Hamblin Watsa Investment Counsel Ltd., all 100%owned; and Morden & Helwig Group Inc., 50% equity and 90% voting interest. Acquisitions are accountedfor by the purchase method, whereby the results of acquired companies are included only from the date ofacquisition. Divestitures are included up to the date of disposal.
PremiumsInsurance premiums are taken into income evenly throughout the terms of the related policies. As premiumdeposits secure the payment of premiums and are refundable, they are not taken into income unless defaultin payment of premiums occurs.
Claims in processThe company records its inventory of claims in process at its estimated value at year-end, based on adetermination of the claims in process at year-end through a complete physical count of related files. Claimsadjustment fees arising therefrom are accounted for on an estimated percentage-of-completion basis.
Deferred premium acquisition costsThe costs incurred in acquiring insurance premiums are deferred, to the extent that they are consideredrecoverable, and amortized over the same period as the related premiums are taken into income.
InvestmentsBonds are carried at amortized cost providing for the amortization of the discount or premium on a straightline basis to maturity. Preferred and common stocks are carried at cost. When there has been a loss invalue of an investment that is other than temporary, the investment is written down to its estimated netrealizable value.
The realized gains (losses) on investments recorded in the income statement are net of provisions for losseson investments of $6.4 million (1991�$7 million). At December 31, 1992 the aggregate provision for losseson investments was $16.3 million (1991�$9.9 million).
Investment incomeInvestment income is recorded as it accrues. Dividends are recorded as income on the record date. Gainsand losses realized on the disposal of investments are taken into income on the date of disposal.

10/14/99 3:05AM
25
Provision for claimsClaim provisions are established by the case method as claims are reported. The provisions aresubsequently adjusted as additional information on the estimated amount of a claim becomes known duringthe course of its settlement. A provision is also made for management's calculation of factors affecting thefuture development of claims including claims incurred but not reported based on the volume of businesscurrently in force and the historical experience on claims.
Translation of foreign currenciesAssets and liabilities in foreign currencies are translated into Canadian dollars at year-end exchange rates. Income and expenses are translated at the exchange rates in effect at the date incurred. Realized gains andlosses on foreign exchange are recognized in the statements of earnings.
GoodwillThe difference between purchase cost and the fair value of the net assets of acquired businesses isamortized on a straight line basis over its estimated useful life which ranges from 10 to 40 years. Thegoodwill is primarily related to the company's investments in Morden & Helwig Group Inc. and HamblinWatsa Investment Counsel Ltd.
2. Other Investments 1992 1991
($000) ($000)Real estate 4,459 4,651
The company has invested in several small real estate projects in Alberta, Texas and Ontario, the major onebeing a 100% interest in a shopping mall in Calgary, Alberta. This investment of $2.3 million (1991�$2.2million) is shown net of a 12.04% mortgage of $4.9 million (1991�$5 million), due June 1994, which is non-recourse to Fairfax Financial Holdings Limited and for which the shopping mall has been pledged as security.
3. Capital Assets1992 1991
($000) ($000)
Land and buildings 4,104 4,147Furniture and equipment 25,630 22,742Leasehold improvements 1,467 1,378Automobiles under capital lease 527 412
31,728 28,679Accumulated amortization 14,305 14,092
17,423 14,587
4. Other AssetsIncluded in other assets are non-interest bearing loans to officers and directors of the company and itssubsidiaries under the company's employee stock purchase plan totalling $4,196 (1991�$9,260) for which275,373 shares (1991�649,573 shares) with a year-end market value of $6,884 (1991�$13,803) have beenpledged as security. The company may under certain circumstances be obligated to purchase loans toofficers and directors of the company and its subsidiaries from a Canadian chartered bank totalling $3,878(1991�nil) for which 266,000 (1991�nil) shares of the company with a year-end market value of $6,650(1991�nil) have been pledged as security.
10/14/99 3:05AM
26
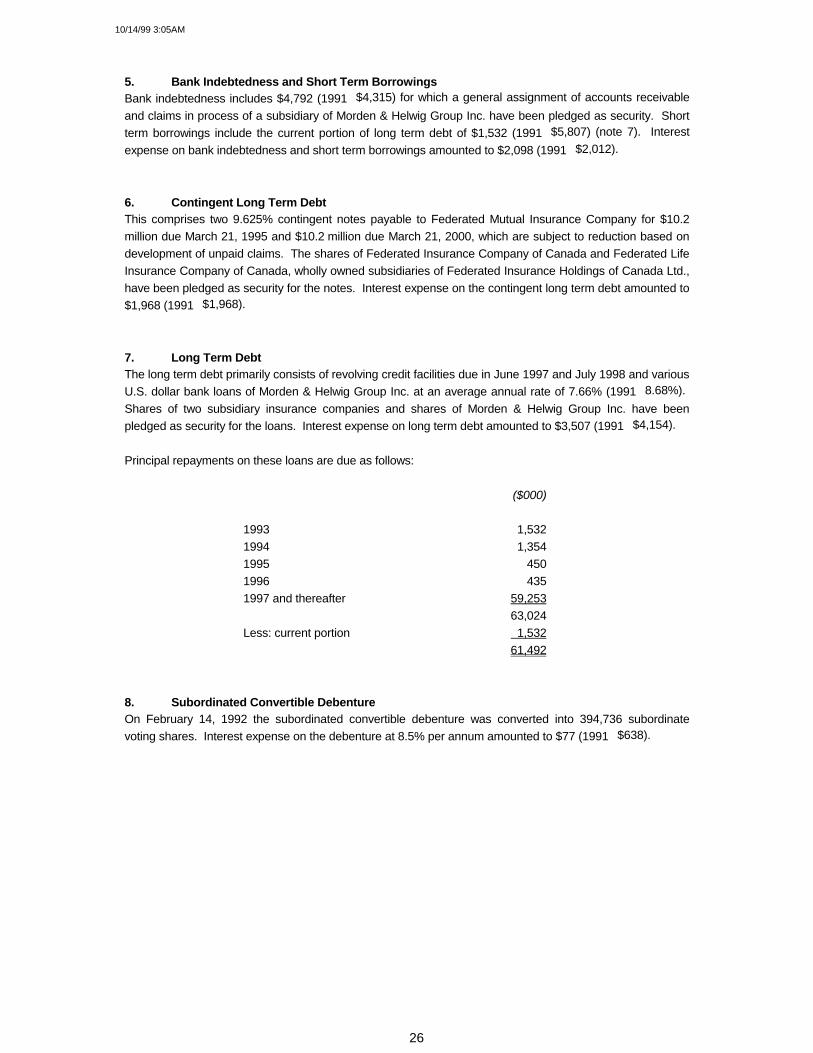
5. Bank Indebtedness and Short Term BorrowingsBank indebtedness includes $4,792 (1991�$4,315) for which a general assignment of accounts receivableand claims in process of a subsidiary of Morden & Helwig Group Inc. have been pledged as security. Shortterm borrowings include the current portion of long term debt of $1,532 (1991�$5,807) (note 7). Interestexpense on bank indebtedness and short term borrowings amounted to $2,098 (1991�$2,012).
6. Contingent Long Term DebtThis comprises two 9.625% contingent notes payable to Federated Mutual Insurance Company for $10.2million due March 21, 1995 and $10.2 million due March 21, 2000, which are subject to reduction based ondevelopment of unpaid claims. The shares of Federated Insurance Company of Canada and Federated LifeInsurance Company of Canada, wholly owned subsidiaries of Federated Insurance Holdings of Canada Ltd.,have been pledged as security for the notes. Interest expense on the contingent long term debt amounted to$1,968 (1991�$1,968).
7. Long Term DebtThe long term debt primarily consists of revolving credit facilities due in June 1997 and July 1998 and variousU.S. dollar bank loans of Morden & Helwig Group Inc. at an average annual rate of 7.66% (1991�8.68%). Shares of two subsidiary insurance companies and shares of Morden & Helwig Group Inc. have beenpledged as security for the loans. Interest expense on long term debt amounted to $3,507 (1991�$4,154).
Principal repayments on these loans are due as follows:
($000)
1993 1,5321994 1,3541995 4501996 4351997 and thereafter 59,253
63,024Less: current portion 1,532
61,492
8. Subordinated Convertible DebentureOn February 14, 1992 the subordinated convertible debenture was converted into 394,736 subordinatevoting shares. Interest expense on the debenture at 8.5% per annum amounted to $77 (1991�$638).

10/14/99 3:05AM
27
9. Capital Stock
Authorized capitalThe authorized share capital of the company consists of an unlimited number of preferred shares issuable inseries, an unlimited number of multiple voting shares carrying ten votes per share and an unlimited numberof subordinate voting shares carrying one vote per share.
Issued capital
1992 1991 number ($000) number ($000)
Subordinate voting shares 5,305,758 63,863 3,907,297 25,954Multiple voting shares 1,548,000 5,000 1,548,000 5,000
6,853,758 68,863 5,455,297 30,954Interest in shares heldthrough ownership interestin shareholder (799,230) (19,022) � �
Net effectively outstanding 6,054,528 49,841 5,455,297 30,954
Under the terms of a normal course issuer bid approved by The Toronto Stock Exchange the companypurchased and cancelled 109,400 (1991�21,500) subordinate voting shares for an aggregate cost of $2,644(1991�$416), of which $1,889 (1991�$250) was charged to retained earnings. On February 14, 1992 thesubordinated convertible debenture was converted into 394,736 subordinate voting shares.
On November 5, 1992 the company issued 433,773 subordinate voting shares at $28 per share as partialconsideration for the purchase of Hamblin Watsa Investment Counsel Ltd.
Also on November 5, 1992, the company issued 679,352 subordinate voting shares at $28 per share toindirectly purchase 49.995% of The Sixty Two Investment Company Limited which owns 1,548,000 multiplevoting and 50,620 subordinate voting shares of Fairfax. The company's indirect ownership of its own sharesconstitutes an effective reduction of shares outstanding by 799,230 and this effective reduction has beenreflected in the fully diluted earnings per share calculation and the book value per share calculation.
10. ReinsuranceThe company follows the policy of underwriting and reinsuring contracts of insurance which generally limitsthe liability of the company to a maximum amount on any one loss of $1 million. Reinsurance is generallyplaced on an excess of loss basis in several layers. This reinsurance does not relieve the company of itsprimary obligation to the policyholders. As at December 31, 1992 provision for claims reflects recoveriesfrom reinsurers of $152,850 (1991�$127,140). During the year, the company ceded $67,661(1991�$54,071) of premium income and $79,800 (1991�$59,694) of claims incurred.
11. Income TaxesThe provision for income taxes differs from the statutory marginal rate as certain sources of income areexempt from tax or are taxed at other than the marginal rate.
A reconciliation of income tax calculated at the statutory marginal tax rate with the income tax provision at theeffective tax rate in the financial statements is summarized below:

10/14/99 3:05AM
28
1992 1991($000) ($000)
Provision for taxes at statutory marginal income tax rate 3,093 14,382Non-taxable investment income (3,414) (3,146)Utilization of prior years' losses (3,031) (1,404)Provision for (recovery of) income taxes (3,352) 9,832
12. Statutory Requirements � Insurance SubsidiariesPayments of dividends by the company's insurance subsidiaries are governed by insurance statutes andregulations.
13. Contingencies and CommitmentsSubsidiaries of the company are defendants in several damage suits and have been named as third party inother suits. The uninsured exposure to the company is not considered to be material.
The company had a joint and several agreement with a third party to guarantee two Carbovan Inc. loanstotalling $11,500. The company eliminated these guarantees in 1992 and has been released from any futureliability.
14. Operating LeasesAggregate future commitments at December 31, 1992 under operating leases relating to premises,automobiles and equipment for various terms up to 10 years are as follows:
($000)1993 9,3001994 7,5001995 5,3001996 3,5001997 2,300Thereafter 1,950
$29,850
15. Earnings per ShareEarnings per share on the consolidated statements of earnings have been presented on a fully diluted basis. Basic earnings per share are $1.76 for 1992 and $4.11 for 1991. The weighted average number of sharesfor 1992 was 5,752,771 (1991�5,870,638) on a fully diluted basis.
16. AcquisitionsEffective October 1, 1992 the company purchased Hamblin Watsa Investment Counsel Ltd. The purchaseprice of $14 million was paid with $1.854 million cash and 433,773 subordinate voting shares of FairfaxFinancial Holdings Limited. Hamblin Watsa Investment Counsel Ltd. had $1.1 million in total assets and $1million in total liabilities as at October 1, 1992. The excess of the purchase price paid over the fair value ofthe net assets was allocated to goodwill and is being amortized over ten years. Hamblin Watsa providesdiscretionary investment management primarily to pension funds and to the insurance company subsidiariesof Fairfax.
On November 5, 1992 the company purchased 49.995% of the shares of The Sixty Two Investment

10/14/99 3:05AM
29
Company Limited (all shares other than those owned by Prem Watsa), being effectively a purchase of799,230 shares in exchange for 679,352 subordinate voting shares of Fairfax. The only asset of Sixty Two,the controlling shareholder of the company, is 1,598,620 shares of Fairfax. As a result, the company ineffect, without any payment, reduced the number of its shares outstanding by 119,878 thereby increasing itsbook value and earnings per share. There has been no income statement or goodwill effect as a result ofthis transaction.
During 1992, Morden & Helwig Group Inc., a subsidiary company, acquired various claims adjusting firms fora total consideration of $4.9 million. Virtually all of the purchase price was allocated to goodwill.
17. Related Party TransactionsDuring the year, the company and its subsidiaries purchased investment counselling services, in the normalcourse of business and on normal market terms, from Hamblin Watsa Investment Counsel Ltd., which wasacquired in 1992. The cost of these services amounted to $474 in 1992 (1991�$634).
18. Segmented InformationThe company is a financial services holding company which through its subsidiaries is engaged in theinsurance of commercial property, oil and gas, casualty and life risks and the provision of claims adjustingand appraisal and loss management services in Canada and the United States.
(a) Industry segmentsClaims Adjusting, Corporate and Appraisal and Consolidation
Insurance Loss Management Adjustments Consolidated
1992 1991 1992 1991 1992 1991 1992 1991($000) ($000) ($000) ($000) ($000) ($000) ($000) ($000)
Revenue 143,915 116,038 139,782 122,982 3,133 10,982 286,830 250,002
Earnings before
income taxes 7,880 28,516 1,376 2,390 (2,281) 1,559 6,975 32,465
Identifiable assets 480,066 432,694 86,441 75,488 24,041 8,382 590,548 516,564
Amortization 1,561 1,256 3,153 2,148 587 380 5,301 3,784
Interest expense - - 2,375 1,298 5,275 7,474 7,650 8,772

10/14/99 3:05AM
30
(b) Geographic segments
Canada United States Total
1992 1991 1992 1991 1992 1991
($000) ($000) ($000) ($000) ($000) ($000)
Revenue 177,466 166,029 109,364 83,973 286,830 250,002
Earnings before income taxes 6,654 28,168 321 4,297 6,975 32,465
Identifiable assets 424,122 361,204 166,426 155,360 590,548 516,564
Amortization 3,473 2,560 1,828 1,224 5,301 3,784
Interest expense 7,048 8,080 602 692 7,650 8,772
10/14/99 3:05AM
31
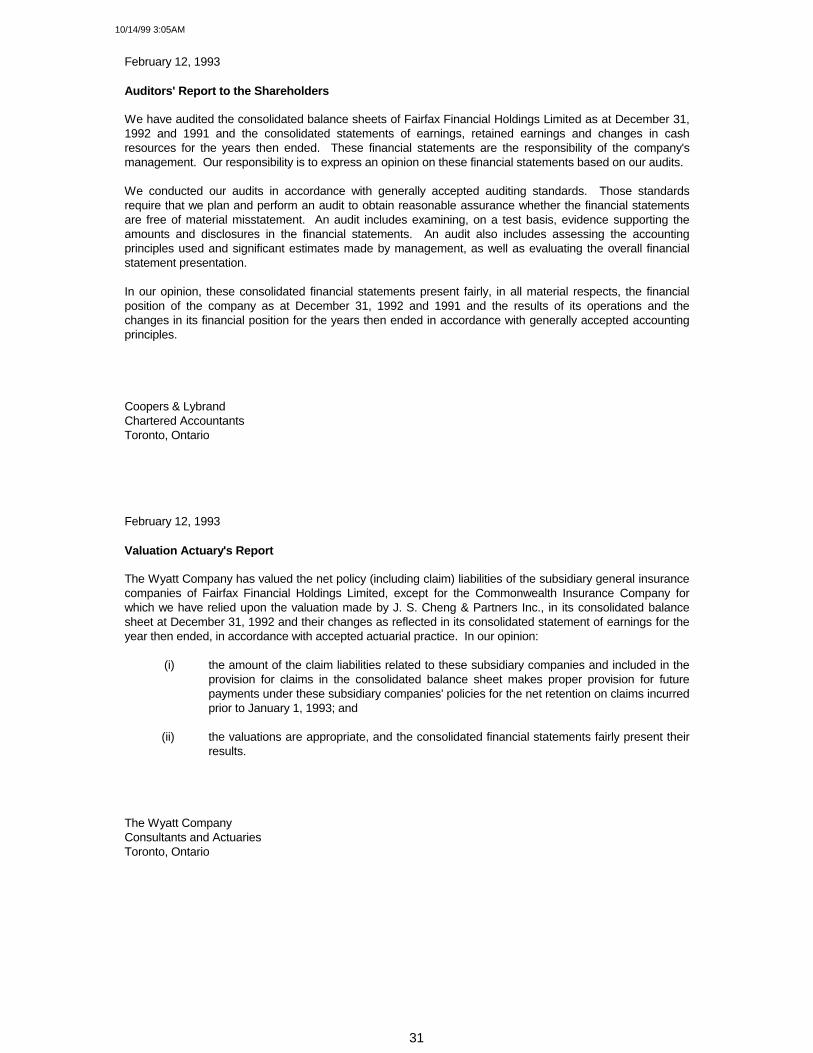
February 12, 1993
Auditors' Report to the Shareholders
We have audited the consolidated balance sheets of Fairfax Financial Holdings Limited as at December 31,1992 and 1991 and the consolidated statements of earnings, retained earnings and changes in cashresources for the years then ended. These financial statements are the responsibility of the company'smanagement. Our responsibility is to express an opinion on these financial statements based on our audits.
We conducted our audits in accordance with generally accepted auditing standards. Those standardsrequire that we plan and perform an audit to obtain reasonable assurance whether the financial statementsare free of material misstatement. An audit includes examining, on a test basis, evidence supporting theamounts and disclosures in the financial statements. An audit also includes assessing the accountingprinciples used and significant estimates made by management, as well as evaluating the overall financialstatement presentation.
In our opinion, these consolidated financial statements present fairly, in all material respects, the financialposition of the company as at December 31, 1992 and 1991 and the results of its operations and thechanges in its financial position for the years then ended in accordance with generally accepted accountingprinciples.
Coopers & LybrandChartered AccountantsToronto, Ontario
February 12, 1993
Valuation Actuary's Report
The Wyatt Company has valued the net policy (including claim) liabilities of the subsidiary general insurancecompanies of Fairfax Financial Holdings Limited, except for the Commonwealth Insurance Company forwhich we have relied upon the valuation made by J. S. Cheng & Partners Inc., in its consolidated balancesheet at December 31, 1992 and their changes as reflected in its consolidated statement of earnings for theyear then ended, in accordance with accepted actuarial practice. In our opinion:
(i) the amount of the claim liabilities related to these subsidiary companies and included in theprovision for claims in the consolidated balance sheet makes proper provision for futurepayments under these subsidiary companies' policies for the net retention on claims incurredprior to January 1, 1993; and
(ii) the valuations are appropriate, and the consolidated financial statements fairly present theirresults.
The Wyatt CompanyConsultants and ActuariesToronto, Ontario
10/14/99 3:05AM
32
Management's Discussion and Analysis of Financial Conditionand Results of Operations
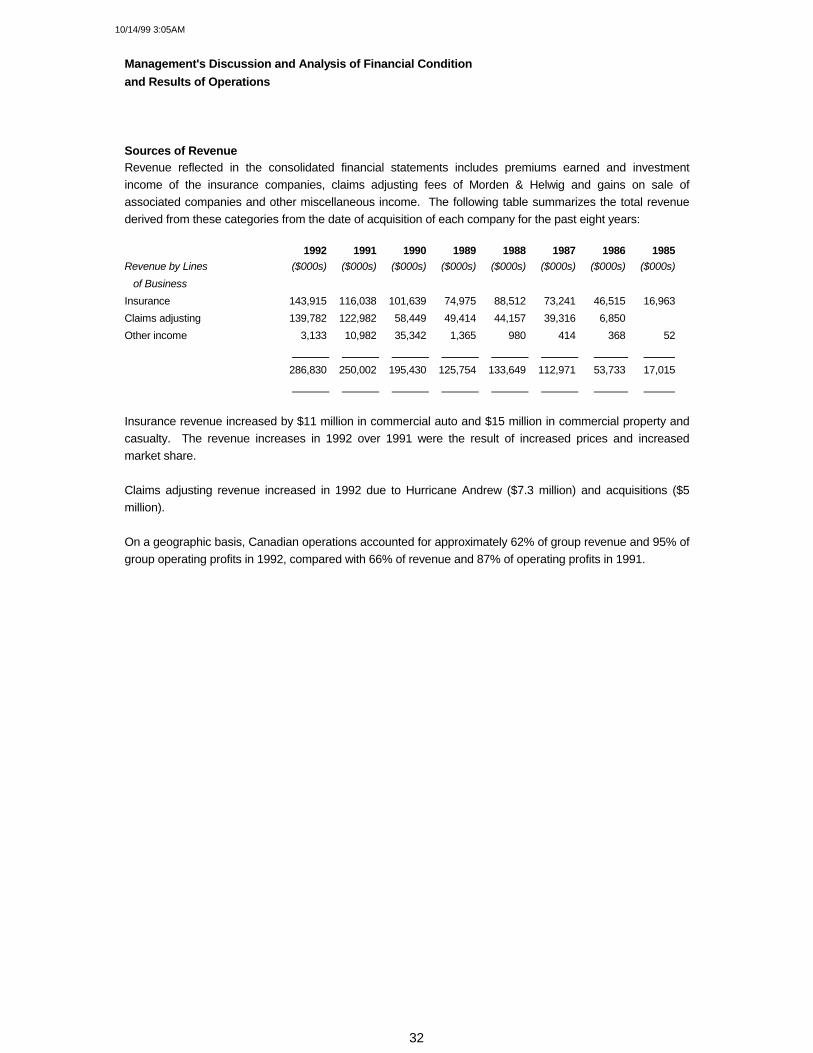
Sources of RevenueRevenue reflected in the consolidated financial statements includes premiums earned and investmentincome of the insurance companies, claims adjusting fees of Morden & Helwig and gains on sale ofassociated companies and other miscellaneous income. The following table summarizes the total revenuederived from these categories from the date of acquisition of each company for the past eight years:
1992 1991 1990 1989 1988 1987 1986 1985Revenue by Lines ($000s) ($000s) ($000s) ($000s) ($000s) ($000s) ($000s) ($000s) of BusinessInsurance 143,915 116,038 101,639 74,975 88,512 73,241 46,515 16,963Claims adjusting 139,782 122,982 58,449 49,414 44,157 39,316 6,850 �
Other income 3,133 10,982 35,342 1,365 980 414 368 52 286,830 250,002 195,430 125,754 133,649 112,971 53,733 17,015
Insurance revenue increased by $11 million in commercial auto and $15 million in commercial property andcasualty. The revenue increases in 1992 over 1991 were the result of increased prices and increasedmarket share.
Claims adjusting revenue increased in 1992 due to Hurricane Andrew ($7.3 million) and acquisitions ($5million).
On a geographic basis, Canadian operations accounted for approximately 62% of group revenue and 95% ofgroup operating profits in 1992, compared with 66% of revenue and 87% of operating profits in 1991.
10/14/99 3:05AM
33
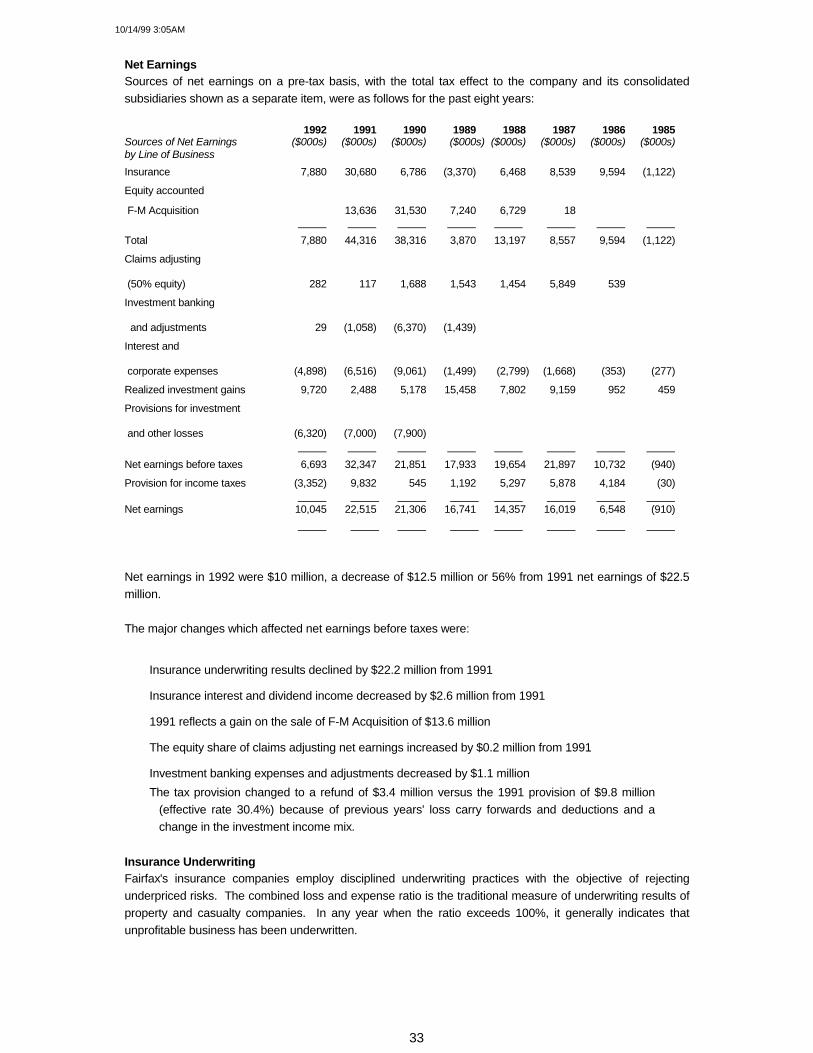
Net EarningsSources of net earnings on a pre-tax basis, with the total tax effect to the company and its consolidatedsubsidiaries shown as a separate item, were as follows for the past eight years:
1992 1991 1990 1989 1988 1987 1986 1985Sources of Net Earnings ($000s) ($000s) ($000s) ($000s) ($000s) ($000s) ($000s) ($000s)by Line of BusinessInsurance 7,880 30,680 6,786 (3,370) 6,468 8,539 9,594 (1,122)
Equity accounted
F-M Acquisition � 13,636 31,530 7,240 6,729 18 � �
Total 7,880 44,316 38,316 3,870 13,197 8,557 9,594 (1,122)
Claims adjusting
(50% equity) 282 117 1,688 1,543 1,454 5,849 539 �
Investment banking
and adjustments 29 (1,058) (6,370) (1,439) � � � �
Interest and
corporate expenses (4,898) (6,516) (9,061) (1,499) (2,799) (1,668) (353) (277)
Realized investment gains 9,720 2,488 5,178 15,458 7,802 9,159 952 459
Provisions for investment
and other losses (6,320) (7,000) (7,900) � � � � �
Net earnings before taxes 6,693 32,347 21,851 17,933 19,654 21,897 10,732 (940)
Provision for income taxes (3,352) 9,832 545 1,192 5,297 5,878 4,184 (30)
Net earnings 10,045 22,515 21,306 16,741 14,357 16,019 6,548 (910)
Net earnings in 1992 were $10 million, a decrease of $12.5 million or 56% from 1991 net earnings of $22.5million.
The major changes which affected net earnings before taxes were:
� Insurance underwriting results declined by $22.2 million from 1991
� Insurance interest and dividend income decreased by $2.6 million from 1991
� 1991 reflects a gain on the sale of F-M Acquisition of $13.6 million
� The equity share of claims adjusting net earnings increased by $0.2 million from 1991
� Investment banking expenses and adjustments decreased by $1.1 million� The tax provision changed to a refund of $3.4 million versus the 1991 provision of $9.8 million
(effective rate 30.4%) because of previous years' loss carry forwards and deductions and achange in the investment income mix.
Insurance UnderwritingFairfax's insurance companies employ disciplined underwriting practices with the objective of rejectingunderpriced risks. The combined loss and expense ratio is the traditional measure of underwriting results ofproperty and casualty companies. In any year when the ratio exceeds 100%, it generally indicates thatunprofitable business has been underwritten.
10/14/99 3:05AM
34
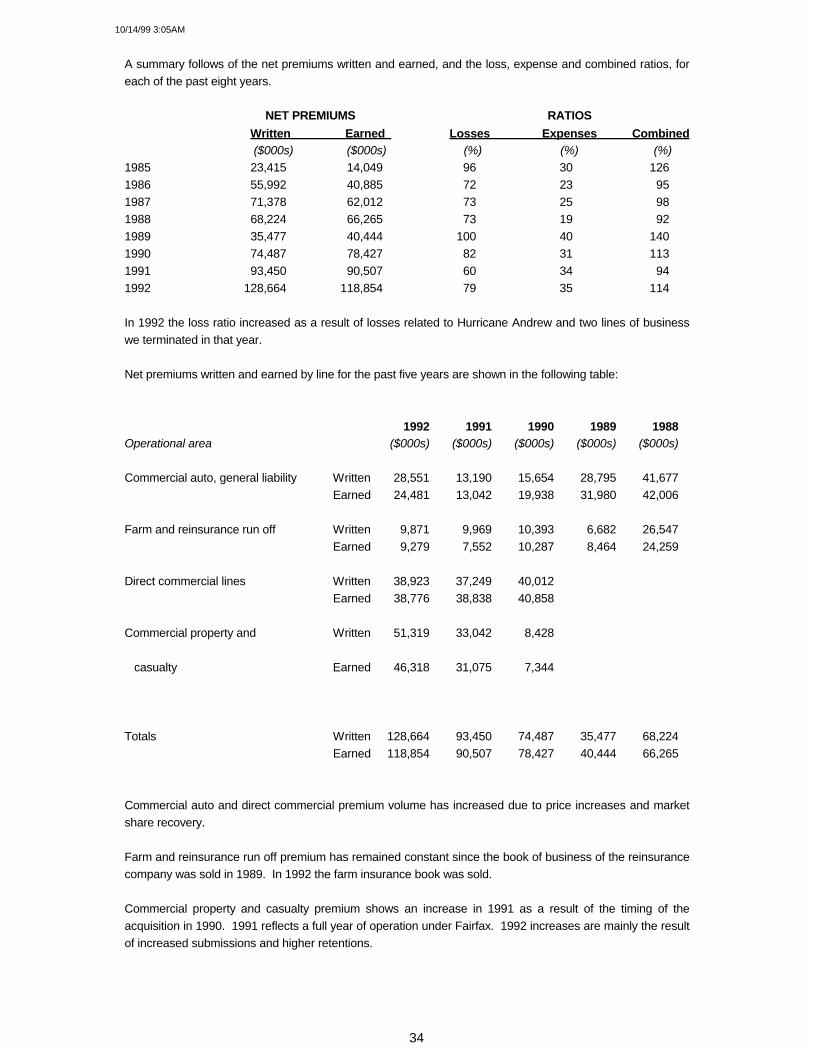
A summary follows of the net premiums written and earned, and the loss, expense and combined ratios, foreach of the past eight years.
NET PREMIUMS RATIOS Written Earned Losses Expenses Combined($000s) ($000s) (%) (%) (%)
1985 23,415 14,049 96 30 1261986 55,992 40,885 72 23 951987 71,378 62,012 73 25 981988 68,224 66,265 73 19 921989 35,477 40,444 100 40 1401990 74,487 78,427 82 31 1131991 93,450 90,507 60 34 941992 128,664 118,854 79 35 114
In 1992 the loss ratio increased as a result of losses related to Hurricane Andrew and two lines of businesswe terminated in that year.
Net premiums written and earned by line for the past five years are shown in the following table:
1992 1991 1990 1989 1988Operational area ($000s) ($000s) ($000s) ($000s) ($000s)
Commercial auto, general liability Written 28,551 13,190 15,654 28,795 41,677Earned 24,481 13,042 19,938 31,980 42,006
Farm and reinsurance run off Written 9,871 9,969 10,393 6,682 26,547Earned 9,279 7,552 10,287 8,464 24,259
Direct commercial lines Written 38,923 37,249 40,012 � � Earned 38,776 38,838 40,858 � �
Commercial property and Written 51,319 33,042 8,428 � �
casualty Earned 46,318 31,075 7,344 � �
Totals Written 128,664 93,450 74,487 35,477 68,224Earned 118,854 90,507 78,427 40,444 66,265
Commercial auto and direct commercial premium volume has increased due to price increases and marketshare recovery.
Farm and reinsurance run off premium has remained constant since the book of business of the reinsurancecompany was sold in 1989. In 1992 the farm insurance book was sold.
Commercial property and casualty premium shows an increase in 1991 as a result of the timing of theacquisition in 1990. 1991 reflects a full year of operation under Fairfax. 1992 increases are mainly the resultof increased submissions and higher retentions.
10/14/99 3:05AM
35
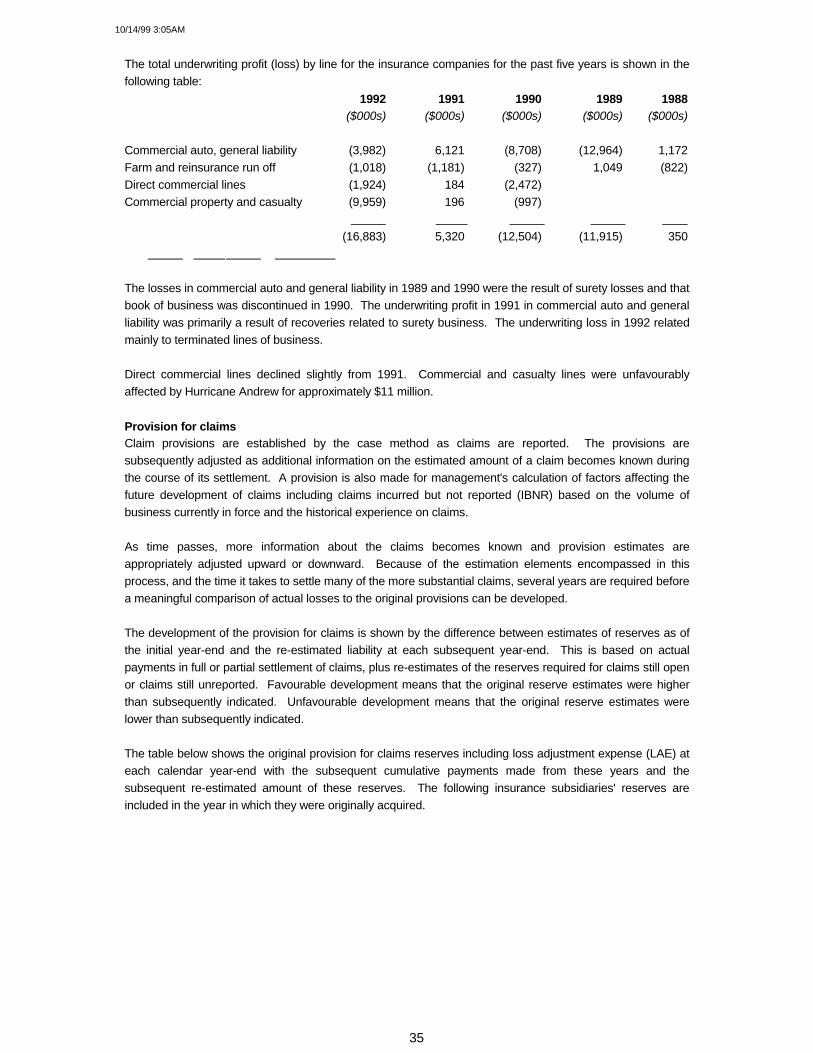
The total underwriting profit (loss) by line for the insurance companies for the past five years is shown in thefollowing table:
1992 1991 1990 1989 1988($000s) ($000s) ($000s) ($000s) ($000s)
Commercial auto, general liability (3,982) 6,121 (8,708) (12,964) 1,172Farm and reinsurance run off (1,018) (1,181) (327) 1,049 (822)Direct commercial lines (1,924) 184 (2,472) � � Commercial property and casualty (9,959) 196 (997) � �
(16,883) 5,320 (12,504) (11,915) 350
The losses in commercial auto and general liability in 1989 and 1990 were the result of surety losses and thatbook of business was discontinued in 1990. The underwriting profit in 1991 in commercial auto and generalliability was primarily a result of recoveries related to surety business. The underwriting loss in 1992 relatedmainly to terminated lines of business.
Direct commercial lines declined slightly from 1991. Commercial and casualty lines were unfavourablyaffected by Hurricane Andrew for approximately $11 million.
Provision for claimsClaim provisions are established by the case method as claims are reported. The provisions aresubsequently adjusted as additional information on the estimated amount of a claim becomes known duringthe course of its settlement. A provision is also made for management's calculation of factors affecting thefuture development of claims including claims incurred but not reported (IBNR) based on the volume ofbusiness currently in force and the historical experience on claims.
As time passes, more information about the claims becomes known and provision estimates areappropriately adjusted upward or downward. Because of the estimation elements encompassed in thisprocess, and the time it takes to settle many of the more substantial claims, several years are required beforea meaningful comparison of actual losses to the original provisions can be developed.
The development of the provision for claims is shown by the difference between estimates of reserves as ofthe initial year-end and the re-estimated liability at each subsequent year-end. This is based on actualpayments in full or partial settlement of claims, plus re-estimates of the reserves required for claims still openor claims still unreported. Favourable development means that the original reserve estimates were higherthan subsequently indicated. Unfavourable development means that the original reserve estimates werelower than subsequently indicated.
The table below shows the original provision for claims reserves including loss adjustment expense (LAE) ateach calendar year-end with the subsequent cumulative payments made from these years and thesubsequent re-estimated amount of these reserves. The following insurance subsidiaries' reserves areincluded in the year in which they were originally acquired.
10/14/99 3:05AM
36
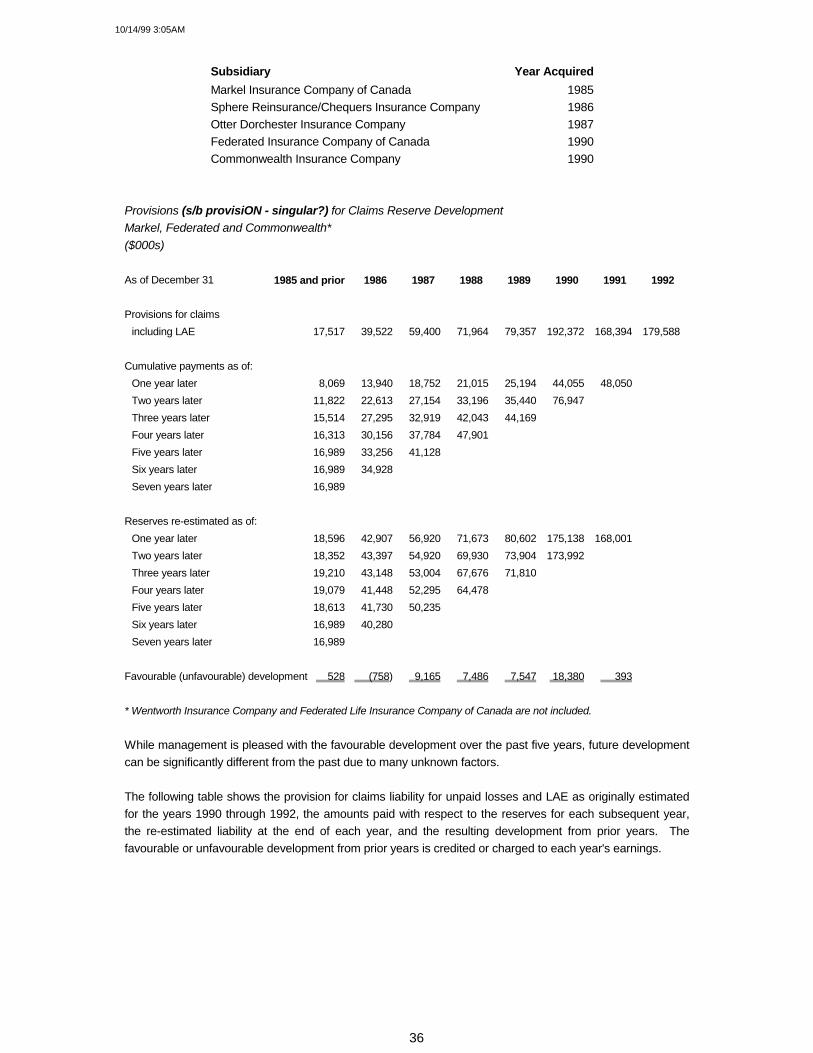
Subsidiary Year AcquiredMarkel Insurance Company of Canada 1985Sphere Reinsurance/Chequers Insurance Company 1986Otter Dorchester Insurance Company 1987Federated Insurance Company of Canada 1990Commonwealth Insurance Company 1990
Provisions (s/b provisiON - singular?) for Claims Reserve DevelopmentMarkel, Federated and Commonwealth*($000s)
As of December 31 1985 and prior 1986 1987 1988 1989 1990 1991 1992
Provisions for claimsincluding LAE 17,517 39,522 59,400 71,964 79,357 192,372 168,394 179,588
Cumulative payments as of:One year later 8,069 13,940 18,752 21,015 25,194 44,055 48,050Two years later 11,822 22,613 27,154 33,196 35,440 76,947Three years later 15,514 27,295 32,919 42,043 44,169Four years later 16,313 30,156 37,784 47,901Five years later 16,989 33,256 41,128 Six years later 16,989 34,928Seven years later 16,989
Reserves re-estimated as of:One year later 18,596 42,907 56,920 71,673 80,602 175,138 168,001Two years later 18,352 43,397 54,920 69,930 73,904 173,992Three years later 19,210 43,148 53,004 67,676 71,810Four years later 19,079 41,448 52,295 64,478Five years later 18,613 41,730 50,235Six years later 16,989 40,280 Seven years later 16,989
Favourable (unfavourable) development 528 (758) 9,165 7,486 7,547 18,380 393
* Wentworth Insurance Company and Federated Life Insurance Company of Canada are not included.
While management is pleased with the favourable development over the past five years, future developmentcan be significantly different from the past due to many unknown factors.
The following table shows the provision for claims liability for unpaid losses and LAE as originally estimatedfor the years 1990 through 1992, the amounts paid with respect to the reserves for each subsequent year,the re-estimated liability at the end of each year, and the resulting development from prior years. Thefavourable or unfavourable development from prior years is credited or charged to each year's earnings.

10/14/99 3:05AM
37
Reconciliation of Provisions for ClaimsMarkel, Federated and Commonwealth*($000s)
1992 1991 1990
Provision for claims and LAE at January 1 168,394 192,372 79,357Plus provision for claims of purchased
subsidiaries at their purchase dates � � 85,428168,394 192,372 164,785
Incurred losses on claims and LAEProvision for current accident year claims 94,177 63,163 80,199Increase (decrease) in provisionfor prior accident years' claims (393) (17,234) 1,245
Total incurred losses on claims and LAE 93,784 45,929 81,444Payments for losses and LAE
Payments on current accident year claims (34,540) (25,852) (28,663)Payments on prior accident years' claims (48,050) (44,055) (25,194)
Total payments for losses and LAE (82,590) (69,907) (53,857)Provision for claims and LAE at December 31 179,588 168,394 192,372
* Wentworth Insurance Company and Federated Life Insurance Company of Canada are not included.
As shown in the table, there has been favourable development from prior years of about $0.4 million in 1992and $17.2 million in 1991, and unfavourable development of $1.2 million in 1990 (mainly because of suretylosses in 1989).
The company strives to establish adequate provisions at the original valuation date. While the favourabledevelopment from prior years in the past two years is comforting, the company continues to be subject toupward or downward development in the future.
Insurance EnvironmentThe property and casualty insurance market in general experienced another year of poor underwriting resultswith combined ratios in Canada expected to be approximately 110% for 1992. Many insurance companiescontinue to write insurance at inadequate prices. Following the various very large underwriting lossesincurred in 1992 in the U.S. and Europe, price adjustments appear inevitable.
Interest and Dividend IncomeThe majority of interest and dividend income is earned by the insurance companies. The Commonwealth andFederated acquisitions added $129.8 million and $100.8 million respectively to the investment portfolio at theend of 1990, and interest and dividend income for Commonwealth was included for only two months in 1990.

10/14/99 3:05AM
38
Average Interest andInvestments Dividend Income
at Book Value Income Yield($000s) ($000s) (%)
1985 29,060 2,455 8.451986 64,181 4,678 7.291987 109,825 8,042 7.321988 130,782 8,922 6.821989 135,703 11,628 8.571990 237,868 20,704 8.701991 338,461 26,051 7.701992 366,481 23,988 6.55
The income yield declined in 1992 to 6.55% as a result of the decline in interest rates and also a switch frombonds into high quality preferreds. Investments for the past eight years are shown in the following table, atthe average of their carrying values at the beginning and end of each year:
Cash andShort Term
Investments Bonds Preferreds Common Total($000s) ($000s) ($000s) ($000s) ($000s)
1985 10,526 15,388 732 2,414 29,060 1986 16,605 24,523 7,979 15,074 64,181 1987 28,025 26,242 16,516 39,042 109,825 1988 29,843 23,575 25,191 52,173 130,782 1989 20,623 28,528 32,212 54,340 135,703 1990 33,596 99,220 45,652 59,400 237,868 1991 60,099 140,177 75,685 62,500 338,461 1992 77,929 108,818 99,821 79,913 366,481
Return on Investment PortfolioThe following table shows the performance of the investment portfolio for the past eight years. The totalreturn includes all interest and dividend income, gains (losses) on the disposal of securities and the changein the unrealized gains (losses) during the year.
Dividends Realized Change in TotalAverage andGains (Losses) Unrealized Return on
Investments Interest After Gains Average Percentageat Book Earned Provisions (Losses) Investment Return
($000s) ($000s) ($000s) ($000s) ($000s) 1985 29,060 2,455 459 878 3,792 13 1986 64,181 4,678 952 (352) 5,278 8 1987 109,825 8,042 9,159 (7,976) 9,225 8 1988 130,782 8,922 7,802 12,131 28,855 22 1989 135,703 11,628 15,458 (6,272) 20,814 15 1990 237,868 20,704 2,278 (32,943) (9,961) (4) 1991 338,461 26,051 (4,512) 27,866 49,405 15 1992 366,481 23,988 3,400 (11,197) 16,191 4
Investment gains (losses) have been an important component of Fairfax's net earnings since 1985. Theamount has fluctuated significantly from period to period, but the amount of investment gains (losses) for any
10/14/99 3:05AM
39
period have no predictive value and variations in amount from period to period have no practical analyticalvalue. The gains (losses) on investments recorded in the statement of earnings for 1992 are net ofprovisions for losses on investments of $6.4 million (1991�$7 million). At December 31, 1992 the aggregateprovision for losses on investments was $16.3 million (1991�$9.9 million). At December 31, 1992 the Fairfaxinvestment portfolio had an unrealized loss of $17.4 million compared to an unrealized loss at December 31,1991 of $6.1 million.
The company expects continuing fluctuations in the stock market and continues to maintain its long termvalue-oriented investment philosophy.
Capital ResourcesAt December 31, 1992 total capital funds, comprising shareholders' equity and non-controlling (minority)interest, were $161.2 million, compared to $141.3 million (including the subordinated convertible debenture)at December 31, 1991.
The following table shows the level of capital as at December 31 for the last four years:
($000s) 1992 1991 1990 1989
Non-controlling interest 17.4 17.0 16.7 10.7Subordinated convertible debenture � 7.5 7.5 7.5Shareholders' equity 143.8 116.8 94.7 90.8
161.2 141.3 118.9 109.0
Fairfax's consolidated balance sheet as at December 31, 1992 reflects a significant improvement in capitalstrength from 1991. Fairfax shareholders' equity has increased from $116.8 million at December 31, 1991 to$143.8 million at December 31, 1992. In 1992 the company purchased and cancelled 109,400 subordinatevoting shares at an average price of $24.12. Also, on February 14, 1992 the $7.5 million subordinatedconvertible debenture was converted into 394,736 subordinate voting shares, increasing shareholders' equityto over $124 million. Effective October 1, 1992, the company purchased Hamblin Watsa Investment CounselLtd. The purchase price of $14 million was paid with $1.854 million cash and 433,773 subordinate votingshares valued at $28 per share.
On November 5, 1992, the company issued 679,352 subordinate voting shares at $28 per share to indirectlypurchase 49.995% of The Sixty Two Investment Company Limited which owns 1,598,620 shares of Fairfax. Fairfax's indirect ownership of its own shares through The Sixty Two Investment Company Limited results inan effective reduction of shares outstanding by 799,230, and this reduction has been reflected in the fullydiluted earnings per share calculation and the book value per share calculation.
In November 1992 Fairfax received approval from The Toronto Stock Exchange to purchase up to 454,500subordinate voting shares of the company under a normal course issuer bid. None had been purchased atDecember 31, 1992.
LiquidityThe purpose of liquidity management is to ensure that there is sufficient cash to meet all financialcommitments and obligations as they fall due.
Fairfax has the financial flexibility to obtain from internal or external sources the funds needed to fulfil its cashrequirements during the current financial year. Cash requirements for Fairfax on an entity basis in 1993include debt servicing and administration expense, totalling about $6 million. Total dividends available from

10/14/99 3:05AM
40
regulated insurance companies in 1993 are approximately $12 million. The insurance subsidiaries of Fairfaxare regulated in their various jurisdictions of operation. As at December 31, 1992 all our insurancecompanies met the standards set by the applicable regulatory authorities.
Consolidated interest expense decreased in 1992 to $7.7 million from $8.8 million in 1991 due to lowerinterest rates.
During 1992, long term debt at Fairfax increased $17 million at the entity level and $6 million at the Morden &Helwig level. The company received smaller dividends in 1992 from its insurance companies, and funded $6million of commitments it had agreed to in past years. In addition, Morden & Helwig and Fairfax completedseveral acquisitions which led to the debt increase.
As a result, the debt to equity ratio with Morden & Helwig equity accounted increased to 0.47:1 at December31, 1992 compared to 0.44:1 at December 31, 1991. The company expects to reduce debt by approximately$17 million in 1993, barring any acquisition activity.
The company has not paid and does not intend to pay dividends as long as it can reinvest the funds and earna 20% return on equity over time.
At December 31, 1992 Fairfax had $75 million of revolving five year term lines of credit of which $47 millionwas utilized.

10/14/99 3:05AM
41
Fairfax Insurance Companies
Combined Statements of Earningsfor the years ended December 31, 1992 and 1991(unaudited)
1992 1991($000) ($000)
RevenuePremiums earned ................................................................... 118,854 90,507
Interest and dividends ............................................................ 22,786 25,361
Realized gains (losses) on investments ................................. 1,977 (2,165)
Other income .......................................................................... 298 2,335
.............................................................................................
............................................................................................. 143,915 116,038
.............................................................................................
ExpensesLosses on claims .................................................................... 94,457 54,267
Operating expenses ............................................................... 37,671 33,606
Commissions, net ................................................................... 3,907 (351)
.............................................................................................
............................................................................................. 136,035 87,522
.............................................................................................
Earnings before income taxes ............................................... 7,880 28,516
Provision for (recovery of) income taxes ................................ (4,171) 7,676
.............................................................................................
Net earnings ............................................................................. 12,051 20,840
.............................................................................................
Fairfax Insurance CompaniesFairfax's insurance business is conducted by five subsidiaries. The companies underwrite a wide range ofcommercial property and oil and gas insurance in Canada, the United States and internationally as well ascommercial casualty, commercial truck and smaller amounts of property, casualty, life, health and disabilityinsurance in Canada.

10/14/99 3:05AM
42
Fairfax Insurance Companies
Combined Balance Sheetsas at December 31, 1992 and 1991(unaudited)
............................................................................................. 1992 1991
............................................................................................. ($000) ($000)
AssetsCash and short term investments .......................................... 83,109 72,141Accounts receivable ............................................................... 73,390 71,802Income taxes refundable ........................................................ 5,448 �
............................................................................................. ............................................................................................. 161,947 143,943
.............................................................................................
Portfolio investmentsBonds � at book value ............................................................ 103,318 114,506Preferred stocks � at book value ........................................... 109,483 94,100Common stocks � at book value ............................................ 92,246 64,409
.............................................................................................
............................................................................................. 305,047 273,015
.............................................................................................
Deferred premium acquisition costs........................................ 6,307 6,128Capital assets .......................................................................... 6,684 5,545Other assets ............................................................................ 82 2,650
.............................................................................................
............................................................................................. 480,067 431,281
.............................................................................................
LiabilitiesAccounts payable and accrued liabilities ................................ 31,650 22,681Premium deposits.................................................................... 5,844 3,993Income taxes payable.............................................................. � 2,441
.............................................................................................
............................................................................................. 37,494 29,115
.............................................................................................
Provision for claims.................................................................. 208,762 194,927Unearned premiums ............................................................... 66,135 55,044Deferred income taxes ........................................................... 6,936 5,706
............................................................................................. ............................................................................................. 281,833 255,677
.............................................................................................
Shareholders' Equity ............................................................... 160,740 146,489
.............................................................................................
............................................................................................. 480,067 431,281
.............................................................................................
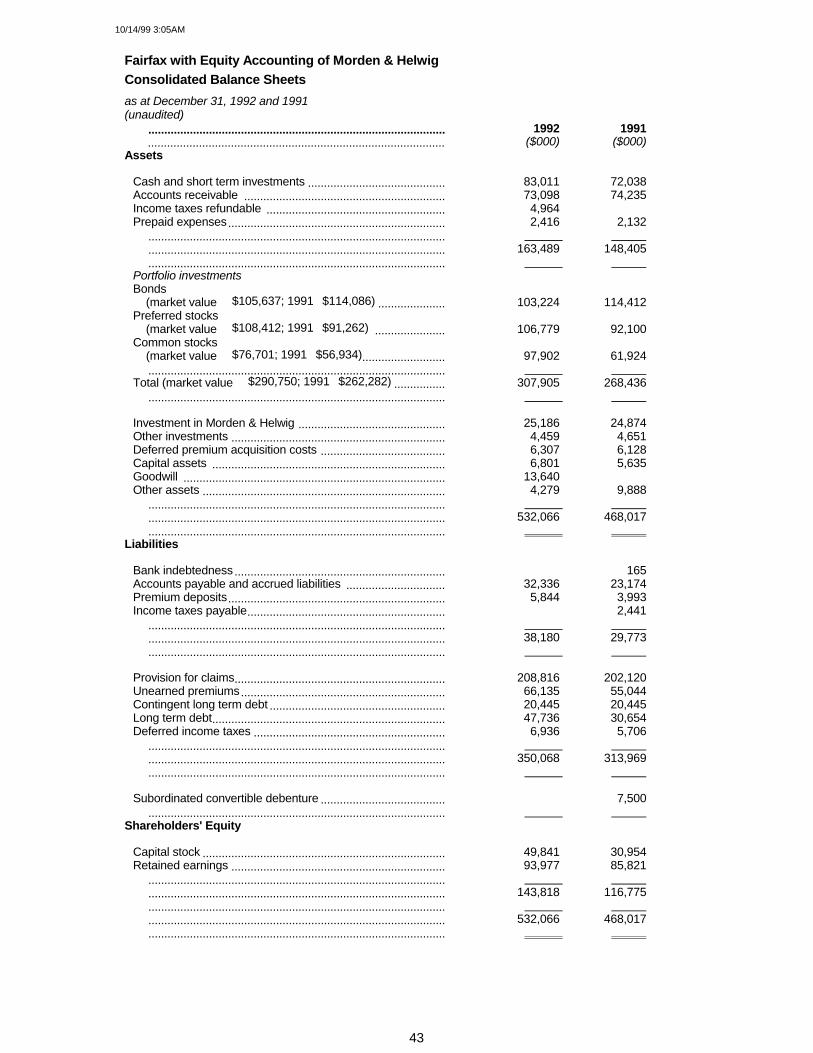
10/14/99 3:05AM
43
Fairfax with Equity Accounting of Morden & HelwigConsolidated Balance Sheetsas at December 31, 1992 and 1991(unaudited)
............................................................................................. 1992 1991
............................................................................................. ($000) ($000)Assets
Cash and short term investments ........................................... 83,011 72,038Accounts receivable ............................................................... 73,098 74,235Income taxes refundable ........................................................ 4,964 � Prepaid expenses.................................................................... 2,416 2,132
.............................................................................................
............................................................................................. 163,489 148,405
............................................................................................. Portfolio investmentsBonds
(market value � $105,637; 1991�$114,086) ..................... 103,224 114,412Preferred stocks
(market value � $108,412; 1991�$91,262) ...................... 106,779 92,100Common stocks
(market value � $76,701; 1991�$56,934).......................... 97,902 61,924.............................................................................................
Total (market value � $290,750; 1991�$262,282) ................ 307,905 268,436.............................................................................................
Investment in Morden & Helwig .............................................. 25,186 24,874Other investments ................................................................... 4,459 4,651Deferred premium acquisition costs ....................................... 6,307 6,128Capital assets ......................................................................... 6,801 5,635Goodwill .................................................................................. 13,640 � Other assets ............................................................................ 4,279 9,888
.............................................................................................
............................................................................................. 532,066 468,017
............................................................................................. Liabilities
Bank indebtedness.................................................................. � 165Accounts payable and accrued liabilities ............................... 32,336 23,174Premium deposits.................................................................... 5,844 3,993Income taxes payable.............................................................. � 2,441
.............................................................................................
............................................................................................. 38,180 29,773
.............................................................................................
Provision for claims.................................................................. 208,816 202,120Unearned premiums................................................................ 66,135 55,044Contingent long term debt ....................................................... 20,445 20,445Long term debt......................................................................... 47,736 30,654Deferred income taxes ............................................................ 6,936 5,706
.............................................................................................
............................................................................................. 350,068 313,969
.............................................................................................
Subordinated convertible debenture ....................................... � 7,500.............................................................................................
Shareholders' Equity
Capital stock ............................................................................ 49,841 30,954Retained earnings ................................................................... 93,977 85,821
............................................................................................. ............................................................................................. 143,818 116,775
.............................................................................................
............................................................................................. 532,066 468,017
.............................................................................................

10/14/99 3:05AM
44
Morden & Helwig Group Inc.Consolidated Balance Sheetsas at December 31, 1992 and 1991
............................................................................................. 1992 1991
............................................................................................. ($000) ($000)
Assets
Cash ........................................................................................ 484 324Accounts receivable ................................................................ 25,128 20,640Claims in process ................................................................... 12,391 12,523Prepaid expenses ................................................................... 1,227 1,249
.............................................................................................
............................................................................................. 39,230 34,736.............................................................................................
Notes receivable ..................................................................... 1,143 1,108Capital assets ........................................................................ 10,622 8,952Other assets ............................................................................ 35,446 30,692
.............................................................................................
............................................................................................. 86,441 75,488
.............................................................................................
Liabilities
Bank indebtedness ................................................................. 4,792 4,315Accounts payable and accrued liabilities ................................ 14,017 10,546Income taxes payable.............................................................. 278 35Long term debt � current portion ............................................ 1,532 5,807Deferred income taxes ............................................................ 3,024 3,160Net liabilities of discontinued operations ...................................................... 64 268
.............................................................................................
............................................................................................. 23,707 24,131
.............................................................................................
Long term debt ........................................................................ 13,336 3,869Future retirement payments ................................................... 6,384 5,758
.............................................................................................
............................................................................................. 19,720 9,627
.............................................................................................
Subordinated convertible debenture ...................................... 8,320 7,900.............................................................................................
Shareholders' Equity
Capital stock ........................................................................... 22,625 21,831Retained earnings .................................................................. 12,069 11,999
.............................................................................................
............................................................................................. 34,694 33,830
.............................................................................................
............................................................................................. 86,441 75,488
.............................................................................................

10/14/99 3:05AM
45
Morden & Helwig Group Inc.Consolidated Statements of Earningsfor the years ended December 31, 1992 and 1991
............................................................................................. 1992 1991
............................................................................................. ($000) ($000)
Revenue .................................................................................... 139,294 122,460
Cost and expensesCost of service ......................................................................... 108,084 94,337Selling, general and administration ......................................... 27,480 23,059Interest ..................................................................................... 2,375 1,298Gain on disposal of assets ...................................................... (21) (595)
.............................................................................................
............................................................................................ 137,918 118,099
.............................................................................................
Earnings before income taxes................................................ 1,376 4,361Income taxes .......................................................................... 814 2,156
.............................................................................................
.............................................................................................Earnings from continuing operations.................................... 562 2,205
Discontinued operations ........................................................ � (1,971).............................................................................................
Net earnings.............................................................................. 562 234.............................................................................................
Consolidated Statements of Retained Earningsfor the years ended December 31, 1992 and 1991
............................................................................................. 1992 1991
............................................................................................. ($000) ($000)
Retained earnings - beginning of year................................... 11,999 12,257Net earnings for the year ......................................................... 562 234Dividends ................................................................................. (492) (492)
.............................................................................................
Retained earnings - end of year.............................................. 12,069 11,999.............................................................................................
These condensed financial statements have been prepared from the Morden & Helwig Group Inc. auditedconsolidated financial statements for the years ended December 31, 1992 and 1991, copies of which areavailable on request.

10/14/99 3:05AM
46
Consolidated Financial Summary (in thousands except per share data)
For the years ended December 311992 1991 1990 1989 1988 1987 1986 1985 1984 1983
Operating ResultsPremiums earned 118,854 90,507 78,427 40,444 66,265 62,012 40,885 14,049 16,616 19,621
Claims fees 139,782 122,982 58,281 49,092 43,349 33,529 6,850 � � �
Interest and dividends 23,988 26,051 20,704 11,628 8,922 8,042 4,678 2,455 2,337 2,009Realized gains (losses) on investments 3,400 (4,512 ) 2,278 15,458 7,802 9,159 952 459 25 215Other income 806 14,974 35,740 9,132 7,311 229 368 52 � �
Total revenue 286,830 250,002 195,430 125,754 133,649 112,971 53,733 17,015 18,978 21,845
Earnings before income taxes 6,975 32,465 23,238 19,204 21,324 18,203 9,085 (880 ) (4,854 ) 308
Extraordinary items � � � � � 1,700 1,711 � � �
Net earnings 10,045 22,515 21,306 16,741 14,357 16,019 6,548 (910 ) (4,775 ) 280
Per Common ShareNet earnings � fully diluted 1.76 3.94 2.92 2.25 1.94 2.23 1.35 (1.89) (7.75) 0.45
Shareholders' equity 23.76 21.41 17.29 12.41 10.13 8.32 5.89 2.08 3.71 11.46Number of shares outstanding
� year-end 6,055 5,455 5,477 7,316 7,322 7,337 7,007 5,000 616 616
Financial ConditionTotal Assets 590,548 516,564 535,987 248,065 246,786 185,413 129,845 41,477 31,401 32,325
Cash and investments 391,781 341,180 335,740 133,858 137,548 124,016 95,633 32,728 25,391 24,218
Total debt * 68,181 51,264 65,918 21,988 28,235 2,773 2,800 � 1,000 300
Shareholders' equity 143,818 116,775 94,676 90,830 74,176 61,048 41,275 10,379 2,287 7,062
Return on Average
Shareholders' Equity 7.7% 21.3% 23.0% 20.3% 21.2% 31.3% 25.4% � � 4.1%
* Total debt with Morden & Helwig equity accounted
Readers of this Management's Discussion and Analysis should review the entire annual report for additional commentaryand information.
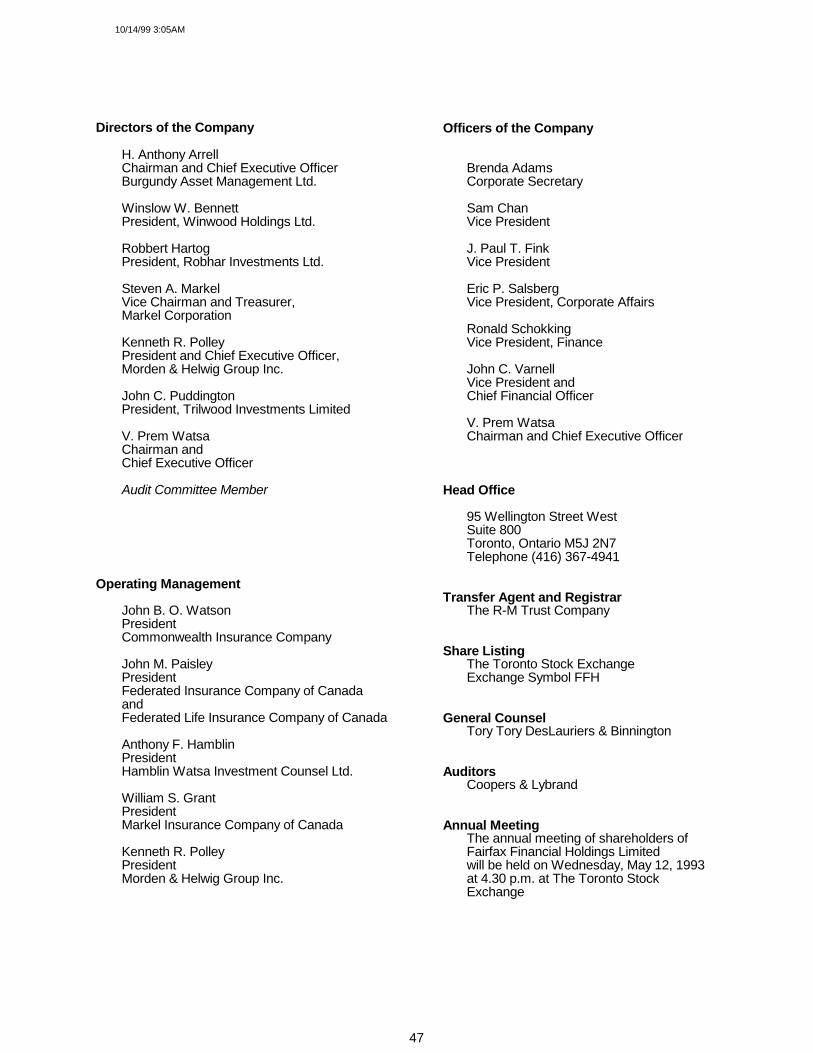
10/14/99 3:05AM
47
Directors of the Company
H. Anthony ArrellChairman and Chief Executive OfficerBurgundy Asset Management Ltd.
Winslow W. BennettPresident, Winwood Holdings Ltd.
� Robbert HartogPresident, Robhar Investments Ltd.
� Steven A. MarkelVice Chairman and Treasurer,Markel Corporation
Kenneth R. PolleyPresident and Chief Executive Officer,Morden & Helwig Group Inc.
John C. PuddingtonPresident, Trilwood Investments Limited
� V. Prem WatsaChairman andChief Executive Officer
� Audit Committee Member
Operating Management
John B. O. WatsonPresidentCommonwealth Insurance Company
John M. PaisleyPresidentFederated Insurance Company of CanadaandFederated Life Insurance Company of Canada
Anthony F. HamblinPresidentHamblin Watsa Investment Counsel Ltd.
William S. GrantPresidentMarkel Insurance Company of Canada
Kenneth R. PolleyPresidentMorden & Helwig Group Inc.
Officers of the Company
Brenda AdamsCorporate Secretary
Sam ChanVice President
J. Paul T. FinkVice President
Eric P. SalsbergVice President, Corporate Affairs
Ronald SchokkingVice President, Finance
John C. VarnellVice President andChief Financial Officer
V. Prem WatsaChairman and Chief Executive Officer
Head Office
95 Wellington Street WestSuite 800Toronto, Ontario M5J 2N7Telephone (416) 367-4941
Transfer Agent and RegistrarThe R-M Trust Company
Share ListingThe Toronto Stock ExchangeExchange Symbol FFH
General CounselTory Tory DesLauriers & Binnington
AuditorsCoopers & Lybrand
Annual MeetingThe annual meeting of shareholders ofFairfax Financial Holdings Limitedwill be held on Wednesday, May 12, 1993at 4.30 p.m. at The Toronto StockExchange
