19606830 merrill lynch the b2b market maker book(1)
TRANSCRIPT

7/21/2019 19606830 Merrill Lynch the B2B Market Maker Book(1)
http://slidepdf.com/reader/full/19606830-merrill-lynch-the-b2b-market-maker-book1 1/88
In-depth Report United States
3 February 2000
Henry BlodgetFirst Vice President
(1) 212 [email protected]
Edward McCabeVice President
(1) 212 [email protected]
The B2B MarketMaker Book
They’re All Business
Reason for Report: Industry Overview
Merrill Lynch & Co.Global Securities Research & Economics Group
Global Fundamental Equity Research Department#5078
RC#60203410

7/21/2019 19606830 Merrill Lynch the B2B Market Maker Book(1)
http://slidepdf.com/reader/full/19606830-merrill-lynch-the-b2b-market-maker-book1 2/88
The B2B Market Maker Book – 3 February 2000
2
Executive Summary• A new species of company is exploding onto the
scene – the B2B market maker. We believe that over the next five years, B2B market makers will cause profound change in the world economy and,
possibly, create more than $1 trillion in stock market value. B2B market makers act asinfomediaries and transaction engines within large,established, often stagnant industrial industries.Capturing just a small portion of the enormous valueof goods and services transacted within theseindustries should translate into significant revenueand (hopefully) profit for the B2B market makers.
• An estimated $400-$500 billion gross revenue opportunity. We estimate worldwide B2B electroniccommerce will grow from $158 billion in 1999 to $2.5trillion by 2003. Importantly, in our view theoverwhelming majority of this commerce will occur on
seller sites, like those of Grainger, Intel, and FedEx.However, we estimate that 15-20% of B2B electroniccommerce will likely be transacted through third-partymarketplaces, generating revenue of $400-$500 billionby 2003. A revenue multiple of 2X-3X suggests thatB2B market makers could generate market capitalizationof $800 billion to $1.5 trillion by 2003, with a presentvalue between $340 billion and $620 billion.
• Network effect should create high barriers to entry and ROIC for market leaders – translating into 1) highvaluations for the leader, 2) dismal valuations for No.
3-No.5. Even more than B2C, B2B e-commerce shouldevolve into a winner-take-most game (sellers willalways gravitate to the marketplace with the mostpotential buyers; buyers to the marketplace with thegreatest selection and price competition). The cost of ensuring market leadership will initially be high – wedon’t look for profits anytime soon. Once leadership iswon, however, the leader should find itself in theenviable position of being the “operating system” for theindustry, the interactive platform around which thewhole industry standardizes. Operating systembusinesses command high multiples.
• Not surprisingly, the B2B market maker opportunity has not gone unnoticed: investors are already paying through the nose for the promise of B2B.The current valuations of most public B2Bcompanies, as well as the private valuations of manyothers, are dizzying (the 10-12 public B2B marketmaker stocks are valued at $85 billion on run-raterevenue of $3-$4 billion – or 20-30X). We expect tosee a plethora of B2B market makers go public thisyear – some great, some okay, some poor. As supplyand demand move closer to equilibrium, werecommend that investors take care to own only thestocks of the best companies. In fact, there could beas much as 100% downside for low-quality B2Bstocks – of which, in our opinion, there will be many.
• We recommend that investors develop a B2Binvestment strategy, whether direct or indirect,
offensive or defensive. For diversified growthinvestors, this would include allocating a small
percentage of the portfolio to a basket of highquality B2B stocks. The leading B2C internet stocks
have outperformed the major indexes for 5 straightyears. Assuming B2B follows a similar trajectory,the risk associated with the sector’s extremevaluations, volatility, and fundamental uncertaintywill, for some investors, be offset by the potentiallygreater risk of not being involved. Put another way,we continue to believe that for investors the greatestrisk in hyper-growth equity investing (which this is)is not losing money, but missing big upside.
Key Points
Huge market opportunity should create major market capitalization. We believe worldwide B2B electroniccommerce could approach $2.5 trillion by 2003. Of this,we estimate that $400-$500 billion will be generated byB2B market makers. At 2X-3X these estimates, webelieve B2B market makers could generate total marketcapitalization between $800 billion and $1.5 trillion by2003 (with a present value between approximately $340billion and $620 billion).
Powerful business models (network effect, customer lock-in, low capital intensity (at maturity), and “operating
system qualities”) should create high barriers to entry and high ROIC. As a result of the network effect, leadingmarket makers should enjoy exponential revenue growthonce a critical mass of market participants and liquidity isachieved. Expenses, meanwhile, should grow linearly,creating high operating leverage. Once established as theleader in an industry, a market maker should enjoydeclining participant acquisition costs, high barriers toentry, high switching costs, and recurring revenue. Start-upcosts and near-term losses will likely concern someinvestors, but, in our opinion, for the best market makers,these investments can be viewed as analogous to CAPEXspending for physical networks (which is capitalized andtherefore doesn’t negatively affect the P&L).
In our view, the good stocks are dizzyingly expensive, but we would rather pay up for them than look for cheap stocks of poorer companies. It is hard to generate first- rate returns by owning second-rate companies, and in this industry, you usually get what you pay for .Although the current crop of market makers will likelygenerate significant fundamental value over time, thecurrent valuations are driven largely by an imbalance of supply and demand. Assuming markets remain robust,we expect to see a plethora of market makers go public inthe next few years. As the supply of stocks moves closerto equilibrium with demand, quality will likely becomemore important (we believe there is close to 100%downside for low-quality stocks). Long-term, there arelikely be many more losers than winners.

7/21/2019 19606830 Merrill Lynch the B2B Market Maker Book(1)
http://slidepdf.com/reader/full/19606830-merrill-lynch-the-b2b-market-maker-book1 3/88
The B2B Market Maker Book – 3 February 2000
3
Each industry sector is different, so each market maker must be carefully analyzed (ie, a large industry does not necessarily translate into a valuable market maker).There are, however, some common characteristics for
success:• Plenty of buyers and sellers. If you want to make a
market, you need both. Ideally, you will have morethan your competitors do (or a plan to get them).
• Liquidity. The value of a market maker is a multipleof the value of transactions that flow through it. Inthe early going, the market maker should have, or befocused on generating, industry-leading liquidity.
• Fragmentation. Middlemen add the most value inmarkets that are highly fragmented on both thesupply and demand sides.
• Inefficiency. Market makers must add value to bothsides of the trade. They can often do so by makingthe buying and selling process more efficient.
• Management with domain expertise . Senior levelindustry relationships and credibility ease concernand facilitate industry “buy in.”
• Early mover advantage. EBay only had a year headstart in the C2C auctions business, but this wasenough.
• Partnerships for distribution and logistics . UPSdoesn’t transport lumber, resin, or hydrochloric acid.
• Neutrality (but not at the expense of liquidity).Few companies opt to do business with theircompetitors – or with subsidiaries of competitors.
• Public currency. With a billion dollar market cap, if you don’t yet have a real business, you can buy one.
Table 1: Valuation Table – Selected Public B2B Market Makers
Market Cap 2000E Rev. Market Cap 2001E Rev. Market CapCompany Ticker 02-Feb-00 High Low ($ millions) ($ millions) To 2000E Sales ($ millions) To 2001E Sales
Ariba (1) ARBA $162.63 $211.00 $30.50 $12,203 $145 84x $278 44x
Chemdex (2) CMDX 97.50 143.00 15.13 3,208 132 24x 271 12x
CommerceOne (1) CMRC 172.25 331.00 8.83 12,402 130 95x 260 48x
FreeMarkets (3) FMKT 229.00 370.00 163.88 8,107 43 190x 86 94x
Internet Capital Group ICGE 119.00 212.00 7.00 32,868 NA NA NA NA
Neoforma NEOF 50.31 60.94 39.88 3,270 NA NA NA NA
pcOrder (4) PCOR 46.38 94.00 26.75 723 68 11x 104 7x
PurchasePro.com (5) PPRO 82.88 175.00 14.66 2,325 18 126x 42 55x
RoweCom (2) ROWE 35.38 53.56 13.13 357 598 1x 1,028 0x
SciQuest (2) SQST 56.63 91.63 25.94 1,556 68 23x 275 6x
VerticalNet (6) VERT 238.25 289.56 17.38 8,386 77 110x 149 56xTotal $85,405Total (ex ICGE & NEOF) $49,267 $1,278 39x $2,491 20x(1) Revenue predominantly licenses, services, and maintenance fees(2) Revenue predominantly gross product sales(3) Revenue predominantly fixed monthly fees(4) Revenue predominantly subscription, content, and services fees(5) Revenue predominantly subscription fees(6) Revenue predominantly advertising fees
52 Week Range
Source: Merrill Lynch Internet Research; FactSet; Investext
Note: At this early point, due to differences of what and how they sell, market makers are recognizing revenue differently.However, almost without exception, the long-term goal for all market makers is to generate more transaction-based revenue.

7/21/2019 19606830 Merrill Lynch the B2B Market Maker Book(1)
http://slidepdf.com/reader/full/19606830-merrill-lynch-the-b2b-market-maker-book1 4/88
The B2B Market Maker Book – 3 February 2000
4
CONTENTS
Section Page
Executive Summary 2
Introduction: Asking The RightB2B Questions
1. 5
Overview: An Industry Snapshot 2. 7
A Brief History of B2BElectronic Commerce
3. 17
B2B Market Overview 4. 21
Market Maker Models 5. 26
Horizontal & Vertical Markets 6. 31
Why We Like B2BMarket Makers
7. 34
Market Maker Beneficiariesand Liquidity
8. 36
Market Maker Success –Key Industry Criteria
9. 38
Market Maker Success –Key Company Criteria
10. 42
B2B Market MakerValuation Framework
11. 45
B2B Market MakerInvestment Philosophy
12. 48
Company Profiles 13. 51
B2B Market Maker Master List 87

7/21/2019 19606830 Merrill Lynch the B2B Market Maker Book(1)
http://slidepdf.com/reader/full/19606830-merrill-lynch-the-b2b-market-maker-book1 5/88
The B2B Market Maker Book – 3 February 2000
5
1. Introduction: Asking The Right B2BQuestions.This report focuses on what we believe to be the internet’s next frontier – B2B(business-to-business) electronic commerce. Unlike companies that focus onconsumer-oriented commerce such as Amazon and EBay, B2B market makers arethird-party intermediaries whose primary purpose, in most cases, is to matchcorporate buyers and sellers. They typically take a fee, make a spread or receivecommissions for their services. Furthermore, the highly targeted audiences manyof these sites attract also allow some of them to generate significant advertisingrevenue.
B2B electronic commerce is not a new concept. Many large companies have beencommunicating electronically with their trading partners for over twenty years viaEDI (electronic data interchange). However, the onerous expenses and technologicalcomplexity of EDI have limited its growth as well as the appreciation of the stocksrelated to it such as Harbinger and Sterling Commerce. More recently, companieslike FedEx, Dell, Intel, Cisco and Grainger have aggressively adopted the internetas a commerce platform. Their web site launches have experienced tremendoussuccess. However, while some component of the market caps of these companiesreflect the benefits B2B electronic commerce has brought to their respectivebusinesses, they are certainly not B2B pure plays from an investment standpoint.
Domestically, Forrester Research forecasts the value of goods and servicestransacted between businesses by 2003 at $1.5 trillion – approximately 14X theirestimate for B2C online commerce. Considering international opportunities, webelieve this market could reach $2.5 trillion in the same year. In our view, theoverwhelming majority of B2B electronic commerce revenue will continue to becaptured by seller sites like those of Intel and Grainger. However, third-partymarket makers – the B2B pure plays – have just begun to emerge. These marketmakers match buyers and sellers more efficiently not only in vertical (industry-specific) markets such as paper, plastics, chemicals, and steel, but also inhorizontal markets (functional) markets for products and services used in allindustries like MRO, consulting services, media buying, and excess inventory.
As indicated by the highly successful IPOs of companies like Internet Capital Group,VerticalNet, Chemdex, SciQuest, FreeMarkets, RoweCom, Ariba, CommerceOne,PurchasePro, etc., over the last year, we believe investors have correctly identified themagnitude of the B2B opportunity and are aggressively seeking for exposure to it.This demand, coupled with the hundreds of private market makers already inexistence, should undoubtedly lead to an IPO calendar over the next 12-18 months fullof B2B market makers. Merrill Lynch’s B2B market maker recommendationscurrently include Internet Capital Group and Ariba, which are covered by the Internetand Enterprise Software groups, respectively.
The major goals of this report are to provide:
1. an overview of B2B electronic commerce and different market maker models;
2. an investment philosophy/framework for B2B market makers;3. a valuation framework;
4. key industry characteristics likely to foster market-maker adoption; and
5. key company characteristics likely to drive market maker success.

7/21/2019 19606830 Merrill Lynch the B2B Market Maker Book(1)
http://slidepdf.com/reader/full/19606830-merrill-lynch-the-b2b-market-maker-book1 6/88
The B2B Market Maker Book – 3 February 2000
6
1. How large is the industry (gross sales, US and worldwide)? How much of it do you think will be transacted through a B2B market maker? Why?Many market makers just assume that 10%-40% of gross sales will gothrough market makers. In many cases, though – especially in industries withlow fragmentation – there is little reason to use a market maker. Marketmakers must 1) solve specific, identifiable problems and 2) add value to boththe buy and sell sides of the supply chain or industries will just ignore them.
2. How fragmented are the buy and supply sides of the industry? Industrieswith a high level of fragmentation on both the buy and sell sides are the best formarket maker adoption, because the MM can add value simply as an aggregator.
3. How inefficient are procurement, sales, and distribution in the industry?The promise of the market place is, in part, to cut fat. So it helps if theindustry is chubby to begin with.
4. What specific industry problem(s) can a third-party marketplace solve –for both the buy and sell sides. The best MMs can identify specific buy andsell-side problems that they solve, as well as future problems that they expectto be able to solve. Remember: using a market maker requires a change incorporate behavior and changing corporate behavior is difficult, no matterhow “sensible” the change seems. As a result, market makers that can “ease
pain”immediately (provide obvious, identifiable, and quantifiable advantages)will likely see faster adoption than those that don’t.
5. How much of a change in behavior does using your marketplace requireon the part of suppliers and buyers? The less, the better – unless you canconvince the company to pay millions of dollars for software licenses andinstallation, in which case it will have to force change in behavior or risk losing its investment.
6. What are your transaction volumes today? How have they ramped?What is the strategy for generating industry-leading “liquidity”(transaction volume through the marketplace). The slickest, most highlyfunctional marketplace in the world is worthless if buyers and sellerscongregate to do business somewhere else.
7. What portion of your management team is from the industry youaddress? Do senior people have strong relationships at the most seniormanagement levels of industry players? Even in the internet industry,people like to do business with people they know and like. This is especially truein the case of market makers, which initially might seem to be less friend than foe.
8. How do you intend to induce the participation of suppliers, particularlylarge ones? What has been the reaction, particularly among largesuppliers, to your entrance into the industry? Have they agreed or atleast indicated an intention to work with you? Are they considering it?Are they dead-set against it? Big suppliers are usually critical to gainingliquidity (who wants to shop at a market that doesn’t carry most of theproducts?). They are also the least likely industry participants to “need” athird-party market maker, especially early on. Having clear strategies forsigning them up, therefore, are critical to success .
9. Are there other B2B market makers addressing the industry? Are youahead or behind them in terms of transactions and revenue as well asbuyer and supplier relationships? Why? This will likely be a winner-take-most game. The aim is to identify the market leader as quickly as possibleand put your eggs in its basket.
10. Do middlemen in the industry add significant value? If so, how do youplan to work with them? Have you partnered with the key distributionand logistics providers? You can buy and sell all day long, but when you’redone transacting, you still have to ship the stuff. Depending on the industry,some middlemen will continue to add value in a market maker world, otherswon’t. The best market makers will partner with middlemen that add valueand, slowly but surely, take market share away from the ones that don’t.
Merrill’s Top TenQuestions To Ask B2B Market
Maker Managements
7/21/2019 19606830 Merrill Lynch the B2B Market Maker Book(1)
http://slidepdf.com/reader/full/19606830-merrill-lynch-the-b2b-market-maker-book1 7/88
The B2B Market Maker Book – 3 February 2000
7
2. Overview: An Industry SnapshotThe recent hype surrounding B2B e-commerce might lead an observer to believethat it is a new concept. It isn’t. Although the emerging market makers are new,B2B electronic commerce has a history that dates back more than twenty-fiveyears.
We trace the heritage of internet-based Electronic commerce back to EDI(Electronic Data Interchange), which allows businesses and their trading partnersusing a variety of systems to exchange information through a standard set of transactions over value-added-networks (VANs). However, EDI deployment andongoing VAN charges have proven too onerous for all but the largest companies.As a result, it is estimated that only 25% of a typical “hub’s” trading partners(“spokes”) use EDI. So not only does a large population of businesses not useEDI, but those that do only realize its benefits with a small portion of theirsupplier base. We believe the major principle of EDI – reducing the process costsof intercompany trade – will live on. However, we believe as businesses continueto get more comfortable with the security, reliability and performance of theInternet that the use of EDI over expensive, proprietary VANs will give way toInternet-facilitated transactions. Enter, the market makers…
We don’t quibble with Forrester Research’s U.S. forecast of $1.5 trillion ($1.3trillion for goods and $200 billion for services) for B2B online trade. We alsobelieve there are significant opportunities for market makers in internationalmarkets, particularly because many of the large industrial markets thesecompanies typically address, like steel, automotive, telecommunications, andelectronics, are global today. In 2003, we assume 38% of B2B electroniccommerce revenue will be generated internationally. As a result, we believeworldwide electronic commerce revenue could total approximately $2.5 trillion by2003. However, more important than this total sales figure is the likely mixbetween seller sites, like those of Cisco, Dell, Intel, Boeing, Grainger, FederalExpress, etc., and the sites of online market makers – the B2B investmentopportunities upon which this report is focused.
We believe that seller web sites will dominate the overall mix of B2B revenue (ie,to play this growth, investors must buy manufacturers such as Cisco directly orcompanies that sell ecommerce products and services to the manufacturers, suchas Verisign, Scient, or iXL). However, we believe it is a reasonable assumptionthat third-party market makers could represent 15-20%, or $372-$496 billion of overall online B2B sales by 2003. In addition, we also assume advertisers spend$7-$10 billion with market makers at this point in time. Combined, we believe thetotal revenue attributable to online market makers by 2003 could range between$400 and $500 billion. (In our conservative case, which we consider less likely,we estimate that only 10% of B2B electronic commerce revenue, or approximately$250 billion, is transacted through market markers.)
Internet-based market makers, the latest incarnation of B2B e-commerce, come indifferent variations. The current market makers usually employ one or more of four basic models – catalog, auction, exchange, and community – which areoutlined below. The critical component for success with all of these models is aclearly identifiable benefit for both buyers and sellers. Those that don’t have thiswill have difficulty attracting the critical mass of buyers and sellers necessary todrive liquidity.
Online Catalogs. Online catalogs are optimally suited for markets where thesupply and demand sides of a market are highly fragmented. SciQuest andChemdex in life sciences are examples of vertically focused players in thiscategory. Ariba, CommerceOne, and PurchasePro in MRO (maintenance, repair,and operating supplies) are horizontally focused market makers. Essentially, thesemarket makers take the paper-based catalogs of multiple vendors, digitize theproduct information and provide buyers with one-stop shopping over the Internet.However, the fact that, in most cases, these market makers embed themselves in
A Brief History of B2B Electronic Commerce
B2B Market Overview
Market Maker Models

7/21/2019 19606830 Merrill Lynch the B2B Market Maker Book(1)
http://slidepdf.com/reader/full/19606830-merrill-lynch-the-b2b-market-maker-book1 8/88
The B2B Market Maker Book – 3 February 2000
8
the business processes and IT systems of buyers and suppliers, reduce process andinventory costs, extend supplier reach, and improve customer access to suppliersmakes their value much greater than just digitizing catalogs. Online marketmakers allow buyers to search for products more efficiently. Instead of flippingthrough a mountain of separate, often out-dated, supplier catalogs, buyers canutilize the powerful search capabilities of the Internet to compare products onmany dimensions including price, availability, delivery dates, warranty, serviceinformation, etc. The prices of products on these sites are typically fixed. Onlinecatalogs usually derive revenue from the combination of a percentage of grosstransaction values, typically in the low single digits to the mid-teens, as well asproduct listing and advertising fees from suppliers.
Auctions . Auctions provide a venue for the purchase and sale of unique items suchas surplus inventory, used capital equipment, discontinued goods, perishableitems, or refurbished products. Examples, among many, include FreeMarkets, areverse auction for manufactured inputs, and TradeOut or AsseTrade, auctions forasset procurement and disposition and excess inventory. In addition, verticallyfocused companies like PaperExchange, which is predominantly (as its namesuggests) a market maker in pulp and paper, also generate ancillary revenues fromthe auction of paper-related capital equipment. Auction pricing is dynamic. In a
traditional auction, the competitive bidding process results in upward pricemovement. The reverse auction, a format in which sellers compete for a buyer’soffer to purchase, results in downward price movement. Revenue for onlineauctioneers is usually derived from the combination of transaction fees typicallyranging from the high single digits to the low twenties as a percentage of grossmerchandise value as well as product listing and supplier advertising fees.
Exchanges. Exchanges provide a spot market for commodities – often with highprice volatility. They provide a venue for the purchase and sale of commoditieslike natural gas, electricity, and telecommunications bandwidth. Altra andEnermetrix in natural gas and electricity and Arbinet in telecommunications are allprominent examples. These markets are bid/ask and provide real-time pricing.Exchanges allow buyers and sellers to trade anonymously, which is key becauseidentifying buyers and sellers can damage their competitive position and skew
pricing. Although market share is important in every market maker category, webelieve it is of paramount importance for exchanges. This is because market sharemeans liquidity. Exchanges without significant liquidity are likely to fail due tothe relatively small transaction fees they extract. However, exchanges that doattain leading market share should have extremely defensible competitivepositions because offering the most liquidity will make trading on a competitiveexchange less compelling. Exchange revenue typically comes from thecombination of transaction fees as well as membership fees. Transaction feesusually range from a spread of a few basis points to percentage spreads in thelow/mid single digits.
Community Market Makers. Community market makers bring together potentialbuyers and sellers, in the form of professionals with common interests, throughweb sites that feature industry-specific content and community aspects. The
content and community aspects these sites typically provide include industry-specific news, editorials, market information, job listings, chat, message boards,etc. As a result, these community market makers attract a targeted audience of potential buyers for suppliers. For the most part, community market makersgenerate revenue from advertising, sponsorship and membership fees as well asfrom fees paid by suppliers for lead generation. Although in most cases minimaltransaction revenue is actually generated on these sites today, we believe this willchange over time as these community market makers either add transaction-orientedmarket mechanisms onto their sites or generate revenue by driving traffic to thecommerce sites of others. With over fifty sites ranging from pollutiononline.comto adhesivesandsealants.com, VerticalNet is the “poster boy” for communitymarket makers.

7/21/2019 19606830 Merrill Lynch the B2B Market Maker Book(1)
http://slidepdf.com/reader/full/19606830-merrill-lynch-the-b2b-market-maker-book1 9/88
The B2B Market Maker Book – 3 February 2000
9
In summary, today, many of the aforementioned market models are separateentities even within specific vertical industries. However, over time we wouldexpect to see some convergence where, for instance, the catalog, auction andexchange pricing mechanisms for, say, the chemicals industry, take place on onesite. Furthermore, as we are already seeing with VerticalNet, we would expect tosee community-based market makers monetize eyeballs through revenue streamsbeyond advertising, sponsorship and lead generation fees. In other words,transaction-based revenue.
Fundamentally, we believe there are two business-to-business markets – verticalmarkets and horizontal markets. Vertical markets are industry-specific. Theinefficiencies addressed and the requirements required for success in each of theseindustries differ significantly. Horizontal market makers facilitate the purchaseand sale of goods and services used by a plethora of industries. In the shorthistory of Internet-based B2B e-commerce, hundreds of vertical market makershave already emerged in industries ranging from metals and livestock to printingand chemicals. Similarly, horizontal market makers have emerged that support thepurchase and sale of goods and services such as those for maintenance, repair andoperations (MRO), benefits administration, media buying and logistics. Asbusiness adoption of these new models matures, we expect a B2B quilt to be
woven where horizontal market makers become interwoven with vertical ones.We expect market makers to capture a meaningful piece of overall B2B e-
commerce. In our view, the overwhelming majority of the estimated $2.5 trillionin B2B e-commerce in 2003 will occur on seller sites, like those of Grainger, Intel,and FedEx. However, we believe that 15-20% of B2B electronic commerce willbe transacted through third-party marketplaces, implying a revenue opportunity of approximately $400-$500 billion by 2003.
User lock-in, “operating system qualities,” low capital intensity, and the networkeffect should lead to high barriers to entry and ROIC for the market leaders.Once leading B2B market makers achieve a critical mass of buyers and suppliers –no easy accomplishment and one that few have achieved to date – they shouldbenefit from the network effect over time. In other words, leading B2B sites (ornetworks) should scale significantly as they attract buyers looking for a broadselection of products and suppliers seeking a large audience of potential buyers.This dynamic should allow market makers to enjoy exponential revenue growthonce a critical mass of market participants and liquidity is achieved. At the sametime, expenses should grow linearly, creating significant operating leverage.Although start-up costs are likely to be high, the pay-off for companies that gaincontrol of their markets should be huge. In fact, we believe the initial start-up andcustomer acquisition costs can be viewed in the same way that CAPEX spendingis viewed for companies building physical communications networks (ie, as aninvestment rather than operating cost). Because CAPEX spending is capitalized,the early P&L for the owner of a physical network will look better than one for amarket maker, where the costs are expensed. Over the long-term, however, themarket maker’s ongoing costs will be relatively fixed, whereas the physicalnetwork’s costs will grow variably with each additional user, which will lead to
much higher returns on invested capital for the successful market maker. Participant acquisition costs, which will start out extremely high, should decline over time and allow for margin expansion. For B2B market markers, the cost of attracting buyers and suppliers, in particular, will be extremely high in the earlygoing. However, as the network effect takes hold and more participants migrate toa market maker, it should take less money and prodding to get suppliers tocontribute their products to a growing source of demand and buyers to shop at agrowing source of supply. Exponential revenue growth due to the network effect,coupled with declining participant acquisition costs should lead to marginexpansion for leading market makers.
Horizontal & Vertical Markets
Why We Like B2B Market Makers

7/21/2019 19606830 Merrill Lynch the B2B Market Maker Book(1)
http://slidepdf.com/reader/full/19606830-merrill-lynch-the-b2b-market-maker-book1 10/88
The B2B Market Maker Book – 3 February 2000
10
Critical mass will create high barriers to entry. Once a market maker gathers acritical mass of buyers and suppliers, embeds itself in the business processes andIT infrastructure of both, achieves market liquidity, and secures relationships withkey distribution and logistics partners we believe it will be tough for anothermarket maker to overtake the leader. Furthermore, leading vertical (industry-specific) market makers will align themselves with specialized distribution andlogistics players to fulfill the orders taken on their site. We believe the B2Bmarket makers that forge these important relationships will have a significant legup toward securing highly defensible market positions.
High switching costs for participants . Aligning with a particular market makertypically includes systems integration between the intermediary and buyers andsuppliers as well as the market maker embedding itself in the business processesof both. In all likelihood, these factors will make switching to another network prohibitively expensive and disruptive.
Recurring revenue. Once market makers embed themselves in the procurementprocesses of buyers, the sales and distribution processes of suppliers, and the systemsof both they should become venues for highly recurring transactions and revenue.
We believe the benefits of online intermediaries are more evident for certain
participants than for others. As we further explain below, we believe smallsuppliers benefit the most from online market makers, followed by small buyersand large buyers. We believe gaining the participation of large suppliers willprove the most challenging for market makers. Since, in our view, large suppliersare the single most important factor in providing liquidity, we consider theirinvolvement the linchpin of a market maker’s success. Below we explain ourthought process and rank marketplace participants according to what we believe isthe relative value proposition offered to each by market makers.
1. Small Suppliers . We believe small supplier participation in online markets ispretty much a no-brainer. “Small” usually means limited resources – whichincludes sales and distribution. Small suppliers usually have neither the brandname nor the scale to provide a sizable enough discount to induce largedistributors or value-added resellers to push their goods and services. Online
markets provide a low-cost distribution channel through which smallsuppliers can reach small customers formerly too far and expensive to reachand large buyers with whom they could never get an entrée.
2. Small Buyers . This is another online market maker participant we throw inthe “no-brainer” category. Online market makers allow small buyers toautomate and reduce the expenses related to the manual procurement processas well as reduce inventory and related carrying costs. Also, small buyersnow get greatly expanded supplier access.
3. Large Buyers. Large buyers buy in volume and, as a result, are highly soughtafter by suppliers of all sizes. A great deal of what large buyers purchasecomes from large suppliers that can handle the service, quality, and pricingrequirements to which big customers are entitled due to their buying power.In addition, commerce between large buyers and large suppliers is oftenalready automated through EDI. Therefore, we don’t believe the benefits of online market makers are as compelling for large buyers as they are for theirsmaller brethren. For the less progressive large buyers, market makers willadd value through automation and reduce procurement processing andinventory carrying costs. For large buyers that have automated theirprocurement processes to a large degree, we believe that there are incrementalprocess and inventory cost savings to be realized.
4. Large Suppliers. We believe supplier affinity for online intermediaries willrun inversely to their market share. In other words, the more market share asupplier controls, the more work it will take to get it to distribute through anonline market maker – for several reasons. For one, large suppliers are large,in part, because they already have broad customer reach and efficient sales
Market Maker Beneficiaries
& Liquidity

7/21/2019 19606830 Merrill Lynch the B2B Market Maker Book(1)
http://slidepdf.com/reader/full/19606830-merrill-lynch-the-b2b-market-maker-book1 11/88
The B2B Market Maker Book – 3 February 2000
11
and distribution channels. Secondly, as leaders in their industries, customersare already required to consider these suppliers when making a purchase.Third, due to their strong competitive position these suppliers will be reticentto serve as one of the “big draws” for a market maker that carries competitiveofferings. As a result, large suppliers like Cisco and Intel are likely tocontinue to sell directly through their own sites.
However, we believe large suppliers will end up participating in third-partyhosted Internet markets – for several reasons. First and foremost, customerswill demand it. With global competition increasing, suppliers differentiatethemselves now, more than ever, through customer service. As such, webelieve that, long-term, suppliers will respond to buyer demands that theymake their products and services available via online market makers. Also,once the most progressive large suppliers in an industry have come on board,laggard suppliers are likely to fall like dominos just to maintain market share.Furthermore, market makers present a channel through which smallersuppliers can nibble away at the market shares of larger players; we don’texpect large suppliers to sit idle and watch this happen. Finally, we expectlarge suppliers will use online market makers to gain access to new customersand revenue streams altogether.
We believe there are key characteristics that will make certain industries morefertile ground for online market maker success. We paint some pretty broadstrokes here and advise investors to assess specific industry characteristicsthoroughly for each market maker opportunity. However, we believe developingsome broad framework to assess the likelihood of market maker success, one thatwill be tweaked as we learn more about B2B, is required to even beginconsidering the merits of particular B2B investment opportunities. The keycharacteristics we would assess or be looking for follow.
A large market. To oversimplify things, we would be looking for market makersthat address very large vertical or horizontal markets. Online market makers areabout reducing inefficiency. Even if a large market is relatively efficient, it islikely that, due to its size, inefficiencies within it can support a very significantinternet business. The optimal market maker will be one that addresses a verylarge, inefficient market like paper, steel and plastics. However, be careful.While large, inefficient markets might have the most fat to take out and, therefore,the most profit potential for a market maker long-term, the fact that they haveremained inefficient for so long likely indicates that they are extremely resistant tochange. As a result, some of the best market maker opportunities might takelongest to come to fruition.
Buyer and seller fragmentation. Theoretically, the more fragmentation, thebetter. As we mentioned earlier, we believe small suppliers and small buyersbenefit the most from online market makers. Therefore, in our view, an industryfull of “little guys” would be ideally suited for a market maker. However, we alsobelieve gaining liquidity in such a market, the key to a market maker’s success,may take some time because it will require bringing a large number of entitiesonline. We think industries where most of the commerce is conducted betweenlarge buyers and large suppliers might be slowest to adopt market makers.However, we also believe that once a couple of large industry leaders contributesupply that others will have to follow suit. Therefore, once the ball starts rolling,we expect liquidity to follow.
Fat. We view fat as the non-value-added links in the value chain. Investors needto be careful here. We would be wary of the prospects of market makers that leadwith purely a disintermediation strategy. While there are middlemen in manyvalue chains that add minimal value beyond matching buyers and sellers (brokersin the paper and plastics industries come to mind), many middlemen, such asvalue-added resellers and many distributors, are important and irreplaceable linksin the value chain. Market makers that focus on automating processes that arecurrently manual so employees can focus more on the value added functions they
Market Maker Success – Key Industry Criteria

7/21/2019 19606830 Merrill Lynch the B2B Market Maker Book(1)
http://slidepdf.com/reader/full/19606830-merrill-lynch-the-b2b-market-maker-book1 12/88
The B2B Market Maker Book – 3 February 2000
12
perform will probably find themselves in a solid industry position. Those thattrumpet a goal of taking food off somebody’s table are likely to feel powerfulindustry forces come to bear on them.
High IT adoption. Generally speaking, we believe industries that have widelyadopted information technology will be more receptive to online market makersthan those that have not. First of all, we believe the fact that the technology
infrastructure is already in place for companies within these industries makesutilization of online market makers an easy transition technology-wise. Second,and probably more importantly, we believe IT adoption serves as a rough proxyfor an industry’s attitude toward change – particularly change that increasesefficiency, which is exactly what market makers are about.
Management with domain expertise . Successful B2B market makers must havemanagement with the industry knowledge, senior level industry relationships, andcredibility to address industry concerns, particularly among suppliers, andarticulate the benefits of migrating to this new market maker paradigm in order togain industry “buy in.”
(Near flawless) early mover advantage . Market makers that move first withoutmajor mistakes are likely to build the critical mass of buyers and suppliers thatwill make them the default online location for conducting trade in their particularindustry. However, more important than moving early, is executing well onceyou’re moving. One high-profile incident of a market maker site going down or amajor steel or chemical customer’s production line grinding to a halt because amarket maker facilitated a delivery that was late or “off-spec” is likely to prompt achorus of “I told you so s” from industry.
Strong partnerships for distribution and logistics. Unlike books, CDs, andstereos, UPS doesn’t transport lumber, resin, or hydrochloric acid. This takesspecialized distribution and logistics players. In many industries, leading marketmakers will need to forge relationships with the key distribution and logisticsproviders in their industry.
Neutrality and liquidity. Market makers need to ensure that all marketparticipants are playing by the same set of rules and being treated equitably in themarketplace. However, we do believe there are ways (ie, performance-basedwarrants or small equity stakes for large suppliers) for market makers to “jumpstart” liquidity while remaining neutral enough to enlist broad participation. Toparticipate in the huge potential upside of a B2B investment, investors can’t waitfor liquidity to be achieved in order to invest – the horse will be way out of thebarn by then. So investors need to look for the characteristics that are likely tolead to liquidity –management with industry knowledge and expertise, early-mover advantage, a critical mass of potential buyers to attract suppliers, a handfulof supplier relationships, key distribution and logistics relationships, and relativeneutrality.
Public currency. This is not to fan the flames of what may be characterized as ascorching B2B IPO market, but assuming that a market maker is confident that itcan execute against the key metrics investors are looking for, we contend thatgoing public is a major competitive advantage. Aside from the fact that the cost of capital may never be cheaper, the IPO significantly increases the visibility of thesecompanies vs. their private competition and also provides them with highly valuedcurrency to quickly grow their businesses through acquisition.
At this early stage, sizing the B2B market and the shareholder value it mightcreate is tough. Frankly, over the next couple of years, valuations are likely to bedriven as much by the grandiose promises of B2B, a scarcity of investmentchoices, strong sequential revenue growth (on diminutive numbers), press, hype,sentiment etc. as by the potential long-term fundamentals of market makers. If history has taught us one thing, it is that many investors are insensitive tovaluation when the fundamentals for Internet companies are improving. Given thatthe sector is so nascent, we expect to see improving fundamentals and increasing
Market Maker Success – KeyCompany Criteria
B2B Valuation Framework

7/21/2019 19606830 Merrill Lynch the B2B Market Maker Book(1)
http://slidepdf.com/reader/full/19606830-merrill-lynch-the-b2b-market-maker-book1 13/88
The B2B Market Maker Book – 3 February 2000
13
market caps for B2B companies for the foreseeable future. Nonetheless, webelieve it is necessary to set up a framework to at least put valuation in somefundamental perspective.
Based on our methodology, we believe it is likely that B2B market makers couldgenerate total market capitalization between $800 billion and $1.5 trillion by 2003.We estimate the present value of this total market capitalization to be between
approximately $340 billion and $620 billion. (Note: Currently, there are only ahandful of publicly traded market markers. Therefore, most of the potential market capitalization to be created resides in private companies. As a result, we believethat the extraordinary valuations of some public market makers reflect more thantheir long-term fundamentals – namely, the general excitement surrounding thisseemingly huge opportunity and the scarcity of public ways to play it.)
Our methodology is fairly straightforward. We estimate 1) the total market forB2B electronic commerce, 2) the percentage of revenue to be captured by marketmakers, 3) market maker profit margins, 4) a multiple to apply to the impliedmarket maker earnings, and 5) an acceptable discount rate (35%).
As mentioned, we believe worldwide electronic commerce revenue could totalapproximately $2.5 trillion by 2003. Clearly, in order for third-party market
makers to create meaningful market capitalization they will have to pick up agreater share of this growing market. The fact that the Ciscos, Intels and FedExsof the world are dominant suppliers in their respective industries has made gainingrelatively quick revenue traction over the web easier for them than it has been formarket makers. This makes sense to us because market makers need to enlistsupplier and buyer participation, which takes time, before generating a meaningfulvolume of transactions. Furthermore, established companies with seller-centricsites have a number of characteristics that make generating web-based businessrelatively easy almost immediately – their own supply or relationships with majorsuppliers and existing customers as well as a brand name and marketing resourcesto attract new customers. In addition, these companies already have relationshipswith the key distribution and logistics players necessary for fulfilling orders. Inother words, these businesses are quick “out of the box” in regard to generatingonline sales, while market makers take longer to ramp.
Over the coming years, we expect that many market makers will add meaningfulnumbers of buyers and suppliers and establish the key distribution and logisticsrelationships. We believe that seller web sites will dominate the overall mix.However, we believe it is a reasonable assumption that third-party market makerscould represent 10-20%, or $248-$496 billion of overall online B2B sales by2003. In addition, we also assume advertisers spend $5-$10 billion with marketmakers at this point in time. Combined we believe the total commerce passingthrough online market makers by 2003 could range between approximately $250-$500 billion. We believe something in the $400-$500 billion range is likely.Based on the higher end of our 2003 revenue range, we believe market makerscould create approximately $800 billion-$1.5 trillion in market capitalization by2003. Below, we lay out three scenarios.

7/21/2019 19606830 Merrill Lynch the B2B Market Maker Book(1)
http://slidepdf.com/reader/full/19606830-merrill-lynch-the-b2b-market-maker-book1 14/88
The B2B Market Maker Book – 3 February 2000
14
Chart 1: B2B Electronic Commerce Valuation Framework ($ billions)
ConservativeCase
Middle Case Bullish Case
Total B2B Transaction Revenue – 2003E $2,481 $2,481 $2,481
Seller Site Sales 90% 85% 80% Market Maker Sales 10% 15% 20%
Market Maker Transaction Revenue $248 $372 $496Market MakersAdvertising Revenue $5 $7 $10TOTAL Market Maker Revenue $253 $380 $506 CAGR (1998-2003E) 237% 259% 275% US 63% 63% 63% International 38% 38% 38%
Net Margin 3% 4% 5%
Net Income $8 $15 $25
PE Multiple 50x 55x 60xRevenue Mulitple 1.5x 2.2x 3.0xMARKET CAPITALIZATION (2003E) $380 $835 $1,518
PV (Discount Rate = 35%) $154 $339 $617Source: Merrill Lynch Internet Research; Forrester Research; Veronis Suhler & Associates
The valuation methodology outlined above is a framework to bring someperspective to where valuations might “normalize” several years out. Obviously,tweaking any of the inputs – overall B2B market size, the percentage of thismarket captured by third-party market makers, margins or multiples – causes thepotential market cap created by the B2B opportunity to swing wildly. In addition,over the near-term (probably the next couple of years, rather than months), therevenue multiples applied to leading B2B companies are likely to remain insubstantial excess of what we use for our valuation framework. Despite strongnear-term growth, for the foreseeable future almost all B2B market makers arelikely to continue to appear small relative to the huge market opportunities they
typically address. We expect investors to ascribe extremely high price-to-salesmultiples to companies for which potential market opportunities look far fromsaturation, upside to revenue estimates remain likely, the waning of hyper-growthany time soon seems remote, and execution is strong.
As evidenced by the spectacular public market debuts of B2B companies likeInternet Capital Group, FreeMarkets, Ariba, CommerceOne, Purchase Pro,Chemdex, SciQuest, RoweCom, and VerticalNet, among others, there issignificant investor demand for public B2B investments. Given the size of theopportunity, this is not surprising. However, despite the multi-billion dollarmarket caps most public B2B companies enjoy, they are all at early stages of development. In many ways, public investors are taking on roles once reservedfor venture capitalists. Whether this role should ever be left to public marketinvestors is open to debate, but, in our minds, that debate is academic. We believeB2B will create tremendous value for public market investors. We believe potentialinvestors should be cognizant of some key points when considering B2B investing.
B2B market makers will likely have a profound effect on many economic sectors, particularly industrial ones. The steel, paper and plastics industries havebeen doing business in essentially the same, often inefficient, manner for manyyears. B2B market makers, with no legacy business or relationships to protect,seek to make businesses out of capturing profit that many large companies formany different reasons, including potential channel conflict, fixed assetinvestment, delicate partner relationships, vertical integration, a general failure toembrace electronic commerce, or complacency, have foregone. The established,
Investment Philosophy

7/21/2019 19606830 Merrill Lynch the B2B Market Maker Book(1)
http://slidepdf.com/reader/full/19606830-merrill-lynch-the-b2b-market-maker-book1 15/88
The B2B Market Maker Book – 3 February 2000
15
often stagnant industrial ecosystems into which these new B2B market makerorganisms look to insert themselves are typically huge – often hundreds of billionsof dollars. Capturing just a small portion of the value transacted within theseindustries is likely to create what could be valuable B2B Internet investments.
Investors are paying up for the promise of B2B. Currently, the public valuations of most B2B companies, as well as the private valuations of many others, look very
expensive. Almost every public B2B company sports a market cap of over $1 billion.Most have multi-billion dollar market caps. In addition, it is not uncommon to seepremiere private companies with hundreds of millions of dollars of private valuation.Undoubtedly, valuations are driven, in large part, by the fact that many B2Bcompanies address huge opportunities and will become valuable long-term based onfundamentals. However, we believe that the valuations of public B2B stocks and oneslikely to come public over the next year are also driven, to varying degrees, by whatseems to be indiscriminate investor demand for anything B2B. This can be attributedto numerous factors, including the B2B hype created by Wall Street, venturecapitalists, and the media and the fact that many investors are determined to catch, inB2B, the Internet run they may have “missed” in B2C. Assuming markets remainrobust, we expect to see a plethora of B2B market makers come to the public market –some great, some okay, some poor. As supply and demand move closer to
equilibrium, it is important for investors to understand the quality of what they mightown and realize that, over time, there could be as much as 100% downside for low-quality B2B equities.
The net result of so many B2B companies coming public is likely to be that therewill be many more losers than winners. Generally speaking, successful marketmakers will create liquidity in the markets they address by enlisting participationfrom a critical mass of buyers and suppliers. For vertical market makersparticularly, it is likely that the No. 1 player in medical equipment, chemicals, orlivestock, etc. will dwarf No. 2 in terms of value.
Why? Market leaders will enjoy the benefits of the network effect. In otherwords, suppliers will align themselves with market makers that provide themaccess to the most buyers and buyers are likely to make purchases through marketmarkers that present them with the largest choice of products and suppliers. As aresult, within a specific market, a dominant share of electronic commerce is likelyto be transacted through the leading site and allow the No. 1 player to enjoy theleverage associated with significant scale as well as strong returns on investedcapital. However, in these “winner take most (if not all)” markets, it isquestionable whether the next tier of players will scale to a size that provides themthe leverage to reach profitability. Obviously, we believe investing in No. 1 isoptimal, investing in No. 2 could result in good returns but is more risky, andinvesting in No. 3, No. 4, and No. 5 is likely to be a bad use of capital.
Winners are likely to create significant value. The downside for losers could be close to 100%. Therefore, if you have a loser, we would recommend that you cut bait immediately. If you have a winner, don’t let valuation scare you into selling. Historically, good internet stocks have looked expensive from thebeginning and looked more expensive over time. Bad internet investments havedone one of two things – they have either started expensive and gotten cheaper orstarted cheap and gotten cheaper. In our experience, the only time investors focuson the valuation of an internet stock is when fundamentals are deteriorating.Given that B2B is in its infancy, we would not expect to see sector-widefundamental deterioration for quite some time. However, if fundamentals shouldtruly deteriorating for a particular B2B company, we believe the stock should besold. However, if fundamentals are improving and upside to estimates is expectedto continue, the stock is likely to continue to rise over the long-term.

7/21/2019 19606830 Merrill Lynch the B2B Market Maker Book(1)
http://slidepdf.com/reader/full/19606830-merrill-lynch-the-b2b-market-maker-book1 16/88
The B2B Market Maker Book – 3 February 2000
16
We don’t expect investors to sell their best internet stocks because they suddenlylook expensive (they always look expensive). On the flip side, we would notadvise investors to rush to buy what seem to be cheap B2B internet stocks. Theyare almost always cheap for fundamental reasons.
Investor suitability. So… market opportunities are large, the companiesaddressing these opportunities are early-stage, winners are likely to create
extraordinary returns, losers could prove to be close to worthless, and pickingwinners and losers is tough. Isn’t this type of investing suitable only for venturecapitalists? No, diversified growth investors, sector investors, and speculativeinvestors all need a strategy for B2B – whether offensive or defensive, direct orindirect. In a vacuum, almost every B2B market maker is a speculative, high-risk and early-stage investment. B2B investing is arguably the closest thing to venturecapital in today’s public markets, so, obviously, these investments are not suitablefor the risk averse. However, many other investor types of varying risk profilesneed to develop a strategy for the sector. Investors that choose to have exposureto the space need to take different approaches.• Diversified growth investors. We have always maintained that diversified
growth investors allocate a small percentage of capital (ie, 10%) to pure playinternet investments. We would suggest that these same investors earmark apercentage of this overall internet allocation to a “basket” of B2B marketmaker stocks. Most B2B market makers address huge markets and have greatpromise, but they also still have much to prove. A “basket” approach givesinvestors the best chance to realize excellent returns by having a couple of success stories in a portfolio of investments in which the majority are losers.In addition, we believe diversified growth investors have limited chances of outperforming applicable investment benchmarks, which are likely to have anincreasing B2B component embedded in them over time, without B2Bexposure.
• Sector investors. It is hard to tell if market makers will actually create newvalue or take it from established industry players. They will probably do a bitof both. In the best case, market makers would create value for themselvesand others by providing leading industry veterans with new customers andincremental revenue streams, lower cost distribution channels, expandedcustomer reach, and improved productivity. Either as a way to capture newlycreated value or as a hedge against value lost by established businesses, webelieve portfolio managers with assets in many industries need exposure tothese new market maker investments.
• Speculative investors . As mentioned, B2B market makers investments arehigh risk/high reward. Under the assumptions that they have more risk capitalat their disposal and are emotionally conditioned to endure more risk thanmost, we believe speculative investors can seek outsized returns by allocatingmore capital to B2B investments over the near-term. For maximum near-termappreciation, we would seek out companies likely to deliver extraordinarysequential revenue unit growth over the next several quarters.

7/21/2019 19606830 Merrill Lynch the B2B Market Maker Book(1)
http://slidepdf.com/reader/full/19606830-merrill-lynch-the-b2b-market-maker-book1 17/88
The B2B Market Maker Book – 3 February 2000
17
3. A Brief History of B2B ElectronicCommerceAll the recent hype surrounding B2B e-commerce might lead an observer tobelieve that it is a brand new concept. It is not. While the emerging third-partycompanies that provide online catalogs, communities, auctions, and exchanges,among other models, are the pure play internet-based B2B investmentopportunities investors are excited about, B2B electronic commerce has a historythat dates back over twenty-five years. We believe this bodes well for theacceptance of B2B market makers because it indicates that businesses have beenadopting B2B e-commerce, although in a different form, for many years. Wewould also point out that, although to varying degrees among different industries,IT is prevalent and becoming increasingly so, in all businesses. In other words,business is generally “wired” for B2B market makers.
Although one could go back further, we trace the heritage of internet-basedelectronic commerce back to EDI (Electronic Data Interchange). In fact, EDI,which allows businesses and their trading partners using a variety of systems toexchange information through a standard set of transactions over value-added-networks (VANs), is over a quarter of a century old. When one thinks of EDIcompanies like Harbinger and Sterling Commerce come to mind. EDI facilitatestransactions such as purchase orders, invoices, shipping notices and a multitude of other documents. EDI can be viewed as a “hub and spoke” model. The “hub” istypically a large company and the “spokes” are its suppliers. Retail,manufacturing, transportation, and healthcare are among the industries that havebeen major adopters of EDI. Due to the fact that EDI runs over proprietarynetworks it is typically well regarded in terms of reliability, security andperformance. For those companies with the resources to use it, EDI has, to someextent, automated the manual process of trading between buyers and suppliers.However, EDI deployment and ongoing VAN charges have proven too onerousfor all but the largest companies. As a result, it is estimated that only 25% of atypical “hub’s” trading partners (“spokes”) use EDI. So not only does a largepopulation of businesses not use EDI, but those that do only realize its benefitswith a small portion of their supplier base. We believe the major principle of EDI –reducing the process costs of intercompany trade – will live on. However, webelieve as businesses continue to get more comfortable about the security,reliability and performance of the internet that the use of EDI over expensive,proprietary VANs will give way to Internet-facilitated transactions.
B2B e-commerce isn’t new. EDI dates back over a quarter
of a century.

7/21/2019 19606830 Merrill Lynch the B2B Market Maker Book(1)
http://slidepdf.com/reader/full/19606830-merrill-lynch-the-b2b-market-maker-book1 18/88
The B2B Market Maker Book – 3 February 2000
18
Chart 2: Electronic Data Interchange
Buyer
Supplier D
Supplier E
Supplier F
Supplier A
Supplier B
Supplier CSource: Merrill Lynch Internet Research
Beyond EDI, many companies have been utilizing the Internet to increase revenue,reduce and avoid expenses, and improve customer service for several years. Wehighlight some examples of the successful use of the Internet in B2B electroniccommerce. Not surprisingly, the companies we highlight are at or near the top of their industries.
Federal Express’ evolution onto the Internet dates back to 1982 when FedEx putterminals on the shipping docks of its major customers. From these terminals,shipping clerks could place pick-up orders directly into FedEx’s systems,automating paperwork and allowing for the electronic tracking of shipment status.
The evolution continued in 1995 when FedEx extended this functionality topersonal computers that accessed FedEx’s systems over modems. This movedcustomer access beyond the shipping dock and into individual departments.Customers could now track the status of orders, helping them better manageproduction schedules and, as a result, customer expectations. In 1996, FederalExpress moved onto the Internet. Using fedex.com customers can request pickup,find drop-off points, and track deliveries, among other things.
FedEx estimates it would have to hire over 20,000 additional couriers, customerservice reps and data-entry clerks to handle the tasks that customers now handlethemselves. Clearly, forgoing these hires allowed FedEx to avoid significantpersonnel costs. Furthermore, FedEx estimates that customers track millions of packages per month on its web site. FedEx estimates that over half of theseInternet-tracked packages would have generated customer service handled calls.
It’s really a double-dip for FedEx. Customers are doing work that allows FedExto avoid and reduce costs and focus on more strategic and revenue-generatingactivities. Meanwhile, customers are more satisfied performing these tasksthemselves anyway.
As the leader in networking gear and the major provider of the Internet’splumbing, Cisco is certainly eating its own cooking. Beyond serving as anincredibly lucrative sales channel, the Internet also enhances Cisco’s ability tooptimize customer service and reduce expenses. In 1991, Cisco began offeringsoftware downloads, defect tracking and technical assistance over the Internet.With the deployment of Cisco’s web site, which commenced in mid-1995, Ciscobrought greater efficiency to and improved customer satisfaction with the orderingprocess. Ordering networking gear is complicated. It is typically configured-to-order by engineers of Cisco’s customers. Pre-Internet, these engineers used to
Many companies haveemployed B2B electronic
commerce for years.
Federal Express
Cisco

7/21/2019 19606830 Merrill Lynch the B2B Market Maker Book(1)
http://slidepdf.com/reader/full/19606830-merrill-lynch-the-b2b-market-maker-book1 19/88
The B2B Market Maker Book – 3 February 2000
19
communicate these complex orders via fax, phone or mail. If mistakes were madein placing or receiving an order, the procurement process would begin again fromscratch with the frustrated customer re-configuring the order. Before Ciscodeployed its web site, approximately one out of four orders needed to be re-initiated.Obviously, in such cases, the time and money of both Cisco and its customer werewasted and customer satisfaction was presumably damaged. Via online ordering,engineers now configure products online, get immediate feedback as to errors, fixthose errors and route the order to procurement. Customer pricing is maintained onCisco’s web site. Therefore, a customer’s authorized purchaser can easilycomplete the order. Similar to FedEx, Cisco allows customers to check the statusof their orders on its web site. Cisco receives hundreds of thousands of inquiresper month. Cisco’s primary freight forwarders update Cisco’s database, typicallyvia EDI, so Cisco’s customers can get current updates on the status of an order.
Cisco sells approximately $30 million+ in products over the Internet every day.That’s approximately $12 billion annually. Over 70% of Cisco’s customerservice requests are handled on the company’s web site. Cisco estimates it issaving at least $500 million in operating costs through its Internet-basedinitiatives. Cisco is a great example of the benefits that B2B e-commerce canbring to a company – increased revenue, improved productivity, reduced expenses
and improved customer satisfaction.Dell is the #1 personal computer company in the world. Dell’s build-to-order,direct sales model has allowed the company to reduce inventory carrying costs andavoid the mark-ups of value-added resellers, distributors and resellers. As a result,Dell estimates it has a 10-15% price advantage over its major competitors. Inshort, Dell’s model has made it the fastest growing major PC provider in the worldand revolutionized the industry. Consistent with its leading edge strategy, Dellwas quick to embrace the virtues of the Internet and electronic commerce. Whilethe vast majority of Dell’s sales are to large corporations, its Internet sales aremuch more weighted toward small businesses and consumers. Therefore, Dell’sInternet strategy goes beyond B2B and has allowed the company to expand itspresence in the consumer market. However, since small businesses are buyingover the Internet and large businesses are accessing the website for product
information, technical assistance and order status updates as well as increasinglyto buy product, we still consider Dell’s Internet strategy largely B2B.
Similar to Cisco, Dell currently generates $35 million in Internet sales per day –that’s over $12 billion annually, and growing. In the most recent quarter, Internetsales accounted for over 43% of Dell’s overall revenue. Dell expects over half of its sales to occur online in the next year or so. The Internet allows Dell to reachbrand new customers. Beyond increased sales, Dell’s web site is extremelyvaluable in terms of reducing service and support costs. Calls for order statusupdates and software downloads cost Dell $3-$5 each. Phone inquiries fortroubleshooting tips run approximately $15. In aggregate, all of these calls run inthe hundreds of thousands of dollars. Moving even a small percentage to the Webenhances Dell’s bottom line. Given the amount of business running through itswebsite, B2B electronic commerce isn’t new to Dell.
GE implemented numerous strategies, including use of the Internet, to improve thepurchasing process. GE lighting piloted an online procurement solution developedby GE Information Systems in 1996. Using the system, employees from GELighting send requisitions to sourcing electronically. The system pulls down theappropriate diagrams and attaches them to the electronic requisition forms.Suppliers are alerted to an incoming RFQ (Request for Quote) within two hours of when the process is initiated. Bids can be awarded within the same day. Puttingtogether a requisition, which used to require retrieving diagrams from a vault,photocopying them and attaching them to a paper requisition form, took at leastseven days. As mentioned, the process can now be completed within one day. Asa result, sixty percent of the procurement staff has been redeployed and thesourcing department has at least 6-8 additional days per month to focus on
Dell
GE

7/21/2019 19606830 Merrill Lynch the B2B Market Maker Book(1)
http://slidepdf.com/reader/full/19606830-merrill-lynch-the-b2b-market-maker-book1 20/88
The B2B Market Maker Book – 3 February 2000
20
strategic activities instead of manual processes. Labor costs in procurement havebeen cut 30%. Due to the fact that sourcing can reach a much larger group of suppliers, material costs have been reduced 5%-20%. The process of identifyingsuppliers, preparing a request for bid, negotiating price and awarding a contracthas been cut from 18-23 days to 9-11. Over the course of 2000, GE expects all of its business units will be purchasing MRO products via the Internet – totaling $5billion. GE thinks it will be able to save $500-$700 million at this time. Clearly,the Internet is playing an important role in improving margins.
These are just a handful of examples of companies utilizing the Internet toimprove business. Intel in microprocessors, Grainger in MRO and Boeing inaerospace and defense are other industry stalwarts considered leading edge in theadoption of Internet-based business-to-business electronic commerce. This smallsample and a continually growing list of companies using the Internet tosignificantly enhance their businesses indicate that B2B is neither new nor a toughconcept to sell.

7/21/2019 19606830 Merrill Lynch the B2B Market Maker Book(1)
http://slidepdf.com/reader/full/19606830-merrill-lynch-the-b2b-market-maker-book1 21/88
The B2B Market Maker Book – 3 February 2000
21
4. B2B Market OverviewWe don’t quibble with Forrester Research’s U.S. forecast of $1.5 trillion ($1.3trillion for goods and $200 billion for services) for B2B online trade. We alsobelieve there are significant opportunities for market makers in internationalmarkets, particularly because many of the large industrial markets these
companies typically address, like steel, automotive, telecommunications, andelectronics, are global today. In 2003, we assume 38% of B2B electroniccommerce revenue is generated internationally. As a result, we believe worldwideelectronic commerce revenue could total approximately $2.5 trillion by 2003.
Chart 3: US B2B Market Forecast – Goods & Services
$0
$200
$400
$600
$800
$1,000
$1,200
$1,400
$1,600
B i l l i o n s
Total B2B Services $22 $44 $83 $143 $220
Total B2B Goods $109 $251 $499 $843 $1,331
1999E 2000E 2001E 2002E 2003E
Source: Forrester Research
Huge Opportunity (in case you hadn’t heard)

7/21/2019 19606830 Merrill Lynch the B2B Market Maker Book(1)
http://slidepdf.com/reader/full/19606830-merrill-lynch-the-b2b-market-maker-book1 22/88
The B2B Market Maker Book – 3 February 2000
22
Chart 4: Worldwide B2B Market Forecast
$0
$500
$1,000
$1,500
$2,000
$2,500
B i l l i o n s
Total Int’l B2B $26 $88 $233 $493 $930
Total US B2B $131 $295 $582 $986 $1,551
1999E 2000E 2001E 2002E 2003E
Source: Merrill Lynch Internet Research; Forrester Research
However, what we view as more important than this total sales figure, is its likelymix between seller sites, like those of Cisco, Dell, Intel, Boeing, Grainger, FederalExpress, etc., and the sites of online market makers – the B2B investmentopportunities upon which this report is focused. We believe that seller web siteswill dominate the overall mix. However, we believe it is a reasonable assumptionthat third-party market makers could represent 15-20%, or $372-$496 billion of overall online B2B sales by 2003. In addition, we also assume advertisers spend$7-$10 billion with market makers at this point in time. Combined we believe thetotal revenue attributable to online market makers by 2003 could range betweenapproximately $400-$500 billion. (In our conservative case, which we considerless likely, we estimate that only 10% of B2B electronic commerce revenue, orapproximately $250 billion, is transacted through market markers.)

7/21/2019 19606830 Merrill Lynch the B2B Market Maker Book(1)
http://slidepdf.com/reader/full/19606830-merrill-lynch-the-b2b-market-maker-book1 23/88
The B2B Market Maker Book – 3 February 2000
23
Chart 5: B2B Electronic Commerce – Seller Site Sales vs. Market Maker Sales
ConservativeCase
Middle Case Bullish Case
Total B2B Transaction Revenue – 2003E $2,481 $2,481 $2,481
Seller Site Sales 90% 85% 80% Market Maker Sales 10% 15% 20%
Market Maker Transaction Revenue $248 $372 $496Market MakersAdvertising Revenue $5 $7 $10TOTAL Market Maker Revenue $253 $380 $506 CAGR (1998-2003E) 237% 259% 275% US 63% 63% 63% International 38% 38% 38%
Source: Merrill Lynch Internet Research; Forrester Research; Veronis Suhler & Associates
Essentially, two constituencies will drive the adoption of B2B e-commerce –buyers and suppliers. For the buyers, B2B e-commerce will drive savings throughlower process costs, reduced inventory carrying costs, improved purchasing policycompliance, and better prices. Furthermore, it will allow buyers to source basedon important parameters beyond price including availability, delivery, quality, and
service, among others. For suppliers, B2B e-commerce will provide a cheaperchannel through which suppliers can sell to existing customers or reach newcustomers altogether. It will also enable suppliers to reduce their process costs.Adoption on both the supply side and the demand side, which we believe is criticalto e-commerce fulfilling its potential, will allow for much more efficient supplyand demand chains. Middlemen that add value will use the Internet to automateprocesses that are currently manual, middlemen that add no value beyond hookingup buyers and sellers better watch out. Below we explain further what we believeto be some of the major values of B2B e-commerce for both buyers and sellers.
Buyer Benefits
Reduced procurement process costs. The National Association of PurchasingManagers estimates that the average manual purchase order costs a company $79
to process, $38 of which is related to internal processing. Searching for productsthrough the separate paper-based, outdated catalogs of suppliers, correspondingwith these suppliers to clarify product and service specifications, availability,delivery, price, etc. and routing requisitions through the approval processmanually is all terribly inefficient. The efficiencies of B2B e-commerce not onlyreduce costs related to the procurement process but also allow personnel to spendmore time on value-added, strategic work.
Reduced inventory costs. A slow procurement process coupled with an inefficientsupply chain leads to long lead times and bloated inventory. e-commerce helpsbuyers reduce inventory costs by improving the order process and increasing thespeed at which suppliers can fulfill orders.
Reduced rogue purchases. Aberdeen Group estimates that 40-45% of corporatepurchases of manufactured goods are made from suppliers other than those on acompany’s preferred vendor list. As a result, businesses are paying much more forgoods and services than needs be the case. B2B e-commerce automates theprocurement process and helps keep employees within corporate purchasingguidelines.
More choices and better pricing . Oftentimes, there are many suppliers fromwhich a customer could be buying goods. However, whether due to a supplier’sor its distributor’s limited geographic coverage or the time and expense related toinvestigating all possible options, a customer is limited to certain suppliers anddistributors. These suppliers and distributors are not always optimal as it regardsnumerous key sourcing parameters, including quality, service, availability,delivery and price.
Buyer and supplier benefits will drive adoption
7/21/2019 19606830 Merrill Lynch the B2B Market Maker Book(1)
http://slidepdf.com/reader/full/19606830-merrill-lynch-the-b2b-market-maker-book1 24/88
The B2B Market Maker Book – 3 February 2000
24
Supplier Benefits
Suppliers reduce the costs associated with sales . The Internet is a cheap, efficientand ubiquitous sales channel, not to mention that it works 24 X 7 without breaks,sick days, vacations or complaints. The nature of some customers and productswill always require sales and distribution through traditional channels. However,there are many products sold and customers reached through existing channelsbecause no better alternatives exist. The inefficiencies of these less-than-optimalchannels typically reveal themselves in inflated costs and margin pressure. TheInternet provides suppliers with a new alternative for selling products and servicesthat don’t necessarily require the “high touch” and related expenses of traditionalchannels.
Suppliers reach new customers thereby generating new revenue streams altogether . In many markets, demand is extremely fragmented . Traditional salesand distribution channels are not limitless, so there are potential buyers thatsuppliers never reach. B2B market makers provide a venue in which vendors canpeddle their wares to a brand new audience of potential customers.
Suppliers reduce the process costs of order management. Due to the fact thatsuppliers and buyers often communicate by phone, fax and mail, the exchange of
information is not only slower than if executed electronically but also more proneto error, which results in costly rework. By automating the exchange of information, B2B e-commerce helps suppliers reduce errors, speed up the order-to-cash cycle, focus employees on value-added functions, and improve customersatisfaction to boot.
Obviously, buyers and suppliers don’t operate in a vacuum. In other words, to alarge degree, a buyer’s efficiency is limited by the efficiency of its suppliers andvice versa. Clearly, B2B e-commerce allows businesses to utilize the Internet toautomate the workflow of many different processes including manufacturing,finance, sales, and purchasing. The Internet can also be used to increaseinformation flow within an enterprise and outside of it creating a “virtualenterprise” that spans the entire “value chain,” which includes customers,suppliers, distributors, etc. All in all, the Internet provides businesses with the
ability to increase operational efficiency by reducing the time, costs and resourcesrequired to transact business, lowering inventory levels and procurement costs,and improving responsiveness to customers and suppliers.
We believe the adoption of B2B e-commerce is still in its very early stages. In ourview, a major shift to Internet-based commerce among businesses is inevitable andnot too far off. However, not all industries will move to this new paradigm asquickly as others will. With technology “blue chips” such as Cisco, Intel and Dell,among others, already doing a tremendous amount of business on the Web, the hi-tech industry has quickly embraced commerce over the Internet. This is notsurprising given that change and innovation is so deeply ingrained in the hi-techculture, not to mention that these companies provided the Internet’s plumbing. Inaddition, industries like hi-tech, where product lifecycles are short and the risks of carrying inventory are high, are likely to migrate to B2B e-commerce fairly
quickly. In addition to industries with short product cycles, we expect companieswith high waste from inventory (suitable for auction markets), high distributioncosts (online catalogs provide a low-cost distribution channel) and commodity-priced products (suited for exchange-oriented market makers) will embrace B2Be-commerce over the next several years. Aerospace and defense, automotive andelectricity are among industries likely to come on board sooner than later. Like inany other paradigm shift, the best companies will move quickly and boldly tomake an opportunity out of an inevitable change. Less progressive companies willmove more slowly and with dire consequences.
Market maker adoption isinevitable

7/21/2019 19606830 Merrill Lynch the B2B Market Maker Book(1)
http://slidepdf.com/reader/full/19606830-merrill-lynch-the-b2b-market-maker-book1 25/88
The B2B Market Maker Book – 3 February 2000
25
Chart 6: B2B Market Forecast – Industry Segmentation
$0
$200
$400
$600
$800
$1,000
$1,200
$1,400
$1,600
B i l l i o n s
1999E 2000E 2001E 2002E 2003E
Telecom
Business Travel
Admin & Support
Professional
Financial
Industrial equipment
Heavy industries
Construction
Aerospace & defense
Pharmaceutical & medical
Consumer goods
Food & agriculture
Shipping & warehousing
Paper & office products
Utilities
Petrochemicals
Motor vehicles
Computing & electronics
Source: Forrester Research
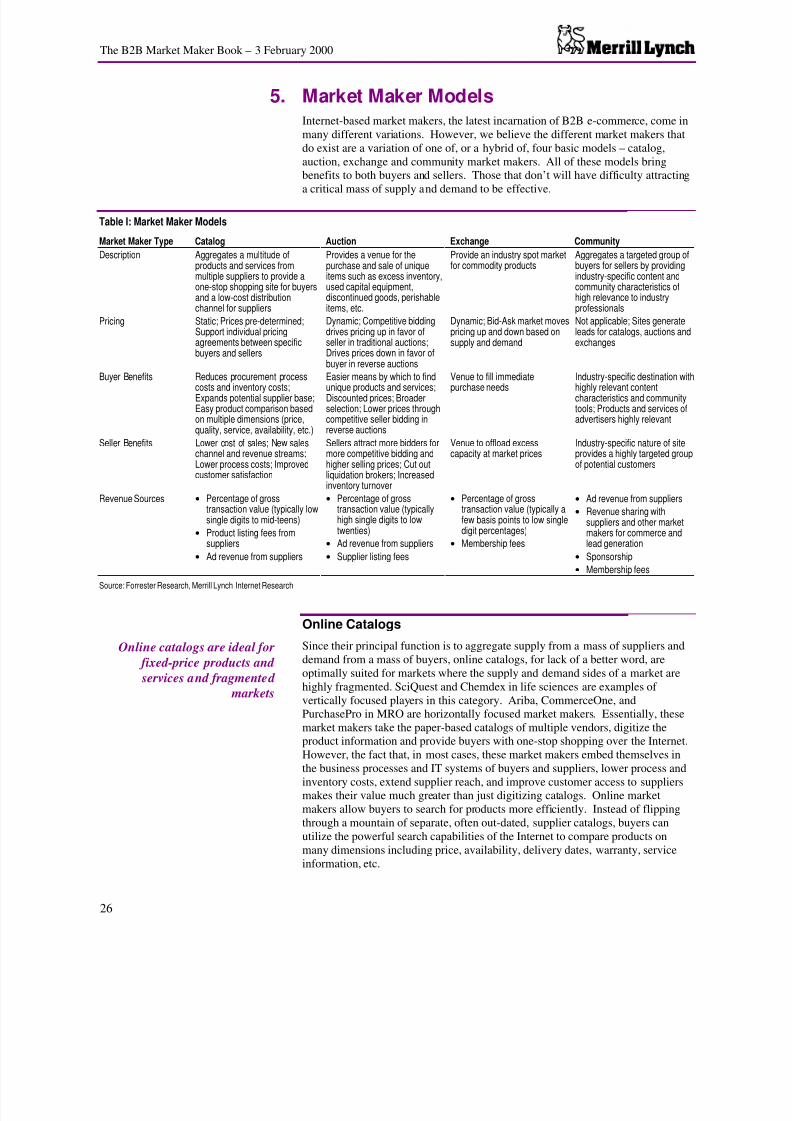
7/21/2019 19606830 Merrill Lynch the B2B Market Maker Book(1)
http://slidepdf.com/reader/full/19606830-merrill-lynch-the-b2b-market-maker-book1 26/88
The B2B Market Maker Book – 3 February 2000
26
5. Market Maker ModelsInternet-based market makers, the latest incarnation of B2B e-commerce, come inmany different variations. However, we believe the different market makers thatdo exist are a variation of one of, or a hybrid of, four basic models – catalog,auction, exchange and community market makers. All of these models bring
benefits to both buyers and sellers. Those that don’t will have difficulty attractinga critical mass of supply and demand to be effective.
Table I: Market Maker Models
Market Maker Type Catalog Auction Exchange CommunityDescription Aggregates a multitude of
products and services frommultiple suppliers to provide aone-stop shopping site for buyersand a low-cost distributionchannel for suppliers
Provides a venue for thepurchase and sale of uniqueitems such as excess inventory,used capital equipment,discontinued goods, perishableitems, etc.
Provide an industry spot marketfor commodity products
Aggregates a targeted group ofbuyers for sellers by providingindustry-specific content andcommunity characteristics ofhigh relevance to industryprofessionals
Pricing Static; Prices pre-determined;Support individual pricingagreements between specificbuyers and sellers
Dynamic; Competitive biddingdrives pricing up in favor ofseller in traditional auctions;Drives prices down in favor ofbuyer in reverse auctions
Dynamic; Bid-Ask market movespricing up and down based onsupply and demand
Not applicable; Sites generateleads for catalogs, auctions andexchanges
Buyer Benefits Reduces procurement processcosts and inventory costs;Expands potential supplier base;Easy product comparison basedon multiple dimensions (price,quality, service, availability, etc.)
Easier means by which to findunique products and services;Discounted prices; Broaderselection; Lower prices throughcompetitive seller bidding inreverse auctions
Venue to fill immediatepurchase needs
Industry-specific destination withhighly relevant contentcharacteristics and communitytools; Products and services ofadvertisers highly relevant
Seller Benefits Lower cost of sales; New saleschannel and revenue streams;Lower process costs; Improvedcustomer satisfaction
Sellers attract more bidders formore competitive bidding andhigher selling prices; Cut outliquidation brokers; Increasedinventory turnover
Venue to offload excesscapacity at market prices
Industry-specific nature of siteprovides a highly targeted groupof potential customers
Revenue Sources • Percentage of grosstransaction value (typically lowsingle digits to mid-teens)
• Product listing fees fromsuppliers
• Ad revenue from suppliers
• Percentage of grosstransaction value (typicallyhigh single digits to lowtwenties)
• Ad revenue from suppliers• Supplier listing fees
• Percentage of grosstransaction value (typically afew basis points to low singledigit percentages)
• Membership fees
• Ad revenue from suppliers• Revenue sharing with
suppliers and other marketmakers for commerce andlead generation
• Sponsorship• Membership fees
Source: Forrester Research, Merrill Lynch Internet Research
Online Catalogs
Since their principal function is to aggregate supply from a mass of suppliers anddemand from a mass of buyers, online catalogs, for lack of a better word, areoptimally suited for markets where the supply and demand sides of a market arehighly fragmented. SciQuest and Chemdex in life sciences are examples of vertically focused players in this category. Ariba, CommerceOne, andPurchasePro in MRO are horizontally focused market makers. Essentially, thesemarket makers take the paper-based catalogs of multiple vendors, digitize theproduct information and provide buyers with one-stop shopping over the Internet.However, the fact that, in most cases, these market makers embed themselves inthe business processes and IT systems of buyers and suppliers, lower process andinventory costs, extend supplier reach, and improve customer access to suppliersmakes their value much greater than just digitizing catalogs. Online marketmakers allow buyers to search for products more efficiently. Instead of flippingthrough a mountain of separate, often out-dated, supplier catalogs, buyers canutilize the powerful search capabilities of the Internet to compare products onmany dimensions including price, availability, delivery dates, warranty, serviceinformation, etc.
Online catalogs are ideal for fixed-price products and services and fragmented
markets

7/21/2019 19606830 Merrill Lynch the B2B Market Maker Book(1)
http://slidepdf.com/reader/full/19606830-merrill-lynch-the-b2b-market-maker-book1 27/88
The B2B Market Maker Book – 3 February 2000
27
The prices of products on these sites are typically fixed. However, these marketmakers need to be capable of customizing the buyer’s view of the site so that it isconsistent with specific buyer-supplier contracted pricing arrangements wherenecessary. Inability to support different pricing arrangements will make theparticipation of many large buyers and suppliers highly unlikely. Online catalogsusually derive revenue from the combination of a percentage of gross transactionvalues, typically in the low single digits to the mid-teens, as well as product listingand advertising fees from suppliers.
Buyer Benefits
Lower procurement process costs and better allocation of human resources are theprincipal benefits to buyers. While the potential for buyers to source from lower-cost suppliers is important, we do not believe it is chief among the benefits onlinecatalogs provide for buyers. We consider improving the procurement process,reducing inventory costs, and providing buyers with the ability to strategicallysource based on many parameters aside from price much more important. Formany organizations, procurement is extremely inefficient. Time is money and thismeans that corporations are paying employees a great deal of money to flipthrough catalogs in order to get information about suppliers and their products.Since the information in these catalogs is not real-time, buyers typically need tophone suppliers to get current information about pricing, availability, delivery andservice, among other important information. Furthermore, the data entry andmanual paperwork inherent in the procurement process often results in humanerror and subsequent rework. Improving the process helps buyers speed up thetime it takes to order and receive goods, allowing them to reduce the amount of inventory they must carry. In general, online catalogs enable purchasingprofessionals to spend more time on value-added, strategic work than currentmanual processes allow. Finally, the Internet shrinks the world – providingbuyers with access to suppliers that otherwise never would have been possible.
Seller Benefits
Brand new revenue streams, lower-cost sales, marketing and distribution, better
order management, and improved customer satisfaction are key benefits forsellers. Due to the costs associated with selling, marketing, and distributing aproduct there is often demand too expensive for a supplier to fulfill. Furthermore,there is often demand that suppliers don’t even know about. Online catalogs allowsuppliers to utilize the ubiquity of the Internet to reach these customers at a lowercost than traditional channels allow. Furthermore, automating manual processessuch as order management also improves efficiency and reduces process costs.The fact that automation allows suppliers to receive and fulfill orders moreaccurately and quickly also improves customer satisfaction and inventory turns.The self-service nature of online catalogs enables customers to get answers toinquiries that would usually require human intervention, enabling suppliers toreallocate human resources to more strategic, value-added functions. Forexample, with the time of sales people freed from providing product informationeasily accessed by customers over the Internet, they can spend less time managingaccounts and more time chasing new business.
Auctions
Auctions provide a venue for the purchase and sale of unique items such assurplus inventory, used capital equipment, discontinued goods, perishable items,or refurbished products. Examples, among many, include FreeMarkets, a reverseauction for manufactured inputs and TradeOut or AsseTrade, auctions for assetprocurement and disposition and excess inventory. In addition, vertically focusedcompanies like PaperExchange, which is predominantly (as its name suggests) amarket maker in pulp and paper, also generates ancillary revenues from theauction of paper-related capital equipment. Unlike with online catalogs, where
Lower process and inventory costs and strategic sourcing are
major benefits for buyers
New revenue streams, lower
costs, and improved customer satisfaction are major benefits for sellers
Great venue for purchase and sale of unique items

7/21/2019 19606830 Merrill Lynch the B2B Market Maker Book(1)
http://slidepdf.com/reader/full/19606830-merrill-lynch-the-b2b-market-maker-book1 28/88
The B2B Market Maker Book – 3 February 2000
28
prices are typically fixed, auction pricing is dynamic. Auctions usually last for apre-determined period of time. In a traditional auction, sellers post an offer to selland buyers bid. The competitive bidding process results in upward pricemovement and, for this reason, we believe the lion’s share of the benefits of traditional auctions accrue to sellers. However, the reverse auction, a format inwhich sellers compete for a buyer’s offer to purchase, results in downward pricemovement. In these auctions, we consider buyers the major beneficiaries.Revenue for online auctioneers is usually derived from the combination of transaction fees ranging from the high single digits to the low twenties as apercentage of gross merchandise value as well as product listing and supplieradvertising fees.
Buyer Benefits
Buyers get easier access to much more product at somewhat bigger discounts thanthrough physical auctions. The sale of surplus inventory, used capital equipmentand the like is extremely inefficient today. Currently, it is typical for a business tounload these types of goods to liquidation brokers at steep discounts who then sellthem at auction or resell them to sources of demand only they know about. Thenumber of items for auction is limited to what the broker tracks down andpurchases. Conceivably, virtual auctions are able to offer much more for sale.With the middleman’s mark-up removed, buyers can purchase goods at steeperdiscounts than in real-world physical auctions. However, due the Internet’s reachwe would expect virtual auctions to attract more potential buyers. As a result, it islikely that buyer savings related to the removal of middlemen will be offset tosome degree by the upward price movement caused by larger bidding populations.Obviously, reverse auctions via the Internet allow buyers to benefit from morecompetitive pricing because they receive offers to sell from a wider range of suppliers.
Seller Benefits
As mentioned, we believe sellers benefit more than buyers when it comes totraditional auctions conducted over the Internet. There are primarily two reasons:1) the reach of the Internet allows the auction to aggregate a critical mass of
buyers and, as such, drive more competitive bidding and higher winning bids and2) online auctions allow sellers (suppliers) to take liquidation brokers, whotypically demand fire-sale prices to buy product, out of the process. Not only doesthe nature of traditional auction pricing favor sellers but the auction market hasmany other characteristics beneficial to suppliers. Suppliers can use auctions totest pricing on new products, manage inventory levels, promote products, take oldproducts out of the market to make way for new product releases and, of course,liquidate excess inventory, capital equipment, and other items. While we believebuyers are the primary beneficiaries of reverse auctions, suppliers do benefitbecause they get the opportunity to sell to buyers they may never have reachedwithout the Internet.
Exchanges
Exchanges provide a spot market for commodities – often with high pricevolatility. They provide a venue for the purchase and sale of commodities likenatural gas, electricity, and telecommunications bandwidth. Altra and Enermetrixin natural gas and electricity and Arbinet in telecommunications are all prominentexamples. These markets are bid/ask and provide real-time pricing. Exchangesallow buyers and sellers to trade anonymously, which is key because not onlymight identifying buyers and sellers damage their competitive position, but itwould likely skew pricing. While market share is important in every marketmaker category, we believe it is of paramount importance for exchanges. This isbecause market share means liquidity. Exchanges without significant liquidity arelikely to fail due to the relatively small transaction fees they extract. However,those exchanges that do attain leading market share should have extremely
Buyers get access to many more products and services than in
physical auctions
Sellers realize higher prices by reaching a larger bidding
population
The new spot markets
7/21/2019 19606830 Merrill Lynch the B2B Market Maker Book(1)
http://slidepdf.com/reader/full/19606830-merrill-lynch-the-b2b-market-maker-book1 29/88
The B2B Market Maker Book – 3 February 2000
29
defensible competitive positions because offering the most liquidity will maketrading on a competitive exchange less than compelling. In addition to providinga venue for immediate buying and selling of commodities, exchanges provide apricing reference for industry players. The primary inefficiency addressed byexchanges is the use of brokers. Almost by definition, commodities are clearlydefined and well understood by all market participants. Brokers add little valuebeyond matching buyers and sellers – a service for which they extract atransaction fee. Online exchanges at least minimize and, arguably, eliminate theneed for brokers in many industries. Exchange revenue typically comes from thecombination of transaction fees as well as membership fees. Transaction feesusually range from a spread of a few basis points to percentage spreads in thelow/mid single digits.
Buyer/Seller Benefits
Assuming the market is liquid, buyers and sellers benefit equally in exchanges.Initially, we expect exchanges to attract industry players – producers, end-usersand members of the extended value chain of a particular industry. These playersare likely to purchase in spot markets based on near-term needs and sell to unloadexcess capacity at market prices. In addition, we would expect futures andderivatives markets to emerge so industry players can hedge risks. Finally, wewould expect financial traders and speculators to emerge that are likely to drivetrading volumes factors larger than the volumes produced by industry participants.
Community Market Makers
Community market makers bring together potential buyers and sellers, in the formof professionals with common interests, through web sites that feature industry-specific content and community aspects. The content and community aspectsthese sites typically provide include industry-specific news, editorials, marketinformation, job listings, chat, message boards, etc. As a result, these communitymarket makers attract a targeted audience of potential buyers for suppliers. Forthe most part, community market makers generate revenue from advertising,sponsorship and membership fees as well as from fees paid by suppliers for leadgeneration. Although in most cases minimal transaction revenue is actuallygenerated on these sites today, we believe this will change over time as thesecommunity market makers either tack transaction-oriented market mechanismsonto their sites or generate revenue by driving traffic to the commerce sites of others. With over fifty sites ranging from pollutiononline.com toadhesivesandsealants.com, VerticalNet is the “poster boy” for community marketmakers. With its recent acquisition of NECX, a market maker in the multi-billiondollar electronics industry, VerticalNet has accelerated its migration to morecommerce-oriented revenue.
Buyer Benefits
The industry focus of these community web sites gives professionals, who,hopefully for their employer’s sake, don’t have time to aimlessly surf the web allday, a destination with content and community aspects of high relevancy to theirprofessions. Within these communities, professionals, a great number of whomare potential buyers, can access editorial content, chat with colleagues and reachsuppliers, among other things.
Buyers and sellers benefit equally
Community market makers will migrate toward transactions
Buyers get highly relevant content and community aspects

7/21/2019 19606830 Merrill Lynch the B2B Market Maker Book(1)
http://slidepdf.com/reader/full/19606830-merrill-lynch-the-b2b-market-maker-book1 30/88
The B2B Market Maker Book – 3 February 2000
30
Seller Benefits
Suppliers benefit from community market makers by gaining access to a highlytargeted audience of potential buyers. Many of the professionals these sites attractare looking to make a purchase – making the sites valuable real estate for suppliersto advertise their offerings. Other site visitors may be on the site simply to takeadvantage of the content and community it offers with no initial intention to buy.However, we believe advertising on these sites is more likely to convert thesevisitors into customers than more broad, less targeted web advertising strategies.
In summary, today, many of the aforementioned market models are separateentities even within specific vertical industries. However, over time we wouldexpect to see some convergence where, for instance the catalog, auction andexchange pricing mechanisms and all the variations thereof, for, let’s say thechemicals industry, take place on one site. Furthermore, as we are already seeingwith VerticalNet, we would expect to see community-based market makersmonetize eyeballs through revenue streams beyond advertising, sponsorship andlead generation fees. In other words, transaction-based revenue.
Sellers get a highly targeted audience
Models will merge

7/21/2019 19606830 Merrill Lynch the B2B Market Maker Book(1)
http://slidepdf.com/reader/full/19606830-merrill-lynch-the-b2b-market-maker-book1 31/88
The B2B Market Maker Book – 3 February 2000
31
6. Horizontal & Vertical MarketsFundamentally, we believe there are two business-to-business markets – verticalmarkets and horizontal markets. Vertical markets are industry-specific. Theinefficiencies market makers address and the requirements required for success ineach of these markets differ significantly. Horizontal market makers are
functional in nature and facilitate the purchase and sale of goods and services usedby a plethora of industries. In the short history of Internet-based B2B e-commerce, hundreds of vertical market makers have already emerged in industriesranging from metals and livestock to printing and chemicals. Similarly, horizontalmarket makers have emerged that support the purchase and sale of goods andservices such as those for maintenance, repair and operations (MRO), benefitsadministration, media buying, and logistics. As business adoption of these newmodels matures we expect a B2B quilt to be woven where horizontal marketmakers become interwoven with vertical ones.
Chart 7: Horizontal & Vertical Markets
P AP E R
S T E E L
C HE MI C AL S
P L A S T I C S
MRO
ENERGY
MANAGEMENT
MEDIABUYING
EXCESSINVENTORY
Source: Merrill Lynch Internet Research
Vertical (Industry) Markets
Vertical market makers serve the commerce needs of buyers and suppliers inspecific industries. Once successful in aggregating a critical mass of buyers andsuppliers and establishing a liquid market, these market makers are likely togenerate solid ad revenue and, more importantly, recurring transaction revenue.Furthermore, once embedded in the systems and business processes of buyers andsuppliers, high switching costs are bound to make participant defection unlikely.
Earlier in this report, we provided a generic description of the four basic marketmaker models – online catalogs, community sites, auctions and exchanges. All of these models exist within vertical markets. However, buyers and suppliers inspecific markets will demand much more than a generic understanding of theirindustries. Transactions are the endgame for market makers. However, the roadto transaction revenue is not an easy one. We believe the most prominentcompetencies market makers must display to generate transaction revenue throughbroad supplier and buyer participation are deep domain knowledge and strongindustry relationships.
Vertical market makers areindustry-specific

7/21/2019 19606830 Merrill Lynch the B2B Market Maker Book(1)
http://slidepdf.com/reader/full/19606830-merrill-lynch-the-b2b-market-maker-book1 32/88
The B2B Market Maker Book – 3 February 2000
32
To attract buyers to their sites, vertical market makers feature industry-specificcontent and community aspects in order to attract buyers. Content often includesindustry news, editorials, job listings and the like. This content, coupled withinteractive features like message boards and chat, engenders a sense of communityamong users and keeps them coming back. Without attracting a critical mass of buyers, it is unlikely that suppliers will participate (and, vice versa).
Attracting suppliers may require more than just a well-visited site. It will likely requirethe convincing, understanding and, at times, prodding of market maker executives andsenior sales people with strong industry relationships. Selling through an intermediaryis typically not a “no-brainer” for suppliers. In fact, in most cases it is a major strategicdecision made at the most senior levels of an organization. In the minds of suppliers,particularly large ones, it often raises concerns about channel conflict, pricedegradation, partner alienation, reduced customer control, employee morale etc.Gaining the participation of suppliers will require that the market makers know theindustry and the players within it. In fact, we consider these relationships supremelyimportant to the success of a market maker.
Obviously, failure to generate meaningful numbers of both buyers and suppliers willresult in meager transaction volumes. Assuming a market maker does attract a criticalmass of buyers and sellers, which is much easier said than done, it will need toaccommodate the specific needs of these participants in terms of pricing, distributionand logistics, quality, service, etc. We’re not talking about books here. The goods andservices traded between businesses, especially where vertical market makers areinvolved, are often mission-critical. Send the wrong tires to an auto manufacturer orsend them late and production could grind to a halt. Needless to say, the cost of failurecould be enormous. As it is, market makers are being adopted cautiously in manyindustries. We expect the value of market makers to win out in the end, butwidespread adoption may take longer in many industries than some expect. Industries,especially those least receptive to the market maker concept at the outset, are not likelyto tolerate mistakes from interlopers trying to improve processes viewed by manyindustry veterans as plenty efficient. It won’t take many mistakes (maybe one) for amarket maker to lose the participation of significant numbers of buyers and sellers.So, while early movement is extremely important. Near flawless early movement is
more important. The only thing worse than moving late is moving early anddisappointing participants. Once disappointed they are unlikely to return. For thereasons mentioned above, and many more, domain knowledge is of paramountimportance to a vertical market maker’s success.
Horizontal (Functional) Markets
Unlike vertical markets, horizontal markets span across multiple industries. Thisis due to the fact that the audiences they address and the goods and servicesbought and sold over them are common to many industries. Horizontal marketmakers provide a venue for transacting goods and services like MRO supplies,logistics services, media buying, outsourced human resources services, temporaryworkers as well as excess inventory and excess capital equipment.
To a great extent the goods and services bought and sold via horizontal marketmakers are standardized in nature. In many horizontal markets, like MRO,logistics can be outsourced to third-party providers like UPS and FedEx. In fact, itis these factors that allow for horizontal market makers to sell to a multitude of various industries. However, this does not mean a “one size fits all” approach willwork. Similar to their vertical brethren, horizontal market makers will have tosupport the specific pricing agreements between customers and suppliers. Manyof the goods and services transacted via horizontal market makers are fairly welldefined and fixed price in nature. Therefore, much of the value horizontal marketmakers provide is in automating workflow and reducing process costs for bothbuyers and suppliers. Defined business rules speed the request and approvalprocess – removing paper and errors from the process and allowing employees tospend more time performing value-added functions.
Domain knowledge and industry relationships are
essential for success
Horizontal market makers serve multiple industries

7/21/2019 19606830 Merrill Lynch the B2B Market Maker Book(1)
http://slidepdf.com/reader/full/19606830-merrill-lynch-the-b2b-market-maker-book1 33/88
The B2B Market Maker Book – 3 February 2000
33
Many horizontal market makers do utilize content and community to attractbuyers. However, we believe this could prove challenging over the long haul.This is due to the fact that although some of the buyers who utilize horizontalmarket makers focus solely on a specific function and identify themselves with it–let’s say media buying – others buy these goods and services in conjunction withindustry-specific functions. These employees may associate themselves with theindustry rather than the function. Targeting this mixed bag of users withmeaningful content and building a sense of community might be tough. Theheterogeneity of horizontal market maker users also may make attractingpremium-priced advertising revenue equally difficult.

7/21/2019 19606830 Merrill Lynch the B2B Market Maker Book(1)
http://slidepdf.com/reader/full/19606830-merrill-lynch-the-b2b-market-maker-book1 34/88
The B2B Market Maker Book – 3 February 2000
34
7. Why We Like B2B Market Makers Huge Market Opportunity. The market for B2B e-commerce is huge. Estimatedby Forrester Research in the U.S. at approximately $43 billion in 1998, B2B e-commerce is projected to grow at a compounded annual rate exceeding 100% andreach over $1.5 trillion by 2003. Including international opportunities, we believe
worldwide B2B electronic commerce could approach $2.5 trillion by 2003. In ourview, the overwhelming majority of this commerce will occur on seller sites, likethose of Grainger, Intel, and FedEx. However, based on our assumption that 15-20% of B2B electronic commerce is transacted through third-party marketplaces,we believe market makers could generate revenue of approximately $400-$500billion by 2003.
From buying and transporting raw materials to moving manufactured products towholesalers, distributors and retailers as well as many other transactions dottedthroughout the supply and demand chains, there are multiple opportunities forB2B market makers to improve the flow of goods and services and extracttransaction fees for the service. In Chart 8, we depict a hypothetical andextremely simple view of a generic value chain. In our view, by definition theonly transactions that don’t fall under the domain of B2B are those between
retailers and consumers. In fact, in most cases where the end buyer is a business,particularly a large one, B2B market makers will own the final transaction.
Chart 8: B2B Market Makers & The Value Chain
Raw Materials Manufacturing Distribution RetailTransportation &Logistics
Transportation &Logistics
Transportation &Logistics
Consumer
Source: Merrill Lynch Internet Research
User Relationships and the Network Effect. With seller-hosted sites like those of FedEx, Cisco or Amazon.com, relationships are one-to-one in nature. Business istransacted between the seller and each individual buyer separately and revenuesgrow linearly. However, B2B market makers are different. They facilitate many-to-many relationships. Each buyer can buy from one or many suppliers and eachsupplier can sell to one or many buyers – with the B2B market maker getting a cutof each transaction. Once B2B market makers achieve a critical mass of buyers andsuppliers – no easy accomplishment and one that few have achieved to date – theyshould benefit from the network effect over time. In other words, leading B2B sites(or networks) should scale significantly as they attract buyers looking for a broadselection of products and suppliers seeking a large audience of potential buyers. Thisdynamic should allow market makers to enjoy exponential revenue growth once acritical mass of market participants and liquidity is achieved.
EBay is probably the best example of the network effect we’ve seen to date inelectronic commerce. EBay is the clear leader in person-to-person auctions in theC2C (consumer-to-consumer) market. In our view, only through the power of thenetwork effect could a company just over four years old and staffed withapproximately 130 employees serve as the transaction platform for grossmerchandise estimated at just under $3 billion for 1999 and enjoy profitability.

7/21/2019 19606830 Merrill Lynch the B2B Market Maker Book(1)
http://slidepdf.com/reader/full/19606830-merrill-lynch-the-b2b-market-maker-book1 35/88
The B2B Market Maker Book – 3 February 2000
35
Chart 9: Seller-Hosted B2B Sites vs. B2B Market Makers
Buyer A
Buyer B
SupplierA
SupplierB
MarketMaker
Seller-HostedSite
Buyer A
Buyer B
Source: Merrill Lynch Internet Research
Participant Acquisition Costs, Which Will Start Out Extremely High, Should Decline Over Time and Allow for Margin Expansion. For B2B market markers,the cost of attracting buyers and suppliers, in particular, will be extremelyexpensive relative to the transactions and revenue they will generate in the earlygoing. Sales cycles are typically long because, in most cases, the decision toparticipate is one made at the highest levels of an organization. B2B marketmakers need to attract a critical mass of buyers and suppliers before revenuetraction will occur. However, as the network effect takes hold and moreparticipants migrate to a market maker, it should take less money and prodding toget suppliers to contribute their products to a growing source of demand andbuyers to shop at a growing source of supply. Exponential revenue growth due to
the network effect, coupled with declining participant acquisition costs should leadto margin expansion for leading market makers.
Barriers to Entry. For market leaders, we believe the barriers to entry forcompetition will be extremely high. Once a market maker gathers a critical massof buyers and suppliers, embeds itself in the business processes and ITinfrastructure of both, and achieves market liquidity, we believe it will be toughfor another market maker to overtake the leader. Furthermore, we believe thatleading vertical (industry-specific) market makers will align themselves withspecialized distribution and logistics players to fulfill the orders taken on their site.We believe the B2B market makers that forge these important relationships willhave a significant leg up toward securing a highly defensible market position.
High Switching Costs for Participants . Aligning with a particular market maker
typically includes systems integration between the participants and theintermediary. Furthermore, market makers, once aligned with, embed themselvesin the business processes of both buyers and suppliers. In all likelihood, both of these factors will make switching to another network prohibitively expensive anddisruptive.
Recurring Revenue . Once market makers embed themselves in the procurementprocesses of buyers, the sales and distribution processes of suppliers, and thesystems of both they should become venues for highly recurring transactions andrevenue.

7/21/2019 19606830 Merrill Lynch the B2B Market Maker Book(1)
http://slidepdf.com/reader/full/19606830-merrill-lynch-the-b2b-market-maker-book1 36/88
The B2B Market Maker Book – 3 February 2000
36
8. Market Maker Beneficiaries and LiquidityRegardless of whether it is an online catalog, auction or exchange the mostimportant, and most challenging, characteristic market makers must attain isliquidity. We believe the benefits of online intermediaries are more evident forcertain participants than for others. As we further explain below, we believe small
suppliers benefit the most from online market makers, followed by small buyersand large buyers. We believe gaining the participation of large suppliers willprove the most challenging for market makers. Since, in our view, large suppliersare the single most important factor in providing liquidity, we consider theirinvolvement the linchpin of a market maker’s success. Below we explain ourthought process and rank marketplace participants according to what we believe isthe relative value proposition offered to each by market makers.
1. Small Suppliers . We believe small supplier participation in online markets ispretty much a “no brainer.” To us, “small” usually means limited resources –this includes sales and distribution. Capacity is not unlimited for distributorsand resellers. They usually limit the products they move to those with thewidest customer appeal and the best profit margins for them. Even if a smallsupplier’s quality and service is “top notch” they usually have neither the
brand name nor the scale to provide a sizable enough discount to induce largedistributors or value-added resellers to push their goods and services. Onlinemarkets provide a low-cost distribution channel through which smallsuppliers can reach small customers formerly too far and expensive to reachand large buyers with whom they could never get an entrée.
2. Small Buyers. This is another online market maker participant we throw inthe “no brainer” category. Online market makers allow small buyers toautomate and reduce the expenses related to the manual procurement process.In addition, more efficient procurement allows small buyers to reduceinventory and related carrying costs. Finally, small buyers now get greatlyexpanded supplier access from the remotely located high-quality supplier theynever would have connected with without the Internet to the large supplier forwhom selling to smaller customers by traditional means was too expensive.
3. Large Buyers. Large buyers buy in volume and, as a result, they are highlysought after by suppliers of all sizes. A great deal of what large buyerspurchase comes from large suppliers that can handle the service, quality andpricing requirements to which big customers are entitled due to their buyingpower. In addition, commerce between large buyers and large suppliers isoften already automated through EDI. Therefore, we don’t believe thebenefits of online market makers are as compelling for large buyers as theyare for their smaller brethren. However, market makers can be beneficial tolarge buyers by introducing them to smaller suppliers to whom they neverwould have had access otherwise. These smaller suppliers often sell high-quality products and offer high-touch service. In addition, they offer largebuyers alternatives on occasions when their large suppliers are constrained interms of product availability or delivery requirements. For large buyers,market makers mean more choices in terms of products, services, andsuppliers. Finally, large organizations have automated procurement tovarying degrees. For the less progressive large buyers, market makers willadd value through automation and reduce procurement processing andinventory carrying costs. For large buyers that have automated theirprocurement processes to a large degree, we believe there are incrementalprocess and inventory cost savings to be realized.
4. Large Suppliers. We believe supplier affinity for online intermediaries willrun inversely to their market share. In other words, the more market share asupplier controls the more work it will take to get it to distribute through anonline market maker, and vice versa. We make a few assumptions here:1) large suppliers are large, in part, because they have relatively broad
Market maker participation is a“no brainer” for small
suppliers…
…and small buyers
Large buyers have nothing to lose
Large suppliers are the toughest nuts to crack

7/21/2019 19606830 Merrill Lynch the B2B Market Maker Book(1)
http://slidepdf.com/reader/full/19606830-merrill-lynch-the-b2b-market-maker-book1 37/88
The B2B Market Maker Book – 3 February 2000
37
customer reach and efficient sales and distribution channels, 2) as leaders intheir industries, we think customers are essentially required to consider thesesuppliers when making a purchase, and 3) due to their strong competitiveposition these suppliers will be reticent to serve as one of the “big draws” fora market maker that carriers competitive offerings. As a result, large supplierslike Cisco and Intel are likely to continue to sell directly through their ownsites.
However, although at times begrudgingly, we believe large suppliers will endup participating in third-party hosted Internet markets for several reasons.First and foremost, customers will demand it. With global competitionincreasing constantly, suppliers differentiate themselves now, more than ever,through customer service. As such, we believe that, long-term, suppliers willrespond to buyer demands that they make their products and servicesavailable via online market makers. Also, once the most progressive largesuppliers in an industry have come on board, laggard suppliers are likely tofall like dominos just to maintain market share. Furthermore, market makerspresent a channel through which smaller suppliers can nibble away at themarket shares of larger players – we don’t expect large suppliers to sit idleand watch this happen. Finally, large suppliers will use online market makers
to gain access to new customers and revenue streams altogether.

7/21/2019 19606830 Merrill Lynch the B2B Market Maker Book(1)
http://slidepdf.com/reader/full/19606830-merrill-lynch-the-b2b-market-maker-book1 38/88
The B2B Market Maker Book – 3 February 2000
38
9. Market Maker Success –Key Industry CriteriaUndoubtedly, a case can be made that market makers can bring efficiency toalmost every conceivable industry. However, we believe there are keycharacteristics that will make certain industries more fertile ground for onlinemarket maker success. The list of industry characteristics we consider importantshould by no means be considered exhaustive. Furthermore, since most of theB2B companies in existence today are very early stage it is impossible to point toa history of wild market maker success, period – never mind varying levels of success from industry to industry. We paint some pretty broad strokes here andadvise investors to assess specific industry characteristics thoroughly for eachmarket maker in which they might consider investing. Caveats aside, we believedeveloping some broad framework, one that will be tweaked as we learn moreabout B2B, to assess the likelihood of market maker success is required to evenbegin considering the merits of particular B2B investment opportunities. The keycharacteristics we would assess or be looking for follow.
A Large Market. By and large, we believe most market makers, if they aresuccessful long-term, will drive revenues by taking a cut of the transactions theyfacilitate. So, to oversimplify things, in general, we would be looking for marketmakers that address very large vertical or horizontal markets. Online marketmakers are about reducing inefficiency. Even if a large market is relativelyefficient, it is likely that, due to its size, inefficiencies within it can support a verysignificant Internet business. The optimal market maker will be one that addressesa very large, inefficient market like paper, steel and plastics. However, be careful.While large, inefficient markets might have the most fat to take out and, therefore,the most profit potential for a market maker long-term, the fact that they haveremained inefficient for so long likely indicates that they are markets extremelyresistant to change. As a result, some of the best market maker opportunitiesmight take longest to come to fruition.
Below, using data from the US Census Bureau, we have ranked what we considermajor business-to-business industries in terms of commerce. We have excludeddata on industries we deem to be almost exclusively retail in nature. The genericcategory, wholesalers, tops the list. This is not surprising given that theseintermediaries are entrenched parts of the supply and distribution chains in somany industries. As one might expect, the list is populated primarily by old,established industries – many with complex supply and demand chains.
The bigger, the better

7/21/2019 19606830 Merrill Lynch the B2B Market Maker Book(1)
http://slidepdf.com/reader/full/19606830-merrill-lynch-the-b2b-market-maker-book1 39/88
The B2B Market Maker Book – 3 February 2000
39
Chart 10: Selected Industries – Size
Business-to-Business Business-to-Business (cont’d) Wholesale trade, durable goods 290,260 2,189,603,850 Monetary authorities-central bank 42 24,581,559Wholesale trade, nondurable goods 162,924 1,865,419,373 Pipeline transportation 2,354 24,428,670Merchant wholesalers, durable goods 240,621 1,214,386,597 Support activities for mining 10,029 20,614,225Merchant wholesalers, nondurable goods 134,534 1,122,841,717 Leather and allied product manufacturing 1,824 10,732,905Professional, scientific, and technical services 621,605 608,627,386 Warehousing and storage 6,471 10,272,024
Transportation equipment manufacturing 13,206 577,916,378 Lessors of intangible assets, except copyrighted works 2,232 7,538,105Computer and electronic product manufacturing 17,240 431,375,762Food manufacturing 26,970 425,282,021 Business-to-Business/Business-to-Consumer (Mix) Chemical manufacturing 13,482 417,690,886 Insurance carriers and related activities 172,010 1,062,365,641Building, developing, general contracting 198,124 391,087,928 Credit intermediation and related activities 166,835 886,819,003Special trade contractors 409,467 340,320,742 Hospitals 6,892 391,786,805Machinery manufacturing 30,580 271,544,523 Utilities 15,558 391,243,209Administrative and support services 260,252 262,463,279 Broadcasting and telecommunications 44,007 367,841,279Fabricated metal product manufacturing 62,684 245,906,101 Ambulatory health care services 454,853 347,752,717Agriculture 1,911,859 196,864,649 Securities intermediation and related activities 58,020 269,342,485Petroleum and coal products manufacturing 2,143 178,945,926 Real estate 222,540 162,824,225Primary Metal Manufacturing 5,298 173,851,670 Religious, grantmaking, civic, professional and similar org 99,125 102,965,794Publishing industries 33,375 172,165,355 Nursing and residential care facilities 57,359 92,833,001Plastics and rubber products manufacturing 16,686 158,967,311 Rental and leasing services 65,099 79,156,509Paper manufacturing 5,925 150,707,499 Personal and laundry services 186,028 58,813,352Truck transportation 103,836 141,883,397 Motion picture and sound recording industries 22,100 49,214,165Heavy construction 42,010 133,904,865 Waste management and remediation services 16,336 40,294,167Electrical equipment, appliance, and component manufacturing 7,108 112,387,785 Support activities for transportation 30,358 40,267,182Repair and maintenance 236,139 108,634,315 Couriers and messengers 10,923 39,676,674Miscellaneous manufacturing 31,433 102,855,358 Air transportation 3,611 21,437,669Printing and related support activities 43,054 98,724,544 Educational services 40,996 20,934,202Beverage and tobacco manufacturing 2,774 96,606,185 Transit and ground passenger transportation 16,006 13,919,480Wood product manufacturing 17,101 88,718,707 Funds, trusts, and other financial vehicles 1,262 11,383,601Nonmetallic mineral product manufacturing 16,404 88,138,388Oil and gas extraction 8,300 87,271,482Apparel manufacturing 17,831 67,742,364Furniture and related product manufacturing 20,694 65,420,573
Textile mills 4,714 60,062,670Information services and data processing services 15,904 52,429,736Mining (except oil and gas) 7,539 50,205,542Textile product mills 7,226 31,947,641Water transportation 1,923 24,915,775
Description EstablishmentsSales, Receipts, orShipments ($1,000)
Sales, Receipts, orShipments ($1,000)Description Establishments
Source: US Census Bureau; Merrill Lynch Internet Research
Buyer and Seller Fragmentation. Theoretically, the more fragmentation, thebetter. In the ideal scenario, an industry would not only be large but feature manysmall buyers purchasing from many small suppliers. As we mentioned earlier, webelieve small suppliers and small buyers benefit the most from online marketmakers. Therefore, in our view, an industry full of “little guys” would be ideallysuited for a market maker. However, we also believe gaining liquidity, the key toa market maker’s success, in such a market may take some time because it willrequire bringing a large number of entities online. We think industries where mostof the commerce is conducted between large buyers and large suppliers might beslowest to adopt market makers. However, we also believe that once a couple of large industry leaders contribute supply that others will have to follow suit.Therefore, once the ball starts rolling, we expect liquidity to follow.
In order to measure industry fragmentation, we have again used US Census data.This time we have sorted the same set of industries used in ranking industrycommerce by the number of establishments in each industry. The census countsindividual establishments as separate locations. Therefore, multiple establishmentsmay be part of a single company. This may overstate fragmentation of buyers andsellers to some degree. That stated, we believe the number of establishments in anindustry probably serves as decent proxy for the fragmentation within it. It is alsoimportant to note that, oftentimes, enterprises with a large number of geographicallydispersed locations often can’t or don’t centralize purchasing, in the case of buyers,
or sales and distribution, in the case of suppliers.
Theoretically, the more fragmented, the better

7/21/2019 19606830 Merrill Lynch the B2B Market Maker Book(1)
http://slidepdf.com/reader/full/19606830-merrill-lynch-the-b2b-market-maker-book1 40/88
The B2B Market Maker Book – 3 February 2000
40
Chart 11: Selected Industries – Fragmentation
Business-to-Business Business-to-Business Agriculture 1,911,859 196,864,649 Pipeline transportation 2,354 24,428,670Professional, scientific, and technical services 621,605 608,627,386 Lessors of intangible assets, except copyrighted works 2,232 7,538,105Special trade contractors 409,467 340,320,742 Petroleum and coal products manufacturing 2,143 178,945,926Wholesale trade, durable goods 290,260 2,189,603,850 Water transportation 1,923 24,915,775Administrative and support services 260,252 262,463,279 Leather and allied product manufacturing 1,824 10,732,905Merchant wholesalers, durable goods 240,621 1,214,386,597 Monetary authorities-central bank 42 24,581,559Repair and maintenance 236,139 108,634,315Building, developing, general contracting 198,124 391,087,928 Business-to-Business/Business-to-Consumer (Mix) Wholesale trade, nondurable goods 162,924 1,865,419,373 Ambulatory health care services 454,853 347,752,717Merchant wholesalers, nondurable goods 134,534 1,122,841,717 Real estate 222,540 162,824,225Truck transportation 103,836 141,883,397 Personal and laundry services 186,028 58,813,352Fabricated metal product manufacturing 62,684 245,906,101 Insurance carriers and related activities 172,010 1,062,365,641Printing and related support activities 43,054 98,724,544 Credit intermediation and related activities 166,835 886,819,003Heavy construction 42,010 133,904,865 Religious, grantmaking, civic, professional and similar org 99,125 102,965,794Publishing industries 33,375 172,165,355 Rental and leasing services 65,099 79,156,509Miscellaneous manufacturing 31,433 102,855,358 Securities intermediation and related activities 58,020 269,342,485Machinery manufacturing 30,580 271,544,523 Nursing and residential care facilities 57,359 92,833,001Food manufacturing 26,970 425,282,021 Broadcasting and telecommunications 44,007 367,841,279Furniture and related product manufacturing 20,694 65,420,573 Educational services 40,996 20,934,202Apparel manufacturing 17,831 67,742,364 Support activities for transportation 30,358 40,267,182Computer and electronic product manufacturing 17,240 431,375,762 Motion picture and sound recording industries 22,100 49,214,165Wood product manufacturing 17,101 88,718,707 Waste management and remediation services 16,336 40,294,167Plastics and rubber products manufacturing 16,686 158,967,311 Transit and ground passenger transportation 16,006 13,919,480Nonmetallic mineral product manufacturing 16,404 88,138,388 Utilities 15,558 391,243,209Information services and data processing services 15,904 52,429,736 Couriers and messengers 10,923 39,676,674Chemical manufacturing 13,482 417,690,886 Hospitals 6,892 391,786,805Transportation equipment manufacturing 13,206 577,916,378 Air transportation 3,611 21,437,669Support activities for mining 10,029 20,614,225 Funds, trusts, and other financial vehicles 1,262 11,383,601Oil and gas extraction 8,300 87,271,482Mining (except oil and gas) 7,539 50,205,542Textile product mills 7,226 31,947,641Electrical equipment, appliance, and component manufacturing 7,108 112,387,785Warehousing and storage 6,471 10,272,024Paper manufacturing 5,925 150,707,499Primary Metal Manufacturing 5,298 173,851,670Textile mills 4,714 60,062,670Beverage and tobacco manufacturing 2,774 96,606,185
Descri ption EstablishmentsSales, Receipts, orShipments ($1,000)Description
Sales, Receipts, orShipments ($1,000)Establishments
Source: US Census Bureau; Merrill Lynch Internet Research
Market Maker Receptivity. In the table below, we rank industries based on acombination of the two aforementioned key characteristics – market size andfragmentation. Nothing scientific here. We multiplied the number rank of anindustry in terms of commerce by its number rank in terms of fragmentation. Wethen ranked these industries by the product of those two numbers. Weacknowledge that the methodology here is extremely conceptual. In addition,many industry characteristics beyond market size and fragmentation will play a partin how quickly an online market maker is adopted (if at all) in a particular industry.
However, in terms of setting a framework for assessing possible industry receptivityof market makers, this methodology might be a decent starting point.
Large Market + Fragmentation= Great Market Maker
Opportunity

7/21/2019 19606830 Merrill Lynch the B2B Market Maker Book(1)
http://slidepdf.com/reader/full/19606830-merrill-lynch-the-b2b-market-maker-book1 41/88
The B2B Market Maker Book – 3 February 2000
41
Chart 12: Selected Industries – Market Maker Receptivity
Business-to-Business Business-to-Business Wholesale trade, durable goods 4 Warehousing and storage 1,386Professional, scientific, and technical services 10 Pipeline transportation 1,482Agriculture 15 Water transportation 1,517
Merchant wholesalers, durable goods 18 Monetary authorities-central bank 1,634Wholesale trade, nondurable goods 18 Lessors of intangible assets, except copyrighted works 1,677Special trade contractors 33 Leather and allied product manufacturing 1,722Merchant wholesalers, nondurable goods 40Administrative and support services 65 Business-to-Business/Business-to-Consumer (Mix) Building, developing, general contracting 80 Insurance carriers and related activities 4Food manufacturin g 144 Ambulatory health care services 6Computer and electronic product manufacturing 147 Credit intermediation and related activities 10Transportation equipment manufacturing 162 Real estate 16Fabricated metal product manufacturing 168 Personal and laundry services 36Repair and maintenance 168 Broadcasting and telecommunications 50Machinery manufacturing 204 Hospitals 54Truck transportation 231 Religious, grantmaking, civic, professional and similar org 54Chemical manufacturing 234 Securities intermediation and related activities 56Publishing industries 270 Utilities 64Heavy construction 308 Rental and leasing services 77Printing and related support activities 338 Nursing and residential care facilities 90Miscellaneous manufacturing 400 Motion picture and sound recording industries 169Plastics and rubber products manufacturing 437 Support activities for transportation 180Primary Metal Manufacturing 595 Waste management and remediation services 196Furniture and related product manufacturing 608 Educational services 198Wood product manufacturing 616 Couriers and messengers 272Apparel manufacturing 620 Transit and ground passenger transportation 285Petroleum and coal products manufacturing 640 Air transportation 323Paper manufacturing 680 Funds, trusts, and other financial vehicles 400Nonmetallic mineral product manufacturing 696Electrical equipment, appliance, and component manufacturi 736Information services and data processing services 850Oil and gas extraction 870Beverage and tobacco manufacturing 999Mining (except oil and gas) 1,050Textile product mills 1,116Support activities for mining 1,120Textile mills 1,188
Descriptionar e a er
Receptivity Descriptionar e a er
Receptivity
Source: US Census Bureau; Merrill Lynch Internet Research (Market Maker Receptivity is calculated by multiplying an industry’s commerce rank by its fragmentation rank. For exan industry ranked #1 in commerce and #1 in fragmentation would produce a Market Maker Receptivity score of 1, and, theoretically, be most receptive to a market maker.)
Fat. We view fat as the non-value-added links in the value chain. In our view,investors, should be wary of the prospects of market makers that lead with purelya disintermediation strategy. While there are middlemen in many value chainsthat add minimal value beyond matching buyers and sellers (brokers in the paperand plastics industries come to mind), many middlemen, such as value-addedresellers and many distributors, are important and irreplaceable links in the valuechain. Market makers that focus on automating processes that are currentlymanual so employees can focus more on the value added functions they performwill probably find themselves in a solid industry position. Those that trumpet agoal of taking food off somebody’s table are likely to feel extremely powerfulindustry forces come to bear on them.
IT Adoption. Generally speaking, we believe industries that have widely adoptedinformation technology will be more receptive to online market makers than those
that have not. First of all, we believe the fact that the technology infrastructure isalready in place for companies within these industries makes utilization of onlinemarket makers an easy transition technology-wise. Second, and probably moreimportantly, we believe IT adoption serves as a rough proxy for an industry’sattitude toward change – particularly change that increases efficiency, which isexactly what market makers are about.
Be wary of market makers with purely a disintermediation
strategy
Industries that adopted IT will be more receptive to
market makers

7/21/2019 19606830 Merrill Lynch the B2B Market Maker Book(1)
http://slidepdf.com/reader/full/19606830-merrill-lynch-the-b2b-market-maker-book1 42/88
The B2B Market Maker Book – 3 February 2000
42
10. Market Maker Success –Key Company CriteriaIn theory, B2B market makers make a great deal of sense. However, in practicethere are many challenges to building a successful B2B business. Presently, thereare hundreds, if not thousands, of market makers in various stages of development.Potential investors need to thoroughly inspect individual market makers and theindustries they address in detail. However, we believe there are some key criteriacommon to most market makers investors should examine when consideringinvestment.
Merrill’s B2B Market Maker Checklist• Management & Domain Expertise• (Near Flawless) Early Movement• Strong Partnerships for Distribution & Logistics• Neutrality• Liquidity• Going Public (if ready) Management & Domain Expertise . Management is probably the single mostimportant factor when evaluating any potential investment. It is of the absolutehighest importance for B2B companies because not only are most of them at veryearly stages of development, but most are trying to delicately nudge their way intoexisting industries, many of which will be less than receptive initially.Particularly in vertical industries like steel, paper, plastics, and chemicals,deciding to distribute product through online market makers is typically made atthe boardroom level. Suppliers need to assess the effects of the decision in termsof potential channel conflict, pricing, distributor and customer relationships, branddilution, employee morale, etc. Successful B2B market makers must havemanagement with the industry knowledge, senior level industry relationships, andcredibility to address these concerns and articulate the benefits of migrating to thisnew market maker paradigm in order to gain industry “buy in.”
(Near Flawless) Early Movement. This is a “land grab” so, similar to B2C, movingearly for B2B market makers is important. Market makers that move first withoutmajor mistakes are likely to build the critical mass of buyers and suppliers that willmake them the default online location for conducting trade in their particular industry.However, more important than moving first, is executing well once you’re moving. If you get your book a day late from Amazon, the world doesn’t end and as long as itdoesn’t happen frequently (which it doesn’t), Amazon’s business is probably not atrisk. AOL and EBay, two dominant Internet companies, have experienced systemoutages during their respective histories. However, we do not expect commercialcustomers to be as tolerant of miscues from market makers.
Many industries are leery about both the role market makers will play and theirability to execute to begin with. One high-profile incident of a market maker site
going down or a major steel or chemical customer’s production line grinding to ahalt because a market maker facilitated a delivery that was late or “off-spec” islikely to prompt a chorus of “I told you so s” from industry. A market maker thatmoves first and makes a major mistake might have been better off not moving atall. Therefore, market makers that move early, not necessarily first, and get itright will probably be much more valuable investments than the first movers thatmake mistakes. Make sure market makers in which you are consideringinvestment have tested their systems and processes sufficiently and that they haverun in beta long enough that the likelihood of major mistakes is minimal. In ourview market makers that know all the demands of taking an order and (especially)fulfilling it and move second are destined for much more success than the firstmover makes a serious mistake. We think the best-positioned companies areclearly those that move first and flawlessly.

7/21/2019 19606830 Merrill Lynch the B2B Market Maker Book(1)
http://slidepdf.com/reader/full/19606830-merrill-lynch-the-b2b-market-maker-book1 43/88
The B2B Market Maker Book – 3 February 2000
43
Strong Partnerships For Distribution & Logistics. Unlike books, CDs, andstereos, UPS doesn’t transport lumber, resin, or hydrochloric acid. This takesspecialized distribution and logistics players. In many industries, leading marketmakers will need to forge relationships with the key distribution and logisticsproviders in their industry. Due to the generic nature of what they transport, UPSor FedEx can typically carry many different types of deliveries for numeroussuppliers/senders in a single truck or plane. Conceivably, this allows UPS orFedEx to more easily maximize the utilization of their fleets. However, due to theexpense of their vehicles (ie, tankers) and the people that man them, and thespecialized nature of what they deliver, scaling up for the incremental supplier thatmay or may not create enough demand to maximize utilization is a risky economicproposition for specialized logistics players. Winning market makers will havelocked in agreements with specialized logistics providers and distributors that cansupport delivery of the products they sell.
Neutrality. Neutrality has quickly become the “First Commandment” of B2Bmarkets. However, neutrality means different things to different people. To us, itmeans ensuring that business is transacted in an equitable manner and that allmarket maker participants are playing by the same clearly defined set of rules.However, market makers must balance neutrality with their #1 goal – achieving
liquidity. In our view, liquidity is the biggest challenge facing every market makerand achieving it is typically contingent upon gaining the participation of largesuppliers. Clearly, a market maker featuring content that favors one or severalsuppliers to the detriment of their competitors is unlikely to gain mass supplierparticipation. In addition, a market maker that gives a disproportionately largeownership stake to one or several large suppliers is likely to alienate otherpotential participants. However, on a case by case basis, we do believe there areways for market makers to induce supplier participation without becoming orappearing biased. For instance, giving major players in a particular industrymoderate, but equally sized ownership stakes in a market maker may help “jumpstart” liquidity. Performance-based warrants that reward suppliers for putting acertain amount of volume through a market maker may also work. Neutrality isimportant, and investors should probably avoid market makers that blatantlyviolate it as this is likely to limit the participation of other industry heavyweightsand, as a result, hamper long-term growth. However, investors also must bewareof market makers so wedded to such a narrow definition of neutrality that theynever gain liquidity.
Liquidity. Before market makers achieve liquidity, the “holy grail” for everymarket maker, they must build a critical mass of buyers and suppliers. Once amarket maker has acquired a critical mass of buyers and suppliers, it will still takesome time to achieve liquidity as these participants, particularly suppliers, arelikely to move cautiously to the paradigm until they have confidence in it, whichwon’t happen overnight. At the point most makers go public, in general, theyhave attracted a significant number of potential buyers (typically through industry-specific content), are working on supplier participation (their biggest challenge),and are quite far from achieving transaction liquidity. In our view, to participatein the significant potential upside of a B2B investment, investors can’t wait forliquidity to be achieved in order to invest, as the horse will be way out of the barnby then. So, investors need to look for the characteristics that are likely to lead toliquidity –management with industry knowledge and expertise that moves early(and close to flawlessly), a critical mass of potential buyers to attract suppliers, atleast a handful of supplier relationships and a bunch more in the pipeline, keydistribution and logistics relationships, and relative neutrality.

7/21/2019 19606830 Merrill Lynch the B2B Market Maker Book(1)
http://slidepdf.com/reader/full/19606830-merrill-lynch-the-b2b-market-maker-book1 44/88
The B2B Market Maker Book – 3 February 2000
44
Going Public First (if ready). This is not to fan the flames of what may becharacterized as a scorching B2B IPO market, but assuming that a market maker isconfident that it can execute against the key metrics investors are looking for, wecontend that going public is a major advantage. Market makers that have limitedor essentially no competition, like PaperExchange in paper, enjoy the luxury of going public when it is optimal and they can get the most value for theircompanies. However, in markets like steel (e-STEEL and MetalSite), chemicals(CheMatch, ChemConnect, and e-Chemicals) and life sciences (Chemdex andSciQuest – both are now public; Chemdex came first), where competition is likelyto become intense very quickly, moving into the public markets first is anadvantage. Aside from the fact that the cost of capital may never be cheaper, theIPO significantly increases the visibility of these companies vs. their privatecompetition and also provides them with highly valued currency to quickly growtheir businesses through acquisition.
We’ve seen it in B2C. Clearly, it was the highly valued stock currencies of Yahoo! and AOL that allowed them to grow and broaden their respectivebusinesses through acquisitions of companies like Broadcast.com and TimeWarner, respectively, and put insurmountable distances between themselves andpotential competitors. In B2B, we’ve already seen Chemdex, which solely
addressed the $36 billion worldwide life sciences market at the time of its IPO,move into the healthcare supplies market through its acquisition of Promedix.VerticalNet, a company whose business to date has been predominantly based onadvertising revenue, intends to generate much more commerce revenue long-term.By recently acquiring NECX, a market maker in the multi-billion dollarelectronics industry VerticalNet was able to accelerate its transition towardcommerce revenue because of its public currency.
7/21/2019 19606830 Merrill Lynch the B2B Market Maker Book(1)
http://slidepdf.com/reader/full/19606830-merrill-lynch-the-b2b-market-maker-book1 45/88
The B2B Market Maker Book – 3 February 2000
45
11. B2B Market Maker Valuation FrameworkAt this early stage, sizing the B2B market and the shareholder value it mightcreate is tough. Frankly, over the next couple of years, valuations are likely to bedriven as much by the grandiose promises of B2B, a scarcity of investmentchoices to meet what we believe is extraordinary investor demand in the sector,
rapid revenue growth (on diminutive numbers), press, hype, sentiment etc. as bythe potential long-term fundamentals of market makers. If history has taught usone thing, it is that most investors are insensitive to valuation when thefundamentals for Internet companies are improving. Given that the sector is sonascent, in general we expect to see improving fundamentals and increasingmarket caps for B2B companies for the foreseeable future. Nonetheless, webelieve it is necessary to set up a framework to at least put valuation in somefundamental perspective. Based on our methodology, we believe it is likely thatB2B market makers could generate total market capitalization betweenapproximately $800 billion and almost $1.5 trillion by 2003. We estimate thepresent value of this total market capitalization between approximately $340billion and $620 billion. (Note: Currently, there are only a handful of publiclytraded market markers. Therefore, most of the potential market capitalization tobe created resides in private companies. As a result, we believe that theextraordinary valuations of some public market makers represent more than their long-term fundamentals – namely, the general excitement surrounding thisseemingly huge opportunity and the scarcity of public ways to play it.)
Our methodology is fairly straightforward. We 1) estimate the total market forB2B electronic commerce, 2) estimate the percentage to be captured by marketmakers, 3) estimate market maker earnings, 4) estimate a multiple to apply tothese earnings, and 5) discount these earnings back at a 35% rate.
As mentioned, we believe worldwide electronic commerce revenue could totalapproximately $2.5 trillion by 2003. However, what we view as more importantthan this total sales figure, is its likely mix between seller sites, like those of Cisco, Dell, Intel, Boeing, Grainger, Federal Express, etc., and the sites of onlinemarket makers – the B2B investment opportunities upon which this report is
focused.Clearly, in order for third-party market makers to create meaningful marketcapitalization, they will have to pick up a greater share of this growing market.The Ciscos, Intels and FedExs of the world should be commended for recognizingrelatively early (read mid 1990s) the value Internet sales could bring to theirbusinesses. However, the fact that they themselves are dominant suppliers in theirrespective industries has made gaining relatively quick revenue traction over theweb easier for them than it has been for market makers. This makes sense to usbecause market makers need to enlist supplier and buyer participation, which takestime, before generating a meaningful volume of transactions. Furthermore,established companies with seller-centric sites have a number of characteristicsthat make generating web-based business relatively easy almost immediately –their own supply or relationships with major suppliers and existing customers aswell as a brand name and marketing resources to attract new customers. Inaddition, these companies already have relationships with the key distribution andlogistics players necessary for fulfilling orders. In other words, these businessesare quick “out of the box” in regard to generating online sales, while marketmakers take longer to ramp.
Valuing B2B market makers is tough at this point
In terms of value created, the mix of revenue between seller-
hosted sites and third-party market makers is probably
more important than the accuracy of the overall forecast
Seller sites will always dominate the mix…

7/21/2019 19606830 Merrill Lynch the B2B Market Maker Book(1)
http://slidepdf.com/reader/full/19606830-merrill-lynch-the-b2b-market-maker-book1 46/88
The B2B Market Maker Book – 3 February 2000
46
Over the coming years, we expect that many market makers will add meaningfulnumbers of buyers and suppliers and establish the key distribution and logisticsrelationships. As a result, we expect them to hit their stride and gain ground interms of the percentage of overall B2B sales they facilitate. We believe that sellerweb sites will dominate the overall mix. However, we believe it is a reasonableassumption that third-party market makers could represent 10-20%, or $248-$496billion of overall online B2B sales by 2003. In addition, we also assumeadvertisers spend $5-$10 billion with market makers at this point in time.Combined we believe the total revenue attributable to online market makers by2003 could range between approximately $400-$500 billion. (In our conservativecase, which we consider less likely, we estimate that only 10% of B2B electroniccommerce revenue, or approximately $250 billion, is transacted through marketmarkers.)
In our conservative case, which we deem least likely, we assume only 10% of online B2B trading, or $248 billion, is captured by third-party market makers.Throwing in $5 billion for advertising, the total revenue attributable to marketmakers would be $253 billion. In this conservative case, we assume an overallnet margin of 3%, generating net income of $8 billion. We use a 50X multiple onthis net income to reflect the fact that, even in 2003, these are likely to remain
high-growth and high return on invested capital businesses for years to come andthey will be assigned premium PE multiples to reflect it. Our conservative caseyields an aggregate B2B market cap of approximately $380 billion, or 1.5X sales.Discounted at 35%, this market capitalization is presently valued at over $150 billion.
In our middle case, we assume market makers garner 15%, or $372 billion, of theonline B2B market. Including $7 billion for advertising, we attribute $380 billionin aggregate revenue to market makers. We also assume economies of scaleresulting from this stronger top-line produce a net margin of 4% and net income of $15 billion. We apply a 55X multiple to these earnings to reflect strongperformance and what is likely to be a great outlook. Market cap generated fromthis case exceeds $830 billion or 2.2X sales. The present value of this market cap,discounted at 35%, is approximately $340 billion.
Following the same methodology, in our bullish scenario, we assume that marketmakers grab 20% of the online B2B market and generate $506 billion in revenue,including $10 billion for advertising revenue. We assume that net margin expandsto 5%. The result is $25 billion in net income. We raise our multiple assumptionto 60X, which generates market cap of approximately $1.5 trillion and a revenuemultiple of 3.0X. Again we discount this market value at 35%. As a result, wearrive at a present value of approximately $620 billion.
…but market makers will gainenough share to create
tremendous value

7/21/2019 19606830 Merrill Lynch the B2B Market Maker Book(1)
http://slidepdf.com/reader/full/19606830-merrill-lynch-the-b2b-market-maker-book1 47/88
The B2B Market Maker Book – 3 February 2000
47
Chart 13: B2B Electronic Commerce Valuation Framework ($ billions)
ConservativeCase
Middle Case Bullish Case
Total B2B Transaction Revenue – 2003E $2,481 $2,481 $2,481
Seller Site Sales 90% 85% 80% Market Maker Sales 10% 15% 20%
Market Maker Transaction Revenue $248 $372 $496Market MakersAdvertising Revenue $5 $7 $10TOTAL Market Maker Revenue $253 $380 $506 CAGR (1998-2003E) 237% 259% 275% US 63% 63% 63% International 38% 38% 38%
Net Margin 3% 4% 5%
Net Income $8 $15 $25
PE Multiple 50x 55x 60xRevenue Mulitple 1.5x 2.2x 3.0xMARKET CAPITALIZATION (2003E) $380 $835 $1,518
PV (Discount Rate = 35%) $154 $339 $617
Source: Merrill Lynch; Forrester Research; Veronis Suhler & Associates
The valuation methodology outlined above is a framework to bring someperspective to where valuations might “normalize” several years out. Obviously,tweaking any of the inputs – overall B2B market size, the percentage of thismarket captured by third-party market makers, margins or multiples – causes thepotential market cap created by the B2B opportunity to swing wildly. In addition,over the near-term (probably the next couple of years, rather than months), therevenue multiples applied to leading B2B companies are likely to remain insubstantial excess of what we use for our valuation framework. Despite strongnear-term growth, for the foreseeable future almost all B2B market makers arelikely to continue to appear small relative to the huge market opportunities theytypically address. We expect investors to ascribe extremely high price-to-salesmultiples to companies for which potential market opportunities look far fromsaturation, upside to revenue estimates remain likely, the waning of hyper-growthany time soon seems remote, and execution is strong.
Framework for potential long- term value creation is an
interesting exercise…
…but it is not what will drive these stocks near-term

7/21/2019 19606830 Merrill Lynch the B2B Market Maker Book(1)
http://slidepdf.com/reader/full/19606830-merrill-lynch-the-b2b-market-maker-book1 48/88
The B2B Market Maker Book – 3 February 2000
48
12. B2B Market Maker Investment PhilosophyAs evidenced by the spectacular public market debuts of B2B companies likeInternet Capital Group, FreeMarkets, Ariba, CommerceOne, Purchase Pro,Chemdex, SciQuest, RoweCom, and VerticalNet, among several others, there issignificant investor demand for public B2B investments. Given the size of the
opportunity, this is not surprising. However, despite the multi-billion dollarmarket caps most public B2B companies enjoy, they are all at extremely earlystages of development. In many ways, public investors are taking on roles oncereserved for venture capitalists. Whether this role should ever be left to publicmarket investors is open to debate. However, in our minds, that debate is strictlyacademic. We believe B2B will create significant value for public marketinvestors. We believe potential investors should be cognizant of some key pointswhen considering B2B investing.• B2B market makers will have a profound effect on many economic sectors,
particularly industrial ones. The steel, paper and plastics industries havebeen doing business in essentially the same, often inefficient, manner formany years. B2B market makers, with no legacy business or relationships toprotect, seek to make businesses out of capturing profit that many large
companies for many different reasons, including potential channel conflict,fixed asset investment, delicate partner relationships, vertical integration, ageneral failure to embrace electronic commerce, or complacency, haveforegone. The established, often stagnant industrial ecosystems into whichthese new B2B market maker organisms look to insert themselves aretypically huge – often hundreds of billions of dollars. Capturing just a smallportion of the value transacted within these industries is likely to createextremely attractive B2B Internet investments.
• Investors are paying up for the promise of B2B. Currently, the publicvaluations of most B2B companies, as well as the private valuations of
many others, look very expensive. Almost every public B2B company sportsa market cap of over $1 billion. Several have multi-billion dollar marketcaps. In addition, it is not uncommon to see premiere, private companies with
hundreds of millions of dollars of private valuation. Undoubtedly, valuationsare driven, in large part, by the fact that many B2B companies address hugeopportunities and will become valuable long-term based on fundamentals.However, we believe there is no question that the valuations of public B2Bstocks and ones likely to come public over the next year are driven, to varyingdegrees, by what seems to be indiscriminate investor demand for anythingB2B. This can be attributed to numerous factors, including the B2B hypecreated by Wall Street, venture capitalists, and the media and the fact thatmany investors are determined to catch, in B2B, the Internet run they mayhave “missed” in B2C. Assuming markets remain robust, we expect to see aplethora of B2B market makers come to the public market – some great, someokay, and some poor. As supply and demand move closer to equilibrium, it isimportant for investors to understand the quality of what they might own and
realize that, over time, there may be nearly 100% downside potential for low-quality B2B equities.• The net result of so many B2B companies coming public is likely to be that
there will be many more losers than winners. Generally speaking, successfulmarket makers will create liquidity in the markets they address by enlistingparticipation from a critical mass of buyers and suppliers. For vertical marketmakers particularly, it is likely that the #1 player in medical equipment,chemicals, or livestock, etc. will dwarf #2 in terms of value.
Why? Market leaders will enjoy the benefits of the network effect. In otherwords, suppliers will align themselves with market makers that provide themaccess to the most buyers and buyers are likely to make purchases throughmarket markers that present them with the largest choice of products and

7/21/2019 19606830 Merrill Lynch the B2B Market Maker Book(1)
http://slidepdf.com/reader/full/19606830-merrill-lynch-the-b2b-market-maker-book1 49/88
The B2B Market Maker Book – 3 February 2000
49
suppliers. As a result, within a specific market, a dominant share of electroniccommerce is likely to be transacted through the leading site and allow the #1player to enjoy the leverage associated with significant scale as well as strongreturns on invested capital. However, in these “winner take most (if not all)”markets, it is questionable whether the next tier of players will scale to a sizethat provides them the leverage to reach profitability. Obviously, we believeinvesting in #1 is optimal, investing in #2 could result in good returns, but ismore risky, and investing in #3, #4, and #5 is likely to be a bad use of capital.(There is likely to be more than a handful of winners among horizontalmarket makers because they sell products and services across many industries– a huge market. It is unlikely that one player can make a sizable enoughearly “land grab” to lock up the market. That said, there will be many moreentrants chasing this market, so while there will be many more winners thanin individual vertical markets, there will also be many more losers. Beware.)
• Investment in successful companies should be extremely rewarding. However, the risk in stocks of companies that fail could be significant.Historically, good internet stocks have looked expensive from the beginningand looked more expensive over time. Although past performance is noguarantee of future results, we recommend that investors stick with the good
quality companies and not let what appear to be expensive valuations “scarethem away. Bad Internet investments have done one of two things – theyhave either started expensive and gotten cheaper or started cheap and gottencheaper. From our experience, the only time investors focus on the valuationof an Internet stock is when fundamentals are deteriorating. Given that B2Bis in its infancy, we would not expect to see sector-wide fundamentaldeterioration for quite some time. If fundamentals are truly deteriorating for aparticular B2B company, the stock should probably be sold immediately.However, if fundamentals are improving and upside to estimates is expectedto continue, the stock is likely to continue to rise regardless of valuation. Wedon’t expect investors to wake up some day soon, come to work, and sell theirbest Internet stocks because they suddenly look expensive. They always look expensive. On the flip side, we would not advise investors to go “bargainhunting” for B2B Internet stocks. They are almost always cheap forfundamental reasons.
• So… market opportunities are large, the companies addressing these opportunities are early-stage, winners are likely to create extraordinary returns, losers could end up close to worthless, and picking winners and losers is tough. Isn’t this type of investing suitable only for venture
capitalists? No, diversified growth investors, sector investors, and speculative investors all need a strategy for B2B. In a vacuum, almost everyB2B market maker is a speculative, high-risk and early-stage investment.B2B investing is arguably the closest thing to venture capital in today’s publicmarkets. So, obviously these investments are not suitable for the risk averse.However, many other investor types of varying risk profiles need to develop astrategy for the sector. Investors that choose to have exposure to the space
need to take different approaches.• Diversified Growth Investors. We have always maintained that
diversified growth investors allocate a small percentage of capital (ie,10%) to pure play Internet investments. We would suggest that thesesame investors earmark a percentage of this overall Internet allocation toa “basket” of B2B market maker stocks. Most B2B market makersaddress huge markets and have great promise. They also still have muchto prove. On a macro level, we are confident that B2B will createsignificant market cap. However, at this early stage, picking theindividual winners is tough. A “basket” approach gives investors the bestchance to realize excellent returns with a couple of success stories in aportfolio of investments in which the majority are major disappointments.

7/21/2019 19606830 Merrill Lynch the B2B Market Maker Book(1)
http://slidepdf.com/reader/full/19606830-merrill-lynch-the-b2b-market-maker-book1 50/88

7/21/2019 19606830 Merrill Lynch the B2B Market Maker Book(1)
http://slidepdf.com/reader/full/19606830-merrill-lynch-the-b2b-market-maker-book1 51/88
The B2B Market Maker Book – 3 February 2000
51
13. Company Profiles
Industry/Market Company Headquarters Ownership PageCross-Industry Internet Capital Group Wayne, PA Public (ICGE, D-2-1-9) 52
MRO/Indirect Goods and Services Procurement/Cross-Industry Ariba Mountain View, CA Public (ARBA, D-2-1-9) 57
Affiliate Marketing LinkShare New York, NY Private 62Automotive, Industrial Products, and Electronics (AIE)Inventory Mangement
NetVendor Atlanta, GA Private 63
Asset/Inventory Management AsseTrade.com Moorestown, NJ Private 64Asset/Inventory Management TradeOut.com Ardsley, NY Private 64Building/Construction BuildNet Research Triangle Park,
NCPrivate 66
Building/Construction BidCom San Francisco, CA Private 66Chemicals ChemConnect San Francisco, CA Private 68Chemicals CheMatch Houston, TX Private 68Chemicals e-Chemicals Ann Arbor, MI Private 69Computer Products pcOrder.com Austin, TX Public (PCOR, Not covered) 70Cross-Industry VerticalNet Horsham, PA Pubilc (VERT, Not covered) 71Credit & Financing eCredit.com Westwood, MA Private 72Energy Altra Energy Technologies Houston, TX Private 73Energy Automated Power Exchange Santa Clara, CA Private 73Energy Enermetrix.com Maynard, MA Private 74Knowledge Resource Management RoweCom Cambridge, PA Public (ROWE, Not Covered) 75Life Sciences/Cross-Industry Chemdex Mountain View, CA Public (CMDX, Not Covered) 76Life Sciences SciQuest Research Triangle Park,
NCPublic (SQST, Not Covered) 77
Livestock eMerge Interactive Sebastian, FL Private 78Metals/Steel e-STEEL New York, NY Private 79Metals/Steel MetalSite Pittsburgh, PA Private 80MRO/Indirect Goods and Services Procurement/Cross-Industry
CommerceOne Walnut Creek, PA Public (CMRC, Not Covered) 81
Pulp & Paper PaperExchange Boston, MA Private 82Reverse Auctions FreeMarkets Pittsburgh, PA Public (FMKT, Not Covered) 83Small Business ONVIA.com Seattle, WA Private 84Small Business SmartAge.com San Francisco, CA Private 84Small Business works.com Austin, TX Private 85Telecommunications Universal Access Chicago, IL Private 86B2B Master List 87

7/21/2019 19606830 Merrill Lynch the B2B Market Maker Book(1)
http://slidepdf.com/reader/full/19606830-merrill-lynch-the-b2b-market-maker-book1 52/8852
Price: $112
Estimates (Dec) 1998A 1999E 2000E
EPS: NM NM NMP/E: NM NM NMEPS Change (YoY): NM NMQ3 EPS (Sep): NM NM
Cash Flow/Share: NA NA NAPrice/Cash Flow: NM NM NM
Dividend Rate: Nil Nil NilDividend Yield: Nil Nil Nil
Opinion & Financial Data
Investment Opinion: D-2-1-9Mkt. Value / Shares Outstanding (mn): $30,912 / 276
Book Value/Share (Mar-1999): N/APrice/Book Ratio: NM
Stock Data
***3 Week Range: $14-$64 1/16Symbol / Exchange: ICGE / OTC
Opt ions: NoneInstitutional Ownership-Spectrum: NA
ML Industry Weightings & Ratings**Strategy; Weighting Rel. to Mkt.:
Income: Underweight (07-Mar-1995)Growth: Overweight (07-Mar-1995)
Income & Growth: Overweight (07-Mar-1995)Capital Appreciation: In Line (28-Jan-1999)
Market Analysis; Technical Rating: Below Average (21-May-1998)
**The views expressed are those of the macro department and do notnecessarily coincide with those of the Fundamental analyst.***Since IPO, 4 August 1999.For full investment opinion definitions, see footnotes.
Investment Highlights:• ICG is a holding company with ownership
positions in 50 partner companies, most of which are focused on Business-to-Business(B2B) e-commerce. In the “land grab” that isB2B, ICG is quickly establishing itself as theleading “land baron.”
• ICG allocates capital to promising B2Bopportunities, then provides partnercompanies with strategic and operationalguidance with the aim of building marketleaders. ICG facilitates strategic relationshipsand shares best practices, advantages notenjoyed by stand-alone B2B start-ups.
• For three reasons, we believe ICG representsan exceptional long-term investmentopportunity: 1) it is focused on B2B, which webelieve will be the next big Internet wave, 2) it
offers a built-in “basket” approach, allowinginvestors to diversify risk, and 3) it effectivelyallows public-market investors to invest atprivate-market prices.
• In the last five years, the total marketcapitalization of pure play B2C companies hasrisen from about $1 billion to $1 trillion. Wethink B2B could ultimately generate evengreater market value. We believe ICGE ispositioned to capture a meaningful percentageof this value.
Henry BlodgetFirst Vice President
(1) 212 [email protected]
Edward McCabeVice President
(1) 212 [email protected]
Internet Capital GroupB2B’s Land Baron ACCUMULATE
Long TermBUY
Merrill Lynch & Co.Global Securities Research & Economics GroupGlobal Fundamental Equity Research Department

7/21/2019 19606830 Merrill Lynch the B2B Market Maker Book(1)
http://slidepdf.com/reader/full/19606830-merrill-lynch-the-b2b-market-maker-book1 53/88
The B2B Market Maker Book – 3 February 2000
53
Summary
As a holding company with ownership positions in 50 business-to-business partnercompanies, we believe Internet Capital Group presents investors with a greatopportunity to play what we believe is the next big Internet wave – B2B e-commerce. According to Forrester Research, domestic B2B e-commerce is
projected to grow from $43 billion in 1998 to $1.5 trillion in 2003, approximately14X the 2003 B2C e-commerce estimate of $108 billion.
Generally speaking, ICG has interests in two types of companies – market makersand infrastructure service providers. Market makers bring together corporatebuyers and sellers of goods, services, and information in a “virtual marketplace.”Infrastructure service providers sell the software, hardware, and services requiredfor businesses to participate in e-commerce.
ICG is a fairly complex company with many moving parts. However, from50,000 feet the company and its strategy look fairly simple. ICG:• identifies or creates companies it believes have the potential to become
market leaders;•
acquires significant ownership interests (ideally, 40%-80%) in thesecompanies and integrates them into its collaborative network;• provides strategic guidance and operational support to its partner companies;
and• promotes collaboration.
ICG’s intention is to own its partner companies long-term and actively providethese companies with strategic guidance and operational support. This long-termoperating focus clearly differentiates ICG from venture capital firms, whichtypically fund and advise a diverse portfolio of businesses with eyes keenlyfocused on a relatively near-term exit strategy.
We advocate that aggressive investors allocate a small percentage of capital (ie,10%) to a basket of high-quality Internet stocks. We would add Internet CapitalGroup to this group of premiere Internet names, and we believe it has severalcharacteristics that make it an especially compelling investment.• ICG is focused on B2B – a much more nascent (read strong growth ahead)
and larger Internet market long-term, in our view, than B2C, access, contentor services.
• ICG, in and of itself, is a basket of investments. All but four of ICG’s 50 B2Bpartner companies are private. Obviously, there is a large amount of risk inprivate-market investing. However, that risk is offset by diversity and bywhat we believe is the potential for a great deal of upside. Not all of ICG’scompanies will be outstanding success stories. In fact, it is likely that somewon’t grow at all – and that’s okay. A few homeruns would likely offsetdozens of strikeouts. ICG’s most significant stake in a publicly held partner
company is its interest in VerticalNet, in which it has invested a total of $14million. A year after the initial investment, ICG’s stake is currently valued atclose to $3 billion. By no means should this type of return be consideredtypical, but it represents the potential value residing in some of ICG’s partnercompanies.
• ICG’s management and Advisory Board are strong. We believe strongmanagement is a prerequisite for investing in early-stage companies. Themembers of ICG’s management team and Advisory Board run the gamut fromformer entrepreneurs venture executives, and former and current seniorexecutives at “blue chip” companies. All in all, it is an impressive group.

7/21/2019 19606830 Merrill Lynch the B2B Market Maker Book(1)
http://slidepdf.com/reader/full/19606830-merrill-lynch-the-b2b-market-maker-book1 54/88
The B2B Market Maker Book – 3 February 2000
54
Market Opportunity
The business-to-business opportunity is large and in its infancy. The value of U.S.online intercompany trade in 1998 was estimated at $43 billion. In 2003, the totalis estimated to grow to $1.5 trillion. That is a compounded annual growth rateexceeding 100%.
We think measuring the B2B market vs. the B2C market helps put things in someperspective. In 1998, the B2C market was estimated at $8 billion. It is expected togrow at a compounded annual growth rate of close to 70% to $108 billion by 2003.That’s nothing to sneeze at…except when you compare it to B2B. As mentioned, in1998 the B2B e-commerce market was estimated at $43 billion – over 5X the $8billion B2C market. If forecasts are accurate (forecasting markets this big is not anexact science; they could be larger or smaller but it is safe to say they will be big), at$1.5 trillion, the U.S. B2B market will be over 14X the size of B2C.
We believe there are several fundamental drivers that will drive B2B e-commercegrowth over the coming years.
Expanded Access to New and Existing Customers and Suppliers. The salesforces of suppliers and the purchasing departments of customers have traditionally
developed and maintained their relationships with each other. We think B2B e-commerce brings important benefits to these relationships for both customers andsuppliers:• B2B reduces the time and cost required to exchange current information
regarding requirements, prices and product availability . Customers get real-time, accurate information whenever they want it and their personnel spendmore time on more value-added functions than phoning, faxing and mailingsuppliers. Also, in addition to suppliers receiving better marks for customersatisfaction, their sales forces spend more time chasing new business asopposed to dealing with account maintenance issues.
• Suppliers get access to new customers altogether . In many markets, demandis fragmented . As such, there is often a base of potential customers too
expensive to reach by traditional means. The Internet represents a newchannel through which to reach new customers. In many cases, suppliers canlimit the involvement of “middlemen” in the selling and distribution processand reduce their costs.
• Buyers get more choices and better pricing . Oftentimes, there are manysuppliers from which a customer could be buying products. However,whether due to a supplier’s or its distributor’s limited geographic coverage orthe time and expense constraints that limit a customer’s ability to investigateall possible options, a customer is limited to certain suppliers and distributors– not always the best ones in terms of quality, service and price.
• Increased Efficiency and Reduced Cost. Traditional businesses can utilizethe Internet to automate internal business processes including manufacturing,finance, sales, and purchasing functions. The Internet can also be used toincrease information flow within an enterprise and outside of it creating a“virtual enterprise” that spans the entire “value chain,” which includescustomers, suppliers, distributors, etc. All in all, the Internet providesbusinesses with the ability to increase operational efficiency by reducing thetime, costs, and resources required to transact business, lowering inventorylevels and procurement costs, and improving responsiveness to customers andsuppliers.

7/21/2019 19606830 Merrill Lynch the B2B Market Maker Book(1)
http://slidepdf.com/reader/full/19606830-merrill-lynch-the-b2b-market-maker-book1 55/88
The B2B Market Maker Book – 3 February 2000
55
Internet Capital Group & Its Strategy
ICG has been operating in the B2B space for over three years. By Internetstandards, particularly B2B, that makes ICG an industry veteran. This relativelylong focus on B2B has provided ICG with the opportunity to observe a multitudeof successes and failures in the space. By no means should this be construed to
mean that management’s investment, strategy and, operating decisions goingforward will be perfect, but, presumably, this experience should help ICG bettersort through the potential winners and losers in B2B. In addition, this focusshould serve as a competitive advantage vs. venture capital firms. Venture capitalfirms typically have a more general focus and, as such, cannot pitch the benefits of a collaborative network or operational support.
ICG’s strategy is straightforward – identify and acquire market leaders; integratethem into the ICG partner company network; improve their strategic direction;provide them with business services in critical areas such as sales and marketing,recruiting, IT, finance and business development; and share best practicesthroughout its network of partner companies. ICG’s management is activelyinvolved in all phases of this strategy. In addition, ICG’s Advisory Boardprovides additional strategic and operational advice. Many members of ICG’s
management team and Advisory Board are relatively new. However, we believethey bring a wealth of applicable and valuable experience to ICG.
Risks
Internet stocks in general, VerticalNet in particular, and the health of the Internet IPO market. If any of these were to break down, ICG would likely losesignificant value. If all three deteriorated simultaneously, which is more likelythan not, the downside could be significant.
Competition. ICG competes with venture capital firms as well as some emergingand existing holding companies focusing more on B2B to acquire ownership inpartner companies. We believe ICG’s ability to offer potential partner companiesoperational support, strategic guidance and a collaborative network should serve
as a significant competitive advantage vs. existing and emerging competition.Potentially, some of ICG’s partner companies could compete with each other.However, we believe that as both steward and significant owner of its partnercompanies ICG is well positioned to cultivate mutually beneficial partnershipswhere, in other cases, competition might have been the only resolution.

7/21/2019 19606830 Merrill Lynch the B2B Market Maker Book(1)
http://slidepdf.com/reader/full/19606830-merrill-lynch-the-b2b-market-maker-book1 56/88
The B2B Market Maker Book – 3 February 2000
56
ICG Valuation ModelPrice Total ICG ICG % Market Value of
Public Companies Company Type 02/03/2000 Shares Ownership Public HoldingsVerticalNet Market Maker $236.00 12.5 35.0% $2,958Breakaway Solutions Infr. Svc. Provider $82.50 7.0 30.0% 576US Interactive Infr. Svc. Provider $56.75 0.5 2.0% 28Ariba Market Maker $174.25 0.7 125
Other Public Holdings 152Total Public Holdings $3,715 (a)
ICG % Discounted Value ofIPO Candidates Company Type Ownership IPO Candidate Holdings
1 CommerX (PlasticsNet.com ) Market Maker 37.0%2 ComputerJobs.com Market Maker 34.0%3 Deja.com Market Maker 27.0%4 eMerge Interactive Market Maker 28.0%5 MetalSite Market Maker 35.0%6 ONVIA.com Market Maker 16.0%7 PaperExchange Market Maker 27.0%8 Universal Access Market Maker 25.0%9 Benchmarking Partners Infr. Svc. Provider 9.0%
10 Comm erceQuest Infr. Svc. Provider 23.0%Total IPO Candidate Holdings $828 (b)
ICG %Emerging Company Holdings Company Type Ownership1 AgProducer Network Market Maker 61.0%2 Animated Im ages Market Maker 35.0%3 Arbinet Market Maker 7.0%4 AsseTrade Market Maker 26.0%5 AutoVia Market Maker 14.0%6 BidCom Market Maker 20.0%7 BuyMedia.com Market Maker 32.0%8 Collabria Market Maker 10.0%9 Courtlink Market Maker 33.0%
10 e-Chem icals Market Maker 34.0%11 eMarket W orld Market Maker 35.0%12 Em ployeeLife.com Market Maker 40.0%13 Internet Com merce System s Market Maker 38.0%14 iParts.com Market Maker 84.0%15 JusticeLink Market Maker 37.0%16 logistics.com Market Maker 0.0%17 NetVendor Systems Market Maker 26.0%
18 PlanSponsor Exchange Market Maker 40.0%19 Purchasing Solutions Market Maker 60.0%20 Residential Delivery Services Market Maker 34.0%21 Starcite! Solutions Market Maker 36.0%22 Usgift.com Market Maker 35.0%23 Blackboard Infr. Svc. Provider 25.0%24 ClearComm erce Infr. Svc. Provider 13.0%25 Context Integration Infr. Svc. Provider 14.0%26 Entegrity Solutions Infr. Svc. Provider 11.0%27 LinkShare Infr. Svc. Provider 29.0%28 PrivaSeek Infr. Svc. Provider 13.0%29 SageMaker Infr. Svc. Provider 25.0%30 ServiceSoft Technologies Infr. Svc. Provider 5.0%31 Sky Alland Marketing Infr. Svc. Provider 26.0%32 Syncra Software Infr. Svc. Provider 29.0%33 traffic.com Infr. Svc. Provider 20.0%34 United Messaging Infr. Svc. Provider 33.0%35 Vitaltone Infr. Svc. Provider 21.0%36 Vivant! Infr. Svc. Provider 18.0%
Total Value of Other Holdings $263 ©
Cash (est.) $1,269 (d)
Subordinated Convertible Note $548 (d)
Total Valuation $5,527
Shares Outstanding 276.2Asset Value $20.01
Price-to-NAV 5.8x
(a) Public holdings marked to market; (b) IPO candidate value assumes a 35% discount rate and 20% post-IPO dilution; All IPO candidates expected to go public within one year; (cEmerging Company holdings valued at cost or last round of financing; (d) Pro-forma for equity and convertible subordinated notes; Ownership stakes presented on a fully diluted basSource: Company Reports and Merrill Lynch Internet Research estimates.

7/21/2019 19606830 Merrill Lynch the B2B Market Maker Book(1)
http://slidepdf.com/reader/full/19606830-merrill-lynch-the-b2b-market-maker-book1 57/8857
Price: $172 5/16
Estimates (Sep) 1999A 2000E 2001E
EPS: d$0.84 d$0.93 d$0.54P/E: NM NM NMEPS Change (YoY): NM NMConsensus EPS: d$0.88 d$0.50 (First Call: 01-Dec-1999)Q1 EPS (Dec): d$0.14 d$0.23
Cash Flow/Share: d$0.20 d$0.24 $0.00Price/Cash Flow: NM NM NM
Dividend Rate: Nil Nil NilDividend Yield: Nil Nil Nil
Opinion & Financial Data
Investment Opinion: D-2-1-9Mkt. Value / Shares Outstanding (mn): $12, 923 / 75
Book Value/Share (Sep-1999): $2.62Price/Book Ratio: 76.5x
ROE 2000E Average: NALT Liability % of Capital: 0.0%
Est. 5 Year EPS Growth: 80.0%
Stock Data
52-Week Range: $240 5/8-$61Symbol / Exchange: ARBA / OTC
Opt ions: NoneInstitutional Ownership-Spectrum: 2.4%
Brokers Covering (First Call): 12
ML Industry Weightings & Ratings**
Strategy; Weighting Rel. to Mkt.:Income: Underweight (07-Mar-1995)Growth: Overweight (07-Mar-1995)
Income & Growth: Overweight (07-Mar-1995)Capital Appreciation: Overweight (28-May-1993)
Market Analysis; Technical Rating: Above Average (30-Aug-1999)
*Intermediate term opinion last changed on 19-Jul-1999.**The views expressed are those of the macro department and do not
necessarily coincide with those of the Fundamental analyst.For full investment opinion definitions, see footnotes.
Fundamental Highlights:• Ariba’s ORMS, ORMX and IBX product lines
and the Ariba Network position Ariba to takefull advantage of the explosive growth in boththe automated procurement and net marketmaker vertical exchange markets.
• The acquisition of Trading Dynamics for $400million in stock enhances Ariba’s net marketmaker offerings by including auction, reverseauction and bid/ask functionality.
• We expect Ariba to grow revenues from $45.4million in FY99 to $91.8 million in FY00(102% YoY): operating margins should dropfrom -37% in FY99 to -42% in FY00 as thecompany invests heavily in infrastructure.
• Key drivers for the next six months includethe development of industry leadingpartnerships and the buildup of the “Network
Effect” as more and more customers andsuppliers sign on to the Ariba Network.
Stock Performance
60
80
100
120
140
160
180
200
220
0.05
0.06
0.07
0.08
0.09
0.10
0.11
0.12
0.13
0.14
0.15
1996 1997 1998 1999
Ariba Incorporated
Rel to S&P Composite Index (500) (Right Scale)
Christopher C. ShilakesFirst Vice President
415-676-3520
Peter GoldmacherAssistant Vice President
415-676-3522
Ariba IncorporatedFoundation Technologies for Net Exchanges ACCUMULATE
Long TermBUYReason for Report: Company Update
Merrill Lynch & Co.Global Securities Research & Economics GroupGlobal Fundamental Equity Research Department

7/21/2019 19606830 Merrill Lynch the B2B Market Maker Book(1)
http://slidepdf.com/reader/full/19606830-merrill-lynch-the-b2b-market-maker-book1 58/88
The B2B Market Maker Book – 3 February 2000
58
Investment Thesis
Ariba has developed one of the first true B2B e-commerce applications to fullyleverage the Internet. Ariba’s first application, Operating Resource ManagementSystem (ORMS), automates procurement of operating resources. Operatingresources consume 33% of a typical corporation’s revenue base, and are the last
bastion of inefficiency in the enterprise, untouched by the huge ERP tide whichswept industry for the last five years.
We estimate Ariba’s current customer base, which includes Chevron, Cisco, FedEx, HP, Merck, Nestle, Philips, US West, Motorola, Charles Schwab and Visa,has well over $180 billion in purchasing power for operating resources. Thisattracts suppliers that want to join the Ariba Supplier Link to provide electroniccatalogs and conduct commerce via the Internet using Ariba technology. Alreadythe company has signed over 40 suppliers since December 1998 to join ASL,including Office Depot, MicroAge, HP, Boise Cascade Office Products,Beyond.com, and Cort Furniture Rental.
Investment highlights include:
1. Ariba is positioned to become the platform of choice for optimizing operatingresource demand and supply chains.
2. Ariba’s leadership in leveraging core e-commerce technologies (cutting-edgeJava deployment, cXML champion, The Ariba Network commerce portal)presents unparalleled competitive advantage.
3. Ariba’s business model combines a proven, profitable enterprise software saleto blue-chip customer base and an expanded revenue opportunity via the e-commerce “network effect.” The Ariba Network leverages the “network effect” to lock-in supplier relationships and lockout competitors.
4. Financial history speaks to solid execution and powerful top line growth trends.
5. Ariba employees are smart, aggressive, and loyal team players and seniormanagement had worked together prior to founding Ariba.
We believe that over the intermediate term, investors should expect a highlyvolatile trading pattern in ARBA, given the premium valuation. As with most e-commerce investments, significant new customer wins, partnerships and revenueupside surprises will be the primary catalysts behind further gains in ARBA.
Ariba ORMS
Ariba’s Operating Resource Management System (ORMS) attacks the “lastbastion of inefficiency” in corporations worldwide:• ERP deployments ignored the operating resource burden pressuring corporate
margins.• Paper clogged and process-heavy procurement of goods and services
supported armies of administrators.• ORMS combines a powerful optimization engine and ubiquitous linkages
between corporate consumers and suppliers with a zero learning curve interface.• Result : Hard dollar savings for efficiently purchased resources and reduced
soft dollar costs involving vendor benchmarking and management as well asprocessing, fulfillment and delivery for both consumer and supplier.
New Products
Ariba ORMX is Ariba’s Application Service Provider (ASP) version of its marketleading ORMS product. This plays exceptionally well in the middle marketswhere companies typically don’t have the money to fund a full IT staff and
7/21/2019 19606830 Merrill Lynch the B2B Market Maker Book(1)
http://slidepdf.com/reader/full/19606830-merrill-lynch-the-b2b-market-maker-book1 59/88
The B2B Market Maker Book – 3 February 2000
59
ongoing product implementation. Ariba ORMX contains all the functionality of the ORMS product thereby bestowing all of the same benefits associated withcentralized purchasing to the middle markets.
The Ariba Internet Business Exchange (IBX) service is geared towards thosesmaller companies that want to leverage the Ariba Network platform withoututilizing the automated workflow associated with the front-end ORMS
application. This new adaptation of the Ariba Network is ideally suited forvertically oriented purchasing communities where Ariba can broker the purchasingof resources from an exchange where a multitude of users can add industryspecific content. These vertical hubs allow users to create an exchange around aspecific industry.
New Technologies
Ariba’s “punch-out” technology is a critical part of its added value in the purchasingworld. Rather than simply displaying a static version of a supplier catalog, Ariba’s“punch out” technology lets buyers link to a supplier’s web site via cXML to takefull advantage of all the functionality the supplier offers while still remaining on theAriba Network. For example, if a company wants to buy a laptop from Dell, using
“punch-out” technology it can go directly to Dell’s web site to configure a PCexactly as desired. When the configuration is completed, because the purchaser isstill on the Ariba web site, it merely submits the order for approval.
The Ariba Network
While ORMS, ORMX and IBX present what appears to be a compellinginvestment opportunity, Ariba is moving to secure a singular, central role inoperating resource procurement with its Ariba Network. The continued rollout of Ariba Network will fully leverage the “network effect”. By using over $140billion in purchasing power aggregated by Ariba customers, Ariba Network willconnect suppliers with these major customers via a “procurement portal”.
AcquisitionsIn November of 1999, Ariba announced its intent to acquire TradingDynamics,Inc. for $400 million in stock in a deal expected to close in January of 2000. Withthis acquisition, Ariba will enhance its product offerings to include value-addedservices like auctions, reverse auctions and a bid/ask exchange for Net MarketMakers. This acquisition enables Ariba to begin to follow through on its strategyof building out its product offerings to become the dominant vendor in thebusiness to business on line purchasing market.
In December, Ariba announced the signing of a definitive agreement to acquire netmarket maker platform vendor TRADEX technologies for $1.86 billion in stock.Ariba’s acquisition of TRADEX complements the Ariba Network strategy byadding similar services and functionality to the emerging net market makersegment of the market. Whereas Ariba’s initial network focus was on the Fortune500 buy side B2B market, TRADEX specializes in platform software for netmarkets including both horizontal and vertically oriented digital marketplaces.TRADEX customers in the horizontal space include American Express, NTT andEDS. Vertically oriented marketplaces include MetalSite and Chemdex.
Ariba’s acquisition of TRADEX and the subsequent creation of the net marketsbusiness unit is in line with Ariba’s stated intent of creating a best of breed globalB2B e-commerce platform. By buying TRADEX, Ariba is getting a jump-start inthe net market maker space which is expected to grow to over 7,500 Net MarketMakers (NMM) by the year 2003. Also, by getting a foothold in the space earlythrough acquisition, Ariba will be able to keep its focus and continue to capitalizeon its first to market lead.

7/21/2019 19606830 Merrill Lynch the B2B Market Maker Book(1)
http://slidepdf.com/reader/full/19606830-merrill-lynch-the-b2b-market-maker-book1 60/88
The B2B Market Maker Book – 3 February 2000
60
Partnerships
In December of 1999, Ariba announced a partnership with American ManagementSystems (AMS) that will serve as a solid introduction for Ariba to the newlycoined G2B (government to business) marketplace. AMS is a $1.3 billion systemsintegrator that generates over 90% of their business through government contracts.
By controlling roughly 50 of the top 80 government agencies, AMS will introduceAriba to approximately half of the $200 billion the federal government is expectedto spend on goods and services next year.
In January of 2000, Ariba announced a definitive agreement with EDS subsidiaryCoNext to provide the software to run managed consortia based B2B net markets.CoNext, a newly formed EDS subsidiary, was created to provide its customers withactively managed joint purchasing, strategic sourcing, auctions and e-procurement.Calling its new service Leveraged Sourcing Networks (LSN), CoNext has targeted12 net markets, approximately $160 billion in managed spending and has alreadysigned customers including Bethlehem Steel, Clorox, Kellogg and Prudential. Moresimply, CoNext is creating 12 net markets and has created a partnership with Aribato resell its e-procurement software and the Ariba Network.
1Q 2000 Highlights
Ariba’s 1Q 2000 (December) results accelerated further from the strong fiscalyear-end close in September. License revenues were well above our projections,at $15.8 million (+227%) and total revenues grew 243% to $23.5 million. Licenseand transaction related revenues grew 61% sequentially off of the strongSeptember quarter close. These numbers were well above our projected $10.4million in license revenue and $18.7 million in total revenue. It appears thattransaction related revenue is ramping much faster than we anticipated, and was60% of license revenue in the quarter. The aggregation of buying power on theAriba Network continued to increase dramatically, up 227% to over $200 billionin operating resource spending alone. Subscription revenues from the AribaNetwork increased by 450% to $3.3 million. Six to eight customer went “live” in
the quarter, bringing the total number to better than 35.Margins benefited from the revenue upside. Gross margins were 700 basis pointsbetter than our model, at 85%. Operating loss narrowed to $7.6 million, versusour forecast $9.2 million operating loss. Ariba has continued to move towardsprofitability ahead of our model.
The balance sheet showed signs of strength as well. The company reported itssecond consecutive quarter of positive operating cash flow, cash balances grew $8million sequentially to $107 million; deferred revenues grew 52% sequentially to$ 46.7 million; and A/R days sales outstanding were 34 days, well below ourexpectations of a move into a 50 to 70 DSO range. Over time, we still expect A/RDSOs to increase to a more traditional level, especially as Ariba’a non-USbusiness increases.
Outlook
Despite a stair-step increase in our model assumptions from a revenue andexpense standpoint (as TRADEX and Trading Dynamics come on line), we stillbelieve our forecasts for Ariba to be conservative. We believe the potentialcatalysts from Net Market Makers and new system integrator partnerships withEDS and AMS and hosting providers like USinternetworking have not yetregistered in the model. Channel partner contribution is still uncertain and Aribais treating it as such, with the current model largely driven by direct sales. Thecompany’s confidence in turning the corner towards profitability by the end of FY01 has increased further, and it appears that investors may see black ink before 4QFY 2001.

7/21/2019 19606830 Merrill Lynch the B2B Market Maker Book(1)
http://slidepdf.com/reader/full/19606830-merrill-lynch-the-b2b-market-maker-book1 61/88
The B2B Market Maker Book – 3 February 2000
61
Ariba Earnings Model (in thousands)
1999 (A) Dec Mar June Sept ’00 2000 (E) Dec Mar June Sept ’01 2001 (E)Full Year 1Q (A) 2Q (E) 3Q (E) 4Q (E) Full Year 1Q (E) 2Q (E) 3Q (E) 4Q (E) Full Year
Licenses 26,768 15,784 18,154 20,605 23,393 77,935 33,146 32,676 38,531 45,616 149,970% of Revenues 59% 67% 63% 61% 59% 62% 68% 63% 62% 61% 63%Network Revenue 6,520 3,274 3,910 5,530 6,690 19,403 6,548 7,429 9,953 12,042 35,972% of Revenues 14% 14% 14% 16% 17% 16% 13% 14% 16% 16% 15%Maintenance & Services 12,084 4,421 6,525 7,493 9,272 27,711 8,842 12,071 13,488 16,690 51,091% of Revenues 27% 19% 23% 22% 24% 22% 18% 23% 22% 22% 22%Total Revenue 45,372 23,479 28,588 33,628 39,355 125,050 48,536 52,176 61,972 74,348 237,033Cost of Revenues 8,813 3,442 6,289 7,398 8,658 25,788 10,678 11,479 13,634 16,357 52,147% of Revenues 19% 15% 22% 22% 22% 21% 22% 22% 22% 22% 22%Gross Profit 36,559 20,037 22,299 26,230 30,697 99,262 37,858 40,697 48,338 57,991 184,885Gross Margin 81% 85% 78% 78% 78% 79% 78% 78% 78% 78% 78%Sales & Marketing 33,859 19,774 25,610 30,265 33,816 109,465 37,965 38,417 40,858 43,962 161,203% of Revenues 75% 84.22% 89.58% 90.00% 85.93% 87.54% 78.22% 73.63% 65.93% 59.13% 68.01%R & D 11,620 4,443 8,436 9,278 9,910 32,067 11,018 10,545 10,672 10,208 42,442% of Revenues 26% 18.92% 29.51% 27.59% 25.18% 25.64% 22.70% 20.21% 17.22% 13.73% 17.91% General & Administrative 7,917 3,421 5,014 5,031 5,647 19,114 6,567 6,016 5,788 6,498 24,869% of Revenues 17% 14.57% 17.54% 14.96% 14.35% 15.28% 13.53% 11.53% 9.34% 8.74% 10.49%Amort. of Stock Bsd Comp 14,584 4,719 3,602 2,530 2,505 13,356 2,360 1,914 1,381 1,365 7,020 Total Operating Exp 53,396 27,638 39,061 44,573 49,373 160,645 55,550 54,978 57,318 60,668 228,514Operating Income (Loss) (16,837) (7,601) (16,762) (18,344) (18,676) (61,383) (17,692) (14,281) (8,980) (2,677) (43,628)
Operating Margin -37% -32% -59% -55% -47% -49% -36% -27% -14% -4% -18%Other Income (Expense) 2219 2059 2080 2100 2121 8360 2143 2164 2186 2208 8700Pretax Income (14,618) (5,542) (14,682) (16,243) (16,555) (53,022) (15,549) (12,117) (6,794) (469) (34,929)Pretax Margin -32% -24% -51% -48% -42% -42% -32% -23% -11% -1% -15%Income Taxes 98 73 77 80 85 315 89 93 98 (159) 120Tax Rate 0 0 0 0 0 0 0 0 0 0 0Net Income (14,716) (5,615) (14,759) (16,324) (16,639) (53,337) (15,638) (12,210) (6,892) (310) (35,049)Net Margin -32% -24% -52% -49% -42% -43% -32% -23% -11% 0% -15%Operating EPS (Basic) (0.42) (0.07) (0.17) (0.15) (0.15) (0.56) (0.14) (0.11) (0.06) (0.00) (0.31) Basic Shares Outstanding 35,032 77,990 85,000 106,000 110,000 94,748 112,000 114,000 116,000 118,000 115,000Yo YLicenses 343% 227% 220% 220% 138% 191% 110% 80% 87% 95% 92%Network Revenue NM 452% 225% 170% 150% 198% 100% 90% 80% 80% 85%Maintenance & Services 420% 209% 150% 120% 100% 129% 100% 85% 80% 80% 84%Total Revenue 443% 243% 201% 183% 130% 176% 107% 83% 84% 89% 90%Cost of Revenues 473% 260% 249% 203% 140% 193% 210% 83% 84% 89% 102%Gross Profit 436% 240% 190% 178% 127% 172% 89% 83% 84% 89% 86%
Sales & Marketing 228% 350% 271% 209% 165% 223% 92% 50% 35% 30% 47%R & D 158% 169% 283% 168% 130% 176% 148% 25% 15% 3% 32% General & Administrative 207% 185% 235% 110% 100% 141% 92% 20% 15% 15% 30% Total Operating Expense 207% 281% 268% 185% 148% 201% 101% 41% 29% 23% 42%Operating Income (Loss) N/M N/M N/M N/M N/M N/M N/M N/M N/M N/M N/MPretax Income N/M N/M N/M N/M N/M N/M N/M N/M N/M N/M N/MNet Income N/M N/M N/M N/M N/M N/M N/M N/M N/M N/M N/MSequentialLicenses N/M 61% 15% 14% 14% N/M 42% (1%) 18% 18% N/MNetwork Revenue N/M 22% 19% 41% 21% N/M (2%) 13% 34% 21% N/MMaintenance & Services N/M (5% ) 48% 15% 24% N/M (5%) 37% 12% 24% N/MTotal Revenue N/M 37% 22% 18% 17% N/M 23% 7% 19% 20% N/MCost of Revenues N/M (5%) 83% 18% 17% N/M 23% 7% 19% 20% N/MGross Profit N/M 48% 11% 18% 17% N/M 23% 7% 19% 20% N/MSales & Marketing N/M 55% 30% 18% 12% N/M 12% 1% 6% 8% N/MR & D N/M 3% 90% 10% 7% N/M 11% (4%) 1% (4% ) N/M General & Administrative N/M 21% 47% 0% 12% N/M 16% (8%) (4% ) 12% N/M Total Operating Expense N/M 39% 41% 14% 11% N/M 13% (1%) 4% 6% N/MOperating Income (Loss) N/M N/M N/M N/M N/M N/M N/M N/M N/M N/M N/MPretax Income N/M N/M N/M N/M N/M N/M N/M N/M N/M N/M N/MNet Income N/M N/M N/M N/M N/M N/M N/M N/M N/M N/M N/MSource: Merrill Lynch

7/21/2019 19606830 Merrill Lynch the B2B Market Maker Book(1)
http://slidepdf.com/reader/full/19606830-merrill-lynch-the-b2b-market-maker-book1 62/88
The B2B Market Maker Book – 3 February 2000
62
LinkShare (Privately held)
Formed in 1996, LinkShare is a leading provider of affiliate marketing programsthat help e-commerce companies sell and market their goods and services throughaffiliated web sites. LinkShare launched the first affiliate network, an onlinemarketplace where merchants and affiliates can forge sales and marketing
partnerships in 1997. The company’s network includes hundreds of thousands of affiliate sites and over 400 leading merchants. LinkShare allows merchants tocreate performance-based marketing partnerships between merchants and affiliateweb sites.
LinkShare is a third-party provider of software and services to create, track, andmanage online marketing partnerships between online merchants and partneringweb sites. Through The LinkShare Network, merchants get access to hundreds of thousands of affiliates, a list that is growing by thousands a week. Merchants postoffers to the network. LinkShare allows merchants to compensate affiliates in anymanner they wish including CPM, impression, click-through, flat fee, percentage-of-sales, monthly minimums, and other structures. Merchants can target affiliatesby site category, geography and other criteria. Merchants can customize theirmarketing efforts by making special offers to specific affiliate groups. Merchantsare charged a fee for use of LinkShare.LinkShare offers affiliates the opportunity to earn revenue from the traffic their sitesgenerate. Affiliates log-on to The LinkShare Network, assess merchant offers, anddecide whether they want to participate in particular programs. Merchants payaffiliates based on the specifics of each particular program. An affiliate might bepaid a percentage of a merchant sale that originated from its site, just for drivingtraffic to a merchant, or simply for putting a merchant link up on its site. LinkSharetracks the activity each affiliate site generates for merchants so affiliates can check on how much merchants owe them. LinkShare is free for affiliates.
Affiliate Marketing

7/21/2019 19606830 Merrill Lynch the B2B Market Maker Book(1)
http://slidepdf.com/reader/full/19606830-merrill-lynch-the-b2b-market-maker-book1 63/88
The B2B Market Maker Book – 3 February 2000
63
NetVendor (Privately held)
Through SurplusBIN.com for surplus inventory and E.MBACE, which allowssuppliers to establish private-labeled trading networks with their distributionpartners, NetVendor provides solutions for customers in the automotive parts,industrial products, and electronics industries.
It is typical for suppliers in the AIE market to have numerous surplus inventoryitems (often in excess of 10,000). There is a lack of infrastructure in these industriesto facilitate efficient distribution of surplus inventory. As a result, companies oftennegotiate the sale of excess inventory through brokers, who typically require deepdiscounts to take items. Inefficiencies of this system include the geographiclimitations of brokers as well as the limits of their buyer contacts. SurplusBIN.comallows participants to communicate, advertise, and post product offeringselectronically, participate in online auctions, and arrange for private inventorypurchase transactions. Currently, NetVendor offers surplus trading communities forspecific vertical markets called PlasticsBIN.com, AutopartsBIN.com, andElectronicsBIN.com. The industry-specific nature of this vertical market strategyallows suppliers to reach a highly relevant audience of potential buyers, whichexpands their reach beyond that currently provided by brokers.
Currently, most transactions between companies and their trading partners areconducted via printed catalogs, telephone, and fax. The internet enablescompanies to automate these manual, paper-intensive, time-consuming, andexpensive processes. The fragmentation of buyers and sellers, importance of information exchange, numerous product offerings, large transaction volumes,among other characteristics, makes the AIE market well suited forE.MBRACE.com. E.MBRACE.com is NetVendor’s software-service platformthat allows suppliers to establish their own private-labeled trading marketplace tosell and distribute inventory to their established trading partners.
NetVendor intends to cross-market SurplusBIN.com and E.MBRACE byleveraging the traffic of SurplusBIN.com to promote E.MBRACE. E.MBRACEfacilitates the transfer of product data from a supplier’s private trading partner
community to the vertical surplus inventory marketplace of SurplusBIN.com.NetVendor generates revenue from transaction fees related to surplus inventorysold through SurplusBIN.com, service and subscription fees from E.MBRACE,and consulting, integration, and customization services.
Automotive, Industrial Products, and Electronics (AIE)
Inventory Management

7/21/2019 19606830 Merrill Lynch the B2B Market Maker Book(1)
http://slidepdf.com/reader/full/19606830-merrill-lynch-the-b2b-market-maker-book1 64/88
The B2B Market Maker Book – 3 February 2000
64
AsseTrade.com (Privately held)
AsseTrade.com, which was formed in 1998 through a joint venture with HenryButcher and Michael Fox International, two of the world’s leading assetevaluation, recovery, disposal, and consulting companies, provides a solution forcorporate asset recovery teams and procurement groups in large industrial and
commercial organizations. AsseTrade provides a complete asset/inventoryrecovery, disposal, and management solution by leveraging the internet as well asthe traditional services provided by Henry Butcher and Michael Fox International.
The recurring supply of surplus assets as well business-wide edicts to reduceinventory and improve return on assets creates a market estimated at more than$350 billion. There are numerous ways for companies to dispose of surplus assets.They include selling them directly to other companies, redeploying them withinorganizations, trade-ins, tax deductible donations, scrap, live auctions, etc.
Currently, asset/inventory recovery, disposal and management is disorganized andinefficient whether it is the transfer of assets within an organization or the auctionof assets to external buyers through liquidation brokers, among many other relatedprocesses. AsseTrade, through the combination of traditional offline services and
the internet, hopes to improve the process. The traditional services provided byAsseTrade include offline auctions and global industrial machinery, equipment,inventory and corporate asset recovery, disposal, marketing, and management.However, AsseTrade has integrated these competencies with internet technology.AsseTrade is more than just an online auction. AsseTrade’s platform allowsclients to manage, sell, trade, purchase, exchange as well as auction corporateassets. AsseTrade’s e-commerce solution is designed to automate ordering,procurement, bid, payment, accounting, shipment, and transaction processing.AsseTrade is customized for individual clients so that they can securely catalog,list, track, and document asset and inventory transactions.
TradeOut.com (Privately held)
Formed in 1998, TradeOut.com is an online marketplace for businesses to buy andsell surplus assets. Generally, these assets fall into three categories: finishedgoods, operating assets, and excess capacity and space. There are a multitude orreasons essentially all companies need to regularly dispose of surplus assets.Surplus finished goods may come in the form of manufacturer overruns, retailoverstocks, or discontinued and obsolete items, among others. Used machinery orstock, office furniture, and manufacturing components are examples of commonsurplus operating assets. Production capacity, shipping capacity, and warehousespace are examples of excess capacity and space that businesses often want todispose of that have value for other companies. The recurring supply of surplusassets as well business-wide edicts to reduce inventory and improve return onassets creates a market estimated at over $350 billion. However, this large marketis currently extremely inefficient.
There are numerous ways for companies to dispose of surplus assets. Theyinclude selling them directly to other companies, redeploying them withinorganizations, trade-ins, tax deductible donations, scrap, live auctions, etc.However, the most common means of surplus asset disposition is liquidation.Liquidators of excess inventory, called jobbers or closeout dealers, buy largequantities of items and resell them to wholesalers or discount stores. Foroperating assets, equipment dealers, buy these surplus assets and resell them toother end users. These liquidation brokers, who typically focus on specificindustries, know the key players (read buyers) within these vertical markets. Theymake their money by extracting “fire sale” prices from sellers and obviouslymarking up the items for resale.
Asset Management
Asset/Inventory Management

7/21/2019 19606830 Merrill Lynch the B2B Market Maker Book(1)
http://slidepdf.com/reader/full/19606830-merrill-lynch-the-b2b-market-maker-book1 65/88
The B2B Market Maker Book – 3 February 2000
65
TradeOut estimates that there are over 10,000 liquidation brokers. However,these liquidators focus on many different industries. It is neither easy nor acorporate seller’s core competency to find a large audience of liquidation brokersin order to stimulate maximum price competition for the surplus assets they aredisposing. Assuming a seller does find a reasonably sized audience of potentialliquidators, the inefficient exchange of information, predominantly phone and fax,used to negotiate the optimal deal is slow, expensive, and time-consuming.Finally, once a deal is done with a particular liquidation broker, there is always therisk that disposition is not executed the way the seller wants. For instance, abroker might not adhere to a seller’s instructions that certain excess inventory beresold internationally to avoid domestic channel conflict.
TradeOut.com brings much needed efficiency to the process. TradeOut.comallows sellers to not only achieve better prices, but also speed up and reduce theexpense of the overall process of surplus asset disposition. Buyers get access tomore supply. In addition, TradeOut speeds up and reduces the cost of the buyingprocess. Obviously, TradeOut significantly improves the exchange of informationbetween buyers and sellers.
7/21/2019 19606830 Merrill Lynch the B2B Market Maker Book(1)
http://slidepdf.com/reader/full/19606830-merrill-lynch-the-b2b-market-maker-book1 66/88
The B2B Market Maker Book – 3 February 2000
66
BuildNet (Privately held)
BuildNet is a business-to-business e-commerce and software company in thehome building industry. BuildNet intends to make commerce in building materialsmore efficient and more profitable. BuildNet ties together the information fromthe key constituencies of the home building process – banks, manufacturers,
distributors, builders, and home buyers.During 1999, BuildNet acquired Beacon Systems, Maxwell & Company, TheFAST Management Group, and Lloyd’s. These are market leading constructionmanagement software systems in the home building industry. Due to theseacquisitions, BuildNet now owns the back-office systems of builders responsiblefor construction of one out of every three residential homes – that’s $74 billion inannual construction. Once system integration is completed, BuildNet plans toleverage its strong position within the back-office of builders to offer electroniccommerce solutions.
Builders using a BuildNet construction management system will be able to connectover the internet to distributors and manufacturers that link their electronic catalogsand inventory systems to BuildNet. Builders will be able to communicate their
future material needs up the supply chain electronically instead of using today’stime-wasting, inaccurate, and expensive modes of communication – phone, fax andmail. Bid requests are sent only to a builder’s specific distributors.
It is estimated that for every $30 million spent on building materials, over 20,000hours are lost to the inefficiencies of phone, fax and mail communicationsbetween builders and distributors. This all results in inflated expenses and delayedproject completion. BuildNet will bring automation to this process – allowinginformation to be exchanged more quickly and accurately, while facilitating real-time inventory, delivery and payment tracking information. Automation clearlyallows builders to reduce procurement process costs. In addition, it accelerates thetime frame in which their material orders are fulfilled – expediting the completionof construction projects. Distributors also reduce the costs related to manual orderprocessing. In addition, they are better able to manage inventory because they can
manage it based more on real-time demand from builders than on their owninternal forecasting methods. With real-time demand information, manufacturerswill also better manage their inventory levels. Similar to builders and distributors,automation will reduce costs related to processes that are now largely manual.
The BuildNet e-commerce solution will become available in select cities in early2000. BuildNet will generate revenue from various sources – licenses,maintenance, and education fees charged to builders related to constructionmanagement systems, fees for hooking suppliers up to the BuildNet network,recurring subscription fees from builders and suppliers for use of the BuildNetnetwork as well as transaction fees. Further out, the company expects to generaterevenue from ancillary sources like mortgage loan origination from its installedbase of builders for home buyers.
BidCom (Privately held)Via the internet, BidCom brings some order to the large and complex constructionindustry. Construction projects typically involve dozens of players includingarchitects, construction companies, sub-contractors, etc. Projects typically lastmonths or even years. From blueprints and contracts to purchase orders, invoices,and permits, documents containing critical information are pervasive throughoutany construction project. Time is money in the construction business andimproving the speed with which construction project participants can exchangeinformation with each other, which is what BidCom facilitates, goes a long waytoward reducing costs. Estimated at $3.2 trillion worldwide, the constructionindustry is huge. It is the world’s biggest industry and largest employer.
Building/Construction
Building/Construction

7/21/2019 19606830 Merrill Lynch the B2B Market Maker Book(1)
http://slidepdf.com/reader/full/19606830-merrill-lynch-the-b2b-market-maker-book1 67/88
The B2B Market Maker Book – 3 February 2000
67
BidCom provides a suite of business-to-business services that help companiesmanage risk and complete projects on time and at reduced costs. BidCom’sservices provide an environment for secure communication, collaboration,commerce, business process management as well as relevant industry content.BidCom’s solution automates the construction industry’s standard businesspractices with Business Process Models (BPMs) that improve the management of the full lifecycle of a construction project from design to completion. BidCom’sservices are sold through a direct sales force on a per-project, per-user basis.

7/21/2019 19606830 Merrill Lynch the B2B Market Maker Book(1)
http://slidepdf.com/reader/full/19606830-merrill-lynch-the-b2b-market-maker-book1 68/88
The B2B Market Maker Book – 3 February 2000
68
ChemConnect (Privately held)
ChemConnect is a chemical and plastics exchange that provides a venue, theWorld Chemical Exchange, for manufactures, buyers, and intermediaries to buyand sell all types of chemicals and plastics products including petrochemicals,polymers, pharmaceuticals, agrochemicals, and research chemicals. Overall, the
chemical market is estimated at $1.6 trillion – it’s huge.The company was founded in 1995. It started as an online supplier directory. In1997, the evolution of ChemConnect continued with the company adding onlinetransactions. Also in 1997, the company added ChemConnect Classifieds, anonline bulletin board where users placed ads to buy and sell chemicals. In Augustof 1999, ChemConnect launched the World Chemical Exchange. The WorldwideExchange has over 3,000 member companies and allows buyers and sellers toconduct business on the “floor” of the exchange or in Private Trading Rooms.
Trading on the World Chemical Exchange is anonymous for both buyers andsellers. Membership is truly global, with only 40% coming from North America.ChemConnect validates and polices membership. In fact, approximately 20% of membership applications are rejected. The exchange offers four different ways to
trade. Buyers can search product offers and place a bid to buy or create a productrequest and receive offers to sell. Sellers can search product requests and placeoffers to sell or create product offers and receive bids to buy. Access to theWorld Chemical Exchange is free for buyers and sellers. Buyers and sellersequally split a transaction fee that ranges from 0.2% to 3% based on the dollarvalue of each transaction.
CheMatch (Privately held)
CheMatch operates an online exchange that allows buyers and sellers of highvolume, bulk commodity petrochemicals to trade anonymously. More than 80users around the world are able view real-time information and conducttransactions on CheMatch’s trading system 24 hours a day and seven days a week.Since its inception in February of 1998, CheMatch has moved more than $100million in products. Some of CheMatch’s products include benzene, mixedxylenes, paraxylene and orthoxylene, toluene, methanol, MTBE, and styrenemonomer.
Overall, the chemical market is estimated at $1.6 trillion – it’s huge. The marketCheMatch currently targets, which is made up of the Top 25 petrochemicals aswell as polymers and plastics, is approximately $400 billion. Not only is themarket large, but it is extremely inefficient as it exists today. Once a decision tobuy or sell bulk chemicals is made, the buyer or seller contacts a multitude of traders, brokers, customers and producers, negotiates with a couple of potentialcounterparties, finalizes terms and confirms the transaction. With the trade agreedupon, the buyer and seller need to take the steps necessary to settle the trade –submit documentation, arrange for providers of transportation and surveying andtesting services, confirm shipping, monitor shipping, and receive physicaldelivery. CheMatch bring great efficiencies to this process. Trades are executedon the CheMatch exchange, transportation, surveying and testing is arranged viaCheMatch and shipment is monitored via the Web.
CheMatch ensures user anonymity, which is extremely important because itcreates market efficiency. Only when a deal is completed are the two partiesrevealed to one another. Anonymity will be of even greater importance in thefuture when the spot market matures and industry and financial participants beginto play in the forwards market that is likely to develop.
Chemicals
Chemicals

7/21/2019 19606830 Merrill Lynch the B2B Market Maker Book(1)
http://slidepdf.com/reader/full/19606830-merrill-lynch-the-b2b-market-maker-book1 69/88
The B2B Market Maker Book – 3 February 2000
69
PetroChemNet, a leading online information resource and communicationsnetwork for the chemical industry, which launched in March of 1997, acquiredCheMatch (and kept the name) in June. The combination marries PetroChemNet’s170+ information products from respected sources within the petroleum andpetrochemical industries with CheMatch’s trading platform. From one desktop,participants will be able monitor pricing real-time, execute trades, monitorbreaking news – news that could effect spot market prices – and communicatewith peers online.
e-Chemicals (Privately held)
Based in Ann Arbor, Michigan and established in 1998, e-Chemicals provides anonline solution for the procurement of industrial chemicals in a market estimatedat $250 billion. e-Chemicals allows users to select a product, get a price, order,and track order status on line. e-Chemicals has partnered with Yellow Freight forlogistics and SunTrust Bank for credit and collections services. e-Chemicals takesorders 24 x 7 x 365
Like in many other industries, the costs associated with buying industrialchemicals are of significant expense. Phoning, faxing, and associated paperwork
result in procurement costs that are estimated to range from $75 to $175 pertransaction. EDI has been adopted over the last decade to help streamline thedemand and supply chains of the industry. However, due to the onerous expensesassociated with EDI, Gartner Group estimates that only 15-20% of a typicalchemical supplier’s trading partners uses it. e-Chemicals hopes to fill the voidEDI has left, particularly among smaller companies. Beyond reducingprocurement cost for buyers and distribution costs for suppliers, e-Chemicalsallows chemical buyers to customize their view of the product and supplieruniverse so that purchasing policies are better adhered to.
e-Chemicals allows buyers to search for products by name (ie, sodium nitrate),manufacturer (ie, DuPont), industry or application (ie, Coatings), product category(ie, acids), or a combination of the aforementioned (ie, DuPont and acids). Userssearch to find a product, enter the quantity desired, obtain price quotes, and order.
Chemicals

7/21/2019 19606830 Merrill Lynch the B2B Market Maker Book(1)
http://slidepdf.com/reader/full/19606830-merrill-lynch-the-b2b-market-maker-book1 70/88
The B2B Market Maker Book – 3 February 2000
70
pcOrder.com (PCOR, $46 ½, Not Rated)
pcOrder.com is a third-party provider of business-to-business solutions thatimprove distribution in the computer industry. pcOrder’s e-commerce solutionincludes sales, marketing, and distribution applications based on technology fromTrilogy, a software applications company. pcOrder’s database of over 700,000
SKUs from over 3,000 manufacturers with detailed product categorization,compatibility, pricing and, availability information make it a robust source of product information.
International Data Corporation estimates that the North American computerproducts market, which includes PCs, servers, workstations, data communicationsequipment, and peripheral products was $129 billion in 1997. IDC expects thismarket to grow to almost $180 billion by 2002. Participants in the computerproduct supply chain include manufacturers, channel participants – includingdistributors, resellers, and systems integrators – and retailers, as well as corporateand consumer end-users. In addition, as a result of the internet, Web-basedshopping service companies that assist end-users in making more informedpurchase decisions have emerged. Moving computer products from manufacturersto end-users can be as simple as the buyer-direct model pioneered and perfectedby Dell or, as is often the case, be fairly complex with products touching the handsof a combination of distributors, integrators, corporate resellers, and retailersbefore reaching end-users.
pcOrder’s solution, eStation, is designed to meet the needs of the majorconstituents of the computer product supply chain including manufacturers,channel participants, media companies, internet shopping services, and bothcorporate and consumer end-users. eStation applications include retail kiosks; e-tail sites for manufacturers, retailers, and resellers; extranets for large corporatecustomers; small and medium business portals that automate relationships betweenretailers, resellers, and manufacturers and small and medium-sized businesses;request for quote (RFQ) technology to facilitate reverse auctions; custom Webstorefronts; automated configuration and ordering for sales reps, and call centerintegration. In addition, pcOrder also offers modules for running productpromotions, cataloging, finance, custom pricing, and configuration.
pcOrder’s goal is to make its platform an industry standard. pcOrder’s customerbase includes manufacturers such as AST, Compaq, Dell, HP, IBM, KingstonTechnology, Nortel Networks, Quantum, SGI; channel participants such asb2bstores.com, beyond.com, CompuCom, CompUSA, EDS, ENTEX, GE CapitalIT Solutions, Ingram Micro, MicroAge, Onsale, and Tech Data; media companiessuch as CMP Media and InfoWorld; and internet shopping services that includeActive Research, Inktomi, and mySimon.
pcOrder generates the majority of its revenue from subscription fees andoccasionally from software license fees. The company also charges services feesfor providing integration, customization, training and web-hosting services.
Computer Products

7/21/2019 19606830 Merrill Lynch the B2B Market Maker Book(1)
http://slidepdf.com/reader/full/19606830-merrill-lynch-the-b2b-market-maker-book1 71/88
The B2B Market Maker Book – 3 February 2000
71
VerticalNet (VERT, $237, Not Rated)
VerticalNet started out simply as Water Online and since 1995 has expanded toover 50 industry-specific vertical trade communities. These trade communitiesspan ten industrial categories that include advanced technologies,communications, environmental, food and packaging, food service/hospitality,
healthcare, science, manufacturing and metals, process, and service.VerticalNet’s communities provide industry-specific content, community aspects,and venues for generating commerce. Content within each of VerticalNet’s tradecommunities includes professional editorials, white papers, software, news,product information, directories, classifieds, job listings, etc. In addition,VerticalNet’s trade communities provide a forum where professionals cancongregate to keep abreast of industry news and events, learn of job opportunities,and exchange ideas. Finally, because these communities attract thousands of visitors who oftentimes are looking to buy or sell some product or service, theyfoster an environment for buyers and sellers to conduct business.
Currently, advertising is VerticalNet’s principal revenue stream. However, it hasalways been VerticalNet’s plan to generate more electronic commerce revenue
longer-term. To this end, VerticalNet offers books, software and other goodsfrom third-party web sites and auction sites with goods posted by inventoryliquidators. VerticalNet’s recent acquisition of NECX Exchange, which closed inDecember, is its most significant move to date in terms of migrating toward amore transaction-oriented model. NECX is an exchange that allows originalequipment manufacturers, contract equipment manufacturers, and distributors tobuy, and sell electronic components. In 1998, NECX had approximately $350million in gross revenue and $37 million in gross profit. NECX has a database of approximately 3 million products from 18,000 suppliers. Forty-five percent of NECX’s users are international, which complements VerticalNet’s internationaluser base of 40%. VerticalNet will integrate NECX with its AdvancedTechnology and Communication industrial sector web sites. We expect to seeVerticalNet expand into new verticals that leverage its significant presence in theelectronic components trading business gained through the NECX acquisition.Furthermore, VerticalNet is likely to extend the online trading technology it isdeveloping around NECX into existing and new communities in areas outside of electronic components where the base technology is applicable.
Cross-Industry

7/21/2019 19606830 Merrill Lynch the B2B Market Maker Book(1)
http://slidepdf.com/reader/full/19606830-merrill-lynch-the-b2b-market-maker-book1 72/88
The B2B Market Maker Book – 3 February 2000
72
eCredit.com (Privately held)
eCredit.com provides both electronic commerce and traditional businesses withreal-time credit, financing and related services. Whether these businesses offercredit and financing themselves or through third-party providers, eCredit.comhelps them improve the speed, quality and risk management of credit and
financing decisions. Through the combination of sophisticated technology and awide range of partners in The Global Financing Network, eCredit.com allows bothelectronic commerce and traditional companies to make credit and financingdecisions on a real-time basis at the point of sale.
The internet increases sales and lowers costs by matching buyers and sellers andfacilitating the exchange of information much more easily and fluidly than iscurrently the case. However, credit decisions, which are key to consummatingtransactions, are, by and large, processed manually and can be a major bottleneck in the overall efficiency facilitated by e-commerce. Once an order or creditapplication arrives from a customer it is typical for a credit analyst to order acredit bureau report, review a potential customer’s payment history, do someanalysis, and make a decision. The manual nature of this process often makesturnaround slow. Slow credit approval increases the risk that a customer may dobusiness with a competitor that can approve credit requests more quickly. Thecurrent credit approval process also leaves data interpretation to the subjectivity of individual credit analysts, limits a company’s ability to implement an enterprise-wide policy for financial risk management, and makes changing enterprise-widecredit policy extremely difficult.
eCredit.com, through The Global Financing Network, connects businesses tofinancing partners and key information sources worldwide. Increasing the speedat which financing is offered to potential buyers significantly enhances a seller’sability to close business. In addition to increasing sales, eCredit.com lowersoperating and information access costs. Counting twenty of the Fortune 500among its customers, the benefits of eCredit.com’s solution has clearly resonatedwith some of the world’s largest companies.
eCredit.com’s services include InfoLink, which is a single source for accessing allmajor credit bureaus and information sources; BusinessVerify, which offers averification check of customer data with bureau data; DecisionDesktop, whichautomates credit analysis tasks including information access, scoring, anddecisioning; InstantDecision, which automates the entire end-to-end trade creditprocess including information access, scoring, decisioning, and documentgeneration; FastFinance, which provides automated connection to multiplefinancing partners and end-to-end process automation, and RapidCollect, acollections management solution that increases collections productivity.
Credit & Financing

7/21/2019 19606830 Merrill Lynch the B2B Market Maker Book(1)
http://slidepdf.com/reader/full/19606830-merrill-lynch-the-b2b-market-maker-book1 73/88
The B2B Market Maker Book – 3 February 2000
73
Altra Energy Technologies (Privately held)
Altra was formed in January of 1996 by combining the back-office managementsystems of PanEnergy (now Duke Energy) and the electronic trading system of Williams. Altra is the leading provider of transaction management software andelectronic commerce solutions for the buying, selling and transportation of energy.
Altra operates a real-time, anonymous exchange, called Altrade, where customerstrade natural gas, crude oil, natural gas liquids, and power online. In addition,Altra offers software solutions that allow users to better schedule and manage theirback-office processes. Altra has over 6,000 users worldwide.
During 1999, Altra has made several major acquisitions. In January, Altraacquired QuickTrade, Altrade’s next biggest competitor, and integrated it into theAltrade electronic trading platform. In March, Altra acquired a leading providerof energy-related commodity trading and risk management software, whichresulted in the formation of Altra’s Risk Management Service Division. In June,Altra acquired TransEnergy Management, a competitor in the market formarketing, transportation, and risk management software.
Altra’s solution not only facilitates a marketplace where energy can be traded, but
also the software required for managing transactions. As such, Altra combineselectronic trading, application software products, and third-party solutions into onesolution. The company has three main product lines: Altra Electronic Trading,Altra Gas Suite, and Altra Power Suite. Altra Electronic Trading links energybuyers and sellers in the wholesale energy market, allowing energy traders to buyand sell natural gas, electricity, and natural gas liquids rapidly over the internet.The marketplace automates a trading process historically executed by phone andfax. In 1998, an estimated $6 billion of energy transactions were executed overAltrade. Altra Gas Suite is specifically designed for the wholesale natural gas andnatural gas liquids market. The suite combines Altrade, the electronic tradingplatform, with software tools that help manage the scheduling and delivery of natural gas and natural gas liquids as well as trading risk. Altra Power Solutionsis specifically designed for the wholesale power (electricity) marketing industry.Power marketers act as brokers between utilities that buy and sell power with eachother. This fast growing market is currently estimated between $60 and $75billion. Altra Power Suite combines electronic trading with software tools formanaging scheduling and delivery as well as trading risk.
Automated Power Exchange (Privately held)
Automated Power Exchange (APX), founded in November of 1996, provides an e-commerce marketplace where buyers and sellers come together to trade electricityand related products. With deregulation, energy transmission and physicalcapacity are becoming commoditized. Automated Power Exchange provides avenue where energy-related commodities can be bought and sold. The traditionalmanual process used to match buyers and sellers in these markets is inefficient.However, APX offers services beyond just matching buyers and sellers, such ascredit management and financial settlement.There are numerous APX participants. They include utilities, energy retailers andaggregators, power marketers, generators, and municipalities. Automated PowerExchange already operates in California with APX California Markets, Ohio withAPX Ohio Hub, and New York with APX New York Markets.. In addition, APXGreen Power Market provides an exchange for the environmentally conscious.Automated Power Exchange intends to open exchanges in Illinois and severalother areas by the end of the year. APX takes a flat fee for every megawatt hourtraded on its exchange.
Deregulated markets give buyers and sellers of electricity more choice in terms of whom they transact business with. APX makes assessing and trading with all of these potential partners much more convenient than doing it manually. The
Energy
Energy
7/21/2019 19606830 Merrill Lynch the B2B Market Maker Book(1)
http://slidepdf.com/reader/full/19606830-merrill-lynch-the-b2b-market-maker-book1 74/88
The B2B Market Maker Book – 3 February 2000
74
conveniences of using Automated Power Exchanges include better pricediscovery, verification of buyer and seller creditworthiness, delivery arrangement,and single party settlement.
Using APX Markets, users can trade 24 hours a day, seven days a week. Tradingcan take place hours, days and weeks ahead of delivery. With APX MarketWindow, a graphical user interface, buyers and sellers can view price information,
market depth, and submit market or limit orders. Transactions are anonymous,which prevents price manipulation.
Through services such as off-peak savings, automatic scheduling, web-basedsettlements and reporting, and credit management, end-users can lower the processcosts related to procuring electricity as well as the prices they actually pay. Theguidance of forward prices coupled with a ready market in which to sell energy,provides generators with a more profitable way to sell output. APX Marketsreduce the costs related to purchasing and reselling energy for aggregators andresellers. The anonymity and liquidity of APX markets allows energy traders toquickly liquidate positions at better prices.
Enermetrix.com (Privately held)
Through its Enermetrix.com Exchange, Enermetrix.com delivers e-commercesolutions that allow energy consumers, suppliers, and utilities in the $320 billionenergy industry to share information, execute competitive energy transactions, andgenerate reports. The company was incorporated in 1995 to deliver e-Commercesolutions to the deregulating energy industry.
Energy costs are usually among the top three to five operating costs for a business.With markets deregulating, energy buyers have choices beyond the incumbentenergy provider in their geography. Enermetrix.com provides a marketplace forthe purchase and sale of energy. For buyers, a staff of Enermetrix.com energyprofessionals helps them analyze their energy costs and consumption data anddefine their energy contract requirements. Energy providers then have theopportunity to compete in auction format to fill a buyer’s energy needs.
Enermetrix.com provides suppliers with a low-cost distribution channel. Marketchannel partners, which include energy service companies (ESCOS), energymarketers, energy distribution companies, government entities, etc., gain a meansto provide commodity services without the expenses or risks related to creatingenergy trading operations. Energy consumers get more reliable and cheaperenergy delivery contracts.
Enermetrix.com currently does business with approximately 50 of the nationslargest energy suppliers including Enron, Duke, and Reliant. Market channelparticipants include service companies like DQE and Unitil. When it comes tocustomers purchasing natural gas and electricity, Enermetrix.com’s Exchangeretention rate is 99%. Its clients include Fortune 500 manufacturers as well aslocal businesses looking to take advantage of the choices presented byderegulation. Customer savings typically range from 10%-20% through the
combination of reduced procurement costs and prices. Enermetrix.com Exchangehas maintained 95% of the energy suppliers that have used the exchange system.The solution enables suppliers to bid on a greater amount of commercial andindustrial contracts at a low-cost. The sales agreement is executed between thesupplier and customer; the customer pays the supplier directly. Bids areconfidential, transactions are real-time, and customers are pre-screened for credit.Enermetrix.com generates revenue in two ways. First, it charges transaction feesfor the electricity or natural gas traded in its marketplace. In addition, it generatesfees for licensing its technology to market channel partners.
Energy

7/21/2019 19606830 Merrill Lynch the B2B Market Maker Book(1)
http://slidepdf.com/reader/full/19606830-merrill-lynch-the-b2b-market-maker-book1 75/88
The B2B Market Maker Book – 3 February 2000
75
RoweCom (ROWE, $34 ½, Not Rated)
RoweCom is the leading business-to-business provider of e-commerce solutionsfor purchasing and managing the acquisition of magazines, newspapers, journals,books and other knowledge resources. In addition to benefiting from the strongexpansion of the overall B2B e-commerce market, RoweCom’s growth is being
driven by the fact that its knowledge resource solution addresses the managementof what is increasingly being recognized in business as among the most critical,but most poorly managed, of assets – information.
The current market RoweCom addresses can be segmented into three parts: (1) itscore market, the market for business magazines, as well as scientific, technical andmedical journals, and other professional publishing; (2) newspapers, consumermagazines and information services; and (3) various other knowledge resources.In aggregate the U.S. market segments RoweCom addresses and future markets ittargets totaled approximately $12o billion in 1997 according to Veronis Suhler &Associates.
RoweCom’s flagship products, the kStore for businesses and the kLibrary foracademic institutions, bring convenience, control and cost savings to knowledge
resource procurement. RoweCom’s kStore is the heart of the RoweCom solutionas the company’s strategy is to do more corporate business than academic goingforward. The kStore is a Web-based “company store” that can either be set up ona customer’s corporate intranet or as a customized internet site. RoweCom offersa large and ever-growing catalog of knowledge resources on the internet from over20,000 publishers, including 240,000 titles from magazines and journals to marketreports and newspapers as well 8 million discounted books through a relationshipwith barnesandnoble.com, as well as various other content.
Since June Rowecom has made three acquisitions – adding a substantial numberof accounts, revenue and content as well as increasing the company’s internationalpresence. These acquisitions were Corporate Subscription Services, InternationalSubscription Agencies and Dawson Information Group. RoweCom has a pendingacquisition of NewsEdge to provide desktop access to real-time news and
information, which should serve as a “hook” to draw users to the site on a moreregular basis. RoweCom intends to link relevant knowledge resources from booksand magazines to courses and consultants to news items so users can furtherexplore information about topics of interest.
Knowledge Resource Management

7/21/2019 19606830 Merrill Lynch the B2B Market Maker Book(1)
http://slidepdf.com/reader/full/19606830-merrill-lynch-the-b2b-market-maker-book1 76/88
The B2B Market Maker Book – 3 February 2000
76
Chemdex (CMDX, $86 ½, Not Rated)
Chemdex Corporation is a leading provider of business-to-business e-commercesolutions for the life sciences industry but has already begun its move into othervertical markets, with its recent Promedix.com acquisition as well as joint ventureswith Tenet Healthcare and Dupont. Founded in 1997, Chemdex’s most mature
business, the one in life sciences, brings together enterprises, researchers, andsuppliers to efficiently buy and sell products over the internet in the ChemdexMarketplace.
Using data from the Laboratory Products Association and Strategic DirectionsInternational, the North American market for scientific products is estimated to beapproximately $12 billion. Worldwide the market is estimated at approximately$36 billion. Annually, approximately 200,000 laboratories worldwide purchasescientific products through thousands of different suppliers for research andtesting activities. The market is fragmented, procurement processes are paper-based, and a great deal of information is exchanged between buyers and sellers.
Chemdex helps solve the classic problems of transacting business in highlyfragmented markets – automating procurement for buyers and improving and
increasing sales and distribution for suppliers.Chemdex’s internet-based procurement system offers enterprises a “wholeproduct” solution combining an online marketplace and procurement capabilitiescustomized to the meet the unique requirements of each customer. Chemdex’s e-Commerce solution gives scientists and researchers access to the ChemdexMarketplace, a one-stop shop that offers hundreds of thousands of products.Features include: contract pricing and customized supplier lists; automatedordering, tracking, shipping, and reordering; summary billing and consolidatedreporting; and ERP integration.
This e-commerce solution is designed to provide purchasing professionals with thedetailed information they find necessary to make purchase decisions, resulting inshorter purchasing cycle times and greater research productivity. In addition, itoffers suppliers a cost-effective way to reach more customers (vs. paper catalogdistribution) and an opportunity to sell more products. Chemdex generates thelion’s share of its revenue through e-commerce transactions. The differencebetween what buyers pay and the discounted amount Chemdex pays suppliers isthe company’s gross margin.
However, Chemdex believes its technology is transferable beyond just the lifesciences market. Along these lines, Chemdex acquired Promedix.com and formed a
joint venture with Tenet healthcare, extending its presence beyond the life sciencesmarket into the $145 billion worldwide healthcare products market; and formedIndustria with DuPont to target the $75 billion worldwide fluids procesing market.
Life Sciences/Cross-Industry

7/21/2019 19606830 Merrill Lynch the B2B Market Maker Book(1)
http://slidepdf.com/reader/full/19606830-merrill-lynch-the-b2b-market-maker-book1 77/88
The B2B Market Maker Book – 3 February 2000
77
SciQuest (SQST, $62, Not Rated)
Similar to Chemdex, SciQuest is a marketplace for scientific and laboratoryproducts in the life sciences industry. The typical users of these products includepharmaceutical, clinical, bio-tech, chemical, industrial, and educationalorganizations. SciQuest’s solution automates the procurement of laboratory
products, a process that is currently manual and extremely inefficient. SciQuestUsing data from the Laboratory Products Association and Strategic DirectionsInternational, the North American market for scientific products is estimated to beapproximately $12 billion. Worldwide the market is estimated at approximately$36 billion. Annually, approximately 200,000 laboratories worldwide purchasescientific products through thousands of different suppliers for research andtesting activities. The market is fragmented, procurement processes are paper-based, and a great deal of information is exchanged between buyers and sellers.
Three groups – scientists, purchasing professionals, and suppliers – are theprimary beneficiaries of SciQuest’s marketplace. Scientists, who oftentimes neednew and different chemicals, supplies, and equipment for research and testing on aproject by project basis now have a central location to search, find compare,
purchase, and manage lab items. Purchasing professionals who typically buy onbehalf of scientists currently prepare purchase orders and track orders manually.SciQuest’s internet-based procurement solution significantly reduces the errorsand costs associated with manual procurement. It also helps keep scientists incompliance with their organization’s purchasing policies. For suppliers, SciQuestprovides a channel through which they can reach brand new customers altogetheror existing customers at lower costs.
SciQuest’s purchasing service gives buyers access to over 300,000 chemicals,supplies, lab equipment, and other products from over 235 suppliers. Buyers areable to search products across multiple suppliers and compare them on numerousattributes. Buyers can purchase from multiple suppliers on one order form, track order status, receive one invoice, and deal with a single point of contact forcustomer service.
Once an order is submitted, SciQuest purchases the items from suppliers at eithera pre-negotiated price or at a discounted price. SciQuest arranges for directshipment from supplier to buyer and does not take possession of products, butdoes take title. While SciQuest does generate advertising revenue, the lion’s shareof its revenue will be generated through e-commerce transactions. The differencebetween what buyers pay and the discounted amount SciQuest pays suppliers isthe company’s gross margin.
Life Sciences

7/21/2019 19606830 Merrill Lynch the B2B Market Maker Book(1)
http://slidepdf.com/reader/full/19606830-merrill-lynch-the-b2b-market-maker-book1 78/88

7/21/2019 19606830 Merrill Lynch the B2B Market Maker Book(1)
http://slidepdf.com/reader/full/19606830-merrill-lynch-the-b2b-market-maker-book1 79/88
The B2B Market Maker Book – 3 February 2000
79
e-STEEL (Privately Held)
e-STEEL, which was founded in 1998, is a market maker in the steel industry. e-STEEL provides a neutral marketplace for buyers and sellers in the $700 billionglobal steel industry. Although the company does feature content relevant to thesteel industry on its site, the endgame for e-STEEL is transaction revenue. Like
most market markers, e-STEEL expands the customer reach of suppliers andimproves buyer access to suppliers. In addition, by automating what historicallyhas been an extremely manual process, e-STEEL reduces transaction costs forboth buyers and sellers. The site already has more then 600 members. e-STEEL.com opened up for transactions in September of 1999. e-STEEL’s focushas not been one of auction, but rather the ability to process transactions in boththe spot and contract market.
The company was primarily financed by a group of well-respected venture capitalgroups led by Bessemer Venture Partners, Greylock and Kleiner Perkins. Thecompany has since included key strategic investors including, MSD Capital (Dell),GE, DuPont, Vulcan (Paul Allen), Mitsui, and Mitsubishi. e-STEEL is continuingto build a solid management team with experts in steel sales as well as add keyemployees from the technology/internet industry.
e-STEEL Exchange allows buyers and sellers of steel products to reach each othermore easily and transact business more efficiently. It enables sellers to createproduct offers and send them to all customers, a specific group of customers, orone customer in particular. The ability to tailor offers for specific customers andblock information from other customers as well as competitors is important toattracting suppliers. On the demand side, e-STEEL Exchange allows buyers tocreate product inquiries and send them to the total universe of e-STEEL suppliers,a subset of them, or one in particular. e-STEEL Exchange enables buyers tosearch through numerous offers and sellers to search through numerous orders toclose transactions more efficiently.
e-STEEL ensures the integrity of users by requiring that potential buyers andsellers pass a rigorous qualification process, which includes a credit check and a
corporate profile.e-STEEL charges no membership or application fees. Although the company willhave several ancillary revenue streams, the “meat and potatoes” of this story willbe transaction fees, which sellers pay. Buyers pay no fees. e-STEEL, whilerecognizing that the US is a key market, has definitively included the global steelindustry in its strategy to become the global portal. Importantly, e-STEEL isfocusing on adding value to the transaction through such avenues as: credit,member profile, logistics, and eventually benefits such as currency hedging(important in longer term orders).
Metals/Steel

7/21/2019 19606830 Merrill Lynch the B2B Market Maker Book(1)
http://slidepdf.com/reader/full/19606830-merrill-lynch-the-b2b-market-maker-book1 80/88
The B2B Market Maker Book – 3 February 2000
80
MetalSite (Privately Held)
Launched in 1998, MetalSite is a marketplace that brings together buyers andsellers in the $700 billion global steel industry. It complements the commerceattributes of its site with community aspects such as industry news and discussiongroups as well as other resources. MetalSite, with a view of being first to the
market, began as an auction site for the investing steel mills, Weirton, LTV, andSteel Dynamics. Weirton, prior to a recent purchase of a good portion of its stakeby ICG, had over 50% ownership, with the others holding about 10%. As well,Bethlehem and Ryerson Tull, two later additions, also hold about a 10% stake inMetalSite. We now estimate Weirton’s stake at 20%. MetalSite’s original saleswere for secondary steel and excess inventory. Since its inception the site hasevolved into incorporating prime material, with a view towards the global markets,as well. Over time, we expect to see MetalSite expand beyond steel into othermetals.
On the supply-side, MetalSite allows steel makers to reach new customers, reducethe cost and increase the efficiency of selling, improve inventory turns, andreallocate the time salespeople currently spend on administrative accountmanagement activities to more revenue-generating activities. Buyers get onecentralized location to view the offerings of multiple suppliers, which eliminatesthe faxing and phoning required today to get information and purchase metals.Obviously, automation wrings costs out of the procurement process for buyers.
To buy on MetalSite buyers review the items for sale by suppliers on the site.Purchases can be made in both a fixed-price and an auction format. Sellers areresponsible for fulfillment and payment. MetalSite if free for buyers. Supplierspay transaction fees. MetalSite also generates revenue by charging developmentand consulting fees for supplier-specific Market Centers within MetalSite. Inaddition, MetalSite generates advertising revenue from suppliers.
Metals/Steel

7/21/2019 19606830 Merrill Lynch the B2B Market Maker Book(1)
http://slidepdf.com/reader/full/19606830-merrill-lynch-the-b2b-market-maker-book1 81/88
The B2B Market Maker Book – 3 February 2000
81
CommerceOne (CMRC, $169, Not Rated)
CommerceOne provides e-commerce solutions that link buyers and suppliers of indirect goods into internet-based trading communities. CommerceOne’sCommerce Chain Solution is designed to automate procurement between multiplebuyers and suppliers.
The procurement processes of corporations for indirect goods like informationtechnology and telecommunications equipment, office equipment and supplies,travel and entertainment, professional services, among other goods and servicesare typically very inefficient. Procurement of these non-strategic, yet essentialitems and services, is typically paper-based and time-consuming, and, therefore,expensive. Various software products designed to automate procurement of indirect goods and services have had limited success due to the fact that they havebeen too buyer-centric and generally neglected the supplier side of the transaction.
The Commerce Chain Solution is comprised of BuySite, MarketSite OpenMarketplace Platform, and MarketSite Commerce Services. BuySite is anintranet-based purchasing application that allows buyers to purchase from catalogsof many different suppliers, while eliminating paperwork, automating workflow
and the approval process, and ensuring employees remain in compliance withcorporate purchasing policies. The MarketSite Open Marketplace Platform is thenexus of the CommerceOne network. It serves as a single point of integration forbuyers and suppliers. It allows suppliers to publish their catalog content once andupdate it easily. Buyers, using BuySite or other third-party procurementapplications, connect to supplier content on the MarketSite Platfrom. Using theMarketSite Platform, commerce service providers can maintain marketplaces forspecific geographies or industries. CommerceOne has established strategicrelationships with British Telecom to host a MarketSite in the U.K., NipponTelegraph and Telephone to host a MarketSite in Japan, and SingaporeTelecommunications to host a MarketSite in Southeast Asia. Among otherindustry-specific relationships, CommerceOne recently announced a high-profileagreement with GM to create GM MarketSite, where GM, its suppliers, anddealers will be able to buy and sell products and services in fixed price catalog,bid-ask exchange, and auction formats.
MRO/Indirect Goods and Services Procurement/Cross-
Industry

7/21/2019 19606830 Merrill Lynch the B2B Market Maker Book(1)
http://slidepdf.com/reader/full/19606830-merrill-lynch-the-b2b-market-maker-book1 82/88
The B2B Market Maker Book – 3 February 2000
82
PaperExchange.com (Privately Held)
PaperExchange is a market maker in the pulp and paper industry. The pulp, paper,and packaging industry is over $100 billion domestically and over $300 billionworldwide. Through Trading Floor, its online marketplace, PaperExchangeenables buyers and sellers to negotiate pricing and transact with each other.
PaperExchange facilitates the trade of many product “grades” includingcontainerboard (liner and medium used to make uncoated corrugated boxes),paperboard (used to make boxes and cartons), newsprint (for newspapers), finepaper (used to make writing, printing, and publishing papers), and tissue (used tomake napkins and paper towels).
Given some of its characteristics, the pulp and paper industry seems well suitedfor a market maker like Paper Exchange. First of all, paper is a commoditydefined by mathematical metrics so it is clearly understood by buyers and sellers.At $300 billion globally, the market is extremely large. Brokers, who extract a feefor not much more than matching buyers and sellers, are pervasive. Finally, thefinancial performance of the paper industry, which is extremely capital intensive,has been subpar for quite some time.
PaperExchange is completely free for buyers. Sellers are not chargedsubscription, membership, or listing fees. PaperExchange makes it money bycharging sellers a commission for transactions conducted on its site.PaperExchange’s Trading Floor is private, secure, and anonymous.PaperExchange also offers value-added services for credit and logistics. Inaddition, PaperExchange facilitates the purchase and sale of paper industryequipment. The site also features industry-specific content including industrynews, events, job listings, and a resource directory.
PaperExchange’s predecessor company was founded in 1996. The initial site waslaunched and the company did its first transaction in 1997. In 1999,PaperExchange significantly beefed up management and quadrupled its staff toapproximately fifty. Also in 1999, the company revamped its web site with therelease of Version 3.0. The company also recently struck a strategic alliance withVerticalNet.
Pulp & Paper

7/21/2019 19606830 Merrill Lynch the B2B Market Maker Book(1)
http://slidepdf.com/reader/full/19606830-merrill-lynch-the-b2b-market-maker-book1 83/88
The B2B Market Maker Book – 3 February 2000
83
FreeMarkets Online (FMKT, $229, Not Rated)
FreeMarkets Online creates customized business-to-business online auctions formany of the world’s largest buyers of industrial parts, raw materials, commodities,and other goods and services. FreeMarkets runs reverse auctions. Unlike intraditional, seller-centric auctions, reverse auctions are designed to drive prices
down. In other words, sellers continue to lower their prices until the auction isclosed.
FreeMarkets estimates that manufacturers worldwide purchase approximately $5trillion of direct materials – the industrial parts and raw materials incorporated infinished products – each year. The company’s online auctions in 1998 covered $1billion worth of purchase orders. Through September of 1999, FreeMarketscreated auctions covering $1 billion worth of purchase orders. To oversimplifythe process, FreeMarkets helps buyers prepare detailed requests for quotations.Simultaneously, FreeMarkets identifies and screens suppliers and trains thesesuppliers on the company’s proprietary auction technology, BidWare. Once theauction begins, qualified suppliers from around the world, many of who would nothave been able to participate without the internet, submit bids to fill the buyer’spurchase order. Bidders remain anonymous but can see the evolving market price,and thus, can respond with new competitive bids – driving prices down. During1998, FreeMarkets estimates its clients achieved cost savings ranging fromapproximately 2% for commodity items to over 25% for customized items.
Since 1995, the company has conducted online auctions for more than 30 clients inover 50 product categories, including injection molded plastic parts, commercialmachinings, metal fabrications, chemicals, printed circuit boards, corrugatedpackaging, and coal. More than 1,800 suppliers from over 30 countries haveparticipated in the company’s auctions. Buy-side clients include UnitedTechnologies, FirstEnergy, SmithKline Beecham, and the Commonwealth of Pennsylvania. United Technologies serves as an excellent example of the benefits of FreeMarkets. FreeMarkets has held over 45 auctions for United Technologies since1996. In one particular auction held in 1997, United Technologies put a three-yearcontract to purchase injection molded plastic parts used in HVAC equipment out tobid. The winning bid is estimated to have resulted in $1.2 million in annual savings,or $3.6 million over the life of the contract – a 12% savings compared to whatUnited Technologies previously paid for the same items.
FreeMarkets generates revenue through client service agreements. These serviceagreements are typically fixed monthly fees. However, many also includeincentive payments based on auction volume and savings. In certain instances, thecompany also generates sales commissions paid by suppliers.
Reverse Auctions

7/21/2019 19606830 Merrill Lynch the B2B Market Maker Book(1)
http://slidepdf.com/reader/full/19606830-merrill-lynch-the-b2b-market-maker-book1 84/88
The B2B Market Maker Book – 3 February 2000
84
ONVIA.com (Privately Held)
ONVIA.com operates a site where small business can buy and sell products andservices, exchange information and access productivity tools. ONVIA.comimproves the procurement process for small businesses by providing a singledestination where buyers can purchase products and services and compare
offerings and price.Businesses with fewer than 100 employees and income-generating home officesare estimated to generate roughly half of gross domestic product in the UnitedStates according to the US Small Business Association. According toInternational Data Corporation (IDC), there are approximately 30 million SOHO(small office/home office) businesses in the United States. IDC estimates thatthese businesses will grow to over 38 million in number by 2002. Furthermore,IDC estimates that small business related e-commerce will reach $107 billion by2002. Clearly, the market is large and fragmented.
ONVIA.com’s marketplace includes a small business services trading hubfeaturing over 6,500 providers across 50 services in a request for quote network inwhich suppliers respond to buyers RFQs. RFQs are formulated based on
electronic questionnaires completed by buyers and routed to qualified suppliers.Through its “Buy Now” system, ONVIA.com gives its users access toapproximately 25,000 products and services in nine categories. The “Buy Now”system contains interactive tools that help small businesses make more informedselections of services and products. Through the combination of the RFQ and“Buy Now” systems, ONVIA.com provides services such as payroll, businesscredit cards, internet access, and telecommunication plans, etc. Products on “BuyNow” cover categories such as computer hardware and software, office suppliesand furniture, phone systems, among others. Information and Business Toolsinclude editorial content specific to small businesses, “how-to” advice, andbusiness tools designed to help small business owners grow their businesses.
ONVIA.com generates revenue through both transaction and advertising fees.Further out, the company intends to monetize the valuable purchasing behavior it
accumulates from its users by providing suppliers with “chaperoned” access tothese potential valuable customers.
SmartAge.com (Privately Held)
SmartAge.com is based in San Francisco and was launched in early 1998.SmartAge is focused on small businesses and offers services that allow thesebusinesses to find and retain customers, sell more, and buy better and cheaper.
Businesses with fewer than 100 employees and income-generating home officesare estimated to generate roughly half of gross domestic product in the UnitedStates according to the US Small Business Association. According toInternational Data Corporation (IDC), there are approximately 30 million SOHO(small office/home office) businesses in the United States. IDC estimates that
these businesses will grow to over 38 million in number by 2002. Furthermore,IDC estimates that small business related e-commerce will reach $107 billion by2002. Clearly, the market is large and fragmented.
SmartAge’s strategy is to acquire customers through SmartClicks, an onlineadvertising exchange. For every two banner ads a member agrees to display on itssite it gets a credit to show its own ad on another site. SmartClicks provides userswith reporting tools for advertising campaign management and its technology,SmartTargeting, targets ads to the sites where they get the best click-through rates.
Small Business
Small Business

7/21/2019 19606830 Merrill Lynch the B2B Market Maker Book(1)
http://slidepdf.com/reader/full/19606830-merrill-lynch-the-b2b-market-maker-book1 85/88
The B2B Market Maker Book – 3 February 2000
85
Once small businesses join SmartClicks, SmartAge offers them a multitude of services from which it generates revenue. Beyond the free banner ad placementusers get for presenting the ads of other affiliated sites for free, users can useSmartAge to purchase advertising space not only on the SmartClicks network, buton other popular ad networks and sites. SmartAge’s MarketPlace and ResourceCenter allows small businesses to buy from and sell to SmartAge’s user base,which totals over one million. SmartAge Site and Store allows small businesses toget online and sell online quickly. SmartAge’s Corner Office, where SmartAgehosts user data, is a management tool that makes SmartAge’s offering “sticky.”
In summary, SmartAge helps small businesses start a web site, enable it forcommerce, find customers, buy with economies of scale, sell on the web, run anaffiliate network, and generally, manage their businesses.
works.com (Privately Held)
works.com, which was founded in September 1997, is headquartered in Houston,Texas and launched its service in May 1999. works.com is an internet-basedprocurement solution for small and medium-sized businesses.
Businesses with fewer than 100 employees and income-generating home offices
are estimated to generate roughly half of gross domestic product in the UnitedStates according to the US Small Business Association. According toInternational Data Corporation (IDC), there are approximately 30 million SOHO(small office/home office) businesses in the United States. IDC estimates thatthese businesses will grow to over 38 million in number by 2002. Furthermore,IDC estimates that small business related e-commerce will reach $107 billion by2002. Clearly, the market is large and fragmented.
works.com automates the whole procurement process, from selection to receivingshipment, for smaller businesses. In addition to the savings works.com providesthrough reduced procurement costs, the company also provides its users withwholesale direct prices on 20,000 business products including computeraccessories, office supplies, furniture, and janitorial products. The companyestimates that these wholesale direct prices allow customers to save an average of 15% on monthly purchases. works.com charges $1.50 per order for its services.works.com automates the whole purchasing process. The service allows users tobrowse catalogs, request items, and place orders online. The approval process issimplified and spending is controlled because the system enables businesses toestablish approval processes that filter and manage purchase requests. Once anorder is made, the purchasing information is captured so the order can be trackedthrough all stages of the purchasing process. Through an online request, works.comautomatically processes returns on behalf of customers. “Custom cabinets” allowbusinesses to customize the site so it presents only their preferred products. Inaddition, works.com provides management with reporting capabilities that allowtracking of purchases on a company-wide or individual level for better budgetmanagement and insights into purchasing habits and patterns.
Small Business

7/21/2019 19606830 Merrill Lynch the B2B Market Maker Book(1)
http://slidepdf.com/reader/full/19606830-merrill-lynch-the-b2b-market-maker-book1 86/88
The B2B Market Maker Book – 3 February 2000
86
Universal Access
Universal Access serves as an intermediary between service providers who buynetwork capacity and transport suppliers who sell it. Universal Access facilitatesthe provisioning, installation, and servicing of dedicated communication links, orcircuits. Universal Access aggregates network information, operates facilities
where networks can be interconnected, provides dedicated circuit access as well ascustomer support services.
Universal Access is vendor-neutral and, as a result, has been able to aggregatenetwork information from over 35 transport suppliers and over 75,000 physicalsites. Universal Information Exchange, or UIX, is the company’s web-basedoffering, which through linked proprietary databases, contains capacity,availability, physical location and pricing information for these transport suppliersand locations. In addition, Universal Access operates UTXs, or UniversalTransport Exchanges, where transport suppliers can connect to each other’snetworks. Universal Access also provides services that include network monitoring, maintenance, and restoration.
Many factors, particularly deregulation and the emergence of the internet, have
resulted in an increasingly competitive, fragmented, and growing market forcommunications network services. Yankee Group projects the domestic marketfor internet transport capacity and network infrastructure services at $57 billion in2002 and growth is likely to remain torrid. This robust market opportunity hasattracted many players and, as a result, there are multiple networks serving variousgeographies. Transport and service providers have limited access to accurateinformation regarding the pricing, capacity, availability, and location of othersuppliers’ networks. Since transport suppliers compete with each other it is notsurprising that they are reluctant to share this information.
The current market environment provides significant challenges for both servicesuppliers like ISPs and ASPs and transport suppliers like IXCs and CLECs.Service providers spend an inordinate amount of time and expense quoting,provisioning, and installing circuits. Furthermore, they often have difficulty
determining capacity availability, which can result in a backlog of customer ordersand lost revenues. Also, this lack of information makes delivering key customerservices such as connection maintenance, monitoring, and restoration extremelychallenging. Transport suppliers are faced with challenges that include theinability to fulfill customer demand for dedicated circuits due to the limited reachof their own networks, expenses related to selling excess capacity, andinconsistent service levels over multiple segments of their networks.
By providing a single point of contact and central repository of transport supplierinformation where service suppliers can analyze provisioning, installation, andnetwork management services, Universal Access helps its clients save time andmoney. Furthermore, Universal Access allows service providers to extend thereach of their network. In addition, for transport suppliers, Universal Accessserves as a source of aggregated demand.
Universal Access currently generates most of its revenue through 12-60 monthcontracts for providing dedicated circuit access for its clients. Due to the fact thatthe company’s UTX roll-out is in its early stages, the company currently generatesa small portion of revenue from leasing space to transport providers in thesefacilities. As the company adds more facilities we would expect these revenues toincrease as a percentage of the overall mix.
Telecommunications

7/21/2019 19606830 Merrill Lynch the B2B Market Maker Book(1)
http://slidepdf.com/reader/full/19606830-merrill-lynch-the-b2b-market-maker-book1 87/88
The B2B Market Maker Book – 3 February 2000
87
Chart 14: B to B Market Maker Master List
Source: Merrill Lynch Internet ResearchMerrill Lynch makes no representations or warranties whatsoever as to the data and information provided in any referenced website and shall have no liability orresponsibility arising out of or in connection with any referenced website.

7/21/2019 19606830 Merrill Lynch the B2B Market Maker Book(1)
http://slidepdf.com/reader/full/19606830-merrill-lynch-the-b2b-market-maker-book1 88/88
The B2B Market Maker Book – 3 February 2000