1953 - kb home
TRANSCRIPT
Irk~~,,..- I £j;'Z'%5 I I
UM & NATURAL GAS SERIES N0.5
1953 and Gas
COMPll..ED BY
ROBERT L. ALKffiE
OF

ST A TE OF omo
Fro.nk J. Lausche, Governor
DEPARTMENT OF NATURAL RESOURCES
A. W. Marion, Director
NATURAL RESOURCES COMMISSION George Wenger,
John A. Slipher, Vice Chairman
C. D. Blubaugh Dr. C. L. Dow A. W. Marion
Chairman
Bryce Browning, Secretary
Dr. John L. Rich Milton Ronsheim Dean L. L. Rummell
DIVISION OF GEOLOGICAL SUR VEY John H. Melvin,
Chief

State of Ohio Frank 1. Lausche, Governor
Department of Natural Resources A. W. Marion, Director
DIVISION OF GEOLOGICAL SURVEY 1ohn H. Melvin, Chief
REPORT OF INVESTIGATIONS NO. 20
PETROLEUM AND NATURAL GAS SERIES NO. 5
1953 Oil and Gas Well Drilling
Statistics
COMPILl!D BY
ROBERT L. ALKffiE
Columbus 1954

ACKNOWLEDGMENTS
The source data for Part I, "Oil and Gas Well Drilling Statistics for 1953, '' were obtained from the semi-monthly drilling reports published by the Ohio Oil and Gas Associ-ation and from the files of the Ohio Division of Mines. Additional information was contrib-uted by the Ohio Fue 1 Gas Company.
"The Development of Underground Storage in Ohio," by J. J. Schmidt, Assistant to the President, East Ohio Gas Company, Cleveland, and K. C. Cottingham, Chief Geologist, Ohio Fuel Gas Company, Columbus, is presented in Part II. This is the second report prepared for the Petroleum and Natural Gas Series by authors not employed by the Survey. The first, "The Canton Gas Pool,'' which appeared in Series No. 3, 1952, was prepared by Henry Belden, III, whose company was a principal operator in the Canton pool. Mr. Cottingham and Mr. Schmidt have been closely associated with the development of under-ground gas storage in Ohio. They have presented an authoritative review of this relatively new procedure, which, as the demand fOr natural gas continues to increase, will become of greater importance to the citizens of Ohio if they are to be assured of a constant supply of this convenient fuel.
The writer expresses sincere appreciation to all who have contributed to this bulletin and to the staff members who assisted in compiling, editing, and typing the assembled data.
Robert L. Alkire April 6, 1954
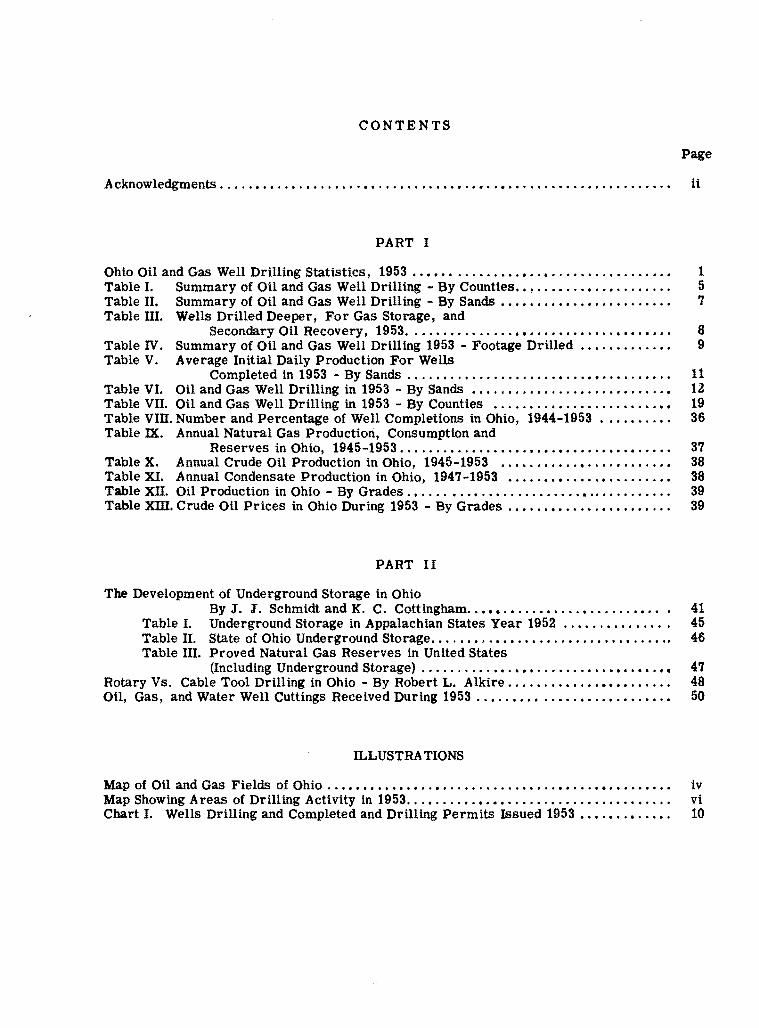
CONTENTS
Page
Acknowledgments .....•••..•.....•...•.... , . . . . . . • • . • • • . • • . . • . • . • • . . • • • . • . . . • . . • ii
PART I
Ohio Oil and Gas Well Drilling Statistics, 1953 . • • • • • . . . • . . . • . • • . • . . • • . • . . • . . . • • • . • 1 Table I. Summary of Oil and Gas Well Drilling - By Counties •• , . . . . . . • • . . • . . . • . . • • 5 Table II. Summary of Oil and Gas Well Drilling - By Sands • • . • . . . • • • • • • . . • . • . • • . . • 7 Table III. Wells Drilled Deeper, For Gas Storage, and
Secondary Oil Recovery, 1953. . . . • • • • . • . . . . . • • • • • • • . • • . . . • • • • . • • . . 8 Table IV. Summary of Oil and Gas Well Drilling 1953 - Footage Drilled . • . . • . . • . . . • • 9 Table V. Average Initial Daily Production For Wells
Completed in 1953 - By Sands . . . . . • . . • . . . . . . . . • . . . • . . • • • • • . . . . • . . • 11 Table VI. OU and Gas Well Drilling in 1953 - By Sands . . . . . • . . . • . . . . . • • . . • . • . . . . . • U Table VII. Oil and Gas Well Drilling in 1953 - By Counties • . . • . • . . • • . . . • • . . • • • • • . • • 19 Table VIII. Number and Percentage of Well Completions in Ohio, 1944-1953 . . . • • • • . • . 36 Table IX. Annual Natural Gas Production, Consumption and
Reserves in Ohio, 1945-1953. . . . . . . • . . . . • • . . . . • • • . • • • • . • • • • • • . . . • • 37 Table X. Annual Crude Oil Production in Ohio, 1945-1953 ..•••••.•..••..••.. , . • . . 38 Table XI. Annual Condensate Production in Ohio, 1947-1953 • . • • . • • • . . • • . • • • • . . • • • • 38 Table XII. Oil Production in Ohio - By Grades . • • . . . • . • • . . • . • . . . . . . . . . • . . . . . . . • . • . • 39 Table XIII. Crude Oil Prices in Ohio During 1953 - By Grades . • • . . • • • . • • • . • . • . • • • . • • 39
PART II
The Development of Underground Storage in Ohio By J. J. Schmidt and K. C. Cottingham......... . . • • . • . • . . . . . . • • • • . 41
Table I. Underground Storage in Appalachian States Year 1952 . . • • . . • • . . . . • • • 45 Table II. State of Ohio Underground Storage.... . . • . . • • • • • • .. . . . . . . • • • • • . • . . .. 46 Table III. Proved Natural Gas Reserves in United States
(Including Underground Storage) ..•.•.....• , . , • , •...•..••• , • • • • • . • • 4 7 Rotary Vs. Cable Tool Drilling in Ohio - By Robert L. Alkire. . • . . . . . • • • • • • • • • . • . . . • 48 Oil, Gas, and Water Well Cuttings Received During 1953 . • • . • • • • • . . . • • • • . • • . • . . • • . • 50
ILLUSTRATIONS
Map of Oil and Gas Fields of Ohio .•• , • • • • • . • • • . . • . . . . . . . • . . . • • . . . • • . • . • • • • • . • • . • • iv Map Showing Areas of Drilling Activity in 1953. • . • . . . . • . • • • • • • . . . . • . . . . • • . • • • • • • . . . vi Chart I. Wells Drilling and Completed and Drilling Permits Issued 1953 • . • . • . . • • • • • . 10

OIL AND GAS FIELDS OF OHIO
64"
M t: H £RI£'
M
-';.
'l;J
~· IO 0 ~
K E N T u c K J 1-.l 8J
~
...,,
..:i. L..llil:!O
tJ GAS ~OIL
Sca!e of Miles ., 10 ),) "°
,...
~
.., 0
50
.... ....
1... ••
•')
1.:J
39•
PART I
OHIO OIL AND GAS WELL DRILLING STATISTICS - 1953
ANNUAL WELL COMPLETIONS; OIL AND GAS PRODUCTION, RESERVES; AND GAS CONSUMPTION DATA,
AND 1953 CRUDE OIL PRICES
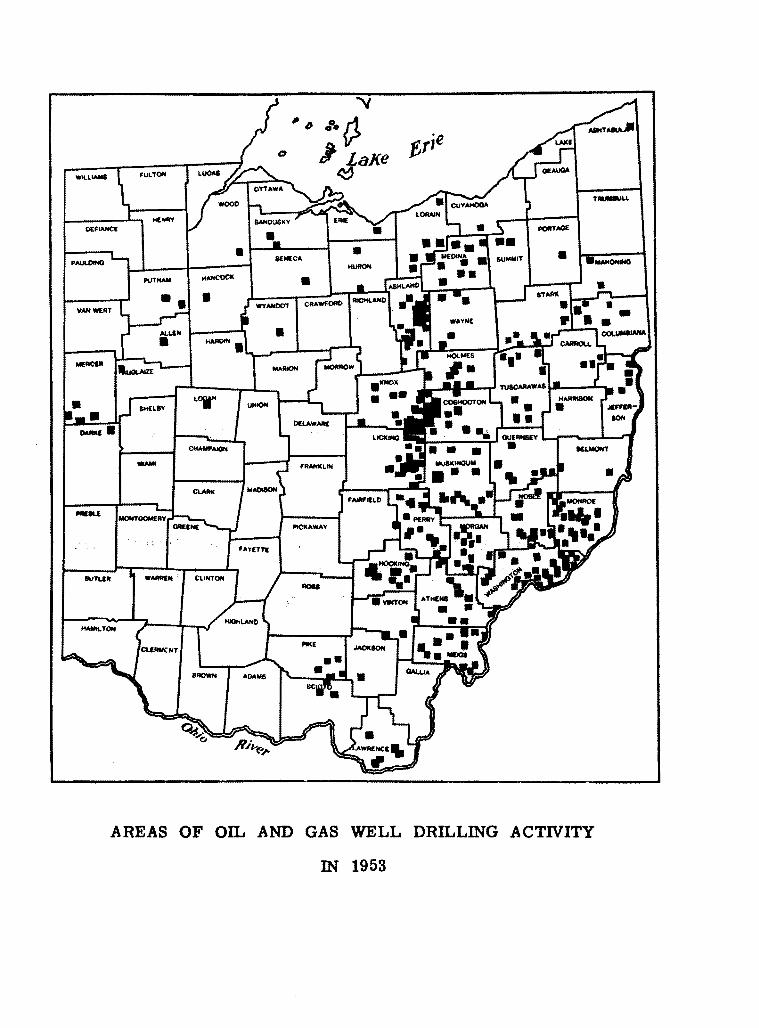
AREAS OF OIL AND GAS WELL DRILLING ACTIVITY
IN 1953
SUMMARY OF OIL AND GAS WELL DRILLING ACTIVITY IN OHIO IN 1953
The most notable development in oil and gas well drilling in Ohio during 1953 was the widespread acceptance of the hydraulic fracture method for increasing production in new Clinton sand wells. Indications as to the success of this process were realized in the latter half of 1952 but it was not until the early months of 1953 that operators generally began to employ the new procedure. Although some favorable increases were recorded in gas well open flows, the out-standing results were attained in oil wells. A review of the records for the year finds numerous well logs with 10 to l5 barrels of oil natural in the Clinton reporting 200 to 300 barrels after fracture. This is particularly true in Coshocton, Knox, and Licking counties where approxi-mately 150 wells were treated. The 945 barrels per day average initial increase in Corning grade production recorded for the year ts largely due to the success of fracturing the Clinton sand in these counties. Other sands have been fractured in Ohio, but, with the exception of the Oriskany and lnd Berea wherein a number of good increases were obtained in gas wells, the quantity is as yet insufficient to be conclusive.
Coshocton and Knox counties retained their positions as the most active areas of Clinton sand oil drilling in the State. Seventy-three new wells in Coshocton County averaged 133 barrels the first 24 hours after completion and 90 wells in Knox County averaged 113 barrels. Eastern Licking County moved into prominence with 35 new Clintt>n wells averaging 102 barrels after fracture.
Two new Clinton sand oil pools of note were developed during the year. The first, known as the Shearer pool and located in the northwest corner of Bethlehem Township, Coshocton County, was initiated by the 1ames I. Shearer-Charles Fox No. 1 well which produced 50 bar-rels the first 24 hours after shot. Nine wells averaged 133 barrels initial, the largest reporting 272 barrels after fracture. The limits of this pool have not been determined. The second new Clinton oil pool of note, called the Fry pool, is located in Pike Township, Stark County. The discovery well was the M. B. Belden-1ames Cuinger No. 1, Section 24, which produced 35 barrels after fracture. Four wells were completed, the largest reporting 40 barrels.
Other areas of successful Clinton sand oil development were located in Hocking, Holmes, and Perry counties.
Ashland County contined as the most active area of Berea sand oil drilling with 83 new wells which averaged 9 barrels at completion. Other successful areas were located in l.icking, Medina, Meigs, and Perry counties.
Gas well drilling declined to the lowest number of successful completions since 1890. There were no major discoveries, but several promising wild-cat completions may forecast new pool developments during the coming year. The principal areas of successful gas development were located in Athens, Lake, Lorain, Muskingum, Perry, Stark, Tuscarawas, am Washington counties.
1

2
The largest gas well for the year was the Ohio Fuel Gas Company-C. G. Krile No. 1, Lot 10, Wellington Township, Lorain County, which reported 14, 241, 000 cubic feet natural with 1, 150 psi rock pressure. The Clinton occurred from 2, 301 to 2, 304 and 2, 310 to 2, 322 with total depth 2, 326 feet. The largest oil well was the, Everett Bucy et al - Howard Mizer No. 4, Section 4, Pike Township, Coshocton County, 'which recorded 630 barrels after fracture. The Clinton was found from 3, 159 to 3, 225 and total depth was 3, 225 feet.
The most active counties were Ashland with 130 wells completed, Knox 130, Washing-ton 114, Coshocton 102, Licking 75, Monroe 59, Noble 38, and Holmes 37.
In new gas discovered Lorain County led with. 27, 584, 000 cubic feet; Knox followed with 17, 517, 000; Coshocton 12, 839, 000; Washington 9, 921, 000; and Licking County 9, 440, 000 cubic feet. The leading counties in new oil discovered were Knox with 10, 131 barrels, Coshoc-ton 9, 731, Licking 3, 627, Perry 1, 295, and Ashland 748 barrels per day.
A total of 1, 097 new wells, in 50 counties, were reported completed in 1953. Seven hundred and eleven were successful and 386 were dry, an average of 35. 2 per cent failures. Initial discoveries were 137, 316, 000 cubic feet.of gas and 28, 147 barrels of oil per day. Foot-age drilled totalled 2, 102, 950 feet. Successful gas wells amounted to 397, 463 feet; oil wells 817, 452 feet; combination oil and gas wells 186, 402; and dry holes 701, 633 feet. Thirty-six per cent of all new wells tested the Clinton sand and 33 per cent the Berea. Ninety-one per cent of all oil and 66 per cent of all gas discovered during the year was found in the Clinton.
The initial average daily oil proQ.uction of 53 barrels is a 20-barrel increase over 1952 and the 565, 000 cubic feet average initial for gas is a decrease of 44, 000 cubic feet per well.
The average depth of all new wells drilled was 1, 917 feet, of new gas wells 2, 196, oil wells 1, 754, combination 2, 913, and dry holes 1, 818 feet. Average depth of all new wells drilled by horizons follows: ,
Shallow sands Berea Ohio shale Oriskany Newburg Clinton Medina Trenton Sub-Trenton
843 feet 997 feet
2, 180 feet 2, 880 feet 2, 493 feet 3, 237 feet 3, 827 feet 1, 372 feet (western Ohio) 3, 256 feet
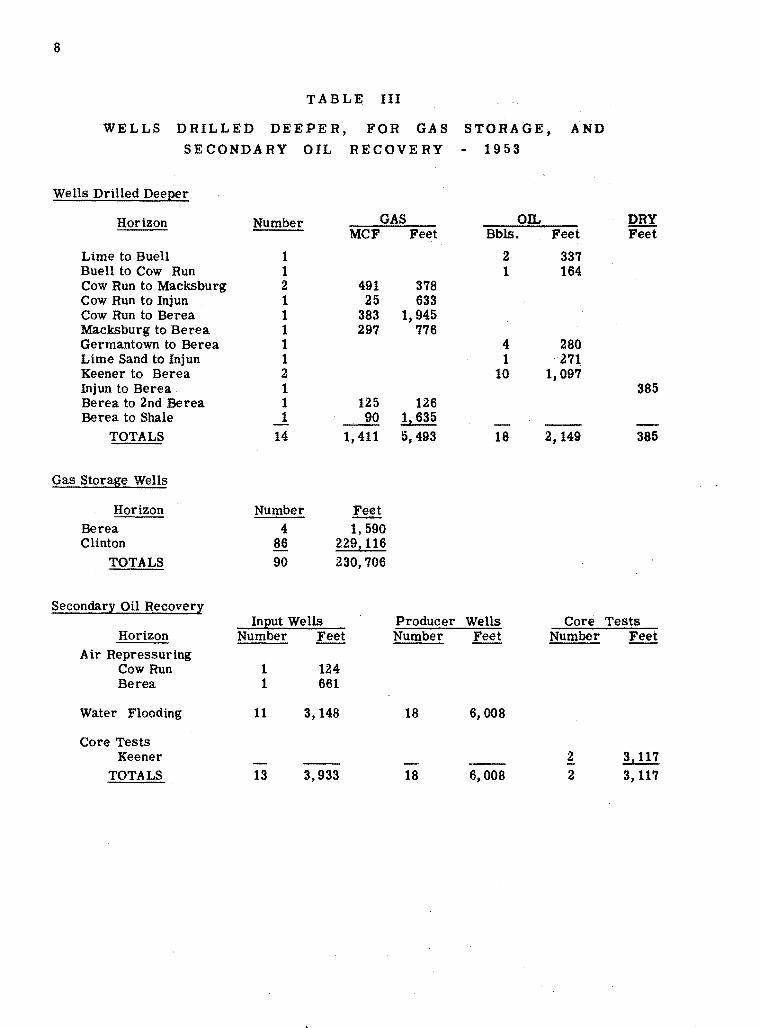
Fourteen wells were drilled deeper during the year. They discovered 1, 411, 000 cubic feet of gas and 18 barrels of oil per day initial and added 8, 427 feet of drilling. Ninety gas storage wells added 230, 706 feet of drilling in this category. Eleven water input wells (3, 148 feet) and 18 producers (6, 008 feet) added 9, 156 feet to the secondary oil recovery footage in the State. . .
Including all types of wells drilled the totals for 1953 are as follows:
Wells - new wells drilled deeper gas storage secondary recovery core tests
Totals
1, 097 Wells 14 90 29 2
1, 232 Wells
2, 102, 950 Feet 8,427
230,706 9,156 3, 117
2, 354, 356 Feet
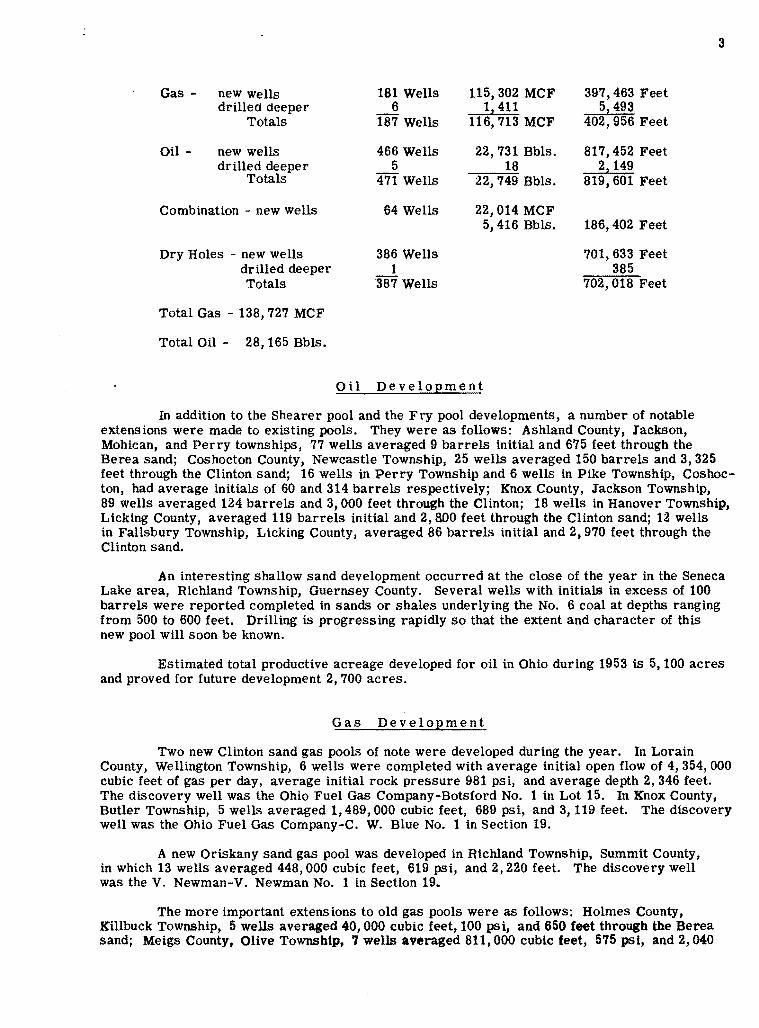
Gas - new wells drilled deeper
Totals
Oil - new wells drilled deeper
Totals
Combination - new wells
Dry Holes - new wells drilled deeper Totals
Total Gas - 138, 727 MCF
Total Oil - 28, 165 Bbls.
181 Wells 115, 302 MCF 6 1, 411
187 Wells 116, 713 MCF
466 Wells 22, 731 Bbls. 5 18
471 Wells 22, 749 Bbls.
64 Wells 22, 014 MCF 5, 416 Bbls.
386 Wells 1
387 Wells
Oil Development
397, 463 Feet 5,493
402, 956 Feet
817, 452 Feet 2, 149
819, 601 Feet
186, 402 Feet
701, 633 Feet 385
702, 018 Feet
In addition to the Shearer pool and the Fry pool developments, a number of notable extensions were made to existing pools. They were as follows: Ashland County, Jackson, Mohican, and Perry townships, 77 wells averaged 9 barrels initial and 675 feet through the
3
Berea sand; Coshocton County, Newcastle Township, 25 wells averaged 150 barrels and 3, 325 feet through the Clinton sand; 16 wells in Perry Township and 6 wells in Pike Township, Coshoc-ton, had average initials of 60 and 314 barrels respectively; Knox County, Jackson Township, 89 wells averaged 124 barrels and 3, 000 feet through the Clinton; 18 wells in Hanover Township, Licking County, averaged 119 barrels initial and 2, 800 feet through the Clinton sand; 12 wells in Fallsbury Township, Licking County, averaged 86 barrels initial and 2, 970 feet through the Clinton sand.
An interesting shallow sand development occurred at the close of the year in the Seneca Lake area, Richland Township, Guernsey County. Several wells with initials in excess of 100 barrels were reported completed in sands or shales underlying the No. 6 coal at depths ranging from 500 to 600 feet. Drilling is progressing rapidly so that the extent and character of this new pool will soon be known.
Estimated total productive acreage developed for oil in Ohio during 1953 is 5, 100 acres and proved for future development 2, 700 acres.
Gas Development
Two new Clinton sand gas pools of note were developed during the year. In Lorain County, Wellington Township, 6 wells were completed with average initial open flow of 4, 354, 000 cubic feet of gas per day, average initial rock pressure 981 psi, and average depth 2, 346 feet. The discovery well was the Ohio Fuel Gas Company-Botsford No. 1 in Lot 15. In Knox County, Butler Township, 5 wells averaged 1, 489, 000 cubic feet, 689 psi, and 3, 119 feet. The discovery well was the Ohio Fuel Gas Company-C. W. Blue No. 1 in Section 19.
A new Oriskany sand gas pool was developed in Richland Township, Summit County, in which 13 wells averaged 448, 000 cubic feet, 619 psi, and 2, 220 feet. The discovery well was the V. Newman-V. Newman No. 1 in Section 19.
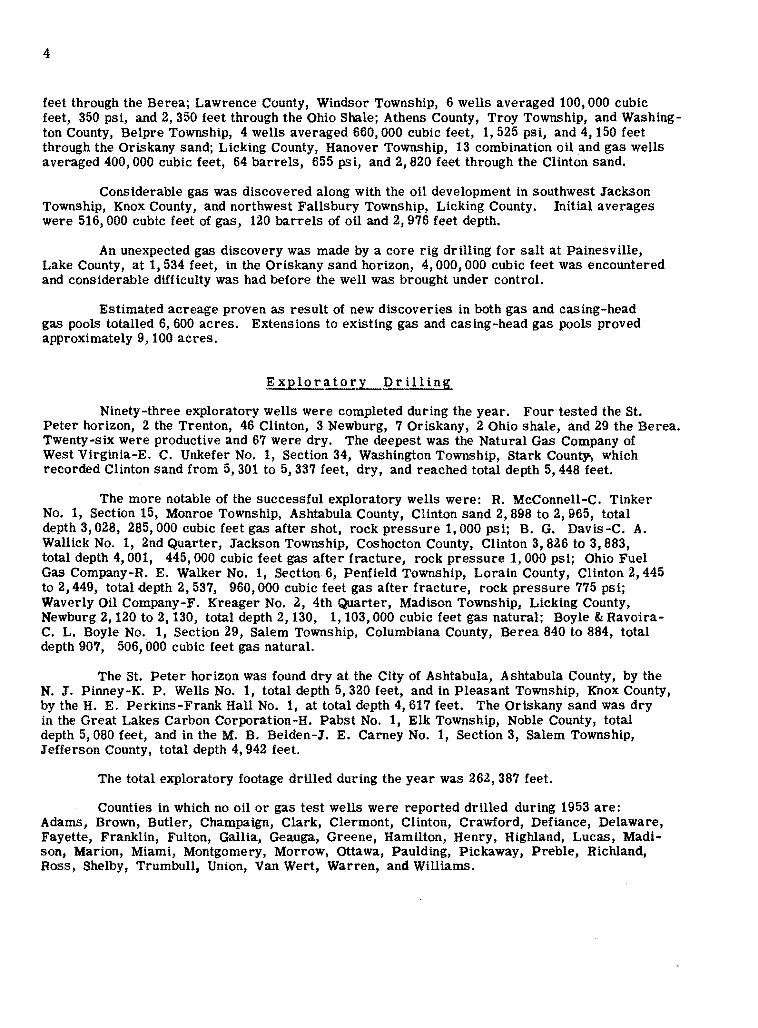
The more important extensions to old gas pools were as follows: Holmes County, Killbuck Township, 5 wells averaged 40, 000 cubic feet, 100 psi, and 650 feet through the Berea sand; Meigs County, Olive Township, 7 wells averaged 811, 000 cubic feet, 575 psi, and 2, 040
4
feet through the Berea; Lawrence County, Windsor Township, 6 wells averaged 100, 000 cubic feet, 350 psi, and 2, 350 feet through the Ohio Shale; Athens County, Troy Township, and Washing-ton County, Belpre Township, 4 wells averaged 660, 000 cubic feet, 1, 525 psi, and 4, 150 feet through the Oriskany sand; Licking County, Hanover Township, 13 combination oil and gas wells averaged 400, 000 cubic feet, 64 barrels, 655 psi, and 2, 820 feet through the Clinton sand.
Considerable gas was discovered along with the oil development in southwest Iackson Township, Knox County, and northwest Fallsbury Township, Licking County. Initial averages were 516, 000 cubic feet of gas, 120 barrels of oil and 2, 976 feet depth.
An unexpected gas discovery was made by a core rig drilling for salt at Painesville, Lake County, at 1, 534 feet, in the Oriskany sand horizon, 4, 000, 000 cubic feet was encountered and considerable difficulty was had before the well was brought under control.
Estimated acreage proven as result of new discoveries in both gas and casing-head gas pools totalled 6, 600 acres. Extensions to existing gas and casing-head gas pools proved approximately 9, 100 acres.
Exploratory Dr ill ing
Ninety-three exploratory wells were completed during the year. Four tested the St. Peter horizon, 2 the Trenton, 46 Clinton, 3 Newburg, 7 Oriskany, 2 Ohio shale, and 29 the Berea. Twenty-six were productive and 67 were dry. The deepest was the Natural Gas Company of West Virginia-E. C. Unkefer No. 1, Section 34, Washington Township, Stark County., which recorded Clinton sand from 5, 301 to 5, 337 feet, dry, and reached total depth 5, 448 feet.
The more notable of the successful exploratory wells were: R. McConnell-C. Tinker No. 1, Section 15, Monroe Township, Ashtabula County, Clinton sand 2, 898 to 2, 965, total depth 3, 028, 285, 000 cubic feet gas after shot, rock pressure 1, 000 psi; B. G. Davis-C. A. Wallick No. 1, 2nd Quarter, Jackson Township, Coshocton County, Clinton 3, 826 to 3, 883, total depth 4, 001, 445, 000 cubic feet gas after fracture, rock pressure 1, 000 psi; Ohio Fuel Gas Company-R. E. Walker No. 1, Section 6, Penfield Township, Lorain County, Clinton 2, 445 to 2, 449, total depth 2, 537, 960, 000 cubic feet gas after fracture, rock pressure 775 psi; Waverly Oil Company-F. Kreager No. 2, 4th Quarter, Madison Township, Licking County, Newburg 2, 120 to 2, 130, total depth 2, 130, 1, 103, 000 cubic feet gas natural; Boyle & Ravoira-C. L. Boyle No. 1, Section 29, Salem Township, Columbiana County, Berea 840 to 884, total depth 907, 506, 000 cubic feet gas natural.
The St. Peter horizon was found dry at the City of Ashtabula, Ashtabula County, by the N. J. Pinney-K. P. Wells No. 1, total depth 5, 320 feet, and in Pleasant Township, Knox County, by the H. E. Perkins-Frank Hall No. 1, at total depth 4, 617 feet. The Oriskany sand was dry in the Great Lakes Carbon Corporation-H. Pabst No. 1, Elk Township, Noble County, total depth 5, 080 feet, and in the M. B. Belden-1. E. Carney No. 1, Section 3, .Salem Township, Iefferson County, total depth 4, 942 feet.
The total exploratory footage drilled during the year was 262, 387 feet.
Counties in which no oil or gas test wells were reported drilled during 1953 are: Adams, Brown, Butler, Champaign, Clark, Clermont, Clinton, Crawford, Defiance, Delaware, Fayette, Franklin, Fulton, Gallia, Geauga, Greene, Hamilton, Henry, Highland, Lucas, Madi-son, Marion, Miami, Montgomery, Morrow, Ottawa, Paulding, Pickaway, Preble, Richland, Ross, Shelby, Trumbull, Union, Van Wert, Warren, and Williams.
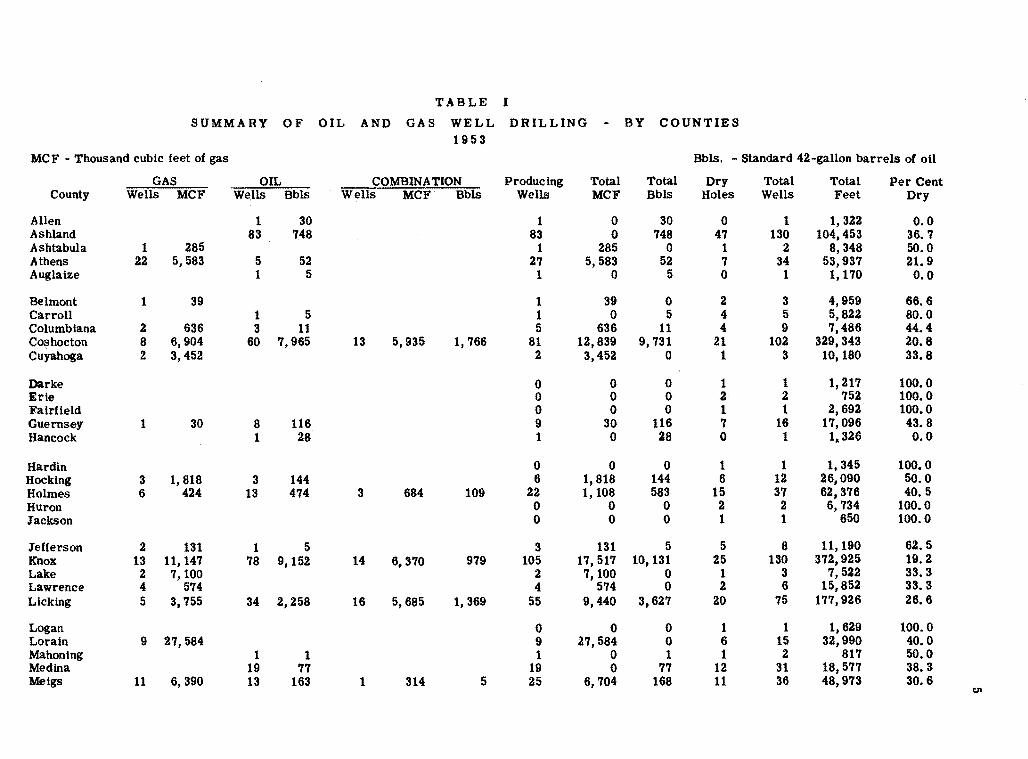
TABLE I SUMMARY OF OIL AND GAS WELL DRILLING - BY COUNTIES
1953 MCF - Thousand cubic feet of gas Bbls. - Standard 42-gallon barrels of oil
GAS OIL COMBINATION Producing Total Total Dry Total Total Per Cent County Wells MCF We.lls Bbls Wells MCF Bbls Wells MCF Bbls Holes Wells Feet Dry
Allen 1 30 1 0 30 0 1 1, 322 0.0 Ashland 83 748 83 0 748 47 130 104,453 36. 7 Ashtabula 1 285 1 285 0 1 2 8,348 50. 0 Athens 22 5,583 5 52 27 5,583 52 7 34 53,937 21.9 Auglaize 1 5 1 0 5 0 1 1,170 o.o Belmont 1 39 1 39 0 2 3 4,959 66. 6 Carroll 1 5 1 0 5 4 5 5,822 80.0 Columbiana 2 636 3 11 5 636 11 4 9 7,486 44.4 Coshocton 8 6,904 60 7,965 13 5,935 1,766 81 12,839 9,731 21 102 329,343 20.8 Cuyahoga 2 3, 452 2 3,452 0 1 3 10,180 33.8
Darke 0 0 0 1 1 1,217 100.0 Erie 0 0 0 2 2 752 100.0 Fairfield 0 0 0 1 1 2,692 100.0 Guernsey 1 30 8 116 9 30 116 7 16 17,096 43. 8 Hancock 1 28 1 0 28 0 1 1,326 o.o Hardin 0 0 0 1 1 1, 345 100. 0 Hocking 3 1, 818 3 144 6 1, 818 144 6 12 26,090 50. 0 Holmes 6 424 13 474 3 684 109 22 1,108 583 15 37 62, 376 40.5 Huron 0 0 0 2 2 6, 734 100.0 Jackson 0 0 0 1 1 650 100.0
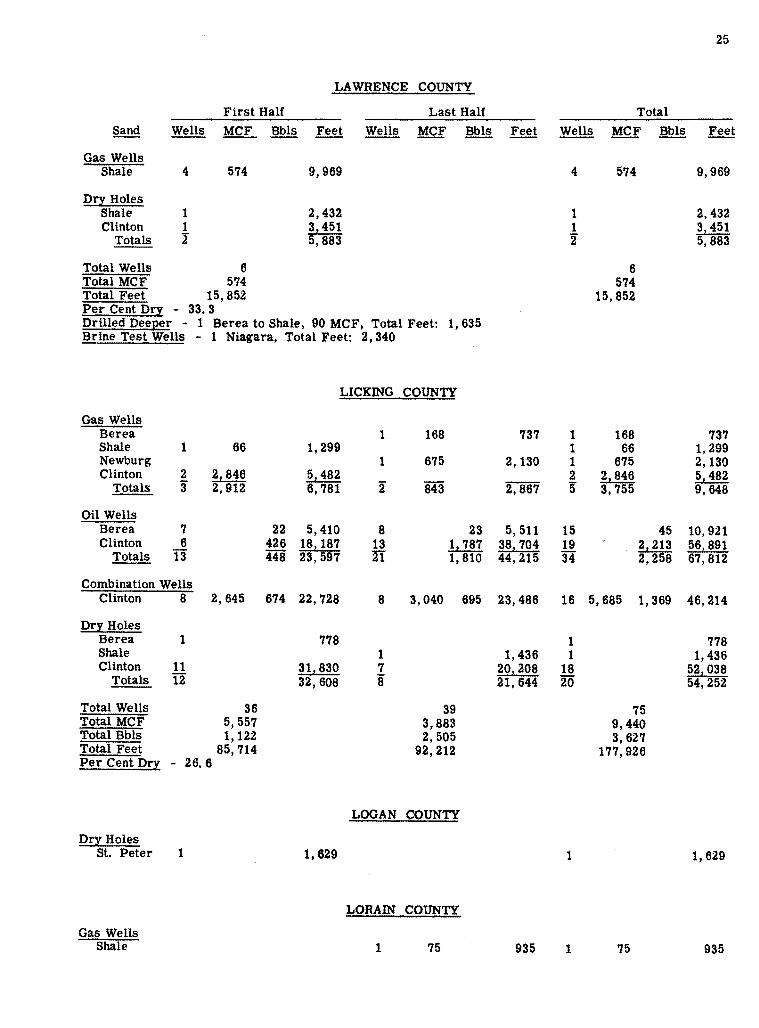
Jefferson 2 131 1 5 3 131 5 5 8 11,190 62. 5 Knox 13 11, 147 78 9,152 14 6, 370 979 105 17, 517 10,131 25 130 372,925 19.2 Lake 2 7, 100 2 7,100 0 1 3 7, 522 33.3 Lawrence 4 574 4 574 0 2 6 15,852 33. 3 Licking 5 3,755 34 2,258 16 5, 685 1,369 55 9,440 3,627 20 75 177, 926 26. 6
Logan 0 0 0 1 1 1, 629 100.0 Lorain 9 27, 584 9 27,584 0 6 15 32,990 40.0 Mahoning 1 1 1 0 1 1 2 817 50. 0 Medina 19 77 19 0 77 12 31 18,577 38.3 Meigs 11 6,390 13 163 1 314 5 25 6,704 168 11 36 48,973 30. 6
01
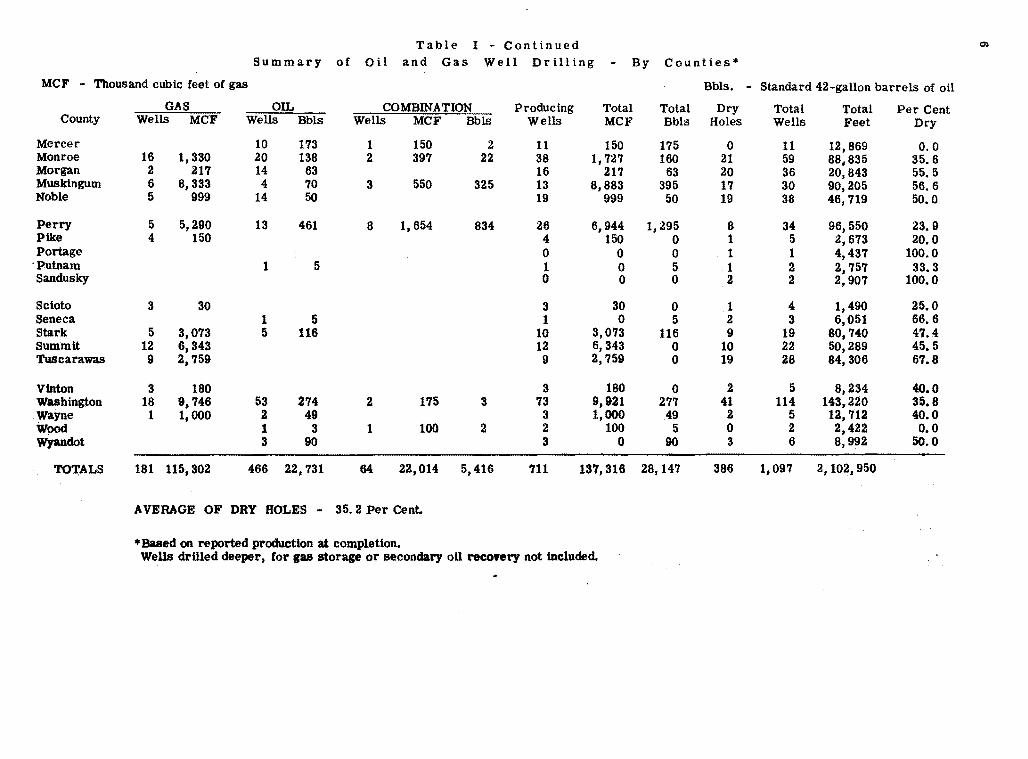
Table I - Continued Cl)
Summary of Oil and Gas Well Drilling - By Counties*
MCF - Thousand cubic feet of gas Bbls. - Standard 42-gallon barrels of oil GAS OIL COMBINATION Producing Total Total Dry Total Total Per Cent
County Wells MCF Wells Bbls Wells MCF Bbls Wells MCF Bbls Holes Wells Feet Dry
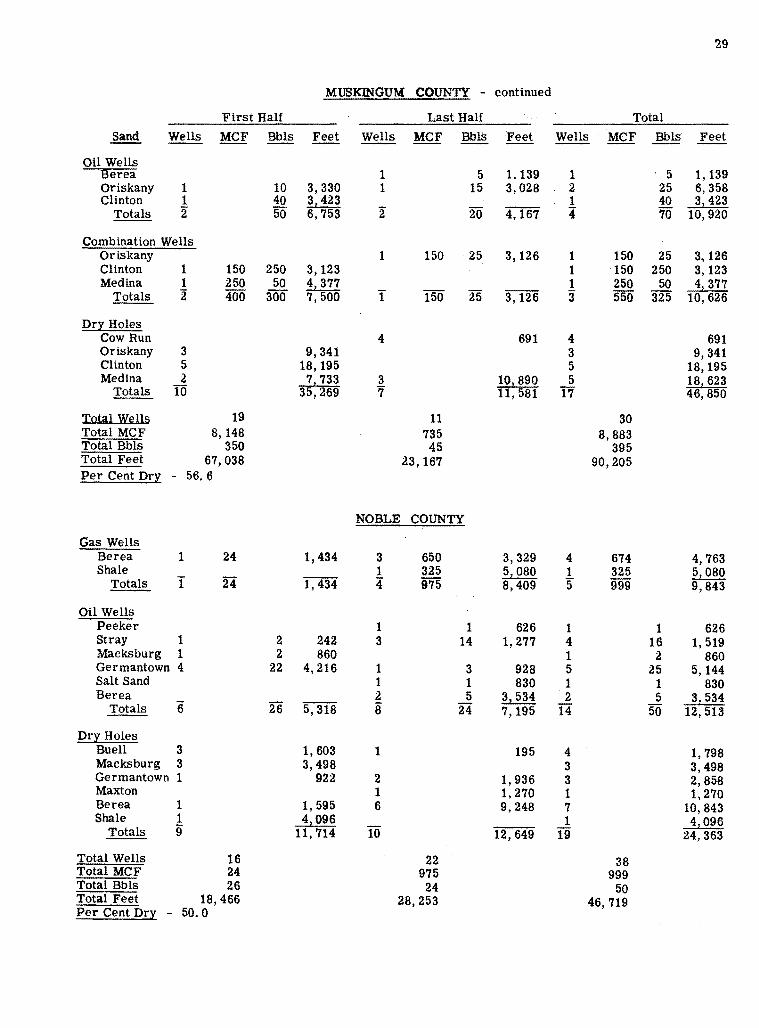
Mercer 10 173 .1 150 2 11 150 175 0 11 12,869 0.0 Monroe 16 1,330 20 138 2 397 22 38 1,727 160 21 59 88,835 35.6 Morgan 2 217 14 63 16 217 63 20 36 20,843 55. 5 Muskingum 6 8, 333 4 70 3 550 325 13 8,883 395 17 30 90,205 56. 6 Noble 5 999 14 50 19 999 50 19 38 46,719 50. 0
Perry 5 5,290 13 461 8 1,654 834 26 6,944 1,295 8 34 96,550 23. 9 Pike 4 150 4 150 0 1 .5 2,673 20.0 Portage 0 0 0 1 1 4, 437 100.0
·Putnam 1 5 1 0 5 1 2 2,757 33.3 Sandusky 0 0 0 2 2 2,907 100.0
Scioto 3 30 3 30 0 1 4 1,490 25.0 Seneca 1 5 1 0 5 2 3 6,051 66.6 Stark 5 3,073 5 116 10 3,073 116 9 19 80,740 47.4 Summit 12 6,343 12 6,343 0 10 22 50,289 45. 5 Tuscarawas 9 2,759 9 2,759 0 19 28 84,306 67.8
Vinton 3 180 3 180 0 2 5 8,234 40.0 Washington 18 9,746 53 274 2 175 3 73 9,921 277 41 114 143,220 35.8 Wayne 1 1,000 2 49 3 1,000 .49 2 5 12,712 40.0 Wood 1 3 1 100 2 2 100 5 0 2 2,422 o. 0 Wyandot 3 90 3 0 90 3 6 8,992 50.0
TOTALS 181 115, 302 466 22,731 64 22,014 5,416 711 137,316 28,147 386 1,097 2,102,950
AVERAGE OF DRY HOLES - 35. 2 Per Cent.
*Based on reported production at completion. Wells drilled deeper, for gas storage or secondary oil recoHry not included.
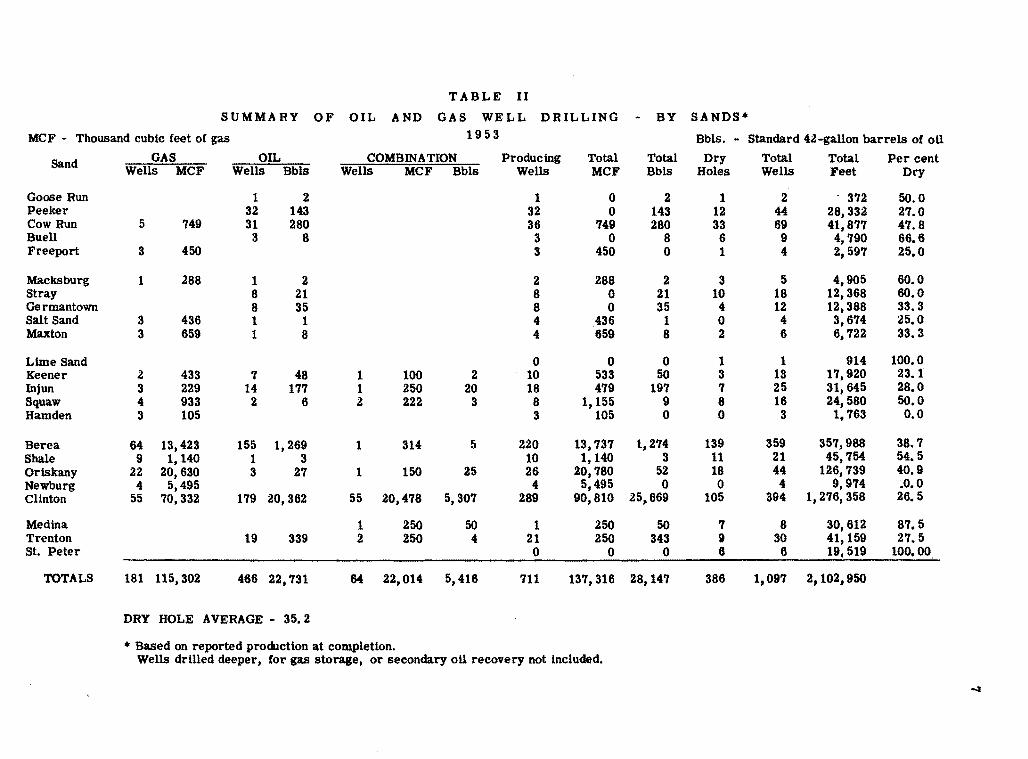
TABLE II
SUMMARY OF OIL AND GAS WELL DRILLING - BY SANDS* MCF - Thousand cubic feet of gas 1953 Bbls. - Standard 42-gallon barrels of oil
Sand GAS OIL COMBINATION Producing Total Total Dry Total Total Per cent Wells MCF Wells Bbls Wells MCF Bbls Wells MCF Bbls Holes Wells Feet Dry
Goose Run 1 2 l 0 2 l 2 - 372 50.0 Peeker 32 143 32 0 143 12 44 28,332 27.0 Cow Run 5 749 31 280 36 749 280 33 69 41,877 47.8 Buell 3 8 3 0 8 6 9 4,790 66.6 Freeport 3 450 3 450 0 1 4 2, 597 25. 0
Macksburg 1 288 1 2 2 288 2 3 5 4,905 60.0 Stray 8 21 8 0 21 10 18 12,368 60.0 Germantown 8 35 8 0 35 4 12 12,388 33.3 Salt Sand 3 436 1 1 4 436 1 0 4 3,674 25.0 Maxton 3 659 1 8 4 659 8 2 6 6, 722 33. 3
Lime Sand 0 0 0 1 l 914 100.0 Keener 2 433 7 48 1 100 2 10 533 50 3 13 17,920 23.1 lnjun 3 229 14 177 l 250 20 18 479 197 7 25 31,645 28.0 Squaw 4 933 2 6 2 222 3 8 1,155 9 8 16 24,580 50.0 Hamden 3 105 3 105 0 0 3 1,763 o.o Berea 64 13,423 155 1,269 1 314 5 220 13,737 1,274 139 359 357,988 38.7 Shale 9 1,140 1 3 10 1,140 3 11 21 45, 754 54.5 Oriskany 22 20,630 3 27 l 150 25 26 20,780 52 18 44 126, 739 40.9 Newburg 4 5,495 4 5,495 0 0 4 9,9'14 .o. 0 Clinton 55 70,332 179 20, 362 55 20,478 5,307 289 90,810 25.669 105 394 1,276,358 26. 5
Medina l 250 50 l 250 50 7 8 30,612 87.5 Trenton 19 339 2 250 4 21 250 343 g 30 41, 159 27. 5 St. Peter 0 0 0 6 6 19,519 100.00
TOTALS 181 115, 302 466 22, 731 64 22,014 5,416 711 137, 316 28,147 386 1,097 2,102,950
DRY HOLE AVERAGE - 35. 2
* Based on reported prowction at completion. Wells drilled deeper, for gas storage, or secondary oil recovery not included.
~
8
TABLE III
WELLS DRILLED DEEPER, FOR GAS STORAGE, AND SECONDARY OIL RECOVERY 1953
Wells Drilled Dee~er
Horizon
Lime to Buell Buell to Cow Run Cow Run to Macksburg Cow Run to Injun Cow Run to Berea Macksburg to Berea Germantown to Berea Lime Sand to Injun Keener to Berea Injun to Berea Berea to 2nd Berea Berea to Shale
TOTALS
Gas Storage Wells
Horizon Berea Clinton
TOTALS
Secondary Oil Recovery
Horizon Air Repressuring
Cow Run Berea
Water Flooding
Core Tests Keener
TOTALS
Number GAS OIL
1 1 2 1 1 1 1 1 2 1 1 1
14
Number 4
86 90
Input Wells
MCF
491 25
383 297
125 90
1, 411
Feet 1,590
229, 116 230,706
Number Feet
1 124 1 661
11 3,148
13 3,933
Feet Bbls. 2 1
378 633
1,945 776
4 1
10
126 1,635 5, 493 18
Producer Wells Number Feet
18 6,008
18 6,008
DRY Feet Feet
337 164
280 - 271
1,097 385
2, 149 385
Core Tests Number Feet
2 2
3, 117 3, 117

9
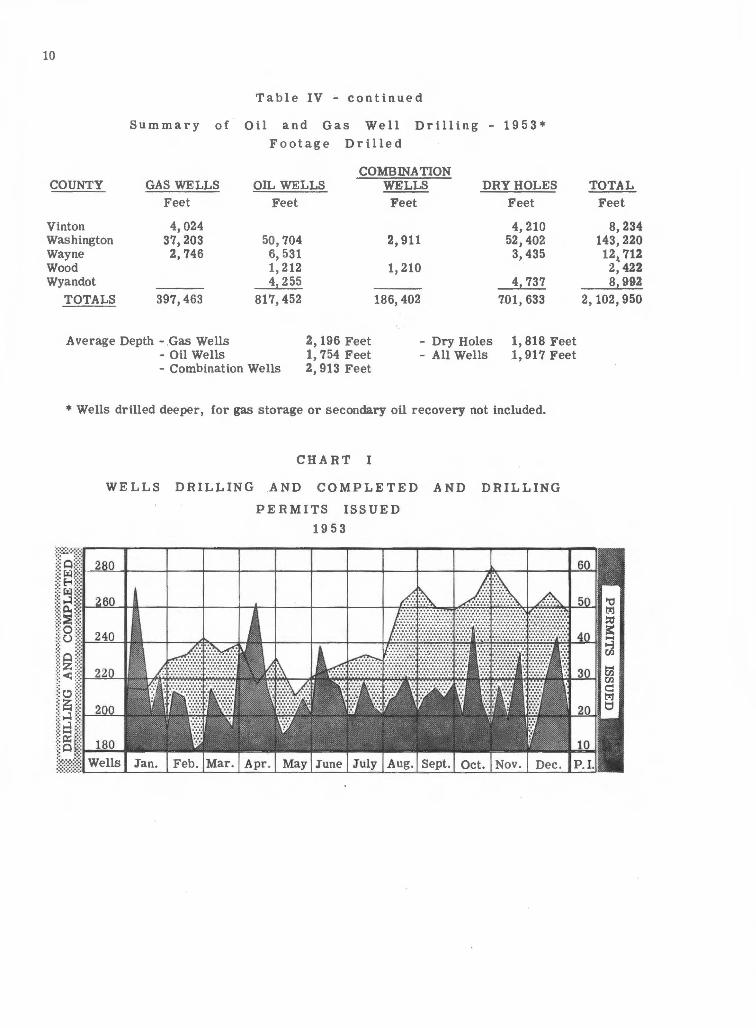
TABLE IV
SUMMARY OF OIL AND GAS WELL DRILLING 1953• FOOTAGE DRILLED
COMBINATION COUNTY GAS WELLS OIL WELLS WELLS DRY HOLES TOTAL
Feet Feet Feet Feet Feet Allen 1,322 1, 322 Ashland 61,835 42,618 104,453 Ashtabula 3,028 5,320 8,348 Athens 44,813 3,838 5,286 53,937 Auglaize 1,170 1, 170
Belmont 1,496 3,463 4,959 Carroll 1,240 4,582 5, 822 Columbiana 1,684 2,178 3, 624 7,486 Coshocton 26,983 195,729 42,295 64,336 329,343 Cuyahoga 6,730 3,450 10,180
Darke 1,217 1,217 Erie 752 752 Fairfield 2,692 2,692 Guernsey 1,313 5,902 9,881 17, 096 Hancock 1,326 1,326
Hardin 1, 345 1,345 Hocking 6,160 8,718 11, 212 26,090 Holmes 3, 973 23,535 9,502 25,366 62,376 Huron 6,734 6,734 1ackson 650 650
1efferson 2, 726 1, 351 7, 113 11, 190 Knox 36,002 228, 435 42,775 65,713 372, 925 Lake 4,540 2,982 7,522 Lawrence 9,969 5, 883 15, 852 Licking 9,648 67,812 46,214 54,252 177, 926
Logan 1, 629 1, 629 Lorain 20,257 12,733 32,990 Mahoning 245 572 817 Medina 7,702 10,875 18,577 Meigs 16,872 16,969 1, 698 13,434 48,973
Mercer 11, 661 1,208 12,869 Monroe 25,618 27,453 3, 069 32,695 88,835 Morgan 1,805 4,485 14,553 20,843 Muskingum 21,809 10,920 10, 626 46, 850 90,205 Noble 9,843 12,513 24,363 46,719
Perry 16,519 31,136 24,894 24,001 96,550 Pike 1,998 675 2, 673 Portage 4,437 4,437 Putnam 1,356 1,401 2,757 Sandusky 2,907 2,907
Scioto 1,090 400 1,490 Seneca 1,329 4,722 6,051 Stark 23,558 24,590 32,592 80,740 Summit 26, 717 23,572 50,289 Tuscarawas 28,339 55,967 84,306
10
COUNTY
Vinton Washington Wayne Wood Wyandot
TOTALS
Table IV '- continued
Summary of Oil and Gas Well Drilling - 1953• Footage Drilled
COMBINATION GAS WELLS OIL WELLS WELLS DRY HOLES
Feet Feet Feet Feet
4,024 4,210 37,203 50,704 2, 911 52,402 2,746 6,531 3,435
1,212 1,210 4, 255 41 737
397,463 817,452 186,402 701,633
Average Depth - .Gas Wells 2, 196 Feet - Dry Holes 1, 818 Feet - Oil Wells 1, 754 Feet - All Wells 1, 917 Feet - Combination Wells 2, 913 Feet
•Wells drilled deeper, for gas storage or secondary oil recovery not included.
CHART I
WELLS DRILLING .AND COMPLETED A ND DRILLING
PERMITS ISSUED 1953
TOTAL Feet
8,234 143,220 12\ 712
2,422 81 992
2, 102, 950

SANDS
Shallow Berea Ohio Shale Oriskany Newburg Clinton Medina Trenton Sub-Treriton
Total or Wts. Average
TABLE V
AVERAGE INITIAL DAILY PRODUCTION FOR WELLS COMPLETED IN 1953
BY SANDS*
GAS WELLS OIL WELLS COMBINATION
No. of Average No. of Average No. of Average Wells Initial Wells Initial Wells Initial
Daily Per Daily Per Dally Per Well-MCF Well-Bbl. Well-MCF
27 159 109 7 4 143 64 210 155 8 1 314
9 127 1 3 22 938 3 9 1 150 4 1,374
55 1,279 179 114 55 372 1 250
19 18 2 125
181 635 466 49 64 344
* Wells drilled deeper, for gas storage or secondary oil recovery not included.
11
Average Initial
Dally Per Well-Bbl.
6 5
25
96 50 2
85
12
County
Washington Totals
Total Wells Total Bbls Total Feet Per Cent Dry
Morgan Noble Washington
Totals
Total Wells Total Bbls Total Feet Per Cent Dr~
Athens Guernsey Meigs Monroe Morgan Muskingum Washington
Totals
Total Wells Total MCF Total Bbls Total Feet Per Cent Dry
Athens Noble Washington
Totals
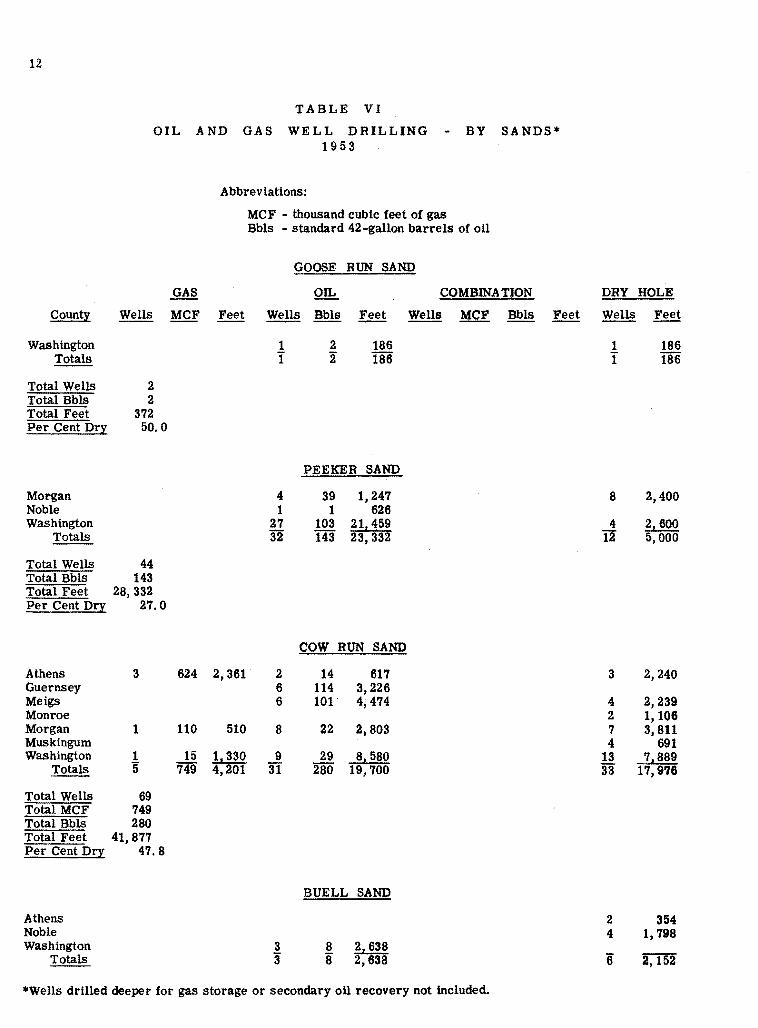
TABLE VI
OIL AND GAS WELL DRILLING 1953
BY SANDS*
Abbreviations:
MCF - thousand cubic feet of gas Bbls - standard 42-gallon barrels of oil
GOOSE RUN SAND
GAS OIL COMBINATION DRY HOLE
Wells MCF Feet Wells Bbls ~ Wells MCF Bbls Feet Wells ~
1 2 186 1 186 I 2 186 I 186
2 2
372 50.0
PEEKER SAND
4 39 1,247 8 2, 400 1 1 626
27 103 211 459 32 143 23,332
4 2, 600 12 5, 000
44 143
28,332 27.0
COW RUN SAND
3 624 2,361 2 14 617 3 2,240 6 114 3, 226 6 101 4,474 4 2,239
2 1, 106 1 110 510 8 22 2,803 7 3, 811
4 691 1 15 11 330 9 29 8,580 13 71889 5 749 4,201 31 280 19,700 33 17,976
69 749 280
41, 877 47.8
BUELL SAND
2 354 4 1, 798
3 8 2,:38 3 8 ' 6 2, 152
*Wells drilled deeper for gas storage or secondary oil recovery not included.
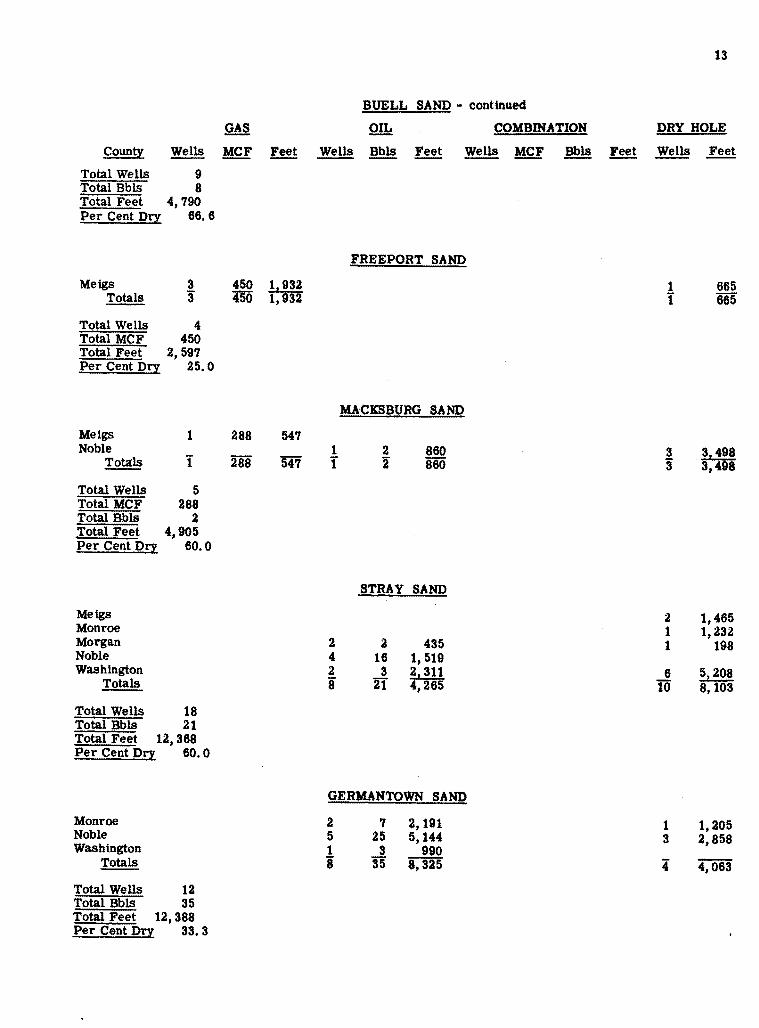
County Wells
Total Wells 9 Total Bbls 8 Total Feet 4,790 Per Cent Dry 66.6
Meigs 3 Totals 3
Total Wells 4 Total MCF 450 Total Feet 2,597 Per Cent Dry 25. 0
Meigs 1 Noble
Totals I Total Wells 5 Total MCF 288 Total Bbls 2 Total Feet 4, 905 Per Cent Dry 60. 0
Meigs Monroe Morgan Noble Washington
Totals
Total Wells 18 Total Bbls 21 Total Feet 12, 368 Per Cent Dry 60. 0
Monroe Noble Washington
Totals
Total Wells 12 Total Bbls 35 Total Feet 12, 388 Per Cent Dry 33. 3
GAS
MCF Feet
450 1,932 450 1,932
288 547
288 547
BUELL SAND - continued
OIL COMBINATION
~ Bbls Feet l!!Y!
1 I
2 4 2 8
FREEPORT SAND
MACKSBURG §AND
2 860 2 860
STRAY SAND
2 435 16 1, 519 3 2, 311
Il 4,265
GERMANTOWN SAND
2 5 1 8
7 2,191 25 5, 144 3 990
35 8, 325
MCF Bbls Feet
13
DRY HOLE
Wells
1 I
3 3
2 1 1
6 10
1 3
i
Feet
665 665
3,498 3,498
1,465 1,232
198
5,208 8,103
1,205 2,858
4,063
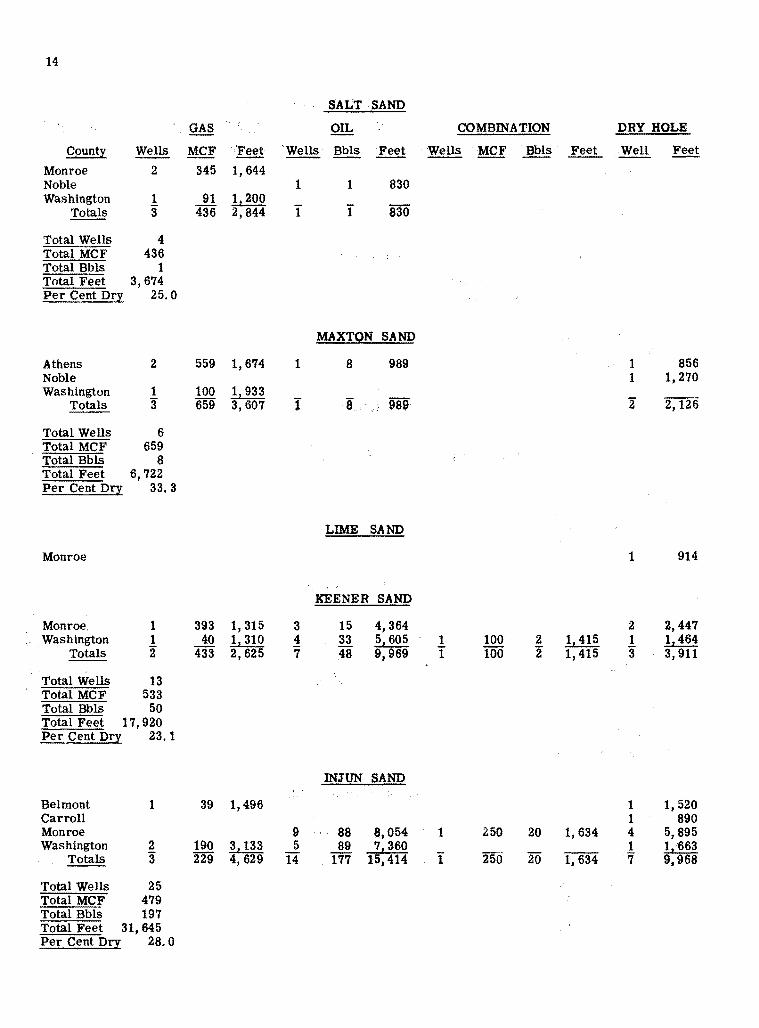
14
SALT SAND
GAS OIL COMBINATION DRY HOLE
C9unty Wells MCF ·Feet 'Wells Bbls Feet Wells M'.CF Bbls Feet Well ~ Monroe 2 345 1,644 Noble 1 1 830 Washington 1 91 1,200
Totals 3 436 2,844 I I 830
Total Wells 4 Total MCF 436 Total Bbls 1 Total Feet 3,674 Per Cent Dry 25.0
MAXTON SAND
Athens 2 559 1,674 1 8 989 1 856 Noble 1 1,270 Washington 1 100 1,933
Totals 3 659 3,607 I 8 98~ 2 2,126
Total Wells 6 Total MCF 659 Total Bbls 8 Total Feet 6,722 Per Cent Dry 33.3
LIME SAND
Monroe 1 914
KEENER SAND
Monroe, 1 393 1,315 3 15 4,364 2 2,447 Washington 1 40 1, 310 4 33 5,605 1 100 2 1, 415 1 1,464
Totals 2 433 2, 625 7 48 9,969 I 100 2 1,415 3 3, 911
Total Wells 13 Total MCF 533 Total Bbls 50 Total Feet 17,920 Per Cent Dry 23.1
INJUN SAND
Belmont 1 39 1,496 1 1, 520 Carroll 1 890 Monroe 9 88 8,054 1 250 20 1,634 4 5,895 Washington 2 190 3,133 5 89 71360 1 1, 663
Totals 3 229 4,629 14 1'17 15,414 i 250 ao 1,634 7 9,968
Total Wells 25 Total MCF 479 Total Bbls 197 Total Feet 31,645 Per Cent DrI 28.0

15
SQUAW SAND
GAS on. COMBINATION DRY HOLE County Wells MCF Feet Wells Bbls Feet Wells MCF ~ Feet ~ Feet
Guernsey 1 30 1,313 Monroe 1 2 1,402 l 147 2 1, 435 2 3,2'19 Washington 3 903 4, 624 1 4 1, 575 1 '15 1 1,496 6 91 456
Totals 4 933 5, 93'1 2 6 2,977 2 222 3 2,931 8 12,735
Total Wells 16 Total MCF 1, 155 Total Bbls 9 Total Feet 24,580 Per Cent Dry 50.0
HAMDEN SAND
Pike 1 30 391 Vinton 2 75 la372
Totals 3 105 1, '163
Total Wells 3 Total MCF 105 Total Feet 1, 763 Per Cent Dry o.o
BEREA SAND
Ashland 83 '148 61,835 44 33,85'1 Athens 12 2,438 18,559 2 30 2,232 1 1,836 Belmont 1 1,943 Carroll 1 5 1,240 3 3, 692 Columbiana 2 636 1,684 3 11 2, 1'18 3 2, 3'18 Coshocton 2 1,963 Guernsey 2 2 2,6'16 '1 9,881 Hocking 1 200 '193 3 2,458 Holmes 6 424 3,9'13 8 223 5, '118 10 '1, 135 Jackson 1 650 Jefferson 2 131 2,'126 1 5 1,351 5 '1, 113 Knox 1 260 684 1 1 805 5 3, 50'1 Licking 1 168 '13'1 15 45 10,921 1 '1'18 Lorain 1 92 Mahoning 1 1 245 1 572 Medina 19 '17 7,702 10 3,871 Meigs 7 5, 652 14,393 7 62 12,495 1 314 5 1, 698 2 3, 786 Monroe 13 592 22,659 4 23 8,322 '1 13,476 Morgan 1 107 1,295 3 4, 38'1 Muskingum 1 5 1,139 Noble 4 674 4,763 2 5 3,534 7 10,843 Perry 5 26 5,364 1 1,090 Pike 1 20 398 1 675 Scioto 3 30 1,090 1 400 Stark 3 2,616 Tuscarawas 4 1,009 4,574 9 9,064 Vinton 1 1,077 Washington 6 1,082 11, 254 5 9,377 Wayne 1 434
Totals 64 13,423 89,582 155 1,269 127, '157 r 314 5 1,698 139 138, 951
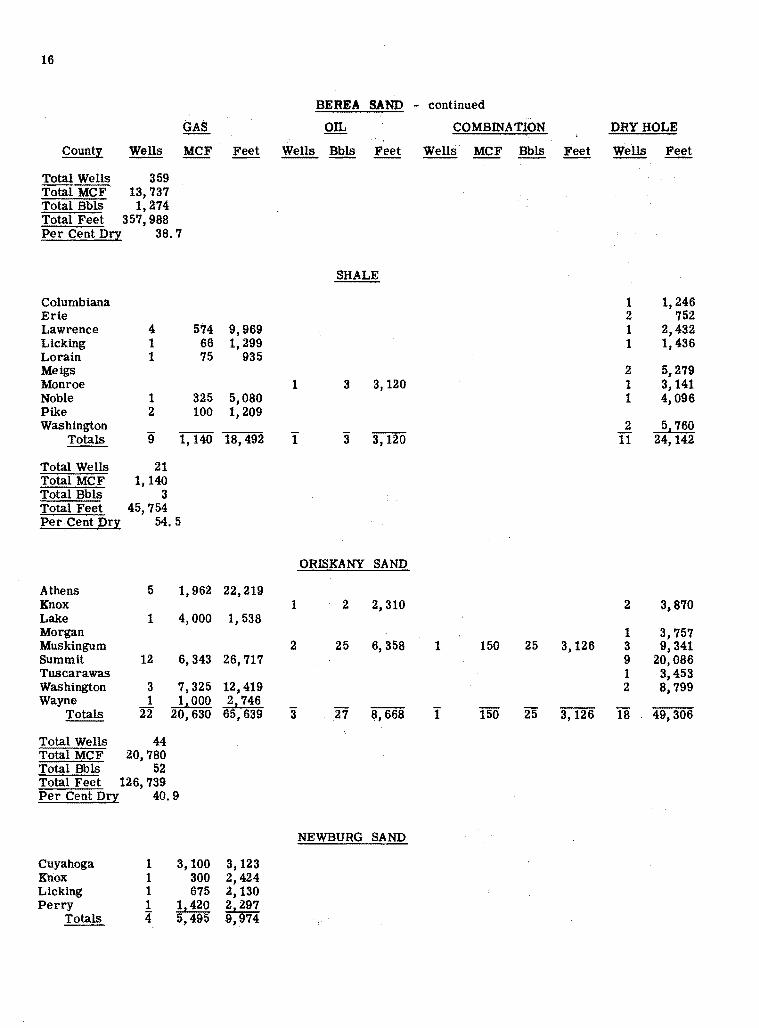
16
BEREA SAND - continued
GAS on.. COMBINATION DRY HOLE
County Wells MCF Feet· Wells Bbls Feet Wells MCF Bbls Feet Wells Feet
Total Wells 359 Total MCF 13, 737 Total Bbls 1,274 Total Feet 357,988 Per Cent Dry 38.7
SHALE
Columbiana 1 1,246 Erie 2 752 Lawrence 4 574 9,969 1 2,432 Licking 1 66 1,299 1 1,436 Lorain 1 75 935 Meigs 2 5,279 Monroe 1 3 3,120 1 3, 141 Noble 1 325 5,080 1 4,096 Pike 2 100 1,209 Washington 2 51760
Totals 9 1,140 18,492 I 3 3, 120 TI 24,142
Total Wells 21 Total MCF 1,140 Total Bbls 3 Total Feet 45,754 Per Cent Dry 54. 5
ORISKANY SAND
Athens 5 1, 962 22,219 Knox 1 2 2,310 2 3,870 Lake 1 4,000 1, 538 Morgan 1 3, 757 Muskingum 2 25 6, 358 1 150 25 3, 126 3 9,341 Summit 12 6,343 26,717 9 20,086 Tuscarawas 1 3,453 Washington 3 7,325 12,419 2 8,799 Wayne 1 11000 21746
Totals 22 20,630 65,639 3 27 8,668 I 150 25 3,126 18 49,306
Total Wells 44 Total MCF 20,780 Total Bbls 52 Total Feet 126,739 Per Cent Dry 40.9
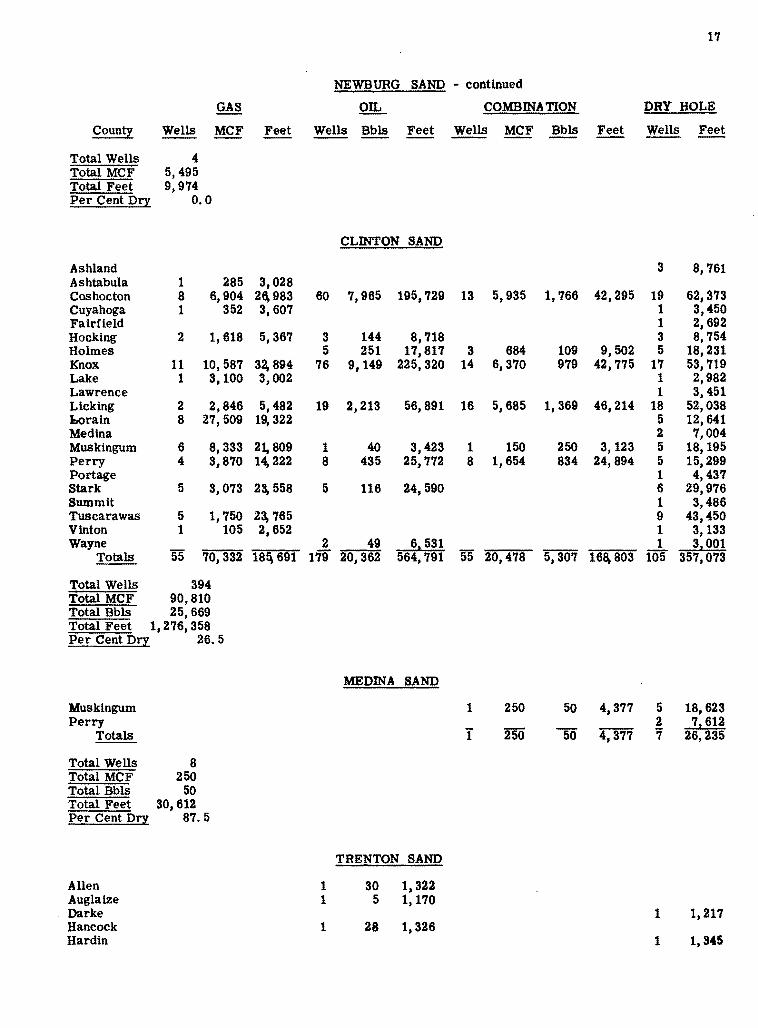
NEWBURG SAND
Cuyahoga 1 3, 100 3, 123 Knox 1 300 2,424 Licking 1 675 2,130 Perry 1 11420 2,297
Totals 4 5,495 9,974
17
NEWBURG SAND - continued
GAS OIL COMBINATION DRY HOLE
County Wells MCF Feet Wells Bbls Feet Wells MCF Bbls Feet Wells Feet -- --Total Wells 4 Total MCF 5,495 Total Feet 9, 974 Per Cent Dry 0.0
CLINTON SAND
Ashland 3 8,761 Ashtabula 1 285 3,028 Coshocton 8 6,904 26, 983 60 7,965 195,729 13 5,935 1,766 42,295 19 62,373 Cuyahoga 1 352 3,607 1 3,450 Fairfield 1 2,692 Hocking 2 1,618 5,367 3 144 8,718 3 8,754 Holmes 5 251 17,817 3 684 109 9,502 5 18,231 Knox 11 10,587 3~894 76 9,149 225,320 14 6,370 979 42,775 17 53,719 Lake 1 3,100 3,002 1 2,982 Lawrence 1 3,451 Licking 2 2,846 5,482 19 2,213 56,891 16 5,685 1,369 46,214 18 52,038 borain 8 27,509 19, 322 5 12,641 Medina 2 7,004 Muskingum 6 8,333 21, 809 1 40 3,423 1 150 250 3,123 5 18,195 Perry 4 3,870 14, 222 8 435 25, 772 8 1, 654 834 24,894 5 15,299 Portage 1 4,437 Stark 5 3,073 23, 558 5 116 24, 590 6 29,976 Summit 1 3,486 Tuscarawas 5 1, 750 23, 765 9 43,450 Vinton 1 105 2,652 1 3,133 Wayne 2 49 61 531 1 31001
Totals 55 70,332 18~ 691 179 20,362 564,791 55 20,478 5,307 168, 803 105 357,073
Total Wells 394 Total MCF 90,810 Total Bbls 25,669 Total Feet 1,276,358 Per Cent Dry 26.5
MEDINA SAND
Muskingum 1 250 50 4,377 5 18, 623 Perry 2 71612
Totals I 250 50 4,377 7 26,235
Total Wells 8 Total MCF 250 Total Bbls 50 Total Feet 30,612 Per Cent Dry 87.5
TRENTON SAND
Allen 1 30 1,322 Auglaize 1 5 1,170 Darke 1 1,217 Hancock 1 28 1,326 Hardin 1 1,345
18
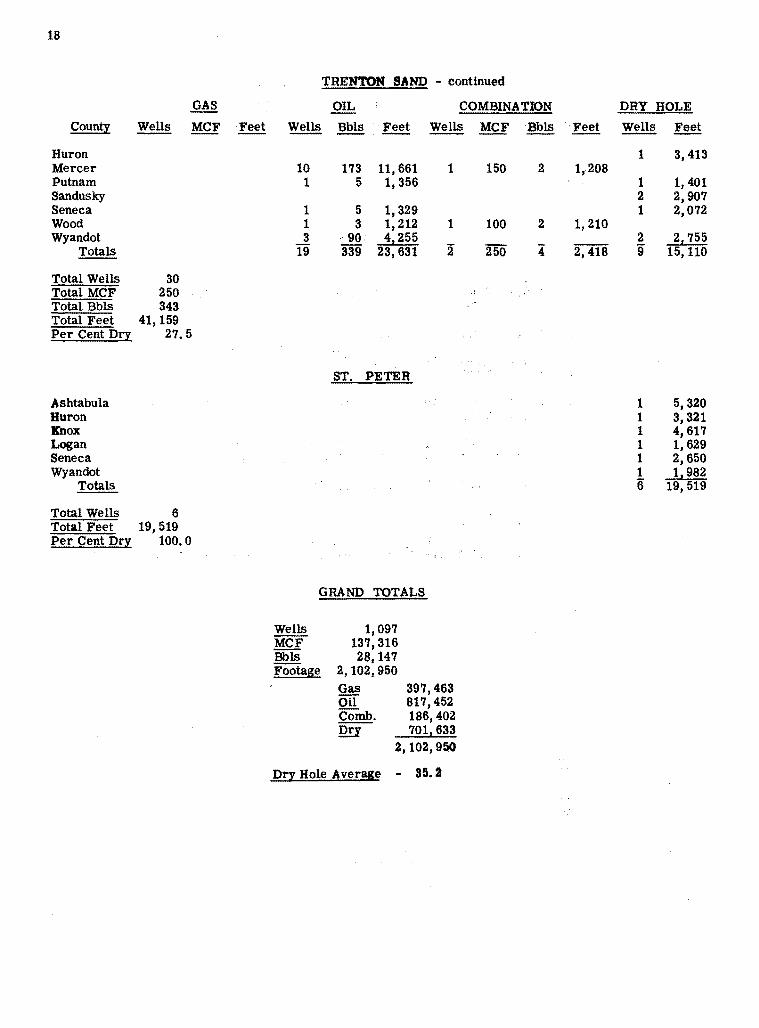
Huron Mercer Putnam Sandusky Seneca Wood Wyandot
Totals
Total Wells Total MCF Total Bbls Total Feet Per Cent Dry
Ashtabula Huron Knox Logan Seneca Wyandot
Totals
Total Wells Total Feet Per Cent Dry
TRENTON SAND - continued
COMBINATION Wells MCF Feet Wells Bbls Feet Wells MCF Bbls , Feet
30 250 343
41,159 27.5
6 19,519
100.0
10 1
1 1 3
19
173 11, 661 5 1,356
5 1,329 3 1,212
.· 90· 41255 339 23,631
ST. PETER
1
1
2
GRAND TOTALS
Wells MCF Bbls FOotage
1,097 137,316 28,147
2,102,950 Gas Oil Comb. !!!I
397,463 817,452 186,402 7011633
2,102,950
Dry Hole Average - 35. 2
150
100
250
2
2
4
1,208
1,210
2,418
DRY HOLE Wells Feet
1 3,413
1 1,401 2 2,907 1 2,072
2 21755 9 15, 110
1 5, 320 1 3, 321 1 4, 617 1 1, 629 1 2, 650 1 1, 982 6 19, 519

19
TABLE VII
OIL AND GAS WELL DRILLING BY COUNTIES 1953
Abbreviations:
MCF - Thousand cubic feet of gas - reported open flow at completion.
BQls - Barrels of oil reported for first 24 hours at completion.
Feet - Total feet (footage) drtlled.
ALLEN COUNTY
First Half Last Half Total Sand Wells MCF Bbls Feet Wells MCF Bbls ~ Wells MCF Bbls ~
Oil Wells Trenton 1 30 1,322 1 30 1,322
ASHLAND COUNTY
Oil Wells Berea 43 335 31,990 40 413 29,845 83 748 61,835
D!:l Holes Berea 22 16,602 22 17,255 44 33,857 Clinton 2 61065 1 21696 3 81 761
Totals 24 22,667 23 19,951 47 42,618
Total Wells 67 63 130 Total Bbls 335 413 748 Total Feet 54,657 49, 796 104,453 Per Cent Dr!: - 36. 7 Gas Storage Wells 44 Clinton, Total Feet: 124,411
ASHTABULA COUNTY
Gas Wells Clinton 1 285 3,028 1 285 3,028
Dry Holes St. Peter 1 5,320 1 5,320
Total Wells 1 1 2 Total MCF 285 285 Total Feet 5, 320 3,028 8,348 Per Cent Dry - 50. 0
ATHENS COUNTY
Gas Wells Cow Run 1 380 634 2 244 1, 727 3 624 2,361 Maxton 1 70 774 1 489 900 2 559 1,674 Berea 1 60 1,651 11 2,378 16,908 12 2,438 18,559 Oriskany 1 356 41275 4 1, 606 171944 5 1,962 22.219
Totals i 866 7,334 18 4,717 37,479 22 5,583 44,813

20
ATHENS COUNTY - continued
First Half Last Half Total Sand Wells MCF Bbls Feet Wells MCF Bbls Feet Wells MCF Bbls Feet
Oil Wells Cow Run 1 2 321 1 12 296 2 14 617 Maxton 1 8 989 1 8 989 Berea 1 2 990 1 28 1,242 2 30 2,232
Totals 2 4 1, 311 3 48 2, 527 5 52 3,838 --Dry Holes
Cow Run 3 2,240 3 2,240 Buell 2 354 2 354 Maxton 1 856 1 856 Berea 1 1,836 1 1,836
Totals 4 3,046 3 2,240 7 5,286
Total Wells 10 24 34 Total MCF 866 4, 717 5,583 Total Bbls 4 48 52 '.IQtal feet 11, 691 42,246 53,937 Per Cent Dry - 21. 9 Drilled Dee~er - 2 Cow Run to Berea, 383 MCF, Total Feet: 1945
1 Macksburg to 2nd Berea, 297 MCF, Total Feet: 776
AUGLAIZE COUNTY
Oil Wells Trenton 1 5 1,170 1 5 1, 170
BELMONT COUNTY
Gas Wells Injun 1 39 1,496 1 39 1,496
Dry Holes Injun 1 1,520 1 1,520 Berea 1 1,943 1 1,943
Totals 2 3,463 2 3,463
Total Wells 3 3 Total MCF 39 39 Total Feet 4, 959 4,959 Per Cent Dry - 66. 6
CARROLL COUNTY
Oil Wells Berea 1 5 1,240 1 5 1,240
Dry Holes Injun 1 890 1 890 Berea 3 3,692 3 3,692
Totals 4 4,582 4 4,582
Total Wells 4 1 5 Total Bbls 5 5 Total Feet 4,582 1,240 5,822 Per Cent Dry - 80. 0

21
COLUMBIANA COUNTY
First Half Last Half Total Sand Wells MCF Bbls Feet Wells MCF Bbls Feet Wells MCF Bbls Feet
Gas Wells Berea 1 536 907 1 100 777 2 636 1,684
Oil Wells Berea 1 3 672 2 8 1,506 3 11 2,178
Dr;y: Holes Berea 1 793 2 1,585 3 2,378 Shale 1 1,246 1 1,246
Totals I 793 3 2,831 4 3,624
Total Wells 3 6 9 Total MCF 536 100 636 Total Bbls 3 8 11 Total Feet 2, 372 5, 114 7,486 Per Cent Orr - 44. 4 Gas Storage Wells - 4 Berea, Total Feet: 1,590 Air Repressuring Wells - 1 Berea Input, Total Feet: 661
COSHOCTON COUNTY
Gas Wells Clinton 4 3,334 12,861 4 3,570 14,122 8 6,904 26,983
Oil Wells Clinton 31 2,526 100,615 29 5,439 95, 114 60 7,965 195,729
Combination .Wells Clinton 7 3,743 428 22,695 6 2,192 1,338 19,600 13 5, 935 1, 766 42,295
Dr;y: Holes Berea 2 1,963 2 1,963 Clinton 8 261116 11 361 257 19 621373
Totals 10 28,079 IT 36,257 21 64, 336 --Total Wells 52 50 102 Total MCF 7,077 5,762 12,839 Total Bbls 2,954 6,777 9,731 Total Feet 164,250 165,093 329,343 Per Cent Dry - 20. 8
CUYAHOGA COUNTY
Gas Wells Newburg 1 3, 100 3, 123 1 3,100 3,123 Clinton 1 352 3,607 1 352 31607
Totals I 3,452 6,730 2 3,452 6,730 Dr;f Holes
Clinton 1 3,450 1 3,450 Total Wells 2 1 3 Total MCF 3, 452 3,452 Total Feet 6,730 3,450 10,180 Per Cent Dry - 33. 8

22
DARKE COUNTY
First Half Last Half Total Sand Wells MCF Bbls Feet Wells MCF Bbls Feet Wells MCF Bbls Feet
Dry Holes Trenton 1 1,217 1 1,217
ERIE COUNTY
Dry Holes Shale 2 752 2 752
FAIRFIELD COUNTY
Dr;t Holes Clinton • 1 2,692 1 2,692
GUERNSEY COUNTY
Gas Wells Squaw 1 30 1,313 1 30 1,313
Oil Wells Cow Run 6 114 3,226 6 114 3,226 Berea 1 1 1,314 1 1 1,362 2 2 2,676
Totals I I 1,314 7 115 4,588 8 116 5,902
Dry Holes Berea 3 4,663 4 5, 218 7 9,881
Total Wells 5 11 16 Total MCF 30 30 Total Bbls 1 115 116 Total Feet 7,290 9,806 17,096 Per Cent Dry - 43. 8
HANCOCK COUNTY
Oil Wells Trenton 1 28 1,326 1 28 1, 326
HARDIN COUNTY
Dry Holes Trenton 1 1,345 1 1,345
HOCKING COUNTY
Gas Wells Berea 1 200 793 1 200 793 Clinton 2 1,618 5,367 2 1,618 5,367
Totals 2 1,618 5,367 I 200 793 3 1, 818 6,160
Oil Wells Clinton 3 144 8, 718 3 144 8,718
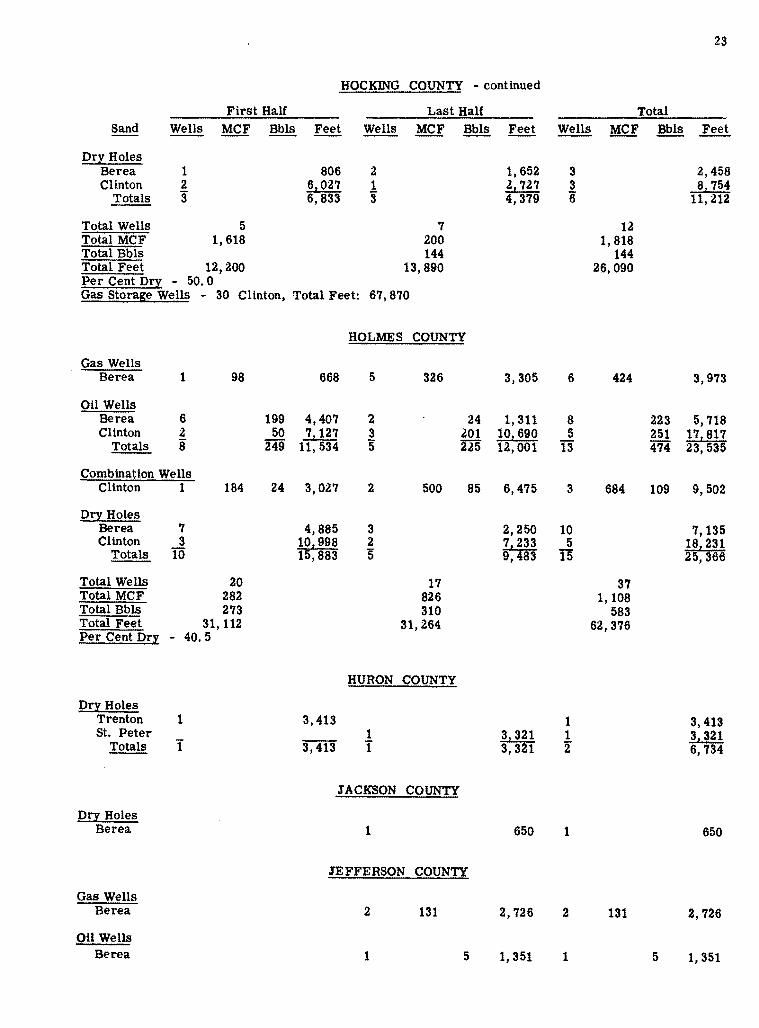
23
HOCKING COUNTY - continued
First Half Last Half Total Sand Wells MCF Bbls ~ Wells MCF Bbls Feet Wells MCF Bbls Feet
Drl: Holes Berea 1 806 2 1,652 3 2,458 Clinton 2 6,027 1 l,727 3 8,754
Totals 3 6,833 3 4,379 6 11, 212
Total Wells 5 7 12 Total MCF 1,618 200 1,818 Total Bbls 144 144 Total Feet 12,200 13,890 26, 090 Per Cent Dry - 50. 0 Gas Storage Wells - 30 Clinton, Total Feet: 67,870
HOLMES COUNTY
Gas Wells Berea 1 98 668 5 326 3,305 6 424 3,973
Oil Wells Berea 6 199 4,407 2 24 1, 311 8 223 5, 718 Clinton 2 50 7,127 3 201 101690 5 251 171 817
Totals 8 249 11, 534 5 225 12, 001 13 474 23,535
Combination Wells Clinton 1 184 24 3,027 2 500 85 6,475 3 684 109 9,502
Dry Holes Berea 7 4,885 3 2,250 10 7,135 Clinton 3 1g.998 2 7,f33 5 18,231 ~ 10 1 ,883 5 ' 83 15 25, 366
Total Wells 20 17 37 Total MCF 282 826 1,108 Total Bbls 273 310 583 Total Feet 31, 112 31,264 62,376 Per Cent Dry - 40. 5
HURON COUNTY
Dr:t: Holes Trenton 1 3,413 1 3, 413 St. Peter 1 3,321 1 3, 321
Totals I 3,413 I 3,321 2 6,734
1ACKSON COUNTY
Dry Holes Berea 1 650 1 650
JEFFERSON COUNTY
Gas Wells Berea 2 131 2, 726 2 131 2,726
Oil Wells Berea 1 5 1, 351 1 5 1,351
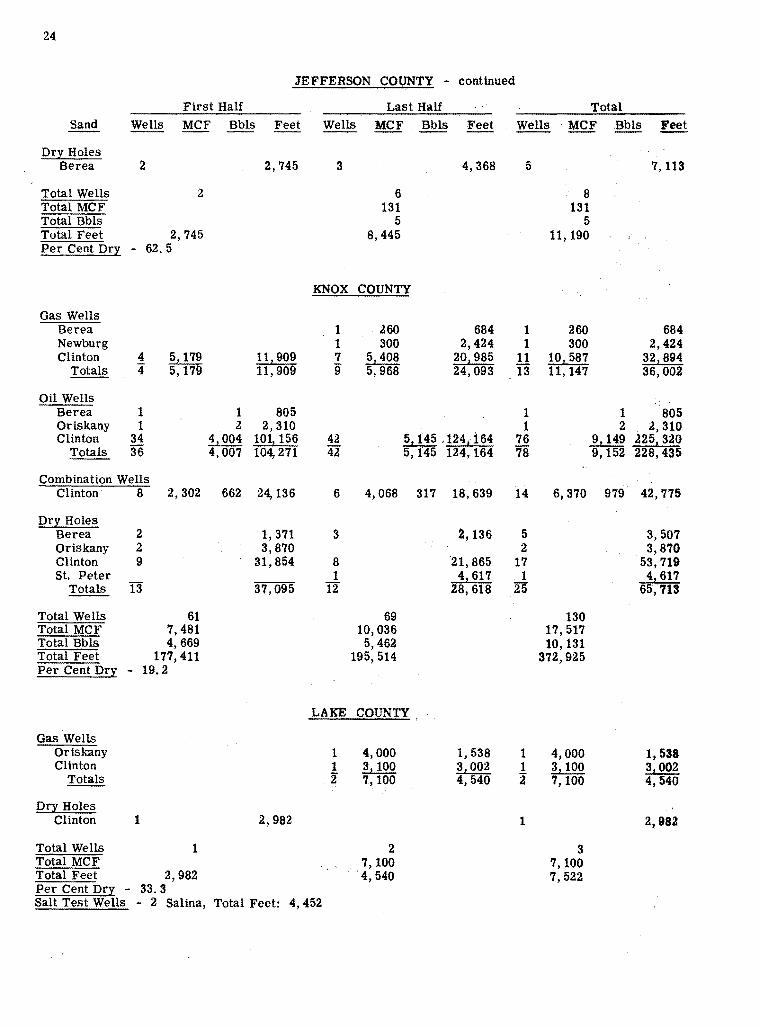
24
JEFFERSON COUNTY - continued
First Half Last Half Total Sand Wells MCF Bbls Feet Wells MCF Bbls Feet ~ ---- · MCF Bbls Feet
Dr:t Holes Berea 2 2,745 3 4,368 5 7,113
Total Wells 2 6 8 Total MCF 131 131 Total Bbls 5 5 Total Feet 2,745 8, 445 11, 190 Per Cent Dry - 62. 5
KNOX COUNTY
Gas Wells Berea 1 260 684 1 260 684 Newburg 1 300 2,424 1 300 2,424 Clinton 4 5,179 11! 909 7 5,408 201985 11 10, 587 32,894
Totals 4 5, 179 11, 909 9 5,968 24,093 13 11, 147 36,002
Oil Wells Berea 1 1 805 1 1 805 Oriskany 1 2 2, 310 1 2 2,310 Clinton 34 4,004 101156 42 5, 145 ,124, i64 76 9,149 2251 320
Totals 36 4,007 104, 271 42 5, f45 124, 164 78 9,152 228,435
Combination Wells Clinton 8 2,302 662 24, 136 6 4,068 317 18,639 14 6,370 979 42,775
Dr:t Holes Berea 2 1,371 3 2,136 5 3,507 Oriskany 2 3,870 2 3,870 Clinton 9 31,854 8 21,865 17 53,719 St. Peter 1 4,617 1 41 617
Totals 13 37, 095 12 28,618 25 65,713 ---Total Wells 61 69 130 Total MCF 7,481 10,036 17,517 Total Bbls 4,669 5,462 10,131 Total Feet 177,411 195,514 372,925 Per Cent Dry - 19.2
LAKE COUNTY
Gas Wells Oriskany 1 4,000 1,538 1 4,000 1,538 Clinton 1 31100 31002 1 3, 100 3,002
Totals 2 7, 100 4,540 :a 7, 100 4,540
Dr;t Holes Clinton 1 2,982 1 2,982
Total Wells 1 2 3 Total MCF 7,100 7,100 Total Feet 2,982 4,540 7,522 Per Cent Dr:t - 33. 3 Salt Test Wells - 2 Salina, Total Feet: 4, 452
Sand
Gas Wells Shale
Dry Holes Shale Clinton
Totals
4
1 1 l
First Half
574
Total Wells 6 Total MCF 574 Total Feet 15, 852 Per Cent Dry - 33. 3
LAWRENCE COUNTY
9,969
2,432 3,451 5,883
Last Half
Drilled Deeper - 1 Berea to Shale, 90 MCF, Total Feet: 1,635 Brine Test Wells - 1 Niagara, Total Feet: 2, 340
Gas Wells Berea Shale 1 66 Newburg Clinton 2 2,846
Totals 3 2,912
Oil Wells Berea 7 Clinton 6
Totals I3
Combination Wells Clinton
Dry Holes Berea Shale Clinton
Totals
Total Wells Total MCF Total Bbls Total Feet Per Cent Dry
Dry Holes St. Peter
Gas Wells Shale
8 2,645
1
11 12
36 5,557 1,122
85, 714 - 26. 6
1
LICKING COUNTY
1 168 1,299
1 675 5,482 6,781 2 843
22 5,410 8 23 426 18:187 13 1:787 448 23,597 2I 1,810
674 22,728 8 3,040 695
778 1
311830 7 32,608 8
39 3,883 2,505
92,212
LOGAN COUNTY
1,629
LORAIN COUNTY
1 75
25
Total
4 574 9,969
1 2,432 1 3,451 2 5,883
6 574
15,852
737 1 168 737 1 66 1,299
2,130 1 675 2,130 2 2,846 5,482
2,867 5 3,755 9,648
5, 511 15 45 10, 921 381704 19 2,2~3 561891 44,215 34 2, 8 67,812
23,486 16 5,685 1,369 46,214
1 778 1,436 1 1,436
201208 18 521038 21,644 20 54,252
75 9,440 3, 627
177,926
1 1,629
935 1 75 935
26
LORAIN COUNTY - continued
First Half Last Half Sand
Clinton Totals
Dry Holes Berea Clinton
Totals
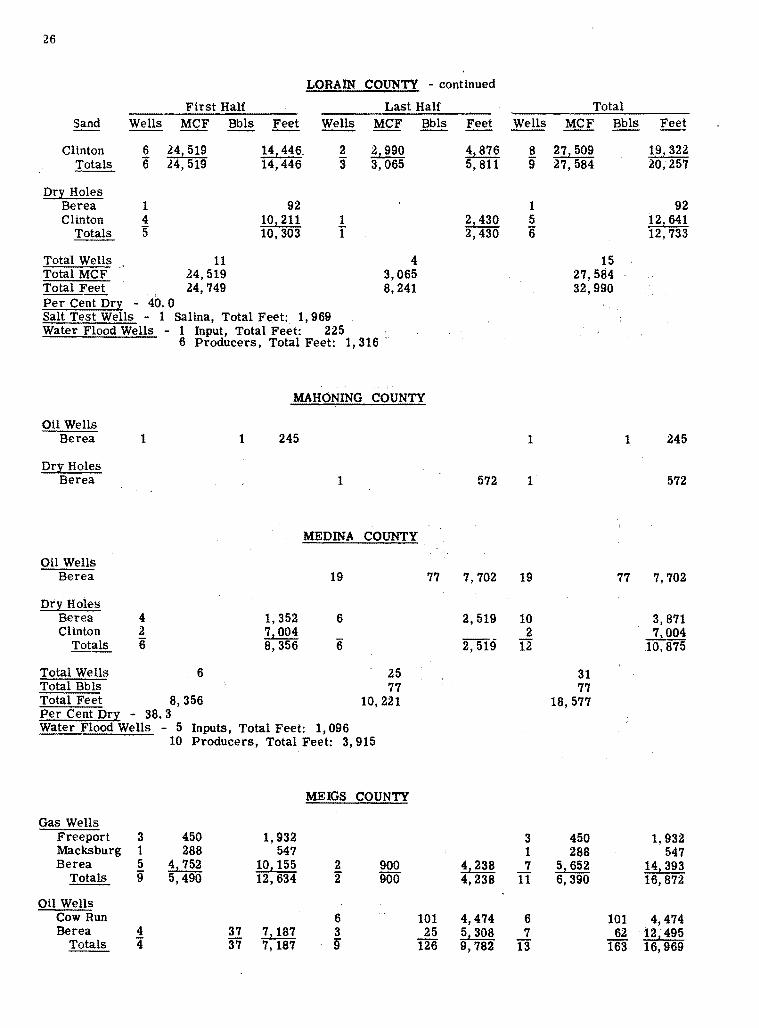
Total Wells Total MCF Total Feet
Wells
6 6
1 4 5
MCF
H,519 .!4,519
11 24,519 24,749
Per Cent Dry - 40. 0
Bbls ~
14! 446. 14,446
92 10, 211 10,303
Wells
2 3
1 I
Salt Test Wells - 1 Salina, Total Feet: 1, 969 Water Flood Wells - 1 Input, Total Feet: 225
MCF
2,990 3,065
4 3,065 8,241
6 Producers, Total Feet: 1, 316 -
Bbls
MAHONING COUNTY
Oil Wells Berea
Dry Holes Berea
Oil Wells Berea
Dry Holes
1
Berea 4 Clinton 2
Totals 6 --Total Wells 6 Total Bbls Total Feet 8, 356 Per Cent Dry - 38. 3
1 245
1
MEDINA COUNTY
19
1,352 6 7,004 8,356 6
25 77
10, 221
Water Flood Wells - 5 Inputs, Total Feet: 1, 096 10 Producers, Total Feet: 3, 915
MEIGS COUNTY
Gas Wells Freeport 3 450 1,932 Macksburg 1 288 547 Berea 5 4,752 101155 2 900
Totals 9 5,490 12, 634 2 900
Oil Wells Cow Run 6 Berea 4 37 7,187 3
Totals 4 37 7,187 9 --
77
101 25
126
Feet
4,876 5, 811
2,430 2,430
572
7,702
2,519
2,519
4,238 4,238
4,474 5,308 9,782
Wells
8 9
1 5 6
1
1
19
10 2
12
3 1 7
IT
6 7
13
Total MCF Bbls
27 2 509 27,584
15 27,584 32,990
1
77
31 77
18,577
450 288
52 652 6,390
101 62
163
Feet
19!322 20,257
92 12,641 12,733
245
572
7,702
3,871 71 004
10,875
1,932 547
141 393 16,872
4,474 121495 16, 969
27
MEIGS COUNTY - continued
First Half Last Half Total Wells MCF 13bls Feet Wells MCF Bbls Feet
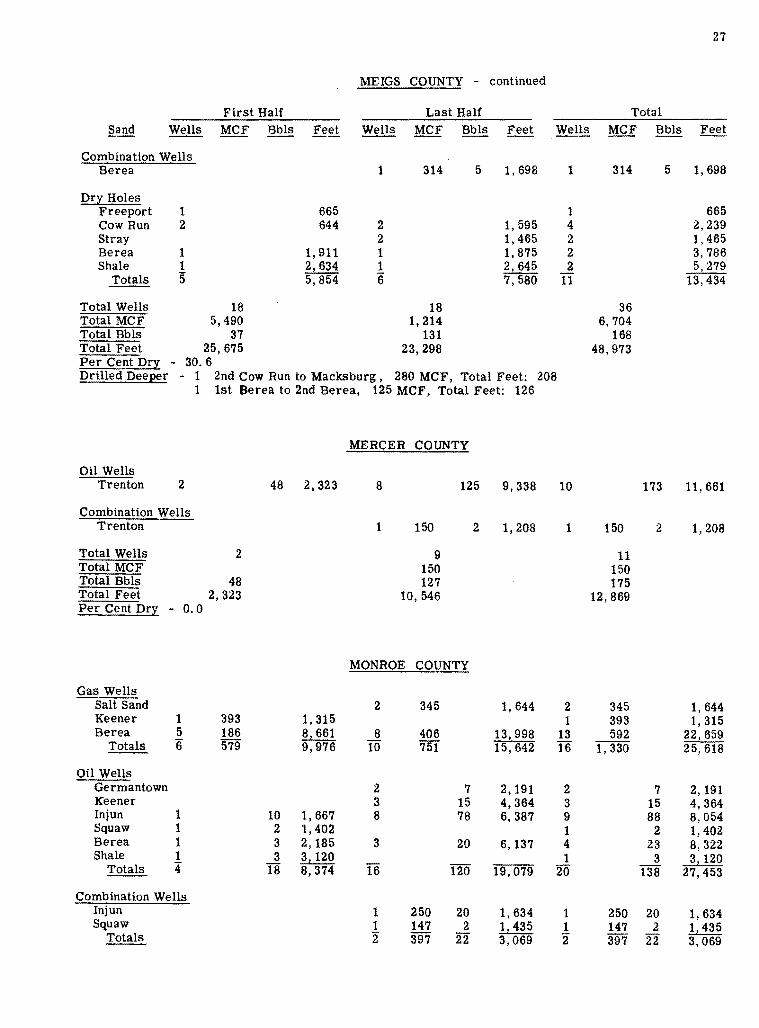
Combination Wells Berea 1 314 5 1,698 1 314 5 1,698
Dr;[ Holes Freeport 1 665 1 665 Cow Run 2 644 2 1,595 4 2,239 Stray 2 1,465 2 1,465 Berea 1 1,911 1 1,875 2 3,786 Shale 1 2,634 1 2,645 2 5,279
Totals 5 5,854 6 7,580 TI 13,434
Total Wells 18 18 36 Total MCF 5,490 1,214 6,704 Total Bbls 37 131 168 Total Feet 25,675 23,298 48,973 Per Cent Dr;[ - 30. 6 Drilled Deeper - 1 2nd Cow Run to Macksburg , 280 MCF, Total Feet: 208
1 1st Berea to 2nd Berea, 125 MCF, Total Feet: 126
MERCER COUNTY
Oil Wells Trenton 2 48 2,323 8 125 9,338 10 173 11, 661
Combination Wells Trenton 1 150 2 1,208 1 150 2 1,208
Total Wells 2 9 11 Total MCF 150 150 Total Bbls 48 127 175 Total Feet 2,323 10, 546 12,869 Per Cent Dry - 0. 0
MONROE COUNTY
Gas Wells Salt Sand 2 345 1,644 2 345 1,644 Keener 1 393 1,315 1 393 1,315 Berea 5 186 8,661 8 406 13!998 13 592 22,659
Totals 6 579 9,976 10 751 15,642 16 1,330 25, 618
Oil Wells Germantown 2 7 2,191 2 7 2, 191 Keener 3 15 4,364 3 15 4, 364 Injun 1 10 1,667 8 78 6,387 9 88 8,054 Squaw 1 2 1,402 1 2 1,402 Berea 1 3 2, 185 3 20 6,137 4 23 8,322 Shale 1 3 3, 120 1 3 3, 120
Totals 4 18 8,374 16 120 19,079 20 138 27,453
Combination Wells Injun 1 250 20 1,634 1 250 20 1,634 Squaw 1 147 2 1,435 1 147 2 1!435
Totals 2 397 22 3,069 2 397 22 3,069
28
MONROE COUNTY - continued
First Half Last Half
Drl'. Holes Cow Run 2 1, 106 Germantown 1 1,205 Stray 1 1,232 Lime Sand 1 Keener 2 Injun 1 1,300 3 Squaw 1 1,468 1 Berea 5 9,665 2 Shale 1 2.141
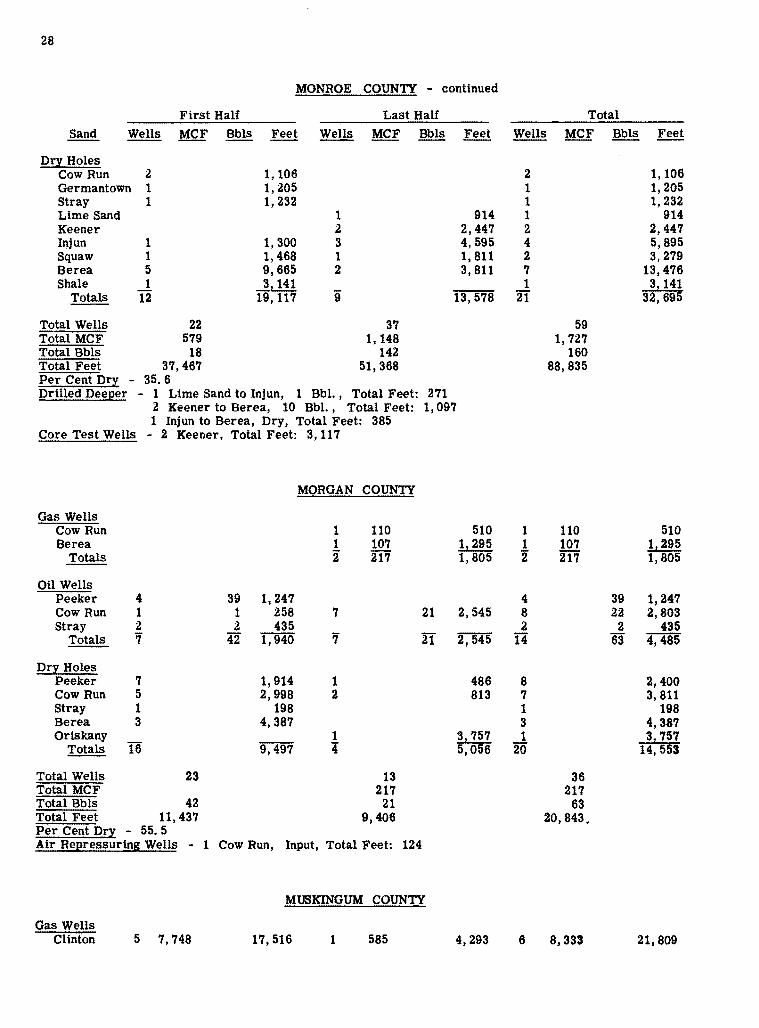
Totals 12 19, 117 9 Total Wells 22 37 Total MCF 579 1, 148 Total Bbls 18 142 Total Feet 37, 467 51, 368 Per Cent Dry - 35, 6 Drilled Deeper - 1 Lime Sand to lnjun, 1 Bbl. , Total Feet: 271
2 1 1
914 1 2, 447 2 4, 595 4 1, 811 2 3, 811 7
1 13,578 2I
2 Keener to Berea, 10 Bbl., Total Feet: 1, 097 1 Injun to Berea, Dry, Total Feet: 385
Core Test Wells - 2 Keener, Total Feet: 3, 117
Gas Wells Cow Run Berea
Totals
Oil Wells Peeker 4 Cow Run 1 Stray 2
Totals 7
Dr! Holes Peeker 7 Cow Run 5 Stray 1 Berea 3 Oriskany
Totals 16
Total Wells 23 Total MCF Total Bbls 42 Total Feet 11,437 Per Cent Drl'. - 55. 5 Air Re2ressuring Wells - 1
Gas Wells Clinton 5 7, 748
MORGAN COUNTY
1 110 1 107 2 217
39 1,247 1 258 7 21 2 435
42 1,940 7 21
1,914 1 2,998 2
198 4,387
1 9,497 4
13 217
21 9,406
Cow Run, Input, Total Feet: 124
MUSKINGUM COUNTY
17,516 1 585
510 1 1,295 1 1,805 2
4 2,545 8
2 2,545 14
486 8 813 7
1 3
3,757 1 5,056 20
4,293 6
59 1, 727
160 88,835
110 107 217
36 217
63
Total
39 22 2
63
20,843.
8,333
1,106 1,205 1,232
914 2,447 5,895 3,279
13,476 3, 141
32,695
510 1,295 1,805
1,247 2,803
435 4,485
2,400 3, 811
198 4,387 3z757
14,553
21,809
29
MUSKJNGUM COUNTY - continued
First Half Last Half Total Sand Wells MCF Bbls Feet Wells MCF Bbl.S Feet Wells MCF Bbls Feet
Oil Wells Berea 1 5 1, 139 1 5 1,139 Oriskany 1 10 3,330 1 15 3,028 2 25 6,358 Clinton 1 40 3,423 1 40 3!423
Totals 2 50 6,753 2 20 4,167 4 70 10,920
Combination Wells Oriskany 1 150 25 3,126 1 150 25 3, 126 Clinton 1 150 250 3,123 1 150 250 3,123 Medina 1 250 50 4,377 1 250 50 4!377
Totals 2 400 300 7,500 I 150 25 3, 126 3 550 325 10,626
DrJ>: Holes Cow Run 4 691 4 691 Oriskany 3 9, 341 3 9,341 Clinton 5 18,195 5 18,195 Medina 2 71733 3 101890 5 18,623 ~ 10 35,269 7 11, 581 17 46,850
Total Wells 19 11 30 Total MCF 8,148 735 8,883 Total Bbls 350 45 395 Total Feet 67,038 23,167 90,205 Per Cent Dry - 56. 6
NOBLE COUNTY Gas Wells
Berea 1 24 1,434 3 650 3,329 4 674 4,763 Shale 1 325 5,080 1 325 5,080
Totals I 24 1,434 4 975 8,409 5 999 9,843 --Oil Wells
Peeker 1 1 626 1 1 626 Stray 1 2 242 3 14 1,277 4 16 1,519 Macksburg 1 2 860 1 2 860 Germantown 4 22 4,216 1 3 928 5 25 5, 144 Salt Sand 1 1 830 1 1 830 Berea 2 5 3,534 2 5 3!534
Totals 6 26 5,318 8 24 7,195 14 50 12,513
Dr:i: Holes Buell 3 1, 603 1 195 4 1,798 Macksburg 3 3,498 3 3,498 Germantown 1 922 2 1,936 3 2,858 Maxton 1 1,270 1 1,270 Berea 1 1,595 6 9,248 7 10,843 Shale 1 41 096 1 4!096
Totals 9 11, 714 10 12,649 19 24,363 Total Wells 16 22 38 Total MCF 24 975 999 Total Bbls 26 24 50 Total Feet 18,466 28,253 46,719 Per Cent Dr:i: - 50. 0
30
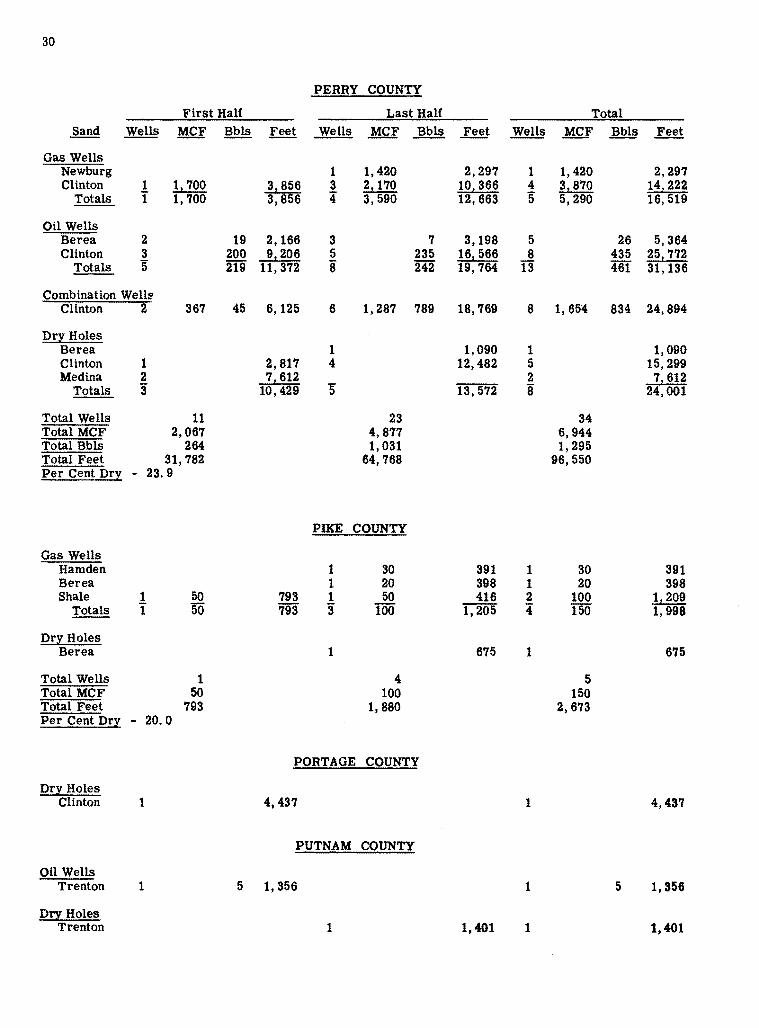
PERRY COUNTY
First Half Last Half Total Sand Wells MCF Bbls Feet Wells MCF Bbls Feet Wells MCF Bbls Feet
Gas Wells Newburg 1 1,420 2,297 1 1,420 2,297 Clinton 1 1,700 3,8~6 3 2,170 101366 4 3,870 141 222
Totals I 1,700 3,8 6 4 3,590 12,663 5 5,290 16,519
Oil Wells Berea 2 19 2,166 3 7 3,198 5 26 5,364 Clinton 3 200 9,206 5 235 161 566 8 435 25 1 772
Totals 5 219 11, 372 8 242 19,764 13 461 31,136
Combination Wells Clinton 2 367 45 6,125 6 1,287 789 18,769 8 1, 65'4 834 24,894
Drl'. Holes Berea 1 1,090 1 1,090 Clinton 1 2,817 4 12,482 5 15,299 Medina 2 71 612 2 71 612
Totals 3 10, 429 5 13,572 8 24,001
Total Wells 11 23 34 Total MCF 2,067 4,877 6,944 Total Bbls 264 1,031 1,295 Total Feet 31,782 64,768 96,550 Per Cent Drl'. - 23. 9
PIKE COUNTY
Gas Wells Hamden 1 30 391 1 30 391 Berea 1 20 398 1 20 398 Shale 1 50 793 1 50 416 2 100 1,209
Totals I 50 793 3 100 1,205 4 150 1,998
Dr! Holes Berea 1 675 1 675
Total Wells 1 4 5 Total MCF 50 100 150 Total Feet 793 1,880 2,673 Per Cent Dry - 20. 0
PORTAGE COUNTY
Dr! Holes Clinton 1 4,437 1 4,437
PUTNAM COUNTY
Oil Wells Trenton 1 5 1,356 1 5 1,356
Dcy Holes Trenton 1 1,401 1 1,401
31
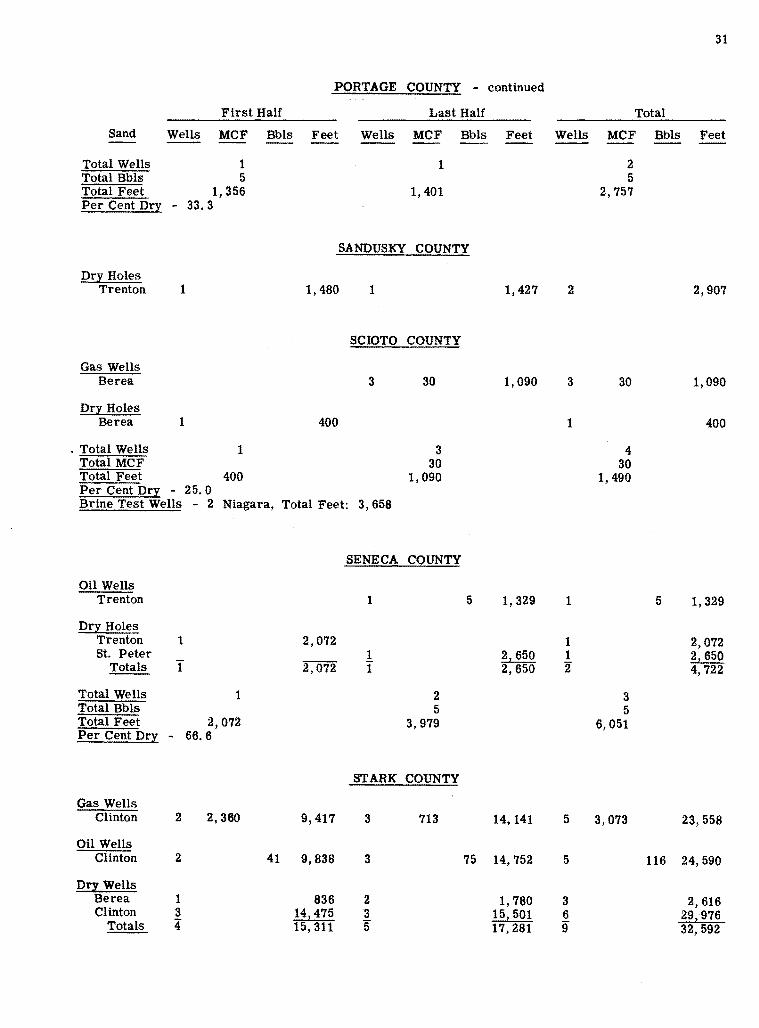
PORTAGE COUNTY - continued
First Half Last Half Total Sand Wells MCF Bbls Feet Wells MCF Bbls Feet Wells MCF Bbls Feet
Total Wells 1 1 2 Total Bbls 5 5 Total Feet 1,356 1,401 2,757 Per Cent Dry - 33. 3
SANDUSKY COUNTY
Dri Holes Trenton 1 1,480 1 1,427 2 2,907
SCIOTO COUNTY
Gas Wells Berea 3 30 1,090 3 30 1,090
Dri Holes Berea 1 400 1 400
• Total Wells 1 3 4 Total MCF 30 30 Total Feet 400 1,090 1, 490 Per Cent D!:1 - 25. 0 Brine Test Wells - 2 Niagara, Total Feet: 3, 658
SENECA COUNTY
Oil Wells Trenton 1 5 1,329 1 5 1,329
Dry Holes Trenton 1 2,072 1 2,072 St. Peter 1 2,650 1 2,650
Totals I 2,072 I 2,650 2 4,722
Total Wells 1 2 3 Total Bbls 5 5 Total Feet 2,072 3,979 6,051 Per Cent D!:1 - 66.6
STARK COUNTY
Gas Wells Clinton 2 2, 360 9,417 3 713 14, 141 5 3,073 23,558
Oil Wells Clinton 2 41 9,838 3 75 14,752 5 116 24,590
D!:1 Wells Berea 1 836 2 1,780 3 2,616 Clinton 3 14!475 3 15!501 6 29 2 976
Totals 4 15, 311 5 17,281 9 32,592
32
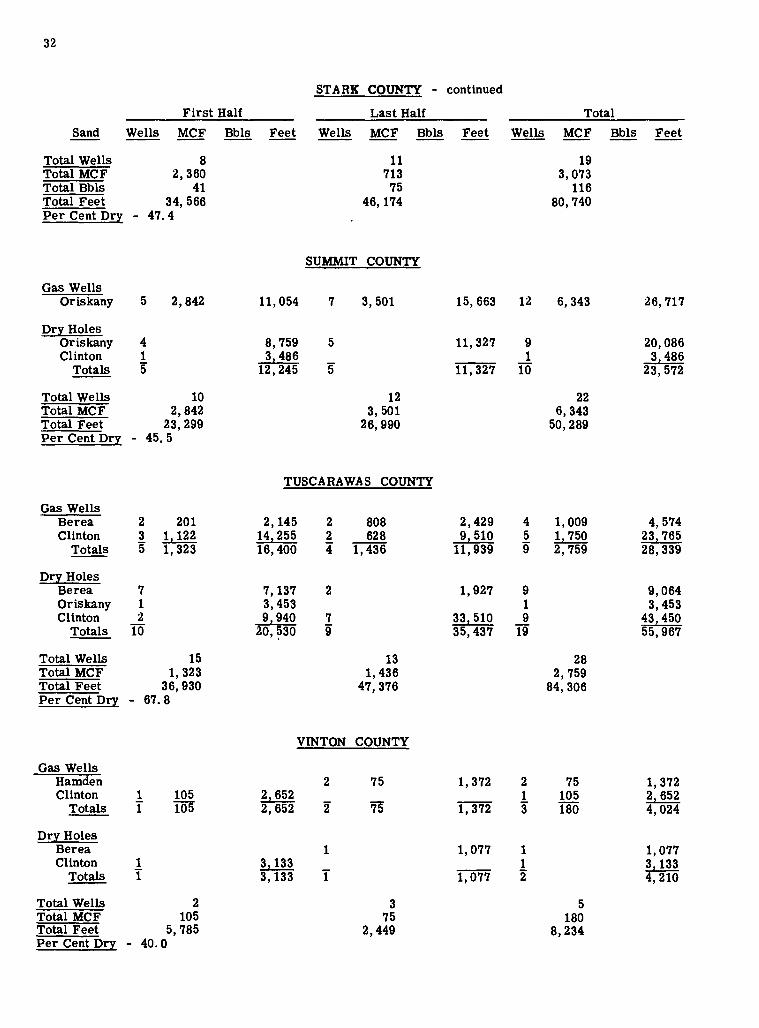
STARK COUNTY - continued
First Half Last Half Total Sand Wells MCF Bbls Feet Wells MCF Bbls Feet Wells MCF Bbls Feet
Total Wells 8 11 19 Total MCF 2,360 713 3,073 Total Bbls 41 75 116 Total Feet 34,566 46, 174 80,740 Per Cent Dry - 47. 4
SUMMIT COUNTY
Gas Wells Oriskany 5 2,842 11, 054 7 3,501 15,663 12 6,343 26, 717
Dr:y: Holes Oriskany 4 8,759 5 11, 327 9 20,086 Clinton 1 31486 1 3,486
Totals 5 12,245 5 11, 327 10 23,572
Total Wells 10 12 22 Total MCF 2,842 3,501 6,343 Total Feet 23,299 26,990 50,289 Per Cent Dry - 45. 5
TUSCARAWAS COUNTY
Gas Wells Berea 2 201 2,145 2 808 2,429 4 1,009 4,574 Clinton 3 1,122 141255 2 628 91510 5 1,750 231765
Totals 5 1,323 16,400 4 1,436 11, 939 9 2,759 28,339
Dr:y: Holes Berea 7 7,137 2 1,927 9 9,064 Oriskany 1 3,453 1 3,453 Clinton 2 91 940 7 331510 9 431450
Totals 10 20,~30 9 35,437 19 55,967
Total Wells 15 13 28 Total MCF 1,323 1,436 2,759 Total Feet 36,930 47,376 84,306 Per Cent Dry - 67. 8
VINTON COUNTY
Gas Wells Hamden 2 75 1,372 2 75 1,372 Clinton 1 105 21652 1 105 21652
Totals I 105 2,652 2 75 1,372 3 180 4,024
Dr:y: Holes Berea 1 1,077 1 1,077 Clinton 1 31133 1 31133
Totals I 3,133 I 1,077 2 4,210
Total Wells 2 3 5 Total MCF 105 75 180 Total Feet 5,785 2,449 8,234 Per Cent Dr:y: - 40. 0
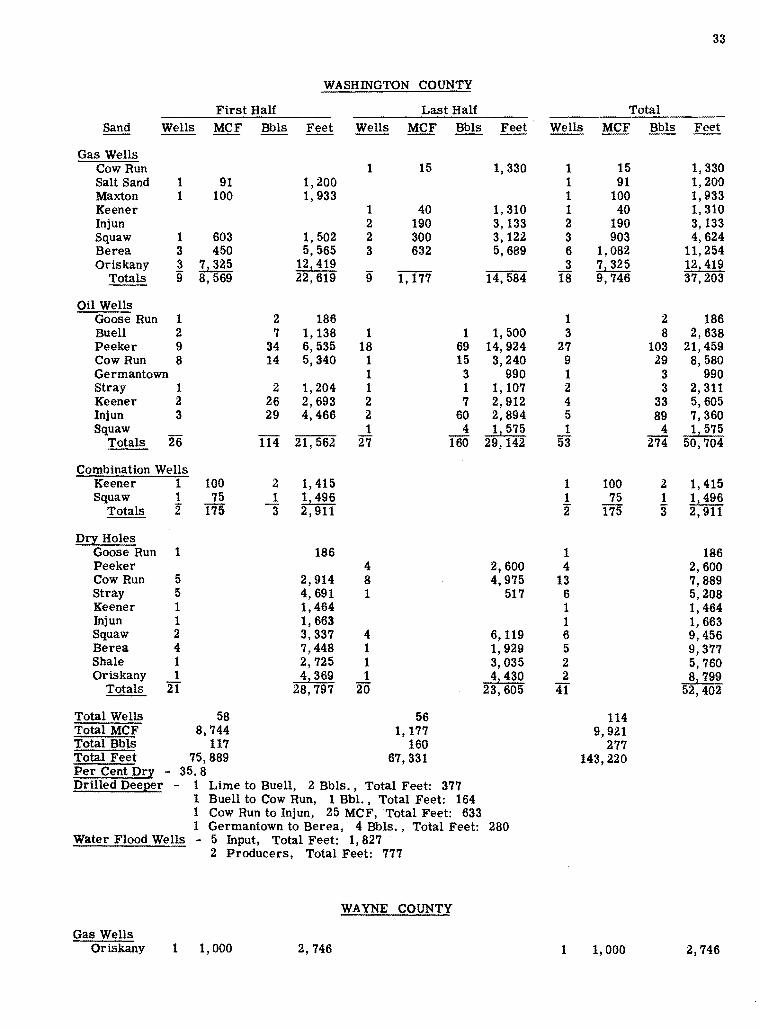
WASHINGTON COUNTY
First Half Last Half Sand Wells MCF Bbls Feet Wells MCF Bbls Feet
Gas Wells Cow Run 1 15 1,330 Salt Sand 1 91 1,200 Maxton 1 100 1,933 Keener 1 40 1,310 Injun 2 190 3,133 Squaw 1 603 1,502 2 300 3,122 Berea 3 450 5,565 3 632 5,689 Oriskany 3 7,325 121419
Totals 9 8, 569 22,619 9 1,177 14,584
OU Wells Goose Run 1 2 186 Buell 2 7 1,138 1 1 1,500 Peeker 9 34 6,535 18 69 14,924 Cow Run 8 14 5,340 1 15 3,240 Germantown 1 3 990 Stray 1 2 1,204 1 1 1,107 Keener 2 26 2,693 2 7 2,912 Injun 3 29 4,466 2 60 2,894 Squaw 1 4 1!575
Totals 26 114 21, 562 27 160 29,142
Combination Wells Keener 1 100 2 1,415 Squaw 1 75 1 1,496
Totals 2 175 3 2,911
Dry Holes Goose Run 1 186 Peeker 4 2,600 Cow Run 5 2,914 8 4,975 Stray 5 4,691 1 517 Keener 1 1,464 lnjun 1 1,663 Squaw 2 3,337 4 6, 119 Berea 4 7,448 1 1,929 Shale 1 2,725 1 3,035 Oriskany 1 4!369 1 41430
Totals 21 28,797 20 23,605
Total Wells 58 56 Total MCF 8,744 1,177 Total Bbls 117 160 Total Feet 75,889 67,331 Per Cent Dry - 35. 8 Drilled DeeEer - 1 Lime to Buell, 2 Bbls., Total Feet: 377
1 Buell to Cow Run, 1 Bbl., Total Feet: 164 1 Cow Run to Injun, 25 MCF, Total Feet: 633 1 Germantown to Berea, 4 Bbls. , Total Feet: 280
Water Flood Wells - 5 Input, Total Feet: 1,827
Gas Wells Oriskany
2 Producers,
1 1,000
Total Feet: 777
WAYNE COUNTY
2,746
33
Total Wells MCF Bbls Feet
1 15 1,330 1 91 1,200 1 100 1,933 1 40 1, 310 2 190 3,133 3 903 4,624 6 1,082 11, 254 3 7,325 12,419
18 9,746 37,203
1 2 186 3 8 2,638
27 103 21,459 9 29 8,580 1 3 990 2 3 2, 311 4 33 5,605 5 89 7,360 1 4 1,575
53 274 50,704
1 100 2 1,415 1 75 1 1, 496 2 175 3 2, 911
1 186 4 2,600
13 7,889 6 5,208 1 1,464 1 1,663 6 9,456 5 9,377 2 5,760 2 82 799
41 52,402
114 9,921
277 143,220
1 1,000 2,746

34
WAYNE COUNTY - Continued
First Half Last Half Total Sand Wells MCF Bbls Feet Wells MCF Bbls Feet Wells MCF Bbls Feet
Oil Wells Clinton 2 49 6,531 2 49 6,531
D!:! Holes Berea 1 434 1 434 Clinton 1 3,001 1 3,ool
Totals 2 3,435 2 3,43
Total Wells 3 2 5 Total MCF 1,000 1,000 Total Bbls 49 49 Total Feet 6,181 6,531 12,712 Per Cent Dr! - 40. 0 Gas Storage Wells - 12 Clinton, Total Feet: 36,835
WOOD COUNTY
Oil Wells Trenton 1 3 1,212 1 3 1, 212
Combination Wells Trenton 1 100 2 1,210 1 100 2 1, 210
Total Wells 1 1 2 Total MCF 100 100 Total Bbls 2 s 5 Total Feet 1,210 1,212 2,422 Per Cent Dry - 0.0
WYANDOT COUNTY
Oil Wells Trenton 3 90 4,255 3 90 4,255
Dr! Holes Trenton 1 1,375 1 1,380 2 2,755 St. Peter 1 1,982 1 1, 982
Totals 2 3,357 I 1,380 3 4,737
Total Wells 5 1 6 Total Bbls 90 90 Total Feet 7,612 1,380 8,992 Per Cent Dry - 50. 0
GRAND TOTALS
Wells 515 582 1,09'1 MCF 84,824 52,492 137,316 Bbls 10,402 17,745 28,147 Footage 1,020,843 1,082,107 2,102,950
ANNUAL WELL COMPLETIONS; on.. AND GAS PRODUCTION,
RESERVES; AND GAS CONSUMPTION DATA,
AND 1953 CRUDE OIL PRICES
w a.I
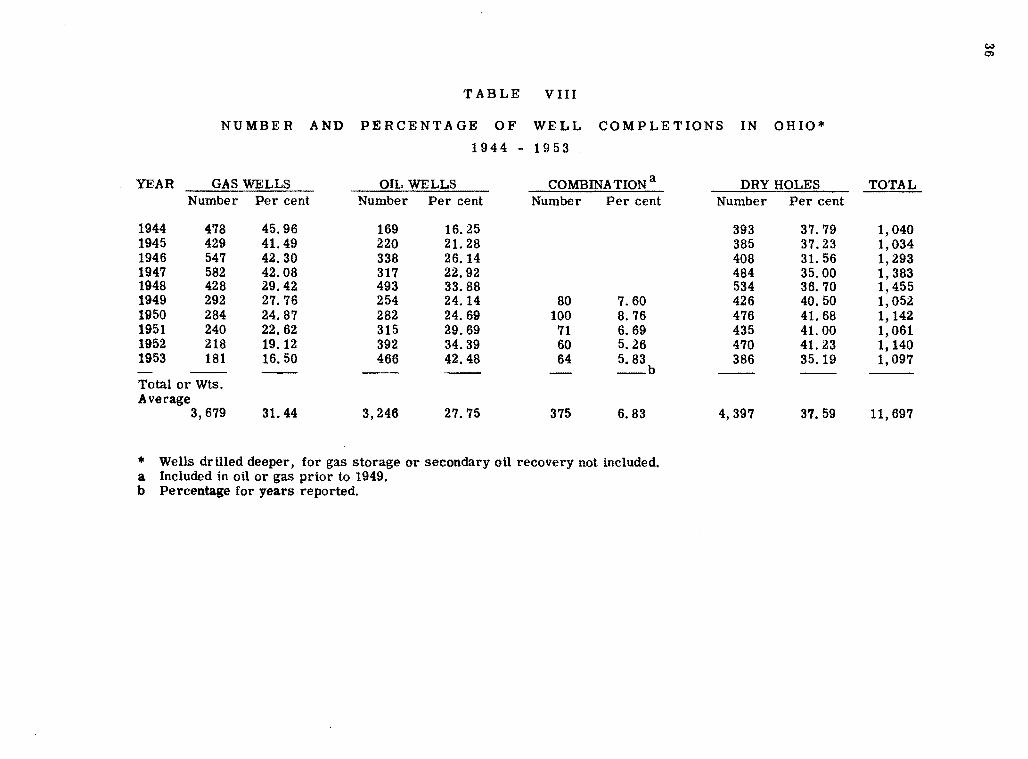
TABLE VIII
NUMBER AND PERCENTAGE OF WELL COMPLETIONS IN OHIO* 1944 - 1953
YEAR GAS WELLS OIL WELLS COMBINATION a DRY HOLES TOTAL Number Per cent Number Per cent Number Per cent Number Per cent
1944 478 45.96 169 16.25 393 37.79 1,040 1945 429 41. 49 220 21. 28 385 37.23 1,034 1946 547 42.30 338 26. 14 408 31. 56 1,293 1947 582 42.08 317 22.92 484 35.00 1,383 1948 428 29.42 493 33.88 534 36.70 1,455 1949 292 27.76 254 24.14 80 7.60 426 40.50 1, 052 1950 284 24.87 282 24.69 100 8.76 476 41. 68 1,142 1951 240 22.62 315 29.69 71 6.69 435 41. 00 1,061 1952 218 19.12 392 34.39 60 5.26 470 41.23 1,140 1953 181 16. 50 466 42.48 64 5.83 386 35.19 1, 097 __ b Total or Wts. Average
3,679 31.44 3,246 27.75 375 6.83 4,397 37. 59 11, 697
• Wells drilled deeper, for gas storage or secondary oil recovery not included • a Included in oil or gas prior to 1949. b Percentage for years reported.

TAB4E IX
ANNUAL NATURAL GAS PRODUCTION, CONSUMPTION AND RESERVES IN OHIO
1945 - 1953
RESERVES YEAR PRODUCTION* CONSUMPTION** AS OF DEC. 31+
Million Cubic Feet Million Cubic Feet Million Cubic Feet
1945 172,258 626,800 1946 59,000 188,527 614,000 1947 74,000 221, 571 611,200 1948 60,732 236,137 581, 108 1949 47,000 246,212 585,597 1950 47,200 324,594 585,048 1951 41,400 375,820 658,439 1952 32,000 697, 517 1953 31,280 592,831
* From A. G. A. ** From U. S. Bureau of Mines. + Exclusive of underground storage.
37
38
YEAR
1945 1946 1947 1948 1949 1950 1951 1952 1953
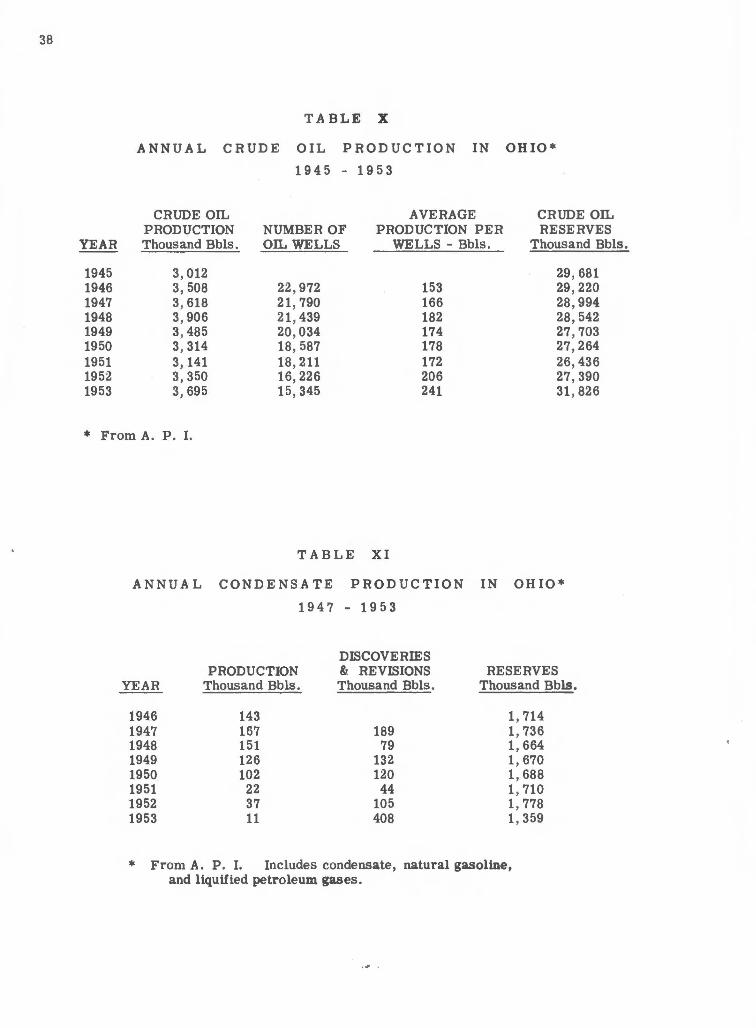
TABLE X
ANNUAL CRUDE OIL PRODUCTION IN OHIO* 1945 - 1953
CRUDE OIL AVERAGE CRUDE OIL PRODUCTION NUMBER OF PRODUCTION PER RESERVES Thousand Bbls. OIL WELLS WELLS - Bbls. Thousand Bbls.
3,012 29,681 3,508 22,972 153 29,220 3, 618 21,790 166 28,994 3,906 21,439 182 28,542 3, 485 20,034 174 27,703 3,314 18,587 178 27,264 3,141 18, 211 172 26,436 3,350 16,226 206 27,390 3,695 15,345 241 31,826
• From A. P. I.
TABLE XI
ANNUAL CONDENSATE PRODUCTION IN OHIO*
1947 - 19 5 3
DISCOVERIES PRODUCTION & REVISIONS RESERVES
YEAR Thousand Bbls. Thousand Bbls. Thousand Bbls.
1946 143 1, 714 1947 167 189 1,736 1948 151 79 1,664 1949 126 132 1,670 1950 102 120 1,688 1951 22 44 1, 710 1952 37 105 1,778 1953 11 408 1, 359
* From A. P. I. Includes condensate, natural gasoline, and liquified petroleum gases.
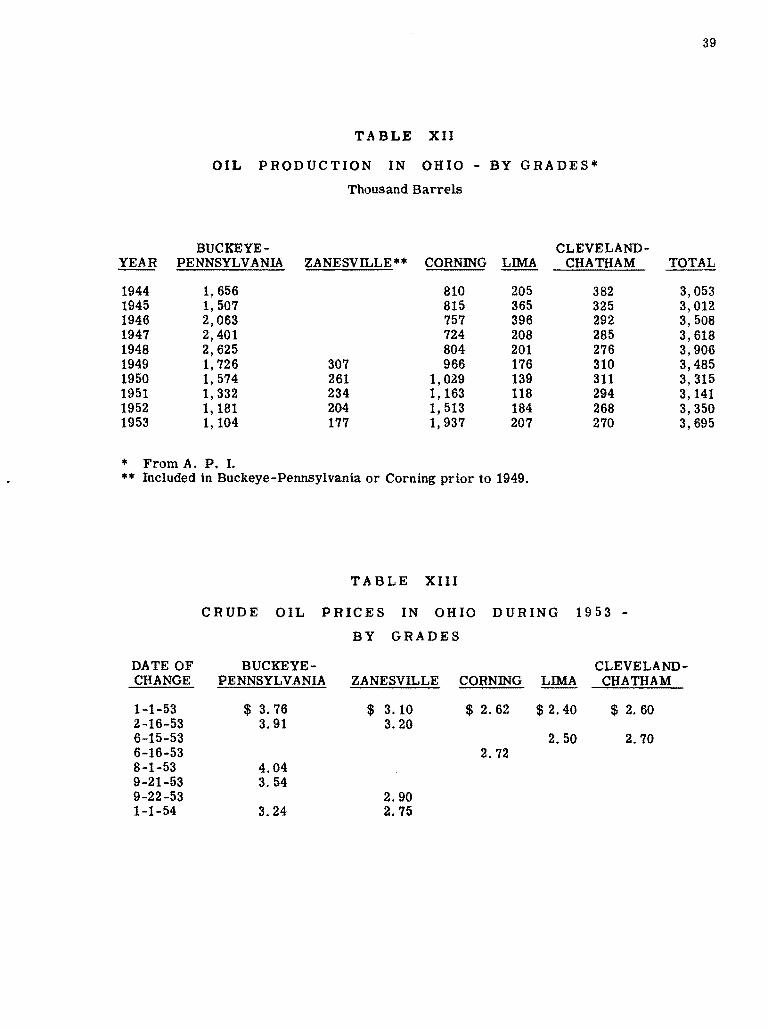
TABLE XII
OIL PRODUCTION IN OHIO - BY GRADES* Thousand Barrels
BUCKEYE- CLEVELAND-YEAR PENNSYLVANIA ZANESVILLE** CORNING LIMA CHATHAM
1944 1,656 810 205 382 1945 1,507 815 365 325 1946 2,063 757 396 292 1947 2,401 724 208 285 1948 2,625 804 201 276 1949 1, 726 307 966 176 310 1950 1,574 261 1,029 139 311 1951 1,332 234 1,163 118 294 1952 1,181 204 1,513 184 268 1953 1, 104 177 1,937 207 270
* From A. P. I. ** Included in Buckeye-Pennsylvania or Corning prior to 1949.
TABLE XIII
CRUDE OIL PRICES IN OHIO DURING 1953 -BY GRADES
39
TOTAL
3,053 3,012 3,508 3,618 3,906 3,485 3,315 3,141 3,350 3, 695
DATE OF CHANGE
BUCKEYE- CLEVELAND-
1-1-53 2-16-53 6-15-53 6-16-53 8-1-53 9-21-53 9-22-53 1-1-54
PENNSYLVANIA
$ 3.76 3. 91
4.04 3. 54
3.24
ZANESVILLE
$ 3. 10 3.20
2.90 2.75
CORNING LIMA CHATHAM
$ 2.62 $ 2. 40 $ 2.60
2.50 2.70 2. 72

PART II
THE DEVELOPMENT OF UNDERGROUND STORAGE IN OHIO
by J. J. Schmidt
K. C. Cottingham
ROTARY VS CABLE TOOL DRILLING IN OHIO
by Robert L. Alkire
OIL, GAS, AND WATER CUTTINGS RECEIVED DURING 1953

THE DEVELOPMENT OF UNDERGROUND
STORAGE IN OHIO
by
J. J. Schmidt East Ohio Gas Company, Cleveland
K. C. Cottingham Ohio Fuel Gas Company, Columbus
To anyone connected with the gas industry, the principle of gas storage is well known.
41
If he has been engaged in the industry for any length of time, he will remember the days of gas holders, both the lift and the later waterless or piston type. He will be familiar with the prac-tice, still in use, of "packing" transmission lines during the night in anticipation of a cold day to follow, and he will understand that, even in the old days, facilities such as lines and compressors could not be "overbuilt " in capacity to provide for short-period demands, such as that at breakfast time, to be only partially used during slack hours that followed. He will know that, in order to hold costs within the economy of both customer and supplier, investment in equipment and general plant was kept within reasonable bounds.
In former days, as they are today, systems were designed for anticipated daily require-ments. In those briefer periods in morning and evening and on extreme days of winter, when sharp peaks occurred, the increased demand was usually provided by some form of temporary storage. In the past, however, consumer requirements were far less than they are today. Furthermore, sources were not so far distant, the fields were under higher pressure, and they were less depleted. In the Appalachian region, most of those nearby fields in fact have been entirely depleted of gas and are now abandoned.
One consideration usually overlooked by the consumer is the time required to move gas from source to destination. The velocity of gas flowing through a line is governed by a number of factors, the most important of which for a given length of line are the diameter of the pipe and the pressures at points of origin and terminus. It might be said as an approximation that the large lines from the southwest, with compressor stations interspersed every 85 miles or so, move their volumes at about 35 miles per hour. In ramifying transmission lines supplying a more densely populated area, the velocity with which gas is moved is considerably less. From this it is evident that, to transmit gas across Ohio from the Ohio River to Lake Erie through the network of lines supplying Ohio consumers, several hours might be required. So again, in order to expedite the required volumes brought from distant sources, some kind of nearby large storage is essential.
Ohio has always been one of the important gas-consuming States, for many years ranking fifth in point of consumption. Until recent years, Ohio wells supplied a large portion of the de-mand though never, even in the early days, was Ohio gas sufficient to meet the entire consumer requirement. In 1907, for instance, Ohio wells furnished 63 percent of Ohio's consumer de-mand, while in 1951 that proportion was only 10 percent. In the period 1906-1951 inclusive, the average proportion supplied by Ohio wells was 37 percent. During the period 1906-1952, the quantity produced from Ohio wells averaged about 53 billion cubic feet per year, the maxi-mum of 80 billion being reached in 1915. Yet in 1952 the production was 41 billion, so that depletion of Ohio production is not as extreme as sometimes assumed. As a producing State, Ohio for many years was in tenth place, though in recent years it has dropped to thirteenth.
Ohio's production, therefore, was and still is important. As a gas-consuming State, on the other hand, Ohio has moved into fourth place, surpassed only by Texas, California, and Louisiana in that order. It is the great increase in Ohio's consumption of natural gas, which
42
has grown from 83 billion cubic feet in 1907 to 376 billion in 1952, that has dwarfed the impor-tance of Ohio's production in the opinion of the average person.
Because of consumer requirements, then, Ohio always has imported a large portion of its annual supply, most of such gas until recent years coming from West Virginia. Prior to the early Forties, the Appalachian states as a group were self-sufficient because some had a supply far in excess of their individual needs. For the five Appalachian producing States, namely Kentucky, New York, Ohio, Pennsylvania, and West Virginia, aggregate consumption for the 5-year period 1940-1944 averaged 427 billion cubic feet per year, with the gas being supplied almost entirely from the combined resources of those States. However, a rapidly in-creasing demand began in 1945, climbing from 466 blllion in that year to more than 1 trillion cubic feet in 1951, and this was largely supplied by western sources.
For reasons mentioned previously, particularly the widely varying rate of consumption, both daily and seasonal, some provision was necessary to hold reserve supplies in readiness close to the consuming areas. In the distribution of other commodities, it is recognized that somewhere between the point of manufacture and the customer the article must be "warehoused" in order that the routine of production can be geared to the sporadic tendency of the market. Not only does this result in a lower cost of the product, but it also asimres the customer of a more convenient and dependable supply. Because of the nature of natural gas as a commodity, and because of the large volumes and consequent high pressures, some form of underground storage seemed to be the solution.
Underground storage of natural gas is not new. Probably the earliest storage was that in Welland County, Ontario, in 1915. In the Zoar field, south of Buffalo, gas was stored in the Onondaga limestone beginning in 1916. Since that time, natural gas has be1en stored in various rock reservoirs in this country. There is an interesting reference in the literature on oil and gas production to the storage of compressed air in a depleted formation. Near Chanute, Kansas, beginning in the year 1903, air was compressed and injected through a depleted gas well into a sandstone lying at a depth of 800 feet. The air was used to of)erate, probably as air lift, ad-jacent oil wells. The reservoir pressure was said to have been raised from 115 to 290 pounds during the 7 years of operation, during which time the rock reservoir w.as used as a large air receiver.*
In the development of many new practices, it is frequently difficult to differentiate cause from effect or to make a proper separation of the contribution each has made. This is particu-larly true in the development of underground storage as we know it today. If, in recent years, there had been no large sources of natural gas, of course there could have been no possibility of supplying growing demands. On the other hand, if there had been no latent desire for natural gas on the part of more and more customers, there would have been little incentive to join sources and distant markets. Following the late Twenties, large gas reserves were discovered in the Southwest for which, at the time, there was but a limited market. This was a situation conducive to waste, as had been proved many times in the past. But, to convey gas from those reserves hundreds of miles eastward, it was necessary that entirely new techniques and prac-tices be developed.
These new procedures were varied. Certainly, in constructing long transmission lines, metallurgical advancement, particularly that improving pipe strength, was vital. New and rapid welding processes were important, for without .welded lines, leakage and maintenance would both have been excessive. Wrapping and coating of pipe were perfected to save metal from corrosion, and various types of cathodic protection were designed to prevent electrolysis. Ditching and backfilling equipment was built for the particular requirements of long lines, en-gineering and construction methods were improved, and even the execution of the undertaking-the business of co-ordinating work of various contractors in separate "spreads"- was a con-tribution. New compressors, working at much higher pressures and improved efficiencies,
* Transactions A. I. M. M. E., Vol. LXI, 1920, pp. 621-623, I. N. Knapp. Recently, some additional information concerning the location of this undertaking was obtained from Mr. Arthur Knapp, the son of Mr. I. N. Knapp.

was a further important development without which distant transmission would have been difficult or impossible.
43
On the other hand, many developments affected the situation from the standpoint of the consumer. Among these was the trend toward more compact housing, the use of effective building insulation, heating equipment improved not only in space required and in efficiency, but adapted to installation in any part of the dwelling, and the convenience of automatic controls. There were many other factors of consequence, not the least of which was cleanliness, the dependability of service, and finally, the considerable price differential when compared to other fuels.
It is not intended in the present discussion to recount the individual characteristics or detailed operating methods for the various storage projects now in use in Ohio. The average reader is familiar with the Clinton sand, in which most of Ohio's gas is stored. He knows that western gas is stored during the summer - usually between May 1 and November 1 - and that gas is removed to meet peaks occurring in the opposing winter cycle. A substantial volume, in the form either of native reserves or injected gas, must remain in the reservoir to give sufficient pressure-volume relationship to assure satisfactory daily deliverability. For this reason it may happen, particularly in reservoirs largely depleted of the original gas, that two or three seasons of input must be gone through before the operation reaches effective output.
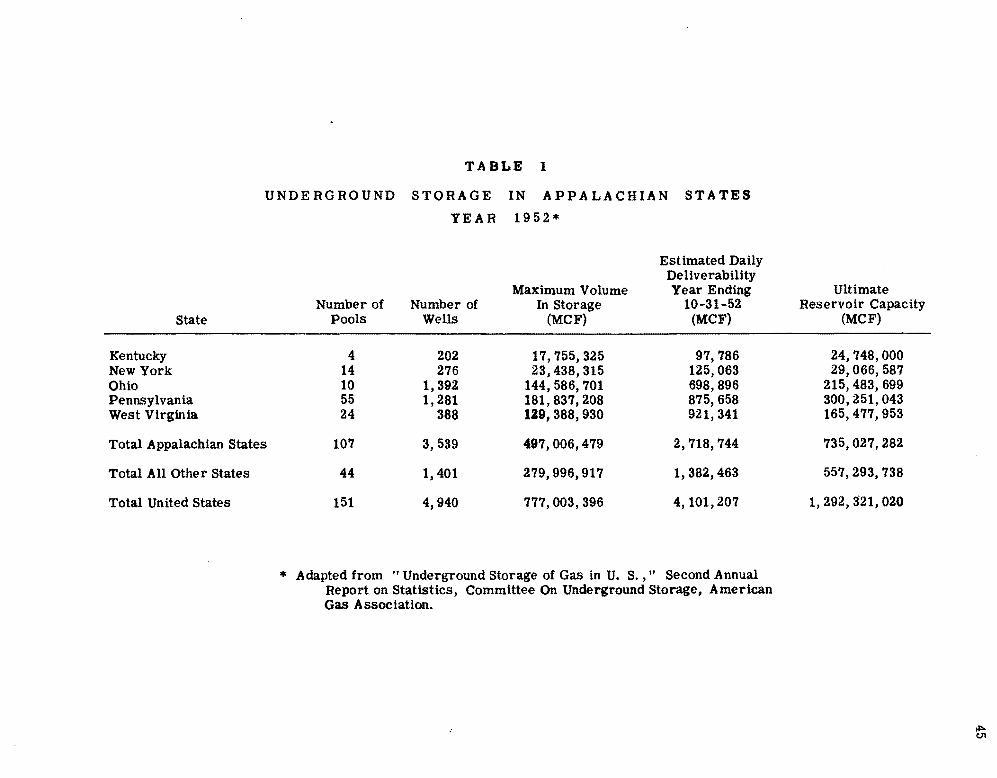
The rock reservoirs, especially those in the Clinton sandstone, are traps either of the stratigraphic, the variable permeability type, or a combination of both. The stratigraphic traps are sand strata or bodies having pinched out edges of permeable Clinton sandstone, all enveloped in impervious shale. The variable permeability type is usually porous rock surrounded by hard and impermeable sandstone in which the interstices between grains have been cemented or otherwise sealed. Table I shows the number of reservoirs, storage wells, capacities, etc., for the Appalachian states and for the United States as a whole at the end of 1952. Table ll shows the annual quantities stored, removed, and the balance in storage at the end of each year since storage began for all underground storage in Ohio.
In any discussion of the future of natural gas, one of the questions most frequently asked refers to the remaining reserves and life of production. Even the uninformed know that natural gas is not generated in the rocks rapidly enough to have any significance with respect to current production. On the other hand, there is always a possibility of discovering petroleum or natural gas in sedimentary rocks, particularly if certain conditions are fulfilled and some beds are above average in porosity. In the matter of future life in years, a frequent error is to divide the reserves of a given year by the production for that year, with a resulting quotient of "equiv-alent years" which is mistakenly regarded as remaining life.
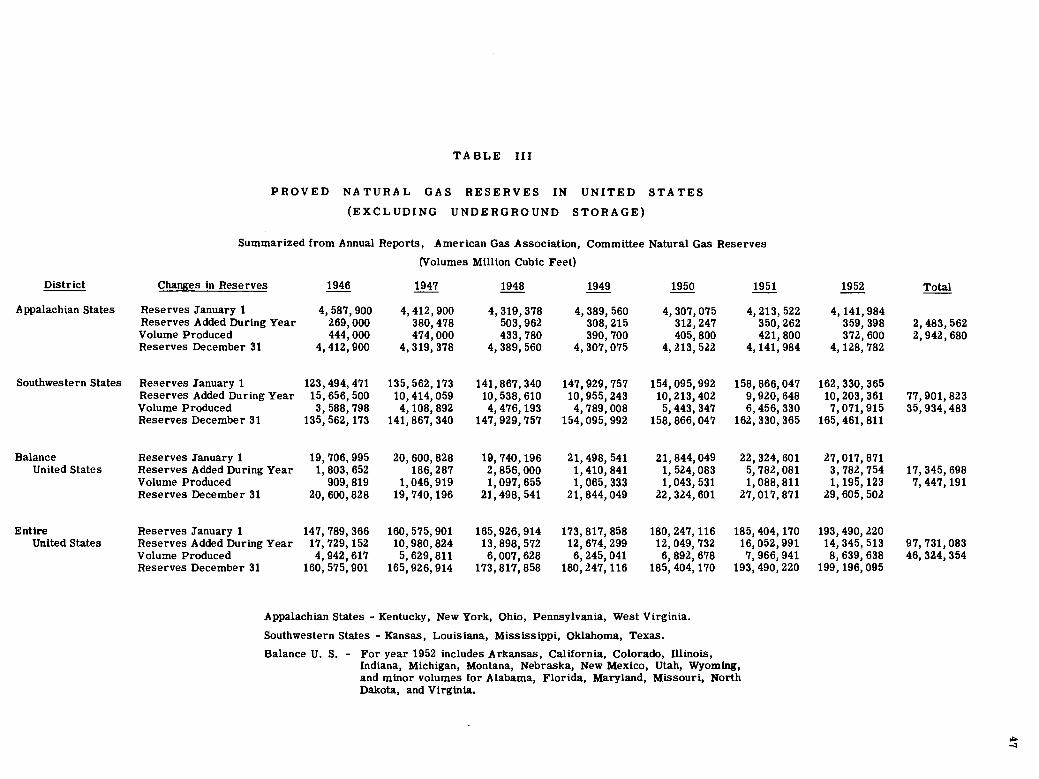
The fallacy of this reasoning is well demonstrated in Table Ill, which shows the annual proved reserves and production for the 7-year period 1946 to 1952 inclusive. Referring to the Appalachian states as an example, the "equivalent years" quotient gives, in 1946, approximately 10 years future. Continuing across to the year 1952, however, we see that, after 6 years of production, the reserves indicate an "equivalent year" ratio of about 11. For the 7 years shown, 46 trillion cubic feet has been produced in the United States, but 98 trillion was added by new discoveries. In other words, additions by new discoveries will for many years offset, and in some states more than compensate, the quantity produced. Even in Ohio, where admittedly both difficulty of success and exploration costs have greatly increased, there will be discoveries from time to time. While Ohio is not shown separately in Table Ill, the total production for 1946-1952 inclusive was 362 billion cubic feet, while the reserves added in that period were 363 billion. The Ohio proved reserves at the end of 1952, exclusive of volumes held in under-ground storage, were 593 billion cubic feet.
In brief, then, though large quantities of gas are available in the Southwest as underground reserves, they cannot be transported coincidentally at a daily rate sufficient for Ohio's winter demand. The western lines entering Ohio are large, ranging in diameters from 16 to 30 inches; nevertheless, despite their sizes, they have far too little capacity to supply Ohio and the other Appalachian states on a direct daily basis. The construction of lines, compressor stations, and
44
other facilities of sufficient capacity to supply Ohio consumers directly from western sources would result in such huge investment that the cost of gas to the customer would 'necessarily be extremely high. In effect, underground storage brings the remote sources of supply to the vicinity of the consumer, and summertime day-by-day transportation of distant gas makes possible the storage of large volumes for use in the winter. The advantage to the customer, from the standpoint of the reduced cost of gas he uses, is readily apparent.
Underground storage improves Ohio's general economy. Rental from leases and wells is a dependable part of the income to those landowners having property over the storage reser-voirs. But most particularly, the consumer, not only he who heats with gas, who is most directly benefited, but also the industrial user, should realize the tremendous importance to him of underground storage, for without such storage, supplying the customer in Ohio during the winter would be an impossibility.
State
Kentucky New York Ohio Pennsylvania West Virginia
TABLE I
UNDERGROUND STORAGE IN APPALACHIAN STATES YEAR 1952*
Estimated Daily De liverability
Maximum Volume Year Ending Number of Number of In Storage 10-31-52
Pools Wells (MCF) (MCF)
4 202 17,755,325 97,786 14 276 23,438,315 125,063 10 1,392 144,586,701 698,896 55 1,281 181,837,208 875,658 24 388 129,388,930 921,341
Total Appalachian States 107 3,539 497,006,479 2,718,744
Total All Other States
Total United States
44 1,401 279,996,917 1,382,463
151 4,940 777,003,396 4, 101, 207
* Adapted from "Underground Storage of Gas in U. S.," Second Annual Repart on Statistics, Committee On Underground Storage, American Gas Association.
Ultimate Reservoir Capacity
(MCF)
24,748,000 29,066,587
215,483,699 300,251,043 165,477,953
735,027,282
557,293,738
1,292,321,020
""' CJ1

46
TABLE II
STATE OF OHIO UNDERGROUND STORAGE
Volumes Injected, Withdrawn, and Year-End Balances (All Quantities In MC F)
Total Volume Input During Output During In Storage On
Year Year Year December 31
1936 1,320,732 14,364 1,306,368 1937 6,203,404 1,193,274 6,316,498 1938 6,188,319 2,655,893 9,848,924 1939 5,563,285 4,893,136 10,519,073 1940 7,624,129 3,918,090 14,225, 112 1941 8,466,842 4,465,964 18,225,990 1942 9,897,538 7,165,547 20,957,981 1943 10,677,672 10,360,304 21,275,349 1944 13,372,319 10,177,109 24,470,559 1945 14,004,138 9,475,533 28,999,164 1946 14,381,974 10,437,529 32,943,609 1947 17,858,548 15,781,748 35,020,409 1948 27,369,390 14,043,905 48,345,894 1949 34,289,866 15,660,986 66,974,774 1950 43,506,553 36,666,750 73,814,577 1951 64,120,470 33,516,996 104,418,051 1952 68,551,066 34,585,223 138,383,894 1953 64,366,948 41,446,849 161,303,993
District
Appalachian States
Southwestern States
Balance United States
Entire United States
PROVED NATURAL GAS
(EXCLUDING
TABLE III
RESERVES IN UNITED STATES
UNDERGROUND STORAGE)
Summarized from Annual Reports, American Gas Association, Committee Natural Gas Reserves (Volumes Million Cubic Feet)
Changes in Reserves 1946 1947 1948 1949 1950
Reserves January 1 4,587,900 4,412,900 4,319,378 4,389,560 4,307,075 Reserves Added During Year 269,000 380,478 503, 962 308,215 312, 247 Volume Produced 444,000 474,000 433,780 390,700 405,800 Reserves December 31 4,412,900 4,319,378 4,389,560 4,307,075 4,213,522
Reserves January 1 123, 494, 471 135,562,173 141,867,340 147,929,757 154,095,992 Reserves Added During Year 15,656,500 10,414,059 10, 538, 610 10,955,243 10,213,402 Volume Produced 3,588,798 4,108,892 4,476,193 4,789,008 5,443,347 Reserves December 31 135, 562, 173 141,867,340 147,929,757 154,095,992 158,866,047
Reserves January 1 19,706,995 20,600,828 19,740,196 21, 498, 541 21,844,049 Reserves Added During Year 1,803,652 186,287 2,856,000 1,410,841 1, 524, 083 Volume Produced 909,819 1,046,919 1,097,655 1, 065, 333 1,043,531 Reserves December 31 20,600,828 19,740, 196 21,498,541 21,844,049 22,324,601
Reserves January 1 147,789,366 160,575,901 165,926,914 173,817,858 180, 247, 116 Reserves Added During Year 17, 729, 152 10,980,824 13,898,572 12,674,299 12,049,732 Volume Produced 4,942,617 5, 629, 811 6,007,628 6,245,041 6,892,678 Reserves December 31 160,575,901 165,926,914 173,817,858 180,247,116 185,404, 170
Appalachian States - Kentucky, New York, Ohio, Pennsylvania, West Virginia. Southwestern States - Kansas, Louisiana, Mississippi, Oklahoma, Texas.
1951
4,213,522 350,262 421,800
4,141,984
158,866,047 9,920,648 6,456,330
162,330,365
22,324,601 5,782,081 1, 088, 811
27, 017, 871
185,404, 170 16,052,991 7,966,941
193,490,220
Balance U. S. - For year 1952 includes Arkansas, California, Colorado, Illinois, Indiana, Michigan, Montana, Nebraska, New Mexico, Utah, Wyoming, and minor volumes for Alabama, Florida, Maryland, Missouri, North Dakota, and Virginia.
1952
4, 141,984 359, 398 372, 600
4,128,782
162,330,365 10,203,361 7, 071, 915
165, 461, 811
27,017,871 3,782,754 1, 195, 123
29,605,502
193,490,220 14,345,513 8,639,638
199,196,095
Total
2,483,562 2, 942, 680
77,901,823 35,934,483
17,345,698 7,447,191
97, 731, 083 46,324,354
~ -:i

48
ROTARY VS CABLE TOOL DRILLING IN OHIO
by
Robert L. Alkire
The first deep well drilled in Ohio by the rotary method was completed in 1945, to a total depth of 7, 455 feet through the Medina sand,. by The Texas Company, on the Lillie Gillespie farm in Section 4, Union Township, Belmont County. In 1947 the Ohio OU Company completed a test to the basement complex, 3, 361 feet, on the Virgil Iohns farm in Tract 9930, McArthur Township, Logan County. Neither of these wells offered sufficient evidence whereby a just comparison could be made between rotary and cable tool drilling costs.
The initial attempt to establish rotary in competition with cable tool in Ohio occurred during the rapid development of the Canton gas pool in Stark County in 1947. High initial vol-umes and close well spacing induced several operators to bring in rotary rigs in the hope of lessening the 60 to 80 days drilling time required by cable tool to reach the Clinton sand. The drilling time, to a depth of approximately 4, 500 feet, was reduced to 30 to 40 days, but in-creased costs were evident. In completing these wells, the rotary machine was moved off when the top of the Clinton was reached and a cable tool spudder moved in to drill through the sand. This was done so that the sand could be drilled clean and any oil or gas show readily recognized. A suitable shot of nitro-glycerine was then used to increase natural production. In reviewing his experiences as a rotary con tractor in the Canton pool, NC>ah Andrews, Union Drilling and Producing Company, Mt. Pleasant, Michigan, stated in a paper givenat the meet-ing of the Eastern District API Division of Production in 1947, that "in order to operate profit-ably it will be necessary to get $4. 25 per foot drilled, and until such time as this is forth-coming, the cable tool contractors need have no concern about rotaries in Ohio." ··
During 1953, six Clinton sand rotary wells were completed in Coshocton and Knox .counties, at an average depth of 3, 100 feet. Normal drilling time was found to be 8 days, an average of 6 bits were needed, as much as 900 feet of shale or 200 feet of limestone could be penetrated a day with one bit, 10 to 15 drill collars were advisable in drilling the "Big Lime," and there were no mud difficulties or serious losses of circulation. The drllling program allowed for 50 feet of 10 inch, a possible 900 feet of 6-5/8 inch, and 3 100 feet of 5-3/16-inch casing. In completion, after electric or gamma ray logging, the 5-3/16-inch casing was set on bottom and cemented a suitable distance above the Clinton sand. The lower pay section was gun-perforated and subjected to hydraulic fracture. A plug was then set below the upper pay and the perforation and fracture procedure repeated.
Comparing Mr. Andrews' experience with the recent operations, there appears to be con-siderable improvement in drilling time, especially in the "Big Lime" section, and a sizable reduction in the number of bits required. The increase in drilling speed and the extended bit life are probably due to additional drill collars and to recent improvement:S in hard-rock bits. Both would have considerable effect on the cost per foot drilled and thereby improve the com-petitive position of rotary drilling. The general acceptance of hydraulic fracturing may also affect rotary operations favorably. The present practice in cable tool completions is to cement the casing in the top of the sand and expose the entire sand section, which usually contains some shale, to the fracture treatment. Whether or not the fracture occurs in the pay zone is not known. A number of processes are being used in an effort to more definitely confine the zone of fracture, but they have met with numerous difficulties and variable success. In rotary oper-ations, an electric or gamma ray log defines the pay zones and the fracture treatments are di-rected into them through the perforations.
Whether or not rotary operations are now competitive with cable tool in Ohio can best be determined by additional drilling. It is generally recognized that the cost per foot drilled by rotary will probably remain above cable tool. But this difference may be overcome by the

49
considerable decrease in drilling time, the reduced casing program, and the improved com-pletion practice which rotary has to offer. In addition, the widespread application of electric or gamma ray logs will furnish a new and valuable source of information for studies toward a better understanding of oll and gas accumulations in the Clinton sand, as well as other pro-ductive horizons in Ohio.
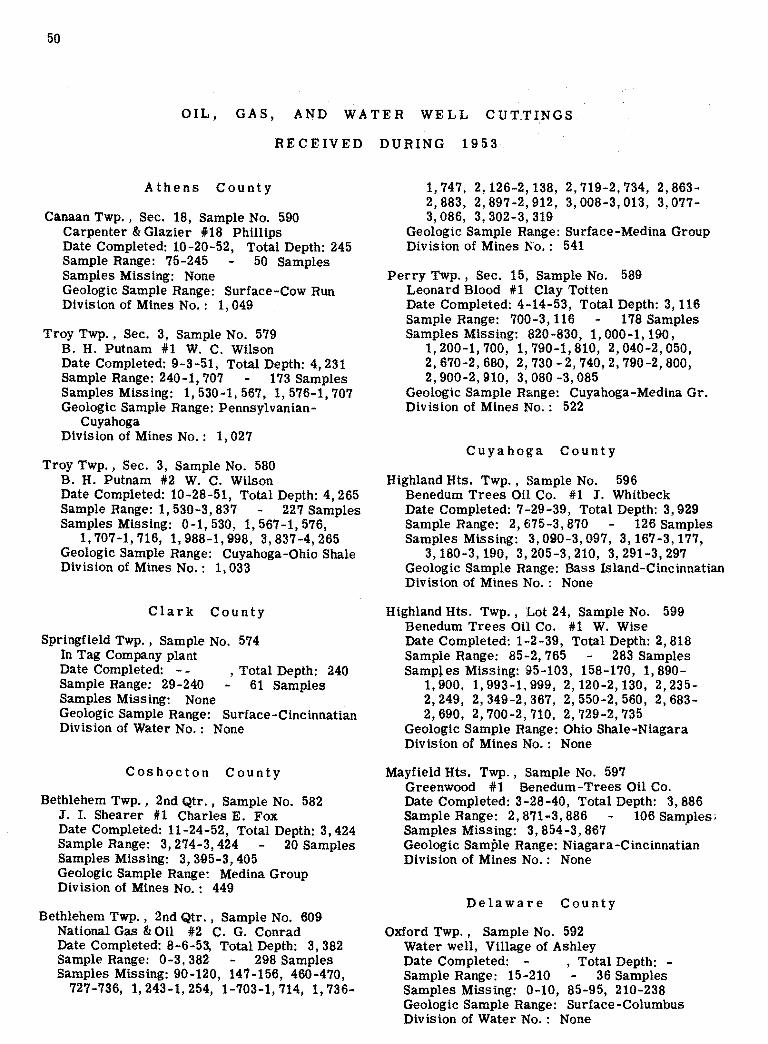
50
OIL, GAS, AND WATER WELL CUT_TINGS
RECEIVED DURING 1953.
Athens County
Canaan Twp. , Sec. 18, Sample No. 590 Carpenter & Glazier *18 Phillips Date Completed: 10-20-52, Total Depth: 245 Sample Range: 75-245 50 Samples Samples Missing: None Geologic Sample Range: Surface-Cow Run Divis ton of Mines No.: 1, 049
Troy Twp., Sec. 3, Sample No. 579 B. H. Putnam *1 W. C. Wilson Date Completed: 9-3-51, Total Depth: 4, 231 Sample Range: 240-1, 707 173 Samples Samples Missing: 1, 530-1, 567, 1, 576-1, 707 Geologic Sample Range: Pennsylvanian-
Cuyahoga Division of Mines No.: 1, 027
Troy Twp. , Sec. 3, Sample No. 580 B. H. Putnam #2 W. C. Wilson Date Completed: 10-28-51, Total Depth: 4, 265 Sample Range: 1, 530-3, 837 227 Samples Samples Missing: 0-1, 530, 1, 567-1, 576,
1,707-1,716, 1,988-1,998, 3,837-4,265 Geologic Sample Range: Cuyahoga-Ohio Shale Division of Mines No. : 1, 033
Clark County
Springfield Twp. , Sample No. 574 In Tag Company plant Date Completed: - -Sample Range: 29-240 Samples Missing: None
, Total Depth: 240 61 Samples
Geologic Sample Range: Surface-Cincinnatian Division of Water No.: None
Coshocton County
Bethlehem Twp. , 2nd Qtr. , Sample No. 582 1. I. Shearer #1 Charles E. Fox Date Completed: 11-24-52, Total Depth: 3, 424 Sample Range: 3, 274-3, 424 20 Samples Samples Missing: 3, 3-95-3, 405 Geologic Sample Range: Medina Group Division of Mines No. : 449
Bethlehem Twp., 2nd Qtr., Sample No. 609 National Gas & Oil #2 C. G. Conrad Date Completed: 8-6-53, Total Depth: 3, 382 Sample Range: 0-3, 382 298 Samples Samples Missing: 90-120, 141-156, 460-470,
727-736, 1,243-1,254, 1-703-1,714, 1,736-
1,747, 2, 126-2, 138, 2,719-2,734, 2,863-2,883, 2,897-2,912, 3,008-3,013, 3,077-3,086, 3,302-3,319
Geologic Sample Range: Surface-Medina Group Division of Mines No. : 541
Perry Twp., Sec. 15, Sample No. 589 Leonard Blood #1 Clay Totten Date Completed: 4-14-53, Total Depth: 3, 116 Sample Range: 700-3, 116 178 Samples Samples Missing: 820-830, 1, 000-1, 190,
1,200-1,700, 1,790-1,810, 2,040-2,050, 2, 670-2, 680, 2, 730 - 2, 740, 2, 790-2, 800, 2, 900-2, 910, 3, 080 -3, 085
Geologic Sample Range: Cuyahoga-Medina Gr. Division of Mines No. : 522
Cuyahoga County
Highland Hts. Twp., Sample No. 596 Benedum Trees Oil Co. #1 1. Whitbeck Date Completed: 7-29-39, Total Depth: 3, 929 Sample Range: 2, 675-3, 870 126 Samples Samples Missing: 3, 090-3, 097, 3, 167-3, 177,
3,180-3, 190, 3,205-3,210, 3,291-3,297 Geologic Sample Range: Bass Island:..Cincinnatian Division of Mines No. : None
Highland Hts. Twp., Lot 24, Sample No. 599 Benedum Trees Oil Co. #1 W. Wise Date Completed: 1-2-39, Total Depth: 2, 818 Sample Range: 85··2, 765 283 Samples Samples Missing: 95-103, 158-170, 1,890-
1,900, 1,993-1,999, 2, 120-2,130, 2,235-2,249, 2,349-2,367, 2,550-2,560, 2,683-2,690, 2,700-2,710, 2,729-2,735
Geologic Sample Range: Ohio Shale-Niagara Division of Mines No. : None
Mayfield Hts. Twp. , Sample No. 597 Greenwood :#1 Benedum-Trees Oil Co. Date Completed: 3-28-40, Total Depth: 3, 886 Sample Range: 2, 871-3, 886 106 Samples• Samples Missing: 3, 854-3, 867 Geologic Sample Range: Niagara-Cincinnatian Division of Mines No. : None
Delaware County
Oxford Twp. , Sampl1e No. 592 Water well, Village of Ashley Date Completed: - , Total Depth: Sample Range: 15-210 36 Samples Samples Missing: 0-10, 85-95, 210-238 Geologic Sample Range: Surface-Columbus Division of Water No.: None

Hancock County
Allen Twp. , Sec. 36, Sample No. 570 Ohio Oil Co. #3 J. C. Kagy Date Completed: 11-14-52, Total Depth: 1, 364 Sample Range: 100-1, 364 165 Samples Samples Missing: 220-230, 1, 300-1, 302,
1,309-1,311, 1,344-1,348 Geologic Sample Range: Bass Is. -Black River Division of Mines No. : 43
Liberty Twp., Sec. 9, Sample No. 571 Ohio Oil Co. #2 Virgil Boyd Date Completed: 11-6-52, Total Depth: 1, 334 Sample Range: 40-1, 334 13.3 Samples Samples Missing: 200-210, 340-350, 620-650,
1,080-1,250, 1,270-1,274 Geologic Sample Range: Bass Is. - Trenton Division of Mines No.: 44
Liberty Twp., Sec. 8, Sample No. 572 Ohio Oil Co. #1 L. M. Hardy Date Completed: 10-27-52, Total Depth: 1, 392 Sample Range: 72-1, 391 164 Samples Samples Missing: 200-210, 240-250, 1, ooo ..
1,010, 1,280-1,285 Geologic Sample Range: Bass Is. - Trenton Division of Mines No.: 45
Hardin County
Lynn Twp. , Lot. 13938, Sample No. 581 Scioto Valley OU Co. #1 L. & E. Laubie Date Completed: 8-17-51, Total Depth: 1, 907 Sample Range: 1, 340-1, 907 107 Samples Samples Missing: None Geologic Sample Range: Cincinnatian-Cambrian Divis ion of Mines No. : 48
Hocking County
Falls Twp. , Sec. 20. Sample No. 594 Northern Ordinance, Inc. #1 Roy B. Funk Date Completed: 3-21-44?, Total Depth: 2, 526 Sample Range: 572-2, 520 230 Samples Samples Missing: 649-661, 1, 036-1, 044,
1,698-1,704, 1,766-1,772, 2,106-2, 112, 2, 132-2, 138, 2, 170-2, 189, 2, 267-2, 288, 2,442-2,475, 2,490-2,495
Geologic Sample Range: Cuyahoga-Medina Gr. Division of Mines No. : None
Falls Twp., Sec. 35, Sample No. 606 W. C. Adair & Co. #1 Harry Mount Date Completed: 9-4-53, Total Depth: 2, 826 Sample Range: 0-2, 815 326 Samples Samples Missing: 2, 356-2, 370, 2, 418-2, 424,
2,815-2,824 Geologic Sample Range: Surface-Medina Gr. Division of Mines No.: 394
Jackson County
Scioto Twp. , Sec. 19, Sample No. 569 C. L. Williams #1 Arby Murray
51
Date Completed: 11.,-30-53, Total Depth: 3, 800 Sample Range: 0-3, 800 763 Samples Samples Missing: 255-260, 430-435, 690-695,
930-935, 1,990-1,995, 2, 147-2, 150, 2,890-2, 895, 3, 003-3, 038, 3, 662-3, 670
Geologic Sample Range: Surface-Prairie Du Che in
Division of Mines No.: 48
Scioto Twp. , Sec. 36, Sample No. 605 Sidney Frohman #1 C. E. Blair Date Completed: 8-27-53, Total Depth: 650 Sample Range: 20-580 99 Samples Samples Missing: 330-335, 355-360, 506-512,
517-520, 556-562 Geologic Sample ,Range: Cuyahoga-Berea Division of Mines No.: 50
Knox County
Jackson Twp., Sec. 22, Sample No. 588 Leonard Blood #4 E. G. Miller Date Completed: 3-22-53, Total Depth: 2, 921 Sample Range: 100-2, 921 237 Samples Samples Missing: 110-130, 190-395, 455-485,
675-685, 865-885, 995-1,005, 1,115-1, 120, 1,250-1,270, 1,280-1,290, 1,300-1,320, 1,840-1,650, 1,~10-1,830, 2,090-2,120, 2, 130-2, 140, 2,540-2,550, 2,560-2,570, 2,610-2,620, 2,680-2,690, 2,875-2,900, 2,905-2,921
Geologic Sample Range: Cuyahoga-Medina Gr. Division of Mines No.: 800
Pleasant Twp., Lot 18, Sample No. 603 Harry Perkins #2 Frank Hall Date Completed: 8-14-53, Total Depth: 4, 617 Sample Range: 3, 010 -4, 600 48 Samples Samples Missing: 3, 018-3, 060, 3, 070-3, 175,
3,200-3,400, 3,425-3,475, 3,500-3,780, 3,875-3,935, 3,945-3,965, 3,975-3,993, 4,035-4,062, 4,075-4,122, 4,134-4,150, 4, 160-4,232, 4,267-4,282
Geologic Sample Range: Cincinnatian-Cambrian Division of Mines No.: 757
Lake County
Concord Twp., L.15, 4th Qtr., Sample No. 602 East Ohio Gas Co. #1 S. L. Mather Date Completed: 10-17-40, Total Depth: 3, 626 Sample Range: 688-3, 626 383 Samples Samples Missing: 1, 583-1, 662, 1, 927-1, 934,
2,373-2,394, 2,435-2,450, 2,480-2,485, 2,722-2,735, 2,934-2,944, 3,186-3,191, 3,240-3,245
Geologic Sample Range: Ohio Sh. -Cincinnatian Divis ion of Mines No. : 2
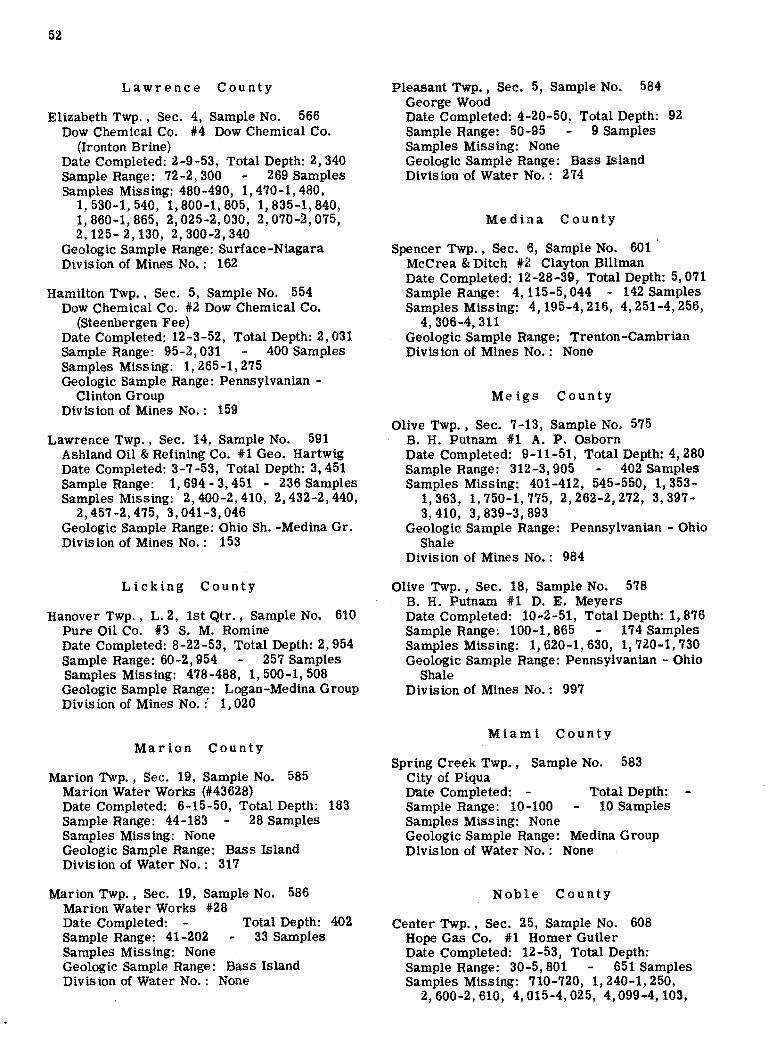
52
Lawrence County
Elizabeth Twp. , Sec. 4, Sample No. 566 Dow Chemical Co. #4 Dow Chemical Co.
(Ironton Brine) Date Completed: 2-9-53, Total Depth: 2, 340 Sample Range: 72-2, 300 269 Samples Samples Missing: 480-490, 1, 470-1, 480,
1,530-1,540, 1,800-1,805, 1,835-1,840, 1,860-1,865, 2,025-2,030, 2,070-2,075, 2, 125- 2, 130, 2, 300-2, 340
Geologic Sample Range: Surface-Niagara Division of Mines No.: 162
Hamilton Twp. , Sec. 5, Sample No. 554 Dow Chemical Co. #2. Dow Chemical Co.
(Steenbergen Fee) Date Completed: 12-3-52, Total Depth: 2, 031 Sample Range: 95-2, 031 400 Samples Samples Missing: 1, 265-1, 275 Geologic Sample Range: Pennsylvanian -
Clinton Group Division of Mines No.: 159
Lawrence Twp., Sec. 14, Sample No. 591 Ashland Oil & Refining Co. #1 Geo. Hartwig Date Completed: 3-7-53, Total Depth: 3, 451 Sample Range: 1, 694 - 3, 451 - 236 Samples Samples Missing: 2, 400-2, 410, 2, 432-2, 440,
2,457-2,475, 3,041-3,046 Geologic Sample Range: Ohio Sh. -Medina Gr. Division of Mines No.: 153
Licking County
Hanover Twp., L. 2, 1st Qtr., Sample No. 610 Pure Oil Co. #3 S. M. Romine Date Completed: 8-22-53, Total Depth: 2, 954 Sample Range: 60-2, 954 257 Samples Samples Missing: 478-488, 1, 500-1, 508 Geologic Sample Range: Logan-Medina Group Division of Mines No. :· 1, 020
Marion County
Marion Twp., Sec. 19, Sample No. 585 Marion Water Works (#43628) Date Completed: 6-15-50, Total Depth: 183 Sample Range: 44-183 28 Samples Samples Missing: None Geologic Sample Range: Bass Island Division of Water No.: 317
Marion Twp., Sec. 19, Sample No. 586 Marion Water Works #28 Date Completed: -Sample Range: 41-202 Samples Missing: None
Total Depth: 402 33 Samples
Geologic Sample Range: Bass Island Division of Water No.: None
Pleasant Twp., Sec. 5, Sample No. 584 George Wood Date Completed: 4-20-50, Total Depth: 92 Sample Range: 50-95 9 Samples Samples Missing: None Geologic Sample Range: Bass Island Division of Water No.: 274
Medina County
Spencer Twp. , Sec. 6, Sample No. 601 McCrea & Ditch #2 Clayton Billman Date Completed: 12-28-39, Total Depth: 5, 071 Sample Range: 4, 115-5, 044 - 142 Samples Samples Missing: 4, 195-4, 216, 4, 251-4, 256,
4,306-4,311 . Geologic Sample Range: Trenton-Cambrian Division of Mines No.: None
Meigs County
Olive Twp., Sec. 7-13, Sample No. 575 B. H. Putnam U A. P. Osborn Date Completed: 9-11-51, Total Depth: 4, 280 Sample Range: 312-3, 905 402 Samples Samples Missing: 401-412, 545-550, 1, 353-
1, 363, 1,750-1,775, 2,262-2,272, 3,397-3,410, 3,839-3,893
Geologic Sample Range: Pennsylvanian - Ohio Shale
Division of Mines No. : 984
Olive Twp. , Sec. 18, Sample No. 578 B. H. Putnam #1 D. E. Meyers Date Completed: 10-2-51, Total Depth: 1, 876 Sample Range: 100-1, 865 174 Samples Samples Missing: 1, 620-1, 630, 1, 720-1, 730 Geologic Sample Range: Pennsylvanian - Ohio
Shale Division of Mines No.: 997
Miami County
Spring Creek Twp. , Sample No. 583 City of Piqua Date Completed: -Sample Range: 10-100 Samples Missing: None
Total Depth: 10 Samples
Geologic Sample Range: Medina Group Division of Water No.: None
Noble County
Center Twp., Sec. 25, Sample No. 608 Hope Gas Co. #1 Hornet Guiler Date Completed: 12-53, Total Depth: Sample Range: 30-5, 801 651 Samples Samples Missing: 710-720, 1, 240-1, 250,
2,600-2,610, 4,015-4,025, 4,099-4,103,

4, 130-4, 138, 4,216-4,220, 4,286-4,295 4,302-4,350, 4,410-4,418, 4,450-4,458 4,921-4,926, 5, 135-5, 145, 5,663-5,722
Geologic Sample Range: Surface-Medina Gr. Division of Mines No.: 878
Elk Twp. , Sec. 15, Sample No. 607 Great Lakes Carbon Corp. #1 Herman Pabst Date Completed: 10-30-53, Total Depth: 5, 080 Sample Range: 0-5, 080 547 Samples Samples Missing: 745-755, 1, 135-1, 145,
3, 992-4, 011 Geologic Sample Range: Pennsylvanian-
Helderberg Division of Mines No.: 917
Perry County
Clayton Twp., Sec. 10, Sample No. 595 Quaker State Oil Ref. Co. #1 James Adrain Date Completed: 12-5-46, Total Depth: 3, 428 Sample Range: 170-2, 479 203 Samples Samples Missing: 848-860, 1, 022-1, 032
1,793-1,805, 2,479-3,428 Geologic Sample Range: Pennsylvanian-
Medina Group Division of Mines No.: 896
Pike County
Beaver Twp., Sec. 31, Sample No. 604 Oxford Oil Co. #1 Frank C. Hines Date Completed: 5-9-53, Total Depth: 793 Sample Range: 310-789 98 Samples Samples Missing: 370-375, 445-458 Geologic Sample Range: Ohio Shale Division of Mines No.: 2
Scioto County
Bloom Twp. , Sec. 35, Sample No. 560 Dow Chemical Co. #3 Dow Chemical Co.
(Ironton Brine) Date Completed: 1-2-53, Total Depth: 2, 027 Sample Range: 72-2, 025 218 Samples Samples Missing: None Geologic Sample Range: Surface to Niagara Division of Mines No. : 86
Green Twp., Lot 29, Sample No. 576 Dow Chemical Co. #5 Dow Chemical Co.
(Ironton Brine) Date Completed: 3-9-53, Total Depth 1, 631 Sample Range: 84-1, 629 196 Samples Samples Missing: 190-200, 1, 230-1, 235
1, 290-1, 300, 1, 590-1, 595 Geologic Sample Range: Surface-Niagara Division of Mines No.: 87
Stark County
Pike Twp. , Sec. 24, Sample No. 593 M. B. Belden #1 Jennie J. Overly Date Completed: 1953, Total Depth:
53
Sample Range: 810-6, 062 347 Samples Samples Missing: 1, 007-1, 012, 1, 310-1, 332
1,651-1,685, 1,700-1,735, 1,749-1,759, 2,000-2,015, 2,031-2, 100, 2, 140-2, 157, 4,089-4,098
Geologic Sample Range: Berea-Medina Group Division of Mines No.: 937
Washington County
Belpre Twp., Sec. 29, Sample No. 577 B. H. Putnam #1 J. S. Lamp Date Completed: 10-14-51, Total Depth: 4, 132 Sample Range: 111-3, 910 - 388 Samples Samples Missing: 152-187, 384-506, 1, 203-
1, 212, 1,333-1,343, 1,502-1,820, 3,037-3, 051, 3, 148-3, 155, 3, 865-3, 874, 3, 910-4, 122
Geologic Sample Range: Pennsylvanian-Ohio Shale
Division of Mines No.: 1, 311
Wood County
Liberty Twp., Sec. 34, Sample No. 573 Ohio Oil Co. C. Stockwell (Fee) Date Completed: 11-24-52, Total Depth: 1, 291 Sample Range: 20-1, 891 174 Samples Samples Missing: 700-800, 1, 182-1, 184,
1, 186-1, 187, 1, 188-1, 191, 1, 192-1, 194, 1, 195-1, 197, 1,215-1,217, 1,220-1,222, 1,251-1,253, 1,255-1,258, 1,291-1,370, 1,371-1,890
Geologic Sample Range: Surface-Black River Division of Mines No.: 23
Portage Twp. , Sec. 36, Sample No. 587 Eugene Tefft #1 Eugene Tefft Date Completed: 1-30-53, Total Depth: 1, 210 Sample Range: 33-1, 210 153 Samples Samples Missing: 180-185, 225-230, 338-344,
400-415, 499-508 Geologic Sample Range: Bass Island-Trenton Division of Mines No.: 20