1904.full_2
TRANSCRIPT

7/30/2019 1904.full_2
http://slidepdf.com/reader/full/1904full2 1/6
Depression and Diabetes A large population-based study of sociodemographic, lifestyle, and clinicalfactors associated with depression in type 1 and type 2 diabetes
ANNE ENGUM, MD1,2
ARNSTEIN M YKLETUN, MA3
K RISTIAN MIDTHJELL, MD, PHD4
ARE HOLEN, MD, PHD1
ALV A. DAHL, MD, PHD5
OBJECTIVE — The purpose of this study was to investigate factors associated with depres-sion in type 1 and type 2 diabetes and test whether these differ from factors associated withdepression in the nondiabetic population.
RESEARCH DESIGN AND METHODS — In an unselected population study compris-ing 60,869 individuals, potential sociodemographic, lifestyle, and clinical factors were investi-
gated in participants with and without diabetes. The associations between hyperglycemia anddepression in types 1 and 2 diabetes were also studied. The levels of depression were self-ratedby using the Hospital Anxiety and Depression Scale.
RESULTS — Several factors were correlated with depression in types 1 and 2 diabetes. How-ever, these factors were not different from those of the nondiabetic population. Comorbidchronic somatic diseases were associated with depression in type 2 but not type 1 diabetes. Intype 2 diabetes, those without comorbidity had the same odds of depression as the nondiabeticpopulation with no chronic somatic diseases. No significant associations were found for hyper-glycemia in relation to depression in type 1 and type 2 diabetes.
CONCLUSIONS — Type 2 diabetes without other chronic somatic diseases did not increasethe risk of depression. Factors associated with depression in type 1 and type 2 diabetes wereshared with the nondiabetic population.
Diabetes Care 28:1904–1909, 2005
Past research has shown that a rela-tionship exists between depressionand diabetes (1). Depression has
been associated with hyperglycemia (2),diabetes-related complications (3), andperceived functional limitations of diabe-tes (4). Moreover, depression among in-dividuals with diabetes has also beenassociated with potential sociodemo-
graphic, lifestyle, and clinical factorsshared with the general population. Thecontributions of socioeconomic status(5), marital status (6), obesity (7), smok-ing habits (8), and physical limitationsand inactivity (9) have been extensivelytested.
When the relationship between dia-betes anddepression is examined,the role
of comorbid chronic somatic diseases hasto be taken into account (10). In general,previous research has indicated a higherprevalence of depression in samples of pa-tients with various chronic somatic dis-eases. The coexistence of chronic somaticdiseases is common (11,12), andthere is astrong connection between symptoms of depression and the number of differentchronic diseases (13,14).
Nevertheless, the question remains: Are the factors associated with depression
in types 1 and 2 diabetes different fromthose in the nondiabetic population? Wehave not been able to find any studies thatinclude interaction tests to investigatewhether factors associated with depres-sion actually interact with having diabe-tes. Multiple health problems, as well aspersonal, social, and community factors,may combine to bring about depressionin individuals with diabetes. Several of thefactors claimed to be linked to depressionare not limited to those with diabetes andmay be related to the general psychologi-cal distress of having a chronic disease
(4).In a large study of the general popu-
lation, the relationship between diabetesand reported symptoms of depressionwere studied. This study investigated therole of some sociodemographic, lifestyle,and clinical factors associated with depres-sion in types 1 and 2 diabetes and examinedwhether these factors were different fromthose of the nondiabetic population.
RESEARCH DESIGN AND
METHODS — The population study
was part of the second Nord-TrøndelagHealth Study, Norway (HUNT 2). Thedata were collected from 1995 to 1997.
Al l in ha bi ta nt s of No rd- Tr øn de la gCounty aged Ն20 years received writteninvitations together with questionnairesand appointed dates for physical tests andblood samples. In the questionnaires, theparticipants were asked about demo-graphic characteristics, health status, life-style, health habits, and their livingconditions. Of 92,100 individuals in-vited, 65,648 (71.3%) responded. The
● ● ● ● ● ● ● ● ● ● ● ● ● ● ● ● ● ● ● ● ● ● ● ● ● ● ● ● ● ● ● ● ● ● ● ● ● ● ● ● ● ● ● ● ● ● ● ● ●
From the 1Department of Neuroscience, Faculty of Medicine, Norwegian University of Science and Tech-nology, Verdal, Norway; the 2Nord-Trøndelag Hospital Trust, Department of Psychiatry,Hospital Levanger,Levanger, Norway; the 3Research Centre for Health Promotion, University of Bergen, Bergen, Norway; the4HUNT Research Centre, Department of Public Health and General Practice, Norwegian University of Science and Technology, Verdal, Norway; and 5The Norwegian Radium Hospital, Oslo, Norway.
Address correspondence and reprint requests to Anne Engum, MD, Department of Psychiatry, HospitalLevanger, N-7600 Levanger, Norway. E-mail: [email protected].
Received for publication 13 December 2004 and accepted in revised form 3 May 2005.Abbreviations: HADS, Hospital Anxiety and Depression Scale; HADS-D, Hospital Anxiety and Depres-
sion Scale, depression items; HUNT, Nord-Trøndelag Health Study, Norway. A table elsewhere in this issue shows conventional and Systeme International (SI) units and conversion
factors for many substances.© 2005 by the American Diabetes Association.The costs of publication of this article were defrayed in part by the payment of page charges. This article must therefore be hereby
marked “advertisement” in accordance with 18 U.S.C. Section 1734 solely to indicate this fact.
E p i d e m i o l o g y / H e a l t h S e r v i c e s / P s y c h o s o c i a l R e s e a r c hO R I G I N A L A R T I C L E
1904 DIABETES CARE, VOLUME 28, NUMBER 8, AUGUST 2005
7/30/2019 1904.full_2
http://slidepdf.com/reader/full/1904full2 2/6
youngest and oldest age-groups had thelowest rates of attendance, whereas thehighest rates were found among womenand middle-aged persons.
Our sample comprised individualsaged 20–89 years with valid ratings of depression, self-report of diabetes, data
about marital status, level of education,smoking habits, BMI, and physical activ-ity. Included were also self-reports aboutsomatic diseases and physical impair-ments. The nondiabetic population com-prised 59,329 individuals. A total of 223had type 1 diabetes, 958 had type 2 dia-betes, and 359 individuals had other sub-types of diabetes or did not take theverifying blood tests and were left unclas-sified. In this study, the main topic was tocompare individuals with types 1 and 2diabetes with nondiabetic responders.
Accordingly, individuals with unclassi-fied diabetes were excluded from theanalyses.
Psychological featuresSymptoms of depression were screenedusing the Hospital Anxiety and Depres-sion Scale (HADS) (15,16). The scale con-sists of seven items for depression(HADS-D) and seven for anxiety. OnlyHADS-D scores were utilized in thisstudy. A main characteristic of HADS-D isthat items covering somatic symptoms of depression have been eliminated to avoidfalse-positive results when used in so-matic settings. In this study, we used therecommended cutoff of eight for casenessof depression. However, this should notimply a level of clinical depression, whichcannot be inferred from the screening in-strument used in the present study.HADS has been extensively tested and haswell-established psychometric properties(17). Several studies have demonstratedgood sensitivity, specificity, and receiveroperating characteristics of HADS. Highcorrelation between HADS scores has
been obtained in relation to other ques-tionnaires and structured interviews de-tecting depression (18,19).
Somatic healthThe initial selection of individuals withdiabetes was based on self-reports. Meta-bolic control was determined by HbA
1c
(A1C) in all individuals who had diabetes. A1C values reflect the average level of blood glucose in the past 3 months. Thetest is widely accepted as a reliable andvalid index of metabolic control. In addi-
tion, all participants indicating a historyof diabetes (nϭ 1,638) received a specificquestionnaire about the disease and1,540 responded. Of those, 1,181 partic-ipated in additional fasting blood test forglucose, C-peptide, and anti-GAD anti-bodies. According to autoantibodies to
GAD, C-peptide tests, and information onstart of insulin treatment, the responderswere further divided into types 1 and 2diabetes. C-peptide was tapped by the ra-dioimmunoassay method (DiagnosticSystem Laboratories, Webster, TX), andanti-GAD antibodies were measured viaimmunoprecipitation by using [3H]leucine translation-labeled GAD65 as theindicator.
A total of 19,979 individuals reporteda history of one or more of the followinghealth problems: cardiovascular diseases
(including angina pectoris, myocardialinfarction, stroke, and hypertension),musculoskeletal diseases (including an-kylosing spondylitis, osteoarthritis, rheu-matoid arthritis, and osteoporosis),thyroid diseases (including hypothyroid-ism, goiter, and hyperthyroidism), can-cer, and asthma. A dichotomous variablefor “somatic diseases” was defined as oneor more of the above-mentioned healthproblems, as opposed to none.
The participants were asked to assesshow much their function was impaired orrestricted with regard to vision, hearing,and movement. Two dichotomous vari-ables were made from the self-reporteddata about the presence (moderately orseverely impaired vision and/or impairedhearing and/or restricted movement) orabsence of physical impairment.
The variable “somatic complaints” in-cluding symptoms such as pain, stiffness,or gastrointestinal symptoms (dyspepsia,nausea, or diarrhea) were divided intoone or more complaints versus none.
Demographic and lifestyle variables
Education was classified into low andhigh: low levels of education coveredcompulsory education (Յ9 years),whereas high education was defined asϾ9 years of school. Two dichotomouscategories were developed for marital sta-tus: single (unmarried, widowed, di-vorced, or separated) versus married orcohabiting.
Lifestyle variables covered informa-tion about smoking, BMI, and physicalactivity. Smokers were defined dichoto-mously into current smokers or not. BMI
was treated as a continuous variable. Theparticipants were asked to give informa-tion about how many hours they spent onphysical activity in their spare time duringthe last year(hours per week). In a dichot-omous variable, physical inactivity wasscored as positive whenever the person
spentϽ1 h per week on physical activities.
StatisticsThe t test or 2 test were used to investi-gate differences on demographic charac-teristics, somatic health, and depressionas measured by HADS-D between type 1or type 2 diabetes and the nondiabeticpopulation. Then bivariate analyses be-tween depression and demographic, life-st yle , a nd soma t ic va ria ble s we recomputed in type 1 and type 2 diabetesand in the nondiabetic population.
To determine whether the factorsidentified in type 1 or type 2 diabetes ascorrelating with depression were specificor shared with the nondiabetic popula-tion, logistic regression models were usedwith depression as a dependent variable.The factors, type 1 (or type 2) diabetes,and the interaction term between the fac-tors and type 1 (or type 2) diabetes wereused as independent variables in 20 sep-arate runs. The models were adjusted fordemographic, lifestyle, and clinical vari-ables that were related to the exposureand that in a stepwise logistic regressionwere related to the outcome (depression)with PϽ 0.20. All the variables in the fullmodels contributed to the models andwere retained. No factors were stronglycorrelated in a collinearity analyses. TheHosmer-Lemeshow goodness-of-fit testwas used to assess model fit. If the inter-action term was positive, the factor wasmore associated with depression in type 1or type 2 diabetes than in the nondiabeticpopulation and accordingly less associ-ated if the interaction term was negative.
We examined the potential for effect
modification by including interactionterms between age and sex with each fac-tor in the analyses.
The relationship between A1C andHADS-D was investigated by linear re-gression analyses adjusted for age and sexin type 1 and type 2 diabetes. The depen-dent variable, HADS-D, was fairly nor-m a l l y d i s t r i b u t e d b o t h i n t y p e 1(skewness ϭ 1.092, kurtosis ϭ 1.458)and in type 2 diabetes (skewness ϭ0.813, kurtosis ϭ 0.353).
We undertook both unadjusted and
Engum and Associates
DIABETES CARE, VOLUME 28, NUMBER 8, AUGUST 2005 1905
7/30/2019 1904.full_2
http://slidepdf.com/reader/full/1904full2 3/6
adjusted logistic regression analyses to as-sess the associations between groups withand without chronic somatic diseases asindependent variables and depression(HADS-D Ն8) as the dependent variablewith the “no chronic disease” group serv-ing as thereference category. In a stepwiselogistic regression, all covariates were sig-nificantly related to theoutcome andwereretained in the model. All the factors werecorrelated, but a collinearity analyses re-vealed no factors were strongly correlatedwith one another.
Thelevel of significance was set at PϽ0.05. All tests were two way and SPSS-PC12.0 was used as the statistical package.
The National Data Inspectorate andthe Board of Medical Research Ethics inHealth Region IV of Norway approved theHUNT 2 study.
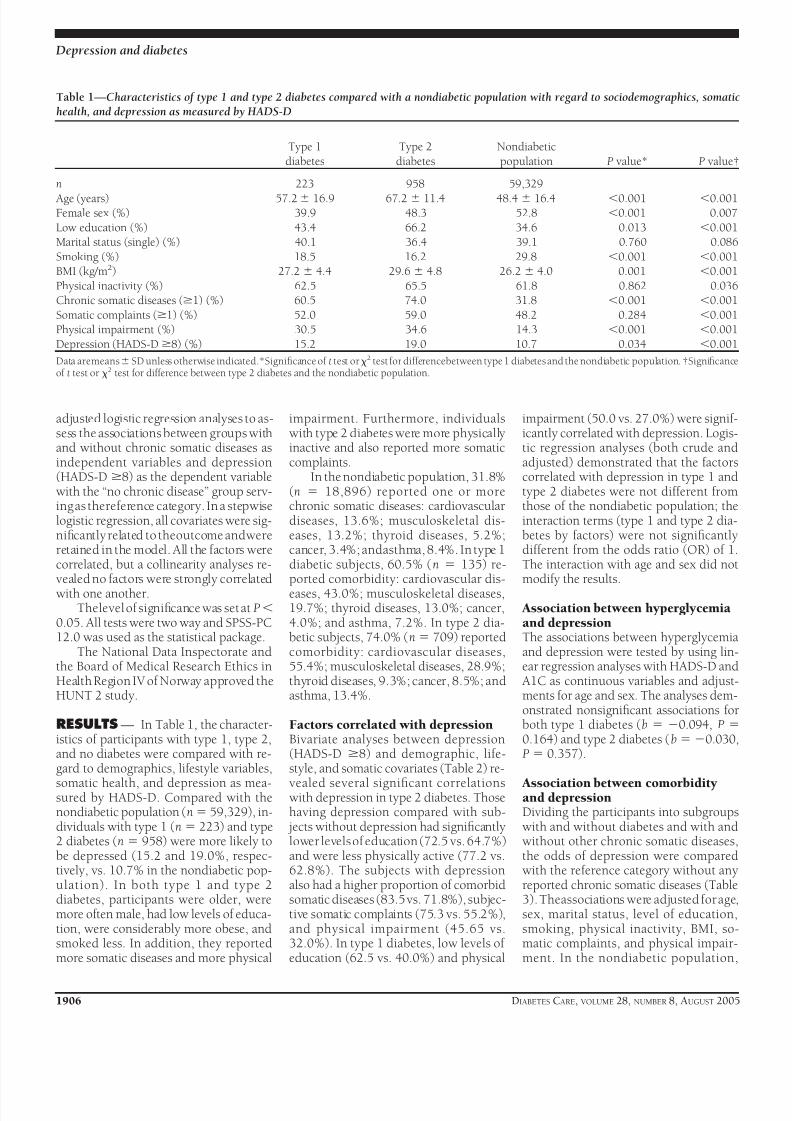
RESULTS — In Table 1, the character-istics of participants with type 1, type 2,and no diabetes were compared with re-gard to demographics, lifestyle variables,
somatic health, and depression as mea-sured by HADS-D. Compared with thenondiabetic population (nϭ 59,329), in-dividuals with type 1 (nϭ 223) and type2 diabetes (n ϭ 958) were more likely tobe depressed (15.2 and 19.0%, respec-tively, vs. 10.7% in the nondiabetic pop-ulation). In both type 1 and type 2diabetes, participants were older, weremore often male, had low levels of educa-tion, were considerably more obese, andsmoked less. In addition, they reportedmore somatic diseases and more physical
impairment. Furthermore, individualswith type 2 diabetes were more physicallyinactive and also reported more somaticcomplaints.
In the nondiabetic population, 31.8%(n ϭ 18,896) reported one or morechronic somatic diseases: cardiovasculardiseases, 13.6%; musculoskeletal dis-eases, 13.2%; thyroid diseases, 5.2%;cancer, 3.4%; andasthma, 8.4%. In type 1diabetic subjects, 60.5% (n ϭ 135) re-ported comorbidity: cardiovascular dis-eases, 43.0%; musculoskeletal diseases,19.7%; thyroid diseases, 13.0%; cancer,4.0%; and asthma, 7.2%. In type 2 dia-betic subjects, 74.0% (nϭ 709) reportedcomorbidity: cardiovascular diseases,55.4%; musculoskeletal diseases, 28.9%;thyroid diseases, 9.3%; cancer, 8.5%; andasthma, 13.4%.
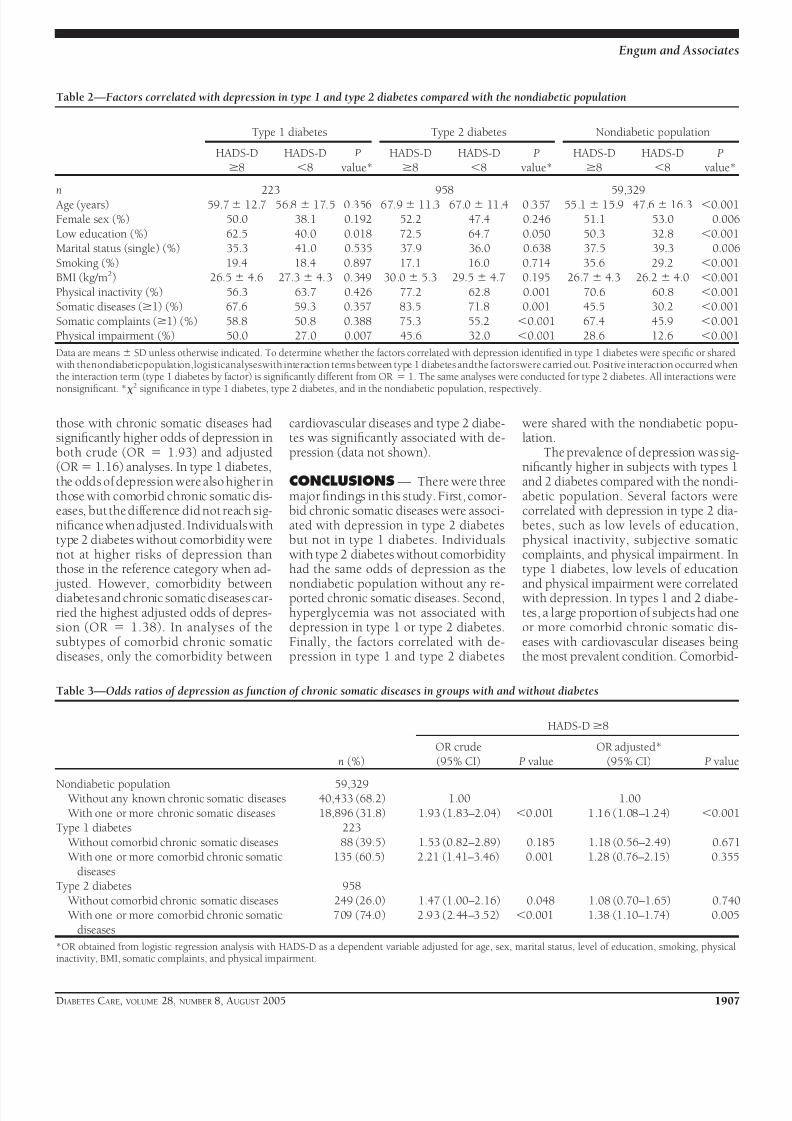
Factors correlated with depressionBivariate analyses between depression(HADS-D Ն8) and demographic, life-style, and somatic covariates (Table 2) re-
vealed several significant correlationswith depression in type 2 diabetes. Thosehaving depression compared with sub-
jects without depression had significantlylower levels of education (72.5 vs. 64.7%)and were less physically active (77.2 vs.62.8%). The subjects with depressionalso had a higher proportion of comorbidsomatic diseases (83.5vs. 71.8%), subjec-tive somatic complaints (75.3 vs. 55.2%),and physical impairment (45.65 vs.32.0%). In type 1 diabetes, low levels of education (62.5 vs. 40.0%) and physical
impairment (50.0 vs. 27.0%) were signif-icantly correlated with depression. Logis-tic regression analyses (both crude andadjusted) demonstrated that the factorscorrelated with depression in type 1 andtype 2 diabetes were not different fromthose of the nondiabetic population; theinteraction terms (type 1 and type 2 dia-betes by factors) were not significantlydifferent from the odds ratio (OR) of 1.The interaction with age and sex did notmodify the results.
Association between hyperglycemiaand depressionThe associations between hyperglycemiaand depression were tested by using lin-ear regression analyses with HADS-D and
A1C as continuous variables and adjust-ments for age and sex. The analyses dem-onstrated nonsignificant associations forboth type 1 diabetes (b ϭ Ϫ0.094, P ϭ0.164) and type 2 diabetes (bϭϪ0.030,P ϭ 0.357).
Association between comorbidityand depressionDividing the participants into subgroupswith and without diabetes and with andwithout other chronic somatic diseases,the odds of depression were comparedwith the reference category without anyreported chronic somatic diseases (Table3). Theassociations were adjusted for age,sex, marital status, level of education,smoking, physical inactivity, BMI, so-matic complaints, and physical impair-ment. In the nondiabetic population,
Table 1—Characteristics of type 1 and type 2 diabetes compared with a nondiabetic population with regard to sociodemographics, somatichealth, and depression as measured by HADS-D
Type 1
diabetes
Type 2
diabetes
Nondiabetic
population P value* P value†
n 223 958 59,329
Age (years) 57.2Ϯ 16.9 67.2 Ϯ 11.4 48.4 Ϯ 16.4 Ͻ0.001 Ͻ0.001Female sex (%) 39.9 48.3 52.8 Ͻ0.001 0.007
Low education (%) 43.4 66.2 34.6 0.013 Ͻ0.001Marital status (single) (%) 40.1 36.4 39.1 0.760 0.086
Smoking (%) 18.5 16.2 29.8 Ͻ0.001 Ͻ0.001BMI (kg/m2) 27.2 Ϯ 4.4 29.6 Ϯ 4.8 26.2 Ϯ 4.0 0.001 Ͻ0.001
Physical inactivity (%) 62.5 65.5 61.8 0.862 0.036Chronic somatic diseases (Ն1) (%) 60.5 74.0 31.8 Ͻ0.001 Ͻ0.001
Somatic complaints (Ն1) (%) 52.0 59.0 48.2 0.284 Ͻ0.001Physical impairment (%) 30.5 34.6 14.3 Ͻ0.001 Ͻ0.001
Depression (HADS-DՆ8) (%) 15.2 19.0 10.7 0.034 Ͻ0.001
Data aremeansϮ SD unless otherwise indicated.*Significance of t test or2 test for differencebetween type 1 diabetes and the nondiabetic population. †Significanceof t test or 2 test for difference between type 2 diabetes and the nondiabetic population.
Depression and diabetes
1906 DIABETES CARE, VOLUME 28, NUMBER 8, AUGUST 2005
7/30/2019 1904.full_2
http://slidepdf.com/reader/full/1904full2 4/6
those with chronic somatic diseases hadsignificantly higher odds of depression inboth crude (OR ϭ 1.93) and adjusted(OR ϭ 1.16) analyses. In type 1 diabetes,the odds of depression were also higher inthose with comorbid chronic somatic dis-eases, but the difference did not reach sig-nificance when adjusted. Individuals withtype 2 diabetes without comorbidity werenot at higher risks of depression thanthose in the reference category when ad-
justed. However, comorbidity betweendiabetes and chronic somatic diseases car-ried the highest adjusted odds of depres-sion (OR ϭ 1.38). In analyses of thesubtypes of comorbid chronic somaticdiseases, only the comorbidity between
cardiovascular diseases and type 2 diabe-tes was significantly associated with de-pression (data not shown).
CONCLUSIONS — There were threemajor findings in this study. First, comor-bid chronic somatic diseases were associ-ated with depression in type 2 diabetesbut not in type 1 diabetes. Individualswith type 2 diabetes without comorbidityhad the same odds of depression as the
nondiabetic population without any re-ported chronic somatic diseases. Second,hyperglycemia was not associated withdepression in type 1 or type 2 diabetes.Finally, the factors correlated with de-pression in type 1 and type 2 diabetes
were shared with the nondiabetic popu-lation.
The prevalence of depression was sig-nificantly higher in subjects with types 1and 2 diabetes compared with the nondi-abetic population. Several factors werecorrelated with depression in type 2 dia-betes, such as low levels of education,physical inactivity, subjective somaticcomplaints, and physical impairment. Intype 1 diabetes, low levels of education
and physical impairment were correlatedwith depression. In types 1 and 2 diabe-tes, a large proportion of subjects had oneor more comorbid chronic somatic dis-eases with cardiovascular diseases beingthe most prevalent condition. Comorbid-
Table 2—Factors correlated with depression in type 1 and type 2 diabetes compared with the nondiabetic population
Type 1 diabetes Type 2 diabetes Nondiabetic population
HADS-D
Ն8HADS-DϽ8
Pvalue*
HADS-D
Ն8HADS-DϽ8
Pvalue*
HADS-D
Ն8HADS-DϽ8
Pvalue*
n 223 958 59,329 Age (years) 59.7Ϯ 12.7 56.8 Ϯ 17.5 0.356 67.9Ϯ 11.3 67.0 Ϯ 11.4 0.357 55.1 Ϯ 15.9 47.6 Ϯ 16.3 Ͻ0.001Female sex (%) 50.0 38.1 0.192 52.2 47.4 0.246 51.1 53.0 0.006
Low education (%) 62.5 40.0 0.018 72.5 64.7 0.050 50.3 32.8 Ͻ0.001Marital status (single) (%) 35.3 41.0 0.535 37.9 36.0 0.638 37.5 39.3 0.006
Smoking (%) 19.4 18.4 0.897 17.1 16.0 0.714 35.6 29.2 Ͻ0.001BMI (kg/m2) 26.5 Ϯ 4.6 27.3 Ϯ 4.3 0.349 30.0 Ϯ 5.3 29.5 Ϯ 4.7 0.195 26.7 Ϯ 4.3 26.2 Ϯ 4.0 Ͻ0.001
Physical inactivity (%) 56.3 63.7 0.426 77.2 62.8 0.001 70.6 60.8 Ͻ0.001Somatic diseases (Ն1) (%) 67.6 59.3 0.357 83.5 71.8 0.001 45.5 30.2 Ͻ0.001
Somatic complaints (Ն1) (%) 58.8 50.8 0.388 75.3 55.2 Ͻ0.001 67.4 45.9 Ͻ0.001Physical impairment (%) 50.0 27.0 0.007 45.6 32.0 Ͻ0.001 28.6 12.6 Ͻ0.001
Data are meansϮ SD unless otherwise indicated. To determine whether the factors correlated with depression identified in type 1 diabetes were specific or sharedwith thenondiabeticpopulation,logisticanalyseswith interaction terms between type 1 diabetes andthe factorswere carried out. Positive interaction occurred whenthe interaction term (type 1 diabetes by factor) is significantly different from OR ϭ 1. The same analyses were conducted for type 2 diabetes. All interactions were
nonsignificant. *2
significance in type 1 diabetes, type 2 diabetes, and in the nondiabetic population, respectively.
Table 3—Odds ratios of depression as function of chronic somatic diseases in groups with and without diabetes
n (%)
HADS-DՆ8
OR crude(95% CI) P value
OR adjusted*(95% CI) P value
Nondiabetic population 59,329 Without any known chronic somatic diseases 40,433 (68.2) 1.00 1.00
With one or more chronic somatic diseases 18,896 (31.8) 1.93 (1.83–2.04) Ͻ0.001 1.16 (1.08–1.24) Ͻ0.001Type 1 diabetes 223
Without comorbid chronic somatic diseases 88 (39.5) 1.53 (0.82–2.89) 0.185 1.18 (0.56–2.49) 0.671 With one or more comorbid chronic somatic
diseases
135 (60.5) 2.21 (1.41–3.46) 0.001 1.28 (0.76–2.15) 0.355
Type 2 diabetes 958
Without comorbid chronic somatic diseases 249 (26.0) 1.47 (1.00–2.16) 0.048 1.08 (0.70–1.65) 0.740 With one or more comorbid chronic somatic
diseases
709 (74.0) 2.93 (2.44–3.52) Ͻ0.001 1.38 (1.10–1.74) 0.005
*OR obtained from logistic regression analysis with HADS-D as a dependent variable adjusted for age, sex, marital status, level of education, smoking, physicalinactivity, BMI, somatic complaints, and physical impairment.
Engum and Associates
DIABETES CARE, VOLUME 28, NUMBER 8, AUGUST 2005 1907
7/30/2019 1904.full_2
http://slidepdf.com/reader/full/1904full2 5/6
ity was associated with depression in type2 diabetes but not in type 1 diabetes. Intype 2 diabetes, those without comorbid-ity had the same odds of depression as thenondiabetic population without chronicsomatic diseases. This suggests that type 2diabetes without other chronic somatic
diseases does not increase the risk of de-pression. The result is in accordance withprevious research. In a previous study(14), it was reported that increased risk of depressive symptomatology in diabetesoccurred only when comorbid diseasessuch as cardiac diseases were present. An-other study showed that the impact of di-abetes itself on depression was not strongbut that depression was connected to co-morbid diseases (20).
In the present study, hyperglycemiawas not associated with depression in
type 1 or type 2 diabetes. We actuallyfound an inverse relationship between A1C and level of depression in both typesof diabetes, although the associationswere not significant. The existing litera-ture is inconsistent with regard to the rel-evance of poor glycemic control anddepression. A meta-analysis (2) reviewed28 studies and measured associations of depression in relation to glycemic con-trol. They concluded that depression wasassociated with hyperglycemia in patientswith types 1 and 2 diabetes but revealedneither the mechanism nor the directionof the association. The results of the meta-analysis were rather heterogeneous, as thestudy designs and methods differed con-siderably. The authors suggested that therelationships might have been stronger inpatients with clinical rather than withsubclinical depression.
Our findings are in accordance withthose of some other studies. Kruse et al.(21) did not find positive associations be-tween depression and A1C in a commu-nity sample. In addition, they concludedthat individuals with diabetes and A1C
levelϽ7% more often had affective disor-ders than those with poor glycemic con-trol. In the general population, patientswith high A1C levels reported slightly butsignificantly higher levels of well-beingthan patients with low A1C levels (22).One study (23) suggested that personalitytraits might be importantin achieving gly-cemic control. Lower scores on neuroti-cism and associated personality featuresof anxiety, hostility, depression, self-consciousness, and vulnerability were as-sociated with poor glycemic control. Less
dysphoric emotions may lower the moti-vation for maintaining the self-care regi-me n, whic h wa s sugge st e d a s t heexplanation for the decreased metaboliccontrol.
Factors correlated with depression intype 1 and type 2 diabetes were not dif-
ferent from those in the nondiabetic pop-ulation. In general, sociodemographic,lifestyle, and clinical variables are oftenreported to correlate with depression indiabetic populations, leaving the impres-sion that these are of particular relevanceto individuals with diabetes. Our findingsindicate that this is far from the case.There are no obvious reasons for why fac-tors correlated with depression wouldhave a particular impact on persons withdiabetes. Nevertheless, contributors todepression have been examined within
rather diverse clinical and epidemiologi-cal diabetic populations. By reviewingprior research, we have been unable tofind any reports demonstrating that fac-tors correlated with depression interactwith diabetes.
Findings of this study indicate thatfactors correlated with depression in dia-betes have the same relevance as those inthe general population and that the pres-ence of comorbid chronic somatic dis-eases might explain the associationbetween type 2 diabetes and depressivesymptoms. This supports the notion thatthe general burden of having chronic dis-eases is linked to depression. Comorbid-ity between diabetes and other chronicsomatic diseases may increase the risks of depression as a result of the psychosocialconsequences of the diseases due to anadditive effect of the perception of havingthe diseases as disabling or an awarenessof having a chronic disease. As illustratedin a population-based study (13), individ-uals in whom diabetes has already beendiagnosed had significantly higher ratesof depressive symptoms than those with
newly diagnosed diabetes. In addition,having a number of coexisting chronicconditions was a significant and indepen-dent predictor of depressive symptoms.Furthermore, a community-based studyshowed that general aspects such as phys-ical limitations might be more importantdeterminants of depression than specificdiagnoses (24).
However, this conclusion does notexclude other hypotheses addressing theconnections between depression and dia-betes. The analyses of this study indicated
increased risks of depression in type 2 di-abetes only when comorbid cardiovascu-lar diseases were present; this is afrequently occurring macrovascular com-plication in type 2 diabetes. The resultmay support theories suggesting that de-pression increases the risks of developingtype 2 diabetes and diabetes-related vas-cular complications (25). Hypotheseshave advanced that underlying factorsmay include increased insulin resistanceand reduced glucose uptake (26). An-other hypothesis is that stress-induceddisturbances of the hypothalamopituitaryadrenal axis and the development of vis-ceral obesity as a pathway to type 2 dia-b e t e s i n i n d i v i d u a l s w i t h g e n e t i csusceptibility (27).
The study was carried out on an un-selected population, thus reducing selec-
tion bias. The population was largeenough to allow for statistical adjust-ments of potential moderators. Some lim-itations of the present study have to beaddressed. First, HADS is a self-reportsymptom scale that measures depressivesympt oms only. St udie s of HADS(18,19,28) have shown that the cutoff point chosen has sensitivity and specific-ity of ϳ0.80 for depression as defined inthe Diagnostic and Statistical Manual of Mental Disorders III/III-R . Second, ourstudy focused on current, not lifetime,psychiatric disorders. Third, the samplewas predominantly of white origin andrace as a possible correlate may not bestudied. Fourth, the diagnosis of diabetesand other chronic somatic diseases wasbased on self-reported data. This ap-proach may lead to underreporting of di-agnoses. It seems unlikely, however, thatthis is a major bias as earlier research hasreported relatively good agreement be-tween self-report and in-person interviewwith regard to chronic somatic diseasessuch as diabetes (29,30). Finally, it is alsoworth considering that a proportion of
the nondiabetic population might haveundiagnosed diabetes. In this study, only218 (0.003%) individuals in the nondia-betic population had increased nonfast-ing blood glucose levels Ն11 mmol/l,indicating the diagnosis of diabetes.
Acknowledgments— The HUNT Study is acollaboration between the HUNT ResearchCentre, Faculty of Medicine, Norwegian Uni-versity of Science and Technology (NTNU), Verdal, Norway, The National Institute of
Depression and diabetes
1908 DIABETES CARE, VOLUME 28, NUMBER 8, AUGUST 2005
7/30/2019 1904.full_2
http://slidepdf.com/reader/full/1904full2 6/6
Public Health, The National Health ScreeningService of Norway, and the Nord-TrøndelagCounty Council.
References1. Anderson RJ, Freedland KE, Clouse RE,
Lustman PJ: The prevalence of comorbiddepression in adults with diabetes: ameta-analysis. Diabetes Care 24:1069–1078, 2001
2. Lustmann PJ,Anderson RJ,Freedland KE,De Groot M, Carney RM, Clouse RE: De-pression and poor glycemic control: Ameta-analytic review of the literature. Di-abetes Care 23:934–942, 2000
3. de Groot M, Anderson R, Freedland KE,Clouse RE, Lustman PJ: Association of de-pression and diabetes complications: ameta-analysis. Psychosom Med 63:619–630,2001
4. Fisher L, CheslaCA, MullanJT, Skaff MM,
Kanter RA: Contributors to depression inLatino and European-American patientswith type 2 diabetes. Diabetes Care 24:1751–1757, 2001
5. Everson SA, Maty SC, Lynch JW, KaplanGA: Epidemiologic evidence for the rela-tion between socioeconomic status anddepression, obesity, and diabetes. J Psy-chosom Res 53:891–895, 2002
6. Peyrot M, Rubin RR: Levels and risks of depression and anxiety symptomatologyamong diabetic adults. Diabetes Care 20:585–590, 1997
7. Katon W, Von Korff M, Ciechanowski P,Russo J, Lin E, Simon G, Ludman E,
Walker E, Bush T, Young B: Behavioraland clinical factors associated with de-pression among individuals with diabe-tes. Diabetes Care 27:914–920, 2004
8. Egede LE, Zheng D: Independent factorsassociated with major depressive disorderin a national sample of individuals withdiabetes. Diabetes Care 26:104–111, 2003
9. Ryerson B, Tierney EF, Thompson TJ, En-gelgau MM, Wang J, Gregg EW, Geiss LS:Excess physical limitations among adultswith diabetes in the U.S. population,1997–1999. Diabetes Care 26:206–210,2003
10. Thomas J, Jones G, Scarinci I, Brantley P:
A descriptive and comparative study of
the prevalence of depressive and anxietydisorders in low-income adults with type2 diabetes and other chronic illnesses. Di-abetes Care 26:2311–2317, 2003
11. Schellevis FG, van der Velden J, van deLisdonk E, van Eijk JT, van Weel C: Co-morbidity of chronic diseases in general
practice. J Clin Epidemiol 46:469–473,199312. Westert GP, Satariano WA, Schellevis FG,
van den Bos GA: Patterns of comorbidityand the use ofhealth services inthe Dutchpopulation. Eur J Public Health 11:365–372, 2001
13. Palinkas LA, Barrett-Connor E, WingardDL:Type 2 diabetes anddepressive symp-toms in older adults: a population-basedstudy. Diabet Med 8:532–539, 1991
14. Bisschop MI, Kriegsman DM, Deeg DJ,Beekman AT, van Tilburg W: The longi-tudinal relation between chronic diseasesand depression in older persons in the
community: the Longitudinal AgingStudy Amsterdam. J Clin Epidemiol 57:187–194, 2004
15. Zigmond AS, Snaith RP: The Hospital Anxiety and Depression Scale. Acta Psy-chiatr Scand 67:361–370, 1983
16. Snaith RP, Zigmond AS. The Hospital Anxiety and Depression Scale Manual. Windsor, Ontario, Canada, NFER-Nel-son, 1994
17. Mykletun A, Stordal E, Dahl AA:The Hos-pital Anxiety and Depression Scale(HADS): Factor structure, item analyses,and internal consistency in a large popu-lation. Br J Psychiatry 179:540–544, 2001
18. Herrman C: International experienceswith the Hospital Anxiety and DepressionScale—a review of validation data andclinical results. J Psychosom 42:17–41,1997
19. Bjelland I, Neckelmann, Tangen Haug T,Dahl AA: A review of validation studies of the Hospital Anxiety and DepressionScale. J Psychosom Research 2:69–77,2002
20. Rajala U, Keinanen-Kiukaanniemi S,Kivela SL: Non-insulin-dependent diabe-tes mellitus and depression in a middle-aged Finnish population. Soc PsychiatryPsychiatr Epidemiol 32:363–367, 1997
21. Kruse J, Schmitz N, Thefeld W: German
National Health Interview and Examina-tion Survey on the association betweendiabetes and mental disorders in a com-munity sample: results from the GermanNational Health Interview and Examina-tion Survey. Diabetes Care 26:1841–1846, 2003
22. Naess S, Midthjell K, Moum T, SorensenT, Tambs K: Diabetes mellitus and psy-chological well-being: results of the Nord-Trondelag health survey. Scand J Soc Med23:179–188, 1995
23. Lane JD, McCaskill CC, Williams PG,Parekh PI, Feinglos MN, Surwit RS: Per-sonality correlates of glycemic control intype 2 diabetes. Diabetes Care 23:1321–1325, 2000
24. de Grauw WJ, van de Lisdonk EH, BehrRR,van GerwenWH, vanden Hoogen HJ,van Weel C: The impact of type 2 diabetesmellitus on daily functioning. Fam Pract16:133–139, 1999
25. Talbot F, Nouwen A: A review of the re-lationship between depression and diabe-tes in adults. Is there a link? Diabetes Care23:1556–1562, 2000
26. Timonen M, Laakso M, Jokelainen J, Ra- jala U, Meyer-Rochow VB, Keinanen-Kiu-kaanniemi S: Insulin resistance anddepression: cross sectional study. BMJ 330:17–18, 2005
27. Rosmond R: Stress induced disturbancesof the HPA axis: a pathway to type 2 dia-betes? Med Sci Monit 9:35–39, 2003
28. Thompson C, Ostler K, Peveler RC, BakerN, Kinmonth AL: Dimensional perspec-
tive on the recognition of depressivesymptoms in primary care. The Hamp-shire depression project 3. Br J Psychiatry179:317–323, 2001
29. Bergmann MM, Jacobs EJ, Hoffmann K,Boeing H: Agreement of self-reportedmedical history: comparison of an in-per-son interview with a self-administeredquestionnaire. Eur J Epidemiol 19:411–416, 2004
30. Midthjell K, Holmen J, Bjorndal A, Lund-Larsen G: Is questionnaire informationvalid in thestudyof a chronic disease suchas diabetes? The Nord-Trøndelagdiabetesstudy. J Epidemiol Community Health 46:
537–542, 1992
Engum and Associates
DIABETES CARE, VOLUME 28, NUMBER 8, AUGUST 2005 1909