18october2011 what makes a calculation good? or bad?
TRANSCRIPT

18 October 2011
Sandia Na(onal Laboratories is a mul( program laboratory managed and operated by Sandia Corpora(on, a wholly owned subsidiary of Lockheed Mar(n Corpora(on, for the U.S. Department of Energy's Na(onal Nuclear Security Administra(on under contract DE-‐AC04-‐94AL85000. .
What Makes A Calculation Good? Or Bad?
Bill Rider Computational Shock and Multiphysics, Department
Sandia Na6onal Laboratories
SAND2011-7666C

Outline A discussion of V&V and the culture of
simulation A cartoon picture of simulation quality The impact of programs on simulation
How and why V&V has grown in emphasis Archival publications:
A couple of examples from my own experience Summary

An initial answer to my question
SOLVER OUR 3-D SOLID MECHANICS
Dilbert
Pick your legacy code technology… A legacy code’s solution is often the starting definition of a “good” calculation
Funny and relevant Dilbert

The origin of hydrodynamic calculations at Los Alamos in WWII and simulation culture.
The first hydro calculation was reported in a Los Alamos report on June 20, 1944 – lead author Hans Bethe Feynmann was the calculational lead
The first codes were 1-D and Lagrangian, where shocks were tracked, and very few zones were used.
The first calculations were done to check for nonlinear corrections to the theory. This continued for the next 15 years It was about understanding, not detail Finally in the 1960’s quantitative
agreement became important. Quality was still an expert judgement.
Ulam Feynmann Von Neumann

Roughly speaking computation moves from understanding to engineering as time progresses.
The age of computation for understanding is often viewed as a “Golden Age” where standards are weak, i.e., did the simulation help us understand something? Hence it is an idyllic time that is looked
at with fondness.
The age of computation for quantitative value is often viewed as an post-industrial wasteland where standards are strong and consequences are high, i.e., is the simulation right? Since V&V is key to the question it gets tagged as part of the horror.
Mordor

Maybe Star Wars is more your speed…
Obi-Wan Kenobi
Darth Sidious
Death Star
Witness the power of a fully armed and operational V&V
program to call your understanding into doubt!
Using the FORCE of calculation, I now understand important physical concepts!
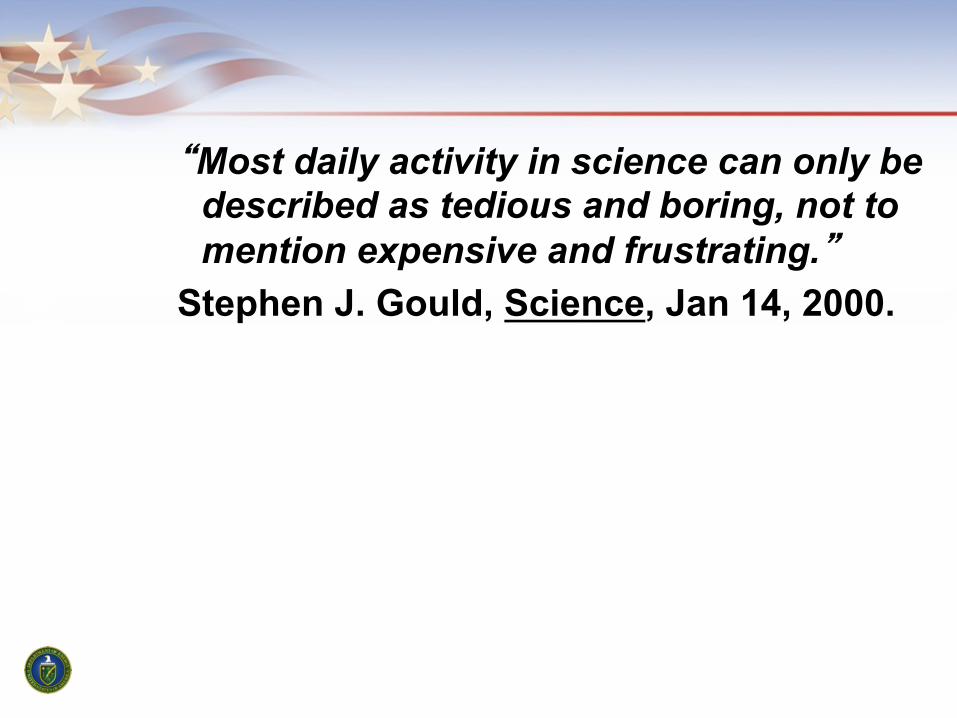
“Most daily activity in science can only be described as tedious and boring, not to mention expensive and frustrating.”
Stephen J. Gould, Science, Jan 14, 2000.

Experiments are an inherent element of any valida6on analysis.
There are different types of experiments:
Maybe repeatable Usual experimental controls
Usual error informa(on
Necessarily repeatable Careful experimental controls Extensive error informa(on
• Analysts and experimentalists need to interact! – The whole really is greater than the sum of the parts. – You really do learn from each other.
Discovery vs. Valida(on
Legacy vs. “Live” Currently undertaken Hopefully repeatable More error informa(on
LANL shock tube lab
Performed in the past OUen unrepeatable
mited error informa(on
NTS
See: W. Oberkampf, “What are Valida(on Experiments?” Experimental Techniques, 25, pp. 35–40 (2001).

The evolution of computers is hard to separate from the history of codes
ENIAC I, 1950
ENIAC V, 1960

The Mid 60’s saw the rise of the CDC machines and their “father” Seymour Cray
The dawn of the “supercomputer era”
CDC6600
CDC7600

Of course there are Crays from the 70’s-90’s

…and the modern (ASCI) era with room filling machines again!

The next generation of supercomputers may be more challenging, but no “smaller”

The most obvious aspect is the raw performance of the machines.
The LLNL Plot
Follows Moore’s Law (approx.)

“The fundamental law of computer science: As machines become more powerful, the efficiency of algorithms grows more important, not less.”
– Nick Trefethen

“This type of design process focuses heavily upon physics understanding of non-linear relationships and less upon brute force computational power. We used less than 1% of the computing power of the lab to design the RRW weapon. This low computer usage infuriated NNSA who personally berated me for placing understanding ahead of computer usage.”
– John Pedicini, LANL Lead RRW Designer, March 7, 2007, From “LANL - the Corporate Story Blog”
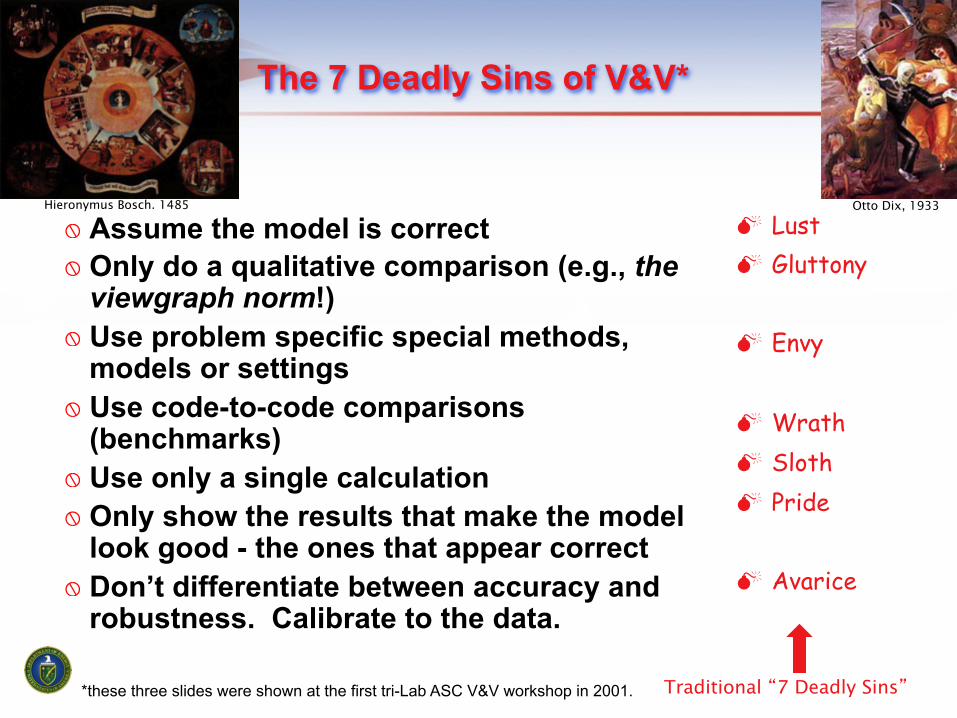
The 7 Deadly Sins of V&V*
" Assume the model is correct " Only do a qualitative comparison (e.g., the
viewgraph norm!) " Use problem specific special methods,
models or settings " Use code-to-code comparisons
(benchmarks) " Use only a single calculation " Only show the results that make the model
look good - the ones that appear correct " Don’t differentiate between accuracy and
robustness. Calibrate to the data.
Lust Gluttony
Envy
Wrath Sloth Pride
Avarice
Otto Dix, 1933 Hieronymus Bosch. 1485
Traditional “7 Deadly Sins” *these three slides were shown at the first tri-Lab ASC V&V workshop in 2001.

7 Virtuous Practices in V&V
Assume the code has flaws, bugs, and errors then FIND THEM!
Be quantitative Verify and Validate the same thing Use analytic solutions & experimental
data Use systematic mesh refinement Show all results - reveal the
shortcomings Assess accuracy and robustness
separately
Prudence
Temperance
Faith
Hope
Fortitude
Justice
Charity
Traditional “7 Cardinal Virtues” *these three slides were shown at the first tri-Lab V&V workshop in 2001.

This is the way validation is usually presented in the literature.
!
!
This is what you’ll see in most Journals. It is neither verification or validation (OK, its barely validation).
This is how Homer does it.
Exp. Data Best calculation

It might be even better if the figure was presented in terms of error too.
! !
!
You’ll almost never see this!
0.0
Exp. Data Best calculation

This presentation is an improvement because experimental error is shown.
!
!
This is not what you’ll see in most Journals, but you should.
Exp. Data Best calculation

Here is a notion of how a “converged” solution might be described.
!
!
You might see this although rarely depicted in this manner. This is not solution verification!
Exp. Data Best calculation
Fine Medium

Here is a notion of how a “converged” solution might be described.
!
!
With a third resolution convergence can be assessed, this is NOT converged (0th order).
A poor man’s method of calculation verification: (With mesh doubling) Equally spaced lines implies zeroth order Factor of two decrease implies first order Factor of four decrease implies second order
This is solution verification despite the bad results
Fine Medium Coarse
Solution Verification for

Here is a notion of how a “converged” solution might be described.
!
!
With a third resolution convergence can be assessed, this is converged (~1st order).
Exp. Data Best calculation
Fine Medium Coarse

This sequence of meshes can be used to extrapolate the solution.
!
!
With three grids plus a convergence rate a converged solution can estimated. Fine
Medium Coarse Extrapolated
Exp. Data Best calculation

The experimental “error” has two components (observation & variability).
!
!
Exp. Data Best calculation
Fine Medium Coarse Extrapolated

Finally, we have a host of other modeling uncertainties that should be quantified.
!
!
Exp. Data Best calculation
Fine Medium Coarse Extrapolated
Arrrgggg!!! Too much work for Homer

In M&S, you don’t know how good (or bad) you are if you don’t ask.
“Due diligence” means asking all the ques6ons, even if you don’t think you’ll like the answers.
28
18 AMT 2009
We all Avoid This Question
How Much is Enough? Credit: M. Pilch.

DOE mission impera6ves require simula6on and analysis for policy and decision making.
Climate Change: Understanding, mitigating and adapting to the effects of global warming Sea level rise Severe weather Regional climate change Geologic carbon sequestration
Energy: Reducing U.S. reliance on foreign energy sources and reducing the carbon footprint of energy production Reducing time and cost of reactor design and
deployment Improving the efficiency of combustion energy
systems Na&onal Nuclear Security: Maintaining a safe, secure and reliable nuclear stockpile Stockpile certification Predictive scientific challenges Real-time evaluation of urban nuclear detonation
Kamm and Trucano SAND 2011-0954P

Expectation of Quality is scope dependent
The public
The customer
Analysts
Expectations of the accuracy of scientific simulations vary. Who are you trying to convince?
Code developers
– My house – My job – The company – Your house – Some money
• I’d bet X on the result; X= • Uncertainty Quantification • Error bars on simulation results • Result converges with
refinement • Mesh refinement • Eyeball norm • Trends are reasonable • Result is plausible • Result is not ridiculous • Code returns a result
Courtesy of Greg Weirs (SNL)

The status of V&V in the late 90’s.
V&V was making inroads in professional societies. AIAA, ASME, (J. Fluids Engr.) JFE’s editorial statement was
a critical moment (more later) The NRC had made validation
and uncertainty integral to Reactor regulation
Early work was being codified through Pat Roache’s publications bringing V&V to the “mainstream” Important contributions by
Oberkampf and Blottner (Sandia)
Another key moment in the evolution toward V&V was the “CFD-vs-Wind Tunnel” debacle. This is was enormously
damaging to the community Remarkably, DOE’s ASCI
program made the same mistake 20 years later!
V&V needs to be a collaborative endeavor that embraces both experimental and theoretical science as essential partners.

Create leading-edge computational modeling and simulation capabilities critically needed to promptly shift from nuclear test-based methods to computational-based methods, to integrate stockpile stewardship elements and thus reduce the nuclear danger.
“...we can meet the challenge of maintaining our nuclear deterrent under a [comprehensive test ban] through a stockpile stewardship program without nuclear testing.”
The President’s Vision:
The DOE/ASCI Program Vision:
The ASCI Challenge
From Paul Messina: Ushering in the Era of Terascale Scientific Simulations (1999)

The University Alliance program
The five large Level I Alliance Centers have been established University of Illinois California Institute of Technology University of Utah Stanford University University of Chicago
More than a dozen Level Two alliances have been funded - focused groups
Level 3 - Individual Collaborations; large number in place
Academic Strategic Alliances!
From Paul Messina: Ushering in the Era of Terascale Scientific Simulations (1999)
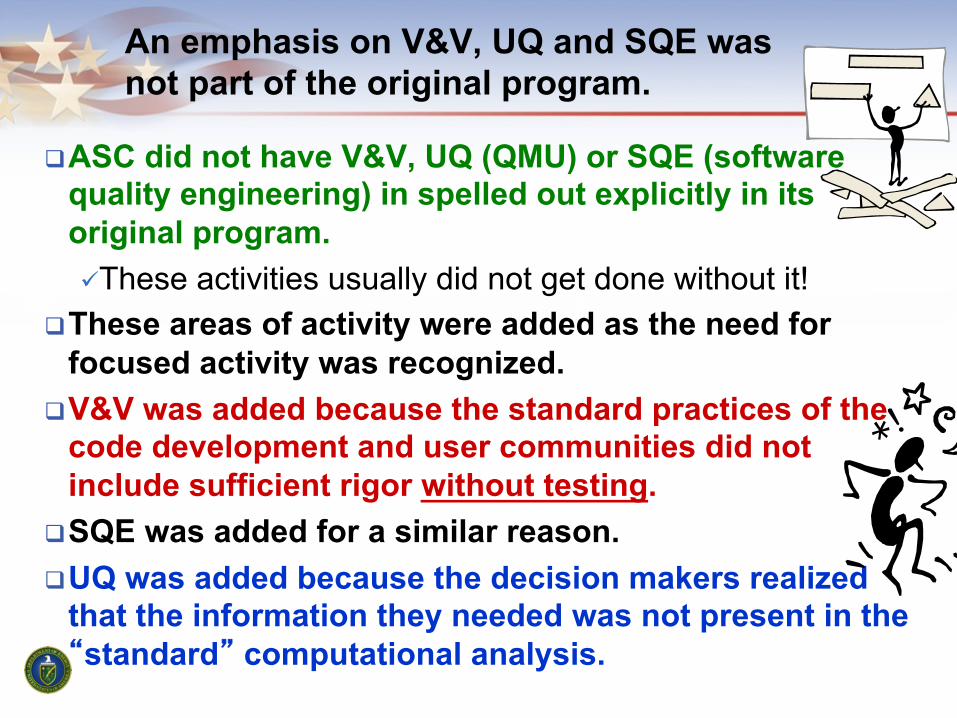
An emphasis on V&V, UQ and SQE was not part of the original program.
ASC did not have V&V, UQ (QMU) or SQE (software quality engineering) in spelled out explicitly in its original program. These activities usually did not get done without it!
These areas of activity were added as the need for focused activity was recognized.
V&V was added because the standard practices of the code development and user communities did not include sufficient rigor without testing.
SQE was added for a similar reason. UQ was added because the decision makers realized
that the information they needed was not present in the “standard” computational analysis.

Leadership in National Security Computational Science
Advanced Simulation & Computing Address to the 2008 Principal Investigator Meeting Dimitri Kusnezov
Vv T Theory Verification &
Validation Uncertainty Quantification
Uq
Sc In Infrastructure Supercomputers Code
Projects
Cp Cs Ws
113
Es 114 115
Experimental Science
Computational Science
Weapons Science

Address to the 2008 Principal Investigator Meeting Dimitri Kusnezov
New Predictive Science Academic Alliance Program (PSAAP)
Focus on a multi-scale, multi-disciplinary, unclassified application of NNSA interest
Demonstrate validated simulation capability for prediction
Produce new methodologies on: Verification Validation Uncertainty quantification Tight integration of experiment and simulation
Projected Selection Announcement – March 1, 2008
new
From Dimitri Kusnezov’s Address to the 2008 Principal Investigator Meeting

The nature of the code development is a key aspect to consider.
How well do the code developers understand what they are working on.
In some cases the key developers have moved on and are not available…
… leading to the “magic” code issue, “Any sufficiently advanced technology is indistinguishable from magic.” Arthur C. Clarke [Clarke's Third Law]
Understanding problems can be nearly improssible, or prone to substantial errors,
Fixing problems become problematic (bad choices are often made!) as a consequence. “One of the reasons why physicists need code developers is that they cannot communicate directly with a computer at their own level. In a religious context this kind of person is a shaman or a priest…” – Jack Worlton, LANL, 1982

CREATE CREATE Computational Research and Engineering Acquisition Tools and Environments
Description • Quadrennial Defense Review calls for an agile and
effective acquisition process with reduced costs and schedules.
• CREATE: Develop and deploy computational engineering tools to the acquisition programs to use with the next generation of supercomputers to design:
1. Military Aircraft, 2. Naval Ships, and 3. RF antennae for military platforms.
• CREATE tools: Enable rapid development of optimized designs with fewer flaws and better performance. Funding Requirements!
~ 35 professionals/project for ~ 10 years"
Benefits/Metrics"• Reduce acquisition program cost and schedule
overruns by minimizing design defects that lead to schedule delays and budget over-runs.!
• Enable early integration of major vehicle subsystems further reducing schedule and costs!
• Optimize Test and Evaluation program through a merged modeling and test approach!
• Improve flexibility and agility by enabling rapid assessment of design options and evaluation of the impact of candidate requirements!
• Enable and facilitate technical oversight of prime contractors by government SPOs!
• Endorsed by Acquisition Program, S&T and T&E organizations"
• Participation and support by Air Force, Army and Navy"
• Injects technology into the early stages of the acquisition process"
• Builds on present, smaller-scale computational engineering projects"
Separated Flow"
Better Antennas for the Network Centric Warfare Battlespace"
Damage from Full Ship Shock Test"
F-18E/F"
From Doug Post’s”The Promise and Challenges of Large-Scale Computational Science and Engineering” 2008

CREATE CREATE Computational Environment –Enabling Computational Engineering to Succeed–
Description • Provide the computational environment and
infrastructure necessary for each CREATE project to succeed:
• Problem (Mesh) Generation Algorithms • Software Engineering • Computational Mathematics and Algorithms • Analysis and Assessment Tools (e.g.
visualization) • Software Development and Collaboration
Infrastructure
Funding Requirements!About ½ of one project!
"
Benefits/Metrics!• Minimize duplication of common resources
needed for development and deployment !• Provide resources to develop new solution
techniques, and enable use of the best existing solution algorithms!
• Ensure common and successful approaches to risk management and mitigation!
• More resources available for essential data analysis and assessment tools!
• Improved sharing of experiences and lessons learned!
Visualization: Shield to protect Stryker from
shock waves from IHEs
Computational Mesh for Aircraft Carrier
• ASCI (DOE NNSA), DOE SC, NSF, etc. computational programs find the proposed level of computational environment support essential for success!
• Provides technical support to the three projects!• Encourages sharing of “lessons learned” and
common experiences among the CREATE projects and with similar projects and programs in other agencies and industry !
From Doug Post’s”The Promise and Challenges of Large-Scale Computational Science and Engineering”

Validation and Uncertainty Quantification Achieving credible, science-based predictive M&S capabilities
CASL = Consortium for Advanced Simulation of Light Water Reactors
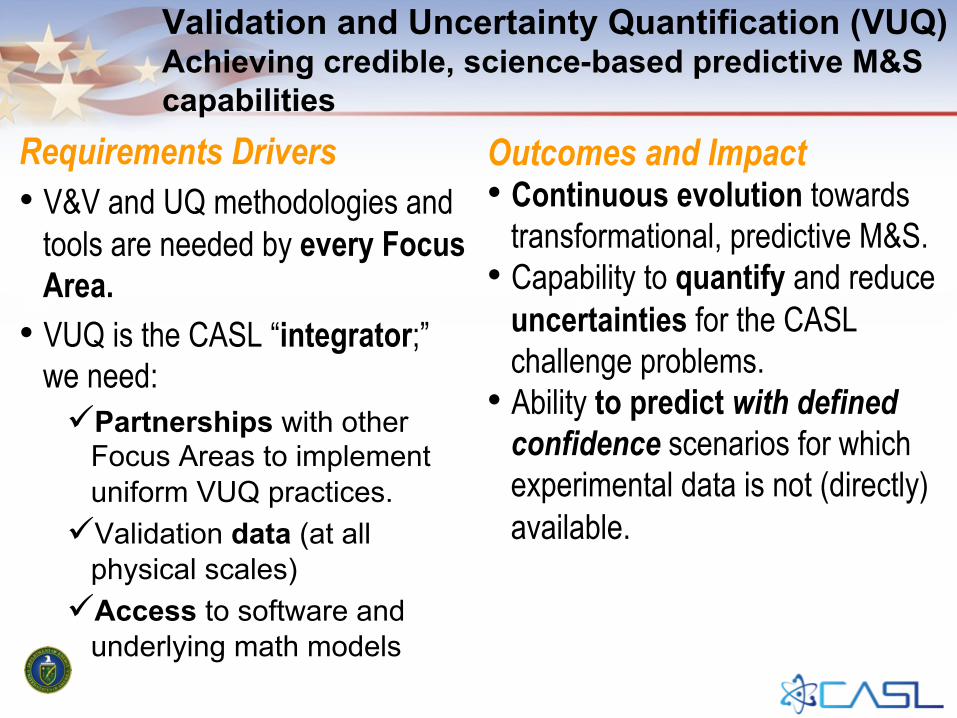
Validation and Uncertainty Quantification (VUQ) Achieving credible, science-based predictive M&S capabilities
Requirements Drivers • V&V and UQ methodologies and
tools are needed by every Focus Area.
• VUQ is the CASL “integrator;” we need: Partnerships with other
Focus Areas to implement uniform VUQ practices.
Validation data (at all physical scales)
Access to software and underlying math models
Outcomes and Impact • Continuous evolution towards
transformational, predictive M&S. • Capability to quantify and reduce
uncertainties for the CASL challenge problems.
• Ability to predict with defined confidence scenarios for which experimental data is not (directly) available.

Deliver Integrated Tools in VERA Simplify Interfaces/Operation; Reduce Scripting Errors/Maintenance
Move from potentially fragile, study-specific script interfaces to a unified, user-friendly capability
SNL DAKOTA optimization, calibration, sensitivity analysis, uncertainty quantification
Westinghouse VIPRE-W • text input/output • serial analysis
responses file
parameters file
loose coupling: file system
interface with separate
executables
Integrated Executable
DAKOTA
LIME
ANC Neutr-onics
VIPRE Thermal-
Hydraulics
BOA Crud
Chemistry
parameters
resp
onse
s
VERA leverages: C++ API,
integrated physics
Current Future

NE-KAMS= Nuclear Energy – Knowledge base for Advanced Modeling and Simulation
Multiple institutions participating in the development, i.e., Bettis, INL, Sandia, ANL, PNNL, Utah State University...
Establish a comprehensive and web-accessible knowledge base to provide V&V-UQ resources for M&S
Provide ability to share CFD data and models with M&S community
Incorporate standards and procedures that allow scientists and engineers to assess the quality of their CFD models and simulations
Developed Code Verification and Validation Data Standards Requirements

PCMM is a tool for managing risk in the use of modeling and simula6on.
PCMM = Predic6ve Capability Maturity Model PCMM helps avoid four types of errors in M&S:
1. Believing that the model is incorrect when it is, in fact, correct (a “false nega(ve” or “Type 1 error”)
2. Believing that the model is correct when it is, in fact, incorrect (a “false posi(ve” or “Type 2 error”)
3. Solving the wrong problem! 4. Using computa(onal informa(on incorrectly.
44 Credit: M. Pilch.

PCMM: Predictive Capability Maturity Model for Computational Modeling and Simulation
Table 1: General Descriptions for Table Entries of the PCMM
MATURITY
ELEMENT
Maturity Level 0 Low Consequence,
Minimal M&S Impact, e.g. Scoping Studies
Maturity Level 1 Moderate Consequence,
Some M&S Impact, e.g. Design Support
Maturity Level 2 High-Consequence, High M&S Impact,
e.g. Qualification Support
Maturity Level 3 High-Consequence,
Decision-Making Based on M&S, e.g. Qualification or Certification
Representation and Geometric Fidelity What features are neglected because of simplifications or
stylizations?
• Judgment only • Little or no
representational or geometric fidelity for the system and BCs
• Significant simplification or stylization of the system and BCs
• Geometry or representation of major components is defined
• Limited simplification or stylization of major components and BCs
• Geometry or representation is well defined for major components and some minor components
• Some peer review conducted
• Essentially no simplification or stylization of components in the system and BCs
• Geometry or representation of all components is at the detail of “as built”, e.g., gaps, material interfaces, fasteners
• Independent peer review conducted
Physics and Material Model Fidelity
How fundamental are the physics and material models and what is the level of model calibration?
• Judgment only • Model forms are either
unknown or fully empirical
• Few, if any, physics-informed models
• No coupling of models
• Some models are physics based and are calibrated using data from related systems
• Minimal or ad hoc coupling of models
• Physics-based models for all important processes
• Significant calibration needed using separate effects tests (SETs) and integral effects tests (IETs)
• One-way coupling of models • Some peer review conducted
• All models are physics based • Minimal need for calibration using SETs
and IETs • Sound physical basis for extrapolation
and coupling of models • Full, two-way coupling of models • Independent peer review conducted
Code Verification Are algorithm deficiencies,
software errors, and poor SQE practices corrupting the simulation
results?
• Judgment only • Minimal testing of any
software elements • Little or no SQE
procedures specified or followed
• Code is managed by SQE procedures
• Unit and regression testing conducted
• Some comparisons made with benchmarks
• Some algorithms are tested to determine the observed order of numerical convergence
• Some features & capabilities (F&C) are tested with benchmark solutions
• Some peer review conducted
• All important algorithms are tested to determine the observed order of numerical convergence
• All important F&Cs are tested with rigorous benchmark solutions
• Independent peer review conducted
Solution Verification Are numerical solution errors and
human procedural errors corrupting the simulation results?
• Judgment only • Numerical errors have
an unknown or large effect on simulation results
• Numerical effects on relevant SRQs are qualitatively estimated
• Input/output (I/O) verified only by the analysts
• Numerical effects are quantitatively estimated to be small on some SRQs
• I/O independently verified • Some peer review conducted
• Numerical effects are determined to be small on all important SRQs
• Important simulations are independently reproduced
• Independent peer review conducted
Model Validation How carefully is the accuracy of the simulation and experimental
results assessed at various tiers in a validation hierarchy?
• Judgment only • Few, if any,
comparisons with measurements from similar systems or applications
• Quantitative assessment of accuracy of SRQs not directly relevant to the application of interest
• Large or unknown exper-imental uncertainties
• Quantitative assessment of predictive accuracy for some key SRQs from IETs and SETs
• Experimental uncertainties are well characterized for most SETs, but poorly known for IETs
• Some peer review conducted
• Quantitative assessment of predictive accuracy for all important SRQs from IETs and SETs at conditions/geometries directly relevant to the application
• Experimental uncertainties are well characterized for all IETs and SETs
• Independent peer review conducted
Uncertainty Quantification and Sensitivity
Analysis How thoroughly are uncertainties
and sensitivities characterized and propagated?
• Judgment only • Only deterministic
analyses are conducted
• Uncertainties and sensitivities are not addressed
• Aleatory and epistemic (A&E) uncertainties propagated, but without distinction
• Informal sensitivity studies conducted
• Many strong UQ/SA assumptions made
• A&E uncertainties segregated, propagated and identified in SRQs
• Quantitative sensitivity analyses conducted for most parameters
• Numerical propagation errors are estimated and their effect known
• Some strong assumptions made • Some peer review conducted
• A&E uncertainties comprehensively treated and properly interpreted
• Comprehensive sensitivity analyses conducted for parameters and models
• Numerical propagation errors are demonstrated to be small
• No significant UQ/SA assumptions made • Independent peer review conducted
Con
tent
Increasing completeness and rigor
Decreasing risk
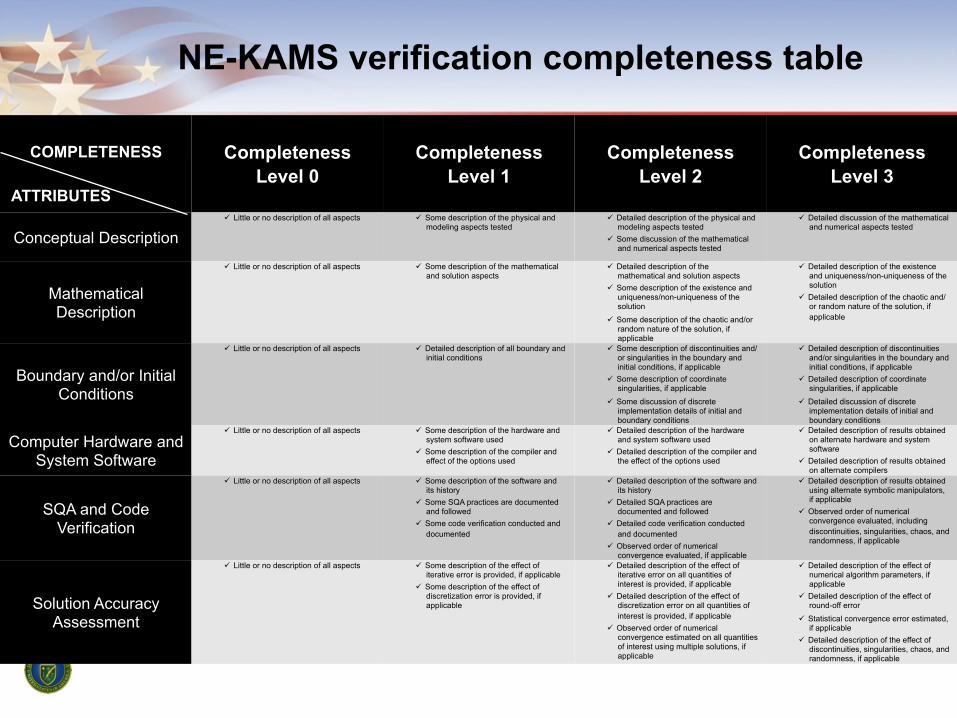
NE-KAMS verification completeness table
COMPLETENESS
ATTRIBUTES
Completeness Level 0
Completeness Level 1
Completeness Level 2
Completeness Level 3
Conceptual Description Little or no description of all aspects Some description of the physical and
modeling aspects tested Detailed description of the physical and
modeling aspects tested Some discussion of the mathematical
and numerical aspects tested
Detailed discussion of the mathematical and numerical aspects tested
Mathematical Description
Little or no description of all aspects Some description of the mathematical and solution aspects
Detailed description of the mathematical and solution aspects
Some description of the existence and uniqueness/non-uniqueness of the solution
Some description of the chaotic and/or random nature of the solution, if applicable
Detailed description of the existence and uniqueness/non-uniqueness of the solution
Detailed description of the chaotic and/or random nature of the solution, if applicable
Boundary and/or Initial Conditions
Little or no description of all aspects Detailed description of all boundary and initial conditions
Some description of discontinuities and/or singularities in the boundary and initial conditions, if applicable
Some description of coordinate singularities, if applicable
Some discussion of discrete implementation details of initial and boundary conditions
Detailed description of discontinuities and/or singularities in the boundary and initial conditions, if applicable
Detailed description of coordinate singularities, if applicable
Detailed discussion of discrete implementation details of initial and boundary conditions
Computer Hardware and System Software
Little or no description of all aspects Some description of the hardware and system software used
Some description of the compiler and effect of the options used
Detailed description of the hardware and system software used
Detailed description of the compiler and the effect of the options used
Detailed description of results obtained on alternate hardware and system software
Detailed description of results obtained on alternate compilers
SQA and Code Verification
Little or no description of all aspects Some description of the software and its history
Some SQA practices are documented and followed
Some code verification conducted and documented
Detailed description of the software and its history
Detailed SQA practices are documented and followed
Detailed code verification conducted and documented
Observed order of numerical convergence evaluated, if applicable
Detailed description of results obtained using alternate symbolic manipulators, if applicable
Observed order of numerical convergence evaluated, including discontinuities, singularities, chaos, and randomness, if applicable
Solution Accuracy Assessment
Little or no description of all aspects Some description of the effect of iterative error is provided, if applicable
Some description of the effect of discretization error is provided, if applicable
Detailed description of the effect of iterative error on all quantities of interest is provided, if applicable
Detailed description of the effect of discretization error on all quantities of interest is provided, if applicable
Observed order of numerical convergence estimated on all quantities of interest using multiple solutions, if applicable
Detailed description of the effect of numerical algorithm parameters, if applicable
Detailed description of the effect of round-off error
Statistical convergence error estimated, if applicable
Detailed description of the effect of discontinuities, singularities, chaos, and randomness, if applicable

NE-KAMS verification problem classification takes a graded approach on evidence.
Closed Form Analytical problems o The best case, includes MMS
Significant Numerical evaluation of analytical solution o The details are difficult, and prone to errors
Numerical solution of ODEs o The accuracy of the evaluation is important
Numerical Approximations of PDEs o Raises a number of thorny issues: code-to-
code comparison, direct numerical simulation,…
o What is the error bar? Why should I trust this calculation

It is important to look at what is at stake, taking DNS as an example.
DNS has been suggested as a means of validating lower level models, e.g., RANS, LES o Full field data is available to compare
against, and the comparison can be quantitative and precise
Examples of important applications where turbulence is key are easy to find: o Automobile design and performance o Aircraft design and performance o The America’s Cup (sailboat racing) o Nuclear reactor design and analysis In each case the economic impacts are potentially huge.

NE-KAMS validation completeness table
COMPLETENESS ATTRIBUTES
Completeness Level 0
Completeness Level 1
Completeness Level 2
Completeness Level 3
1. Experimental Facility
Little or no description of the facili y or its operation
Some information on the functional operation of the facility and its operating procedures
Some information on the geometric and equipment features of the facility
Detailed information on the functional operation of the facility and its operating procedures
Detailed information of the geometric and equipment features of the facility
Some information on the calibration procedures and reference standards for the facility
Some information on the calibration results and characterization of the facility
Detailed information of the fine-scale flow features/environment inside the test section
Some information of the fine-scale flow features or physical processes upstream and downstream of the test section
Detailed information on the calibration procedures and reference standards for the facility
Detailed information on the calibration results and characterization of the facility
Information on the inspection, maintenance, and repairs of the facility
2. Analog Instrumentation and Signal Processing
Little or no information on sensors and calibration procedures
Little or no information on instrumentation
Little or no information on signal processing
Some information on sensors and calibration procedures
Some information on transducers Some information on signal processing
Detailed information on sensors and calibration procedures
Detailed information on transducers Detailed information on signal
processing
Some assessment of instrument performance and suitability
Use of independent sensors and calibration procedures
Use of independent/alternative signal processing procedures
Detailed assessment of instrument performance and suitability
3. Boundary and Initial Conditions
Little or no information on boundary conditions
Little or no information on initial conditions
Little or no information on design dimensions
Some inflow quantities measured Some wall quantities measured Some initial conditions measured Detailed model-design dimensions
provided
Most inflow quantities measured Most wall quantities measured Most initial conditions measured Detailed as-built model dimensions
measured
Some outflow and reverse flow quantities measured
Fine-scale inflow quantities measured Fine-scale wall quantities measured Fine-scale outflow quantities measured Fine-scale initial conditions measured As-tested model dimensions measured Inflow and outflow quantities measured
at multiple streamwise locations
4. Fluid and Material Properties of the Walls
Little or no information on fluid and material properties
Little or no information on wall properties
Some thermodynamic state data of fluid(s) provided
Some transport properties of fluid(s) provided
Detailed information provided to determine thermodynamic state of fluid(s)
Detailed information provided to determine transport properties of fluid(s)
Volume fraction of additional phases is provided, plus size distribution statistics
All thermodynamic, transport, and optical properties of the fluid(s) are provided, as well as how these are determined
Thermal, mechanical and optical properties of the wall(s) are provided
Detailed description of additional phases is provided, plus size distribution statistics
5. Test Conditions
Little or no information on test conditions
Some description provided of the method of control and record of the test conditions
Some description provided for measuring test conditions
Detailed description provided of the method of control and record of the test conditions
Detailed description provided for measuring test conditions
Detailed description of operational procedures for setting and controlling test conditions
Detailed measurement of time and spatial variation of test conditions
6. Measurement of Experimental Responses
Little or no information on data acquisition and sampling procedures
Only mean data are provided. Only data from a single run are
provided
Some information on data acquisition and sampling procedures
Statistical analysis of final experimental responses provided
Detailed information on data acquisition and sampling procedures
Multiple experiments conducted to determine measurement uncertainty
Statistical analysis of intermediate experimental responses provided
Use of independent data acquisition procedures
Description of sensitivity of experimental responses to control of test conditions
Video recording of measurement procedures and data acquisition provided
All experimental responses reported with estimated bias and random uncertainties, including correlated uncertainties


We can see how different the user communities can be.
If one considers that the journals characterize the leading edge of work in an area.
For fluid mechanics, the engineering community has embraced well-defined standards (i.e., using V&V)
While the physics community tends to embrace a standard based on expert judgment.
These considerations tend to be reflected in practice (albeit in very broad brush strokes): Some engineers tend to work to achieve an evidence basis
for decisions Most physicists tend to provide their evidence based more
strongly on expertise.

Excerpt from the editorial policy of JFE
“Journal of Fluids Engineering disseminates technical information in fluid mechanics of interest to researchers and designers in mechanical engineering. The majority of papers present original analytical, numerical or experimental results and physical interpretation of lasting scientific value. Other papers are devoted to the review of recent contributions to a topic, or the description of the methodology and/or the physical significance of an area that has recently matured.”

Excerpt from the editorial policy of JFE (i.e. the fine print)
“Although no standard method for evaluating numerical uncertainty is currently accepted by the CFD community, there are numerous methods and techniques available to the user to accomplish this task. The following is a list of guidelines, enumerating the criteria to be considered for archival publication of computational results in the Journal of Fluids Engineering.” Then 10 different means of achieving this end are discussed, and a seven page article on the topic.

Excerpt from the editorial policy of JFE (digging even deeper, more fine print!)
“An uncertainty analysis of experimental measurements is necessary for the results to be used to their fullest value. Authors submitting papers for publication to this Journal are expected to describe the uncertainties in their experimental measurements and in the results calculated from those measurements and unsteadiness.” The numerical treatment of uncertainty follows directly from the need to assess the experimental uncertainty.
I found that the treatment of uncertainty in either case to be uncommon.

Excerpt from the editorial policy of JFE
“The Journal of Fluids Engineering will not consider any paper reporting the numerical solution of a fluids engineering problem that fails to address the task of systematic truncation error testing and accuracy estimation. Authors should address the following criteria for assessing numerical uncertainty. ” Its difficult to find language this strong for other publications, its also clear that this policy is not uniformly implemented.

Excerpt from the editorial policy of Journal of Fluid Mechanics
“Journal of Fluid Mechanics is the leading international journal in the field and is essential reading for all those concerned with developments in fluid mechanics. It publishes authoritative articles covering theoretical, computational and experimental investigations of all aspects of the mechanics of fluids. Each issue contains papers on both the fundamental aspects of fluid mechanics, and their applications to other fields such as aeronautics, astrophysics, biology, chemical and mechanical engineering, hydraulics, meteorology, oceanography, geology, acoustics and combustion.”
There is nothing about accuracy, validation, verification, convergence, etc…
Everything is in the hands of the editors and reviewers, i.e. the experts.
“An expert is someone who knows some
of the worst mistakes that can be made in his subject, and how to avoid them.”
- Werner Heisenberg

Journal of Computational Physics
Journal of Computational Physics thoroughly treats the computational aspects of physical problems, presenting techniques for the numerical solution of mathematical equations arising in all areas of physics. The journal seeks to emphasize methods that cross disciplinary boundaries. Elsevier’s reviewer guidance:

As an example, I’ll focus on two of my own papers. Both papers were written
for the “same” reason, to report algorithmic progress.
Testing, i.e. verification became important although for different reasons.
The volume tracking paper is highly cited because of the tests it introduced.
The testing of the other paper became a bit of a tug-of-war with the editor and reviewers.
Both issues point to the process to determine quality of calculations.
Rider, Greenough & Kamm, J. Comp. Phys., 225, 2007 (RGK2007). Rider & Kothe, J. Comp. Phys., 141, 1998 (RK1998).

Why did I write “Reconstructing Volume Tracking” with Doug Kothe.
We wrote the paper because the standard way of coding up a volume of fluid method was so hard to debug.
We thought we had a better way to put the method together using computational geometry (i.e., a “toolbox”)
Once the method was coded it needed to be tested: In addition existing methods for testing these methods were pretty lame.
We came up with some new tests borrowed from the high-resolution methods community (combining the work of several researchers
Dukowicz’s vortex, Smolarkiewicz’s deformation field and Leveque’s time reversal)

61
Using Computational Geometry to Construct a VOF or Volume Tracking Method
u t
12
3v t
u t
1
23
4
n
21
4
3n
T
T F
An intersection isforced on this line
n
T
F F
An intersectionis forced onthis line
Fluxes A = 12
xvyv+1 ! xv+1yv( )v=1
n"
A = !6
rv + rv+1( ) rvzv+1 " rv+1zv( )v=1
n#

Why did this paper get cited so much? Test Problems
0 10
1
Velocity Field
X
Y
0 10
1
Velocity Field
X
Y
0 10
1
Velocity Field
X
Y
0 10
1
Velocity Field
X
Y
Translation Solid Body Rotation
Vortex Deformation Field
! = 1"sin2 "x( )cos2 "y( )
u = ! "#dy,v = "#
dx
! = 14"sin 4" x + 12( )( )
# cos 4" y + 12( )( )
Too Easy! For Debugging
Zalesak’s disc
J. Dukowicz produced the earliest example I found. From P. Smolarkiewicz
!cos " t T( )From R. Leveque

0 10
1
X
Y
0 10
1
X
Y
64x64
128x128
Deform
ation Flow w
ith Time R
eversal
0 10
1
X
Y
0 10
1
X
Y
Maximum Deformation
Final State
Vorte
x w
ith T
ime
Rev
ersa
l
32x32

Single Vortex: PPIC Solutions
32x32 grid
solutions by Glenn Price
64x64 grid
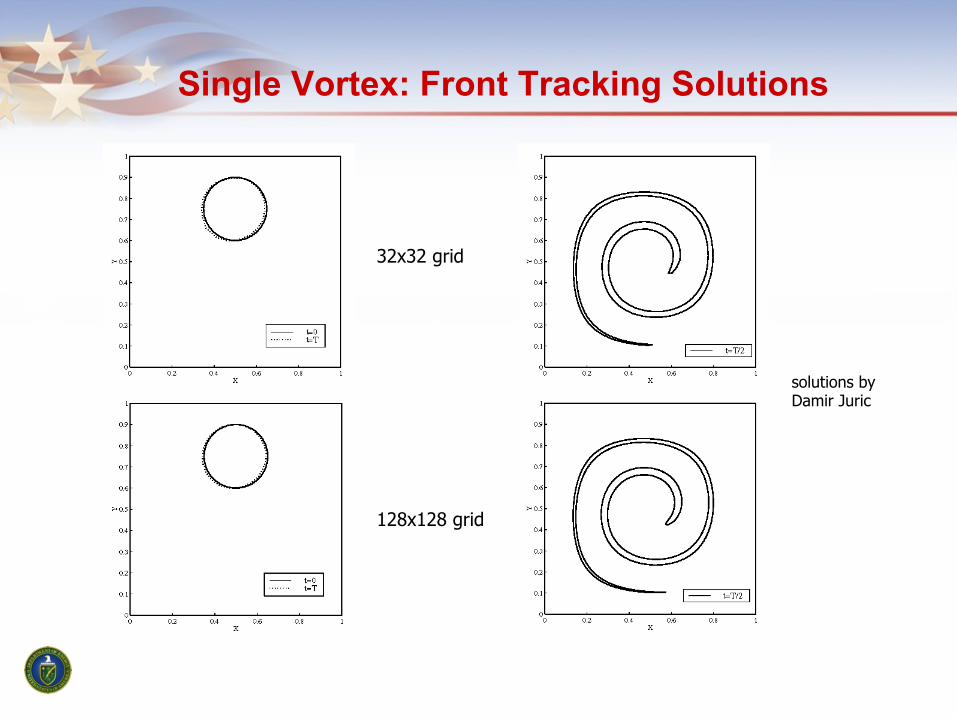
Single Vortex: Front Tracking Solutions
32x32 grid
128x128 grid
solutions by Damir Juric

Deformation Field: Front Tracking Solutions
32x32 grid
128x128 grid
solutions by Damir Juric

Deformation Field: PPIC Solutions
128x128 grid solutions by Glenn Price

Single Vortex: PPIC Solutions
32x32 grid
solutions by Glenn Price
64x64 grid

In fact 3-D Versions of these problems now exist thanks to Fedkiw, Enright, Ferzinger and Mitchell.
The new tests came from the level set community, who were originally quite resistant to these problems. In the process they have made their method a great deal better.
Enright, Fedkiw, Ferzinger & MitchellJ. Comp. Phys., 183, 2002.

010
1
1.1
5th Order WENO
x/t
density
Switching Gears to Paper 2, 1-D Shock Physics Problems
0.55 0.6 0.7 0.8 0.90
1
2
3
4
5
6
7
4th Order Slopes
x/t
4th Order Slopes
exact
3 2 1 0 1 2 30.5
1
2
3
4
5
x
exact
Shu-Osher Entropy Wave Sod’s Shock Tube
W-C Blast Waves Goal for GR2004: Compare results with“off-the-shelf” methods: • PLMDE*-piecewise linear method
for Direct Eulerian, 2nd order Godunov
• WENO5**-5th order weighted ENO
* Colella, SIAM J. Sci. Stat. Comp., 6, 1985 **Jiang & Shu, J. Comp. Phys., 126 1996

Summary of Greenough-Rider’s paper that formed the motivation for the later paper.
WENO5 is much more efficient for linear problems
PLMDE is more efficient than WENO5 on all nonlinear problems (with discontinuities)
The advantage is unambiguous for Sod’s shock tube and the Interacting Blast Waves
The advantage is less clear-cut for the “peak” problem
At a given mesh spacing WENO5 gives better answers for the Shu-Osher problem, but worse than PLMDE at fixed computational expense
Greenough & Rider, J. Comp. Phys., 194, 2004 (GR2004).

Why discontinuities are special: first order accuracy is expected for solutions containing discontinuities.
For coupled systems (even linear) with discontinuities high-order accuracy is lost between characteristics emanating from the discontinuity* Several recent works have re-confirmed this result (Osher, Carpenter, Greenough & Rider)
Can be overcome is very restrictive special cases‡ Generally with smooth data and a nonlinear system
of hyperbolic conservation laws a discontinuity (i.e., shock) will eventually form Therefore the loss of accuracy is virtually inevitable! Actually the convergence rate will typically be less than one◊ *Majda & Osher, Comm. Pure Appl. Math., 30, 1977.
‡Siklosi & Kriess, SIAM J. Num. Anal., 41, 2003. ◊Aslam, Banks, & Rider, J. Comp. Phys., 227, 2008 (ABR2008).

Greenough & Rider (2005) provided quantitative errors for these problems.
We plotted the errors as a function of position too. WENO is worse than PLMDE almost everywhere, but for a much greater computational expense. In RGK2007 nothing like this appeared. The methods we developed don’t improve Sod ST results too much, that was the point!
*We expect 0.75 in the limit of ∆x->0 due to ABR2008 **We expect 0.86 in the limit of ∆x->0 due to ABR2008
*
**

Why did I write the paper on “Accurate Monotonicity and Extrema-Preserving Methods…”
We had developed some new methods that extended the concepts in “high-resolution” methods
To provide an introduction to high-resolution schemes there is a simple principle to invoke. These methods have provided an enormous upgrade in
computational performance over the past 30 years
The Dogbert Principle: “Logically all things are created by a combination of simpler, less capable components” (see Laney in Computational Gasdynamics)
We wanted to make the simple components, the older high-resolution methods (e.g. TVD, ENO, WENO, etc…)
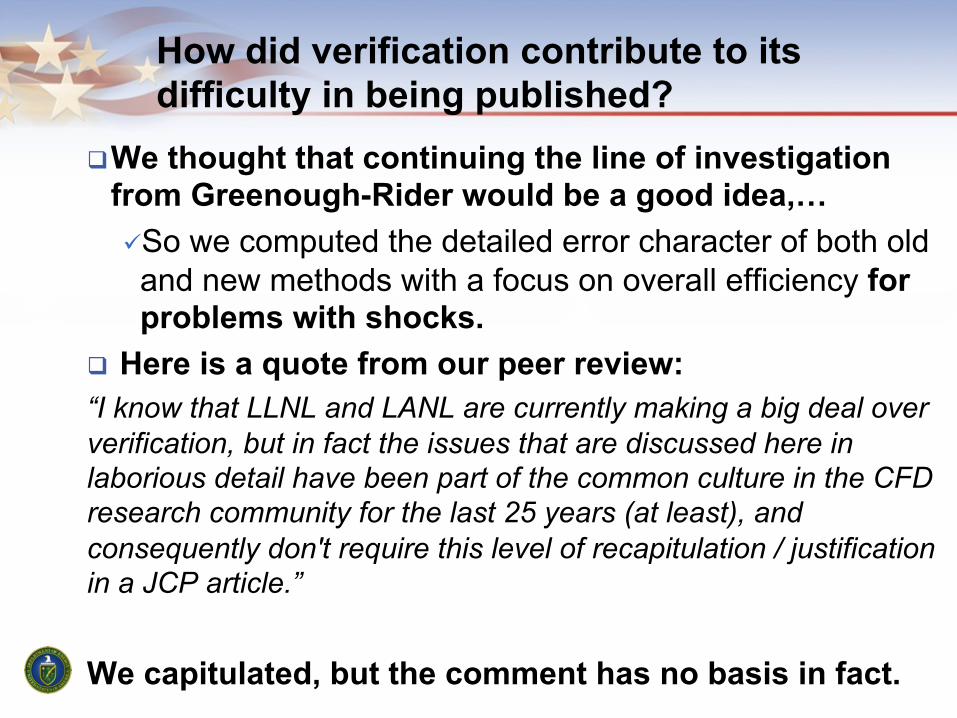
How did verification contribute to its difficulty in being published?
We thought that continuing the line of investigation from Greenough-Rider would be a good idea,… So we computed the detailed error character of both old and new methods with a focus on overall efficiency for problems with shocks.
Here is a quote from our peer review: “I know that LLNL and LANL are currently making a big deal over verification, but in fact the issues that are discussed here in laborious detail have been part of the common culture in the CFD research community for the last 25 years (at least), and consequently don't require this level of recapitulation / justification in a JCP article.” We capitulated, but the comment has no basis in fact.

Let’s look at the presentation of shock problems in detail.
From Sod’s classical 1978 paper (J. Comp. Phys. 27) (i.e., where Sod’s problem comes from)
No error or convergence rates discussed anywhere in the paper. Run time on a computer is given.

Move forward to Harten’s paper introducing TVD methods
From Harten’s classical 1983 paper (J. Comp. Phys. 49) (i.e., where TVD methods are introduced)
No error or convergence rates discussed anywhere in the paper. Run time on a computer is given.
Sod’s Shocktube Another
Shocktube

Move forward another decade to Huynh’s excellent paper in SIAM J. Num. Anal.
From Huynh’s 1995 paper (SIAM J Num. Anal. 49) (i.e., where a fantastic overview of methods is provided)
No error or convergence rates discussed anywhere in the paper. Run time on a computer is given.

Staying in this era, but returning to J. Comp. Phys.
From Jiang and Shu’s WENO paper (J. Comp. Phys. 126 - introduced 5th order WENO)
No error or convergence rates discussed anywhere in the paper. Run time on a computer is given.

What Makes A Calculation Good? Or Bad?
In a nutshell, the current criteria is largely subjective, In other words “expert” based. I think the future criteria will still be expert-based
Various programs are helping to add evidence to the judgments regarding calculation quality.
Professional societies and publications have an uneven role to play in moving the criteria forward Engineering societies and journals have a more evidence based determination of quality
Physics/hard sciences are more expert based in the determination of quality

So… What Makes A Calculation Good? Or Bad?
The answer to the question is still quite subjective, but…
… it is becoming more evidence based. This is largely a function of where you do your
work, In academic/physics settings it is dominantly expert based (i.e., more subjective)
In engineering, it is becoming more evidence based Demands on modeling & simulation from society are pushing the community toward a greater reliance on evidence based criteria.

Acknowledgements
Tim Trucano, Marty Pilch, Jim Kamm, Randy Summers, Allen Robinson, Erik Strack, Greg Weirs, Jim Stewart, and Tony Guinta (SNL)
Jerry Brock, Len Margolin, Tariq Aslam and François Hemez (LANL)
Jeff Greenough and Jeff Banks (LLNL) Kim Mousseau, Nam Dinh, Rich Johnson (INL) Jim Fort (PNNL) Bill Oberkamf (SNL retired) Bart Smith (Utah State Univ.) Chris Roy (VTU)

Who Am I ?
I’m a staff member at Sandia, and I’ve been there SNL for 5 years. Prior to that I was at LANL for 18 years. I’ve worked in computational physics since 1992.
In addition, I have expertise in hydrodynamics (incompressible to shock), numerical analysis, interface tracking, turbulence modeling, nonlinear coupled physics modeling, nuclear engineering…
I’ve written two books and lots of papers on these, and other topics.