181- 141 52 - nasa · 181- 141 52 a multifrequencyevaluationof activeand passive...
TRANSCRIPT

181- 141 52
A MULTIFREQUENCY EVALUATION OF ACTIVE AND PASSIVE
MICROWAVE SENSORS FOR OIL SPILL DETECTION AND ASSESSMENT
Richard G. Fenner
National Aeronautics and Space AdministrationLyndon B. Johnson Space Center
Houston, Texas
Stephen C. Reid and Charles H. SolieLockheed Engineering and Management Services Company, Inc.
Houston, Texas
ABSTRACT
During 1979, two major accidental oil spills occurred in the Gulfof Mexico. On June 3, 1979, the PEMEX well, Ixtoc I, suffered a blow-out and was not capped until the spring of 1980. On November I, 1979,the freighter Mimosa collided with the tanker Burma-Agate at the en-trance to the Po_ of Galveston. Five to six of the Burma-Ag_te:s tankswere ruptured. Fire resulting from the collision prevented them frombeing sealed, and several thousand barrels of crude oil were subsequentlyspilled into the Gulf. These spills presented a major ecological threatto the Texas Gulf Coast, but offored a unique opportunity to evaluatemultiple-frequencymicrowave sensor data for oil-spill detection andassessment.
During the summer of 1979, the NASA/Lyndon B. Johnson Space Centerwas evaluating an X-band synthetic aperture radar (X-SAR) system on aNASA WB-57 hlgh-altitude aircraft. Imagery of the Ixtoc I spill was ob-tained on June 3, 1979, in a flight over the Gulf of Mexico, east ofHarlingen, Texas. In November, the NASA Earth Survey #2 C-130 aircraftwas being made ready for a data-gathering mission. As part of the pre-r:issionsensor evaluation, several runs were made over the Burma-Agatespill gathering active/passive microwave and multispectral scanner data.In January 1980, an additional C-130 aircraft active/passive microwavedata flight was made over the Ixtoc I well oil spill. Supportive photo-graphic data was taken on these C-130 flights.
This paper will present an evaluation of the data gathered on theseflights with respect to how active and passi.e microwave sensors can bestbe used in oil-spill detection and assessment. Radar backscatter curvestaken over oil spills will be presented and their effect on syntheticaperture radar (SAR) imagery will be discussed. Pluts of microwave radiu-metric brightness variations ever oil spills will be presented and dis-cussed. Recommendationsas to how to _lect the best combination offrequency, viewing angle, ana sensor type for evaluation of various as-pects of oil spills will also be discussed.
163
1981005626-172
https://ntrs.nasa.gov/search.jsp?R=19810005640 2018-09-17T16:38:51+00:00Z
INTRODUCTION
Numerous studies1-z_ have been conducted which have firmly establishedthe ability of remote sensors to define the presence of oil slicks, theiraerial coverage, temporal development and spectral reflectance and emissioncharacteristics.
The effect of oil spilled on the surface of the sea is to dampen thevery short capillary waves that dominate microwave radar backscatter. Con-sequently, the use of radar for observing oil spills has been the subjectof considerable experimental effort over the last several years. The oil-spill observation is ordinarily done with an aircraft-mounted imaging radarcapable of displaying signals from the sea-surface wave patterns. A drrkarea on the image indicates the absence of capillary waves, and consequently,the presence of oil spills.
Since radar intrinsically possesses the all-weather, day/night capabil-ity and the large swath widths required for timely continuous monitoring ofoil contamination of the ocean surface, an orbital radar system is a likelycandidate for worldwide monitoring of oil spills.
Unfortunately, quantitative research into the amount of radar back-scatter suppression due to the phenomenon has been too little to adequatelypredict performance of operational radar oil-spill monitoring systems.
Early studies14 conducted by the Naval Research Laboratory concludedthat viewing angles greater than 45 degrees off nadir should be used toavoid specular returns and proviCe maximum swath widths for aircraft-mounted imaging radars.
Contrasted to the aircraft situation where incidence angle ranges of45 degrees or greater are usually required to obtain reasonable swaths, aspacecraft incidence angle range of only a few degrees (Seasat case of fivedegrees at a 22-degree incidence angle) provides swaths of lOOkm or greater.This combined with allowable viewing angles and the ambiguity cunstraint_ ofa spacecraft synthetic aperture radar (SAR) results in a need to well definethe angular response of oilspill backscatter for _,ariouswavelengths to es-tablish the system parameters for an orbital oilspill detection SAR.
K. KrishenIs presented the analysis of 13.3 GHz scatterometer datagathered over a crude-oil spill off the MiC ssippi River Delta in the GulfOT Mexico. Krishen's res,'Itsfor a moderat: sea state (wind speed of 18knots) demonstrated that scatterometer systems can be used to detect oilspills at incidence angles less than 45 degrees off nadir and that the oil'ssmouthing of the sea results in a predictable decrease in the radar scatter-ing coefficient.
This paper will present the results of analysis of the data taken onthe previously mentioned aircraft flights. In analyzing the data, emphasiswas placed on determining the optimum frequency and sensor for a spaceborneplatform.
Before describing the results of this experiment, a brief review of theinstrumentation and processing will be given to assist in the interpretationof the data presented in later sections of this paper.
INSTRUMENTATION
The NASA/JSC WB-57 and C-130 aircraft are operated as part of the Air-borne Instrumentation Research Program (AIRP). They are used to gather
164
!
1981005626-173
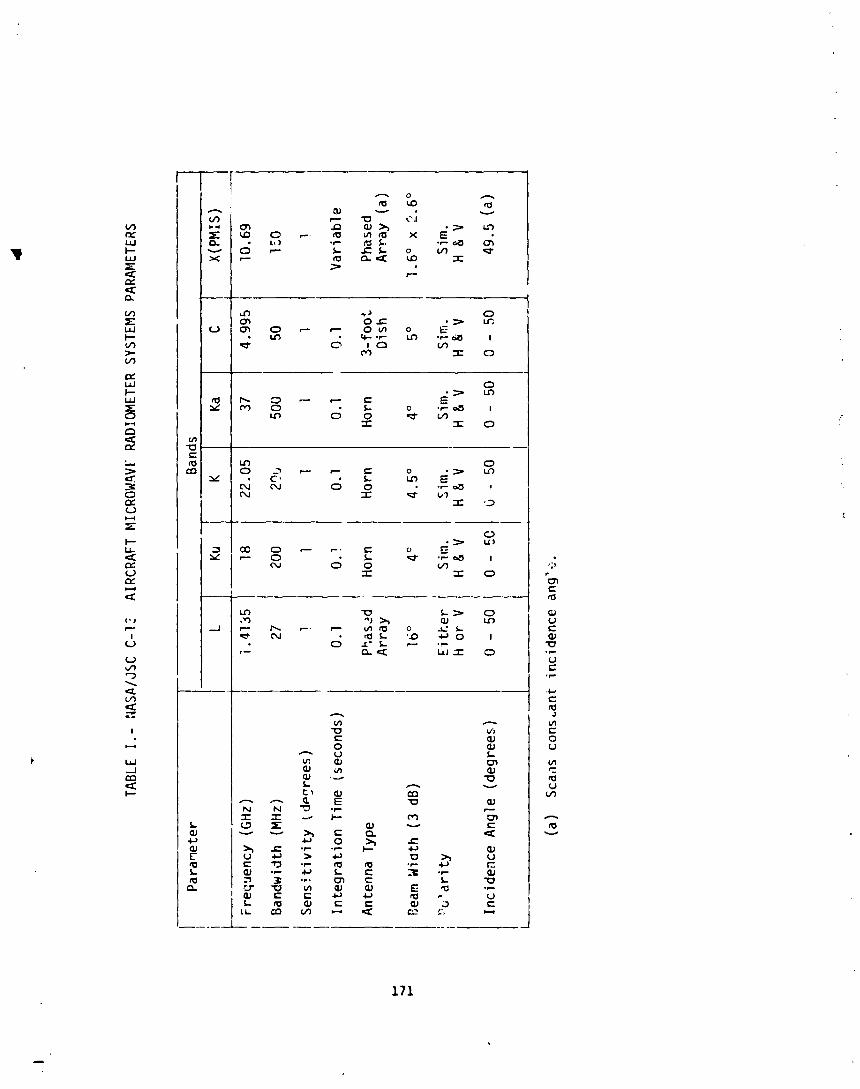
remote sensing data for Earth Resources Applications investigations. In addi-tion to active microwave sensors, both aircraft carry Zeiss color and color-infrared photographic equipment and multispectral scanners. The C-130 air-craft is instrumentedwith passive microwave radiometer systems and four ac-tive microwave sensors called scatterometers. These systems are continuouswave radars that illuminate the surface in a fan beam from nadir to 50 degrees
_.ftof nadir along the flight path of the aircraft. The operating wavelengthsare 75cm (400 MHz}, !8.5cm (I.6 GHz), 6.3cm (4.75 GHz) and 2.3cm (13.3 GHz).The spatial resolutions are approximately 75mm x 180m, 40m x 120m, 40m x 60m,and 40m x 40m respectively. Tables I and II contain the system parameters ofthe C-130 microwave radiometer and scatterometer system_.
The WB-57 aircraft carries an X-band synthetic aperture radar (SAR) sys-tem. This system is a modified AN/APQ-IO2A military recom_aissance radar.Table Ill contains the performance parameters for this system.
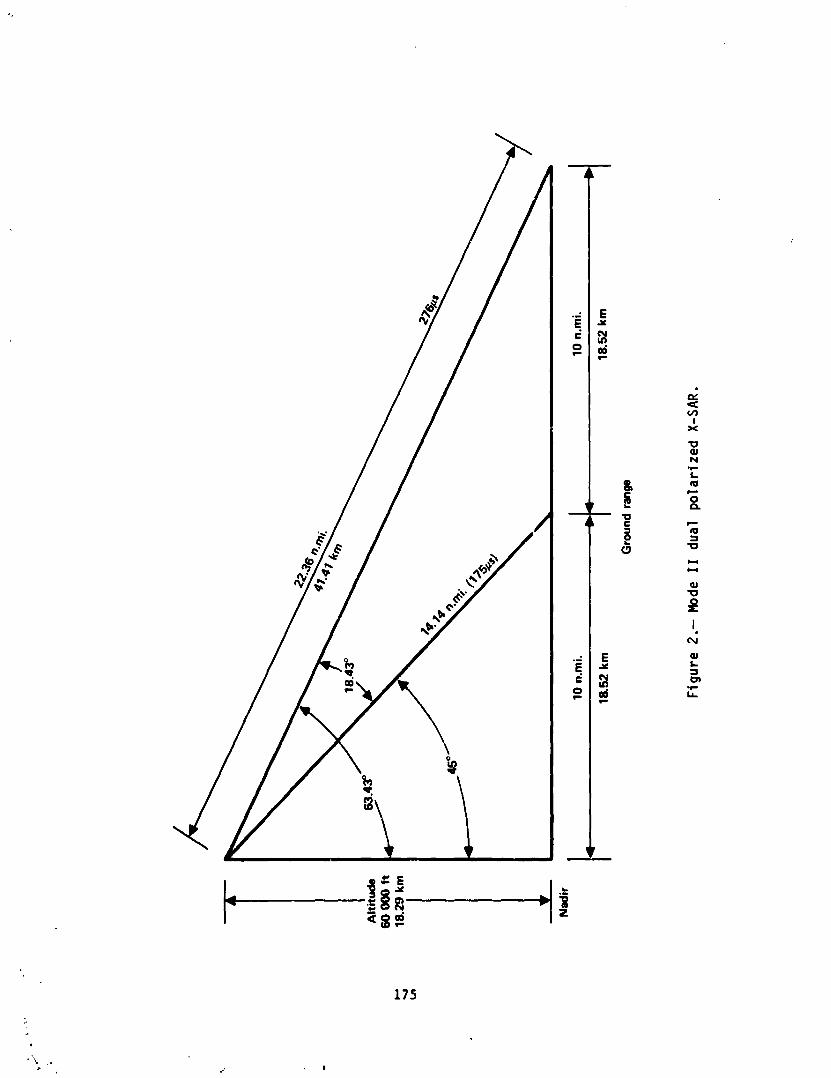
The unique feature of this radar system is the ability to position theantenna to two different ranges of incidence angles. Figures I and 2 showthese two modes of system operations.
DATA ACQUISITION
To obtain the signature of oil-covered surface and non oil-covered sur-face without changing the radar viewing direction with respect to the winddirection the aircraft was flown orthogonal to the oil slick flow direction.Two passes across each of the two oil slicks (Burma-Agate on 11/15/79 andIxtoc I on 1/29/80) were made to obtain a sufficient number of indc)endentsamples for statistical analyses. The aircraft flew at an altitude of 1500feet over the Burma-Agate spill and 2000 feet over the Ixtoc I spill. Figure3 is an aerlo, photograph obtained with a Zeiss nine-inch camera over theBurma-Agate. Figure 4 is an aerial photograph obtained over the Ixtoc I wellsite.
Of the microwave sensor data acquired, only the 13.3 GHz scatterometersystems and the C-band radiometer acquired data over both spills. Additionalscatterom_ter data at 4.75, 1.6, and 0.4 GHz was obtained over the Burma-Agatespill and additional radiometer data at 18 GHz, 22 GHz, and 37 GHz was obtain-ed over the Ixtoc I spill.
Although no ground truth was taken at either site, onboard observationsindicate6 a calm sea with low surface-wind conditions. In addition, an esti-:_ateof the sea state was made using the non oil-covered surface 13.3 GHz scat-terometer backscatter coefficient measurements and data presented by Jones.16This estimate indicated wind velocities of less than two meters per second forthe Burma-Agate flights and between four meters per second and six meters persecond for the Ixtoc I flights.
SCATTEROMETER DATA ANALYSIS
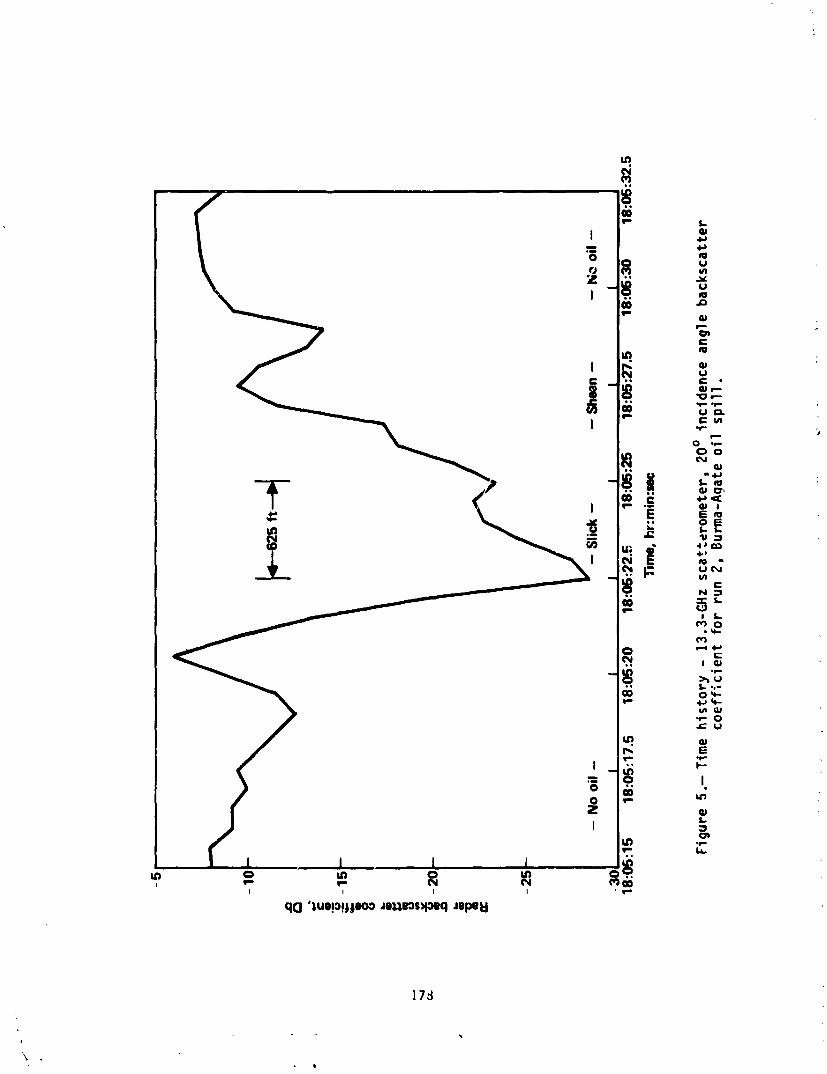
By obtaining radar data across the oil slick, time histories of back-scatter coefficient for each incidence angle of both oil-free and oil-coveredsurfaces provide measurements of the differences due to the presence of theoil. Figure 5 is a time history of 13.3 GHz 20-degree incidence angle back-scatter coefficient for Run 2 of the Burma-Agate spill. The mean value ofthe non oil-covered surface is -8 dB while the mean value of the oil slick
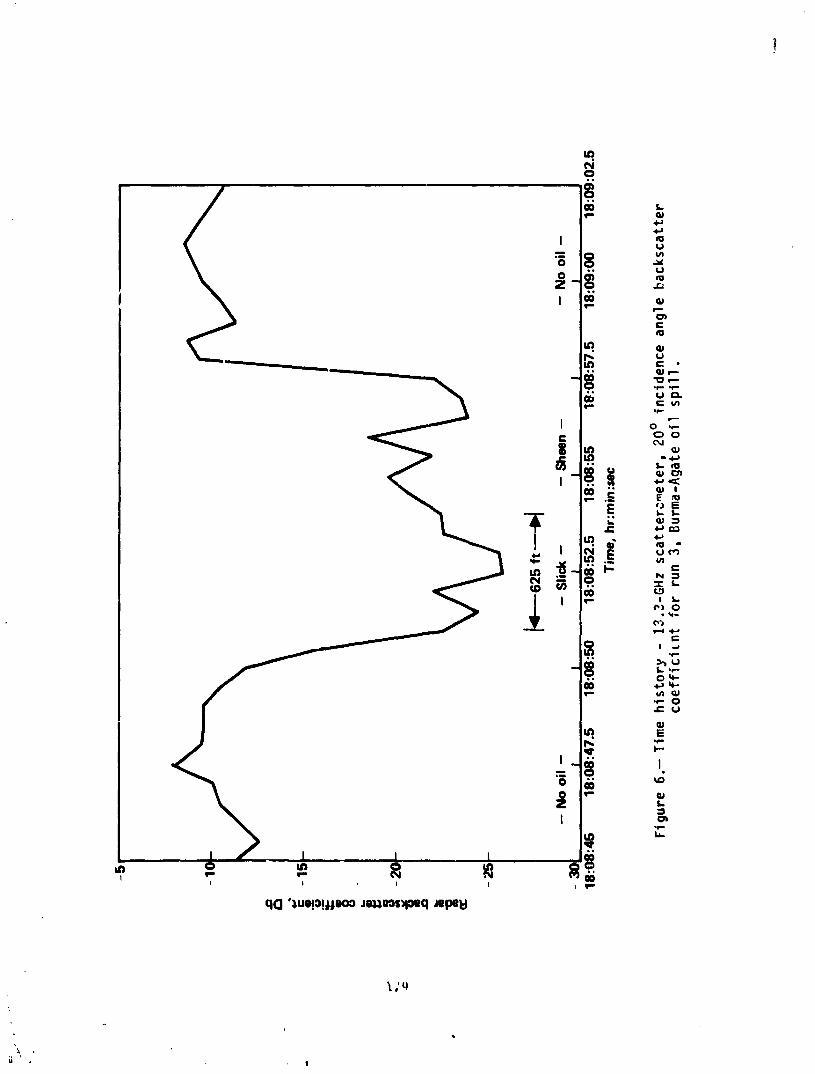
surface is -24 dB. Figure 6 is a time history of 13.3 GHz 20-degree incipience
165
i
1981005626-174

angle backscatter coefficient for Run 3 of the Burma-Agate spill. The meanvalue of the non oil-covered surfaceis -9 dB while the mean value of the oil- •slick surface is again -24 dB.
In both Figures 5 and 6, the radar return at 20-degrees incidence angleis decreased by about 16 dB due to the presence of the oil slick.
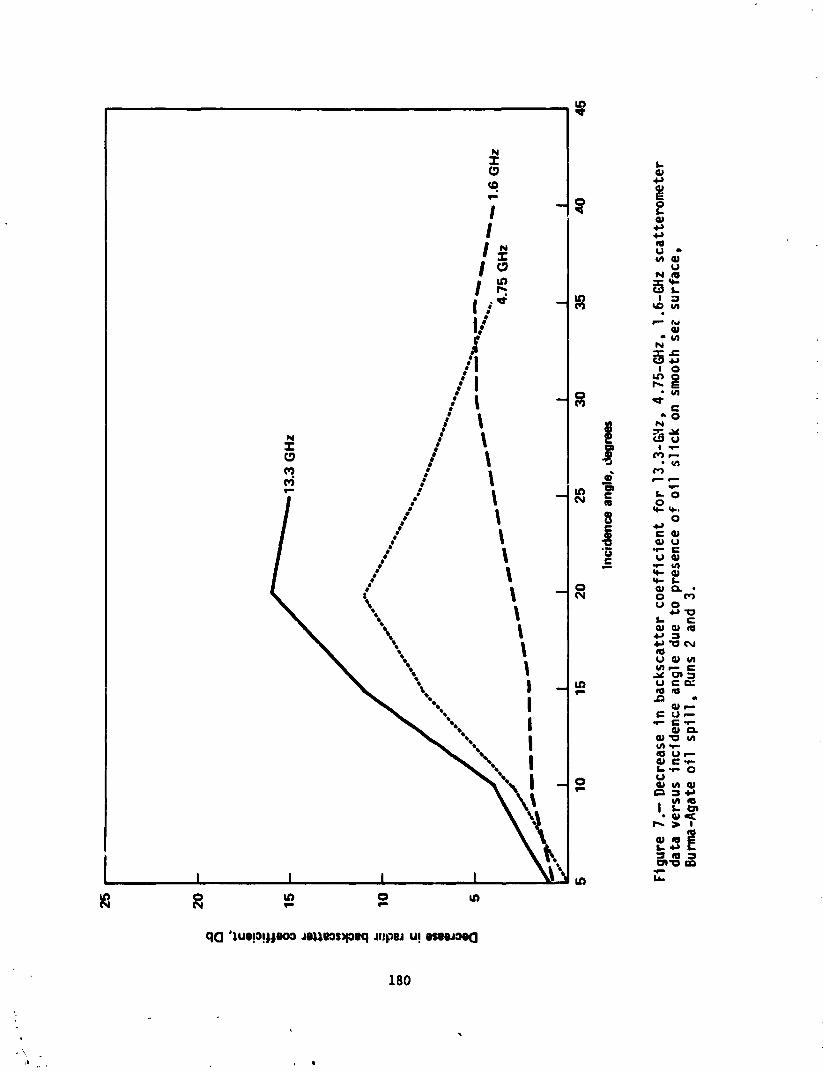
Figure 7 illustrates the angular and frequency dependence of this de-crease in radar backscatter due to the presence of an oil slick on a smoothsea surface. The P-band (75cm) data is not included since the change in _a_arbackscatter at the incidence angles being considered was negligible. The sig-nificant responses, greater than 6 dB due to the oil slick for 13.3 GHz and4.75 GHz at 15- to 30-degrees incidence angles, are encouraging in that thisrange of angles has previously not been considered for oil slick detection.
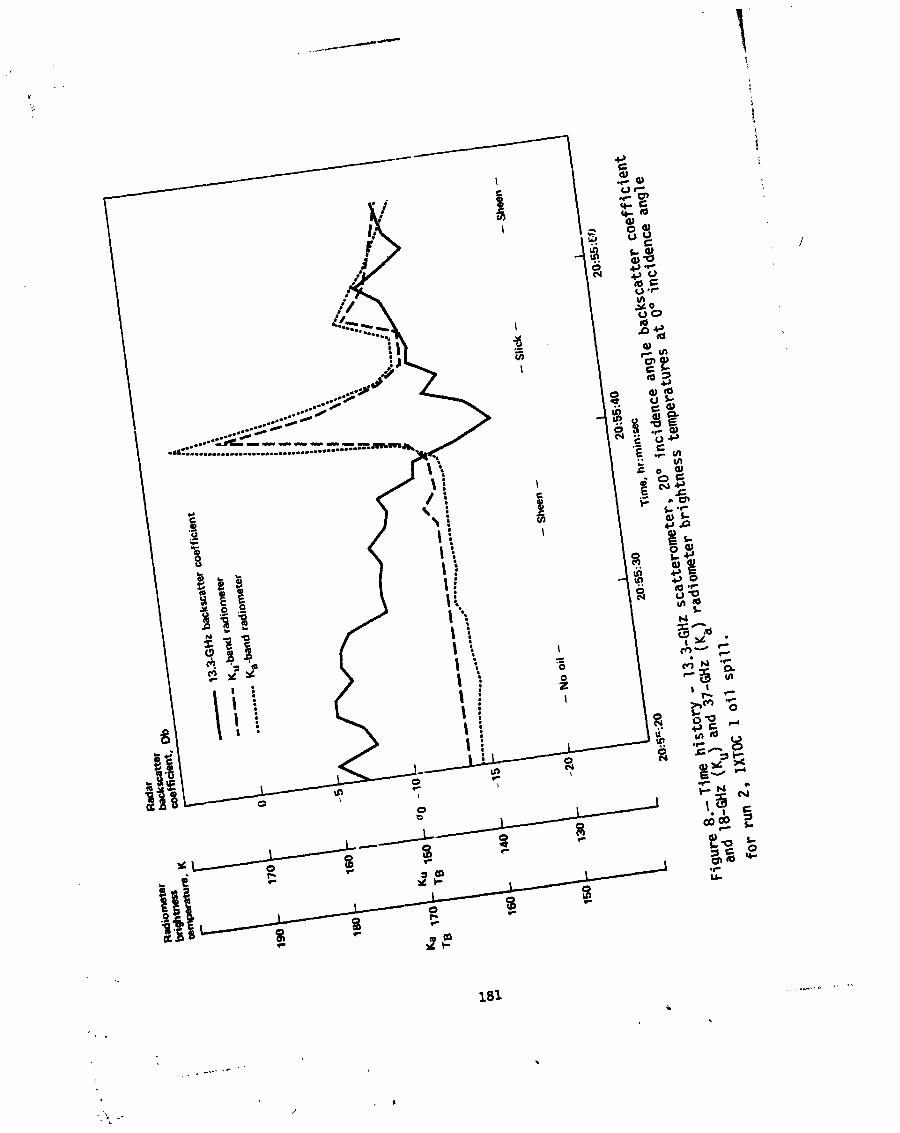
Figure 8 is a time history of the 20-degrees incidence angle backscattercoefficient for the 13.3 GHz scatterometer and the microwave brightness tem-perature for the 18 GHz and 37 GHz radiometers for Run 2 of the Ixtoc I spill.Several significant features can be noted about the nature of this spill fromFigure 8.
The higher value (-6 dB) of the backscatter coefficient at ?0:55:20/27is indicative of the return of non oil-covered surfaces with a surface wind
speed estimated at six meters per second.17 The decrease of the radar back-scatter seen from 20:55:30 to 20:55:37 without a change in th_ radiometerbrightness temperature is indicative of t_ smoothing action of an oil sheen(thickness of less than O.Imm).IB
The further decrease in the radar backscatter and the increase in
brightness temperature seen from 20:55:40 through 20:55:45 is indicative ofan oil slick (thickness approximately lmm).19,2°
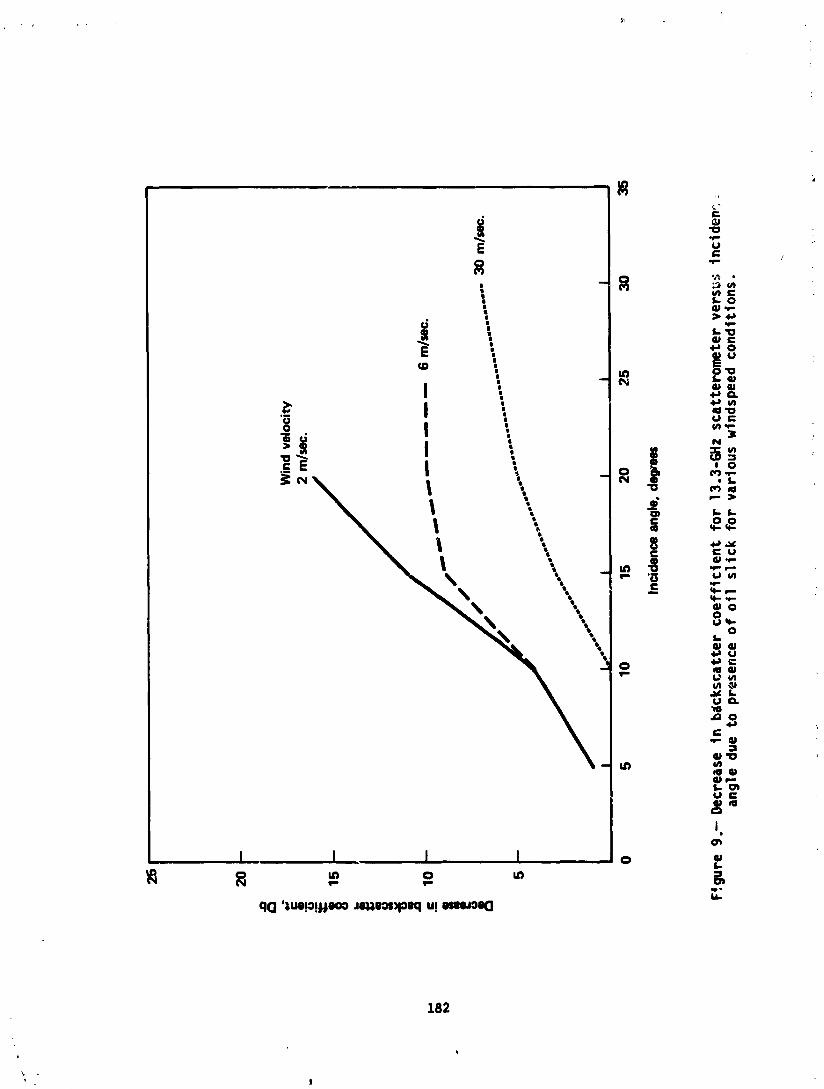
Figure 9 is a compamson of 13.3 GHz radar backscatter coefficient versusincidence angle for various wind speeds over open ocean and oil spills. Thedecreases in backscatter for incidence angles less tnan 30 degrees is seen tobe less for higher wind speeds. The 2m/sec data is from the Burma-Agate spill,the 6m/sec from the Ixtoc I spill and the 30m/sec data is from an earlierspill reported by Krishen.Is
RADIOMETER DATA DISCUSSIO_
Four radiometer data lines were selected because they highlight signifi-cant features of radio emission from an oil spill. Frequencies used i_ thedata presented are C-, Ku-, and Ka-band (4.995 GHz, 18 GHz, and 37 GHz). Un-fortunately, the I0.69 GHz scanner (Passive Microwave Imaging System) failedon the Ix_oc I mission and no data was obtained.
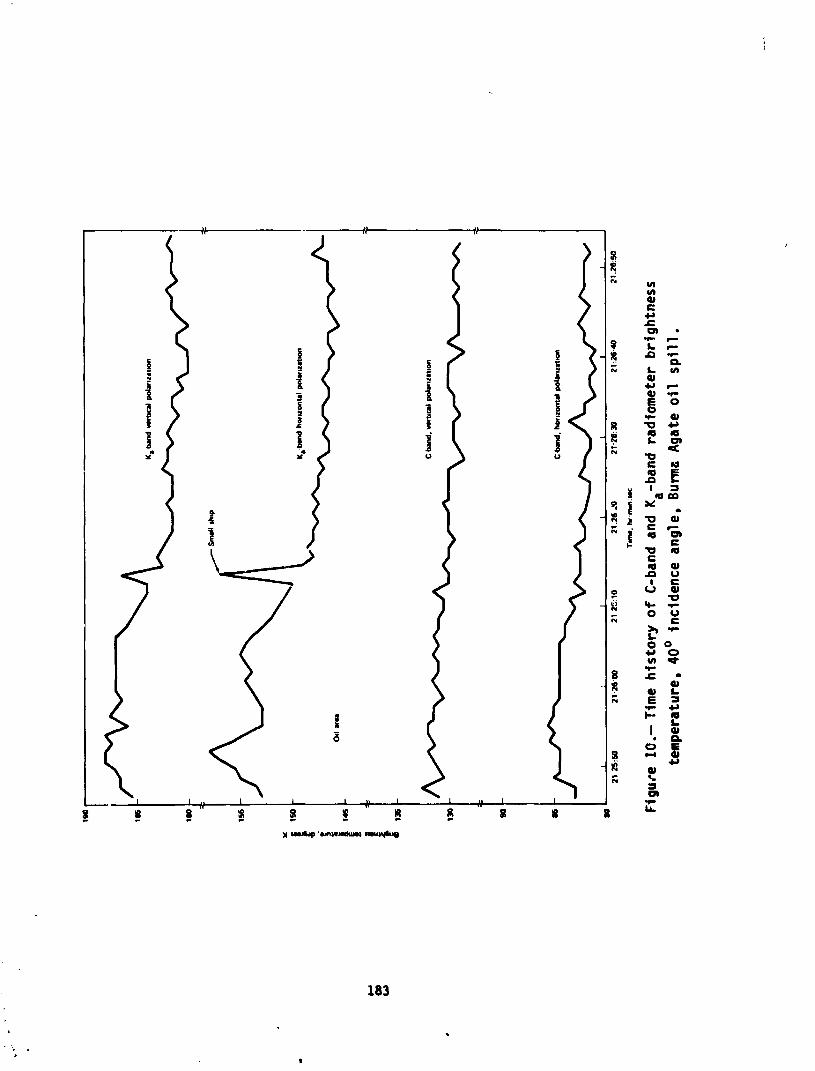
Figure lO is a time history of C- and Ka-band brightness temperaturefrom the Burma-Agate spill at incidence angles of 40 degrees. Bo_h horizon-tal and vertical polarizations are shown. The Ka-band radiometer yielded thelargest change in temperature. Review of the photographs from this flightline showed that the radiometers were turned on just as the aircraft started
to pass over the oil slick. Inmmdiately after the visible oil slick, therewas an apparent clear area, then a small ship. The K-band radiometers, how-ever, indicate that oil, though not visibie to the camera was present, andclear water was not present until after the ship.
166
t
1981005626-175

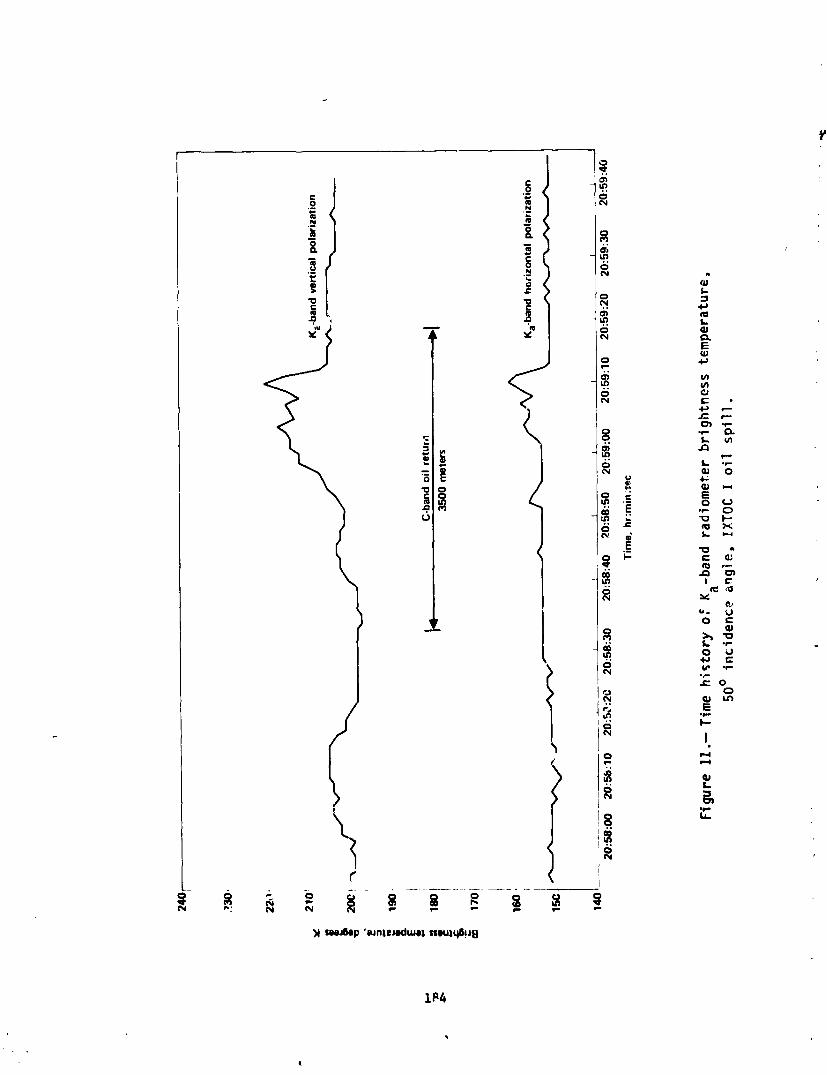
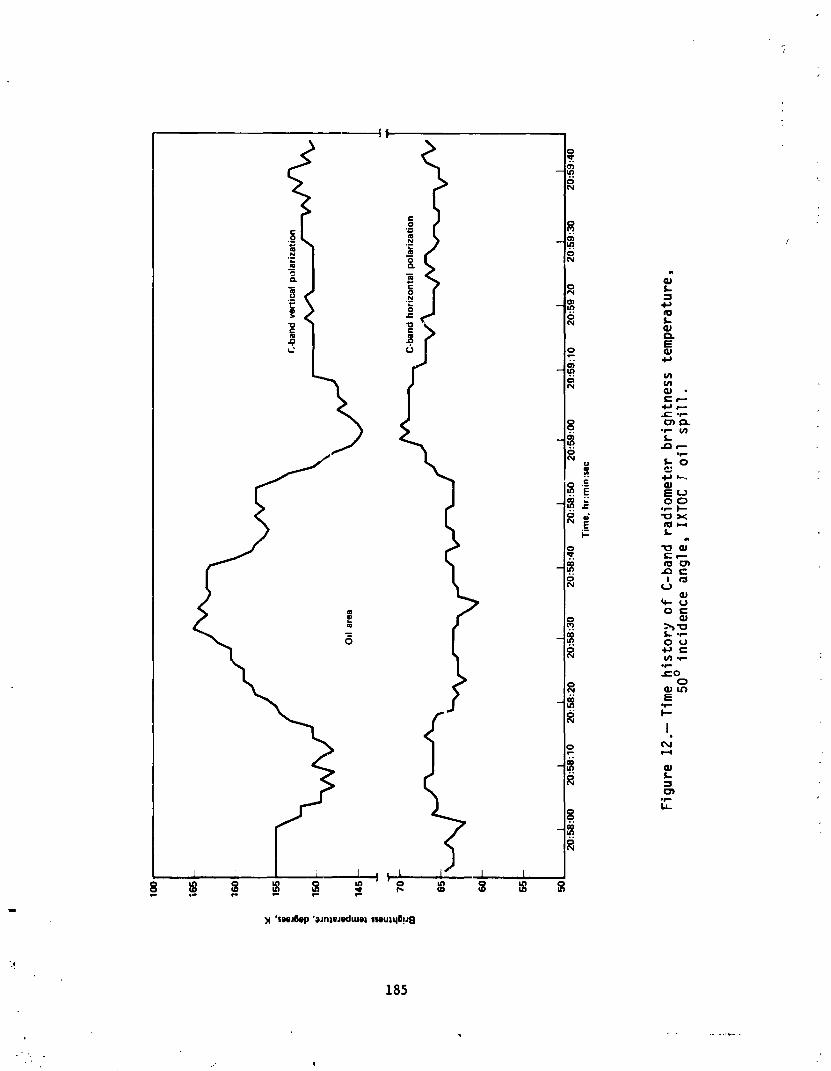
The next two Figures (II and 12) are plots of data from the Ixtoc I spillwith an incidence angle of 50 degrees. When looking at these figures, itshould be noted that the C-band system looks ahead of the aircraft while theK-bands look behind the aircraft and thus a target appears in the K-bandsapproximately 20 seconds after it appears in _he C-band. As in the Burma-Agate case, Figure II shows Ka-band data in whic:_both the horizontal andvertical channels increase in brightness temperature. Ku- and K-band data(_ot shown) responded the same. Large quantities of oil were visible in aphotograph of this area. Figure 12 shows the C-band results for the same area.At this incidence angle, the spill appears larger to the C-band radiometer'svertical cilannel. Part of this is possibly due to a larger antenna footprintfor the C-band systeln.
However, the depression of the C-band horizontal channel is most inter-esting. It is believed that this is a functimn of wind velocity and the thick-ness of the oil on the surface.
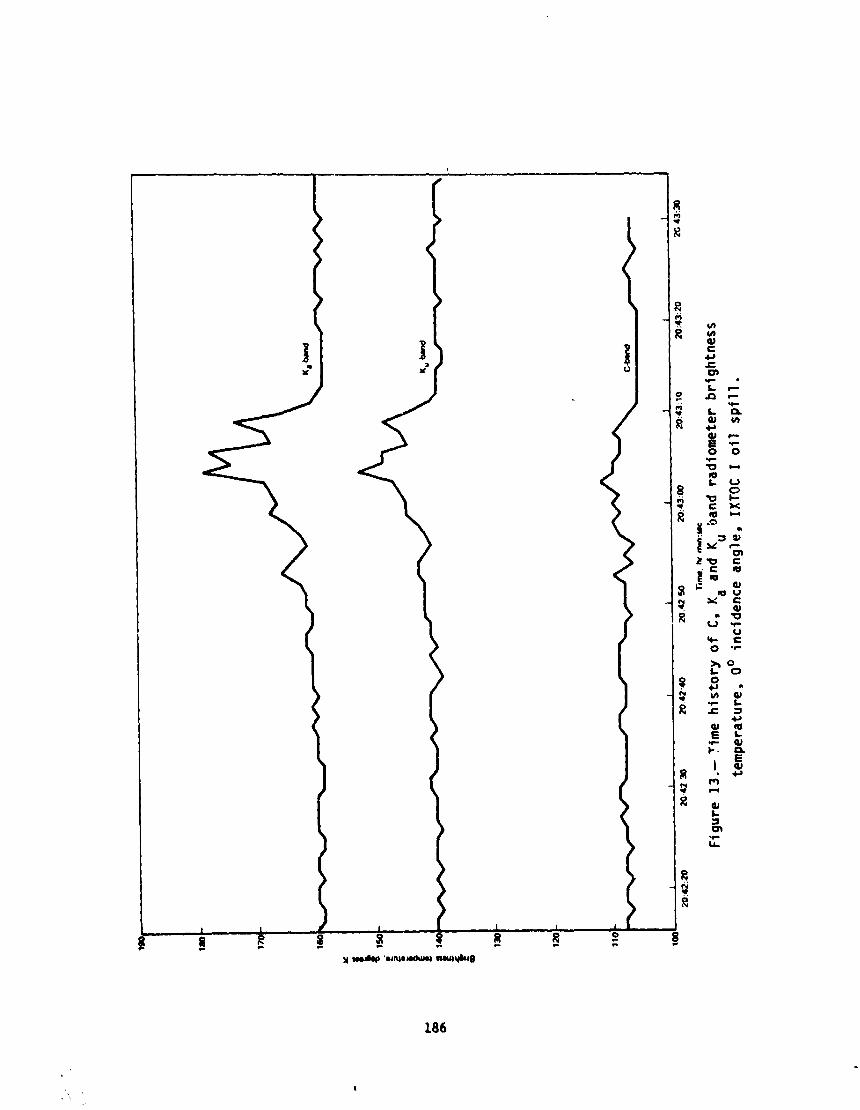
Figure 13 is a plot of the data from three radiometers, C-, Ku-, and Ka-band made in the same area as the previous two figures, but at an incidenceangle cf zero degrees. Large qbantities of oil were visible in a photographof this area. Notice the lack of a slgnificant return in the C-band datawhile Ka-band rises almost ZO degrees Kelvin.
Although no attempt has been made to determine the thickness of the oilfrom this data, thickness measurements have been made at other frequencies.2°Perhaps this data will aid others in deciding the relative importance of radio-metric data and what frequencies should be used.
RADAR IMAGERY ANALYSIS
As stated previously, the radar imagery of the Ixtoc I spill was gatheredas a part of the engineering evaluation of the system. Initial analysis of thedata was more concerned with the ability of the radar systems to clutter-lockover water. The fact that the radar could image oil slicks was considered in-teresting, but radars had imaged oil slicks previously.
After analysis of the Burma-Agate and Ixtoc I scatterometer data producedthe results shown in Figure 7, the radar imagery w_s agai.,examined. This ex-amination attempted to determine if the large decrease in backscatter at 20degrees could be seen on the imagery.
Figure 14 is a radar image of the Ixtoc I slick taken in August 1979.This image was taken on a calm day. Winds in the area were five knots or less.
Plotted below the imagery are the quieting or decrease curves of Figure 7.Although the radar imagery was taken at X-band and the scatterometer data wastaken at L-, C-, and K_-band, it can reasonably be assumed that an X-bandscatterometer would il,w produced a curve which would fall between the C-bandand Ku-band curves.
Nadir is to the left of the image. The image spans a range of incidenceangles from 14 degrees to 51 degrees. The brightness to the left of the imageis typical of what happens to radar backscatter as you approach nadir. Moreaqd more energy is backscattered and less is forward scattered.
Note that the oil slicks still darken the image in this range, particu-larly around 20 degrees as predicted by the associated curves. The fact thatthe slicks are black indicates that the change is occurring over most of thegrey scale of the film which is nominally 15 dB to 20 dB. This corresponds tothe lO dB to 15 dB quieting effect shown on the curve.
167
1981005626-176

As noted previously, this imagery was taken on a relatively calm d_y.In discussing this imagery, NOAArepresentatives were quite surprised to seethat the slicks could be seen on a calm sea. Their attempts to track theslicks with the U.S. Coast Guard AOSSsystem 6,7,13 had shown that at windspeeds less than five knots, slicks were not detectable.
This image and associated curves _learly show that the optimum range ofincidence angles for oil-spill detection is in the 15 degrees to 25 deqreesrange. In this range, the larger surface return would place a less sL, inger.tpower output requirement on the radar and the quieting effect of the oil isgreatest for lower wind speeds.
CONCLUSIONS
The data set used to prepare this paper was gathered under target ofopportunity circumstances, thus all ser,_ors were not available for allflights. However some general conclusions can be drawn. These are asfollows:
(I) The presence of an oil spill nn a K_ter surface can be detected bya microwave radar s)stem at incidence cngle_ less than 45 degrees. Higherradar frequencies produce greater contrast c_tween surfaces with and withoutoil on the surface. In the incideqce angle range of 15 degrees to 25 degrees,there is greater surface return and maximum quieting due tu the oil, thus re-ducing power output requirements on the radar.
(2) Windspeed over the surface affects the maqnitude of the differencebetween oil-rovered and non oil-covered surfaces. ]'he usP of low (<20 ° ) in-cidence angles at low microwave frequencies (L-band_ ?_cvides less detect-ibility than highe _ microwave frequencies (Ku-band)
(3) An X- or Ku-band synthetic aperture radar (SAR) operating at orbi-tal altitudes and incidence angles similar to Seasat would provide an effec-tive means for detecting, monitoring, and tracking large o11 spills.
(4) More study must be given to the effects of sea state on the activemicrowave oil-spill signature at incidence angles less than 45 degrees.
(5) Radiometers, while net having the resolution capability that SAR_ystel,s have, do have potential for determining oil thickness on the surface.
ACKNOWLEDGEMENTJ
The authors would like to express their appreciation tc Gordon C. Hrabaland James L. Lindemann of the NASA Lyndon B. Johnson Space Center AircraftOperations Division for their assistance in gathering the basic data set forthis paper; Jack M. Williams, Courtney E. Clements, and Joe R. Theriault ofLockheed Engineering and M_nagement Services Company for C-130 Nicrowave Sys-tems data reduction; and Joan P. Samonski of Lockheed Engineering and Manage-ment Services Company for the typing and editing of this paper.
168
I
1981005626-177
REFERENCES
I. Aukland, J. C., et al, 1971, hdlti-sensor Oil Spill Detection:Proceedings Seventh International Symposium of Remote Sensing ofEnvironment, pp 1045-1052.
2. Kennedy, J. M., Wermund, E. G., 1971, Oil Sp111s: Infrared and Micro-wave: Photogrammetric Engineering, pp 1235-1242.
3. Munday, J. C., Maclntyre, W. G., and Penney, M. E., 1971, Oil SlickStudies Using Photographic and Multispectral Scanner Data: Proceed-ings Seventh International Symposium of Remote Sensing of Environment,pp 1027-1043.
4. Aukland, J. C., Conway, W. H., ano S_nders, N. K., 1969, Detection ofOil Slick Pollution on Water Surfaces with Microwave Radiometer Systems:Proceedings Sixth International Symposium of Remote Sensing of Environ-ment, pp 789-796.
5. Thaman, R. R., Estes, J. E., Butler, R. W., and Ryerson, J. M., 1973,The Use of Airborne Imagery for the Estimation of Marine Oil Spills:An Operation Example: Proceedings Eighth International Symposium ofRemote Sensing of Environment, pp 1093-10£8.
6. Woolever, G. F., et al, 1975, Utilization of Remote Sensing Techniquesfor U.S. Coast Guard Missions: Proceedings Tenth International Sympo-sium of Remo':e Sensing of Environment, pp 3-16.
7. Becket, R. 1972, Coast Guard Evaluates Oil Spill Detection Schemes,Microv,ave, Nay 1972, pp 12, 14.
8. Vizy, ii. N., 1974, Detecting and Monitoring Oil Slicks with AerialPhotos: Photo _mmetric Engineering, Vol. 40, pn 597-708.
r Kotlarski, J. k., and Anderson, H. R., 1974, Oil Slick Detection byX-Band SAR: Proceedings Ninth International Symposium of Remote Sens-ing of Environment, pp 1775-1790.
I0. Pilon, R. 0., Purves, C. G., 1973, Radar Imagery of Oil Slicks: IEEETransactions on Aerospace and Electronic Systems. Vol. AES-9, No. 5,September 1973, pp 630-636.
II. Kraus, S. P., et al, 1977, R_da_ D_tec_ion of Surface Oil Slicks:Photogrammetric Engineering ana Remote Sensing, Vol. 43, No. 12,December 1977, pp 1523-1531.
12. Lund, T., 1978, Surveillance of Environ,nental Pollution and Resourcesby Electromagnetic Waves: D. Reidel Publishing Co., pp 309-318.
13. Maurer, A. T., Edgerton, A. T., and Meeks, D. C., 1977, U.S. CoastGuard Airborne Oil Surveillance System - Status Report: ProceedingsEleventh International Symposium of Remote Sensing of Environment,pp 1639-1640.
14. Guinard, N. W., 1971, The Remote Sensing of Oil Slicks: ProceedingsSeventh International Symposium of Remote Sensing of Environment,pp 1005-1026.
15. Krishen, K., 1977, Detection of Oil Spills Using 13.3 GHz Scatterometer,Proceedings Eighth Internationai Symposium of Remote Sensing of Envlron-ment, pp II05-II19.
16. Jones, W. L., et al, 1977, Aircraft Measurements of the MicrowaveScattering Signature of the Ocean: IEEE Transactions on Antennas andPropagation, 'am_ary 19/7, pp 52-61.
169
!
1981005626-178
17. Moore, R. K., Fung, A. K., 1979, Radar Determination of Winds at Sea:Proceedings of IEEE, Vol. 67, No. II, November 1979, po 1504-1521.
18. Sabins, F. F., 1978, Remote Sensing, Freeman and Company, pp 334-342.19. Smugge, T. J., 1979, The Use of Microwave Approaches in Hydrulogy:
Proceedings of the American Society of Photogrammetry, pp 9-28.20. Hollinger, J. P. and Mennella, R. A., 1973, Oi| Spills - Measurements
of Their Distributions and Volumes by Multifrequency MicrowaveRadiometery: Science Vol. 181, July 1973, pp 54-56.
170
I
1981005626-179
171
1981005626-180

i
TABLE II.- NASA/JSC C-130 SCATTEROMETERSYSTEMSPARAMETERS
P_rameter Bands
Ku C L P/
,.,
F_equency (GHz) 13.3 4.75 1.6 0.4
Solariza*,Jn VV VV or HH, VV or HH VV or HHand and andCROSS CROSS CROSS
Along-track Resolutio(feet) 120 120 12b 240
Cross-track Beamwidth
(degrees) 2.5 4 8 16
Incidence Angles(degrees) 5-50 5-50 5-50 5-50
Nominal Bandwidtil(Hz)(@ = 30° Vei : 150 kts) 400 150 50 12
Nominal IntegrationTime per Measurement
(seconds) 0.16 0.32 0.64 l.O
Number of Measurements
Averaged per Second 6 3 1.5 l.O
Precision of Measure-ment per Second of +0.36 +0.57 +l.O +2.0Spatial Data (dB)
(e : 30°) -0.38 -0.62 -I.I -2.6
172
i
l |
1981005626-181
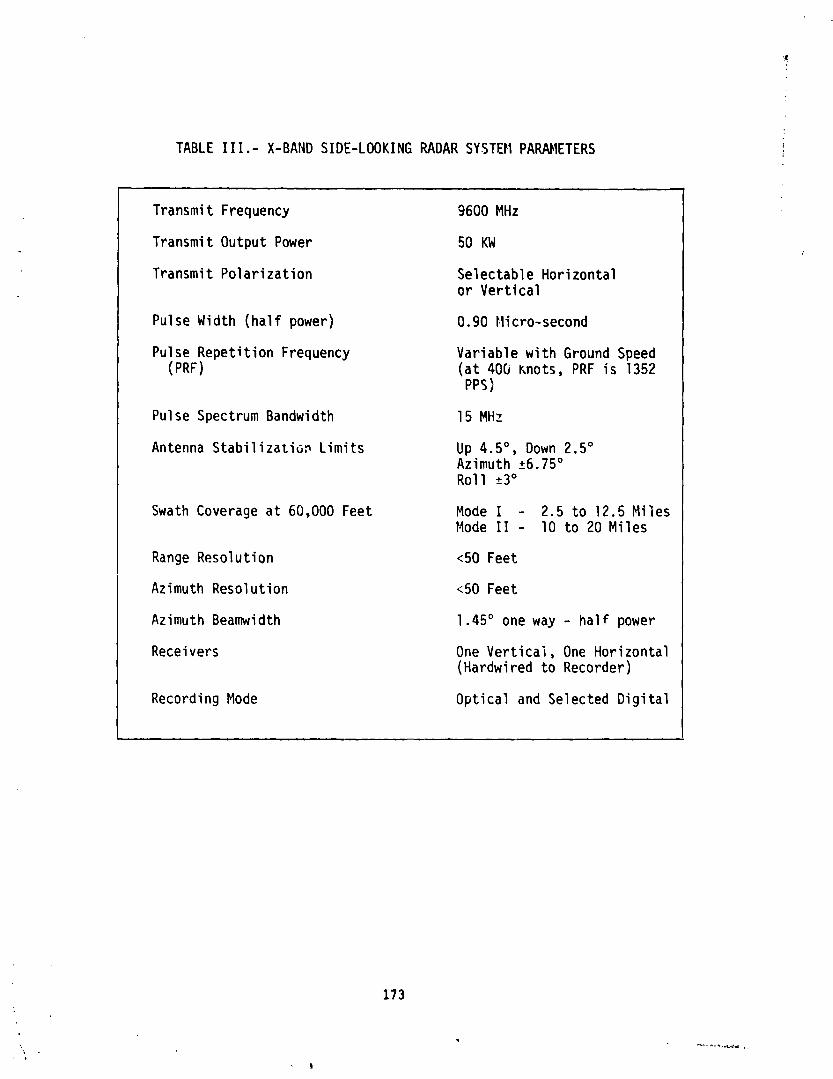
TABLE Ill.- X-BAND SIDE-LOOKING RADAR SYSTEtlPAR_IETERS
Transmit Frequency 9600 MHz
Transmit Output Power 50 KW/
Transmit Polarization Selectable Horizontalor Vertical
Pulse Width (half power) 0.90 tlicro-second
Pulse Repetition Frequency Variable with Ground Speed(PRF) (at 400 Knots, PRF is 1352
PPS)
Pulse Spectrum Bandwidth 15 MHz
Antenna Stabilizatiop Limits Up 4.5°, Down 2.5°Azimuth ±6.75°Roll ±3°
Swath Coverage at 60,000 Feet Mode I - 2.5 to 12.5 MilesMode II - lO to 20 Miles
Range Resolution <50 Feet
Azimuth Resolution <50 Feet
Azimuth Beamwidth 1.45° one way - half power
Receivers One Vertical, One Horizontal(Hardwired to Recorder)
Recording Mode Optical and Selected Digital
173
I
] 98] 005626-] 82

Z74
\_ p ,, , |
1981005626-183
m
•- EE. --c c_lI,n
v)I
x
N,F,-t,.
c e-.w m oi, c
o "-,1'--4
QJ"O
I
•- EE ",_ t_
175
i
1981005626-184
Figure 3.-. _rial photograph of the Burma..A_ate.
176, ORIGDCAL PAGe1 IS
OF POOR QUAI,rI'Y
1981005626-185

_g
Figure 4.- Aerial photograph of the Ixtoc I well.
': 177
1981005626-186
II
\I
1981005626-187
|
1981005626-188
180
,,\,
1981005626-189
l•
!
181
I
182
+
\
1981005626-191
183
|
1981005626-192
1981005626-193
4
185
1981005626-194
Z86
I
1981005626-195
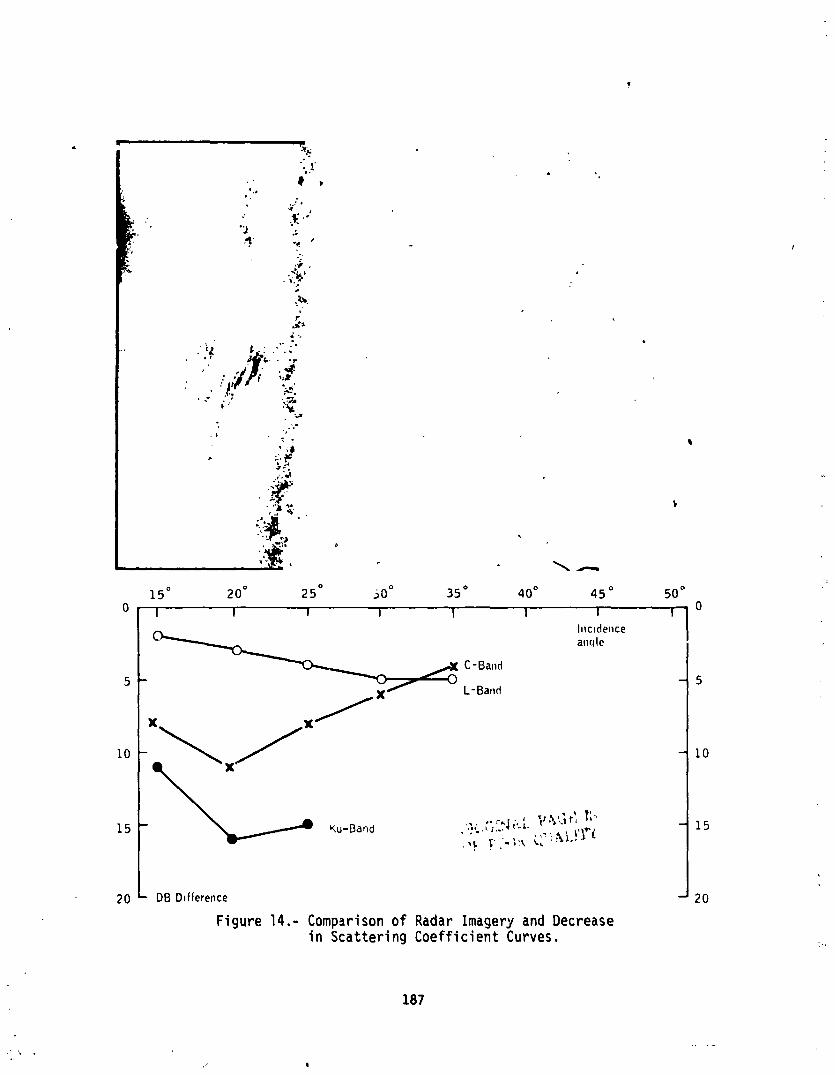
20 - DB Ddference - 20
Figure 14.- Comparison of Radar Imagery and Decreasein Scattering Coefficient Curves.
187
/ II
1981005626-196