18 meeting of competent authorities for reach and clp...
TRANSCRIPT
EUROPEAN COMMISSION ENVIRONMENT DIRECTORATE-GENERAL Green Economy Chemicals DIRECTORATE-GENERAL INTERNAL MARKET, INDUSTRY, ENTREPRENEURSHIP AND SMES Consumer, Environmental and Health Technologies REACH Chemicals
Brussels,18 June 2015 Doc. CA/63/2015
18th Meeting of Competent Authorities for REACH and CLP (CARACAL) 23 – 24 June 2015
CCAB, Brussels, Belgium Concerns: Draft Interim Report of a Study 'Monitoring the Impacts of
REACH on Innovation, Competitiveness and SME' Agenda Point: Information point 21 Action Requested: The CARACAL are invited to take note of this document and send
written comments to [email protected] and [email protected] by 15 July 2015
Introduction: The document contains a report prepared by the Centre for Strategy & Evaluation Services (CSES) LLP and Risk & Policy Analysts Ltd. (RPA) with the contribution of Ökopol GmbH (Institut für Ökologie und Politik GmbH). The report was launched in June 2014 with the overarching objective to evaluate the changes in the operational conditions and the structure of the chemicals industry and downstream industries, after the introduction of the REACH Regulation, focusing on the period 2010 - 2013. The interim report provides initial analysis of data collected from EU-wide business survey on twelve themes that are the focus of the study, as well as preliminary conclusions and recommendations.
Monitoring the Impacts of REACH on Innovation, Competitiveness and SMEs
Interim Report
17th June, 2015
Monitoring Impacts of REACH on Innovation, Competitiveness and SMEs – Interim Report
Table of Contents
Table of Contents
Section Page
1 Introduction 1 1.1 Aim of the study 1 1.2 Study objectives 1 1.3 Structure of the Report 3
2 Methodology 4 2.1 Overall Methodological Approach 4 2.2 The Research Tools 5
3 Overall Assessment of he Findings 12 3.1 Competitiveness Assessment 12 3.2 Assessment of REACH at the Current State of Implementation 12
4 Findings 14 4.1 Objective 1 - The Single Market and Harmonisation 14 4.2 Objective 2 - Strengthening External Competitiveness 21 4.3 Objective 3 - Registration 2013 29 4.4 Objective 4 - Business Opportunities 49 4.5 Objective 5 - SIEF &Registration Consortia 61 4.6 Objective 6 - SMEs 67 4.7 Objective 7 - Downstream Users 76 4.8 Objective 8 - Innovation 84 4.9 Objective 9 - Human Resources and Consultants 97 4.10 Objective 10 - Substances of Very High Concern and Authorisation 102 4.11 Objective 11 - Support and Assistance Instruments 119 4.12 Objective 12 – Registration 2018 128
5 Next steps 139 5.1 ESPG Presentation 139 5.2 Development of Draft Final Report 139 5.3 Development of Final Report 139
Appendix A Interviews 140

Monitoring Impacts of REACH on Innovation, Competitiveness and SMEs – Interim Report
Section 1 - Introduction
1
1 Introduction
This document contains the Interim Report for the study on Monitoring the impacts of REACH on innovation, competitiveness and SMEs. The report was prepared by the Centre for Strategy & Evaluation Services (CSES) LLP and Risk & Policy Analysts Ltd. (RPA) with the contribution of Ökopol GmbH (Institut für Ökologie und Politik GmbH).
1.1 Aim of the Study
The overarching study objective is to evaluate changes to the operational conditions and the structure of the chemicals industry and downstream industries following the introduction of the REACH Regulation, focusing on the 2010 – 2013 period. The specific aims of the study are, in summary, to:
Identify, test and apply methodologies for evaluating the coherence, efficiency, effectiveness, sustainability and impacts of REACH in relation to the chemical industry and major downstream user sectors.
Identify the strengths and weaknesses of REACH implementation with respect to the conditions and structure of the market, consumer choice, compliance costs and administrative procedures and any other relevant indicators identified during the course of the study.
Provide recommendations to remedy any weaknesses identified in REACH implementation so as to minimise the possible adverse effects of REACH implementation and to maximise the impacts of specific REACH mechanisms that improve business conditions for economic operators.
1.2 Study objectives
The specifications identify a series of individual objectives that will be the subject of in-depth examination through this study. The specific objectives identified in the specifications are listed below:
1. Single Market and Harmonisation - to assess the degree of harmonisation achieved within the sector due to REACH. An attempt should be made to quantify to what extent the intra-EU trade increase for chemicals can be attributed to the existence of REACH. An estimate should be given of the number and proportion of companies (with a distinction of SMEs) who went outside of the domestic market as a result of harmonisation effects of REACH. The analysis should allow the determination of areas with greatest potential for further harmonisation benefits, as well as to identify available measures to increase the level of harmonisation.
2. External Competitiveness – to determine the major mechanisms whereby REACH alters the position of the EU industry when exposed to the global markets. An initial attempt to quantify the extent of the impacts of those mechanisms should be provided. Besides costs and other challenges, the analysis should also aim to describe examples, if any, of where REACH improved competitiveness of the EU chemicals sector (e.g. when new products or improved safety provided added value to EU traders).
3. Registration 2013 - to quantify the costs of the registration exercise in 2013 - with more details regarding the specific categories of costs. These categories should be established in a way to facilitate policy responses (for instance – costs of training, familiarisation and information, costs of financing, costs of legal support etc.). In addition, the availability (in terms of prices, quantities and supply stability) of substances which were expected to be registered in 2013 should be verified.

Monitoring Impacts of REACH on Innovation, Competitiveness and SMEs – Interim Report
Section 1 - Introduction
2
4. Business opportunities - Analysis of examples that fostered better practices within companies (in particular SMEs) should be described and analysed. Added value for companies acting in different roles within the supply chains brought in by REACH in terms better knowledge of hazards and risks of substances as well as their uses should be evaluated and described. The contractor should also search for examples of best practices and describe conditions in which these business opportunities are most likely to occur, with a view to facilitate design of appropriate policy measures.
5. SIEF & Registration Consortia – to describe the pricing policies of the Substance Information Exchange Fora (SIEF), as well as to establish their affordability with regard to various types, sizes, sub-sectors, business models and geographic location of registrants. This should be supported by an analysis of the structure of the SIEFs costs and of any additional costs incurred by lead registrants and member registrants. Focus should also be given on the transparency and communication practices within the SIEFs. The added value of consortia should be analysed, as well as the reasons for which opt-outs or 'double' registrations have been pursued by registrants. Best practices with regard to SIEF pricing policies, consortia agreements and communication should be catalogued.
6. SMEs – to describe and assess all roles of SMEs in relation to REACH. Additional dimensions should also be brought in, such as the economic conditions in specific Member States. The assessment should then conclude on the major concerns in relation with the implementation of REACH and order them thematically according to the specific REACH related process to facilitate targeted policy response. The analysis should also establish if SMEs have specific constraints in fulfilling these roles and if these are specific to the companies fitting into the SME definition (or SME sub-categories) or are of a more general nature.
7. Downstream Users (“DUs”) – to establish and carry out an assessment of the major cost drivers for DUs of REACH compliance. Costs for major downstream sectors should be put into context with regard to how these affect profit margins and the overall costs for safety & environment protection as required by other EU and national legislation. Awareness and compliance costs estimations should be provided at EU and Member State and at a sectoral level. An assessment of any major concerns in relation to the implementation of REACH should be provided, structured thematically according to the specific REACH-related processes.
8. Innovation – regulation can be a driver and constraint to innovation. Evidence of substitution mechanisms (e.g. Restrictions, Candidate List, Annex XIV, Authorisation conditions etc.) and intelligence gathered through registration and supply chain communication should be described along with potential economic impacts or benefits. Where innovation was hindered, evidence should be gathered and analysed. Best practices should be identified and assessed from the perspective of relative abilities of SMEs in capitalisation on the new opportunities created by REACH.
9. Human Resources & Consultants – to assess the availability of adequately qualified persons to deal with REACH at company level, including issues such as REACH jobs market saturation, level of skills as well as transparency and easiness of assessing the qualification and performance of consultants and/or internal staff. In addition, specific constraints for SMEs for both acquiring highly qualified internal human capacities and/or adequately externalizing REACH processes to consultant services should be examined. The analysis should also take into account the offer of education programmes most appropriate to acquire the necessary skills as well as the practice of REACH professionals in documenting their skills and their trans-border recognition.

Monitoring Impacts of REACH on Innovation, Competitiveness and SMEs – Interim Report
Section 1 - Introduction
3
10. SVHC and Authorisations – as the first authorisation applications are being evaluated by ECHA and the Commission the assessment should cover the costs of preparing an authorisation application and the availability of human resources with required competences. The assessment should also conclude on the affordability of the authorisation process, especially for SMEs, taking into account the experience of the first authorisation consortia. Other areas of relevance, such as the effects of listing substances under SVHC RoadMap, the Candidate List, Annex XIV on the availability of substances on the market and the number of suppliers (concentration). With regard to Downstream Users, the assessment should cover direct and indirect costs of the application of Article 33.
11. Support – to characterise and provide feedback on the available support and assistance instruments to the industry provided by ECHA, Member States and industry associations. The analysis should provide feedback on the services most valued and demanded. It should allow providing a feedback to Member States and business organisations on the best practices and the areas for further investments. The feedback from SMEs should be considered as a priority.
12. Registration 2018 –to update the estimates with regard to the costs of the 2018 registration deadline if no changes are made to the implementation of REACH. The analysis should establish specific cost categories with the greatest scope for achieving cost-efficiencies, as well as suggest specific implementation measures to achieve them, while maintaining a high level of health and environmental protection.
1.3 Structure of the report
The remainder of the report is structured as follows:
Section 2 sets out the methodology adopted for the study.
Section 3 presents a succinct synthesis of the results of the research findings with regard to twelve objectives.
Section 4 provides assessments of the twelve individual objectives.
Section 5 sets out the next steps.
Appendix A provides the list of interviews.
Monitoring Impacts of REACH on Innovation, Competitiveness and SMEs – Interim Report
Section 2 – Methodology
4
2 Methodology
This section sets out the key elements of the methodology adopted for the study. First the overall approach is presented then the individual research tools are discussed. More detail is provided in a separate Methodology Report.
2.1 The overall methodological approach
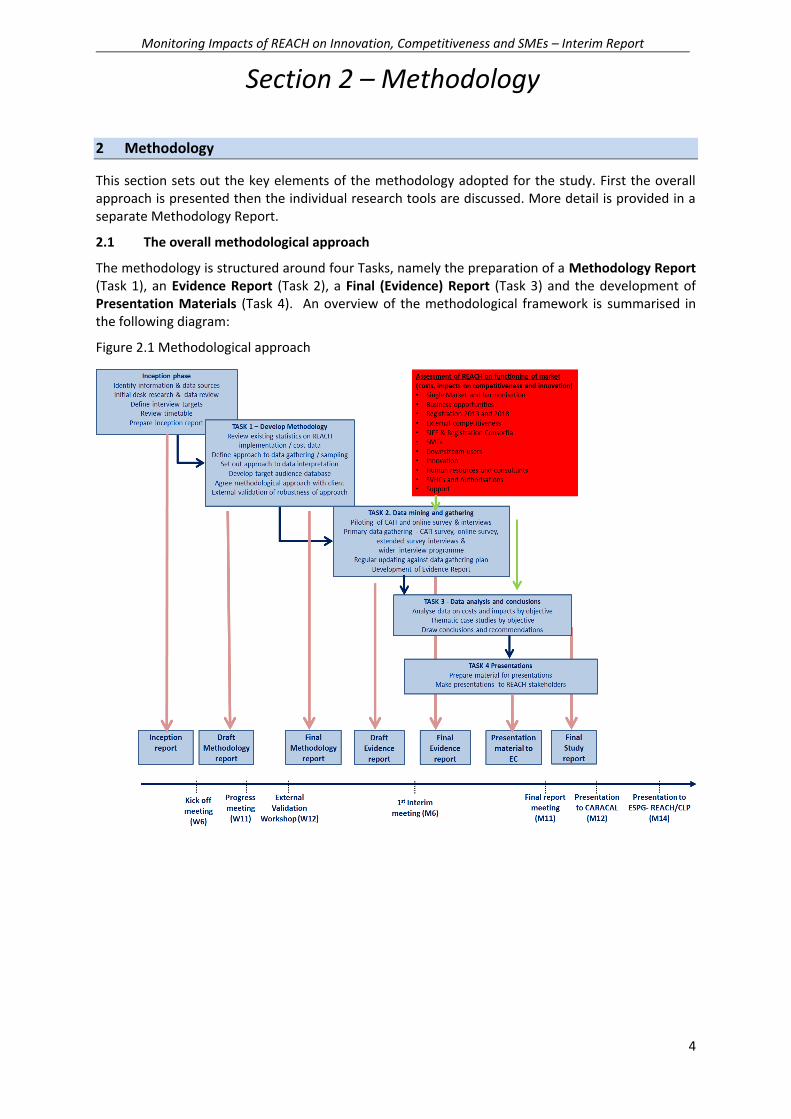
The methodology is structured around four Tasks, namely the preparation of a Methodology Report (Task 1), an Evidence Report (Task 2), a Final (Evidence) Report (Task 3) and the development of Presentation Materials (Task 4). An overview of the methodological framework is summarised in the following diagram:
Figure 2.1 Methodological approach
Monitoring Impacts of REACH on Innovation, Competitiveness and SMEs – Interim Report
Section 2 – Methodology
5
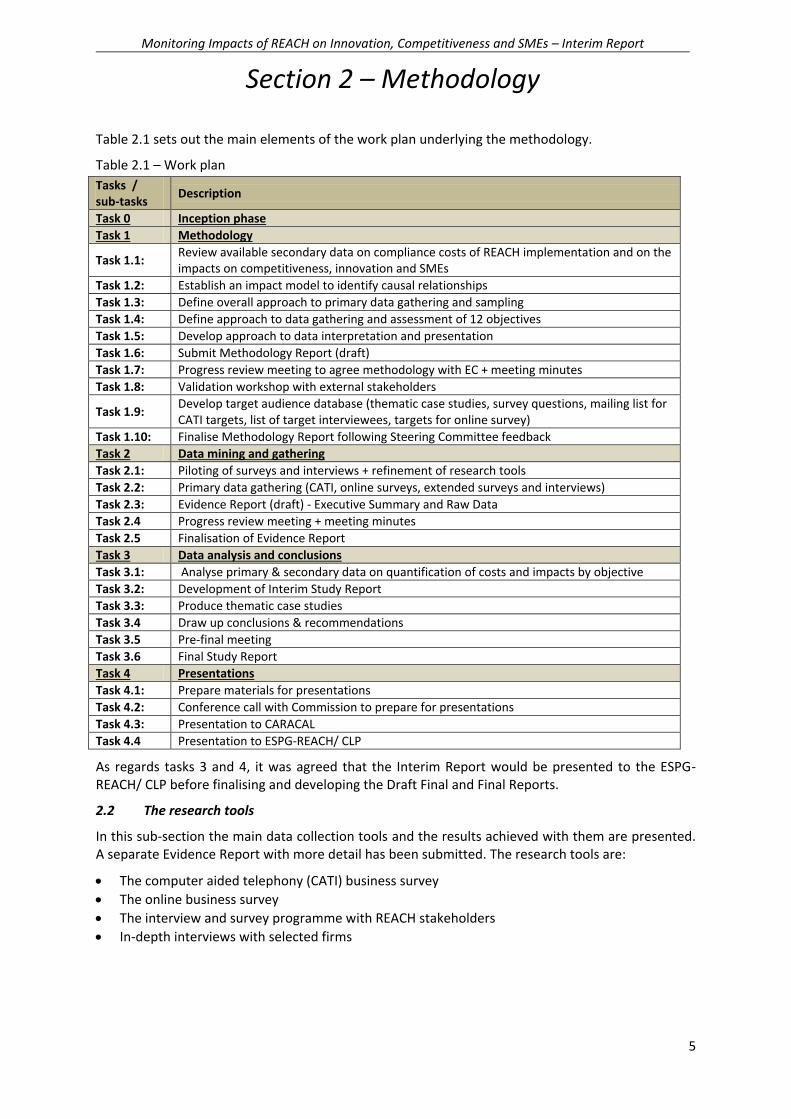
Table 2.1 sets out the main elements of the work plan underlying the methodology.
Table 2.1 – Work plan
Tasks / sub-tasks
Description
Task 0 Inception phase
Task 1 Methodology
Task 1.1: Review available secondary data on compliance costs of REACH implementation and on the impacts on competitiveness, innovation and SMEs
Task 1.2: Establish an impact model to identify causal relationships
Task 1.3: Define overall approach to primary data gathering and sampling
Task 1.4: Define approach to data gathering and assessment of 12 objectives
Task 1.5: Develop approach to data interpretation and presentation
Task 1.6: Submit Methodology Report (draft)
Task 1.7: Progress review meeting to agree methodology with EC + meeting minutes
Task 1.8: Validation workshop with external stakeholders
Task 1.9: Develop target audience database (thematic case studies, survey questions, mailing list for CATI targets, list of target interviewees, targets for online survey)
Task 1.10: Finalise Methodology Report following Steering Committee feedback
Task 2 Data mining and gathering
Task 2.1: Piloting of surveys and interviews + refinement of research tools
Task 2.2: Primary data gathering (CATI, online surveys, extended surveys and interviews)
Task 2.3: Evidence Report (draft) - Executive Summary and Raw Data
Task 2.4 Progress review meeting + meeting minutes
Task 2.5 Finalisation of Evidence Report
Task 3 Data analysis and conclusions
Task 3.1: Analyse primary & secondary data on quantification of costs and impacts by objective
Task 3.2: Development of Interim Study Report
Task 3.3: Produce thematic case studies
Task 3.4 Draw up conclusions & recommendations
Task 3.5 Pre-final meeting
Task 3.6 Final Study Report
Task 4 Presentations
Task 4.1: Prepare materials for presentations
Task 4.2: Conference call with Commission to prepare for presentations
Task 4.3: Presentation to CARACAL
Task 4.4 Presentation to ESPG-REACH/ CLP
As regards tasks 3 and 4, it was agreed that the Interim Report would be presented to the ESPG-REACH/ CLP before finalising and developing the Draft Final and Final Reports.
2.2 The research tools
In this sub-section the main data collection tools and the results achieved with them are presented. A separate Evidence Report with more detail has been submitted. The research tools are:
The computer aided telephony (CATI) business survey
The online business survey
The interview and survey programme with REACH stakeholders
In-depth interviews with selected firms

Monitoring Impacts of REACH on Innovation, Competitiveness and SMEs – Interim Report
Section 2 – Methodology
6
The scale and scope of the tools used is summarised in the table below. While there were some deviations from the initial targets, these are considered to be minor and do not affect the capacity to address the evaluation questions and the quality of the analysis.
The paragraphs that follow provide additional details.
Table 2.2 - Scale of data gathering activities and geographic coverage
Data collection tool
Target Result
CATI phone survey with firms
Coverage: 15 EU Member States, Target: 1200 random survey responses from firms with quota set by size, REACH role and country
1076 responses achieved by March 20th covering all 15 Member States. Targets initially set were met with minor deviations
Open-ended on-line business survey
Coverage: EU28 Member States
Target: 1000+ responses from firms covering all REACh roles, firm sizes and Member States
A total of 566 responses had been received by March 20th. All 28 EU and EEA countries are represented as well as non-EU based firms.
Stakeholders interview/survey programme
Up to 80 interviews with REACH stakeholders (Member State authorities, REACH helpdesks, associations, NGOs, trade unions)
Total of 104 interviews with stakeholders completed by March 30th. The inputs from phone and face to face interviews and responses in written have been brought together for analysis.
In-depth interviews with firms
50 in-depth interviews with firms Total of 56 interviews completed including firms with different roles, sizes and countries of operation
2.2.1 CATI survey
For the CATI survey firms across Europe were contacted and asked to respond to a telephone survey (15-25 minutes). The survey covered 15 EU Member States, 8 of which account for more than 90% of EU chemicals production (DE, FR, IT, ES, UK, PL, NL and BE), as well as 7 (AT, BG, CZ, HU, LT, RO, SE) that would ensure a good balance between new Member States and older Member States, countries with a small domestic chemicals manufacturing capacity, but where there is a significant presence of importers and DUs, among other considerations.
As can be seen in Table 2.3 there are some deviations from the initial targets set. Nonetheless, the sample largely met the targets in terms of overall samples size and distribution by firm size. 62% of the respondents are SMEs which in line with the initial target (60%) aiming to balance the higher number of SMEs and the fact that large firms account for a greater share of the European chemicals' production. The 1076 complete responses represented 8% of the total number of 13254 firms contacted.

Monitoring Impacts of REACH on Innovation, Competitiveness and SMEs – Interim Report
Section 2 – Methodology
7
Table 2.3 – CATI survey sample – proposed and actual distribution by size and REACH role
Initial target Actual sample
REACH role Total Large
firms SMEs* Total Large
firms SMEs*
Manufacturers of substances 300
200 100 203 97 106
Formulators 250
50 200 251 75 176
Distributors/wholesalers/retailers of chemicals substances or mixtures
150 50 100 158 48 110
Importers of substances and mixtures 100 25 75 60 25 35
Suppliers of articles (Manufacturers/importers/distributors of articles)
250 100 150 251 100 151
End users (industrial or professional users) 150 50 100 153 64 89
Total sample 1200 475 725 1076 409 667
% by size threshold 100 40% 60% 100 38% 62%
One of the important methodological findings of the research was that individual companies usually have several REACH roles. It is important to bear this in mind when assessing the implications of the findings.
Table 2.4 CATI survey sample: secondary roles
Other role Primary role
Manufacturer Formulator Distributor
Importer of chemicals
Supplier of articles
End user Total
Manufacturer 0% 54% 50% 57% 20% 42% 203
Formulator 47% 0% 44% 35% 24% 33% 251
Distributor 8% 27% 0% 30% 20% 23% 158
Importer 11% 17% 25% 0% 77% 41% 251
Supplier of articles
5% 7% 2% 8% 0% 84% 153
End user 17% 23% 35% 65% 35% 0% 60
Within the SME category, there is greater share of medium size firms in almost all categories, but with the exception of end users and importers, all categories have at least 10 representatives.
Table 2.5 – CATI survey sample – Number of micro, small and medium enterprises by role
Manufacturers
Formulators Distributors Importers Suppliers of articles
End users
All firms
Micro 10 21 26 6 16 5 84
Small 30 53 48 10 35 12 188
Medium 63 94 32 17 95 72 373
No data 3 8 4 2 5 22
Total SMEs
106 176 110 35 151 89 667
In terms of the second-level criteria (country and sector distribution) the survey sample (table 2.6) reflects the dominant share of a few countries within the chemicals industry while also taking into account countries with smaller participation. In certain countries (Hungary, Lithuania, Netherlands) it

Monitoring Impacts of REACH on Innovation, Competitiveness and SMEs – Interim Report
Section 2 – Methodology
8
proved particularly difficult to reach the initial targets but overall, the sample size achieved by country allows for a minimum level of statistically meaningful results.
Table 2.6 - CATI interview numbers by Member States
Country where firm is established Initial target Actual number of responses Share in the sample
Austria 60 53 4.9%
Belgium 80 70 6.5%
Bulgaria 60 49 4.6%
Czech Republic 60 52 4.8%
France 100 105 9.8%
Germany 120 127 11.8%
Hungary 60 33 3.1%
Italy 120 128 11.9%
Lithuania 50 25 2.3%
Netherlands 80 58 5.4%
Poland 80 72 6.7%
Romania 50 50 4.6%
Spain 100 91 8.5%
Sweden 60 56 5.2%
United Kingdom 120 107 9.9%
Total 1076 100.0%
In terms of the sectors covered the sample includes a large number of firms from the five main segments of the chemicals' sector whose role is, typically, as manufacturers, formulators or, in fewer cases, importers. In total, they represent around 41% of the sample. Within this group the specialty chemicals' sectors (dyes and pigments, paints and inks, auxiliaries for industry and crop protection) may be overrepresented. The sample also includes firms in primary metal industry (mainly manufacturers) and the pharmaceutical sector (manufacturers/formulators).
Concerning importers and distributors of chemicals, 86 firms (8% of the sample) specialised in the wholesale trade of chemical products predominantly stated that their primary role was as distributor of chemicals. In total, the chemicals and related sectors represent 53% of the sample.
Beyond the chemicals and chemicals-related sectors, downstream users sectors represent 47% of the sample. They include a significant number of firms in key industry sectors (electric & electronic devices, textiles, industrial machinery, fabricated metal products, construction) who indicated that their primary REACH roles are article suppliers or end users. The transportation/automotive sector is also covered although with relatively few firms. In addition, there is a broad range of services covered with firms typically referring to end user role. In total, the wide range of downstream user sectors covered reflects the very wide use of chemicals across the whole of the EU economy.
2.2.2 The on-line business survey
An on-line business survey was used to provide feedback and data covering a wider number of issues than what could be possible through the use of a time-limited CATI survey. The online survey was launched at the beginning of February following piloting with 5 enterprises. It was disseminated via multiple channels, including European and national industry associations (including the associations that were present in the workshop) and other media (such as the online publication Chemical

Monitoring Impacts of REACH on Innovation, Competitiveness and SMEs – Interim Report
Section 2 – Methodology
9
Watch1). It was made available in eight languages (EN, DE, IT, FR, CZ, PL, ES, RO) and was formally launched on February 9th.
The tables below summarize the breakdown of the 566 responses received by March 25th 2015 indicating the distribution by primary REACH role (as indicated by the respondent), firm size and country of operation of the respondent. A number of respondents indicated more than one country of establishment on the basis that they are multinational firms with multiple units of operation, inside and often outside the EU.
The survey sample covers all REACH roles with a satisfactory level to support findings on general trends and views even if the level of confidence – from a statistical point of view – was not as high as we hoped it would be. Particularly in the case distributors or article suppliers the number of responses is quite small despite the efforts of the team to promote the survey to relevant targets.
Table 2.7 Responses to the business survey by primary role and firm size
Stated primary role Large SMEs Not indicated All firms
Manufacturers of chemicals 87 67 42 196
Importers of chemicals 13 44 15 72
Formulator 22 53 16 91
Distributors of chemicals 6 36 4 46
Suppliers of articles 22 14 10 46
End users 56 32 27 115
Total 206 246 114 566
As in the case of the CATI companies tended to have several additional REACH roles in addition to their primary role as indicated in the survey response.
Table 2.8 OBS sample – other roles
Other role Primary role
Man of chemicals
Formulator Distributor Importer of chemicals
Supplier of articles
End user Total
Man of chemicals 37% 24% 58% 8% 41% 196
Formulator 31%
18% 34% 8% 91% 91
Distributor 7% 24%
63% 7% 46% 46
Importer of chemicals
18% 28% 32%
7% 72% 72
Supplier of articles
2% 11% 20% 17%
46% 46
End user 9% 15% 10% 19% 20%
115
In terms of country coverage2, firms with establishments in the Member States with a high share in chemicals manufacturing (Germany, Italy, France and the UK) represent more than half of the sample. There is also an important share of firms that stated that they were multinational in nature and their responses reflected the overall group of firms. Spain, the Netherlands, Belgium, Czech
1 https://chemicalwatch.com/22905/eu-commission-launches-major-reach-impacts-study 2 Respondents were given the choice to indicate more than country and this was the case with 76 respondents that indicated 2 or more countries.
Monitoring Impacts of REACH on Innovation, Competitiveness and SMEs – Interim Report
Section 2 – Methodology
10
Republic and Poland are relatively well represented, with more than 30 responses each. Smaller EU countries, which generally have a minor share in the manufacturing sector, are represented by a few (<15) firms.
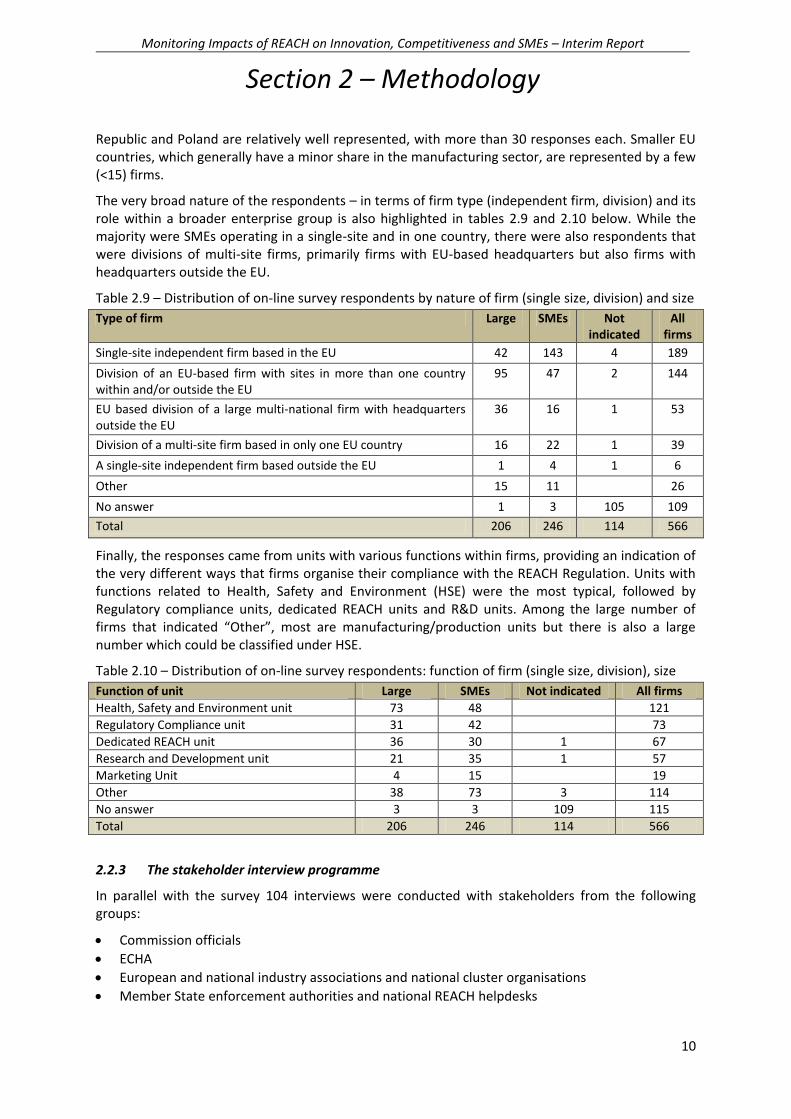
The very broad nature of the respondents – in terms of firm type (independent firm, division) and its role within a broader enterprise group is also highlighted in tables 2.9 and 2.10 below. While the majority were SMEs operating in a single-site and in one country, there were also respondents that were divisions of multi-site firms, primarily firms with EU-based headquarters but also firms with headquarters outside the EU.
Table 2.9 – Distribution of on-line survey respondents by nature of firm (single size, division) and size
Type of firm Large SMEs Not indicated
All firms
Single-site independent firm based in the EU 42 143 4 189
Division of an EU-based firm with sites in more than one country within and/or outside the EU
95 47 2 144
EU based division of a large multi-national firm with headquarters outside the EU
36 16 1 53
Division of a multi-site firm based in only one EU country 16 22 1 39
A single-site independent firm based outside the EU 1 4 1 6
Other 15 11 26
No answer 1 3 105 109
Total 206 246 114 566
Finally, the responses came from units with various functions within firms, providing an indication of the very different ways that firms organise their compliance with the REACH Regulation. Units with functions related to Health, Safety and Environment (HSE) were the most typical, followed by Regulatory compliance units, dedicated REACH units and R&D units. Among the large number of firms that indicated “Other”, most are manufacturing/production units but there is also a large number which could be classified under HSE.
Table 2.10 – Distribution of on-line survey respondents: function of firm (single size, division), size
Function of unit Large SMEs Not indicated All firms
Health, Safety and Environment unit 73 48 121
Regulatory Compliance unit 31 42 73
Dedicated REACH unit 36 30 1 67
Research and Development unit 21 35 1 57
Marketing Unit 4 15 19
Other 38 73 3 114
No answer 3 3 109 115
Total 206 246 114 566
2.2.3 The stakeholder interview programme
In parallel with the survey 104 interviews were conducted with stakeholders from the following groups:
Commission officials
ECHA
European and national industry associations and national cluster organisations
Member State enforcement authorities and national REACH helpdesks
Monitoring Impacts of REACH on Innovation, Competitiveness and SMEs – Interim Report
Section 2 – Methodology
11
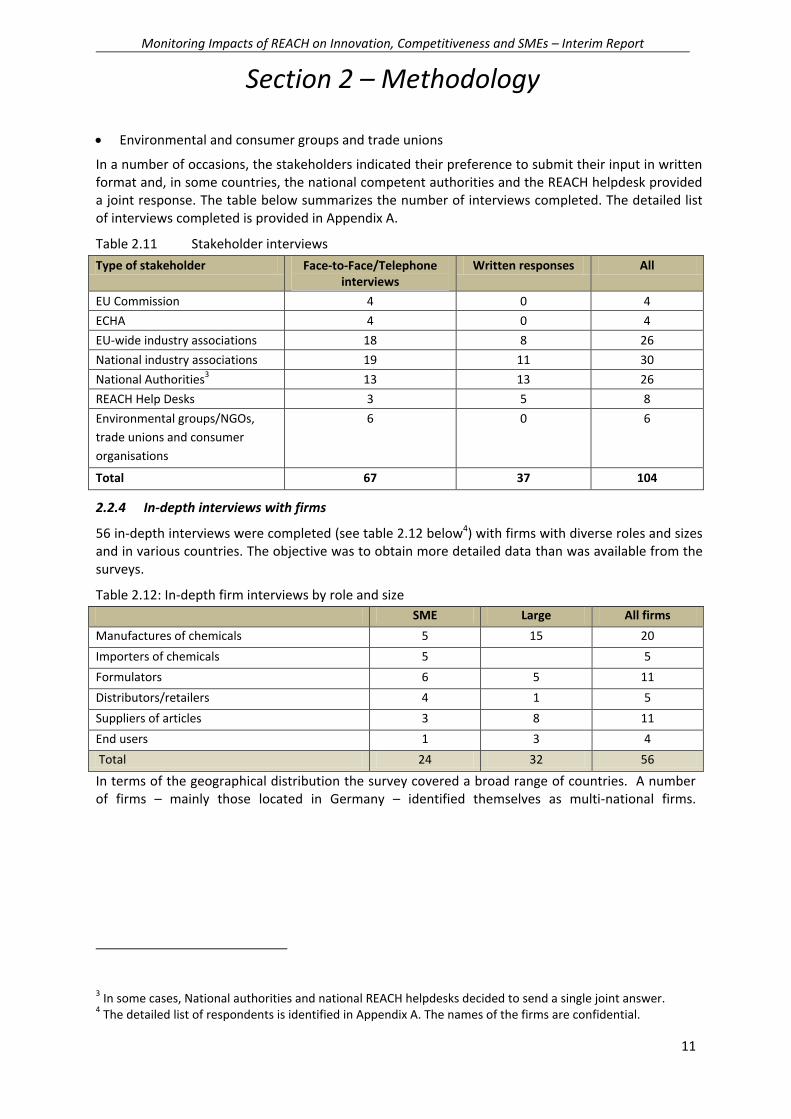
Environmental and consumer groups and trade unions
In a number of occasions, the stakeholders indicated their preference to submit their input in written format and, in some countries, the national competent authorities and the REACH helpdesk provided a joint response. The table below summarizes the number of interviews completed. The detailed list of interviews completed is provided in Appendix A.
Table 2.11 Stakeholder interviews
Type of stakeholder Face-to-Face/Telephone interviews
Written responses All
EU Commission 4 0 4
ECHA 4 0 4
EU-wide industry associations 18 8 26
National industry associations 19 11 30
National Authorities3 13 13 26
REACH Help Desks 3 5 8
Environmental groups/NGOs,
trade unions and consumer
organisations
6 0 6
Total 67 37 104
2.2.4 In-depth interviews with firms
56 in-depth interviews were completed (see table 2.12 below4) with firms with diverse roles and sizes and in various countries. The objective was to obtain more detailed data than was available from the surveys.
Table 2.12: In-depth firm interviews by role and size
SME Large All firms
Manufactures of chemicals 5 15 20
Importers of chemicals 5 5
Formulators 6 5 11
Distributors/retailers 4 1 5
Suppliers of articles 3 8 11
End users 1 3 4
Total 24 32 56
In terms of the geographical distribution the survey covered a broad range of countries. A number of firms – mainly those located in Germany – identified themselves as multi-national firms.
3 In some cases, National authorities and national REACH helpdesks decided to send a single joint answer. 4 The detailed list of respondents is identified in Appendix A. The names of the firms are confidential.
Monitoring Impacts of REACH on Innovation, Competitiveness and SMEs – Draft Interim Report
Section 3 – Overall Assessment
12
3 Overall assessment of the findings
The aim of this section is to provide a synthesis of the overall findings regarding the 12 objectives of the study. In the first place we outline the overall approach to assessing the impacts of the REACH Regulation - at this stage of its implementation - on innovation, competitiveness and SMEs, using the Commission’s guidelines. Then a summary overall assessment is made, based on the findings as regards the 12 objectives investigated in the report.
3.1 Competitiveness assessment
The overall approach is informed by the The Commission’s Competitiveness Proofing Toolkit5 which compliments the Impact Assessment Guidelines6 by providing guidelines on how to focus specifically on competitiveness. Competitiveness is defined as “a measure of an economy’s ability to provide its population with high and rising standards of living and high rates of employment on a sustainable basis. Vigorous competition in a supportive business environment is a key driver of productivity growth and competitiveness”.7
Competitiveness proofing is aimed at identifying impacts on enterprise competitiveness at sector and aggregate level by identifying, and – where proportionate – quantifying the likely impacts of the legislation in question in three key dimensions of enterprise competitiveness:
a) Cost competitiveness: the cost of doing business, which includes cost of intermediate inputs (incl. energy) and of factors of production (labour and capital);
b) Capacity to innovate: the capacity of the business to produce more and/or higher quality products and services that meet better customers' preferences; and,
c) International competitiveness: the above two aspects could also be assessed in an international comparative perspective, so that the likely impact of the policy proposal on the European industries’
market shares and revealed comparative advantages is taken into account.8
The findings of the 12 objectives are assessed in the light if these three key dimensions.
3.2 Assessment of REACH at the current state of implementation
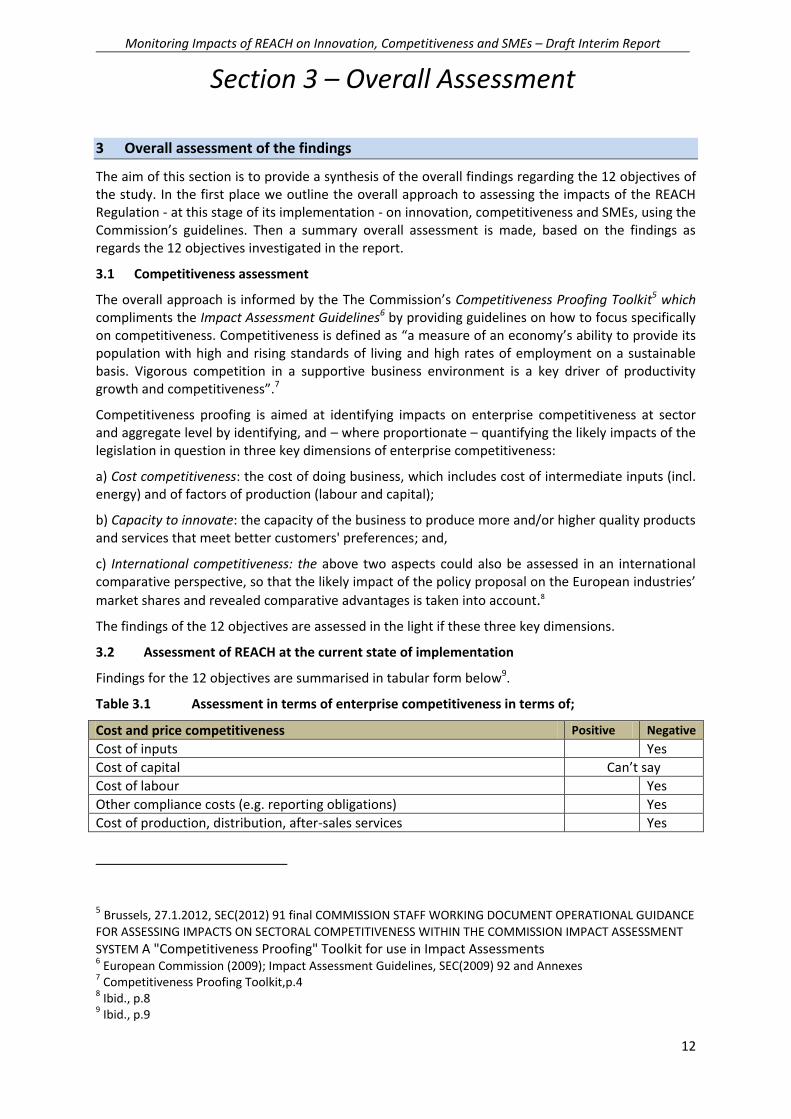
Findings for the 12 objectives are summarised in tabular form below9.
Table 3.1 Assessment in terms of enterprise competitiveness in terms of;
Cost and price competitiveness Positive Negative
Cost of inputs Yes
Cost of capital Can’t say
Cost of labour Yes
Other compliance costs (e.g. reporting obligations) Yes
Cost of production, distribution, after-sales services Yes
5 Brussels, 27.1.2012, SEC(2012) 91 final COMMISSION STAFF WORKING DOCUMENT OPERATIONAL GUIDANCE FOR ASSESSING IMPACTS ON SECTORAL COMPETITIVENESS WITHIN THE COMMISSION IMPACT ASSESSMENT
SYSTEM A "Competitiveness Proofing" Toolkit for use in Impact Assessments 6 European Commission (2009); Impact Assessment Guidelines, SEC(2009) 92 and Annexes 7 Competitiveness Proofing Toolkit,p.4 8 Ibid., p.8 9 Ibid., p.9

Monitoring Impacts of REACH on Innovation, Competitiveness and SMEs – Draft Interim Report
Section 3 – Overall Assessment
13
Price of outputs (directly) Yes
Capacity to innovate
Capacity to produce and bring R&D to the market Yes
Capacity for product innovation Yes Yes
Capacity for process innovation (incl. distribution, marketing, after-sales) Yes
Access to risk capital Can’t say
International competitiveness
Market shares (Single Market) Yes
Market shares (external market) Yes
Revealed comparative advantage Separate study
The above overall assessment includes many sub-areas where the answers may be different, and the assessment as regards innovation may be somewhat controversial, given the different approaches to interpreting the term (see 4.8.1).
The Regulation still has a period to go before it is fully implemented. There is the registration in 2018 which is expected to prove quite demanding, and after that some more time will be required for the implementation to “bed in”.

Monitoring Impacts of REACH on Innovation, Competitiveness and SMEs – Draft Interim Report
Section 4 – Findings
14
4 Findings by individual objective
In section 4 the findings by individual objective are presented. These are based on the data provided in the Evidence Report, as well as additional qualitative evidence and interviews carried out subsequently.
4.1 Objective 1 - Single Market and Harmonisation
4.1.1 Introduction
The aims of this section on the Single Market and harmonisation are to: assess the degree of harmonisation achieved within the sector due to REACH; attempt to quantify to what extent the intra-EU trade increase for chemicals can be attributed to the existence of REACH; estimate the number and proportion of companies (with a distinction of SMEs) who went outside of the domestic market as a result of harmonisation effects of REACH; and, identify areas with greatest potential for further harmonisation benefits, as well as measures to increase the level of harmonisation. These matters are discussed in turn below.
4.1.2 The degree of harmonisation in the chemicals sector due to REACH
The sectoral composition of the EU chemicals market is set out in table 4.1 below. Table 6.3 sets out the customer base of the chemical industry. The size and the complexity of the EU chemicals industry apparent from these two tables is reflected in the amount of legislation operative in the sector.
Table 4.1.1 Composition of the EU chemicals sector Weight Chemical sub-sectors € billion
26.6% Petrochemicals 140.0
13.7% Basic Inorganics 72.0
6.1% Other inorganics 32.2
2.7% Industrial gases 14.2
4.9% Fertilizers 25.6
21.5% Polymers 113.4
19.0% Plastics 100.1
1.0% Synthetic rubber 5.1
1.6% Man-made fibres 8.2
26.5% Specialty chemicals 139.7
2.5% Dyes & pigments 13.3
1.9% Crop protection 9.8
7.8% Paints & inks 41.0
14.3% Auxiliaries for industry 75.6
11.7% Consumer chemicals 61.8
100.0% Chemicals excluding pharmaceuticals 526.9
Source: Cefic, Chemdata International (2014)
Legislation present in the sector includes: the REACH Regulation and its subsequent amendments; the Regulation on Biocidal Products and amendments; safety standards related to ionising radiation; the Regulation on Classification, Labelling and Packaging of substances and mixtures (and amendments; dangerous substances; dangerous mixtures; the directive(s) on cosmetic products; legislation on waste, the environment, transport, health and safety, working time, etc. It is
Monitoring Impacts of REACH on Innovation, Competitiveness and SMEs – Draft Interim Report
Section 4 – Findings
15
understood that a separate study is under way to assess the cumulative costs of legislation on the chemical industry.
Given this size and complexity, and the many types of enterprises active in the EU and the EEA, it is not surprising that a wide range of views has been expressed amongst those consulted and surveyed as to the extent of harmonisation in the EU chemicals market that could be attributed to the REACH Regulation.
According to some industry sector representatives, their sector (e.g. the refining sector) had already been quite highly harmonised before REACH was enacted, and REACH has not added a great deal to that. Other sector organisations pointed out that there are still important areas lacking in harmonisation with other legislation – for example with RoHS, cosmetics and biocides. While some associations pointed out that the promulgation of the of the legislation as a regulation (rather than a directive)in principle encourages harmonisation, several associations also pointed out that interpretation (e.g. “articles”) varies across Member States, and there are differences in implementation, where practices and interpretations differ between and even within MS. On the other hand, several national industry associations were very positive about the harmonisation effects of REACH. For example, dealing with one authority to register chemical substances rather than 28 is often considered a positive factor for the industry.
When companies agreed that REACH brought increased harmonisation, they generally, if they operate across EU borders, at the same time pointed out that differences in implementation existed that work against harmonisation. As one medium-sized formulator put it, “REACH in combination with CLP has not been adopted in a consistent manner across the EU. That makes it difficult to ensure that local rules are followed” (OBS).
The Regulation can probably be best seen as a tool or framework trough which to work towards harmonisation. However, at the same time the bringing into existence of REACH also brought many things out into the open and added factors that had not been present previously. This has created new complexity in the market, for example as regards interpretation, implementation and surveillance, and thus increased the challenge of achieving increased harmonisation.
4.1.3 Increases in intra-EU trade in chemicals attributable to harmonisation effects of REACH.
Trade flows between member states in the chemicals sector are complex and involve a wide range of products, substances, and mixtures transacted between multinational enterprises and between different units of multinational firms (intra-firm trade) as well as national firms. Most chemicals trade is of a “derived” nature - it is reliant upon demand for inputs to intermediate goods or final products.
Total EU chemical sales were worth €527 billion in 2013. Intra-EU sales (marked as “Intra-EU exports” on the chart) increased from €183 in 2003 to €292 in 2013 – a 60 per cent increase during the last 10 years. Intra-EU trade did contract slightly in 2013, the first time in five years.
According to a Cefic report10: “Removing both trade and non-trade barriers inside the European Union helped boost growth and competitiveness in the EU chemical industry between 2003 and 2013”, while “The accession of new EU member states in 2004 and 2007 gave the internal market an extra boost for intra-EU trade”. The bar chart below shows that there was an increase in the percentage share of intra EU trade in chemicals after 2004 and 2007, which stopped in 2013.
10 The European Chemicals Industry, Facts and Figures 2014, p.11.

Monitoring Impacts of REACH on Innovation, Competitiveness and SMEs – Draft Interim Report
Section 4 – Findings
16
Chart 4.1.1 Percentage shares of EU trade in chemicals 2003-13
Source: Cefic, Chemdata International (Cefic, 2014, p.11)
The MSCAs and Helpdesks interviewed indicated that they were not aware of any data suggesting that there were any increases in intra-EU trade that could be attributed to the effect of the REACH Regulation. Industry representatives either said that they were not aware of such increases, or there were no effects. However, one association commented that they thought that trade between EU manufacturers had increased because it was easier to buy from other REACH compliant suppliers based in the EU than from suppliers outside the EU; and another said they thought that more EU-based formulators would buy from EU-based suppliers because many non-EU based formulators do not want to incur the costs (e.g. registration) of supplying the EU market, leaving more scope for EU-based suppliers.
As regards quantifying the extent to which intra-EU trade has been affected by REACH, the CATI and OBS respondents were asked what they though the effects were on exports and imports.
The great majority of firms (85.4%) did not identify any changes to exports within the EEA that could be attributed to the introduction of the REACH Regulation. Some 4.2% of CATI respondents saw a positive impact, while 5.7% suggested that REACH has had a negative impact. This applies across the board, independent of the firm’s size, its export orientation or its country of operation.
However, in terms of REACH roles, there was a marked response from manufacturers who saw a slight decrease in exports as a result of REACH (9.8% of the 133 responses). The second largest (percentage) response was from importers who saw a slight increase in their exports (6.6% of 31 responses), while 5.9% of distributors (68 respondents) saw a slight decrease in their exports. The OBS responses suggest that declines in exports were related to price increases.
As regards the level of imports of substances/mixtures or articles from within the EEA, 80% of firms indicated no increase in imports while 13.4% pointed to an increase in the level of imports from other EEA countries as a result of REACH11. Some companies reporting to switching suppliers from
11 It was not asked if there was a negative effect.
44% 46% 49% 49% 50% 50% 51% 52% 53%
55% 55%
0%
10%
20%
30%
40%
50%
60%
2003 2004 2005 2006 2007 2008 2009 2010 2011 2012 2013
Home sales Intra-EU exports Extra-EU exports
Monitoring Impacts of REACH on Innovation, Competitiveness and SMEs – Draft Interim Report
Section 4 – Findings
17
non-EU to REACH-compliant EU-based sources that had invested the funds to comply with the regulation. Changes were quite evenly spread among all REACH roles, but with relatively high increases for formulators and distributors. The overall share of increases in imports from the EEA is significantly higher than the share of those showing increased exports to the EEA.
The OBS survey also shows that the majority of firms indicated no change in terms of imports or exports. Among importers and, less so, among distributors there is a negative impact in terms of exports and imports within the EU. This is linked to the costs of REACH, which may lead importers to the decision to remove certain products from their portfolio or make them too expensive for buyers).
The actual processes underlying these numbers are complex and the result of market relationships that have developed over many years as the chemical industry has evolved. For example, one instance of “growth in intra-EU trade” that was mentioned is the case of a small firm in one MS that is one of two manufacturers of a substance in the EU, each of which is based in a different MS. The two manufacturers have up to recently competed but registration costs for the substance do not justify two registrations so they have agreed between them that only one (producing much higher volume of the substance than the other) will register and manufacture and will supply the other who will continue to market the substance under its own brand name. This will be registered as an increase in intra-EU trade (exports and imports), and is attributable to REACH. Both companies will continue to supply their distributors as before but can hardly be said to reflect what was intended.
Several companies (distributors, suppliers of articles) also indicated in the course of the interview programme that they have switched from non-EU to EU suppliers where possible to avoid the registration issue when dealing with non-EU suppliers. Dealing with non-EU suppliers through ORs also increases transaction costs. Companies also think that the 2018 registration will further drive the decision to buy within the EU if the substances are available.
When comparing the effects of the implementation of REACH on businesses in terms of trade inside the EU, there is a marked difference in response between SMEs and large firms (OBS) as regards the effect on exports due to price increases related to REACH, and in particular as regards micro firms. 46.4% of micro firms, and 15.9% of small firms said they had decreased exports to elsewhere in the EU due to REACH-related price increases (compared to 6.3% of large firms); and 35.7% of micro firms said they had decreased imports from other EU countries because of REACH - related cost increases compared to 9.2% of large firms. 10.7% of micro firms increased imports from elsewhere in the EU because they know that products are REACH compliant.
So while overall there the data suggest is not a great deal of change, the more detailed picture of what is happening where there is change is complex. Small and micro firms report significantly higher decreases in exports and imports from other EU countries due to cost increases associated with REACH, but also increased imports from elsewhere in the EU due to knowing that the products were REACH compliant.
4.1.4 Intra-EU internationalisation of companies as a result of harmonisation effects of REACH.
Where there has been increased harmonisation in the chemicals market as a result of REACH, the question arises as to whether this has led to new opportunities for firms and in particular if it might have prompted non-exporters to export for the first time.
The CATI survey responses suggest that 24.1% thought (20.0% somewhat, 4.1% substantial) that the increased harmonisation of the EU chemicals' legislation due to REACH has led to new opportunities, although most (71.9%) did not. There are no differences identified depending on firms' size, but firms in Romania (60% of respondents), Lithuania (40%), Poland (38%) and less so, Bulgaria (31.5%)

Monitoring Impacts of REACH on Innovation, Competitiveness and SMEs – Draft Interim Report
Section 4 – Findings
18
and Sweden (29%) were more supportive of this statement12. In contrast, firms in Germany (14%), UK (13%), Spain (17%) and Hungary (15%) were less so.
Some 14.5% of respondents to the OBS see new business opportunities as a result of the harmonization of the EU chemicals' legislation. However, 67.3% disagreed that this was the case.
Table 4.1.2 - REACH has increased the harmonisation of the EU chemicals legislation, leading to the opening of new opportunities for our business in the EU (percentage of firms indicating)
Options Manufacturers
Formulators Distributors Importer Suppliers of articles
End users All firms
Strongly disagree 19.8 18.8 30.8 38.0 17.2 24.3 24.6
Disagree 32.8 42.2 33.3 24.0 41.4 29.7 32.7
Neither agree nor disagree
29.0 31.3 23.1 22.0 31.0 31.1 28.2
Agree 17.6 7.8 12.8 12.0 10.3 12.2 13.2
Strongly agree 0.8 0.0 0.0 4.0 0.0 2.7 1.3
Do not know 9.2 6.3 5.1 4.0 10.3 16.2 9.1
Total 100.0 100.0 100.0 100.0 100.0 100.0 100.0
n 131 64 39 50 29 74 394
Source: Online business survey
One large formulator said: “REACH has increased harmonisation but has not led to new business opportunities. In fact, the increased costs have probably reduced business opportunities”. A micro distributor said “It has prevented us continuing with a long established business because the [third country suppliers] did no honour their obligation to register under REACH and the cost of purchasing letters of access for that made it too expensive for us to register ourselves” (OBS).
There was no evidence of companies starting to carry out cross-border operations just as a result of the harmonisation effects of REACH. The survey feedback provides some insight into the related underlying tendencies. 13% of the CATI survey respondents indicated that they are selling only to the domestic market (100% of their turnover). These firms did not point to any changes as a result of REACH. Being mainly micro and small firms and most often distributors, end users and article suppliers, they seem not to be affected – at least in terms of their market focus – by the REACH Regulation. Nonetheless, 24.1% of them considered that the REACH harmonisation presented business “opportunities”. Respondents did not specify what these opportunities were nor that they had been realised. It may be that if the economic environment improves such opportunities may be pursued.
The OBS also shed some light on the extent to which firms with a focus on domestic markets were given an incentive to export. Among firms which indicated a certain level of exports – but still with a domestic market representing over 80% of sales – the large majority (88%) indicated no change to their exports to the EEA as a result of REACH. 2.2% said that these had increased, while 9.5% considered that REACH provided business opportunities. However, none indicated that they actually increased their exports to other EU countries or that REACH led to the opening of new markets for their products within the EU.
12 Firms indicating “Yes, somewhat” or “Yes, substantially”.

Monitoring Impacts of REACH on Innovation, Competitiveness and SMEs – Draft Interim Report
Section 4 – Findings
19
Table 4.1.3 The role of REACH in promoting exporting for firms with a strong focus on domestic markets (>80% of total annual sales)
Statement Source Total number of firms with focus on domestic
markets
Percentage of firms indicating
REACH has increased the harmonisation of the EU chemicals legislation, leading to the opening of new opportunities for our business in the EU (agree or strongly agree)
CATI survey 334 24.2%
Business survey 42 9.5%
Exports to other European Economic Area countries changed as a result of the introduction of the REACH Regulation : increased slightly/significantly
CATI survey 179 2.2%
Business survey 42 0%
Opening of new markets for your products within the EU (positive or very positive impact)
Business survey 42 0%
Source: CATI/Online survey
The data point to a limited role of REACH in promoting exports among firms focusing on domestic markets. However, there are other factors at play of greater importance than REACH that determine whether firms will export or not.
4.1.5 Areas with the greatest potential for further harmonisation benefits, and measures to increase the level of harmonisation.
A critical success factor for the operation of a harmonised single market for chemicals is the consistent implementation and enforcement of the legislation and market surveillance. Among the CATI survey respondents, 22.3% stated that there is currently a level playing field for firms, while 60.1% said that it is uneven situation, either overall or in a few specific respects. End users appear to be more supportive of the view that there is a level playing field, compared to formulators and manufacturers. However, it is important to note that end users have rather limited actual experience of the enforcement of REACH. At the same time, there is no variation depending on size or export orientation.
53.8% of respondents to the OBS agreed that the variation in the level of enforcement of REACH across the EU has a negative impact on the operation of the single market, particularly in the case of distributors and importers, although the view is widely held among all the REACH roles.
The need for further efforts to make market surveillance more effective was indicated in the responses of a number of industry representatives during the interviews. Around 30% of industry representatives suggested that market surveillance was effective. The main reasons for less than effective surveillance were identified as the different approaches followed by Member States’ enforcement authorities in terms of inspections (more or less active) and the relative resources allocated to ensuring REACH compliance.
Member States’ authorities and REACH helpdesks also agreed that market surveillance issues are the ones most frequently raised by firms in their countries. Other issues often raised by firms are related to imports from other EU countries.

Monitoring Impacts of REACH on Innovation, Competitiveness and SMEs – Draft Interim Report
Section 4 – Findings
20
Table 4.1.4 - Issues raised by firms to MS authorities – Number/share of MS authorities stating frequency that issues are raised by firms
Issue Do not know
Never Quite Rare
Occasionally Quite often
Very often
n
Access to other EU markets
18.2 18.2 13.6 27.3 18.2 4.6 22
Imports from other EU countries
12.5 12.5 0.0 41.7 20.8 12.5 24
Market surveillance issues
9.1 9.1 27.3 13.6 31.8 9.1 22
Investment within the EU
28.6 19.1 14.3 23.8 9.5 4.8 21
Source: MS authorities/REACH helpdesks interviews
MS authorities identified the following as areas to address to increase harmonisation:-
Issues surrounding languages (e.g. translations of SDS/ ES)
Lack of resources for staff, staff training and retention.
Collaboration between different government bodies
The supply of test laboratories (costs and time to get a response)
The lack of knowledge as regards REACH among firms
According to companies interviewed, the following factors cause problems as regards surveillance and enforcement:
Different penalties for non-compliance (not harmonised)
Different OSH legislation in MS, also BOELV (Binding Occupational Exposure Limit Values)
National rules still apply in some countries (Nordic area, Germany, etc.); there is a multiplicity of “product registries” that lead to incurring of costs despite REACH harmonisation and EU-free trade rules (e.g. Denmark, Sweden, Italy, Netherlands, France).
Re-imports of chemicals into the EU
Nanomaterials (REACH Annexes are not implemented yet)
Lack of enforcement as regards imported articles
Varying inspection requirements between and within MS (for example in France it based on departments of which here are 900).
Knowledge levels of inspectors
Valid test methods for SVHC contents in articles
Products entering from non-EU/ EEA countries (polymers, cosmetics, biocides and chemical articles).

Monitoring Impacts of REACH on Innovation, Competitiveness and SMEs – Draft Interim Report
Section 4 – Findings
21
4.2 Objective 2 - Strengthening External Competitiveness
4.2.1 Introduction
The aims of this section are to determine the main mechanisms whereby REACH has altered the position of EU industry when exposed to global chemical markets and, to attempt to quantify the impact of those mechanisms. In addition, the aim is to describe examples, if any, of ways in which REACH has improved the global competitiveness of the EU chemicals sector (i.e. when new products or improved safety provided added value to EU traders) The competitive position of the EU’s chemical industry overall is dealt with in other reports such as The European Chemical Industry – Facts and Figures 2014 (CEFIC) and Evolution of competitiveness in the European chemical industry: historical trends and future prospects (2014) by Oxford Economics for CEFIC. It is understood that a study by the European Commission is also under way dealing with this topic as well as an assessment of REACH-like regulations in other countries.
The focus of this study is on how REACH affects the competitiveness of EU industry when exposed to global markets. Following the approach of the Commission’s Competitiveness Toolkit, the drivers of competitiveness are costs/ prices, innovation, competitiveness of and access to markets13. The REACH Regulation affects these through its various mechanisms: registration, evaluation, authorisation and restriction – and the processes underlying these mechanisms.
4.2.2 The main mechanisms through which REACH has impacted on the position of EU industry when competing in global chemical markets.
The mechanisms through which REACH impacts enterprise operations are those at the core of the Regulation and their underlying processes. Registration influences enterprises through costs including registration itself and the various expenses required to bring that about which could include testing, participation in SIEFs or consortia, communication through the value chain, creating the required forms and updating them, etc. The data and knowledge created could also affect competitiveness if it leads to innovation. Authorisation includes not just the actual process of applying for authorisation, but the whole preceding process starting with MS CAs proposing substances, the development of the candidate list, and the effects on production, imports and exports. Restriction affects competiveness because it may limit or ban the manufacture, placing on the market or use of a substance.
All types of participants in the chemicals value chain are affected: from manufacturers to end users. The CEFIC and Oxford Economics reports make it clear that EU chemicals companies are very highly involved in the global trade in chemicals. The relationship is complex as many chemicals that are exported may include substances or mixtures that were initially imported – including from third-country-based subsidiaries of EU enterprises. Such intra-firm trade is important for the competitiveness of EU chemicals industry and enterprises. As the Cefic report (2014) put it “The industry relies increasingly on tightly interconnected clusters that in turn participate in global value chains”.14 Hence competition in the global chemicals market is not just a case of promoting EU
13 Brussels, 27.1.2012 SEC(2012) 91 final COMMISSION STAFF WORKING DOCUMENT OPERATIONAL GUIDANCE FOR ASSESSING IMPACTS ON SECTORAL COMPETITIVENESS WITHIN THE COMMISSION IMPACT ASSESSMENT
SYSTEM A "Competitiveness Proofing" Toolkit for use in Impact Assessments, p. 8.
14 p.15
Monitoring Impacts of REACH on Innovation, Competitiveness and SMEs – Draft Interim Report
Section 4 – Findings
22
export, but also of ensuring access to key imports of substances not available, or not available at competitive prices, in the EU.
When discussing the impacts of the REACH Regulation through its various mechanisms with MSCAs very few had any specific comments, other than that they did not have data, or systematic data, in that respect, or that if data existed it was the responsibility of a different department to collect and interpret (usually the relevant department or ministry of industry, commerce or economy). Some anecdotal remarks were forthcoming to the effect that increased imports of articles from non-EU countries had been observed, or that exports were less competitive due to higher prices; that supply chains were more transparent which was beneficial for the market; and that authorisation and SVHC presence could have an effect. At last one MSCA is supporting a sub0-sector fo the industry facing a difficult competitive situation as a result of problems in accessing imports.
Industry representatives usually had well-developed views. One (UK) said that REACH had led to a refocusing on the domestic market for suppliers as they preferred intra-EU suppliers who were REACH compliant. Another UK-based association said that uncertainty about future supplies of substances and the need to find substitutes ‘in case’ theirs were authorised or restricted meant that innovation was being stifled and companies were nervous about investment. One said that some imports from Russia had been stopped, others that some importers or EU suppliers had withdrawn which made the market better for those remaining. A report by the Commission on Critical Raw Materials which linked the risk of supply (beryllium) to regulatory concerns was referred to.
Turning to the views of firms, according to the CATI survey, the majority of firms (65%) do not consider that the REACH regulation has had an impact on their competitive position compared to firms from outside the EU. However, among manufacturers of chemicals – which are more directly affected by the Regulation (through registration/authorisation costs) - 38.9% consider that it has indeed had an impact. Among firms with a high level of exports there are higher levels of concern (35% indicate there is an impact) in comparison to firms focusing primarily on the domestic market (20%), who may of course still import inputs.
The size of the firm also appears to have a role. Among large firms, 28% indicated that they have concerns, whereas this was less so among medium (23%), small (21.5%) and, even more so, micro firms (9.5%). This may be a reflection of the fact that smaller firms tend to export less outside the EU, or may be less directly dependent on imports from outside the EU and are often less aware of such competitive issues. Company interviews do show however that at least some micro firms are confronted by survival considerations as a result of competitive developments resulting from REACH, rather than marginal adjustments. As far as the country of establishment is concerned, there are no major or obvious deviations among respondents.
Among those firms indicating that they think their competitive position is affected, the majority believes that REACH has weakened their position (54.8%). However, there are important variations among firms with different roles. Manufacturers of substances tend to be more negative (73.4% say that their competitive position was weakened, substantially for the greater part), while article suppliers are more positive (59.1% consider that it was strengthened). Formulators are also negative. It should be noted that the negative views are much stronger (more firms usually indicate that their position was substantially weakened) while positive views are not (no more than 1.6% indicate that their position was substantially strengthened). Furthermore, the analysis suggests that large firms tend to have a more negative view compared to smaller ones. 65% percent of large firms provide a negative assessment in comparison to 45% of SMEs. This might be because smaller firms do not often see themselves as competing with non-EU firms.

Monitoring Impacts of REACH on Innovation, Competitiveness and SMEs – Draft Interim Report
Section 4 – Findings
23
Table 4.2.1 - Would you say that your competitive position vis a vis firms from outside the EU has:
Response Manufacturers
Formulators Distributors Importers Suppliers of articles
End users All firms
Weakened substantially
54.4 47.8 21.4 36.4 30.6 38.9 42.5
Weakened 19.0 9.0 17.9 18.2 4.1 5.6 12.3
Strengthened 22.8 37.3 46.4 45.5 57.1 44.4 38.5
Strengthened substantially
1.3 1.5 3.6 0.0 2.0 0.0 1.6
Do not know 2.5 4.5 10.7 0.0 6.1 11.1 5.2
Total 100.0 100.0 100.0 100.0 100.0 100.0 100.0
n 79 67 28 11 49 18 252
Source: CATI survey
4.2.3 The impacts of the REACH mechanisms.
To identify the type of impacts that affect competitiveness, the OBS asked respondents to indicate the impact of REACH on a number of aspects that are linked with their competitive position vis a vis non-EU competitors. These were: access to raw materials, access to markets, operating costs, capacity to innovate, availability of human resources, and access to financial resources. Operating costs were seen as negatively affected by 56% of respondents, followed by access to raw materials (38.9%) the capacity to innovate (35%), and availability of human resources (31.3%). Positive impacts are much less often identified. Examining responses by REACH role, distributors tend to have the most negative view (generally more than 60%) while article suppliers more often consider that REACH is not relevant or does not have a particular impact.
Table 4.2.2 -Has REACH impacted on any of the following factors affecting the competitiveness of your business in comparison to non-EU competitors? (percentage of respondents indicating – all roles).
Options Very negatively
Negatively
Not particularly
Positively Very positively
Not relevant
Do not know
n
Access to raw materials
9.5 29.4 23.3 2.8 0.3 24.5 10.1 326
Access to markets
9.3 18.6 34.5 5.3 0.0 21.4 10.9 322
Operating costs
16.7 39.3 19.8 0.3 0.0 14.6 9.3 323
Capacity to innovate
16.6 18.4 31.6 10.0 0.6 16.9 5.9 320
Availability of human resources
8.8 22.5 38.8 1.9 0.6 17.5 10.0 320
Access to financial resources
5.0 14.8 41.8 0.9 0.3 21.1 16.0 318
Source: Online survey
On the specific topic of access to external export markets, the majority of CATI survey respondents also did not assign much added value to REACH and the fact that their products are REACH compliant. The majority (88.9%) of CATI respondents indicated that their exports to outside the EU had not increased due to their products being REACH compliant, although some said it had increased somewhat (7.2%). Interviews with firms indicated that, despite the adoption of more demanding

Monitoring Impacts of REACH on Innovation, Competitiveness and SMEs – Draft Interim Report
Section 4 – Findings
24
chemicals legislation in some countries, there is a limited benefit arising from being REACH compliant, at least at this stage, as, for example, test results are not necessarily accepted and/ or tests have to be repeated, or done differently.
The online survey responses further corroborated the findings presented above. Some 3.1% of firms see a positive impact of REACH in relation to opening of new markets outside the EU, their market share (3.7%) or the relative price of their products (0.3%). However, in most cases REACH is not considered relevant or it is seen as having a predominantly negative effect, especially as regards prices.
Table 4.2.3 - What have been the impacts, if any, of the implementation of the REACH Regulation in relation to the following aspects?
Options Strong negative
Negative
No particular
impact
Positive Strong positive
Not relevant
Do not
know
n
Opening new markets for your products outside the EU
5.5 9.2 43.7 2.8 0.3 32.6 5.8 325
Your market share size outside EU
4.0 7.1 46.3 3.4 0.3 29.6 9.3 324
The price of your products compared to non-EU competitors
15.2 25.2 28.6 0.3 0.0 16.8 14.0 322
Source: Online survey
From the point of view of access to external markets, some feedback from the company interviews has indicated what the negative effects on competitiveness might involve. Not only have transaction costs as regards existing imports been increased, for example in the case of having to work through an OR, or having to register an import as an importer, but there is a view that new innovative products or formulations may not be marketed in the EU because non-EU exporters will not want to do the necessary registrations where small volumes of substances are present in mixes. In addition, it has proved very hard, in many instances, for importers into the EU to obtain data about the composition of the substances, mixes or articles in question. Non-EU suppliers are often not aware of REACH and do not want to invest time into learning about it or complying with the regulation. They also have concerns about intellectual property. When these are intra-firm imports it is less of an issue.
Some EU-based multinationals have indicated that they have had to set up and train REACH-compliant international supply chains for their products at considerable expense (e.g. for electronics and information and communication technology products). In addition, once the supply base is set up, it is more rigid and it is less possible to switch to suppliers with better prices as they will not all have been put through the REACH compliance process by the purchaser, given the costs involved. There is also less flexibility as regards supplies through non-EU based toll manufacturers as they now would also have to be REACH-compliant.
Some EU businesses could benefit from these trends as, where possible, EU importers may switch to sourcing from within the EU, although it could amount to a reduction in the competitiveness of markets and will not necessarily be to the benefit of EU industry as a whole.
Large firms are more concerned than SMEs (27.1% compared to 21.1%, and 13.7% for micro firms) about the effect of the Regulation on their competitive position vis à vis firms from outside the EU, and more see this in a negative light (65.8%) than SMEs (46.1%). This may be because they compete more with such non-EU firms. At the same time, 31.5% of large firms and 46.8% of SMEs thought their position had strengthened (CATI data).

Monitoring Impacts of REACH on Innovation, Competitiveness and SMEs – Draft Interim Report
Section 4 – Findings
25
Table 4.2.4 How has the competitive position of your firm vis à vis firms from outside the EU been affected (percentage of respondents indicating)
Options Micro Small Medium SMEs total
Large All firms
Strengthened substantially 7.7 2.3 2.6 2.8 0.0 1.6
Strengthened 30.8 43.2 47.4 44.0 31.5 38.5
Weakened 15.4 13.6 16.7 14.9 9.0 12.3
Weakened substantially 23.1 38.6 28.2 31.2 56.8 42.5
Don't know 23.1 2.3 5.1 7.1 2.7 5.2
Total 100.0 100.0 100.0 100.0 100.0 100.0
n 13 44 78 141 111 252
Source: CATI survey
The survey findings suggest that impacts on operating costs are among the key challenges identified in terms of impacts on international competitiveness. The OBS reveal the different responses of firms to these costs. They suggest that only a small share of firms said they were able to pass the costs on to consumers in terms of increased prices, mainly among manufacturers and formulators. A much greater share said they absorbed the costs by reducing profit margins. The decision to withdraw certain products from the market or withdraw completely from the market was also less common, with the exception of distributors and importers which appeared to be more willing to take such steps.
Referring only to Registration costs, manufacturers and importers that responded to the CATI survey most often stated that they avoided increasing prices or removing products from the market (only 20% of manufacturers and 6% of importers selected this option ). The majority (over 70%) decided to make the necessary investments and absorbed the relevant costs.
The type of response largely depends on the structure of the market in question. The options are:
Firms can raise prices to reflect costs without losing competitiveness. This can happen in markets where demand is inelastic, or greater than supply.
Firms absorb REACH costs in prices but with limited impact on profitability due to high profit margins.
Firms operate with smaller profit margins and in markets where they cannot increase prices without losing market share or profitability. In this case REACH costs may lead to a decision to reduce or stop the supply of a specific substance.
The possibilities illustrated above are reflected in the responses of industry representatives. Most provided a negative assessment of the impact of REACH on each of the above aspects, in most cases being even more critical than firms (for example 76% of industry representatives considered that REACH has a negative impact on operating costs). Again, it is only in relation to the capacity to innovate that a more positive contribution is identified by 12% of respondents. Furthermore, most industry representatives support the view that, rather than having a minor impact on firms’ competitiveness – in comparison to other parameters such energy prices, labour costs, raw materials prices or the impact of the financial crisis – REACH is of some (35% of respondents) or of high importance (35%).
Large firms tended more often to say they absorbed costs and reduced margins than SMEs (75.9%, compared to 66.7% for SMEs). SMEs and large firms indicated that they raised prices about to the same extent (about 20%) but SMEs as a whole indicated a higher response rate than large firms to the options of “withdrawing from markets” (12.8% as opposed to 7.3%) and “withdrawing products from the market” (27.6% as compared to 14.6%) – a particularly high rate (77.8%) was recorded for micro firms for product withdrawal (however the number of responses was not high).

Monitoring Impacts of REACH on Innovation, Competitiveness and SMEs – Draft Interim Report
Section 4 – Findings
26
Examples of the processes underlying the above data collected through interviews in the form of anecdotal evidence are that: 3rd country exporters to the EU may be put off by registration costs, or that they do not want to work through an OR. There is also anecdotal evidence of exporters being able to charge more for REACH products, and there are questions about new markets becoming accessible and existing ones closing, but we have not been able to substantiate these comments. However, it is very probable that the results will differ depending on the segment of the market in question, and the presence of alternative (actual and potential) suppliers. Trade data indicate that the EU is particularly strong (in terms of exports) in the area of specialty and fine chemicals. These high knowledge intensive areas tend to be less sensitive to price completion. However, non-EU (e.g. Chinese) industry has developed rapidly and this might not always be the case in the future.
In the OBS seven respondents (DUs) reported that they had ceased production in the EU and had moved operations to outside the EU in response to REACH requirements, in particular the appearance of substances on the candidate list and moving towards authorisation. These were from the following sectors: textiles, electronics, chemicals manufacture, manufacture of processes for electroplating, manufacture of paints, varnishes and similar coatings, printing ink (including specialist fluoropolymer based versions) manufacture of dyes and pigments, wholesale of chemicals and selling and formulating dyes and pigments. These activities were no longer considered competitive in the EU. In the course of the interview programme several SMEs that are affected by authorisation indicted that they are also seriously entertaining such thoughts, while many micro and small firms and family businesses are confronted with survival issues.
Table 4.2.5 provides a selection of some comments by firms obtained during the company interviews cast some light on the nature of the impacts that emerge as a result of the REACH mechanisms..
Table 4.2.5 Text replies to the OBS (selection)
Firm size Firm primary role
Comments as regards aspects of the implementation of REACH Regulation that affect the competitiveness vis a vis non-EU industry.
Large Supplier of articles
The burden to the EU manufacturer is increased compared to Non-EU industry.
Large Formulator The administrative burden of doing business with neighbouring non-EU countries (Russia, Switzerland, Turkey) has increased dramatically.
Micro Distributor It has prevented us from continuing with long established business because the non-EU supplier did not honour their obligation to register under Reach and the cost of purchasing letters of access from the SIEF made it too expensive for us to register by ourselves.
Large Importer of chemicals
REACH has a very limited focus on non-EU based trading entities with trade activities within the EU.
Large Formulator It is difficult to do business globally - REACH is a barrier to importing materials from outside of the EU.
Large Man of chemicals
Conducting business with neighbouring non EU-countries, such as Turkey, Switzerland and Russia requires increased administrative burden. There is additional effort required to identify alternative suppliers and to conduct the REACH checks for procured substances.
Large Supplier of articles
We invested large sums to recruit resources to manage substances under authorisation with a given sunset date only to find that the sunset date was then changed. These funds could have been deployed to improve our competitive position – e.g. to obtain new product lines, etc.
Small Importer of As a small firm it is practically impossible for us to obtain registrations for all
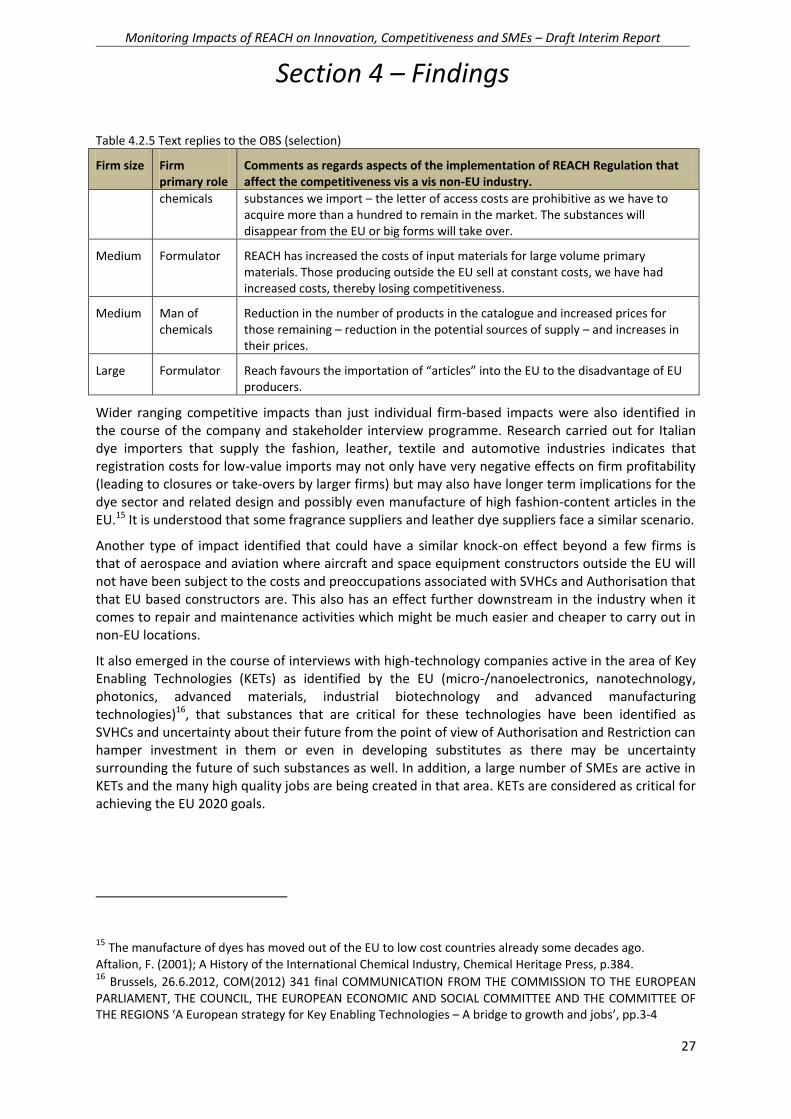
Monitoring Impacts of REACH on Innovation, Competitiveness and SMEs – Draft Interim Report
Section 4 – Findings
27
Table 4.2.5 Text replies to the OBS (selection)
Firm size Firm primary role
Comments as regards aspects of the implementation of REACH Regulation that affect the competitiveness vis a vis non-EU industry.
chemicals substances we import – the letter of access costs are prohibitive as we have to acquire more than a hundred to remain in the market. The substances will disappear from the EU or big forms will take over.
Medium Formulator REACH has increased the costs of input materials for large volume primary materials. Those producing outside the EU sell at constant costs, we have had increased costs, thereby losing competitiveness.
Medium Man of chemicals
Reduction in the number of products in the catalogue and increased prices for those remaining – reduction in the potential sources of supply – and increases in their prices.
Large Formulator Reach favours the importation of “articles” into the EU to the disadvantage of EU producers.
Wider ranging competitive impacts than just individual firm-based impacts were also identified in the course of the company and stakeholder interview programme. Research carried out for Italian dye importers that supply the fashion, leather, textile and automotive industries indicates that registration costs for low-value imports may not only have very negative effects on firm profitability (leading to closures or take-overs by larger firms) but may also have longer term implications for the dye sector and related design and possibly even manufacture of high fashion-content articles in the EU.15 It is understood that some fragrance suppliers and leather dye suppliers face a similar scenario.
Another type of impact identified that could have a similar knock-on effect beyond a few firms is that of aerospace and aviation where aircraft and space equipment constructors outside the EU will not have been subject to the costs and preoccupations associated with SVHCs and Authorisation that that EU based constructors are. This also has an effect further downstream in the industry when it comes to repair and maintenance activities which might be much easier and cheaper to carry out in non-EU locations.
It also emerged in the course of interviews with high-technology companies active in the area of Key Enabling Technologies (KETs) as identified by the EU (micro-/nanoelectronics, nanotechnology, photonics, advanced materials, industrial biotechnology and advanced manufacturing technologies)16, that substances that are critical for these technologies have been identified as SVHCs and uncertainty about their future from the point of view of Authorisation and Restriction can hamper investment in them or even in developing substitutes as there may be uncertainty surrounding the future of such substances as well. In addition, a large number of SMEs are active in KETs and the many high quality jobs are being created in that area. KETs are considered as critical for achieving the EU 2020 goals.
15 The manufacture of dyes has moved out of the EU to low cost countries already some decades ago. Aftalion, F. (2001); A History of the International Chemical Industry, Chemical Heritage Press, p.384. 16 Brussels, 26.6.2012, COM(2012) 341 final COMMUNICATION FROM THE COMMISSION TO THE EUROPEAN PARLIAMENT, THE COUNCIL, THE EUROPEAN ECONOMIC AND SOCIAL COMMITTEE AND THE COMMITTEE OF THE REGIONS ‘A European strategy for Key Enabling Technologies – A bridge to growth and jobs’, pp.3-4
Monitoring Impacts of REACH on Innovation, Competitiveness and SMEs – Draft Interim Report
Section 4 – Findings
28
4.2.4 Ways in which REACH has improved the global competitiveness of the EU chemicals sector.
The reports mentioned in the introductory part of this sub-section by Cefic and Oxford Economics (2014) make it clear that the competitiveness of the EU’s chemical industry is driven by a wide range of factors including energy prices, labour cost (and productivity), exchange rates, infrastructure, taxation, and R&D spending and innovation (considered separately elsewhere in this report), and the regulatory environment. The REACH Regulation is but one piece of legislation among many that affect the industry. That does not mean, of course, that it cannot have a critical influence on an individual firm, or group of firms, or even s sub-sector, as indicated above, but it does mean that at best, it is likely, even if far reaching, to have a limited overall impact on the industry as a whole.
At this stage of the life cycle of the legislation, the field research (interviews, surveys) has identified some ways in which the Regulation has contributed, or can contribute to competitiveness of the industry. These are:
It has increased transparency in the sector, which means there is more scope to identify inefficiency and bring about improvements in the supply chain.
Related to transparency is improved communication – various sector initiatives have been set up which has meant that different members of supply chains better communicate their needs and expectations leading to better integration, quality control, need identification and less waste.
Linked to this is increased traceability, a key constituent of quality control.
Improved communication with customers through the abovementioned channels is also expected to bear fruit, although the research team has not identified evidence of that.
One area where there has been improvement is as regards risk management and environmental management. About half of respondents to the CATI said that REACH would contribute to improved risk management procedures, and about a third said there would be improved management of environmental emissions and waste resulting from REACH. However, these often imply cost increases for firms and in the course of the field work no companies were identified that said it had actually resulted in increased sales abroad, although as indicated above, some said it did present “opportunities”. On te other hand, some survey respondents did make it clear that that buyers in non-EU markets are not be prepared to pay higher prices for REACH compliant products.

Monitoring Impacts of REACH on Innovation, Competitiveness and SMEs – Draft Interim Report
Section 4 – Findings
29
4.3 Objective 3: Registration 2013
4.3.1 Introduction
The key study objectives in respect of Registration 2013 (Objective 3) are to:
Quantify the costs of the registration exercise in 2013 – providing, where possible, more details on the specific categories of costs such as costs of training, familiarisation and information, costs of financing, costs of legal support, as well as costs of SIEF or Consortium participation, letters of access, etc. This is to assist policymakers to make appropriate adjustments in factors underlying these costs and so, where possible, propose actions to reduce burdens or excessive costs; and
Availability of substances - examine stability of supply of substances in terms of whether substances that were expected to be registered in 2013 have been registered, the prices and quantities available.
Drawing on the information gathered from the surveys and interviews (and provided in Section 4.3 of the Evidence Report attached to this report), this section presents an analysis and conclusions in relation to each of these questions in turn. When necessary, key data in relation to the questions are also presented in this section where this is pertinent to the answers to the questions that are the focus of study.
4.3.2 Quantification of the costs of the registration exercise in 2013
Introduction
Both the OBS and CATI surveys requested estimates of the cost of the registration 2013 exercise17. The CATI survey asked for information on the cost of registering all substances in all tonnage bands in 2013 and the number of substances registered. The OBS requested more detailed estimates on costs of registering substances, asking for information on the cost of registering substances in each of the four tonnage bands, the number of substances registered in 2013 in each tonnage band and the percentage of costs associated with different registration activities (described in the relevant sections below).
Overall costs of registration 2013 to Registrants
As noted above, both the OBS and CATI requested information on the costs of registering substances in 2013. Data from both surveys provides information on total cost of Registration 2013 to each responding registrant. Table 4.3.1 provides data from both surveys presented separately and as an overall estimate so as to allow comparison to be made between the results of the CATI and the OBS to check consistency.
Table 4.3.1: Total costs of registration
Firm size Range CATI OBS Combined Data
SME
Average € 245,175 € 380,734 € 321,795
Median € 100,000 € 168,000 € 122,500
Min € 999 € 2,000 € 999
17 Registration costs include external costs such as ECHA fees, costs of participation in SIEFs/consortia, letters of access, consultants paid and any internal costs (e.g. wages and other human resources, travelling) directly linked with the registration process.

Monitoring Impacts of REACH on Innovation, Competitiveness and SMEs – Draft Interim Report
Section 4 – Findings
30
Max € 2,500,000 € 3,750,000 € 3,750,000
Count 40 52 92
Large
Average € 3,050,356 € 3,215,522 € 3,138,147
Median € 400,000 € 260,000 € 300,000
Min € 5,500 € 9,000 € 5,500
Max € 42,500,000 € 100,000,000 € 100,000,000
Count 52 59 111
Overall
Average € 1,830,712 € 1,853,570 € 1,843,362
Median € 200,000 € 195,000 € 200,000
Min € 999 € 2,000 € 999
Max € 42,500,000 € 100,000,000 € 100,000,000
Count 92 114 206
Whilst the CATI survey was a larger survey overall in terms of the number of respondents, a similar (but slightly higher) number of respondents provided estimated costs of Registration 2013 in the OBS and a total of 206 respondents provided information on total costs once the two surveys are combined.
Comparing the information from the two surveys, the maximum and minimum cost estimates vary from one survey to another where this can be expected as these values represents the extreme high and low ends of the spectrum of costs (outliers). Estimates of average cost per registrant are very similar for large companies and also overall. However, the OBS records higher average cost of registration for SMEs than the CATI survey.
With regard to all cost estimates between the surveys, cost estimates will vary significantly depending on the number of substances registered by one registrant versus another and, as is suggested by data provided in the next section (where costs are expressed on the basis of the average cost per substance), this is likely to the reason for variation between estimates from the CATI versus the OBS. Here, for example, the average number of substances registered in 2013 by respondents to the OBS was around 12 for SMEs and 31 for large enterprises but many registered more and many registered less.
The data from the surveys suggests that overall statistical average cost of Registration in 2013 was around €322k for SMEs and €3,138k for large companies for registration of entire portfolios of substances. However, these average values are not representative of the ‘typical cost’ to a SME or Large enterprise as there is such variation in the numbers of substances to which the estimates relate. Figure 4.3.1 provides a plot of the distribution of cost estimates for both surveys in terms of the percentage of estimates falling between each cost range and Figure 4.3.2 for the surveys combined18. As can be seen from both figures, there is significant variation from the average values provided above and, as suggested by the median values above, costs for 50% of respondents were less than half of the average for SMEs and less than a tenth of the average for large companies. The results of both surveys suggest a very similar (and wide) distribution of total registration costs across the sample with the vast majority at the lower end of the spectrum of costs and a smaller percentage with higher (and for an even smaller percentage, much higher) costs. This segment of
18 Note that for readability the x axis is adjusted so that it covers up to the 95 percentile value – i.e. the 5% highest costs are not provided on the graph

Monitoring Impacts of REACH on Innovation, Competitiveness and SMEs – Draft Interim Report
Section 4 – Findings
31
respondents recording highest costs acts to increase the average significantly to €1,843k across all registrants (SMEs and Large combined) but, as can be seen from Figure 4.3.2, the vast majority of respondents (84%) recorded costs below the average value of €1,843k, indeed, 75% of respondents recorded costs below or substantially below €750k and 50% below or substantially below €200k.

Monitoring Impacts of REACH on Innovation, Competitiveness and SMEs – Draft Interim Report
Section 4 – Findings
32
0%
5%
10%
15%
20%
25%
30%
Percentage Frequency Average Total Registration Cost per MI - CATI versus OBS
% Frequency Average Registration cost per MI (Respondents to CATI Survey, n=92) % Frequency Average Registration cost per MI (Respondents to OBS, n=114)
Chart 4.3.1 Percentage frequency average total registration cost per MI – CATI vs OBS
Chart 4.3.2 Percentage frequency average total registration cost per MI
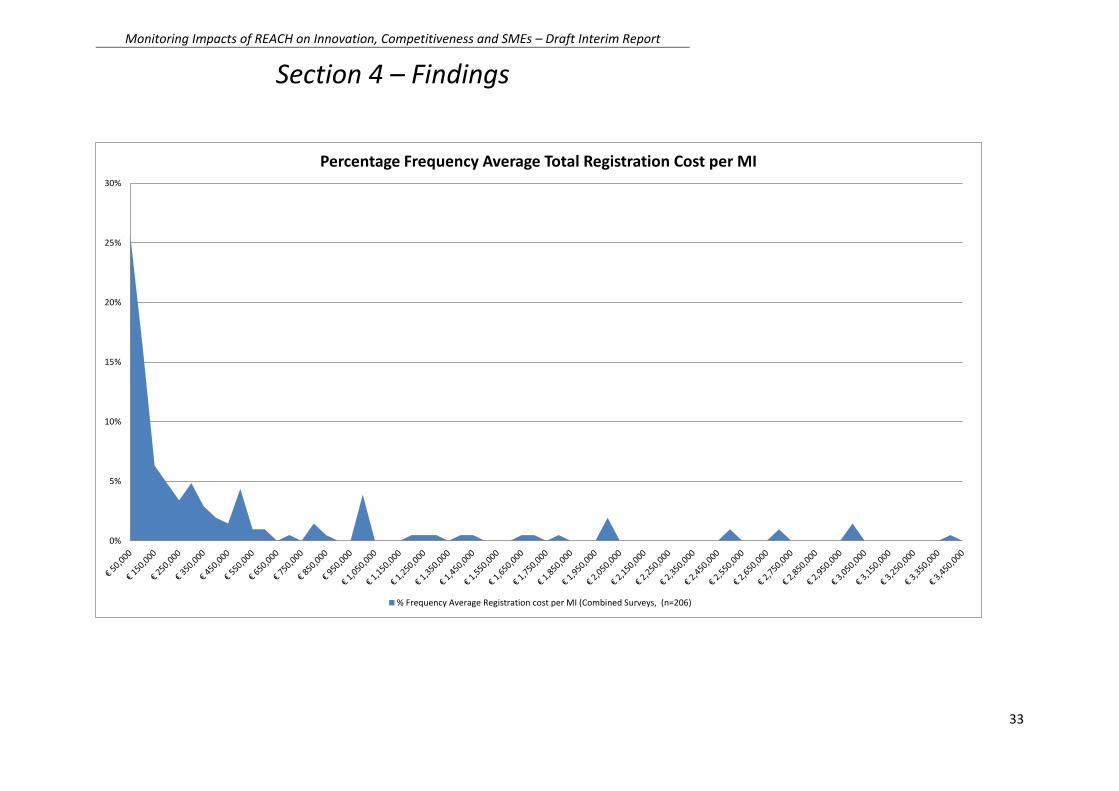
Monitoring Impacts of REACH on Innovation, Competitiveness and SMEs – Draft Interim Report
Section 4 – Findings
33
0%
5%
10%
15%
20%
25%
30%
Percentage Frequency Average Total Registration Cost per MI
% Frequency Average Registration cost per MI (Combined Surveys, (n=206)

Monitoring Impacts of REACH on Innovation, Competitiveness and SMEs – Draft Interim Report
Section 4 – Findings
34
Costs of registering individual substances in 2013
Total cost estimates for registrants will vary significantly depending on the number of substances registered by one registrant versus another. As respondents to both surveys were asked also to provide an estimate of the number of substances registered in 2013, for respondents providing cost estimates and estimates of numbers of substances registered it has been possible to divide the costs by the total number of substances registered in 2013 for both surveys19.
Table 4.3.2 provides the resulting estimates of the average cost of registering a substance in 2013. As can be seen from the table, results are very similar between surveys suggesting a high degree of consistency once results are expressed as per substance registration costs.
Table 4.3.2: Average cost per substance per MI
Firm size Range CATI OBS Combined Data
SME
Average € 59,079 € 57,484 € 58,137
Median € 50,000 € 40,763 € 47,333
Min € 1,000 € 543 € 543
Max € 200,000 € 186,000 € 200,000
Count 36 52 88
Large
Average € 78,846 € 79,189 € 79,031
Median € 40,000 € 39,074 € 40,000
Min € 2,750 € 4,500 € 2,750
Max € 666,667 € 555,556 € 666,667
Count 50 59 109
Overall
Average € 70,571 € 68,286 € 69,269
Median € 47,973 € 40,763 € 43,473
Min € 1,000 € 543 € 543
Max € 666,667 € 555,556 € 666,667
Count 86 114 200
Once again, the average - and other values- are of limited use for drawing conclusions on the costs of registration. This is both because there remains significant variation around the averages which, in turn, is likely to be related to factors including:
Tonnage bands in which substances were registered – SMEs, in particular, registered more substances in the lower tonnage bands than the higher tonnage bands compared with Large enterprises;
The number of registrations which were for substances already registered at >1,000t versus first time registration;
Differences between substances themselves in terms of factors such as the number of other registrants (and the extent of cost sharing that is possible), hazardous properties, numbers of downstream uses/users.
19 As the CATI survey did not request specific information on costs of registering substances in each tonnage band it is not possible to provide a breakdown of costs by tonnage for results of the CATI and OBS combined. This information was, however, requested in the OBS and these data are discussed in more detail in later sub-sections.
Monitoring Impacts of REACH on Innovation, Competitiveness and SMEs – Draft Interim Report
Section 4 – Findings
35
Figure 4.3.3 provides a plot of the distribution of cost estimates for both surveys in terms of the percentage of estimates falling between each cost range and Figure 4.3.4 for the surveys combined. As can be seen from both figures, there is significant variability in cost of registration per substance for the reasons outlined above.

Monitoring Impacts of REACH on Innovation, Competitiveness and SMEs – Draft Interim Report
Section 4 – Findings
36
0%
2%
4%
6%
8%
10%
12%
14%
16%
18%
20%
Percentage Frequency Average Registration Costs per Substance CATI versus Online Business Survey
% Frequency Average Registration cost per Substance (Respondents to CATI Survey, n=86) % Frequency Average Registration cost per Substance (Respondents to OBS, n=114)
0%
2%
4%
6%
8%
10%
12%
14%
16%
Percentage Frequency Average Registration Costs per Substance
% Frequency Average Registration cost per Substance (Combined survey, (n=200)
Chart 4.3.3 Percentage average registration costs per substance CATI versus OBS
Chart 4.3.4 Percentage frequency average registration costs per substance

Monitoring Impacts of REACH on Innovation, Competitiveness and SMEs – Draft Interim Report
Section 4 – Findings
37
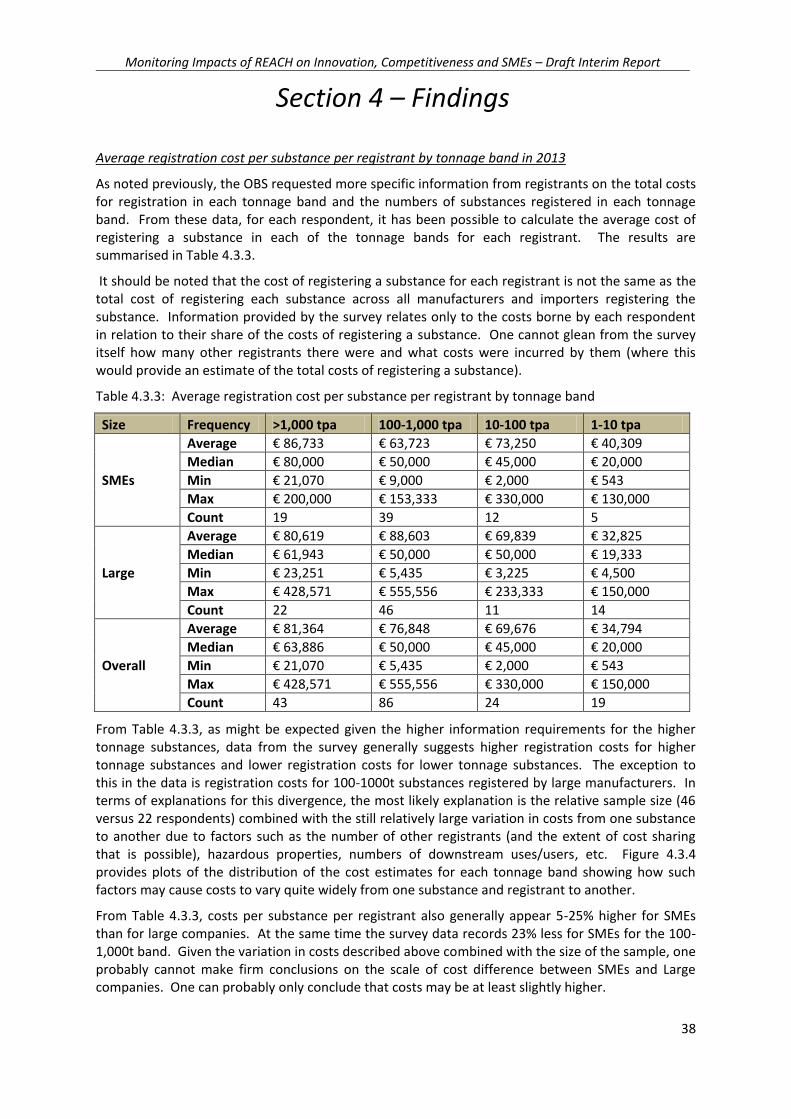
Monitoring Impacts of REACH on Innovation, Competitiveness and SMEs – Draft Interim Report
Section 4 – Findings
38
Average registration cost per substance per registrant by tonnage band in 2013
As noted previously, the OBS requested more specific information from registrants on the total costs for registration in each tonnage band and the numbers of substances registered in each tonnage band. From these data, for each respondent, it has been possible to calculate the average cost of registering a substance in each of the tonnage bands for each registrant. The results are summarised in Table 4.3.3.
It should be noted that the cost of registering a substance for each registrant is not the same as the total cost of registering each substance across all manufacturers and importers registering the substance. Information provided by the survey relates only to the costs borne by each respondent in relation to their share of the costs of registering a substance. One cannot glean from the survey itself how many other registrants there were and what costs were incurred by them (where this would provide an estimate of the total costs of registering a substance).
Table 4.3.3: Average registration cost per substance per registrant by tonnage band
Size Frequency >1,000 tpa 100-1,000 tpa 10-100 tpa 1-10 tpa
SMEs
Average € 86,733 € 63,723 € 73,250 € 40,309
Median € 80,000 € 50,000 € 45,000 € 20,000
Min € 21,070 € 9,000 € 2,000 € 543
Max € 200,000 € 153,333 € 330,000 € 130,000
Count 19 39 12 5
Large
Average € 80,619 € 88,603 € 69,839 € 32,825
Median € 61,943 € 50,000 € 50,000 € 19,333
Min € 23,251 € 5,435 € 3,225 € 4,500
Max € 428,571 € 555,556 € 233,333 € 150,000
Count 22 46 11 14
Overall
Average € 81,364 € 76,848 € 69,676 € 34,794
Median € 63,886 € 50,000 € 45,000 € 20,000
Min € 21,070 € 5,435 € 2,000 € 543
Max € 428,571 € 555,556 € 330,000 € 150,000
Count 43 86 24 19
From Table 4.3.3, as might be expected given the higher information requirements for the higher tonnage substances, data from the survey generally suggests higher registration costs for higher tonnage substances and lower registration costs for lower tonnage substances. The exception to this in the data is registration costs for 100-1000t substances registered by large manufacturers. In terms of explanations for this divergence, the most likely explanation is the relative sample size (46 versus 22 respondents) combined with the still relatively large variation in costs from one substance to another due to factors such as the number of other registrants (and the extent of cost sharing that is possible), hazardous properties, numbers of downstream uses/users, etc. Figure 4.3.4 provides plots of the distribution of the cost estimates for each tonnage band showing how such factors may cause costs to vary quite widely from one substance and registrant to another.
From Table 4.3.3, costs per substance per registrant also generally appear 5-25% higher for SMEs than for large companies. At the same time the survey data records 23% less for SMEs for the 100-1,000t band. Given the variation in costs described above combined with the size of the sample, one probably cannot make firm conclusions on the scale of cost difference between SMEs and Large companies. One can probably only conclude that costs may be at least slightly higher.

Monitoring Impacts of REACH on Innovation, Competitiveness and SMEs – Draft Interim Report
Section 4 – Findings
39
Chart 4.3.5 Percentage frequency average registration costs per substance - different tonnages
Cost of different elements of registration
The study specification identified that, where possible, more details on the specific categories of costs such as costs of training, familiarisation and information, costs of financing, costs of legal support, as well as costs of SIEF or Consortium participation, etc. should be undertaken. Accordingly the OBS asked respondents to consider registration of a typical 100-1,000t substance and estimate the approximate percentage of costs that were associated with the following registration activities:
preparation of Registration Dossier – costs of drafting, finalising a technical registration dossier and submitting it (including all administrative data and producing study summaries for the relevant Annexes VII to XI but not CSA/CSR);
0%
5%
10%
15%
20%
25%
30%
Percentage Frequency Average Registration Costs per Substance at Different Tonnage Levels
Registration cost for substances at 10-100 tpa (n=35) Registration cost for substances at 1-10 tpa (n=19)
0%
5%
10%
15%
20%
25%
30%
Registration cost for substances at >1,000 tonnes tpa (n=56) Registration cost for substances at 100-1,000 tpa (n=86)

Monitoring Impacts of REACH on Innovation, Competitiveness and SMEs – Draft Interim Report
Section 4 – Findings
40
undertaking Chemical Safety Assessment (CSA) and producing Chemical Safety Reports (CSR) excluding liaison with downstream users or undertaking testing;
liaising with Downstream Users Joint registration and SIEF administrative costs;
producing extended Substance Safety Data Sheet (eSDS);
translating extended Substance Safety Data Sheet (eSDS);
gathering the information required in the relevant Annexes (VII to XI) – costs include testing costs, letters of access to information and proposals for animal tests; and
Registration fees.
Analysis of the results grouped across all respondents to the OBS suggests the distribution of costs in Table 4.3.4. The table provides the distributions for SMEs, Large enterprises and the overall average from the survey. These suggest that, typically, the two most costly activities in registration of 100-1,000t substances for both SMEs and Large enterprises were:
Fulfilling information requirements (19-22% of total costs); and
Preparing registration dossiers (16-20% of total costs).
Registration fees were a higher component of the total cost for the larger enterprises (19%) than for SMEs (11%) where this would appear consistent with the graded fee schedule (which require higher fees from larger enterprises versus SMEs).
Table 4.3.4: Distribution of costs across different registration activities for 100-1,000t substances – as a percentage of total cost
SMEs Large All Respondents
Cost category Average n= Average n= Average n=
Cost of preparation of Registration Dossier – costs of drafting, finalising a technical registration dossier and submitting it (include all administrative data and producing study summaries for the relevant Annexes VII to XI - not CSA/CSR)
16% 30 20% 45 17% 78
Cost of undertaking Chemical Safety Assessment (CSA) and producing Chemical Safety Reports (CSR) – excluding liaison with downstream users (see below) or undertaking testing
9% 22 9% 38 9% 63
Costs of liaising with Downstream Users 13% 3 6% 4 9% 9
Joint registration and SIEF administrative costs – the costs of liaising with other parties as part of joint registration and SIEFs
14% 17 12% 24 12% 44
Costs of producing extended Substance Safety Data Sheet (eSDS)
11% 7 6% 1 12% 9
Costs of translating extended Substance Safety Data Sheet (eSDS)
8% 8 6% 1 9% 11
Costs of gathering the information required in the relevant Annexes (VII to XI) – costs include testing costs, letters of access to information and proposals for animal tests
19% 32 22% 43 19% 77
Registration fees 11% 25 19% 32 14% 58
In order to provide an estimate of the ‘typical’ cost of each of the activities (in €s per registrant per substance), the percentages in Table 4.3.4 have been applied to the average registration costs for SMEs, Large Enterprises and over all respondents in Table 4.3.3. As noted in the discussion above,
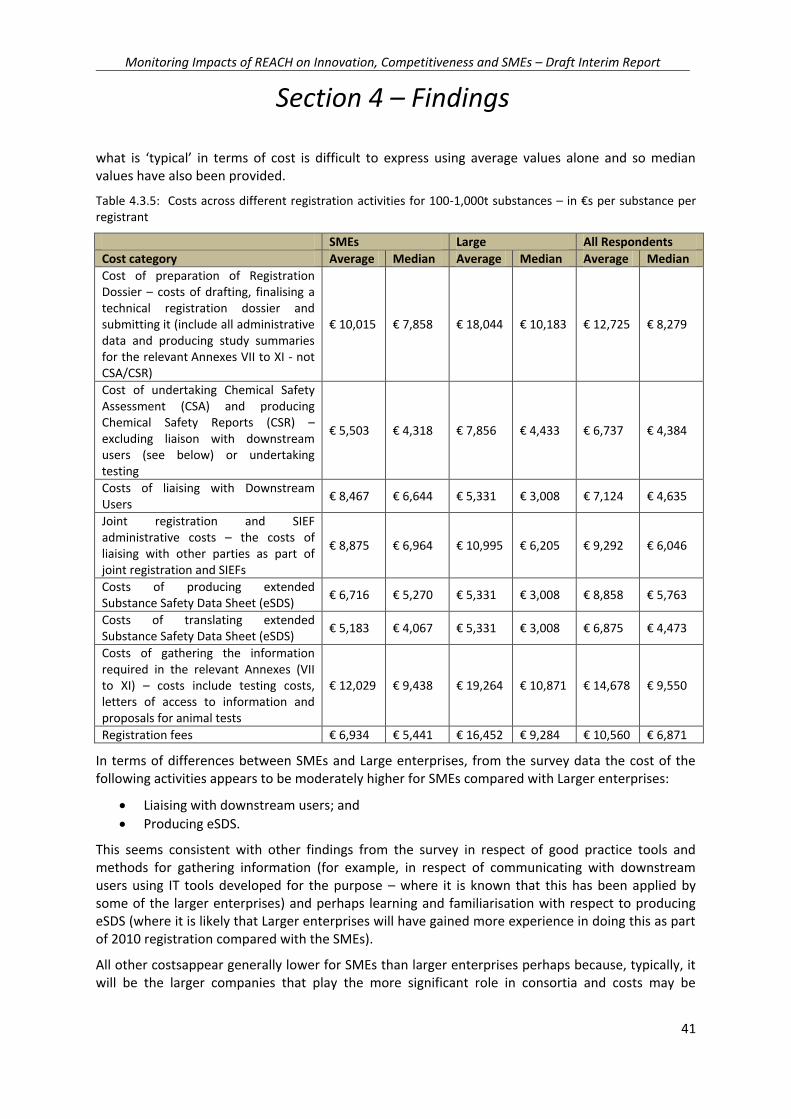
Monitoring Impacts of REACH on Innovation, Competitiveness and SMEs – Draft Interim Report
Section 4 – Findings
41
what is ‘typical’ in terms of cost is difficult to express using average values alone and so median values have also been provided.
Table 4.3.5: Costs across different registration activities for 100-1,000t substances – in €s per substance per registrant
SMEs Large All Respondents
Cost category Average Median Average Median Average Median
Cost of preparation of Registration Dossier – costs of drafting, finalising a technical registration dossier and submitting it (include all administrative data and producing study summaries for the relevant Annexes VII to XI - not CSA/CSR)
€ 10,015 € 7,858 € 18,044 € 10,183 € 12,725 € 8,279
Cost of undertaking Chemical Safety Assessment (CSA) and producing Chemical Safety Reports (CSR) – excluding liaison with downstream users (see below) or undertaking testing
€ 5,503 € 4,318 € 7,856 € 4,433 € 6,737 € 4,384
Costs of liaising with Downstream Users
€ 8,467 € 6,644 € 5,331 € 3,008 € 7,124 € 4,635
Joint registration and SIEF administrative costs – the costs of liaising with other parties as part of joint registration and SIEFs
€ 8,875 € 6,964 € 10,995 € 6,205 € 9,292 € 6,046
Costs of producing extended Substance Safety Data Sheet (eSDS)
€ 6,716 € 5,270 € 5,331 € 3,008 € 8,858 € 5,763
Costs of translating extended Substance Safety Data Sheet (eSDS)
€ 5,183 € 4,067 € 5,331 € 3,008 € 6,875 € 4,473
Costs of gathering the information required in the relevant Annexes (VII to XI) – costs include testing costs, letters of access to information and proposals for animal tests
€ 12,029 € 9,438 € 19,264 € 10,871 € 14,678 € 9,550
Registration fees € 6,934 € 5,441 € 16,452 € 9,284 € 10,560 € 6,871
In terms of differences between SMEs and Large enterprises, from the survey data the cost of the following activities appears to be moderately higher for SMEs compared with Larger enterprises:
Liaising with downstream users; and
Producing eSDS.
This seems consistent with other findings from the survey in respect of good practice tools and methods for gathering information (for example, in respect of communicating with downstream users using IT tools developed for the purpose – where it is known that this has been applied by some of the larger enterprises) and perhaps learning and familiarisation with respect to producing eSDS (where it is likely that Larger enterprises will have gained more experience in doing this as part of 2010 registration compared with the SMEs).
All other costsappear generally lower for SMEs than larger enterprises perhaps because, typically, it will be the larger companies that play the more significant role in consortia and costs may be

Monitoring Impacts of REACH on Innovation, Competitiveness and SMEs – Draft Interim Report
Section 4 – Findings
42
weighted slightly towards these larger companies in spite of any cost sharing arrangements within consortium agreements.
Costs of Registration 2013 from the survey and comparison with ex-ante estimates
The 2003 Extended Impact Assessment (EIA) provided the Commission’s formal assessment of the economic costs of REACH. The assessment was conducted after the 2003 consultation on proposals and made adjustments to the estimates provided to the Commission in the 2003 Business Impact Assessment (BIA) of the Consultation Proposals. The adjustments were to reflect changes made to proposals post consultation. The reasoning behind some of the cost estimates in the Commission’s EIA is not well documented but the predicted total costs for registration, testing and SDSs are provided in Table 4.3.6 below.
It should be noted that subsequent to the 2003 EIA, some further revisions were made to the text of REACH in relation to a number of requirements including the requirement to form Substance Information Exchange Fora (SIEFs) to reduce the potential for duplication of effort and repeat testing in respect of the information requirements in Annexes VII to XI (to reduce testing costs and also to reduce testing on animals). Whilst the impact of revisions post 2003 was estimated for (and by) the Commission work was centred on changes in costs rather than total costs. As such, to our knowledge, no official Commission estimate of the total costs of the provisions set out in the final text of REACH was produced after the Commission’s 2003 EIA.
Table 4.3.6: Net present value costs of REACH (€ millions, 3% discount factor) set out in the 2003 EIA and updated to 2013 prices
1-10t/y 10-100t/y 100-1,000t/y
>1,000t/y Total
Registration costs
€ 116 € 116 € 116 € 233 € 582
Testing costs* € 150 € 349 € 407 € 524 € 1,454
Safety data sheet costs
€ 291
*assuming validation and acceptance of (Q)SARs can be applied within the timeframe envisaged.
Applying the number of substances expected to be registered from the EIA provides the average costs per substance for registration, testing and SDS in Table 4.3.7. As the EIA did not divide SDS costs across the various tonnage bands, in Table 4.3.7 it has been assumed that 10% of the total SDS costs (€29 million) in the EIA would apply to 1-10t substances (as SDSs for these substances would only be required by REACH if there were a change in the classification of the substance). The remaining costs (€262 million) are assumed to be the same across all substances manufactured or imported in quantities of >10t.
Table 4.3.7: Average per substance costs of registration, testing and SDS in the EIA
1-10t/y 10-100t/y 100-1,000t/y >1,000t/y
Registration costs € 6,205 € 19,843 € 38,487 € 53,711
Testing costs € 8,023 € 59,699 € 135,036 € 120,793
Safety data sheet costs € 1,556 € 19,844 € 19,844 € 19,844
The costs in Table 4.3.7 represent the average costs per substance registered from the Commission’s EIA. In all of the BIAs and the EIA estimates made for each tonnage band reflected the total costs of

Monitoring Impacts of REACH on Innovation, Competitiveness and SMEs – Draft Interim Report
Section 4 – Findings
43
registering the substance including registrations submitted for the lower tonnage bands. As such the only cost estimates for the 100-1,000t substances can be used to reflect the EIA costs for the 2013 registration exercise20. In turn, only these can be compared with costs for the same tonnage band generated from the survey.
In terms of the cost estimates from the OBS, the average costs given in Table 4.3.5 for the different elements of registration of 100-1,000t substances provide costs per substance per registrant for each of the combined elements used in the EIA (i.e. registration, testing and SDS). These are provided in Table 4.3.8 and suggest that the total cost of testing, registration and SDS (excluding fees) from the survey was around €66k on average per substance per registrant and the median cost was around €43k per substance per registrant.
In order to compare these with estimates from the EIA one must convert the average cost per substance per registrant to one of average cost per substance by multiplying by the average number of registrants per substance. ECHA statistics on Registration 201321 deadline identify the following:
2,998 substances were newly registered;
83% of submissions were joint registrations comprising one lead registrant and, on average, 2.9 members (i.e. 3.9 registrants in total). As such, 17% of submissions were individual registrations making the weighted average number of registrants per substance equal to 3.41 registrants.
Applying the average of 3.41 registrants per substance to the costs per substance per registrants provides an estimate of the average and median per substance costs of registration in 2013 for comparison with those predicted in the 2003 EIA. These are also provided in Table 4.3.8.
Here it must be noted that the calculations and resulting estimates in Table 4.3.8 are approximations of the rough order of magnitude of average costs of registering individual 100-1,000t substances for comparison only with predicted costs from the EIA. As has been noted previously, it is difficult/ impossible to define what ‘typical’ costs are per substance (or per registrant) and there is wide variability in costs depending on a range of factors. As previous discussion has indicated, average costs do not reflect ‘typical’ costs and are only useful for statistical aggregation.
Table 4.3.8: Estimation of costs per substance from the OBS and comparison with EIA estimates
Registration SDS Testing
Testing, registration & SDS
Average cost per substance per registrant from OBS (Average)
€ 35,878 € 15,732 € 14,678 € 66,288
Actual number of registrants per substance reported by ECHA for 2013
3.41
Projected average cost per substance from OBS
€ 122,236 € 53,600 € 50,008 € 225,844
Cost per substance From EIA € 38,487 € 19,844 € 135,036 € 193,367
20 And equally those for >1,000t reflect 2010 and 1-100t combined those for 2018.
21 See http://echa.europa.eu/documents/10162/13629/reach_2013_result_stats_en.pdf

Monitoring Impacts of REACH on Innovation, Competitiveness and SMEs – Draft Interim Report
Section 4 – Findings
44
Having caveated the data and their use in suitably strong terms, a comparison of the average statistical costs derived from the OBS with those produced in the EIA provides a number of observations:
the average per substance costs of registration, testing and SDS derived from the OBS data are around €226k per substance; higher than the €193k predicted in the 2003 EIA but not significantly higher given the estimation methods used to derive both numbers and the margins for error in both.
Considering the uncertainties and margins of error, it the OBS data does not suggest very significantly higher costs for Registration 2013 than those envisaged in the EIA, indeed the estimates are remarkably close to one another and very much of the same order of magnitude; and
That said, estimates for the constituents of costs differ between the OBS and the EIA. Here the OBS data suggests much higher per substance costs of registration22 compared with the EIA. The average per substance cost of producing and translating eSDSs are also higher in the OBS tha the EIA but the magnitude of difference is not as large as for costs of registration. At the same time, the per substance testing and information costs suggested by the OBS are significantly lower than those that were predicted in the EIA.
On an average per substance basis, then, the total cost of all elements of registration of 100-1000t substances does not appear on first inspection to have been very significantly higher than was predicted in the EIA in 2003. On further inspection, the EIA estimates predicted significantly higher testing costs and significantly lower registration costs than the values suggested by the OBS. SDS costs were also predicted to be lower than the OBS would suggest.
In terms of reasons for these differences, there are several possible explanations and/or effects that may be responsible for the observed differences. When combined these may have acted to increase/deacrease actual from anticipated values:
The EIA did not account for SIEFs and SIEF administration: The 2003 EIA was published before agreements were made (during the UK presidency) on one substance, one registration (OSOR) that subsequently brough about the requirement to form SIEFs. Whilst proposals were costed at the time to determine the likely change in costs, this was never (to our knowledge) aggregated to produce an official revised estimate of the costs of REACH. The effect of the introduction of SIEFs was to reduce/eliminate the repeat testing that was assumed would occur in the EIA, thus reducing the overall costs of testing for a substance compared to the EIA estimates and substituting this for an increase in administrative costs for SIEFs. Thus, some of the testing costs in the EIA would be substituted by an increase in registration costs in the EIA estimates;
Fewer substances have required testing to be undertaken/fewer new tests have been required than was anticipated in the EIA: There was considerable uncertainty about how much data was already available and how much testing on how many substances would be required. The EIA itself used average testing needs produced by JRC (2003). These assumed
22 Comprising preparation of Registration Dossier, CSA/CSR, liaising with Downstream Users, Joint registration and SIEF administration costs.
Monitoring Impacts of REACH on Innovation, Competitiveness and SMEs – Draft Interim Report
Section 4 – Findings
45
that 15,490 tests would be required across the 2,461 substances, i.e. 6.2 tests per substance on average. 3,725 of these tests would be animal tests so 1.5 animal tests per substance were expected to be required. In the event, ECHA statistics for 2013 registration suggests 770 testing proposals in 376 dossiers, 563 of which were proposals to test on animals. When compared with the 2,998 substances newly registered, averaged over all substances actually registered in 2013 this would suggest 0.25 tests per substance and 0.18 animal tests per substance on average. This would tend, then, to suggest that the number of substances requiring new tests was very significantly over estimated in the EIA compared with the actual.
Paying for existing information was not accounted in the EIA but will be present in the estimates from the OBS: the information costs that were quantified in the EIA were associated with the cost of gathering new information and undertaking new tests. SIEFs were not a part of proposals at the time of the EIA and so cost sharing including payment for access to existing information was not a consideration in the EIA estimates. It is worth noting that it was not a consideration in later assessments either because payment for existing information was regarded as a ‘transfer payment’. Here it was broadly assumed that the owner of any information was likely to also be registering substances under REACH (whether the same or different substances). As such, whilst some companies would have to buy information from another registrant, the beneficiary would be another registrant and so the net costs from an economic perspective would be zero. From an economic perspective (which was the focus of the EIA), this remains true. The perspective of respondents to the OBS will be one of financial rather than economic costs and so paying for existing information will form a part of the information/testing costs in the OBS (alomgside the cost of any new information/testing);
Legal costs of establishing SIEFs and Joint Registrations were not accounted for in the EIA: the EIA predated proposals for SIEFs and, as such, the administrative and legal costs, while considered during deliberations over one substance, one registration, were not included in the estimates of registration cost in the EIA. Even when/where they were considered the examples of significant legal costs associated with the requirements were not anticipated (but, to a point, at the time were not considered to be within the scope of what the REACH regulation could or should attempt to control).
Implications for updating of estimates of the 2018 registration costs
Objective 12 of the study (discussed in Section 4.12) seeks to provide an updated assessment of the costs of Registration 2018. Drawing from the above assessment it is clear that the analysis should be based upon estimates that:
better reflect the costs of purchasing data from the owners of information; and
better reflect the administrative and legal costs of consortium/joint registration and SIEF formation.
With regard to testing and information, it seems from the data that far fewer new tests have been required for the 100-1,000t substances than were anticipated. This in spite of the fact that the EIA assumed wide use of QSARs to deliver some of the anticipated missing test information and this has not occurred to the extent that was envisaged at the time of the EIA. With regard to the 1-10t and 10-100t substances to be registered in 2018, however, it does not necessarily follow that just because more information was available on the 100-1,000t substances than was anticipated, the same will be true for the remaining substances. As such, it does not seem reasonable to change
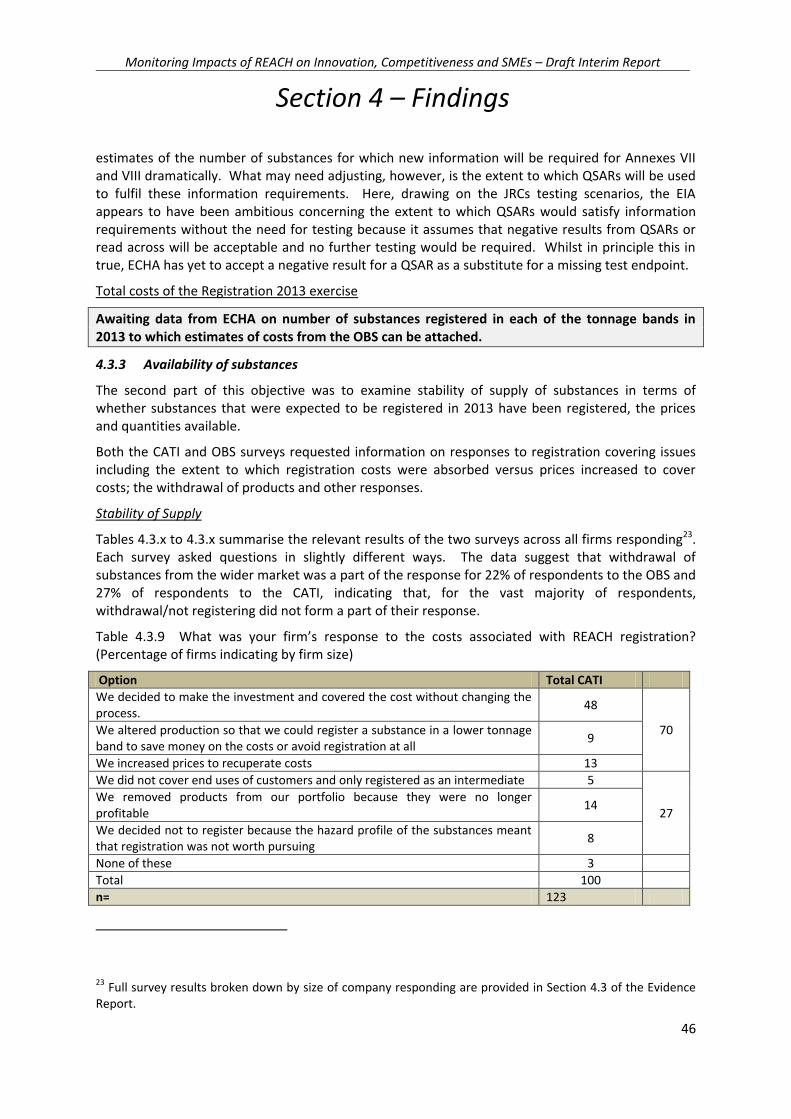
Monitoring Impacts of REACH on Innovation, Competitiveness and SMEs – Draft Interim Report
Section 4 – Findings
46
estimates of the number of substances for which new information will be required for Annexes VII and VIII dramatically. What may need adjusting, however, is the extent to which QSARs will be used to fulfil these information requirements. Here, drawing on the JRCs testing scenarios, the EIA appears to have been ambitious concerning the extent to which QSARs would satisfy information requirements without the need for testing because it assumes that negative results from QSARs or read across will be acceptable and no further testing would be required. Whilst in principle this in true, ECHA has yet to accept a negative result for a QSAR as a substitute for a missing test endpoint.
Total costs of the Registration 2013 exercise
Awaiting data from ECHA on number of substances registered in each of the tonnage bands in 2013 to which estimates of costs from the OBS can be attached.
4.3.3 Availability of substances
The second part of this objective was to examine stability of supply of substances in terms of whether substances that were expected to be registered in 2013 have been registered, the prices and quantities available.
Both the CATI and OBS surveys requested information on responses to registration covering issues including the extent to which registration costs were absorbed versus prices increased to cover costs; the withdrawal of products and other responses.
Stability of Supply
Tables 4.3.x to 4.3.x summarise the relevant results of the two surveys across all firms responding23. Each survey asked questions in slightly different ways. The data suggest that withdrawal of substances from the wider market was a part of the response for 22% of respondents to the OBS and 27% of respondents to the CATI, indicating that, for the vast majority of respondents, withdrawal/not registering did not form a part of their response.
Table 4.3.9 What was your firm’s response to the costs associated with REACH registration? (Percentage of firms indicating by firm size)
Option Total CATI
We decided to make the investment and covered the cost without changing the process.
48
70 We altered production so that we could register a substance in a lower tonnage band to save money on the costs or avoid registration at all
9
We increased prices to recuperate costs 13
We did not cover end uses of customers and only registered as an intermediate 5
27 We removed products from our portfolio because they were no longer profitable
14
We decided not to register because the hazard profile of the substances meant that registration was not worth pursuing
8
None of these 3
Total 100
n= 123
23 Full survey results broken down by size of company responding are provided in Section 4.3 of the Evidence Report.

Monitoring Impacts of REACH on Innovation, Competitiveness and SMEs – Draft Interim Report
Section 4 – Findings
47
Source: CATI Survey
Table 4.3.10 How has your firm responded – if at all - to the costs associated with the implementation of the REACH regulation? Please indicate all those that best reflect your response? (Percent indicating the specific response by firm size)
Options All firms
We decided to absorb the REACH related costs reducing our profit margins
51 65
We raised prices to cover REACH costs and maintain or increase profit margins
14
We decided to withdraw specific products from the market
15 22
We decided to withdraw from specific markets 7
Other 12 12
Total 100 100
n= 294 294
Source: Online Business Survey
Table 4.3.11 Have any of the substances that you used or placed in the market in the past been withdrawn as a result of the 2013 registration requirements? (Percentage of firms indicating by firm size)
Options All firms
Yes 31
No 61
Don't know 9
Total 100
n= 281
Source: Online Business Survey
In terms of security of supply, the data from the surveys do not provide an indication of how many substances were withdrawn nor do they provide an indication of what other manufacturers/importers responses were for the same substances or whether substances may be registered by other manufacturers/importers in 20189. As such, one cannot draw conclusions on the extent to which REACH has affected (or will affect)stability of supply more genrally. Inevitably, however, some uses and some substances may not have been registered, either because they were no longer profitable for sale on the open market, the hazard profile was not consistent with uses or other reasons. As substances may still be registered in the lower tonnage bands in 2018 it is not until then that a clear picture of the impact of REACH on security of supply can be more firmly established.
To be completed once information received from ECHA.
Prices
In terms of prices for substances registered, Table 4.3.12 provides responses from both surveys. The results of both surveys indicate that by far the dominant response to registration costs was one of absorbing costs rather than increasing them to cover costs. Altering production (it is assumed by lowering volumes rather than separating in smaller business entities) appears also to be a minority
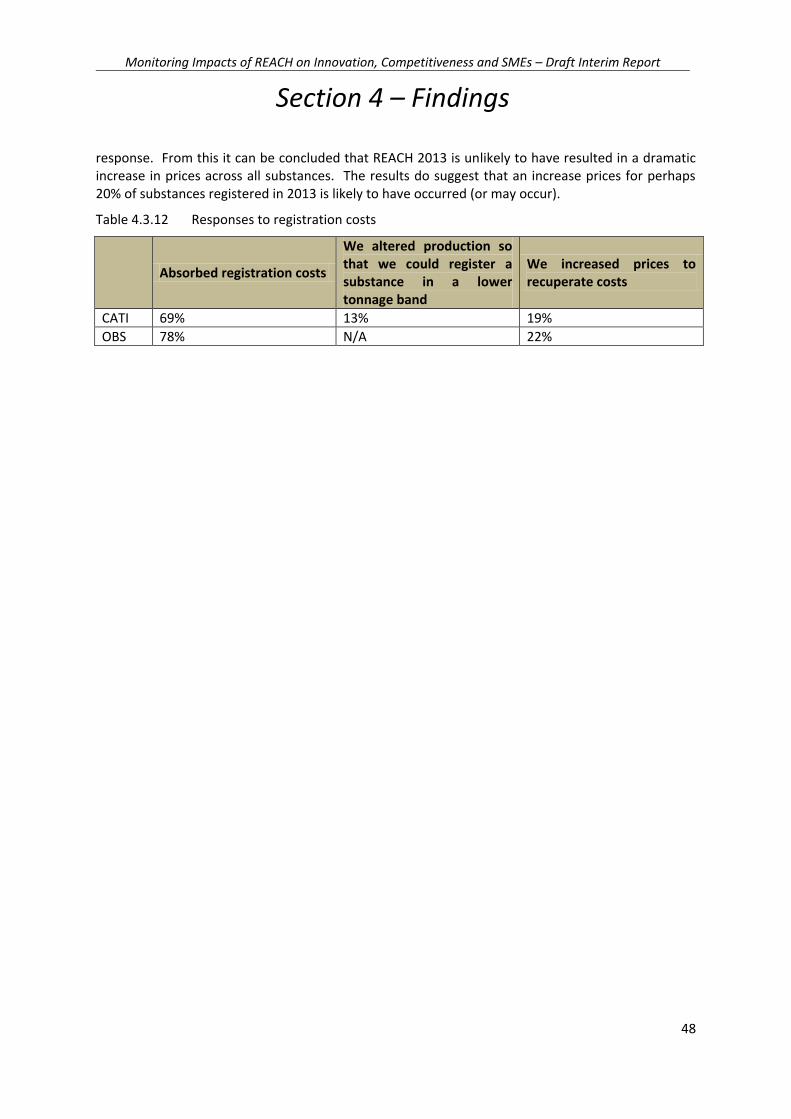
Monitoring Impacts of REACH on Innovation, Competitiveness and SMEs – Draft Interim Report
Section 4 – Findings
48
response. From this it can be concluded that REACH 2013 is unlikely to have resulted in a dramatic increase in prices across all substances. The results do suggest that an increase prices for perhaps 20% of substances registered in 2013 is likely to have occurred (or may occur).
Table 4.3.12 Responses to registration costs
Absorbed registration costs
We altered production so that we could register a substance in a lower tonnage band
We increased prices to recuperate costs
CATI 69% 13% 19%
OBS 78% N/A 22%
Monitoring Impacts of REACH on Innovation, Competitiveness and SMEs – Draft Interim Report
Section 4 – Findings
49
4.4 Objective 4 - Business opportunities
4.4.1 Introduction
The key study aims in respect of the Business Opportunities objective are to describe and analyse examples that fostered better practices within companies (in particular SMEs); describe and evaluate the added value for companies acting in different roles within the supply chain brought in by REACH in terms of better knowledge of hazards and risks of substances as well as their uses (e.g. RMM); and, to search for examples of best practices and describe conditions in which these business opportunities are most likely to occur, with a view to facilitate design of appropriate policy measures.
The aim was to assess whether the REACH Regulation led to the opening of business opportunities for European companies within and outside the European market. In addition, examples of best practices should be described as well as the conditions in which the opportunities are more likely to arise. Objective 4 has some overlaps with several other objectives and in particular with Objective 1 “Single Market and Harmonisation” and Objective 2 “External competitiveness” as well as with Objective 6 “SMEs”, Objective 7 “Downstream users”, Objective 8 “Innovation”, Objective 9 “Human resources and consultants" and Objective 10 “SVHCs and authorisations”. Some of the information necessary for the assessment has been therefore drawn from the respective sections of the different research tools (CATI survey, online business survey, interviews with firms, industry associations and Member States).
4.4.2 Examples of business opportunities
A business opportunity is the identification of a need and the development of the means to fulfil that need (that could be a new product or service) that leads to begin a business.
Considering the different mechanisms of the Regulation, REACH has created the need for:
Improved information management and information communication systems; Testing and analysis of substances; Better risk management processes; Development of safer alternatives to substances of very high concern.
With regard to the first two aspects, a good part of the workload created by the Regulation has been covered by companies offering specialised consultancy services and technical testing and analysis services. Indeed, all the stakeholders surveyed agree that, since REACH is a very complex piece of legislation with several requirements at multiple levels, companies that have benefit the most are the ones offering consultancy services linked to the Regulation, such as regulatory compliance, lobbying, administration of consortia or chemical risk management. While benefitting individual, or groups, of companies, this does constitute an additional cost that has to be absorbed by the industry as a whole.
Another sector that has benefited from REACH is the technical testing and analysis sector. Eurostat data on NACE code M71.2 “Technical testing and analysis” shows that the sector has kept growing at European level even in the aftermath of the economic crisis. Although the NACE code does not

Monitoring Impacts of REACH on Innovation, Competitiveness and SMEs – Draft Interim Report
Section 4 – Findings
50
capture chemical testing and analysis only24, it can be speculated that REACH had a positive impacts on these economic activities.
As in the case of the testing and analysis sector, in the chemical sector (manufacturing of chemicals and downstream sectors) it is also very difficult to use macroeconomic data to draw conclusions on the economic effects of REACH, whether these are positive or negative, especially in times of economic turbulence as the years of the entering into force of the Regulation. Also at a microeconomic level, it is very difficult for companies to judge the impacts of a single regulation. Indeed, when surveyed on the impacts of REACH on different aspects, most of the stakeholders did not blame negative effects or attribute positive effects to the sole action of the Regulation25, but have pointed it out as a contributing factor.
As presented in the Evidence report (Section 4.1), the great majority of the CATI respondents (around 85%) did not identify any change in their trade level that could be linked to the introduction of REACH. Around the same percentages of firms (from 0% to 6%) ascribed to REACH an increase or a decrease in exports to other EEA countries, with the notable exception of those companies indicating as a primary role to be manufacturers of chemicals, where 12% indicated a decrease attributable to REACH against 4% that indicated an increase26, probably pointing to the higher costs and lower margins due to the Regulation.
Also in the business online survey, companies were asked what the effects of the REACH implementation have been on their businesses in terms of trade inside the EU. Six possible options were given plus the possibility to provide an explanation or additional comments. The results are presented in the table below.
Table 4.4.1 What (if any) have been the effects of the implementation of REACH on your business in terms of trade inside the EU? Option No. of companies Percentage*
We have increased our exports to other EU countries as this has become easier following the introduction of REACH
7 2%
We have decreased our exports to other EU countries because the price of our products has increased due to REACH
55 12%
We have increased our imports from other EU countries because we know that the products are REACH-compliant
18 4%
We have decreased our imports from other EU countries because the 48 11%
24 This class includes the performance of physical, chemical and other analytical testing of all types of materials and products, such as: acoustics and vibration testing; testing of composition and purity of minerals etc.; testing activities in the field of food hygiene, including veterinary testing and control in relation to food production; testing of physical characteristics and performance of materials, such as strength, thickness, durability, radioactivity, etc.; qualification and reliability testing; performance testing of complete machinery: motors, automobiles, electronic equipment etc.; radiographic testing of welds and joints; failure analysis; testing and measuring of environmental indicators: air and water pollution etc.; certification of products, including consumer goods, motor vehicles, aircraft, pressurised containers, nuclear plants etc.; periodic road-safety testing of motor vehicles; testing with use of models or mock-ups (e.g. of aircraft, ships, dams etc.); operation of police laboratories. 25 Some stakeholders have attributed specific effects to the Authorisation and Restriction process; these are discussed in the Section “Objective 10 - SVHCs and authorisations”. 26 Table 4.1.1 of the Evidence report.

Monitoring Impacts of REACH on Innovation, Competitiveness and SMEs – Draft Interim Report
Section 4 – Findings
51
price of the products has increased due to REACH
No change 255 58%
No available information 59 13%
Total 566 (442 respondents) -
Skipped the question 124 -
Notes:* Percentage on the total of respondents
Source: Business online survey
The majority (around 60%) of the firms replying to the question did not identify any change in their trade level attributable to REACH. Around 11-12% of the respondents indicated a decrease in imports and a same percentage a decrease in exports attributing the cause to an increase in the prices of the products due to REACH.
Interestingly, when following up with the interviews, two of the companies that indicated to have increased their exports to other EU countries thanks to REACH (both located in East Europe) noted that the Regulation made it easier for them to access other national markets within Europe, due to the standardisation of the information to be provided introduced by the Regulation.
When surveyed about the opening of new markets or the REACH effects on their market share, the large majority (between 60 to 70%) observed no impact. It is important to note that a larger share of SMEs has reported negative effects in comparison with large companies, confirming the SMEs’ view of REACH has a very burdensome legislation.
Table 4.4.2 What have been the impacts, if any, of the implementation of the REACH Regulation in relation to the following aspects? (Percentage of respondents by company size (all firms)
Response Very
positive impact
Positive impact
No impact
Negative
impact
Very negativ
e impact
Not relevant
Do not know
n=
Opening of new markets for your products within the EU
1 0 59 18 12 0 10 218
Opening of new markets for your products outside the EU
0 0 68 14 9 0 9 210
The size of your market share within the EU
0 0 70 12 7 0 11 223
The size of your market share outside the EU
0 0 69 11 6 0 14 217
Source: Business Survey
Table 4.4.3 What have been the impacts, if any, of the implementation of the REACH Regulation in relation to the following aspects? (Percentage of respondents by company size (SMEs)
Response Very
positive impact
Positive impact
No impact
Negative
impact
Very negativ
e impact
Not relevant
Do not know
n=
Opening of new markets for your products within the EU
1 0 49 22 18 0 11 120
Opening of new markets for your products outside the EU
1 0 55 21 12 0 12 110
The size of your market share within the EU
0 0 59 18 11 0 13 114
The size of your market share outside the EU
1 0 58 16 10 0 16 109
Source: Business Survey

Monitoring Impacts of REACH on Innovation, Competitiveness and SMEs – Draft Interim Report
Section 4 – Findings
52
Table 4.4.4 What have been the impacts, if any, of the implementation of the REACH Regulation in relation to the following aspects? (Percentage of respondents by company size (large enterprises)
Response Very
positive impact
Positive impact
No impact
Negative
impact
Very negativ
e impact
Not relevant
Do not know
n=
Opening of new markets for your products within the EU
1 0 72 14 3 0 10 93
Opening of new markets for your products outside the EU
0 0 84 8 3 0 5 93
The size of your market share within the EU
1 0 82 7 2 0 8 101
The size of your market share outside the EU
0 0 82 6 0 0 12 99
Source: Business Survey
Between 23% and 40% of the companies indicated that REACH has a negative or very negative impact on the price of their products when compared to the European and extra-EU competitors’ product prices.
Notably, between 21% and 27% of the respondents think that REACH has a positive or very positive impact on the confidence of consumers in product safety and in creating demand for safer products. This is important, as the demand for safer products can lead to the opening of business opportunities.
Table 4.4.5 What have been the impacts, if any, of the implementation of the REACH Regulation in relation to the following aspects? Number and (Percentage) of respondents
Response Very
positive impact
Positive impact
No impact
Negative impact
Very negative impact
Not relevant
Do not know
n=
The price of your products in comparison to competitors from inside the EU
0 (0%) 5 (2%) 136
(43%) 55 (17%) 18 (6%) 65 (20%) 41 (13%) 320
The price of your products in comparison to competitors from outside the EU
0 (0%) 1 (0%) 92 (29%) 81 (25%) 49 (15%) 54 (17%) 45 (14%) 322
Creating demand for safer products 6 (2%) 83 (25%) 123
(38%) 12 (4%) 9 (3%) 72 (22%) 22 (7%) 327
Confidence of consumers in product safety
7 (2%) 62 (19%) 124
(38%) 11 (3%) 8 (2%) 76 (23%) 39 (12%) 327
Source: Business Survey
In spite of the fact that in the opinion of the majority, REACH did not have an observable impact on the trade level or the market size and did not led to the opening of new opportunities (Table 4.1.4 of the Evidence report), between 15-25% of the companies surveyed27 agreed that the increased harmonisation of the EU chemicals legislation brought by REACH created new opportunities for their businesses in the EU. The creation of business opportunities by the REACH Regulation is further investigated in the case study provided.
27 Depending on the research tool: 15% in the online business survey; 25% in the CATI survey.
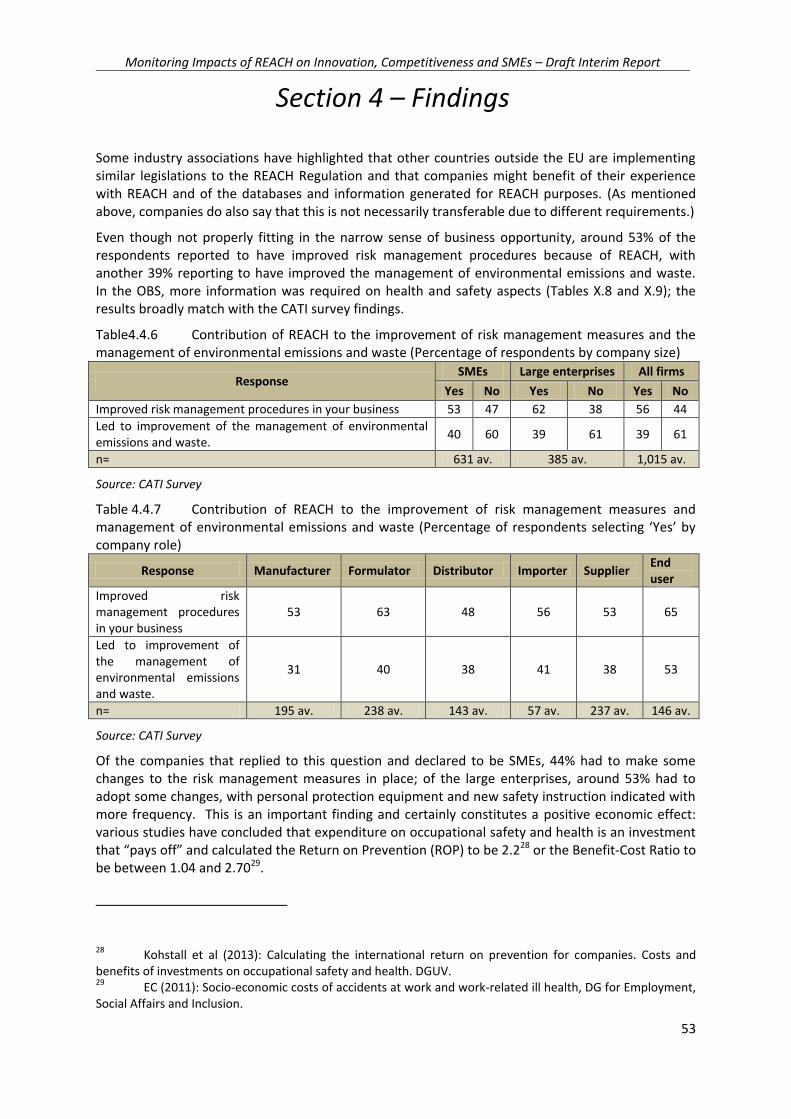
Monitoring Impacts of REACH on Innovation, Competitiveness and SMEs – Draft Interim Report
Section 4 – Findings
53
Some industry associations have highlighted that other countries outside the EU are implementing similar legislations to the REACH Regulation and that companies might benefit of their experience with REACH and of the databases and information generated for REACH purposes. (As mentioned above, companies do also say that this is not necessarily transferable due to different requirements.)
Even though not properly fitting in the narrow sense of business opportunity, around 53% of the respondents reported to have improved risk management procedures because of REACH, with another 39% reporting to have improved the management of environmental emissions and waste. In the OBS, more information was required on health and safety aspects (Tables X.8 and X.9); the results broadly match with the CATI survey findings.
Table4.4.6 Contribution of REACH to the improvement of risk management measures and the management of environmental emissions and waste (Percentage of respondents by company size)
Response SMEs Large enterprises All firms
Yes No Yes No Yes No
Improved risk management procedures in your business 53 47 62 38 56 44
Led to improvement of the management of environmental emissions and waste.
40 60 39 61 39 61
n= 631 av. 385 av. 1,015 av.
Source: CATI Survey
Table 4.4.7 Contribution of REACH to the improvement of risk management measures and management of environmental emissions and waste (Percentage of respondents selecting ‘Yes’ by company role)
Response Manufacturer Formulator Distributor Importer Supplier End user
Improved risk management procedures in your business
53 63 48 56 53 65
Led to improvement of the management of environmental emissions and waste.
31 40 38 41 38 53
n= 195 av. 238 av. 143 av. 57 av. 237 av. 146 av.
Source: CATI Survey
Of the companies that replied to this question and declared to be SMEs, 44% had to make some changes to the risk management measures in place; of the large enterprises, around 53% had to adopt some changes, with personal protection equipment and new safety instruction indicated with more frequency. This is an important finding and certainly constitutes a positive economic effect: various studies have concluded that expenditure on occupational safety and health is an investment that “pays off” and calculated the Return on Prevention (ROP) to be 2.228 or the Benefit-Cost Ratio to be between 1.04 and 2.7029.
28 Kohstall et al (2013): Calculating the international return on prevention for companies. Costs and benefits of investments on occupational safety and health. DGUV. 29 EC (2011): Socio-economic costs of accidents at work and work-related ill health, DG for Employment, Social Affairs and Inclusion.
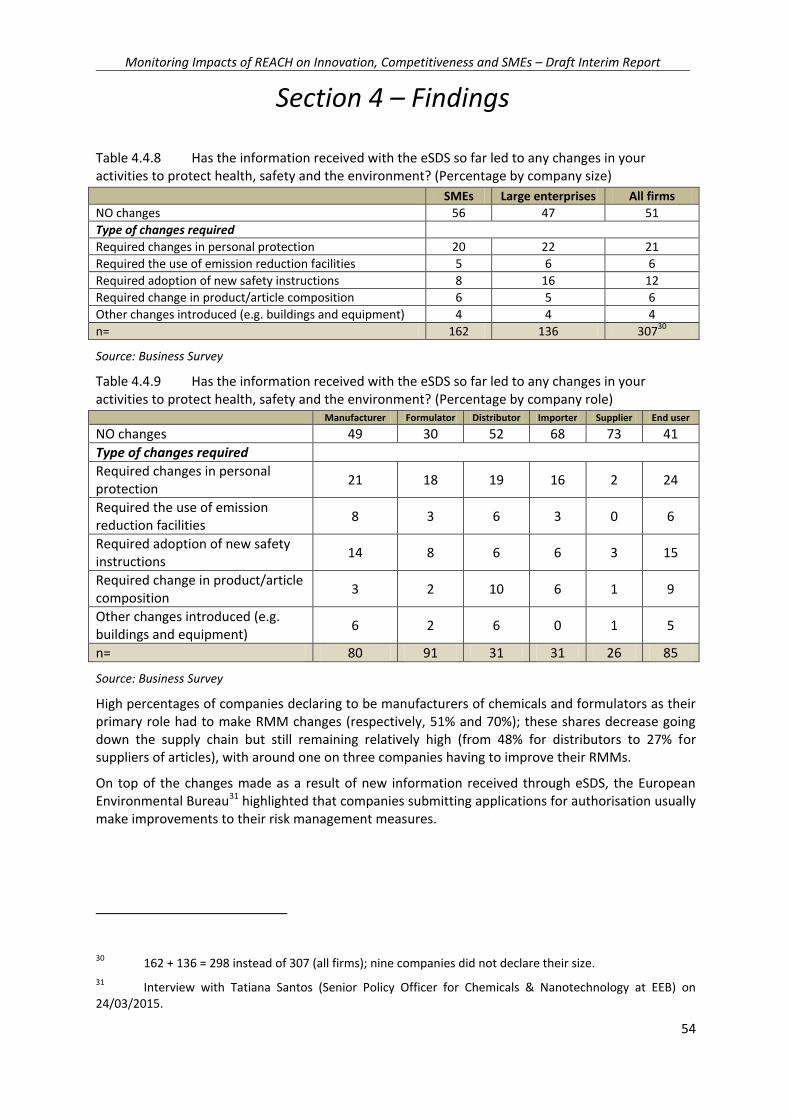
Monitoring Impacts of REACH on Innovation, Competitiveness and SMEs – Draft Interim Report
Section 4 – Findings
54
Table 4.4.8 Has the information received with the eSDS so far led to any changes in your activities to protect health, safety and the environment? (Percentage by company size)
SMEs Large enterprises All firms
NO changes 56 47 51
Type of changes required
Required changes in personal protection 20 22 21
Required the use of emission reduction facilities 5 6 6
Required adoption of new safety instructions 8 16 12
Required change in product/article composition 6 5 6
Other changes introduced (e.g. buildings and equipment) 4 4 4
n= 162 136 30730
Source: Business Survey
Table 4.4.9 Has the information received with the eSDS so far led to any changes in your activities to protect health, safety and the environment? (Percentage by company role)
Manufacturer Formulator Distributor Importer Supplier End user
NO changes 49 30 52 68 73 41
Type of changes required
Required changes in personal protection
21 18 19 16 2 24
Required the use of emission reduction facilities
8 3 6 3 0 6
Required adoption of new safety instructions
14 8 6 6 3 15
Required change in product/article composition
3 2 10 6 1 9
Other changes introduced (e.g. buildings and equipment)
6 2 6 0 1 5
n= 80 91 31 31 26 85
Source: Business Survey
High percentages of companies declaring to be manufacturers of chemicals and formulators as their primary role had to make RMM changes (respectively, 51% and 70%); these shares decrease going down the supply chain but still remaining relatively high (from 48% for distributors to 27% for suppliers of articles), with around one on three companies having to improve their RMMs.
On top of the changes made as a result of new information received through eSDS, the European Environmental Bureau31 highlighted that companies submitting applications for authorisation usually make improvements to their risk management measures.
30 162 + 136 = 298 instead of 307 (all firms); nine companies did not declare their size.
31 Interview with Tatiana Santos (Senior Policy Officer for Chemicals & Nanotechnology at EEB) on 24/03/2015.

Monitoring Impacts of REACH on Innovation, Competitiveness and SMEs – Draft Interim Report
Section 4 – Findings
55
Table 4.4.10 How has the introduction of REACH Regulation affected the following aspects of your firm's operation? (Percentage of respondents by company size (all firms))
Response Very
positive impact
Positive impact
No impact
Negative impact
Very negative impact
Not relevant
Do not know
n=
Worker health and safety within your facilities
3 31 53 1 0 10 1 323
Management of environmental emissions and wastes
1 22 59 3 0 12 3 321
Source: Business Survey
Although overall one on two companies declared to have had to make some improvement to RMMs, a smaller share of companies (34%) (Table X.10) reported a positive or very positive effect of the REACH Regulation over workers’ health and safety: this might depend on the fact that, although companies had to improve their risk management measures to ensure compliance with the Regulation, they do not necessarily consider that these improvements had any impact on the health and safety of workers. Indeed, during the in-depth interviews, some companies, especially in heavily regulated sectors such as oil and refinery, reported that the risk management measures in place are the ones required by the occupational health and safety legislation and that REACH did not bring any added value. Other companies argued that they had to change some risk management measures but only because required by worst case scenarios in the eSDS, questioning whether this results in actual exposure changes.
4.4.3 Case Study – Business opportunities through improved supply chain communication
This case study investigates whether the increase of communication within the supply chain required by the REACH Regulation has strengthened the relationships between actors of the same supply chains and stimulated the creation of business opportunities.
In the surveys, companies were asked whether and how REACH contributed to innovation and to the creation of business opportunities. In order to establish whether such opportunities have occurred or are likely to occur to a greater extent for large companies or SMEs or in particular roles in the chemicals’ supply chain, the results are presented by company size and role (Tables below).
Table 4.4.11: Contribution of REACH to innovation and creation of new business opportunities for your firm (Percentage of respondents by company size)
Response SMEs Large enterprises All firms
Yes No Yes No Yes No
Led to Increased Research and Development activity 25 75 32 68 28 72
Through increased levels of knowledge in relation to the properties and/or the possible uses of chemical substances
51 49 48 52 50 50
Through increased awareness of the needs of your suppliers 44 56 46 54 45 55
Through collaboration with downstream members of the supply chain (customers and clients)
43 57 47 53 45 55
We have launched and are commercialising products/ services as result of experience/ knowledge gained through compliance
23 77 25 75 23 77
n= 631 av. 385 av. 1,015 av.
Source: CATI Survey

Monitoring Impacts of REACH on Innovation, Competitiveness and SMEs – Draft Interim Report
Section 4 – Findings
56
Table 4.4.12: Contribution of REACH to innovation and creation of new business opportunities for your firm (Percentage of respondents selecting ‘Yes’ by company role)
Response Manufacturer Formulator Distributor Importer Supplier End user
Led to Increased Research and Development activity
31 46 12 17 24 17
Through increased levels of knowledge in relation to the properties and/or the possible uses of chemical substances
49 56 54 52 46 41
Through increased awareness of the needs of your suppliers
47 49 45 40 46 35
Through collaboration with downstream members of the supply chain (customers and clients)
49 49 46 45 46 30
We have launched and are commercialising products/ services as result of experience/ knowledge gained through compliance
17 34 26 23 20 18
n= 195 av. 238 av. 143 av. 57 av. 237 av. 146 av.
Around 30% of all firms replied that the Regulation led to an increased activity in Research and Development, with a slightly higher share of large companies (32%) in comparison to SMEs (25%). Almost half of all companies (46%) declaring as their primary role to be formulators and almost one in three (31%) manufacturers of chemicals, reported that REACH led to increased R&D. Indeed, formulators and manufacturers are the categories on which most of the regulatory pressure (especially by the authorisation and restriction mechanisms) is posed. Twenty-four percent of suppliers of articles reported increased R&D as a consequence of REACH: consumers (as opposed to professional end users) are often the larger share of the customers of the suppliers of articles; therefore these have all the incentives to find suitable alternatives to hazardous chemicals in their applications that might be targeted by regulatory initiatives or public awareness campaigns.
BEUC (the European umbrella group of national consumer organisations) highlighted that thanks to Article 33, the Regulation has provided a very important new instrument to consumers which has an important effect on the supply chain. Retailers are becoming increasingly aware that consumers can ask information on the content of SVHCs in products and these requests have positive impacts not only in terms of the right to know but also on incentives to substitute SVHCs in consumer products.32
In spite of the fact that one on three companies reported increased R&D as a consequence of REACH, only 8% of the companies surveyed through the OBS declared that the Regulation had a positive or very positive impact on R&D (Table 4.4.13). Indeed, in the view of some of the companies and industry associations interviewed, this increment in R&D is not necessarily positive: the search for alternatives to substances under regulatory scrutiny is seen as very time and resource intensive and as diverting resources from R&D on “real” innovations. Some stakeholders consider that the hazardousness of some of the substances in their products does not necessarily mean that
32 Interview with Sylvia Maurer (Head of Sustainability and Safety at BEUC) on 25/03/2015.

Monitoring Impacts of REACH on Innovation, Competitiveness and SMEs – Draft Interim Report
Section 4 – Findings
57
there is a risk and that the starting of the regulatory scrutiny on the mere consideration of the hazardousness creates regulatory uncertainty and divert precious resources.
Of the opposite view are the EEB and the International Chemical Secretariat (chemsec), arguing that SVHCs-free products are safer and that hazardous chemicals should be replaced with safer alternatives. Chemsec is also of the opinion that REACH has improved the communication within the supply chain, making easier for companies to identify new markets and opportunities. From one side, manufacturers of chemicals can get to know better the needs of downstream users industries; from the other side, DUs can work together with manufacturers for more customised products33.
Chemsec34 maintains the Substitution Support Portal (SUBSPORT), a project realized in the framework of the European Union’s Life programme. The portal aims to provide guidelines to compare and assess alternatives and to present successful examples of substitution. A list of examples referring to SMEs developing safer alternatives has been kindly provided by ChemSec:
Nordic Paper has developed a technology to mechanically refining the cellulose fibres of paper used for packaging of foodstuff, enhancing its grease resistance without the use of perfluorinated compounds;
Sustainable Cards Europe launched wood cards to substitute PVC cards used as key cards in hotel rooms;
OrganoClick developed the Organotex® technology, a water repellent surface treatment which does not contain fluorocarbons and isocyanates, to be used on textiles and other materials;
Sterisol focused on “active packaging” to eliminate the need for preservatives in their skin care products;
Tärnsjö garveri is a tanning and leather goods manufacturer that refused to adopt the more time and cost-efficient chrome excel method and kept applying the traditional vegetable tanning technique of leather;
GreenPan™ is a cookware brand that developed PTFE and PFOA-free non-stick cookware; Soyprint substituted petroleum-based printing toners with toner powder derived from
soybeans; NPT developed a glue alternative to the adhesive used for wood-flooring installation
containing VOCs, isocyanates or tin.
When searching for the common conditions on which these experiences of small-medium companies flourished, the most important factor is probably that these enterprises share the same business culture, with innovation at the core of the business and strategy. While regulatory pressure might be the initial driver for the research, most of the times companies recognises the importance to gain competitive advantages by producing safer products, saving on chemical management costs and benefiting from a green and innovative image. The exploration of the market to identify the need for greener products and services is also very important and this is probably the aspect where public authorities offer most of the support and funds. Across Europe, there are indeed several initiatives focusing on providing assistance to companies (and especially SMEs) in exploring the possibility of substituting hazardous chemicals in products, for example:
33 Interview with Frida Hök (Chemicals and policy at chemsec) on 17/02/2015. 34 In partnership with Kooperationsstelle Hamburg IFE GmbH, The Instituto Sindical de Trabajo Ambiente y Salud (ISTAS) and Grontmij A/S.
Monitoring Impacts of REACH on Innovation, Competitiveness and SMEs – Draft Interim Report
Section 4 – Findings
58
The Eco-innovation observatory funded by the European Commission35; Norden – Nordic Innovation funded by the Nordic Council of Ministers36; Substitution-cmr by Anses, the French Agency for Environmental and Occupational Health
Safety37.
Another crucial factor is the availability of private funding: in the absence of supportive private investors, innovation, and therefore substitution of hazardous chemicals with safer alternatives, is not possible. An important role for public authorities would be to bridge the gap between SMEs and private investors: regulatory pressure without adequate financial incentives and subsidies is often negatively perceived by companies and does not trigger virtuous behaviour. It should be noted that private investors have shown their interest in investing in companies researching in greener alternatives to hazardous chemicals.38
Beyond the authorisation and restriction mechanisms and the pressure on substituting hazardous chemicals, the Regulation has enhanced the knowledge of the companies on the properties of the chemicals used: 68% reported that the Regulation had a positive or very positive impact on the knowledge in relation to the content of chemical substances, their properties and their possible uses (Table 4.4.13). Moreover, around 23% of the respondents (of which around 34% were formulators)39 indicated to have launched and commercialised products/services as result of experience and knowledge gained through compliance with the Regulation.
35 http://www.eco-innovation.eu/ 36 http://www.nordicinnovation.org/no/ 37 www.substitution-cmr.fr 38 http://newsletter.echa.europa.eu/home/-/newsletter/entry/3_15_investor-perspective-why-reach-matters-for-your-bottom-line 39 Tables4.4.11 and 4.4.12.

Monitoring Impacts of REACH on Innovation, Competitiveness and SMEs – Draft Interim Report
Section 4 – Findings
59
Table 4.4.13: How has the introduction of REACH Regulation affected the following aspects of your firm's operation? (Percentage of respondents by company size (all firms))
Response Very
positive impact
Positive impact
No impact
Negative impact
Very negative impact
Not relevant
Do not know
n=
Research and development budget
1 7 35 18 12 23 5 310
Awareness of the needs of our supply chain
3 47 29 7 1 10 3 319
Collaboration with suppliers 2 43 34 12 3 6 1 322
Collaboration with downstream supply chains
1 32 42 12 1 9 3 319
Development of new products and services
1 16 42 15 12 11 3 322
Levels of knowledge in relation to the content of chemical substances, their properties and/or their possible uses
7 61 21 2 0 7 1 324
Source: Business Survey
Between 45 and 50% of the companies surveyed indicated that the increased knowledge over the properties and uses of the chemical substances and the increased communication and collaboration within the supply chain brought to the opening of new business opportunities.
Some companies have developed sophisticated information management systems (e.g. GEMS40) to better handle the information flows throughout the supply chain and to collect, manage and report the presence of hazardous substances in their products. This type of systems allows to systematically collect information from the suppliers and to provide information to professional users and customers or other stakeholders, in compliance with Article 33 of the REACH Regulation. Moreover, large companies include information disclosure requirements on the content of hazardous substances in the products supplied in their purchasing agreements and contracts. This certainly constitutes an incentive to the other actors in the supply chain to be REACH compliant and provide an effective co-operation. During the interviews, a similar incentive has been reported by some suppliers of articles, referring that in some Nordic countries in order to participate and gain points for public procurement bids, the authorities require “REACH compliance” certificates from the participants.
Although agreeing that the increased communication and collaboration within the supply chain has been greatly beneficial, BEUC highlighted that among retailers the management and communication of information is still very poor and the results disappointing. In a study conducted in partnership with their members, BEUC tested the “right to know” mechanism and surveyed the awareness on these obligations of different retailers41. The results highlighted that, at the time, retailers were still
40 GEMS (Global Environmental Management System) by Abbott. Information available at: http://prod2.dam.abbott.com/en-us/documents/pdfs/partners/Restricted_Substances_Training.pdf
41 More information at: http://www.chemsec.org/what-we-do/sin-list/latest-on-sin/829-consumers-qright-to-knowq-tested-companies-asked-if-they-use-any-sin-list-chemicals

Monitoring Impacts of REACH on Innovation, Competitiveness and SMEs – Draft Interim Report
Section 4 – Findings
60
unaware of their REACH obligations and, if aware, were still confused in terms of types of information that should be provided to consumers.
When enquired about what sources of information acted as a stimulus to new product conception, development and/or commercialisation (Table X.14), although between 80 to 95% of the companies did not consider that any of the listed sources triggered business opportunities, some companies reported that the candidate list for Authorisation (20%), the development of Safety Data Sheets (19%) and the exchange of information within the supply chain (17%) were useful sources of information for product conception.
Table 4.4.14: Has the development of, or access to, any of the following sources of information generated by REACH acted as a stimulus to new product conception, development and/or commercialisation in your business? (Percentage of respondents by company size)
Response SMEs Large enterprises All firms
Yes No Yes No Yes No
Development of the Registration dossier with Technical dossier and Chemical Safety Report
3 97 8 92 5 95
Development of the Safety Data Sheets (SDS)/(eSDS) 22 78 23 77 19 81
Substance Information Exchange Forum (SIEFs)/ Consortia 3 97 9 91 5 95
The ECHA dissemination portal 14 86 19 81 13 87
Exchange of information in the supply chain 18 82 24 76 17 83
Registry of Restriction Intentions or Restrictions already agreed or in discussion
7 93 19 81 10 90
Candidate list of substances for Authorisation 16 84 33 67 20 80
Notifications of use to ECHA by users of Candidate list substances
4 96 10 90 5 95
n= 246 206 566
Source: Business Survey

Monitoring Impacts of REACH on Innovation, Competitiveness and SMEs – Draft Interim Report
Section 4 – Findings
61
4.5 Objective 5 - SIEFs & Registration Consortia
4.5.1 Introduction
The aims of the study as regards SIEFs and consortia are to: describe the pricing policies of SIEF; establish their affordability with regard to various types, sizes, sub-sectors, business models and geographic location of registrants; support the assessment of affordability through an analysis of the structure of SIEFs’ costs and of any additional costs incurred by lead registrant and member registrants; focus on the transparency and communication practices within the SIEFs; and analyse the added value of consortia, as well as the reasons for which opt-outs or 'double' registrations have been pursued by registrants. Best practices with regard to SIEF pricing policies, consortia agreements and communication should be catalogued.
4.5.2 Registration, SIEF and Consortia
The core process of REACH is the registration that has to be done by each manufacturer and importer who places a substance on the market in amounts exceeding one ton per year. Information requirements, submission formats and general rules for the registration process are laid down in the regulation itself.
One of the core requirements is the so called OSOR42 principle that generally commits all potential registrants of the same substance to aim at a common registration dossier. This implies that all registrants share the available substance data and/or to generate new, commonly owned data. To support this data sharing, the so called substance information exchange fora (SIEFs) are introduced by REACH.
As a result of the SIEF work one dossier with all hazard data on the substance shall be submitted to
ECHA and all registrants can refer to this dossier and only submit an individual part of information,
mainly related to the company itself and potentially the use and exposure information, if relevant.
The central dossier is the so called lead dossier, the individual dossiers are called member dossiers
(or joint dossiers). REACH also foresees an adequate sharing of costs between the members of the
SIEF / registration arising from the use of existing, the generation of new data and the related
administrative work. How this process of data sharing and cost compensation is organised is not
regulated under REACH. The approach taken must not be unfair or discriminatory for other market
actors and the cost sharing shall be performed in a transparent way (Article 30(1) of the REACH text).
Basically two models have been established to organise cost and data sharing:
SIEF members directly collaborate to register a substance – This approach is frequently
taken in practice if only few market actors are involved and (most) members of a joint
registration have the motivation to be active in the dossier development.
A consortium is formed that gathers the group of active companies to elaborate the lead
dossier, while the other potential registrants remain inactive. – This approach is frequently
taken in practice if many market actors are involved and at least some of the companies
want to take an active role in the development of the lead dossier. One reason for being
42 One Substance One Registration
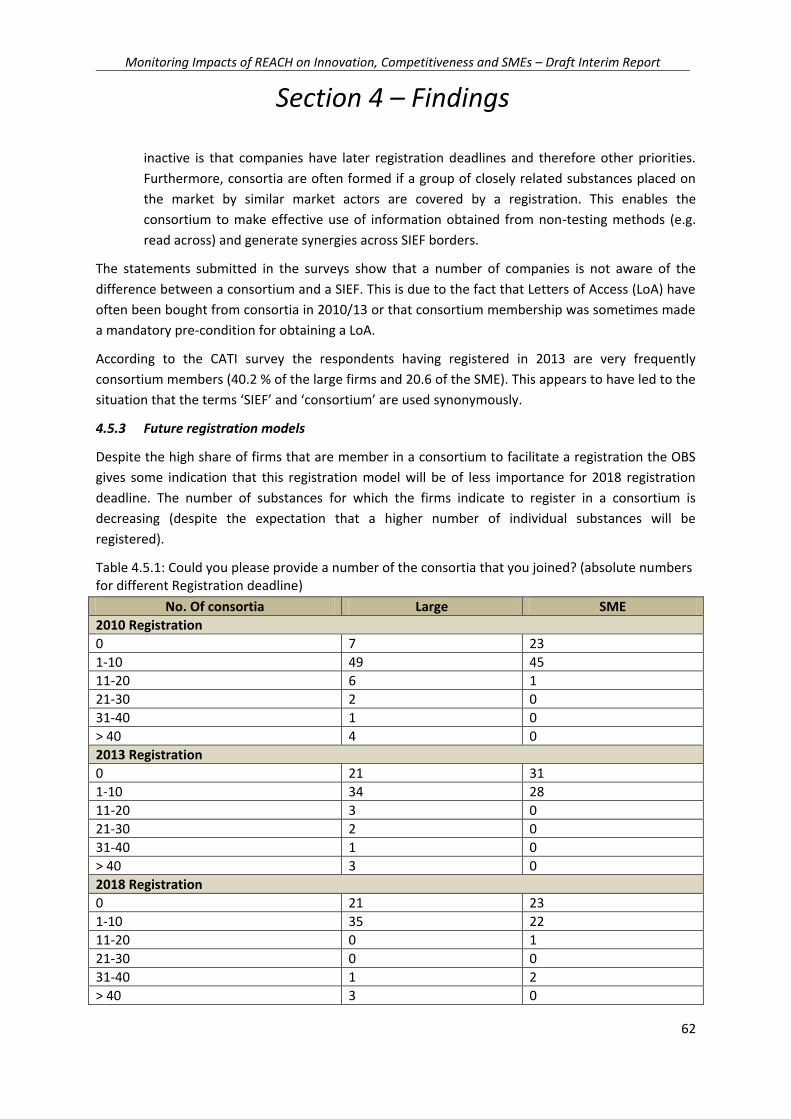
Monitoring Impacts of REACH on Innovation, Competitiveness and SMEs – Draft Interim Report
Section 4 – Findings
62
inactive is that companies have later registration deadlines and therefore other priorities.
Furthermore, consortia are often formed if a group of closely related substances placed on
the market by similar market actors are covered by a registration. This enables the
consortium to make effective use of information obtained from non-testing methods (e.g.
read across) and generate synergies across SIEF borders.
The statements submitted in the surveys show that a number of companies is not aware of the
difference between a consortium and a SIEF. This is due to the fact that Letters of Access (LoA) have
often been bought from consortia in 2010/13 or that consortium membership was sometimes made
a mandatory pre-condition for obtaining a LoA.
According to the CATI survey the respondents having registered in 2013 are very frequently
consortium members (40.2 % of the large firms and 20.6 of the SME). This appears to have led to the
situation that the terms ‘SIEF’ and ‘consortium’ are used synonymously.
4.5.3 Future registration models
Despite the high share of firms that are member in a consortium to facilitate a registration the OBS
gives some indication that this registration model will be of less importance for 2018 registration
deadline. The number of substances for which the firms indicate to register in a consortium is
decreasing (despite the expectation that a higher number of individual substances will be
registered).
Table 4.5.1: Could you please provide a number of the consortia that you joined? (absolute numbers for different Registration deadline)
No. Of consortia Large SME
2010 Registration
0 7 23
1-10 49 45
11-20 6 1
21-30 2 0
31-40 1 0
> 40 4 0
2013 Registration
0 21 31
1-10 34 28
11-20 3 0
21-30 2 0
31-40 1 0
> 40 3 0
2018 Registration
0 21 23
1-10 35 22
11-20 0 1
21-30 0 0
31-40 1 2
> 40 3 0

Monitoring Impacts of REACH on Innovation, Competitiveness and SMEs – Draft Interim Report
Section 4 – Findings
63
Source: Online Business Survey
In the interviews individual firms expressed the view that, in contrast to the former situations,
consortia might not be suitable in their SIEFs because few registrants are in the pre-SIEFs (less than
five) and therefore cost sharing is expected to be much easier than in the past (also because the
registration tonnages do not spread over so many tonnage bands and hence the data needs are very
similar for all registrants43).
There were several advantages seen from being a consortium member (see table below). However,
especially SME indicate that the main advantage is the possibility to be involved in decisions on the
dossier.
4.5.2 Advantages from joining a consortium
Large SME All firms
Main discussions were only carried out in a small core group
39,0 34,0 36,7
Contractual agreements protected intellectual property and clarified responsibilities
39,0 21,4 31,0
No specific added value but it was a precondition to be actively involved in dossier development
13,8 31,1 21,8
Other (please specify) 8,1 13,6 10,5
n = 123 103 229
Source: Online Business Survey
Several “other reasons” are mentioned by the stakeholders in the survey related to extra work partly
going beyond the actual registration, such as discussions on substances sameness44, preparation of a
safety data sheet, coverage of various EINECS entries, documentation of assessment approaches and
deviations from standard data requirements.
These experiences with SIEF and consortia were also reflected in observations made by industry
associations and member state authorities as presented in the table below.
Table 4.5.3: Types of issues firms have most often raised in relation to the operation of SIEFs and
consortia (Industry associations, share of respondents indicating that specific issues have been
raised by their members in relation to the operation of SIEFs or consortia).
Issues SIEFs Consortia
MS Authorities
Industry Associations
MS Authorities
Industry Associations
Participants demanding too much money 81.5% 34.6% 51.9% 57.7%
43 Even more, far less expensive and complex test data are needed to register in tonnage bands below 100 tpa.
44 Note: Although being mentioned in the survey, in practice this task is essential to form a SIEF and decide, which substance it covers as well as to evaluate if studies apply to a substances.
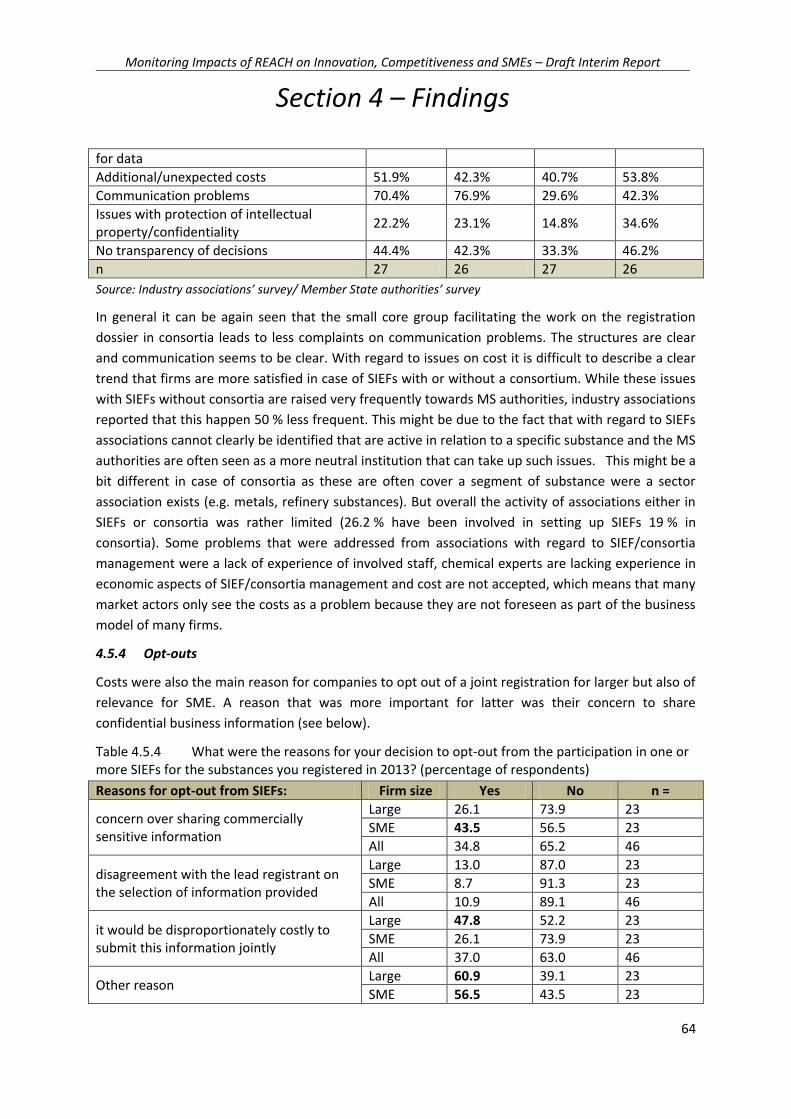
Monitoring Impacts of REACH on Innovation, Competitiveness and SMEs – Draft Interim Report
Section 4 – Findings
64
for data
Additional/unexpected costs 51.9% 42.3% 40.7% 53.8%
Communication problems 70.4% 76.9% 29.6% 42.3%
Issues with protection of intellectual property/confidentiality
22.2% 23.1% 14.8% 34.6%
No transparency of decisions 44.4% 42.3% 33.3% 46.2%
n 27 26 27 26
Source: Industry associations’ survey/ Member State authorities’ survey
In general it can be again seen that the small core group facilitating the work on the registration
dossier in consortia leads to less complaints on communication problems. The structures are clear
and communication seems to be clear. With regard to issues on cost it is difficult to describe a clear
trend that firms are more satisfied in case of SIEFs with or without a consortium. While these issues
with SIEFs without consortia are raised very frequently towards MS authorities, industry associations
reported that this happen 50 % less frequent. This might be due to the fact that with regard to SIEFs
associations cannot clearly be identified that are active in relation to a specific substance and the MS
authorities are often seen as a more neutral institution that can take up such issues. This might be a
bit different in case of consortia as these are often cover a segment of substance were a sector
association exists (e.g. metals, refinery substances). But overall the activity of associations either in
SIEFs or consortia was rather limited (26.2 % have been involved in setting up SIEFs 19 % in
consortia). Some problems that were addressed from associations with regard to SIEF/consortia
management were a lack of experience of involved staff, chemical experts are lacking experience in
economic aspects of SIEF/consortia management and cost are not accepted, which means that many
market actors only see the costs as a problem because they are not foreseen as part of the business
model of many firms.
4.5.4 Opt-outs
Costs were also the main reason for companies to opt out of a joint registration for larger but also of
relevance for SME. A reason that was more important for latter was their concern to share
confidential business information (see below).
Table 4.5.4 What were the reasons for your decision to opt-out from the participation in one or more SIEFs for the substances you registered in 2013? (percentage of respondents)
Reasons for opt-out from SIEFs: Firm size Yes No n =
concern over sharing commercially sensitive information
Large 26.1 73.9 23
SME 43.5 56.5 23
All 34.8 65.2 46
disagreement with the lead registrant on the selection of information provided
Large 13.0 87.0 23
SME 8.7 91.3 23
All 10.9 89.1 46
it would be disproportionately costly to submit this information jointly
Large 47.8 52.2 23
SME 26.1 73.9 23
All 37.0 63.0 46
Other reason Large 60.9 39.1 23
SME 56.5 43.5 23
Monitoring Impacts of REACH on Innovation, Competitiveness and SMEs – Draft Interim Report
Section 4 – Findings
65
All 58.7 41.3 46
Source: CATI Survey
Other reasons that were mentioned in the frame of the CATI survey showed that there still is a high degree of uncertainty related to the basic obligations roles and processes of REACH as in fact reasons were given that do not represent opt outs as used in the REACH text. Firms stated:
Decision of a corporate central (alone no valid reason for an opt out) No registration or pre-registration yet (not an opt out) Costs were as high as own dossier Substance identity differed / Impurity profile of the SIEF did not match with the own (which is
rather a SIEF split than an opt out) Different uses were covered (not an opt out in the meaning of the REACH text –data could have
been shared and CSR sharing is not mandatory- so this could have been handled within one registration)
This shows with regard to the registration phase that still capacity building needs to be in the center of activities to avoid unwanted developments due to a lack of understanding of the processes
4.5.5 Conclusions and recommendations
A general preference for organizing a registration via the SIEF or a consortium cannot be given. There are indications that in some situations consortia be favorable and others were SIEFs seem sufficient and will reduce bureaucracy.
There are indications that the degree of willingness of SME to play more active role in registration is limited. This might lead to a situation in 2018 when new SIEFs have to be founded that nobody becomes active with the result that registrations will not be made or have to face significant problems due to a (too) late start of the process.
Rules for cost sharing are widely accepted by many companies, still there is a relevant share of firms that claim costs are a problem.
Cost sharing rules should be critical reviewed and if seen as unacceptable be changed. In such cases these changes should also be applied to already existing (with the consequence that some members of registrations will be reimbursed while other might need to pay once more for existing registrations.
Opt out can be justified in some cases but the principle one substance one registration should be the guideline for all registrants and it should be critically checked if justification is sufficient for an opt out (preferable before provision of registration numbers to single registrations).
Member states and associations should concentrate on capacity building with regard to 2018 as there is still a lack of basic understanding of REACH which in practice is one source of problems either in SIEFs or consortia.
Sources
ECHA 2010 DOSSIER SUBMISSION REPORT ON 1 DECEMBER 2010, http://echa.europa.eu/documents/10162/13581/registration_stats_20101201_en.pdf
ECHA 2014 Registration Statistics, 06/03/2015,
CEFIC 2008 Guidance on SIEF Formation, Version 0 http://www.cefic.org/Documents/IndustrySupport/Guidance_SIEF_Formation.pdf
CEFIC 2009a CEFIC FAQ on SIEFs April 2009 http://www.cefic.org/Documents/IndustrySupport/FAQ_SFF_and%20SIEF_0409.pdf

Monitoring Impacts of REACH on Innovation, Competitiveness and SMEs – Draft Interim Report
Section 4 – Findings
66
CEFIC 2009b Conclusions of SIEF Workshop 30/03/09 http://www.cefic.org/Documents/IndustrySupport/Conclusions_SIEF_workshop_300309_updated.pdf
COM 2012 Technical assistance to prepare the Commission report on the operation of REACH, http://ec.europa.eu/enterprise/sectors/chemicals/files/reach/review2012/operation-final-report_en.pdf

Monitoring Impacts of REACH on Innovation, Competitiveness and SMEs – Draft Interim Report
Section 4 – Findings
67
4.6 Objective 6 – SMEs
4.6.1 Introduction
The aims of this section are to: describe and assess all roles of the SMEs in relation to REACH, bringing in additional dimensions, such as the economic conditions in specific Member States; conclude on the major concerns in relation with the implementation of REACH and order those thematically according to the specific REACH related process to facilitate targeted policy response; and establish if SMEs have specific constraints in fulfilling these roles and if these are specific to the companies fitting into the SME definition (or SME sub-categories) or are of a more general nature.
The breakdown of responses by firm size for the CATI and online business surveys is provided below.
Table 4.6.1: Size of the firms responding to the CATI and business survey
CATI survey
Online business survey
Firm size n % n %
Micro 95 8.8 28 4.9
Small 214 19.9 82 14.5
Medium 337 31.3 136 24.1
SMEs (not defined) 21 2.0 - -
SMEs total 667 62.0 246 43.5
Large 409 38.0 206 36.4
Not indicated
114 20.1
Total 1076 100.0 566 100.0
Source: CATI survey& Online business survey
By way of introduction it can be said that the category of “SME”45 encompasses a large range of types of enterprises. In many ways it is a problematic way to categorise firms because it may in include on the one hand a highly profitable high tech micro firm doing a global business; and at the same time a local or regional business with 245 employees that is struggling for survival.
The table below sets out the distribution of (non-financial) SMEs in the EU in terms of firm size (by number and percentage), according to number of enterprises, employment and value added at factor cost. This makes explicit the importance of the role played by SMEs in the overall economy of the EU.
45 As defined in EU Recommendation 2003/61
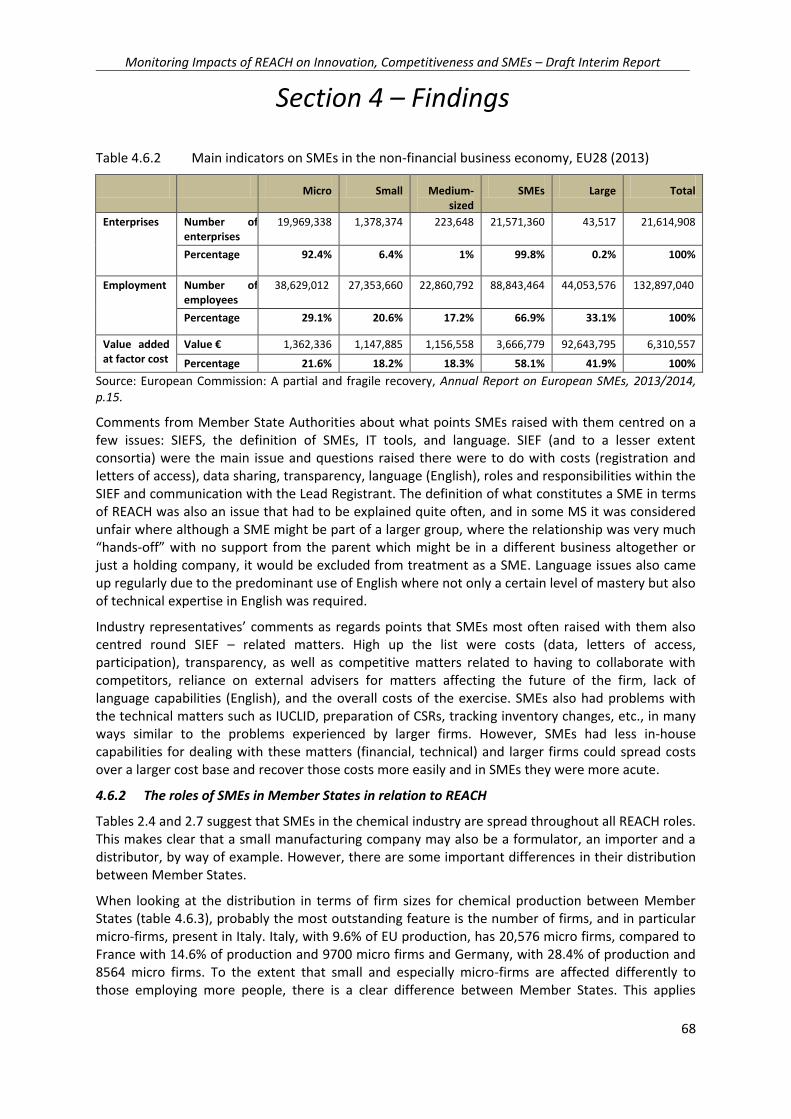
Monitoring Impacts of REACH on Innovation, Competitiveness and SMEs – Draft Interim Report
Section 4 – Findings
68
Table 4.6.2 Main indicators on SMEs in the non-financial business economy, EU28 (2013)
Micro Small Medium-sized
SMEs Large Total
Enterprises Number of enterprises
19,969,338 1,378,374 223,648 21,571,360 43,517 21,614,908
Percentage 92.4% 6.4% 1% 99.8% 0.2% 100%
Employment Number of employees
38,629,012 27,353,660 22,860,792 88,843,464 44,053,576 132,897,040
Percentage 29.1% 20.6% 17.2% 66.9% 33.1% 100%
Value added at factor cost
Value € 1,362,336 1,147,885 1,156,558 3,666,779 92,643,795 6,310,557
Percentage 21.6% 18.2% 18.3% 58.1% 41.9% 100%
Source: European Commission: A partial and fragile recovery, Annual Report on European SMEs, 2013/2014, p.15.
Comments from Member State Authorities about what points SMEs raised with them centred on a few issues: SIEFS, the definition of SMEs, IT tools, and language. SIEF (and to a lesser extent consortia) were the main issue and questions raised there were to do with costs (registration and letters of access), data sharing, transparency, language (English), roles and responsibilities within the SIEF and communication with the Lead Registrant. The definition of what constitutes a SME in terms of REACH was also an issue that had to be explained quite often, and in some MS it was considered unfair where although a SME might be part of a larger group, where the relationship was very much “hands-off” with no support from the parent which might be in a different business altogether or just a holding company, it would be excluded from treatment as a SME. Language issues also came up regularly due to the predominant use of English where not only a certain level of mastery but also of technical expertise in English was required.
Industry representatives’ comments as regards points that SMEs most often raised with them also centred round SIEF – related matters. High up the list were costs (data, letters of access, participation), transparency, as well as competitive matters related to having to collaborate with competitors, reliance on external advisers for matters affecting the future of the firm, lack of language capabilities (English), and the overall costs of the exercise. SMEs also had problems with the technical matters such as IUCLID, preparation of CSRs, tracking inventory changes, etc., in many ways similar to the problems experienced by larger firms. However, SMEs had less in-house capabilities for dealing with these matters (financial, technical) and larger firms could spread costs over a larger cost base and recover those costs more easily and in SMEs they were more acute.
4.6.2 The roles of SMEs in Member States in relation to REACH
Tables 2.4 and 2.7 suggest that SMEs in the chemical industry are spread throughout all REACH roles. This makes clear that a small manufacturing company may also be a formulator, an importer and a distributor, by way of example. However, there are some important differences in their distribution between Member States.
When looking at the distribution in terms of firm sizes for chemical production between Member States (table 4.6.3), probably the most outstanding feature is the number of firms, and in particular micro-firms, present in Italy. Italy, with 9.6% of EU production, has 20,576 micro firms, compared to France with 14.6% of production and 9700 micro firms and Germany, with 28.4% of production and 8564 micro firms. To the extent that small and especially micro-firms are affected differently to those employing more people, there is a clear difference between Member States. This applies

Monitoring Impacts of REACH on Innovation, Competitiveness and SMEs – Draft Interim Report
Section 4 – Findings
69
across the board for all the “objectives” under consideration in this study: from Single Market effects and harmonisation, international competitiveness, registration costs, business opportunities, SIF nd consortia, through to downstream users, innovation, human resources and consultants, SVHCs, support and registration in 2018.
Table 4.6.3 Distribution of firm sizes in EU Member States (Chemical industry NACE 20+22)46: percentage and number of enterprises
Member State From 0 to 9 persons
employed
From 10 to 19 persons employed
From 20 to 49 persons employed
From 50 to 249 persons employed
250 persons employed or more
Total
Belgium % 69% 10% 10% 8% 3% 100
Number 1566 223 221 188 64 2262
Bulgaria 74% 10% 9% 6% 1% 100
1381 195 159 114 21 1870
Czech Republic 91% 3% 3% 3% 1% 100
7630 270 218 232 63 8413
Denmark 65% 13% 10% 10% 3% 100
494 96 75 76 23 764
Germany 65% 14% 8% 10% 3% 100
8,564 1,893 1,029 1,276 375 13137
Estonia 70% 9% 10% 10% 1% 100
196 26 28 27 4 281
Ireland 54% 15% n.a 13% n.a 100
220 61 n.a 53 n.a n.a
Greece 91% 4% 3% 1% 0%
4313 212 139 71 8 4743
Spain 75% 11% 8% 4% 1% 100
9654 1453 1039 565 90 12801
France 82% 6% 6% 5% 2% 100
9700 652 746 550 185 1183
Croatia 84% 8% 5% 3% 1% 100
1354 123 79 52 10 1618
Italy 80% 11% 6% 3% 1% 100
20576 2844 1543 758 135 25856
Cyprus n.a 16% 11% n.a 0% n.a
Na 61 42 n.a. 0 Na
Latvia 78% 9% 8% 4% 0% 100
469 57 46 26 3 601
Lithuania 87% 6% 3% 3% 1% 100
1163 80 46 43 9 1341
Luxembourg 57% 8% 4% 27% 4% 100
46 These NACE codes selected are provisional and might have to be revised.
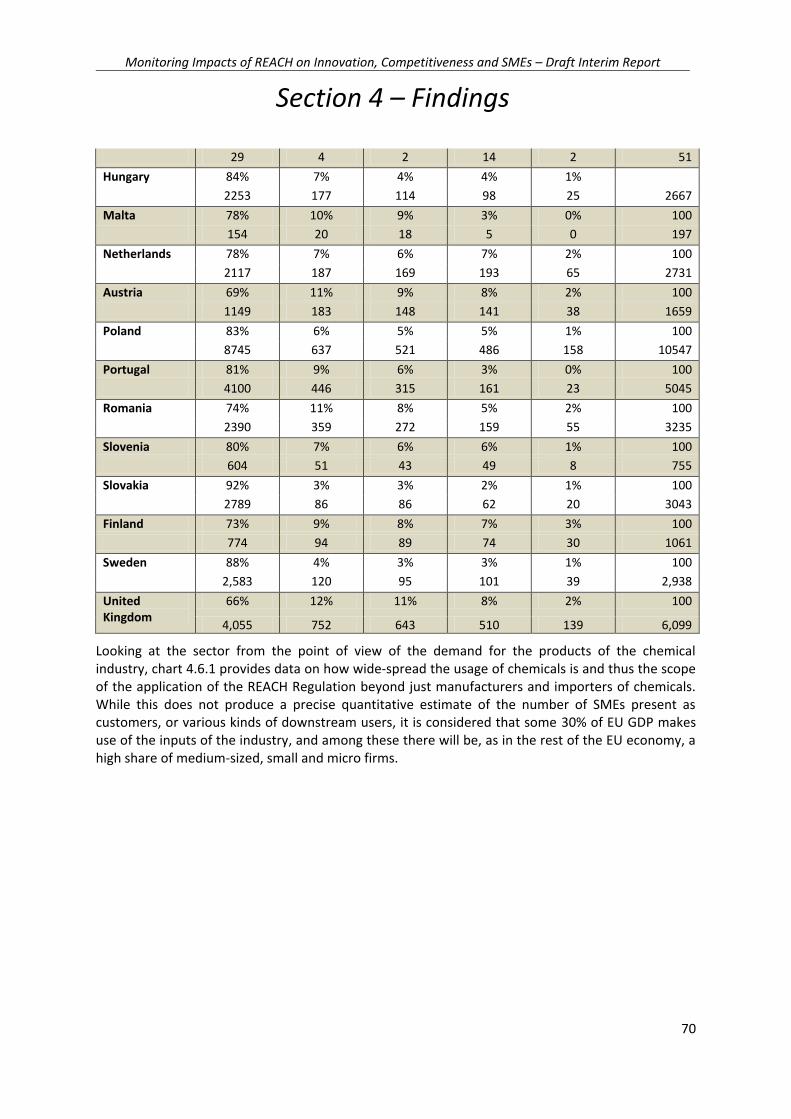
Monitoring Impacts of REACH on Innovation, Competitiveness and SMEs – Draft Interim Report
Section 4 – Findings
70
29 4 2 14 2 51
Hungary 84% 7% 4% 4% 1%
2253 177 114 98 25 2667
Malta 78% 10% 9% 3% 0% 100
154 20 18 5 0 197
Netherlands 78% 7% 6% 7% 2% 100
2117 187 169 193 65 2731
Austria 69% 11% 9% 8% 2% 100
1149 183 148 141 38 1659
Poland 83% 6% 5% 5% 1% 100
8745 637 521 486 158 10547
Portugal 81% 9% 6% 3% 0% 100
4100 446 315 161 23 5045
Romania 74% 11% 8% 5% 2% 100
2390 359 272 159 55 3235
Slovenia 80% 7% 6% 6% 1% 100
604 51 43 49 8 755
Slovakia 92% 3% 3% 2% 1% 100
2789 86 86 62 20 3043
Finland 73% 9% 8% 7% 3% 100
774 94 89 74 30 1061
Sweden 88% 4% 3% 3% 1% 100
2,583 120 95 101 39 2,938
United Kingdom
66% 12% 11% 8% 2% 100
4,055 752 643 510 139 6,099
Looking at the sector from the point of view of the demand for the products of the chemical industry, chart 4.6.1 provides data on how wide-spread the usage of chemicals is and thus the scope of the application of the REACH Regulation beyond just manufacturers and importers of chemicals. While this does not produce a precise quantitative estimate of the number of SMEs present as customers, or various kinds of downstream users, it is considered that some 30% of EU GDP makes use of the inputs of the industry, and among these there will be, as in the rest of the EU economy, a high share of medium-sized, small and micro firms.

Monitoring Impacts of REACH on Innovation, Competitiveness and SMEs – Draft Interim Report
Section 4 – Findings
71
Chart 4.6.1 Percentage of output of chemical production consumed by customer sector
Sources: European Commission, Eurostat data (Input-Output, 2000)
The above observations indicate that SMEs are widely spread throughout all REACH roles. There is a wide range in the presence of different categories of SME (micro- , small and medium) and large enterprises in different Member States. The later point in particular has far reaching implications as regards the different impacts of the implementation of REACH in different Member States.
4.6.3 The major concerns for SMEs compared to large firms in relation to the implementation of REACH
In the following paragraphs the main concerns of SMEs in relation to the implementation of REACH are identified in terms of their differences to those of large firms in other parts of this study. This is based on the evidence report and additional qualitative interviews.
The operation of the Single Market
As regards the effects of the implementation of REACH on businesses in terms of trade inside the EU, there is a marked difference in response between SMEs and large firms concerning the effect on exports (16.7% compared to 6.3%) where there is a greater reduction for SMEs due to price increases related to REACH, and in particular for micro firms (OBS). There was also a greater decrease in imports compared to large firms, but this was not as substantial (11.4% compared to 9.2%).
As far as the effect of REACH on harmonisation of chemicals legislation and opening of new opportunities is concerned, differences are not that significant, except in the case of micro firms’ response who “strongly disagree” that REACH has increased harmonisation and led to new EU
0,0%
2,0%
4,0%
6,0%
8,0%
10,0%
12,0%
14,0%
16,0%
Ru
bb
er a
nd
pla
stic
s
Co
nst
ruct
ion
Pu
lp a
nd
pap
er
Au
tom
oti
ve
Bas
ic m
etal
s
Text
iles
Oth
er n
on
-met
allic
min
eral
…
Fab
rica
ted
met
al p
rod
uct
s
Mac
hin
ery
and
eq
uip
men
t
Foo
d a
nd
bev
erag
es
Wo
od
Pu
blis
hin
g an
d p
rin
tin
g
Elec
tric
al m
ach
iner
y an
d…
Furn
itu
re
Oth
er m
anu
fact
uri
ng
Hea
lth
an
d s
oci
al w
ork
Oth
er b
usi
nes
s ac
tivi
ties
Agr
icu
ltu
re
Wh
ole
sale
& r
etai
l tra
de
Serv
ice

Monitoring Impacts of REACH on Innovation, Competitiveness and SMEs – Draft Interim Report
Section 4 – Findings
72
business opportunities (60.9%), compared to large firms (20.3%) and an average of 24.6%. There is also a high level of “disagree” response from small firms (39.7%)(OBS).
Micro firms also express a very high level (57.1%) of agreement (“strongly agree”) with the statement that the level of enforcement of REACH across the EU varies and that this has a negative impact on the operation of the single market. In this instance 19.4% of SMEs as a whole “strongly agree”, compared to 10.6% of large firms (OBS). Overall 58.6% of SMEs agree or strongly agree.
Competitiveness
Large firms are more concerned than SMEs about the effect of the Regulation on their competitive position compared to firms from outside the EU (27.1% compared to 20.1%), and see this in a more negative light than SMEs, This may be because they compete more with such non-EU firms.
Registration 2013
As regards registration in 2013, 40.7% of large firms indicated that 81-100% of their substances are now registered, compared to 22.9% of SMEs (OBS). Correspondingly, more SMEs also indicated that 0% or 1-20% of substances (by turnover) had been registered. 46% of micro firms (only 13 responded) had done no registrations.
Overall, SMEs reported experiencing a higher level of substance withdrawal than large firms as a result of 2013 registration requirements (36.4% as opposed to 24.8%)(OBS). This was, again, particularly the case with micro firms (55.6%, although not many responded).
SMEs responded slightly differently to the costs raised by the REACH Regulation in some ways: fewer decided to absorb the cost by reducing profit margins (66.7% compared to 75.9%); more decided to withdraw from specific markets (12.8% compared to 7.3%); and, more decided to withdraw specific products from the market (27.7% compared to 14.6%) (OBS). In the last instance, 77.8% of micro firms indicated product withdrawals.
Innovation
As regards innovation, the contribution of REACH to innovation and the development of new business opportunities were not dissimilar for SMEs and large firms in the case of both surveys. SMEs generally provided lower levels of positive responses for the role of the information sources generated by REACH as a source of innovation than large firms, except in the case of the (e)SDS.
The survey responses suggest that there was not a substantial difference between SMEs and large firms in terms of reallocation of R&D resources to compliance activities. Fewer SMEs did a temporary transfer than large firms. In practice this might of course mean a high opportunity cost for a micro- or small firm if that means a manager/ owner spends time on compliance with REACH rather than running the business.
There was also not a great deal of difference as regards the effects REACH on time to market between SMEs and large firms, except where the increase was of more than 12 months, and this particularly affected micro firms (to be investigated further).
A larger share of SMEs than large firms indicated that they had not been affected by the placing of substances on the candidate list (33.6% compared to 17.1%) (OBS). This is valid for both the CATI and online business surveys. Large firms tended more often than SMEs to launch reformulation initiatives in response (41.9% compared to 24.6%). More large firms requested substitution of such substances by their suppliers than SMEs (36.8% compared to 18.9%). In other respects the effects of the candidate list was similar.
Monitoring Impacts of REACH on Innovation, Competitiveness and SMEs – Draft Interim Report
Section 4 – Findings
73
A lower percentage of SMEs than large firms appear affected by authorisation, and overall, for all possible options, a higher share of large firms than SMEs responded, particularly as regards request for substitution to suppliers (OBS).
When substances produced entered the registry of intended substances for restriction, substantially more SMEs than large firms withdrew the substance from the market (17.2% compared to 5.4%).
SIEF and Consortia
Feedback from SMEs as regards the value for money from participating in SIEF is quite variable in comparison to the feedback from large firms. A higher percentage of SMEs thought it “very low” than large firms, but a lower percentage saw it is “low” and “about right”. A higher percentage of SMEs saw the value as “high” and “very high” than large firms (OBS).
More large firms (40.2%) joined consortia than SMEs (20.6%) and the more detailed breakdown by size shows that smaller size firms tend to avoid participation in consortia and more large firms saw more added value in consortia than SIEF due to discussions being carried out in a small core group and in the contractual agreements that protect IP and clarified responsibilities. A higher percentage of SMEs than large firms saw consortia as providing no specific value but they participated because they were a precondition for involvement in dossier development (41.0% compared to 22.4%).
DUs Communication in the supply chain
There are not significant differences between SMEs and large firms as regards the percentages of substances used for which eSDS have been received, except possibly in the case of the 0% category (9.1% SMEs as opposed to 3.6% of large firms).
As regards information received with the eSDS leading to changes in activities to protect health, safety and the environment (HSE), the major difference between SMEs and large firms lay in the required adoption of new safety instructions where this was the case for 9.9% of SMEs and 21.7% of large firms.
Large firms were more aware of the different methods to consolidate received eSDSs into their own SDS (63.6% compared to 43.9%).
Staffing and resources
There are some significant differences in the way in which SMEs and large firms deal internally with the resources required to ensure compliance with REACH. A larger share of large firms report having a dedicated REACH unit (32.7% compared to 17.4%) and have a dedicated REACH manager (48.3% compared to 28.6%). The CATI results also reflect these differences.
Both the CATI survey and the OBS indicate that there are not significant differences between SMEs and large firms as regards availability of qualified persons to deal with REACH-related activities. Interviews with companies make it clear that the key issue for SMEs is affordability rather than availability.
As regards availability of appropriate educational and training programmes to deal with REACH regulations, more large firms have designed in-house training programmes (37.0% compared to 27.3%) and more SMEs said that existing courses are not appropriate for their needs (21.2% compared to 12.6%) – especially in the case of micro firms (46.7%).
As far as working with external consultants is concerned, more SMEs say they find it very difficult to find consultants with the right level of skills and experience that they can trust and work with (22.8%
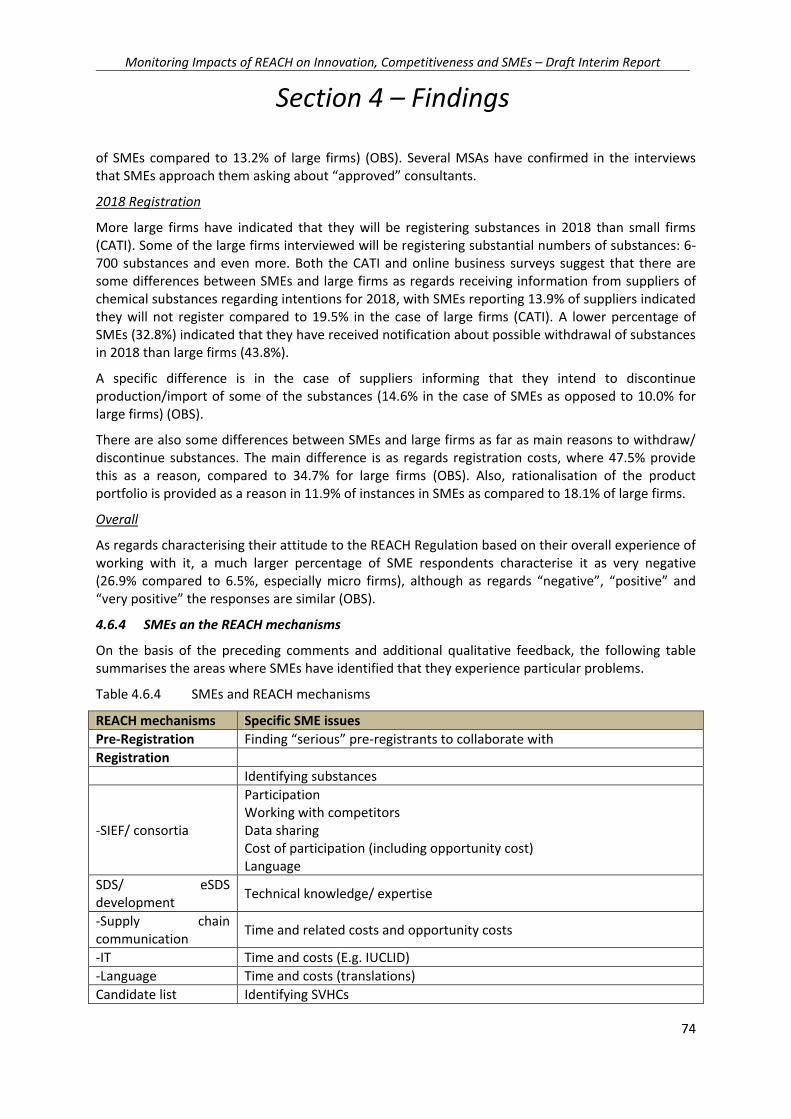
Monitoring Impacts of REACH on Innovation, Competitiveness and SMEs – Draft Interim Report
Section 4 – Findings
74
of SMEs compared to 13.2% of large firms) (OBS). Several MSAs have confirmed in the interviews that SMEs approach them asking about “approved” consultants.
2018 Registration
More large firms have indicated that they will be registering substances in 2018 than small firms (CATI). Some of the large firms interviewed will be registering substantial numbers of substances: 6-700 substances and even more. Both the CATI and online business surveys suggest that there are some differences between SMEs and large firms as regards receiving information from suppliers of chemical substances regarding intentions for 2018, with SMEs reporting 13.9% of suppliers indicated they will not register compared to 19.5% in the case of large firms (CATI). A lower percentage of SMEs (32.8%) indicated that they have received notification about possible withdrawal of substances in 2018 than large firms (43.8%).
A specific difference is in the case of suppliers informing that they intend to discontinue production/import of some of the substances (14.6% in the case of SMEs as opposed to 10.0% for large firms) (OBS).
There are also some differences between SMEs and large firms as far as main reasons to withdraw/ discontinue substances. The main difference is as regards registration costs, where 47.5% provide this as a reason, compared to 34.7% for large firms (OBS). Also, rationalisation of the product portfolio is provided as a reason in 11.9% of instances in SMEs as compared to 18.1% of large firms.
Overall
As regards characterising their attitude to the REACH Regulation based on their overall experience of working with it, a much larger percentage of SME respondents characterise it as very negative (26.9% compared to 6.5%, especially micro firms), although as regards “negative”, “positive” and “very positive” the responses are similar (OBS).
4.6.4 SMEs an the REACH mechanisms
On the basis of the preceding comments and additional qualitative feedback, the following table summarises the areas where SMEs have identified that they experience particular problems.
Table 4.6.4 SMEs and REACH mechanisms
REACH mechanisms Specific SME issues
Pre-Registration Finding “serious” pre-registrants to collaborate with
Registration
Identifying substances
-SIEF/ consortia
Participation Working with competitors Data sharing Cost of participation (including opportunity cost) Language
SDS/ eSDS development
Technical knowledge/ expertise
-Supply chain communication
Time and related costs and opportunity costs
-IT Time and costs (E.g. IUCLID)
-Language Time and costs (translations)
Candidate list Identifying SVHCs

Monitoring Impacts of REACH on Innovation, Competitiveness and SMEs – Draft Interim Report
Section 4 – Findings
75
Sharing information Identifying alternatives/ withdrawal Updating information Uncertainty
Authorisation
Cost of Authorisation (familiarisation, adaptation, administration) Registering uses/ ensuring activities are included – links with suppliers/ downstream Cost of R&D to find substitutes Uncertainty
Restriction Covering uses – future development?
Support SMEs appreciate individual support and being able to learn from their peers in groups
Overall, it can probably be said that the major issue for the micro or small enterprise is not willingness to comply, nor necessarily lack of technical expertise, nor having to deal with SVHCs, but the availability of resources (in terms of costs and opportunity costs) to comply with the requirements of the Regulation. Even medium-sized companies, especially at the higher end of the employment scale, tend to have a specialist Health, Safety and Environmental employee, or even a team that will tend to pick up REACH duties. For the small and micro-enterprise, it is usually the company owner/ manager or the research chemist who deals with this, in addition to this or her other duties, which can put a substantial strain on that person with important opportunity costs. Outsourcing is costly, and invariably employment of an additional person just for regulatory compliance – in addition to other REACH costs such as letters of access can have a substantial impact on return on capital.
4.6.5 SME- specific constraints in fulfilling REACH roles
It is well known that SMEs face a range of issues as compared to large firms in several fields: access to finance, access to skills and capabilities, access to markets, innovation, etc.
The above review of survey results suggests that there are areas where SMEs are differently impacted to larger firms as a result of compliance with REACH. There are two factors underlying these various divergences. One is related to the way in which small volume/ size interacts with the Regulation – a mechanical ratio as it were; the other is to do with the basic problem of being small, which is compounded by the specific demands of compliance.
Turning to the first factor, a small or micro firm may be more dependent on the destiny of one or a few substances than a large firm, or the cost of letters of access may be sufficient to make a SME withdraw from a business line – or it may even decide to cease operations. Large firms have much more resilience in this respect and there are already since the 2010 registration period instances reported of otherwise healthy businesses that have been built up over decades closing down or having to be sold to larger competitors with more financial resources due to REACH compliance costs.
The second factor is related to the first: larger businesses have more resources and markets from which to recover REACH compliance costs. This means that specialised staff can be recruited, trained and offered rewarding career paths to deal with REACH (and other) compliance, and absorb costs – direct and indirect, visible and invisible, captured and not captured by company accounting systems, that micro and small enterprises simply have a great deal of difficult in absorbing. In essence, the entry barrier – fixed cost basis – for participating in the chemical industry has been raised and some micro and small firms will find it increasingly difficult to compete.
Monitoring Impacts of REACH on Innovation, Competitiveness and SMEs – Draft Interim Report
Section 4 – Findings
76
4.7 Objective 7 - Downstream Users (DUs)
4.7.1 Introduction
The aims of this section are to establish and assess the major cost drivers for downstream users with regard to REACH. Costs for major downstream sectors should be put in the context of profit margins and overall costs for safety & environment protection as required by other EU and national legislations; and to provide estimates of awareness and compliance costs estimations at EU and Member State and sector specific level.
As a result of REACH, downstream users have changed their roles from being passive actors regarding substance regulation to actors that are actively involved in the control of chemical risks. The degree of involvement differs depending on the REACH process concerned. Downstream users are increasingly taking up their responsibilities and fulfilling an active role.
Besides the mandatory legal obligations they already had to fulfil before REACH, such as having to provide safety data sheets (SDS) for substances and mixtures, a number of new tasks are to be performed due to REACH. Some of these are very challenging as they are new and partly change the DUs’ understanding of how they are using chemicals. Some tasks are legally binding like the notification of SVHC in articles (Article 7), communication on SVHC in the supply chain according to Article 33 or the implementation of information on risk management received via SDSs. Other tasks such as e.g. becoming active due to non-registration of current suppliers47 only become relevant under certain conditions and require active observation of the supply chain (mainly the suppliers) and REACH processes (e.g. the need to obtain authorisation for the use of a substance or a mixture containing a specific substance). Depending on regulatory decisions, the situation for a specific substance can change within a comparatively short period of time48 and needs adequate reactions by the specific DU.
4.7.2 Overall finding - awareness
Interviews with firms, authorities and associations often gave indications that a large number of DUs are still unaware of many of the main REACH processes (see following table). This particularly became clear from the evaluation of the survey results. Here it was noticed that although the questions addressed issues related to a specific DU role and or DU tasks, the respondents’ answers indicated the lack of a basic understanding of the REACH system and terminology (e.g. assignment as manufacturer but responding to the typical DU tasks like e.g. consolidation of received information for a mixture).
47 Change of supplier, review process for alternative substances or processes, consider own registration and start import activity… 48 …compared to the former legal framework before REACH

Monitoring Impacts of REACH on Innovation, Competitiveness and SMEs – Draft Interim Report
Section 4 – Findings
77
Table 4.7.1 On the basis of your experience, are firms with a Downstream User role in your sector/country aware of their REACH related responsibilities?
Answer Options Response Percent
Response Count
Do not know 10,3% 4
The majority of firms (if not all) are not aware 28,2% 11
Important part of them are aware 33,3% 13
Most (if not all of them) are aware 28,2% 11
(Industry association survey)
Many helpdesks reported that approximately 50% of all questions are received from DUs. The questions’ subjects are often related to general REACH tasks.
Although DUs are regulated as end-users of chemicals under REACH it can be observed that many of them, as individual companies, are not involved in REACH processes yet. The content of supporting tools and instruments as well as the overall process of registration with regard to communication in the supply chain, of the first two registration phases has been mainly organised by large EU substance manufacturers and their associations (e.g. CEFIC, CONCAWE, Eurometaux) and some DU sector associations (also these involved DU organisations rather represented uses dominated by large and industrial end-users rather than uses, dominated by SME). Therefore much work on describing uses was actually not done by individual firms. So it could be observed that many firms that responded to the survey have not been involved in use mappings in the preparation of a registration.
Table 4.7.1 Have you been involved in upstream communication during use mapping for the different registration deadlines?
Formulator End user Distributor
Supplier of articles
All
Don't know 5,2 5,9 5,7 7,2 6,0
No 49,4 73,2 63,9 66,9 62,1
Yes 45,4 20,9 30,4 25,9 31,9
n = 251 153 158 251 813
(Source: CATI survey)
Experiences from interviews with member state authorities show that it is particularly difficult to reach companies in DU sectors with little awareness of their relation to chemicals; i.e. the use of chemicals is not understood as “part of the business” a company is active in, although many chemicals may be use. An additional problem exists in sectors that are dominated by SME because, even if they are aware of the existence of REACH, they do not engage in identifying their obligations and understanding the processes due to high degree of complexity of the regulation itself as well as its “outputs” (e.g. exposure scenarios) and the instruments used for implementation of the obligations (e.g. XML formats for safety data sheets). In particular the instruments and tools do not fit to the way SME are organised and the qualification of staff that is employed (the latter is not only true for SME). As a consequence DU who are aware of REACH and have started implementation had to invest in the qualification and training of staff (about 30 %, CATI) and additionally to involve external experts (about 19 % technical and 11 % legal, CATI). A lower share of companies (about 19 %, CATI) really spent resources that contributed to the implementation of the registration process by being actively involved in use descriptions under REACH.

Monitoring Impacts of REACH on Innovation, Competitiveness and SMEs – Draft Interim Report
Section 4 – Findings
78
4.7.3 Registration
The first registration phases showed that DU need to observe activities of suppliers with some attention, among others because it may be questionable if all substances are registered. Although this may not lead to the complete disappearance of a substance from the market, but with the REACH requirement that each manufacturer or importer above 1 tpa has to register, it could happen that the DU specific supplier stops his activity for a the substance, requiring the DU to identify new suppliers. The DU needs to ensure that he is part of a supply chain that is covered by a registration to continue his activities (business as usual scenario).
In the interviews the firms stated that not all substances pre-registered in 2008 will be registered. Some manufacturers and importers only make use of transition periods that enable marketing of substances after the pre-registration phase. Registration costs or even authorisation cost may make marketing unprofitable (this is due mainly for substances with small tonnages and low profit per ton). Regardless of the role, about 30 % across all DUs reported that substances have already disappeared from the market due to the 2013 registration requirement. This is supported by ECHA’s findings on the 2010 registration period, where much less registrations were made then expected based on pre-registrations. Several interviewed firms reported that they are currently reviewing their complete substance portfolio, to find out if these will are profitable if a registration is necessary. Some stated that they already have listed substances that they will definitely not market after 2018.
There are indications that importers tend to stop importing to a somewhat higher degree than manufacturers stop manufacture. This could be because their business is based on buying substances from (non-EU) manufacturers and selling them inside the EU generating profit from price differences between buying and selling. Such firms are often small entities that employ few people. Services are concentrated on logistics with low to no experience in regulatory questions and scientific issues with regard to chemicals legislation and risk assessment. They can often just cease importing and move to other business fields (substances). EU-manufacturers seem to stop manufacture less often as their business is based on a dedicated infrastructure to manufacture a substance. It is more difficult to change the substance portfolio as their plants are often designed to produce a certain substance so that the possibilities to change manufacturing to other products are limited. Reasons for not registering were very often based on economics (investment to register all substances in the portfolio too high, single substance with too low value for company’s profit, no relevance of a substance for the portfolio – low demand).
The consequence of manufacturers and importers not registering all substances of their current portfolio for the DUs is that they should monitor their own substance portfolio more carefully (including substances in mixtures and articles). In many companies, this is not yet a well-established process. It requires contacting suppliers asking for their registration intentions proactively and assessing if alternative suppliers are available. In case there are only few suppliers, companies may also consider own registrations and subsequent import. Many companies claimed in the interviews that a high additional workload is necessary for these tasks to ensure availability of raw materials.
Up to now the preferred reaction to cases, where a supplier withdrew a substance from the market was either to change to an alternative substance from the supplier’s portfolio (54.3 % of all responding firms in the CATI survey) or changed the supplier (51.9 %). This is accompanied with a high number of firms that replied that their own research to find alternatives was triggered (over 60 % in the group of the formulators and the article supplier group – latter probably also in relation to the candidate listing of substances).

Monitoring Impacts of REACH on Innovation, Competitiveness and SMEs – Draft Interim Report
Section 4 – Findings
79
In many cases the consequences from a “no registration scenario” are limited. Nevertheless, as in 2018 it is expected that only few manufacturers and importers per individual substance exist and hence will register, the possibilities for DUs to change suppliers in case a substance is not registered will be more limited. How far substitution can be realised depends a great deal on the DU process affected or the accompanying regulatory field that also applies to the DU products (a frequently discussed example in the frame of REACH is the aviation industry or the medical devices sector that need to undergo product specific approval procedures and the use of new substances could trigger the need to apply for a new permit).
It should be noted that in some cases it was reported that substance withdrawal led to a stop of the production of a certain mixture or article (in about 25 % of the cases). The shift of production to non-EU areas was, at the moment, reported as an option of minor importance (about 7 % of the responding firms).This was confirmed in the interviews. Only companies producing mixtures for the non EU-markets and hence facing global competition from non-REACH areas reported that they are considering shifting the production as an option. Other DU firms stated that the EU is their end market and that therefore a shift to non-EU countries would not be an option.
4.7.4 Communication in the supply chain
Communication between the supply chain members of a substance is one the key elements under REACH. Communication does not only happen via the traditional channel, the safety data sheet but also in several other contexts. Some of these communication processes are legal obligations (like several information obligations towards customers and consumers) others are in practice often interpreted as obligations that support certain implementation processes but are not legally binding (e.g. communication on uses and conditions of use in the supply chain).
Safety data sheets are still the core communication tool under REACH. Several stakeholders reported that REACH already did improve the core chapters. The data basis on substances is much better in their opinion and classifications are regarded as more also became more trustworthy. This was also an outcome of the REACH-Review 2012 where similar findings were described in the Eurostat baseline update (COM, 2012).
For hazardous substances registered in amounts exceeding 1 tpa safety data sheets have to be supplied with an exposure scenario (eSDS) as annex. In general eSDS are known to DU although only 90 % of the formulators and only 70% of the DU further down the supply chain have received eSDS up to now.
A lot of criticism is observed on the eSDS and exposure scenarios. Exposure scenarios are not seen as an instrument that improves corporate health and environmental safety practices in a positive way. More than 50% of the respondents answered that no changes have been made to the internal practices due to the receipt of an extended safety data sheet. If changes were realised these usually only comprised the application of additional personal protection equipment (PPE, 20 % CATI) or changes in safety instructions (12 %). With regard to both measures it is doubtful if they fit in the hierarchy of measures to be applied under occupational safety legislation, as this allows the use of PPE only, if elimination of hazard or technical measures are not possible.
Table 4.7.3 shows the share of companies with different roles that have received extended safety data sheets up to now.

Monitoring Impacts of REACH on Innovation, Competitiveness and SMEs – Draft Interim Report
Section 4 – Findings
80
Table 4.7.3 Have you been provided with extended SDSs (Safety Data Sheets and exposure scenarios) for one or more substances that you use?
Formulator End user Distributor Supplier All
Don't know 0,4 4,6 5,1 1,2 2,3
No 9,2 34,6 16,5 25,5 20,4
Yes 90,4 60,8 78,5 73,3 77,2
n = 251 153 158 251 813
(Source CATI survey)
It was stated in the interviews that handling eSDS as they are currently supplied (electronically as PDF documents or physically on paper) requires resource input. Interview partners stated that the work under the CSR/ES Roadmap which among others aims to support standardisation and implementation of ES phrases, electronic information exchange formats and an ES format are too slow and therefore do not contribute to fulfilling the legal obligation to provide eSDS now. Furthermore it was doubted that the instruments currently being prepared would help the broad range of firms that have to deal with eSDS. The XML standard and its implementation in ERP-IT systems is seen as a solution for “industry” but not for smaller firms or even SME, which usually do not have comparable systems. Integration of a standard in smaller “stand alone” software solutions seems to be without alternative if such information should be managed by all market actors.
With regard to their own SDSs DU have to provide, only a low share of firms in the CATI believes to be 100 % compliant. One reason might be that only about 50 % of the firms in the survey were aware of the different methods and options that are available to consolidate information for mixtures under REACH.
4.7.5 Substances of very high concern
From the perspective of formulators and end users of mixtures the SVHC status does not cause additional problems as far as the communication in the supply chain is concerned (SDS have to be provided as for any other substance). Problems rather originate from the fact that the reaction on candidate listing at the moment is almost exclusively that customers demand immediate substitution in products, as can be seen from the answers of all actors to a respective question in the survey.
Table 4.7.4 Have any of your customers requested the removal of SVHCs from your products?
Manufacturer
Importer Formulator End user
Distributor Supplier of Articles
All
NO 78,7 66,7 45,5 57,6 52,0 57,7 61,2
YES 21,3 33,3 54,5 42,4 48,0 42,3 38,8
n = 61 27 44 59 25 26 242
(Source Business survey)
So in fact the candidate list builds up pressure to substitute SVHC. However, the interviews showed that this substitution is often not based on an analysis of the alternatives’ hazardous properties, but only on their legal status (not on candidate list). Consequently, only in a few cases the substitution pressure leads to real innovation in terms of the development of less hazardous substance alternatives at the level of the substance manufacturer. It is more likely, that article producers innovate, frequently because the elimination of a SVHC in products has been on the agenda in the firms anyway and is now treated with higher priority (which also can lead to more resources being made available in the companies).

Monitoring Impacts of REACH on Innovation, Competitiveness and SMEs – Draft Interim Report
Section 4 – Findings
81
Another aspect some interviewed companies highlighted in the context of the candidate list is that communication of substitution requests in the supply chain (in particular for consumer products) has become much easier, especially in non-EU countries. The candidate list of REACH is well known and it is therefore more easily possible to make a clear claim on the need for a replacement of a substance with reference to REACH. This is well understood and formulations are often adapted to be SVHC free. Companies that produce consumer products described REACH as a benchmark and a good way to present products as more environmentally and health friendly alternatives as compared to those of competitors from non-EU countries. This positive marketing effect is less obvious if products are meant to be used by commercial actors or for very complex articles.
Article suppliers also have problems in generating and monitoring information on SVHC in their articles. Although REACH Article 33 defines an obligation for each article supplier to forward information on the SVHC content (to consumers only on request), this information is often not provided. In many cases it is unclear if the lack of communication is due to the absence of SVHC in the article or due to ignorance of the supplier on the SVHC content. In practice the implementation of Article 33 consists of article recipients requesting the absence of SVHC in the articles in supply contracts. At the moment there is a high degree of uncertainty among the interviewed actors if REACH compliance can be ensured with regard to SVHC in articles.
Regardless of their REACH-role, firms have started to implement IT-systems to monitor SVHC in products (about 55 % (OBS). Over 60 % (OBS) of the firms that received articles validated the information on the SVHC content with chemical analyses for the articles they supply.
The uncertainty regarding the SVHC content in articles is reflected in several responses on related challenges. Also other problem areas are addressed (OBS/CATI):
Availability of information from suppliers is problematic (either no information is there or suppliers do not understand why it is demanded)
Lack of awareness the obligation exists.
Complex articles require a lot of communication, even more with non-EU suppliers who do not share information (not willing, not understanding)
Relatively large administration burden to companies to track SVHC (limited human resources)
Information needed beyond the REACH text to make the obligation work (exact concentration and location of SVHC to be able to fulfil the obligation in the next step of the supply chain).
Uncertainty leads to additional burden by own verification of information by testing
Implementation of an effective and anticipated regulatory watch on substances of concern. Recent tools and lists published by ECHA are quite useful (CoRAP or PACT RMOA).
Immediate effect of obligation when SVHC on candidate list (no transition period to assess portfolio)
Complex supply chain already outside the EU (loss of substance information there)
SDS from non-EU suppliers are of bad quality
Due to marketing strategy substitution is the only option
Although DU often request substitution of SVHC from supplied products and by this put some pressure on their suppliers there is no defined tendency to move commercial activities outside the

Monitoring Impacts of REACH on Innovation, Competitiveness and SMEs – Draft Interim Report
Section 4 – Findings
82
EU. 4.3 % of the suppliers of products with SVHC (OBS) indicated they moved away from EU-production. A slightly higher share indicated that they just stopped using the substance in commercial activities49 (8.6 % OBS). So a loss of business to the EU economy can be observed at 13 % of the responding companies, but far more companies either are not affected of any withdrawal (32.4 %) and the rest is facing the problem with SVHC by either developing safer alternatives (22.1% OBS) or moving to existing ones (16 % OBS). A share of 6.3 % already has started to prepare the probable next step in the authorisation process and is preparing for an application to get an authorisation.
The withdrawal from the market of candidate substances seems not to be the usual reaction to listing because a large share of businesses does not have any experience with this. If they can, the main reaction is to find alternatives either by procuring existing alternatives or by initiating related research for new alternatives. Moving activities to non-EU areas is even less chosen an option than preparing an application for authorisation. The latter seems to be especially an option for suppliers of articles.
4.7.6 Conclusions and recommendations
A database should be set up that presents different provisions on a substance level (this demand was also formulated during the REACH review 2012 and has lately been renewed by some industry associations.
Based on the interviews and the surveys, the following can be concluded with regard to the REACH effects on DUs:
1) Many companies, in particular SMEs and firms which have not been involved in chemicals legislation in the past, are still not aware of their roles, obligations and tasks under REACH
2) Investments have been made to build up competence and resources to implement REACH obligations
3) Most DUs compensated the loss of a substance supplier by identifying an alternative supplier, identifying alternative substances (with the help of the supplier) or by changing the design of the own products.
4) Complete substance withdrawal from the market due to the cease of import or manufacture is not a major issue for DUs, yet.
5) Communication of eSDS is still not fully implemented, in particular formulators appear not yet to forward information on the safe conditions of use of mixtures.
6) The candidate list has several effects on DU businesses:
listing triggers supply chain communication on the SVHC content in articles and initiates substitution activities at all supply chain levels;
however substance replacement usually draws from existing substances rather than the development of new alternatives
and takes account of the regulatory status of alternatives rather than of their hazard profile
7) Article 7 and Article 33 appear not to be well implemented, in particular suffering from low credibility of supply chain communication with non-EU suppliers.
49 Formulation of mixtures, production of articles
Monitoring Impacts of REACH on Innovation, Competitiveness and SMEs – Draft Interim Report
Section 4 – Findings
83
This leads to the following recommendations:
1) All actors should focus awareness raising campaigns to DU SMEs and sectors with little awareness on their chemicals use and convey basic REACH knowledge on roles and obligations in the first place.
2) Support activities should also be directed to the implementation of substitution / alternatives assessment to ensure that both substance withdrawal and candidate listing / authorisation of SVHC can be compensated in the supply chains
3) Enforcement activities may be initiated targeting the development and supply of eSDS to create more incentives for DUs to communicate safe conditions of use along the supply chain and reach chemicals’ end-users.
4) There are several legal acts with requirements on (hazardous) substances. Especially DU often do not only have to follow REACH but have to fulfil other product related laws. Therefore a database should be set up that presents different provisions on a substance level (this demand was also formulated during the REACH review 2012 and has lately been renewed by some industry associations.
.
.

Monitoring Impacts of REACH on Innovation, Competitiveness and SMEs – Draft Interim Report
Section 4 – Findings
84
4.8 Objective 8 – Innovation
4.8.1 Introduction
The aim of this section on innovation is to consider the ways in which the REACH Regulation has been both a driver and a constraint to innovation. As regards driving innovation – drivers are identified and assessed. In particular, evidence of substitution mechanisms (e.g. Restrictions, Candidate List, Annex XIV, Authorisation conditions etc.) as well as intelligence gathered through registration and supply chain communication is described along with their potential economic impacts or benefits. As regards hindering innovation, evidence is gathered and analysed. Best practices are to be identified and assessed from the perspective of relative abilities of SMEs in capitalisation on the new opportunities created by REACH.
At the outset it should be noted that the term “innovation” can mean different things to different people, which can lead to some misunderstanding between those discussing the issue. From a formal point of view to is possible to define innovation as “an innovation is the implementation of a new or significantly improved product (good or service), or process, a new marketing method, or a new organisational method in business practices, workplace organisation or external relations.”50 In practice, there may be different views as to whether a given change in response regulatory demands is actually an innovation. For industry innovation is related to market demand - new products or services, profitability and market share - rather than regulatory compliance (although the two might correspond, but not necessarily). The discussion of innovation is also very closely linked with that of competitiveness above (section 4.2).
4.8.2 REACH and innovation – an overview
One of the key factors underlying the Regulation has been the aim of encouraging innovation, and in particular in relation to the placing of new or reformulated substances on the market that are safer and less hazardous than substances already on the market (product innovation). REACH might be expected to also promote other forms of innovation (process, organisational).
In general, MSCAs did not have a great deal to report as regards the relationship between REACH and innovation. Some were aware of anecdotal evidence that businesses that had had problems finding substitutes for substances, and some had taken up the general competitive challenges of particular industries, but they were generally of the view that innovative matters should be taken up with individual firms.
50 OECD/ European Commission (2005); Oslo Manual. Guidelines for collecting and interpreting innovation data, p.46. This definition encompasses:(i) product innovation: introduction of a good or service that is new or significantly improved with reference to its characteristics or intended uses. This includes significant improvements in technical specifications, components and materials, incorporated software, user friendliness or other functional characteristics; (ii) process innovation: implementation of a new or significantly improved production or delivery method. This includes significant changes in techniques, equipment and/ or software; (iii) marketing innovation: implementation of a new marketing method involving significant changes in product designs or packaging, product placements, product promotion or pricing; and,(iv) organisational innovation: implementation of a new organisational method in the firm’s business practices, workplace organisation or external relations. This approach also underlies the Community Innovation Surveys

Monitoring Impacts of REACH on Innovation, Competitiveness and SMEs – Draft Interim Report
Section 4 – Findings
85
Industry representatives often had highly developed views. In general they said that the effects of REACH on innovation have tended to depend on the REACH role in question. For example, distributors are not directly affected. Industry sector is also a factor, for example there might be less dyes available for the leather and textiles industries as a result of registration costs which can lead to a reduction in product range. For enterprises or sectors that use substances that have been targeted through the candidate list and authorisation it may either lead to increased R&D as enterprise search for substitutes, or it can lead to uncertainty and potentially reduced investment in R&D and innovation for several years. The overall view is that REACH has detracted enterprises from R&D and innovation.
A good many industry representatives mentioned that REACH had fostered better practices, usually with respect to improved communication in the supply chain, which has produced more transparency across industry sectors. There has also been more attention paid to chemical risk and safe use of chemicals, especially among downstream users. However, it was also pointed out that these had not brought material benefits to companies, just costs, and in many companies HSE practices were already at a very high level and the appearance of REACH had not affected them. Nor had the development of and access to some of the key REACH tools (e.g. SDS, CSR, etc.) had a significant impact on innovation. Some considered SDSs were too technical to be understood by many companies, while sometimes there were no real alternatives to substances in use, or if there were, they were not as good or substantially more expensive.
The relationship between a substance being identified as a SVHC and R&D funding and innovation is complex and depends on the substance in question. For high value added substances, such as the cobalt compounds, there might be increased expenditure on R&D. Others, such as arsenic by-products, may just be withdrawn. It also depends on whether substitutes exist or not. Where they do not, research might be less and companies just apply for authorisation. In some industries that use substances such as lead, where there is uncertainty as to whether related possible alternative substances might not also be added to the candidate list, it may hinder investment. The case of industrial gases as also mentioned, where placing a substance on the candidate list for several years before a decision is made can blight investors’ interest in the sector.
Industry representatives said that it was proving difficult, as expected, to find substitutes for some substances on the candidate list, such as those used in coatings and lubricants. Specific substances mentioned were the chromates, lead, dimethylformamide and beryllium. The processes and data within REACH were not of particular use in such searches. For other substances substitutes were more readily available.
As to the question whether REACH had, overall, provided the appropriate incentives for, or constrained, innovation, the view among industry representatives tended to be that maybe in the long term there would be positive results, but for the time being the compliance aspect was predominant. However, REACH does encourage companies to consider options that do not include SVHCs.
At the enterprise level, firms were asked to consider whether the implementation of REACH supported innovation and created new business opportunities. CATI survey responses show that the implementation of REACH is linked with increased R&D activity (around 26.3% stated so) – and in particular for 43.6% of formulators and 30.4% of manufacturers, and the launch of new products (22.4%). However, the results are substantially higher as regards the development of new knowledge and understanding in relation to the properties of substances and the better understanding of the supply chain. Furthermore, there are improved risk management procedures

Monitoring Impacts of REACH on Innovation, Competitiveness and SMEs – Draft Interim Report
Section 4 – Findings
86
arising (more than half of respondents (54.5%) reported this result, in particular for the end users and formulators.
Table 4.8.1: How has the implementation of the REACH Regulation encouraged innovation and created new business opportunities for your firm (percentage of firms responding)?
Forms of contribution to innovation
Manufacturers
Formulators
Distributors Importers Suppliers of articles
End users
All firms
Led to Increased Research and Development activity
30.35 43.60 11.04 16.67 23.08 16.67 26.3
Through increased levels of knowledge in relation to the properties and/or the possible uses of chemical substances
48.28 54.47 49.67 50.00 44.26 39.47 47.8
Through increased awareness of the needs of our suppliers/customers
43.84 45.93 40.76 38.33 43.95 34.21 42.2
Through collaboration with downstream members of the supply chain
47.26 47.15 43.23 41.67 44.67 28.76 43.1
We launched and are commercialising products/ services as result of knowledge gained through compliance
16.00 32.93 24.03 22.03 19.43 16.99 22.4
Improved risk management procedures in your business
51.23 62.35 45.16 51.67 51.20 62.09 54.5
Improved management of environmental emissions and waste.
30.85 38.55 34.67 40.00 36.55 49.67 37.7
n 201 249 150 60 249 153 1062
Source: CATI survey
The responses from the OBS indicated a markedly lower result than the CATI in the case of R&D activity and launch and commercialisation of new products and services (8% compared to 26.3% for R&D and 17.4% compared to 22.4% for commercialisation of new products), and also as compared to other impacts, but the percentages are markedly lower than in the case of the CATI survey.
When comparing the differences between the survey results it is worth bearing in mind that the CATI is undertaken under a good deal of time pressure with a relatively unknown cold-caller whereas the OBS was a voluntary self-completion survey by an interested party. Each has advantages and disadvantages – neither is perfect.

Monitoring Impacts of REACH on Innovation, Competitiveness and SMEs – Draft Interim Report
Section 4 – Findings
87
Table 4.8.2: How has the introduction of REACH Regulation affected the following aspects of your firm's operation? (Percentage of firms indicating a positive or very positive impact)
Forms of contribution to innovation
Manufacturers
Formulators
Distributors
Importers
Suppliers of articles
End users
All firms
Research and Development budget
6.7 12.5 0.0 2.7 0.0 16.4 8.0
Levels of knowledge in relation to the content of chemical substances, their properties and/or their possible uses
65.1 80.9 60.7 48.7 67.7 77.1 67.9
Collaboration with suppliers
39.4 47.9 59.3 32.4 38.7 52.9 44.4
Through increased awareness of the needs of our suppliers
45.4 60.9 50.0 39.5 45.2 55.7 49.5
Collaboration with downstream supply chains
38.0 44.7 32.1 26.3 22.6 25.4 32.9
Development of new products and services
12.3 35.4 10.7 7.7 12.9 22.9 17.4
Improved risk management procedures in your business
36.1 48.9 37.0 28.2 29.0 51.4 39.8
Improved management of environmental emissions and waste.
20.8 31.3 18.5 10.3 9.7 35.7 23.1
n 105 48 24 37 30 67 311
4.8.3 REACH as a driver of and barrier to innovation
In the following paragraphs the role of REACH is considered from the point of view of specific REACH processes and mechanisms: the response to registration (costs); and the substitution mechanisms within REACH – the candidate list, authorisation and restriction. Then the role of intelligence gathered through supply chain communication is assessed.
Responses to Registration Costs
Registration can drive innovation in two ways: through the effect of registration costs and through the knowledge gained from registration processes. The first of these will be discussed here, the second below. Registration costs can lead to firms deciding to withdraw the substance if they do not want to register as it is considered uneconomic. This can lead to that firm developing substitute products, or using alternatives already on the market (reformulating). The firm may also just buy the substance from another company that has registered, if that is cheaper. It can have the same consequences on downstream users.
Among the responses to registration cost were: the removal of products, registration as an intermediate; and not registering due to the hazard profile of the substance. Between the CATI and the OBS about 30-40% of respondents indicated that they had undertaken such activities, all of which might trigger innovation and R&D . Some companies also opted to import the substance themselves, switched to an alternative available, and changed manufacturing processes.

Monitoring Impacts of REACH on Innovation, Competitiveness and SMEs – Draft Interim Report
Section 4 – Findings
88
Table 4.8.3 What was the response of your firm to the costs associated with the 2013 REACH Registration? (percentage of firms indicating how frequently each response applied)
Response Never Very rarely
Occasionally
Frequently
Very frequently
Not applicable
Total n=
Altered production to register a substance in a lower tonnage band to save money on the costs of Registration
36.4 8.5 11.9 2.8 38.6 1.7 100 176
Registered as an intermediate only
34.3 9.5 9.5 3.6 40.8 2.4 100 169
Removed products from portfolio because they are towards the end of their profitable life and it was sensible to rationalise our portfolio
33.3 5.2 14.4 6.3 39.1 1.7 100 147
Hazard profile of the substances meant that registration was not worth pursuing
36.6 7.4 6.9 3.4 41.7 4 100 175
Source: Online Business Survey
Responses to Registration Costs – Withdrawal of Substances
One of the possible responses to costs is to withdraw substances from portfolios. Respondents to the Business Survey were asked whether substances have been withdrawn and what the responses/implications have been. 31% said they had experienced withdrawals subsequent to registration 2013 (OBS). Those who indicated that they had experienced withdrawals were asked what their response had been. Table 4.8.4 sets out responses by firm size category.
Table 4.8.4 If any of the substances that you used or placed in the market in the past have been withdrawn as a result of the 2013 registration requirements, what was the response of your firm to the withdrawal of a substance? (Percentage of firms indicating by frequency and size)
Options
Never Rarely Occasionally
Frequently Very frequently
Not applicable
SME
Large
SME
Large
SME
Large
SME
Large
SME
Large
SME
Large
We switched to an alternative readily available from our supplier
6 0 13 19 25 34 15 28 12 3 10 6
We have decided to import the substance for our own use
40 34 4 16 6 13 4 0 2 0 19 22
We carried out research to identify an alternative and changed our supplier
8 3 6 25 25 31 21 22 15 0 8 6
We changed our manufacturing processes so that we no longer need the substance or an alternative
21 19 15 16 15 16 10 13 4 0 12 22
We stopped producing the products that required the withdrawn substance
17 22 13 19 13 19 13 3 13 3 12 25

Monitoring Impacts of REACH on Innovation, Competitiveness and SMEs – Draft Interim Report
Section 4 – Findings
89
We stopped producing the products that required the withdrawn substance in the EU and shifted these activities to sites outside the EU
44 34 2 3 6 9 2 3 2 3 21 28
n= SME=52
Large=32
Source: Online Business Survey
The most frequently adopted approach was to switch to an alternative that they were already aware of and switched supplier, or to carry out research and then switch to a new supplier. There was also some changing of manufacturing processes.
REACH Registration withdrawal and its impact on innovation for Downstream Users.
One of the possible implications of the REACH registration process is the decision of manufacturers/importers to withdraw products from the market. In total, 16% of downstream users indicated that they had experienced a withdrawal. However, this was 32% among formulators and much less among end users (5%) or suppliers of articles (8.4%). Nonetheless, among those firms, REACH could have important implications for the firms using and could potentially operate as a driver of innovation.
Among firms with downstream user roles that respon ded to the CATI survey and had experienced a substance withdrawal, 50.4% reported that they carried out research to identify an alternative substance (mainly the suppliers of articles and formulators did that). In addition 24% indicated that they changed their manufacturing processes so that they no longer needed the substance.
Table 4.8.5 What was the response of your firm to the withdrawal of a substance by your supplier? (percentage of downstream users that experience a substance withdrawal responding)
Action taken Formulators Distributors Suppliers of articles
End users
All firms
We carried out research to identify an alternative substance
60.0 14.3 61.9 14.3 50.4
We changed our manufacturing processes so that we no longer need the substance
31.3 0 28.6 0.0 24.0
n 21 7 80 21 129
Source: CATI survey
The on-line survey produced similar results as regards all firms with 62.2% of firms indicating that they carried out research to identify an alternative substance, and a third saying that they changed their manufacturing process to avoid the need to use the substance withdrawn. There were also high percentages for the formulators and the suppliers of articles in the case of research, although in the business survey other roles also evidenced high levels as compared to the CATI, namely importers and, to an extent, end users. As regards changes in manufacturing processes there was a more even distribution of responses except in the case of manufacturers where a high response was recorded.
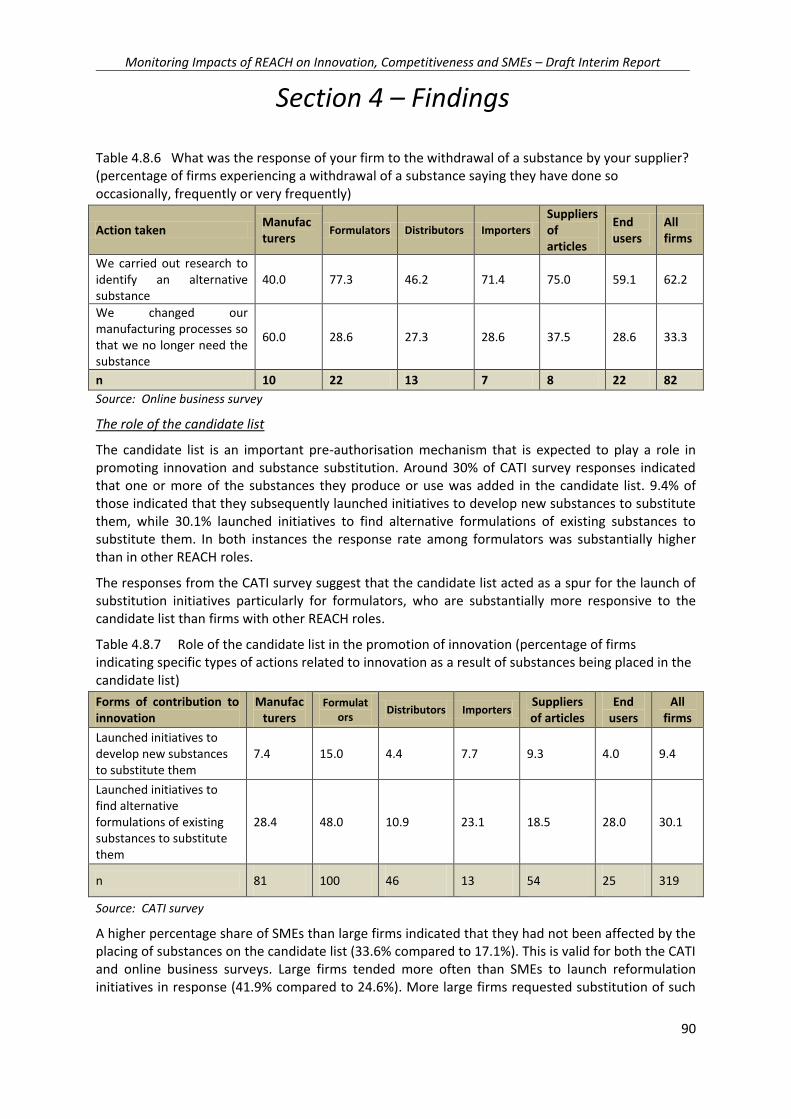
Monitoring Impacts of REACH on Innovation, Competitiveness and SMEs – Draft Interim Report
Section 4 – Findings
90
Table 4.8.6 What was the response of your firm to the withdrawal of a substance by your supplier? (percentage of firms experiencing a withdrawal of a substance saying they have done so occasionally, frequently or very frequently)
Action taken Manufacturers
Formulators Distributors Importers
Suppliers of articles
End users
All firms
We carried out research to identify an alternative substance
40.0 77.3 46.2 71.4 75.0 59.1 62.2
We changed our manufacturing processes so that we no longer need the substance
60.0 28.6 27.3 28.6 37.5 28.6 33.3
n 10 22 13 7 8 22 82
Source: Online business survey
The role of the candidate list
The candidate list is an important pre-authorisation mechanism that is expected to play a role in promoting innovation and substance substitution. Around 30% of CATI survey responses indicated that one or more of the substances they produce or use was added in the candidate list. 9.4% of those indicated that they subsequently launched initiatives to develop new substances to substitute them, while 30.1% launched initiatives to find alternative formulations of existing substances to substitute them. In both instances the response rate among formulators was substantially higher than in other REACH roles.
The responses from the CATI survey suggest that the candidate list acted as a spur for the launch of substitution initiatives particularly for formulators, who are substantially more responsive to the candidate list than firms with other REACH roles.
Table 4.8.7 Role of the candidate list in the promotion of innovation (percentage of firms indicating specific types of actions related to innovation as a result of substances being placed in the candidate list)
Forms of contribution to innovation
Manufacturers
Formulators
Distributors Importers Suppliers of articles
End users
All firms
Launched initiatives to develop new substances to substitute them
7.4 15.0 4.4 7.7 9.3 4.0 9.4
Launched initiatives to find alternative formulations of existing substances to substitute them
28.4 48.0 10.9 23.1 18.5 28.0 30.1
n 81 100 46 13 54 25 319
Source: CATI survey
A higher percentage share of SMEs than large firms indicated that they had not been affected by the placing of substances on the candidate list (33.6% compared to 17.1%). This is valid for both the CATI and online business surveys. Large firms tended more often than SMEs to launch reformulation initiatives in response (41.9% compared to 24.6%). More large firms requested substitution of such
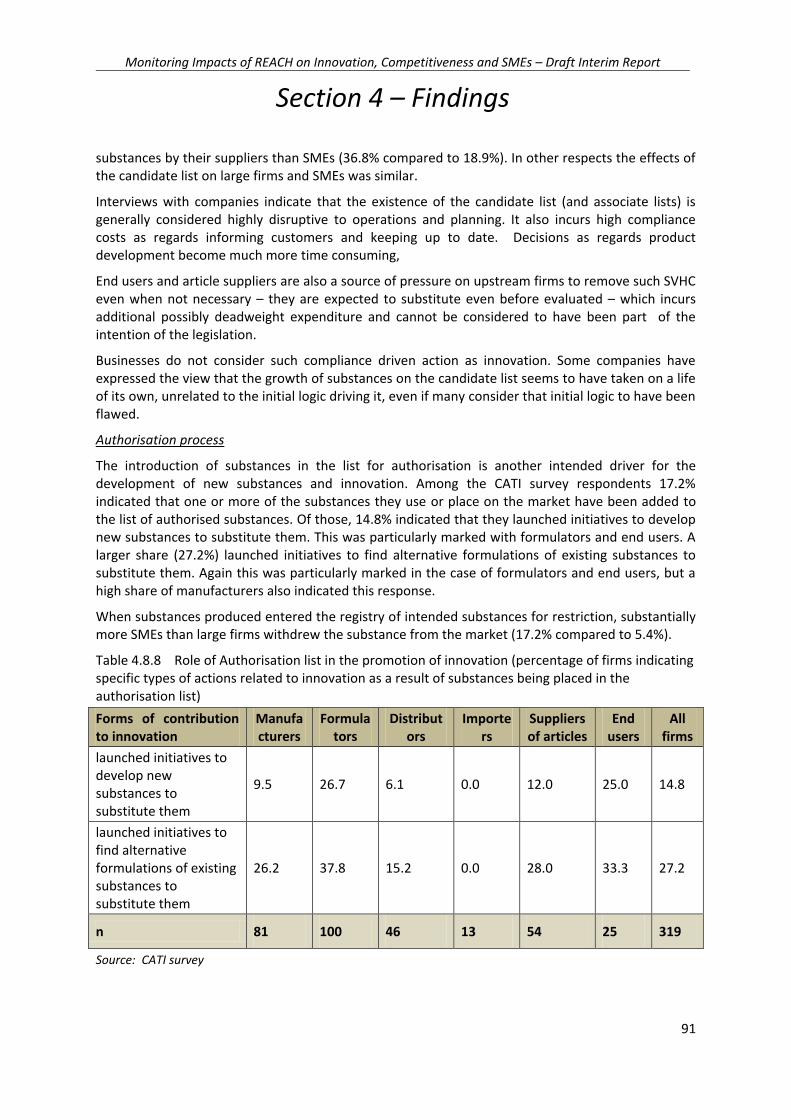
Monitoring Impacts of REACH on Innovation, Competitiveness and SMEs – Draft Interim Report
Section 4 – Findings
91
substances by their suppliers than SMEs (36.8% compared to 18.9%). In other respects the effects of the candidate list on large firms and SMEs was similar.
Interviews with companies indicate that the existence of the candidate list (and associate lists) is generally considered highly disruptive to operations and planning. It also incurs high compliance costs as regards informing customers and keeping up to date. Decisions as regards product development become much more time consuming,
End users and article suppliers are also a source of pressure on upstream firms to remove such SVHC even when not necessary – they are expected to substitute even before evaluated – which incurs additional possibly deadweight expenditure and cannot be considered to have been part of the intention of the legislation.
Businesses do not consider such compliance driven action as innovation. Some companies have expressed the view that the growth of substances on the candidate list seems to have taken on a life of its own, unrelated to the initial logic driving it, even if many consider that initial logic to have been flawed.
Authorisation process
The introduction of substances in the list for authorisation is another intended driver for the development of new substances and innovation. Among the CATI survey respondents 17.2% indicated that one or more of the substances they use or place on the market have been added to the list of authorised substances. Of those, 14.8% indicated that they launched initiatives to develop new substances to substitute them. This was particularly marked with formulators and end users. A larger share (27.2%) launched initiatives to find alternative formulations of existing substances to substitute them. Again this was particularly marked in the case of formulators and end users, but a high share of manufacturers also indicated this response.
When substances produced entered the registry of intended substances for restriction, substantially more SMEs than large firms withdrew the substance from the market (17.2% compared to 5.4%).
Table 4.8.8 Role of Authorisation list in the promotion of innovation (percentage of firms indicating specific types of actions related to innovation as a result of substances being placed in the authorisation list)
Forms of contribution to innovation
Manufacturers
Formulators
Distributors
Importers
Suppliers of articles
End users
All firms
launched initiatives to develop new substances to substitute them
9.5 26.7 6.1 0.0 12.0 25.0 14.8
launched initiatives to find alternative formulations of existing substances to substitute them
26.2 37.8 15.2 0.0 28.0 33.3 27.2
n 81 100 46 13 54 25 319
Source: CATI survey

Monitoring Impacts of REACH on Innovation, Competitiveness and SMEs – Draft Interim Report
Section 4 – Findings
92
A higher percentage of SMEs than large firms said they are not affected by authorisation (37.7% compared to 29.1%), and overall, for all possible options as a result of authorisation, large firms indicated a higher response, except for “no action taken” (OBS).
The first cases for authorisation have been decided and the authorities consider this to have been a learning experience for all concerned. Their b=view is that it cost much more and was generally more disruptive for the industry than was necessary, and hope that for the future lessons will be learnt. They are also working with applicants t try and reduce the cost. The view is that authorisation will be allowed if there is a good case for it.
Companies faced with authorisation still see this as a very costly exercise, unnecessary if they are already taking the necessary risk reduction measures, that creates a lot o uncertainty as even if granted it is not always sure that all uses will be covered, and if DUs will be supplied by those with authorisation, or what the effect will be on future prices as suppliers will be expected to recover cost some way or another. Hence, no wonder, the relocation, even if admittedly only a handful, of some businesses that use SVHC to locations outside the EU as reported in the surveys.
For SMEs this can be extremely demanding in terms of management time and costs, especially if expensive R&D is carried out only to prove to the authorities that other avenues have been considered but in the end authorisation is granted.
Having said that, there are instances where under the pressure of authorisation alternative substances have been developed.
Product and Process Oriented Research and Development (PPORD)
The introduction of exemptions from REACH related obligations in the case of Product and Process Oriented Research and Development was among one of the mechanisms directly targeting the promotion of R&D and innovation. 9.3% of respondents indicated that they had made use of PPORDs (primarily manufacturers and formulators).
Table 4.8.9 Has your firm applied for Product and Process Oriented Research and Development (PPORD) exemptions (percentage of respondents indicating)?
Sources of information Manufacturers
Formulators
Distributors
Importers
Suppliers of articles
End users
All firms
Firms that have made use of PPORD exemptions 13.5 9.5 0.0 2.8 0.0 7.1 9.3
n 111 21 14 36 8 14 204
Source: Online business survey
The Steering Group has requested up to date data from ECHA on this. In the previous Innovation study (CSES study)51 311 of the 719 PPORD issued between 2008 and 2011 had gone to German
51 CSES (2012); Interim Evaluation: Impact of the REACH regulation on the innovativeness of the EU chemical Industry, Annexes - Case Studies.
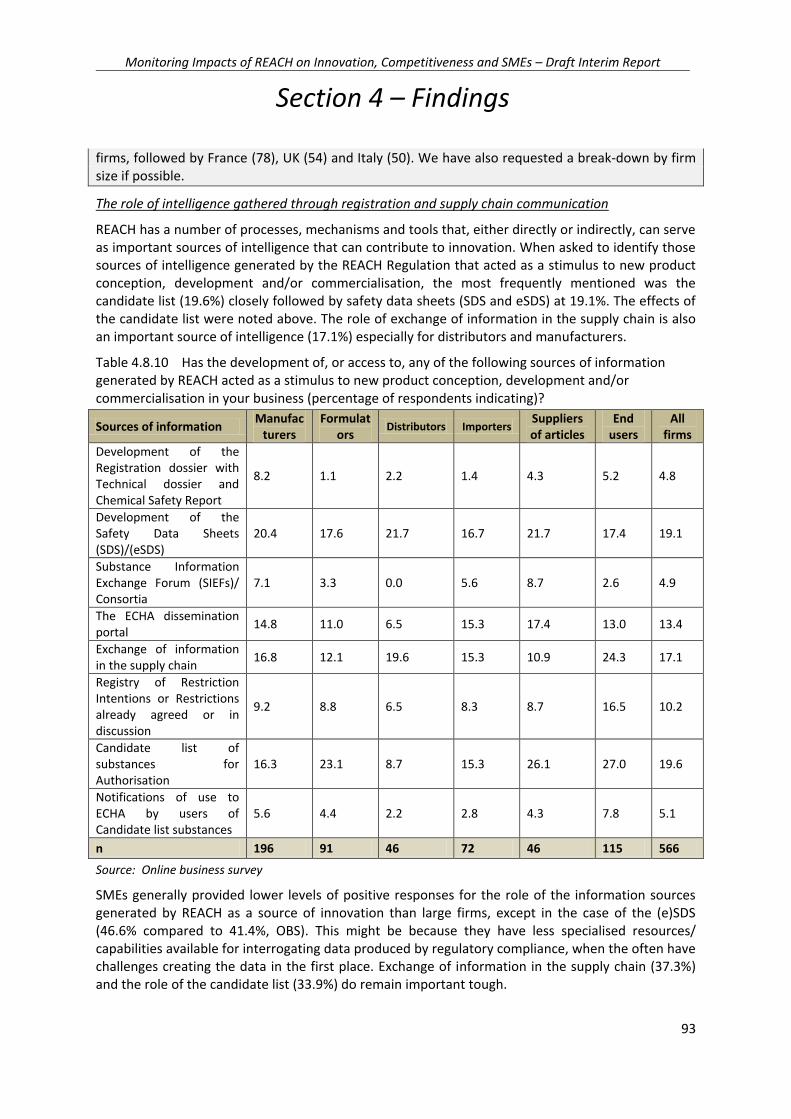
Monitoring Impacts of REACH on Innovation, Competitiveness and SMEs – Draft Interim Report
Section 4 – Findings
93
firms, followed by France (78), UK (54) and Italy (50). We have also requested a break-down by firm size if possible.
The role of intelligence gathered through registration and supply chain communication
REACH has a number of processes, mechanisms and tools that, either directly or indirectly, can serve as important sources of intelligence that can contribute to innovation. When asked to identify those sources of intelligence generated by the REACH Regulation that acted as a stimulus to new product conception, development and/or commercialisation, the most frequently mentioned was the candidate list (19.6%) closely followed by safety data sheets (SDS and eSDS) at 19.1%. The effects of the candidate list were noted above. The role of exchange of information in the supply chain is also an important source of intelligence (17.1%) especially for distributors and manufacturers.
Table 4.8.10 Has the development of, or access to, any of the following sources of information generated by REACH acted as a stimulus to new product conception, development and/or commercialisation in your business (percentage of respondents indicating)?
Sources of information Manufac
turers Formulat
ors Distributors Importers
Suppliers of articles
End users
All firms
Development of the Registration dossier with Technical dossier and Chemical Safety Report
8.2 1.1 2.2 1.4 4.3 5.2 4.8
Development of the Safety Data Sheets (SDS)/(eSDS)
20.4 17.6 21.7 16.7 21.7 17.4 19.1
Substance Information Exchange Forum (SIEFs)/ Consortia
7.1 3.3 0.0 5.6 8.7 2.6 4.9
The ECHA dissemination portal
14.8 11.0 6.5 15.3 17.4 13.0 13.4
Exchange of information in the supply chain
16.8 12.1 19.6 15.3 10.9 24.3 17.1
Registry of Restriction Intentions or Restrictions already agreed or in discussion
9.2 8.8 6.5 8.3 8.7 16.5 10.2
Candidate list of substances for Authorisation
16.3 23.1 8.7 15.3 26.1 27.0 19.6
Notifications of use to ECHA by users of Candidate list substances
5.6 4.4 2.2 2.8 4.3 7.8 5.1
n 196 91 46 72 46 115 566
Source: Online business survey
SMEs generally provided lower levels of positive responses for the role of the information sources generated by REACH as a source of innovation than large firms, except in the case of the (e)SDS (46.6% compared to 41.4%, OBS). This might be because they have less specialised resources/ capabilities available for interrogating data produced by regulatory compliance, when the often have challenges creating the data in the first place. Exchange of information in the supply chain (37.3%) and the role of the candidate list (33.9%) do remain important tough.
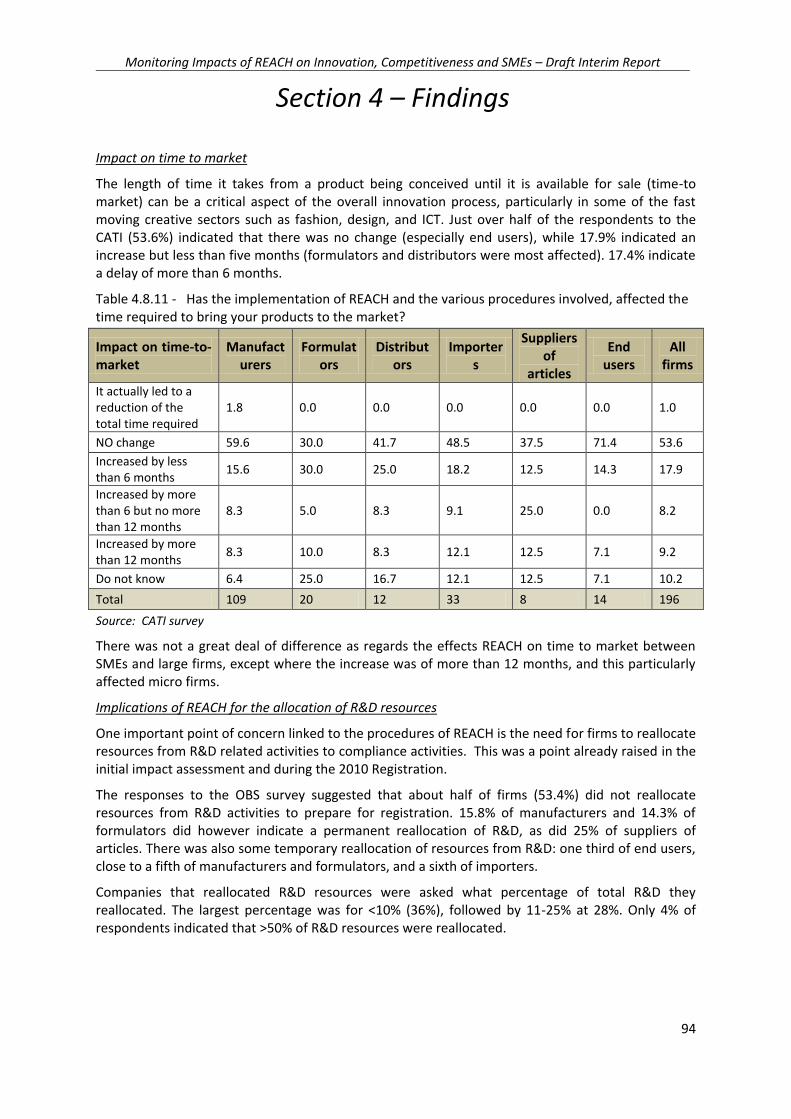
Monitoring Impacts of REACH on Innovation, Competitiveness and SMEs – Draft Interim Report
Section 4 – Findings
94
Impact on time to market
The length of time it takes from a product being conceived until it is available for sale (time-to market) can be a critical aspect of the overall innovation process, particularly in some of the fast moving creative sectors such as fashion, design, and ICT. Just over half of the respondents to the CATI (53.6%) indicated that there was no change (especially end users), while 17.9% indicated an increase but less than five months (formulators and distributors were most affected). 17.4% indicate a delay of more than 6 months.
Table 4.8.11 - Has the implementation of REACH and the various procedures involved, affected the time required to bring your products to the market?
Impact on time-to- market
Manufacturers
Formulators
Distributors
Importers
Suppliers of
articles
End users
All firms
It actually led to a reduction of the total time required
1.8 0.0 0.0 0.0 0.0 0.0 1.0
NO change 59.6 30.0 41.7 48.5 37.5 71.4 53.6
Increased by less than 6 months
15.6 30.0 25.0 18.2 12.5 14.3 17.9
Increased by more than 6 but no more than 12 months
8.3 5.0 8.3 9.1 25.0 0.0 8.2
Increased by more than 12 months
8.3 10.0 8.3 12.1 12.5 7.1 9.2
Do not know 6.4 25.0 16.7 12.1 12.5 7.1 10.2
Total 109 20 12 33 8 14 196
Source: CATI survey
There was not a great deal of difference as regards the effects REACH on time to market between SMEs and large firms, except where the increase was of more than 12 months, and this particularly affected micro firms.
Implications of REACH for the allocation of R&D resources
One important point of concern linked to the procedures of REACH is the need for firms to reallocate resources from R&D related activities to compliance activities. This was a point already raised in the initial impact assessment and during the 2010 Registration.
The responses to the OBS survey suggested that about half of firms (53.4%) did not reallocate resources from R&D activities to prepare for registration. 15.8% of manufacturers and 14.3% of formulators did however indicate a permanent reallocation of R&D, as did 25% of suppliers of articles. There was also some temporary reallocation of resources from R&D: one third of end users, close to a fifth of manufacturers and formulators, and a sixth of importers.
Companies that reallocated R&D resources were asked what percentage of total R&D they reallocated. The largest percentage was for <10% (36%), followed by 11-25% at 28%. Only 4% of respondents indicated that >50% of R&D resources were reallocated.
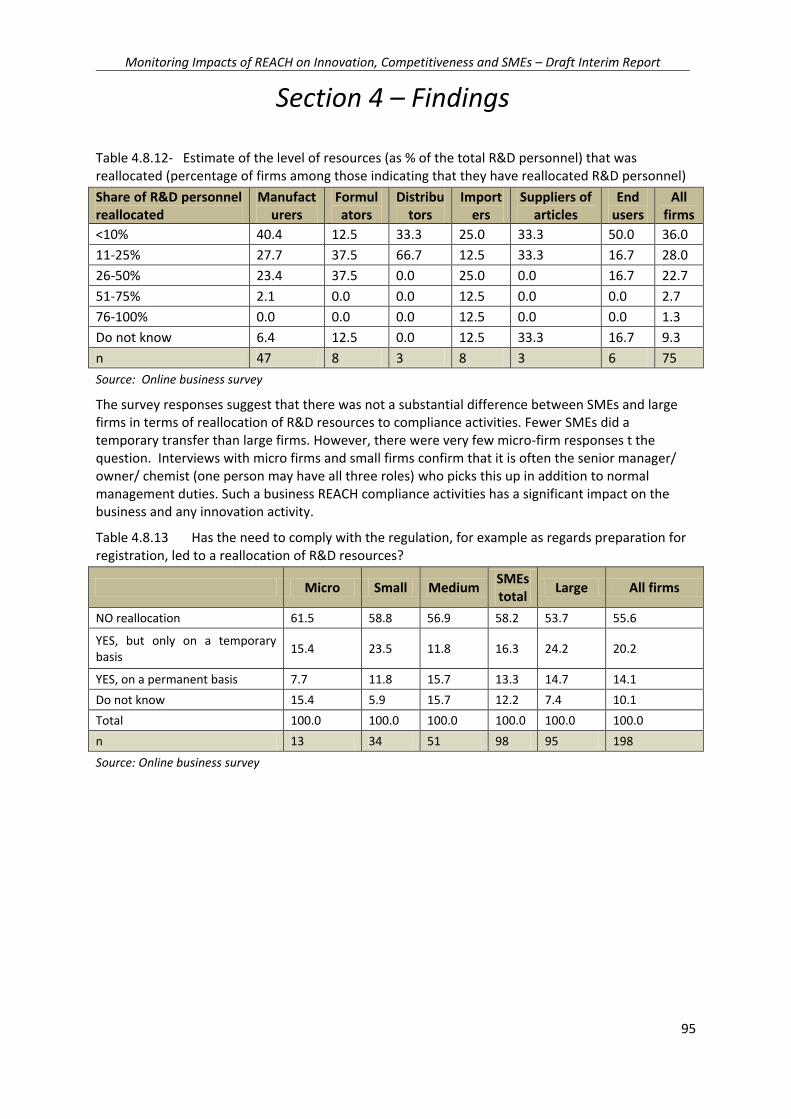
Monitoring Impacts of REACH on Innovation, Competitiveness and SMEs – Draft Interim Report
Section 4 – Findings
95
Table 4.8.12- Estimate of the level of resources (as % of the total R&D personnel) that was reallocated (percentage of firms among those indicating that they have reallocated R&D personnel)
Share of R&D personnel reallocated
Manufacturers
Formulators
Distributors
Importers
Suppliers of articles
End users
All firms
<10% 40.4 12.5 33.3 25.0 33.3 50.0 36.0
11-25% 27.7 37.5 66.7 12.5 33.3 16.7 28.0
26-50% 23.4 37.5 0.0 25.0 0.0 16.7 22.7
51-75% 2.1 0.0 0.0 12.5 0.0 0.0 2.7
76-100% 0.0 0.0 0.0 12.5 0.0 0.0 1.3
Do not know 6.4 12.5 0.0 12.5 33.3 16.7 9.3
n 47 8 3 8 3 6 75
Source: Online business survey
The survey responses suggest that there was not a substantial difference between SMEs and large firms in terms of reallocation of R&D resources to compliance activities. Fewer SMEs did a temporary transfer than large firms. However, there were very few micro-firm responses t the question. Interviews with micro firms and small firms confirm that it is often the senior manager/ owner/ chemist (one person may have all three roles) who picks this up in addition to normal management duties. Such a business REACH compliance activities has a significant impact on the business and any innovation activity.
Table 4.8.13 Has the need to comply with the regulation, for example as regards preparation for registration, led to a reallocation of R&D resources?
Micro Small Medium SMEs total
Large All firms
NO reallocation 61.5 58.8 56.9 58.2 53.7 55.6
YES, but only on a temporary basis
15.4 23.5 11.8 16.3 24.2 20.2
YES, on a permanent basis 7.7 11.8 15.7 13.3 14.7 14.1
Do not know 15.4 5.9 15.7 12.2 7.4 10.1
Total 100.0 100.0 100.0 100.0 100.0 100.0
n 13 34 51 98 95 198
Source: Online business survey
Monitoring Impacts of REACH on Innovation, Competitiveness and SMEs – Draft Interim Report
Section 4 – Findings
96
4.8.4 Best practices identified and assessed from the perspective of relative abilities of SMEs in capitalisation on the new opportunities created by REACH.
Some attention has been devoted to this question in section 4.4. However, to date not many good practices have been identified for SMEs to capitalise on opportunities provided by REACH. The opportunities provided might include: export to new EU markets with an EU registration number; export outside of the EU with a REACH-compliant product; supplying an EU buyer whose non-EU supplier has not registered; buying another SME who is not able to or want to meet REACH compliance requirements and as a result wants to sell and withdraw from the business; and then there is a host a host regulatory activities to be performed in the industry which could help individual or groups of firms but will add costs to the operation of the industry overall.
Those SMEs that have looked further into new opportunities and developed them have often done so in collaboration with industry association initiatives, or other public sector funding support.

Monitoring Impacts of REACH on Innovation, Competitiveness and SMEs – Draft Interim Report
Section 4 – Findings
97
4.9 Objective 9 - Human Resources and Consultants
4.9.1 Introduction
The aims of this section are: to assess the availability of adequately qualified persons to deal with REACH at company level, including issues such as REACH jobs market saturation, level of skills as well as transparency and ease of assessing the qualification and performance of consultants and/or internal staff; to examine constraints for SMEs for both acquiring highly qualified internal human capacities and/or adequately externalizing REACH processes to consultant services should be examined; and to consider the offer of education programmes most appropriate to acquire the necessary skills and the practice of REACH professionals in documenting their skills and their trans-border recognition.
4.9.1 Stakeholder views on availability
Some 40% of Member State authorities/ Help Desks interviewed said that that they thought there is adequate availability of appropriate human resources and 50% said that the same was true as regards appropriate external resources (primarily consultants). Industry representatives are more supportive – over 60% indicating that the available human resources and external support are of adequate quality.
The less positive view of MS authorities/ Help Desks may be because they come into contact more often with smaller firms, whereas industry representatives tend to deal with larger enterprises. This is also an area where there seems to be a good deal of variation between MS – often smaller MS with smaller and less developed or complex chemical industries have more issues about supply of specialised staff, consultants and training or educational courses in the national language. They also generally point out that when good consultants are available they come at a price that often presents a cost issue for smaller firms as they can be expensive from a small firm point of view. While MS authorities are not in a position to comment on quality of local/ national consultants, several (again, mainly in smaller MS) have said they have been approached by SMEs asking for a list of “reputable” or “accredited” consultants, which they do not have and cannot provide.
Industry representatives are also aware of the cost issue related to availability and confirm that larger companies can afford external consultants more readily, and also invest in internal training and employment of specialists, whereas in a micro-firm the company chemist might well be (or, is probably) in charge of both dealing with REACH obligations and R&D, and the additional cost of dealing with an external specialist is a significant financial burden. Those companies and individuals who have been working with REACH since 2007 or even earlier have developed a high level of expertise and larger firms do not experience significant issues as regards supply of suitable staff. However, this also varies by Member State and not all are immune from such problems. Quality of external consultants can be an issue (especially in smaller MS), even if there is an advanced chemical industry) depending on the specialisation required and the level of specialisation in question. SMEs do experience issues related to cost and quality - although sometimes the Industry Association can provide support (e.g. ReachReady in the UK). Availability of training varies by country, and is not always available in the national language. Industry associations (and sometimes consortia) provide training – usually in the form of workshops, webinars and short courses.

Monitoring Impacts of REACH on Innovation, Competitiveness and SMEs – Draft Interim Report
Section 4 – Findings
98
4.9.2 How companies deal with REACH obligations
Organisation of REACH compliance activities
Dealing with REACH compliance activities can be a complicated and demanding process, and firms adopt different approaches, allocate varying levels of human resources and make different use of external support. According to the CATI survey, the development of a separate REACH unit or use of a dedicated REACH manager is an approach adopted by a significant number of firms, particularly among manufacturers and formulators (see table 4.9.1). It is less common among firms with other REACH roles, especially importers or end users. As expected, it is also less common among smaller firms (14%), in comparison to large firms (35%). Much more prevalent is the allocation of REACH compliance activities and responsibilities to the Health and Safety and Environment department/unit (50% of the firms). A large share of firms indicated that they deal with REACH related material on an ad-hoc basis, when and if needed. The use of external consultants to outsource REACH compliance activities is also common, particularly among manufacturers. However, only a small share indicated that they have fully outsourced them. Among SMEs, 18% indicated that they fully outsource their compliance activities.
Table 4.9.1 - How does your firm deal with REACH compliance activities? (percentage of firms responding – multiple responses possible)
Manufac
turers Formulators
Distributors
Importer
Suppliers of articles
End users
All firms
Dedicated REACH unit 35.0 27.1 13.3 8.3 14.7 14.4 20.8
Dedicated REACH manager 45.8 40.6 23.4 20.0 28.7 14.4 31.4
Dealt with by a team responsible for HSE compliance
57.1 62.9 51.3 56.7 51.4 66.0 57.5
Managers and technicians deal with REACH on an ad hoc basis
46.8 53.4 41.1 43.3 50.6 50.3 48.7
Partly outsourced REACH compliance activities
40.4 23.1 13.9 18.3 19.9 15.0 22.9
Fully outsourced REACH compliance activities
3.9 2.4 4.4 10.0 8.4 2.6 4.8
Other 7.9 6.4 10.8 10.0 8.4 11.8 8.7
N 203 251 158 60 251 153 1076
Source: CATI survey
Numbers of staff
In terms of the actual level of human resources allocated, the majority of the CATI survey respondents indicated that in 2013, they allocated between 1-2 FTE to REACH related activities. As expected, a greater share of large firms indicated more than 5 FTE, while an important share of micro firms (24%) indicated that their total FTE allocated was 0. There are small variations on the basis of the firms’ REACH role. Manufacturers and formulators tend to allocate more resources than downstream users, even though there are also some article suppliers and end users which also allocate significant resources. The data from the OBS – covering the period 2011-2014 – suggest a similar level of human resources allocated. However, there is a greater share of large firms (close to 35%) which indicated that have allocated more than 2 FTE.
In terms of evolution over time, the business survey responses provided show a small trend towards the increase of human resources allocated over time, with more firms indicating than they have
Monitoring Impacts of REACH on Innovation, Competitiveness and SMEs – Draft Interim Report
Section 4 – Findings
99
more than 2 FTE. An initial analysis suggests that this is mainly driven by the increased resources allocated by downstream users, article suppliers and end users.
4.9.3 The availability of adequately qualified persons.
As regards the availability of resources to deal with REACH at company level 37.4% of the CATI respondents consider that it is easy to fill REACH vacancies with the right people while 26.6% suggested that it was difficult. The analysis by firm size does not indicate any substantial differences but there are noticeable differences depending on the country where the firm operates. More than 50% of firms in the Netherlands, Spain, Sweden and Romania say that is easy while over 35% of respondents in Italy, France and Austria thought that it is difficult.
The online survey responses provide a more negative picture, with only a small share of firms indicating that filling REACH-related vacancies is easy or, at least, not more difficult than other positions. Important though is the finding that a large majority of firms (over 65%) prefer to train existing staff rather than recruit new external staff. Furthermore, around 20% suggested that they ended up spending additional resources to train staff recruited for REACH.
This has implications for the provision of training and education.
According to the CATI, as regards the availability and quality of external consultants (used by an important number of firms), 45.5% of respondents do not find this a particular issue, and the share of positive (easy) and negative (difficult) responses is similar (25%). The results of the business survey are also very similar. Furthermore, there appears to be no difference of view depending on the basis of firm size (larger firms tend to say more difficult than micro or small), but there are some differences depending on the country of operation. Over 40% Austrian and Hungarian respondents thought that access to quality consultants is difficult while, over 35% of respondents from the Czech Republic, the UK and the Netherlands thought that it is easy. The survey did not ask if there were issues about costs/ affordability of consultants though, and feedback from interview programmes suggest that this is the key issue for SMEs, rather than availability.
4.9.2 Specific constraints for SMEs as regards acquiring highly qualified internal human resources and/or adequately externalising REACH processes to advisory services.
There are some significant differences in the way in which SMEs and large firms deal internally with the resources required to ensure compliance with REACH. A larger share of large firms report having a dedicated REACH unit more often (32.7% compared to 17.4%) and have a dedicated REACH manager (48.3% compared to 28.6%). SMEs more often deal with REACH in an ad hoc fashion and bot partly and fully outsource more often. The CATI results also reflect these differences.
Both the CATI survey and online business survey indicate that there are not significant differences between SMEs and large firms as regards availability of qualified staff to deal with REACH-related activities. Both seem to favour using existing embers of staff and to provide them with additional training as and when needed, rather than to recruit externally. This may also be related to the economic environment in recent years, especially where there re inflexible labour markets.
As far as working with external consultants is concerned, more SMEs say they find it very difficult to find consultants with the right level of skills and experience that they can trust and work with (22.8% of SMEs compared to 13.2% of large firms), but the overall percentages for difficult (quite plus very) are not dissimilar.
Monitoring Impacts of REACH on Innovation, Competitiveness and SMEs – Draft Interim Report
Section 4 – Findings
100
Similar shares also find it difficult to assess the value of consultants because there are no EU-wide standards to assess them against (17.5% and 16.7%) although there is a significant difference between small (21.1%) and micro firms (26.7%).
Interviews with SMEs suggest that the key difference between large firms and SMEs as regards staff and consultants lies in affordability.
4.9.3 The offer of education programmes
Concerning the availability of relevant education and training courses to support the firms in REACH compliance, around 50% of the OBS respondents appear to be satisfied with what is already available. Distributors and suppliers appear a bit less satisfied than firms with other REACH roles. Nonetheless, around one-third of respondents said that they complement existing training courses with internal tailor-made courses.
More large firms have designed in-house training programmes (37.0% compared to 27.3%) and more SMEs said that existing courses are not appropriate for their needs (21.2% compared to 12.6%) – especially in the case of micro firms (46.7%).
It should be noted that there are two different generic areas of skills in question. On the one hand there are the highly technical skills such as those required by toxicologists that generally require advanced university education. On the other there Is the skill level required by someone who is responsible for REACH compliance in a company, who needs to understand chemistry but may also have other company work commitments and would be involved in outsourcing work to a specialist laboratory or REACH consultant (legal or technical).
As regards the second group, what the findings point out is that most companies have tended to adopt a learning-by doing approach to learn about what is required for compliance and then to bring about the required company changes to implement those changes. They have made use of internal resources with relevant REACH-knowledge where available, or developed such a capability by self-taught methods (often by the owner/ manager). A wide range of knowledge sources is used, including courses at industry associations, consortia, networks, ECHA websites and webinars, etc. that provide the basic information which companies then adapt to firm-specific circumstances. Some smaller MS do not always have sufficient training and consulting expertise available so it has either to be imported or company employees and managers are sent abroad which is costly. The emphasis is on the practical use of the training or education, rather than on the nature of the qualification.
A study to identify the number and type of university courses existing in the field of REACH and CLP across Europe and identify areas of opportunity for input into training of regulatory scientists in the field of chemicals was undertaken for ECHA and published in 2012.52
The study found that many courses of various durations and content existed throughout Europe, but that there was not a ‘fit for purpose’ scheme that would benefit industry, students, universities and ECHA alike. This should provide a tailored and comprehensive training scheme that could be of even higher value if offered as an accredited university qualification. The following options were identified:
52 Universita degli studi di Milano, Dipartimento di Scienze Farmacologiche e biomolecolari DiSFeB (2012) Mapping Study on Academic Courses Relevant to REACH and CLP , Final Report, December 18, 2012

Monitoring Impacts of REACH on Innovation, Competitiveness and SMEs – Draft Interim Report
Section 4 – Findings
101
- To expand the experience gained during the DG SANCO European Toxicology Risk Assessment Training (TRISK) initiative, as this was a successful proof of concept focusing on human health risk assessment.
- To build on the current initiative by the Italian Ministry of Health and Research, to set up postgraduate courses in the field of REACH/CLP for the training of professionals and could be considered as an initiative to replicate across other European countries.
- The ECHA graduate scheme could be developed to work with European academic institutions to develop further education programmes, possibly linked with some form of internship or research positions for newly qualified graduates within ECHA.
According to feedback obtained during the interview programme, it is understood that of the initial universities offering masters courses in chemistry specialising in REACH most have now withdrawn those programmes.
The OBS feedback suggests that companies want a practical hands-on approach tailored to their experience which cannot be readily provided by university education. For those large or specialised companies with substantial in-house laboratories and larger teams of researchers, a different approach is required to deal with issues such ecotoxicology or toxicology that is also offered in a bespoke manner appropriate for the companies in question. Small and micro-firms tend to develop the capabilities in-house (self-taught supplemented by the occasional workshop) or outsource it all (to a greater extent than larger firms).
One approach that might be worth further consideration is that of the Chemicals Office of the Republic of Slovenia. For companies that need special advice for activities in the chemicals field, staff carrying out such activities need to undergo a certain level of training and pass exams related not only REACH but other regulatory areas where chemicals are involved before they are qualified to work in that area.
As regards the question of the value of a certificate, or similar qualification that would mean that the holder has a certain level of knowledge in REACH, it was primarily SMEs that found this of interest (in countries such as Italy and Ireland), as it would suggest a certain basic level of competence for the holder and could lead to the expansion of the offer of REACH consultants. There might also be a few levels within the qualification that would mean different levels of technical competency so that for basic questions it is not necessary to use a post-Doc. It can also be looked into whether such a qualification can be pan-European, or if there would be a pan-European basis which can then be topped-up with a national test. Furthermore, the need for such a qualification in the post 2018 registration period would have to be assessed carefully. Would there still be a sufficient on-going demand? A further issue is what will happen to demand if the EU economy recovers and starts to grow strongly in the next few years? If economic growth picks up it could lead to an increased demand for chemists that would work on product development and innovation.
Monitoring Impacts of REACH on Innovation, Competitiveness and SMEs – Draft Interim Report
Section 4 – Findings
102
4.10 Objective 10 - Substances of Very High Concern (SVHCs) and Authorisations
4.10.1 Introduction
In the area of substances of very high concern and authorisations, the aim of the study is:
To assess the costs of preparing an authorisation application; To verify the availability of human resources with required competences; To assess the affordability of the authorisation process, especially for SMEs; To evaluate the effects of listing substances under the SVHC roadmap, the Candidate list,
Annex XIV on the availability of substances on the market and the number of suppliers; and To assess the direct and indirect costs of the application of Article 33.
The 2012 REACH review process concluded that the authorisation and restriction mechanisms are working and are ensuring that risks from Substances of Very High Concern (SVHC) are controlled and that, where suitable alternatives are economically and technically viable, those substances are progressively replaced.
4.10.2 Costs of preparation of an authorisation application
Indeed, for around 50% of the 31 substances in Annex XIV, no applications for authorisation (AfA) have been received by ECHA and the latest application dates have passed. Moreover, some of the 28 applications received so far are so-called “bridging applications”, meaning that the applicants are working on phasing out the substance from their processes/products but need more time to fully develop an alternative. On top of this, companies involved in an AfA usually improve their risk management measures to have the strongest arguments for the application.
Between 2013 and 2014 ECHA surveyed applicants with regard to the application costs: they calculated an average cost per applicant/use of around €230,000 based on 24 responses, although the trend indicates declining costs (applicants that submitted AfAs in the second half of 2014 had average costs of less than €200,000 per applicant/use). Around 50% of the costs of an AfA are accounted for consulting fees, a 15% for the application fees due to ECHA and 35% for expanses and internal staff time, with 60% of the total cost driven by the assessment reports (40% accounted for the Analysis of the Alternative (AoA), 35% for the Socio-Economic Analysis (SEA) and 25% for the Chemical Safety Report (CSR)). 53 These shares are presented in Chart 4.10.1.
Companies interviewed for the purpose of this study overall confirmed these figures. Other companies that were in the process of preparing an application or that will have to in the future estimated costs ranging between €250,000 to €500,000.
4.10.3 Availability of human resources
Overall, there was a certain consensus that the authorisation mechanism has been a “learning by doing” process for everybody, including the Commission and ECHA. Availability of human resources and consultants and the verification of whether they had the right competences for following and assisting in an application for authorisation has been problematic at the beginning as there were no previous experiences and nothing to benchmark with, but the feeling is that now, although the
53 http://echa.europa.eu/documents/10162/21825501/afa_201502_7_nicot_en.pdf
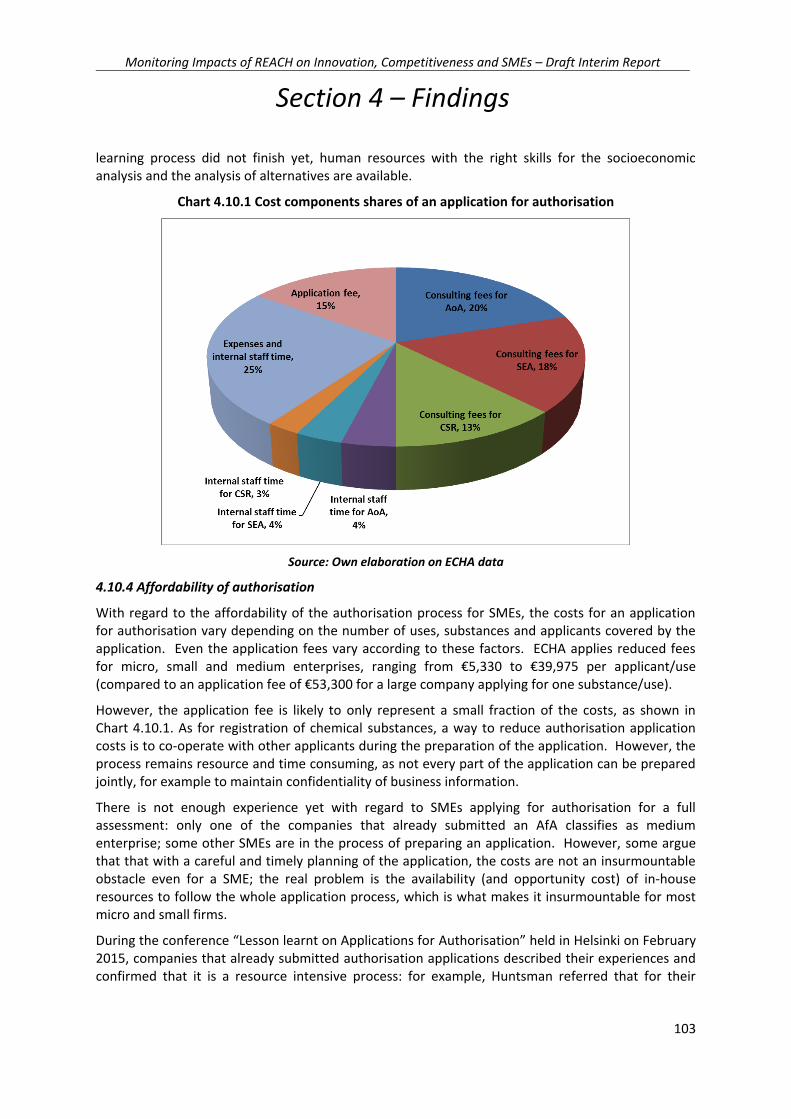
Monitoring Impacts of REACH on Innovation, Competitiveness and SMEs – Draft Interim Report
Section 4 – Findings
103
learning process did not finish yet, human resources with the right skills for the socioeconomic analysis and the analysis of alternatives are available.
Chart 4.10.1 Cost components shares of an application for authorisation
Source: Own elaboration on ECHA data
4.10.4 Affordability of authorisation
With regard to the affordability of the authorisation process for SMEs, the costs for an application for authorisation vary depending on the number of uses, substances and applicants covered by the application. Even the application fees vary according to these factors. ECHA applies reduced fees for micro, small and medium enterprises, ranging from €5,330 to €39,975 per applicant/use (compared to an application fee of €53,300 for a large company applying for one substance/use).
However, the application fee is likely to only represent a small fraction of the costs, as shown in Chart 4.10.1. As for registration of chemical substances, a way to reduce authorisation application costs is to co-operate with other applicants during the preparation of the application. However, the process remains resource and time consuming, as not every part of the application can be prepared jointly, for example to maintain confidentiality of business information.
There is not enough experience yet with regard to SMEs applying for authorisation for a full assessment: only one of the companies that already submitted an AfA classifies as medium enterprise; some other SMEs are in the process of preparing an application. However, some argue that that with a careful and timely planning of the application, the costs are not an insurmountable obstacle even for a SME; the real problem is the availability (and opportunity cost) of in-house resources to follow the whole application process, which is what makes it insurmountable for most micro and small firms.
During the conference “Lesson learnt on Applications for Authorisation” held in Helsinki on February 2015, companies that already submitted authorisation applications described their experiences and confirmed that it is a resource intensive process: for example, Huntsman referred that for their
Monitoring Impacts of REACH on Innovation, Competitiveness and SMEs – Draft Interim Report
Section 4 – Findings
104
application, for the period going from May 2011 to December 2014, a three and a half year period, a core working team of 8 people dealt with the process, having:
“18 team meetings in 7 cities and 5 countries”; Monthly senior management reports; Regular presentations to Board of Directors; Dozens of teleconferences, hundreds of phone calls and countless email”.54
Another issue that might arise is the possibility of being the manufacturer/importer/downstream user of two or more substances in Annex XIV and of having to deal with two or more applications for authorisation at the same time. In this event, even in the case of a careful planning, both availability of human resources and costs will be an issue for a small enterprise. This event is already a reality for over 30% of the large companies surveyed through the OBS (chart 4.10.2) and for 20 SMEs (of which 1 micro-enterprise) responding to have more than 1 substance they manufacture/import/use in Annex XIV (it should be noted that companies can chose not to submit an AfA). The likeliness of having companies submitting AfAs at the same time is also confirmed by the number of companies reporting to have more than one substance in the Candidate list or that have been prioritised for inclusion in Annex XIV.
4.10.5 The effect of listing substances
With regard to the effects of listing substances in the Candidate list and in Annex XIV on the availability of substances on the market and the number of suppliers, the surveys’ results offer some interesting information.
Around 40% of the respondents have received customers’ requests to remove SVHCs from their products, with small variations between SMEs and large enterprises; around 70% of the companies declaring as their primary role to be suppliers of articles received such request from their customers (Tables 4.10.1 and 4.10.2).
Table 4.10.1 Have any of your customers requested the removal of SVHCs from your products? (Percentage of respondents by company size)
Response SME Large enterprise All firms
Yes 36 42 39
No 64 58 61
n= 124 111 242
Source: Business Survey
Table 4.10.2 Have any of your customers requested the removal of SVHCs from your products? (Percentage of respondents by company role)
Response Manufacturer Formulator Distributor Importer Supplier End user
Yes 21 55 48 33 72 42
No 79 45 52 67 58 58
n= 61 44 25 27 26 59
Source: Business Survey
54 http://echa.europa.eu/documents/10162/21825501/afa_201502_3_frazee_en.pdf
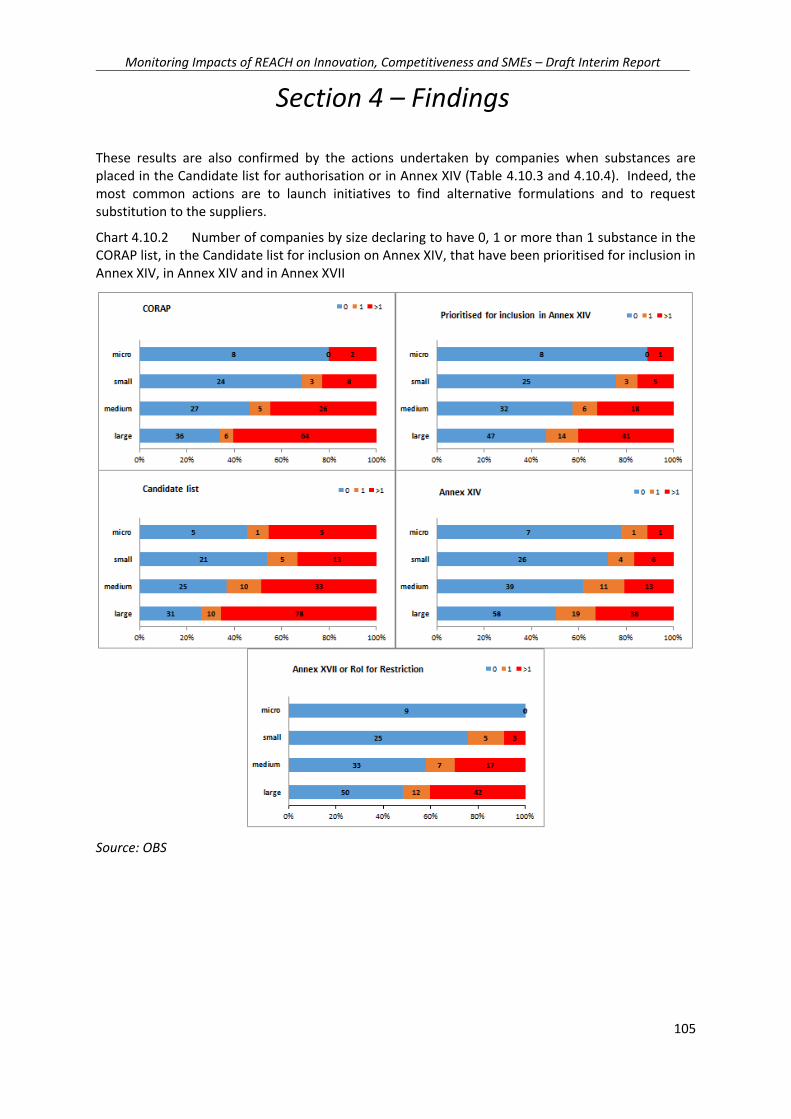
Monitoring Impacts of REACH on Innovation, Competitiveness and SMEs – Draft Interim Report
Section 4 – Findings
105
These results are also confirmed by the actions undertaken by companies when substances are placed in the Candidate list for authorisation or in Annex XIV (Table 4.10.3 and 4.10.4). Indeed, the most common actions are to launch initiatives to find alternative formulations and to request substitution to the suppliers.
Chart 4.10.2 Number of companies by size declaring to have 0, 1 or more than 1 substance in the CORAP list, in the Candidate list for inclusion on Annex XIV, that have been prioritised for inclusion in Annex XIV, in Annex XIV and in Annex XVII
Source: OBS

Monitoring Impacts of REACH on Innovation, Competitiveness and SMEs – Draft Interim Report
Section 4 – Findings
106
Table 4.10.3 What has been the response of your firm to the placing of substances relevant to your business in the Candidate list? (percentage of firms indicating)
Type of response Manufactur
er Formulat
or Distribut
or Importer Supplier
End user
All firms
Not applicable (no relevant substance placed on the list)
28.9 25.6 26.3 27.6 20.0 18.0 22.7
Launched initiatives to develop new substances to substitute them
21.7 20.5 15.8 13.8 12.0 28.0 18.7
Launched initiatives to find alternative formulations of existing substances to substitute them
28.9 46.2 21.1 24.1 28.0 44.0 29.9
Withdrew them from our product portfolio
9.6 28.2 15.8 24.1 8.0 12.0 14.0
Requested substitution of those substances by our suppliers
14.5 30.8 26.3 17.2 40.0 42.0 23.7
No special action taken 25.3 7.7 26.3 24.1 32.0 14.0 18.7
We are applying for Authorisation
7.2 2.6 0.0 0.0 12.0 6.0 5.0
Total 100.0 100.0 100.0 100.0 100.0 100.0 100.0
n= 83 39 19 29 25 50 278
Source: Online business survey
Table 4.10.4: What has been the response of your firm to the placing of substances relevant to your business in Annex XIV? (percentage of firms indicating)
Manufactur
er Formulat
or Distribut
or Importer Supplier
End user
All firms
Not applicable (no relevant substance placed on the list)
41.0 43.6 21.1 31.0 24.0 22.0 29.5
Launched initiatives to develop new substances to substitute them
14.5 5.1 5.3 3.4 12.0 20.0 11.2
Launched initiatives to find alternative formulations of existing substances to substitute them
7.2 17.9 10.5 17.2 20.0 28.0 14.0
Withdrew them from our product portfolio
8.4 15.4 36.8 13.8 8.0 16.0 12.6
Requested substitution of those substances by our suppliers
7.2 7.7 10.5 13.8 36.0 26.0 13.3
No special action taken 10.8 5.1 10.5 3.4 16.0 6.0 7.6
We are applying for Authorisation
13.3 10.3 0.0 6.9 20.0 30.0 13.7
Total 100.0 100.0 100.0 100.0 100.0 100.0 100.0
n= 83 39 19 29 25 50 278
Source: Online Business Survey

Monitoring Impacts of REACH on Innovation, Competitiveness and SMEs – Draft Interim Report
Section 4 – Findings
107
Similar actions were taken when substances have been withdrawn from the market (Table 4.10.5). Notably, around 18% of the (243) companies replying to this question, indicated that they have ceased the activities that relied on the substance withdrawn or to have moved their operations outside the EU.
Table 4.10.5 What has been the response of your firm to the withdrawal of a substance from the market due to its being entered onto the Candidate List or the Authorisation List?
Type of response Manufacturer Formulator Distributor Importer Supplier End user All firms
Have had no experience of any withdrawal
61.5 45.5 44.0 33.3 50.0 32.1 46.5
Identified a new supplier of the substance
1.5 2.3 4.0 8.3 3.8 10.7 4.9
Initiated research on available alternatives
15.4 36.4 36.0 33.3 23.1 46.4 31.7
Moved to an existing alternative substance
13.8 25.0 16.0 29.2 26.9 32.1 23.0
Registered and/or imported the substance yourself
1.5 0.0 0.0 4.2 3.8 1.8 1.6
Ceased production activities that relied on the substance
6.2 13.6 36.0 16.7 3.8 8.9 12.3
Moved operations outside the EU
1.5 9.1 4.0 12.5 3.8 7.1 6.2
Started working on an application for authorisation
7.7 2.3 4.0 4.2 19.2 16.1 9.1
Other 9.2 6.8 4.0 4.2 7.7 12.5 8.2
Total 100.0 100.0 100.0 100.0 100.0 100.0 100.0
n= 65 44 25 24 26 56 243
Source: OBS
With regard to the effects of the inclusion of substances in the Candidate list on their availability on the market, some industry representatives reported on some specific cases.55
In general, industry representatives and companies agree that authorisation does have an impact on competitiveness and innovation and especially on investment decisions: the existence of the authorisation mechanism might be a contributing factor in the decision making process when considering the pros and cons of producing in the European Union or outside. If a company wants to make a multimillion investment for expanding its capacity and the machineries or any part of the production process have substances that are included or might be included in the future in Annex XIV for their hazardous profile, how can the authorities guarantee that the company will be able to
55 Eurometaux provided the example of arsenic trioxide: this substance is recovered as a by-product from copper smelting streams and, after its inclusion, there has been a reduction of 50% in the manufacturing, with arsenic trioxide quantities that before were processed now being sent to landfills. Eucomed and EDMA reported the case of medical grade DEHP.

Monitoring Impacts of REACH on Innovation, Competitiveness and SMEs – Draft Interim Report
Section 4 – Findings
108
use those production lines for e.g. 30 years? Will the company have to invest new money to change the process after 12, 7 or even 4 years?
The inclusion of substances in the candidate list triggers considerations of reformulation for some products and of withdrawal for some others: in particular, the continuous inclusion of new substances might imply the reformulation of a high number of products with associated high costs and the inevitable dropping out of products from the companies’ portfolios. Some industry associations highlighted that this process is slowing down product development and diverting resources from innovation.
The withdrawing from some markets and the possible relocation of activities outside Europe depend on the criticality of the substance going through Authorisation/Restriction and on the feasibility of substitution. In the case of a complete ban on the use of a critical substance with no feasible substitutes, or the need for submission of a costly and in any case time limited authorisation, industry would have no choice but to contemplate non-EU solutions. At the same time over 90% of the chemical sector and its downstream users sectors is made up of small and medium sized enterprises (SMEs): it is unlikely to be economically feasible for SMEs to relocate to extra-EU countries. Companies with manufacturing facilities outside Europe might consider relocation a straight-forward solution, being able to import the articles without having to deal with the Authorisation procedure. Another possible solution would be the outsourcing of the manufacturing process; however, difficulties could be foreseen in terms of extra costs, logistical issues and ensuring batch to batch integrity.
Many of the different stakeholders interviewed, from NGOs to industry associations, have stressed that the fact that imported articles do not have to go through authorisation is unfair and a competitiveness issue.
Another issue that has been pointed out is that chemicals suppliers may choose not to apply for Authorisation for small volume uses as the costs of doing so are too high, meaning that the cost of application would fall entirely on downstream users. An example is the in-vitro diagnostic industry, that typically tends to use smaller amounts of critical substances relative to quantities used by other sectors. The costs for AfAs are likely to be passed to the end-user clinical laboratories. Similarly, supply of substances used by the non-commercial laboratory-based sector and included in the Candidate list or listed in Annex XIV could be threatened, impacting significantly the delivery of laboratory medicine to European healthcare. The portfolio of tests each requiring substitution of a certain substance would have to be prioritized for costs and availability of human resources with a detrimental effect on low volume or low margin tests, e.g. for rare diseases.
Some stakeholders have suggested that the inclusion in the Candidate list should be based on actual risk consideration instead of being hazard-based; right now, risk is considered too far down the process, meaning that substances in the candidate list are already “black-listed” even if there is no risk, with all the repercussions over reputation and availability of the substance on the market. Moreover, some stakeholders claimed that the Candidate listing started even before the first Registration process was finished, leading to targeting the same hazardous substances for which however most of the data were already available, for which substitution was already considered and for which very strict RMMs were already in place.
In order to further assess the effects of the identification and listing of SVHCs, a case study on the PACT list is presented at the conclusion of this Section.
The Commission and ECHA are aware of industry concerns and started to reflect on how to streamline and simplify the authorisation process for specific areas where authorisation requirement

Monitoring Impacts of REACH on Innovation, Competitiveness and SMEs – Draft Interim Report
Section 4 – Findings
109
might impose disproportionate administrative burden on operators56. On the basis of the discussion with the Member States Competent Authorities and industry stakeholders, the Commission and the Agency are looking in particular to these four areas:
Uses in low volumes; Uses in legacy spare parts; Uses in products subject to type-approval; and Uses as biological essential elements.
The use of Annex XIV substances in low volumes has been considered because the costs of a full-scale AfA in comparison with the potential benefits for the human health and the environment in terms of reduced risks related to their substitution are likely to be disproportionate.
Legacy spare parts are spare parts intended for articles produced and placed on the market before the sunset date: they have been considered as an area for simplification because, given the limited and decreasing volume of spare parts intended for articles that are no longer produced, the costs for an AfA are likely to be disproportionate and because research on alternatives for such uses is technically and economically difficult.
Certain uses of Annex XIV substances might be subject to type approval or authorisation requirement under other pieces of legislation and the use of an alternative would require a re-approval or re-authorisation (for example in the aerospace or automotive sectors). This is therefore another area where a simplification of the AfA might benefit companies without hindering the objectives of REACH. However, different conditions apply to type approval/authorisation in different sectors and it is difficult to define a general framework. The Commission will consider different aspects for the simplification for this area, such as the need for re-approval or re-authorisation, the high socio-economic values of certain uses in certain sectors with regard to the Socio-Economic Analysis and the setting of the review periods in line with the length of the review periods for re-approval/re-authorisation.
Uses as biological essential elements will be considered for simplification in the future, after the consideration of the uses in low volumes and the uses in legacy spare parts, as are not yet a concern for the existing Annex XIV substances.
Two public consultations on streamlining and simplification of the REACH authorisation application procedure remained open between February and April 201557, one for applications concerning uses of substances in low volumes and one on one-time extension of transitional arrangements for uses of substances in legacy spare parts. On the uses in low volumes, input were asked on volume limit to benefit from the simplified procedure, additional conditions on the uses and on the type of applications, on informal requirements and on considerations for the review period. With regard to legacy spare parts, the aim was to collect information on which Annex XIV substances are used and
56 Announced in the Communication of 18 June 2014 on “Regulatory Fitness and Performance Programme (REFIT): State of Play and Outlook”. 57 http://ec.europa.eu/yourvoice/consultations/2015/index_en.htm

Monitoring Impacts of REACH on Innovation, Competitiveness and SMEs – Draft Interim Report
Section 4 – Findings
110
on the volume used. The Commission is now considering the comments received and “will propose an implementing act to provide legal certainty on the simplified applications for authorisation”58.
The AfA Task Force is already working on simplified templates for the AoA and the SEA for the first two areas (low volumes and legacy spare parts). The Commission is also considering other aspects for streamlining all applications in general, by defining the type and level of information required in the different documents of an AfA (CSR, AoA and SEA) and possibly by providing practical examples of what constitutes a good CSR, AoA or SEA.
It should be noted that the NGOs interviewed have voiced their concern over the streamlining process of the authorisation mechanism and have called the Commission to lift the de facto moratorium on the inclusion of SVHC into Annex XIV59.
4.10.6 The direct and indirect costs of the application of Article 33
With regard to the assessment of the direct and indirect costs of the application of Article 33, usually information management systems are integrated and they help companies to comply with several pieces of legislation60 as well as to better manage information. It is therefore very difficult to attribute direct costs to the need of companies to comply with Article 33 only.
During the interviews, NGOs and trade unions61 have stressed the importance of Article 33 (establishing the so-called “right to know”) that has provided a very important new instrument to consumers which has an important effect on the supply chain. Retailers are becoming increasingly aware that consumers can ask information on the content of SVHCs in products (as confirmed by the results of the surveys presented in Table X.6) and these requests have positive impacts not only in terms of the right to know but also on incentives to substitute SVHCs in consumer products.
Moreover, consumer organisations can now contribute to the debate on prioritising chemicals for substance evaluation: they can communicate easily with the Agency and the Commission, notify concerns over certain substances, contribute to the public consultations launched by ECHA during the authorisation and restriction processes.
Through the OBS, companies were asked whether they had been required to communicate information on SVHCs to downstream users under Article 33 of REACH. Table X.6 provides the responses for different roles. These would suggest that a potentially significant proportion have had to do so, with this proportion broadly increasing as one progresses down the supply chain.
58 17th Meeting of Competent Auhtorities for REACH and CLP (CARACAL), 26-27 March 2015, Brussels, Streamlining and simplifications of the authorisation process, Doc. CA/16/2015. 59 http://www.eeb.org/?LinkServID=6E866A31-5056-B741-DBC7F95AB907572B&showMeta=0&aa 60 See for example the Global Environmental Management System developed by Abbott: http://prod2.dam.abbott.com/en-us/documents/pdfs/partners/Restricted_Substances_Training.pdf 61 BEUC, EEB, ChemSec, ETUC and Client Earth.

Monitoring Impacts of REACH on Innovation, Competitiveness and SMEs – Draft Interim Report
Section 4 – Findings
111
Table 4.10.6 Have you had to communicate information to industrial or professional users and distributors on the presence of a substance on the candidate list being included in an article at above 0.1% (w/w) (under Article 33 of REACH)? (percentage of firms responding)
Manufacturer Formulator Distributor Importer Supplier End user All firms
Yes 26.7 42.9 62.5 33.3 54.2 53.6 45.5
No 73.3 57.1 37.5 66.7 45.8 46.4 54.5
Total 100.0 100.0 100.0 100.0 100.0 100.0 100.0
n= 30 14 8 12 24 28 121
Source: OBS
This is confirmed by the companies that reported to have installed specific IT systems for answering customers’ questions regarding to SVHC content in articles (around 57% of the respondents), with suppliers of articles and end users having the highest percentages (Table X.7 and X.8). These results are encouraging and indicate that awareness or Article 33 among companies is increasing and that the call from NGOs to implement dedicated management systems in order to ensure coherence in the answers provided in different countries is being progressively accepted by companies across the EU. In order to verify whether there is effectively a positive trend, during the interview BEUC’s representative suggested the Commission to launch a study to update and expand the survey conducted in 2011 by BEUC and its national members investigating the functioning of article 3362.
Table 4.10.7 Have you installed specific internal (IT) systems and/or routines for answering customer/consumer questions regarding the SVHC content in the articles you place on the market? (Percentage of respondents by company size)
Response SME Large enterprise All firms
Yes 40 70 57
No 60 30 43
n= 40 54 97
Source: OBS
Table 4.10.8 Have you installed specific internal (IT) systems and/or routines for answering customer/consumer questions regarding the SVHC content in the articles you place on the market? (Percentage of respondents by company role)
Response Manufacturer Formulator Distributor Importer Supplier End user
Yes 55 44 56 30 68 63
No 45 56 44 70 32 38
n= 20 9 9 10 25 24
Source: OBS
It should be noted that also private investors have highlighted the importance to strengthen chemicals companies’ reporting of product stewardship, substitution and management of substances of concern.63
62 More information at: http://www.chemsec.org/what-we-do/sin-list/latest-on-sin/829-consumers-qright-to-knowq-tested-companies-asked-if-they-use-any-sin-list-chemicals 63 http://newsletter.echa.europa.eu/home/-/newsletter/entry/3_15_investor-perspective-why-reach-matters-for-your-bottom-line

Monitoring Impacts of REACH on Innovation, Competitiveness and SMEs – Draft Interim Report
Section 4 – Findings
112
4.10.7 The PACT list – Case study
The aim of this case study is to assess industry awareness of the PACT list and to verify whether the listing triggers earlier actions in response of potential regulatory risk management measures in the future.
Since September 2014, the Public Activities Coordination Tool (PACT) has been available online.64 Its main purpose is to give advance notice of the substances that are being scrutinised by the authorities to determine whether there is a potential need for regulatory risk management.
The PACT is part of the implementation of the SVHC Roadmap commenced in February 2013. Through the PACT list, the European Commission, ECHA and the Member States Competent Authorities want to comply with their commitment to increase transparency and predictability towards the general public and the stakeholders. The communication of information about the substances under regulatory scrutiny should enable stakeholders to better predict the adoption of formal risk management routes in the future and should also give them the opportunity to:
In case of being registrants, ensure that their registration data are up-to-date; Consider the best business strategy to address substances of potential concern; To get prepared for the public consultation that could be launched to inform any regulatory
process; To have easy access to the contact details of the authorities carrying out the risk
management option analysis (RMOA) in case they would like to contribute to the development process65.
As for 1 June 2015, the PACT list contains 274 chemical substances66 for which a risk management option analysis (RMOA) or an informal PBT/vPvB properties hazard assessment or endocrine disruptor properties hazard assessment is being carried out or has been completed.
The PACT list presents information on:
Substance identification (name, EC and CAS number); Date of inclusion in the list; The national authority carrying out the RMOA/hazard assessment for PBT/vPvB or endocrine
properties; Whether the national authority is carrying out a RMOA or a hazard assessment for PBT/vPvB
or endocrine properties; The scope of the activity (the suspected hazard or concern considered); The outcome with any document available.
It is important to note that the information and views presented as well as the outcome of the RMOA and of the hazard assessment are those of the evaluating authority only and do not preclude
64 http://echa.europa.eu/documents/10162/19126370/svhc_roadmap_2015_en.pdf 65 Although it is the decision of the authority on how to take into account any input provided by stakeholders. 66 The PACT list is updated monthly. More information can be found at: http://echa.europa.eu/addressing-chemicals-of-concern/substances-of-potential-concern/pact

Monitoring Impacts of REACH on Innovation, Competitiveness and SMEs – Draft Interim Report
Section 4 – Findings
113
other Member States and the Commission to initiate other regulatory measures if deem appropriate, for example in consideration of new available information or further assessment.67
In the framework of this case study, the Commission suggested investigation of the PACT list effects on the supply chain actors of diisocyanates.
Diisocyanates are manufactured in high volumes: according to Eurostat data, in 2013 there was a total production of 2,155,000 tonnes in the EU2868. Main applications are:
In the production of polyurethanes (reacted with polyols); In coatings, adhesives, sealants, elastomers and binders.
Many of the isomers of diisocyanates (and in particular the most diffuse mixes of monomeric MDI and TDI) are subject to harmonised classification, with MDI and TDI isomers classified as suspected to cause cancer (H351), as skin, eye and respiratory irritants (H315, H319 and H335), as acute toxic if inhaled (H330) and as skin and respiratory sensitisers (H317 and H334). MDI is classified also as potentially toxic to kidney and liver (H373), while TDI as harmful to aquatic life with long lasting effects (H412).
Some of the diisocyanates have been included in the Community Rolling Action Plan for substance evaluation (table X.9).
Table 4.10.9 Diisocyanates in CORAP
Name EC Number
CAS Number
Year Member State
Initial Grounds for Concern
Status
3,3'-dimethylbiphenyl-4,4'-diyl diisocyanate
202-112-7
91-97-4 201
3 France
Human health/Suspected CMR; Sensitiser; Environment/Suspected PBT; Exposure/Consumer use
Ongoing
4,4’-methylenediphenyl diisocyanate
202-966-0
101-68-8
2013
Estonia
Human health/CMR; Sensitiser; Environment/Suspected PBT; Exposure/Wide dispersive use; Consumer use; Aggregated tonnage
Ongoing
m-tolylidene diisocyanate 247-722-4
26471-62-5
2012
Poland Human health/CMR and sensitiser; Environment/
Concluded
67 Disclaimer on ECHA’s website.
68 According to the Danish Environmental Protection Agency (Survey of certain isocyanates (MDI and TDI), Part of the LOUS-review, Environmental Project No. 1537, 2014), the isomers of Methylene diphenyl diisocyanate (MDI) and Toluene diisocyanate (TDI) are commercially the most important, making up about 95% of the market volume-wise.

Monitoring Impacts of REACH on Innovation, Competitiveness and SMEs – Draft Interim Report
Section 4 – Findings
114
Name EC Number
CAS Number
Year Member State
Initial Grounds for Concern
Status
Suspected PBT (hydrolisis products); Exposure/Wide dispersive use, high aggregated tonnage
4,4'-methylenediphenyl diisocyanate, oligomeric reaction products with butane-1,3-diol, 2,4'-diisocyanatodiphenyl methane, [(methylethylene)bis(oxy)]dipropanol and propane-1,2-diol
500-312-1
123714-19-2
2016
Estonia
Human health/CMR; Sensitiser; Environment/Suspected PBT; Exposure/Wide dispersive use; Consumer use; Aggregated tonnage
Not started
4,4'-methylenediphenyl diisocyanate, oligomeric reaction products with butane-1,3-diol, 2,4'-diisocyanato-diphenyl methane, 2,2'-oxydiethanol and propane-1,2-diol
500-415-1
158885-29-1
2016
Estonia
Human health/CMR; Sensitiser; Environment/Suspected PBT; Exposure/Wide dispersive use; Consumer use; Aggregated tonnage
Not started
Reaction mass of 4,4'-methylenediphenyl diisocyanate and o-(p-isocyanatobenzyl)phenyl isocyanate / methylene diphenyl diisocyanate
905-806-4
201
5 Estonia
Human health/CMR; Sensitiser; Environment/Suspected PBT; Exposure/Wide dispersive use; Consumer use; Aggregated tonnage
Ongoing
Moreover, the use of MDI-containing consumers’ products is restricted in the European Union69, coupled with a European Commission Recommendation on the professional use of MDI. There are several other sector regulations addressing MDI and TDI (e.g. cosmetics, food contact material, waste, industrial emissions) and some Member States have National Occupational Limit Values for MDI, TDI and other diisocyanates.
It is evident that diisocyanates have been under regulatory scrutiny for many years, so it is not a surprise they were included in the PACT list (Table 4.10.10 lists the diisocyanates included in the list). Currently, there are four Member States looking at different suspected hazard:
Denmark was carrying out a RMOA on diisocyanates as CMR but the analysis has been put on hold;
Estonia and France are carrying out a hazard assessment for PBT properties;
69 Entry 56 of Annex XVII to REACH.
Monitoring Impacts of REACH on Innovation, Competitiveness and SMEs – Draft Interim Report
Section 4 – Findings
115
Germany has concluded a RMOA on diisocyanates as sensitisers and deemed appropriate to initiate regulatory risk management action.
More precisely, Germany will propose “to integrate a certification scheme defining minimum handling conditions into a REACH restriction” on the use of substances which contain more than 0.1wt% of free diisocyanates, “unless a company can prove convincingly that they have an internal system in place that ensures the procedures to handle diisocyanates are strictly followed” 70. The details however are still to be defined.
For the purpose of this case study, the project team held phone interviews with three industry associations of manufacturers and downstream sectors:
The European Diisocyanate & Polyol Producers Associations (ISOPA) and the European Aliphatic Isocyanates Producers Association (ALIPA) represented by Jörg Palmersheim (Secretary General);
The European Association of paint, printing ink and artists’ colours companies (CEPE) represented by Didier Leroy (Technical Director);
The European Association of flexible polyurethane foam blocks manufacturers (Europur) represented by Michel Baumgartner (Secretary General).
All the interviewees were well aware of the PACT list and actually welcomed it, agreeing that increases the transparency of the regulatory process. However, they noted that some improvements can be made, for example clarifying the terminology and increasing awareness among stakeholders that “restriction” does not automatically mean “ban”, especially in this case where the German initiative is targeted on workers’ protection. This would allow avoidance of a “black list” effect and to trigger questions and concerns on product availability among customers.
Interviewees were also very satisfied by the collaboration with the German authorities and that they could feed information in the process. However, they noted that the involvement of the whole supply chain is very difficult to achieve and public authorities should think on how to actively engage the third or fourth level down the supply chain. For example, only in the EU end users’ sectors of aliphatic diisocyanates, there are around 150,000 companies with around 800,000 workers. This is also very important, given that already at the level of the formulators for the different applications, 95% of the companies are SMEs and around 100% among the end-use applicators and in the indirect industry71.
From their side, the main producers of diisocyanates have, through ISOPA, developed the product stewardship programme “Walk the talk”, aiming to improve health and safety across the polyurethanes industry. Producers provide regular training to their employees on how to handle diisocyanates and offer training and guidelines to their customers too. All employees that could be potentially exposed to diisocyanates are screened through health surveillance programmes once a year and are encouraged to have a lung function test at least another time in one year.
Although some alternatives are available for some applications (see for example the OrganoTex® water repellent technology developed by OrganoClick and listed in the Subsport portal about
70 Risk Management Options Analysis Conclusion document for Diisocyanates by Baua. 71 http://www.alipa.org/index.php?page=end-use-sectors-summary
Monitoring Impacts of REACH on Innovation, Competitiveness and SMEs – Draft Interim Report
Section 4 – Findings
116
substitution of hazardous chemicals maintained by ChemSec72), economically suitable alternatives to diisocyanates for their wide range of applications are not readily available on the market; there is ongoing research for developing isocyanate-free polyurethane adhesives, sealants and coatings73.
In conclusion, the main challenge will be the involvement of all the end users’ sectors: one of the findings of this study is that in those sectors where there is a pro-active industry association dealing with all aspects of the Regulation and actively engaging with the public authorities, problems and conflicts are minimised, companies are more likely to be better prepared and to better answer to regulatory pressure. Not surprisingly, chemicals manufacturers and formulators, both at company and industry association level, are better equipped to deal with REACH; going down the supply chain, the size of the companies decreases and chemicals regulation becomes just one of the aspect that sectorial industry associations have to deal with.
72 www.subsport.eu
73 http://www.turi.org/content/download/9523/165782/file/Toluene%20Diisocyanate%20Policy%20Analysis.%202014..pdf

Monitoring Impacts of REACH on Innovation, Competitiveness and SMEs – Draft Interim Report
Section 4 – Findings
117
Table 4.10.10 Diisocyanates in the list Name EC
Number
CAS Number
Inclusion Date
Authority
Activity Scope Outcome Finalisation date
Follow-up
2-methyl-m-phenylene diisocyanate
202-039-0
91-08-7
23/09/2014
Denmark
RMOA CMR On hold 29/08/2014
2-methyl-m-phenylene diisocyanate (TDI 2,6)
202-039-0
91-08-7
23/09/2014
Germany
RMOA Sensitiser
Appropriate to initiate regulatory risk management action.
28/08/2014
Restriction
3,3'-dimethylbiphenyl-4,4'-diyl diisocyanate
202-112-7
91-97-4
01/04/2015
France Hazard assessment
PBT Substance evaluation under development
Tosyldiisocyanate (TODI)
202-112-7
91-97-4
23/09/2014
Germany
RMOA Sensitiser
Appropriate to initiate regulatory risk management action.
28/08/2014
Restriction
4,4'-methylenediphenyl diisocyanate
202-966-0
101-68-8
01/04/2015
Estonia Hazard assessment
PBT Substance evaluation under development
4,4'-methylenediphenyl diisocyanate
202-966-0
101-68-8
23/09/2014
Denmark
RMOA CMR On hold 29/08/2014
4,4'-methylenediphenyl diisocyanate (4,4' MDI)
202-966-0
101-68-8
23/09/2014
Germany
RMOA Sensitiser
Appropriate to initiate regulatory risk management action.
28/08/2014
4-methyl-m-phenylene diisocyanate (TDI 2,4)
209-544-5
584-84-9
23/09/2014
Germany
RMOA Sensitiser
Appropriate to initiate regulatory risk management action.
28/08/2014
4-methyl-m-phenylene diisocyanate,toluene-2,6-di-isocyanate
209-544-5
584-84-9
23/09/2014
Denmark
RMOA CMR On hold 29/08/2014
hexamethylene diisocyanate (HDI)
212-485-8
822-06-0
23/09/2014
Germany
RMOA Sensitiser
Appropriate to
28/08/2014
Restriction
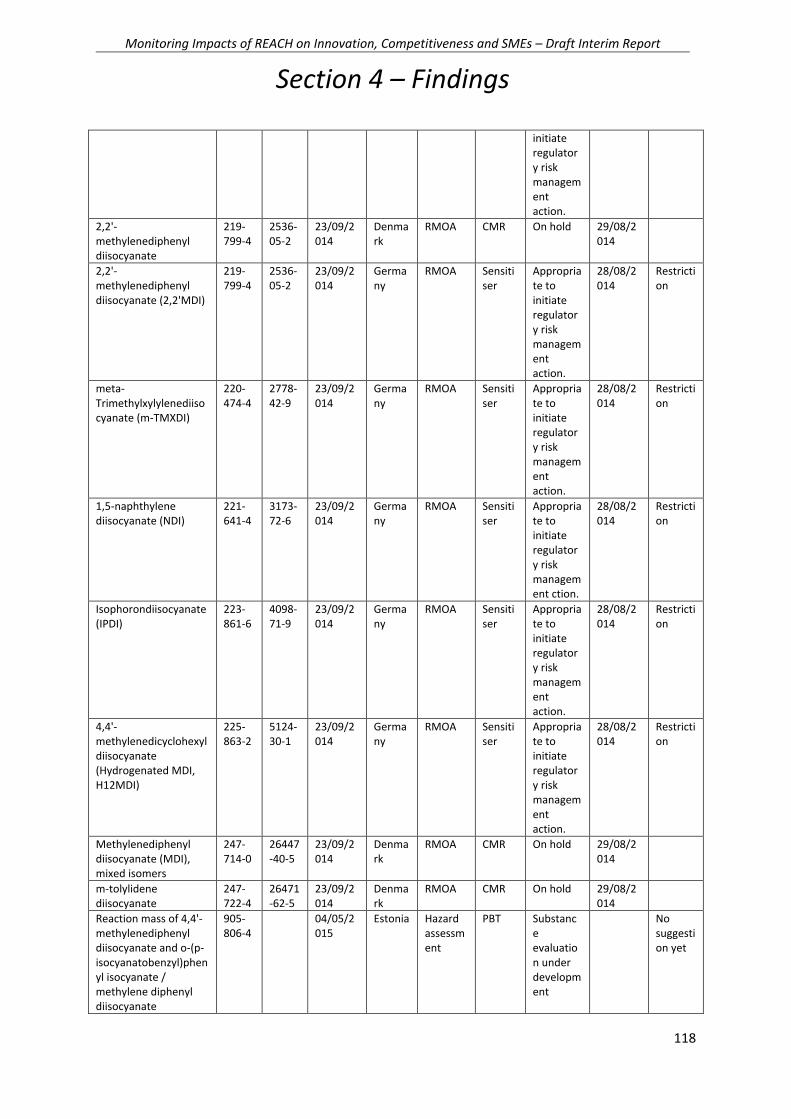
Monitoring Impacts of REACH on Innovation, Competitiveness and SMEs – Draft Interim Report
Section 4 – Findings
118
initiate regulatory risk management action.
2,2'-methylenediphenyl diisocyanate
219-799-4
2536-05-2
23/09/2014
Denmark
RMOA CMR On hold 29/08/2014
2,2'-methylenediphenyl diisocyanate (2,2'MDI)
219-799-4
2536-05-2
23/09/2014
Germany
RMOA Sensitiser
Appropriate to initiate regulatory risk management action.
28/08/2014
Restriction
meta-Trimethylxylylenediisocyanate (m-TMXDI)
220-474-4
2778-42-9
23/09/2014
Germany
RMOA Sensitiser
Appropriate to initiate regulatory risk management action.
28/08/2014
Restriction
1,5-naphthylene diisocyanate (NDI)
221-641-4
3173-72-6
23/09/2014
Germany
RMOA Sensitiser
Appropriate to initiate regulatory risk management ction.
28/08/2014
Restriction
Isophorondiisocyanate (IPDI)
223-861-6
4098-71-9
23/09/2014
Germany
RMOA Sensitiser
Appropriate to initiate regulatory risk management action.
28/08/2014
Restriction
4,4'-methylenedicyclohexyl diisocyanate (Hydrogenated MDI, H12MDI)
225-863-2
5124-30-1
23/09/2014
Germany
RMOA Sensitiser
Appropriate to initiate regulatory risk management action.
28/08/2014
Restriction
Methylenediphenyl diisocyanate (MDI), mixed isomers
247-714-0
26447-40-5
23/09/2014
Denmark
RMOA CMR On hold 29/08/2014
m-tolylidene diisocyanate
247-722-4
26471-62-5
23/09/2014
Denmark
RMOA CMR On hold 29/08/2014
Reaction mass of 4,4'-methylenediphenyl diisocyanate and o-(p-isocyanatobenzyl)phenyl isocyanate / methylene diphenyl diisocyanate
905-806-4
04/05/2015
Estonia Hazard assessment
PBT Substance evaluation under development
No suggestion yet

Monitoring Impacts of REACH on Innovation, Competitiveness and SMEs – Draft Interim Report
Section 4 – Findings
119
4.11 Objective 11 - Support and assistance instruments
4.11.1 Introduction
The aims of this section are to characterise and provide feedback on the available support and assistance instruments to the industry provided by ECHA, Member States and industry associations; to provide feedback on the services most valued and demanded; and to provide feedback to Member States and business organisations on the best practices and areas for further investment. The feedback from SMEs should be considered as a priority.
This study objective concerns the level of support and assistance instruments available to industry and SMEs provided by ECHA, Member State authorities (including the role of REACH helpdesks) and industry associations. There are important links between this objective, which relates to the broader question of the availability of support for firms74, and Objective 9 (Human Resources & Consultants), which relates to the extent to which firms have sufficient internal human capacities and/or are adequately externalising REACH compliance processes to consultants. For both objectives, there is a particular interest in establishing how far external support is sufficient to meet the needs of SMEs in achieving REACH compliance, and in maximising the potential benefits, whilst reducing the potential administrative burdens for smaller firms.
4.11.2 Overall observations
As pointed out in the section on methodology, the feedback from the OBS and the CATI survey does sometimes differ due to the different audiences and delivery methods in question. The CATI survey is designed to be a representative picture of the firms covered. A random sampling method was used. Responses to this survey provide no indication how deep the specific firm is really involved in REACH activities. The Online survey was an internet based open survey. Everybody who was willing to contribute and became aware of the survey could take part. This can be assumed to be more likely firms that are involved in REACH issues and already performed some activities to implement REACH.
Generally it could be observed that companies contributing to the CATI survey used support structures significantly less than companies having contributed to the online business survey (OBS). Even the most common support instrument was used by only 50% of the respondents. This is could be an indication that the individual users prefer different instruments (and therefore no instrument is used by a large majority) or that many companies did not use any of the instruments, yet. As all instruments addressed in the online survey have been used by a high percentage of the respondents the latter explanation (market actors use various information and support instruments) seems more likely.
Another observation supporting the assumption that CATI respondents are not very involved in the REACH implementation is that a high share of the contacted industry associations believes a large share of downstream users is unaware of their REACH obligations (and consequently have not used the supporting instruments extensively).
74 In the following text we refer to support structures. These include all kind of tools (documents, IT-Tools, Helpdesks, websites, information events etc.), that have been developed in the past to support market actors to Implement REACH.

Monitoring Impacts of REACH on Innovation, Competitiveness and SMEs – Draft Interim Report
Section 4 – Findings
120
Table 4.11.1 On the basis of your experience, are firms with a Downstream User role in your sector/country aware of their REACH related responsibilities?
Answer Options Response Percent
Do not know 10,3%
The majority of firms (if not all) are not aware 28,2%
Important part of them are aware 33,3%
Most (if not all of them) are aware 28,2%
Total 100%
N 39
Source: industry association survey
Many organisations have developed support structures. The most commonly used instruments are the guidance documents that have been developed for different REACH processes (e.g. registration, downstream user obligations etc.) or on more specific issues with practical use (e.g. standard SIEF agreements and cost sharing models75, comments on safety data sheet documents76 or the specific Environmental Release Categories that can be used in risk assessments and support registrants in this activity77).
Further supporting instruments are still under development in the frame of the CSR/ES Roadmap as a shared activity between ECHA, member states and industry78, e.g. the standards for an electronic exchange format for extended safety data sheets or methods for the consolidation of information for the safe use of mixtures by downstream users. Especially the outcome of the work on a ready-to-use electronic exchange format and a related IT-tool was often mentioned in interviews a “long awaited”. This is due to the challenge of managing the large amount of new information generated and received from registration.
Overall it was observed that all institutions provide similar “sets” of instruments/support often consisting of guidance documents, training events/network/conference and formats/standards.
Mainly in those cases where practical implementation of REACH-tasks is supported, the respective instruments are actually industry-specific. Examples are associations developing registration dossiers or preparing authorisation dossiers for their members or taking over the administration of SIEF/Consortium processes.
4.11.3 ECHA support structures
REACH was designed as a system that from the start contained elements that aimed to support the stakeholders during implementation. Article 77 defines a list of supporting instruments that the Agency (ECHA) had to generate. Among these the following tasks are listed in the REACH text:
75 See e.g. CEFIC website: Implementing REACH Guidance and tools http://www.cefic.org/Industry-support/Implementing-reach/Guidances-and-Tools1/ 76 E.g. on the website of the Federal Institute for Occupational Safety and Health (BAuA) http://www.baua.de/de/Themen-von-A-Z/Gefahrstoffe/SDB/Muster/Muster.html;jsessionid=460FC4D3B25F38CA367D9FFDB7E91397.1_cid333 77 For an overview on this instrument see Report on the ECHA project: “ASSESSMENT OF RELIABILITY OF SPERCS”FRAMEWORK CONTRACT NO ECHA/2011/01; SERVICE REQUEST SR16” (Ökopol, 2014) http://echa.europa.eu/documents/10162/13628/assessment_of_reliability_of_spercs_final_report_en.pdf 78 http://echa.europa.eu/de/csr-es-roadmap
Monitoring Impacts of REACH on Innovation, Competitiveness and SMEs – Draft Interim Report
Section 4 – Findings
121
Provide data on substances to the public - realised e.g. in database of registered substances or the classification and labelling inventory;
Provide information on strategic developments on substances under REACH - list of substances under evaluation; PACT
Develop technical and scientific support documents for industry stakeholders (these with a special focus on SME) and national authorities and helpdesks - various guidance documents, factsheets, data submission manuals, nutshell guidance documents etc.
Establish supporting structures for competent authorities on substance risks - e.g. RIPE portal for member states79
Registration support for manufacturers and importers - e.g. ECHA helpdesk
Generation of position papers and interpretation of the regulation - various paper to implement REACH processes into practice
On request of the commission give support to countries from non-EU to develop standards for sound chemicals management - e.g. ECHA’s involvement in international chemicals management, such as the OECD, SAICM
Defining standards to generate decisions for the various REACH tasks - e.g. screening approach to identify potential SVHC80
Publication of decisions - Portal on decisions81
Provide formats to enable submission of information to ECHA - e.g. IUCLID, integrated input masks in REACH IT
An overview on the status of the implementation activities by ECHA is given every year in the general reports of the Agency82. In a report to the Commission in the frame of the REACH Review 201283 it was concluded that ECHA achieved most of its support obligations. However, it was also stated that some instruments or activities would need further improvement. This can also be seen in the stakeholder answers in the online business survey of the current study. While over 90 % of the respondents across all REACH roles84 answered that ECHA supporting instruments have been used, which was the maximum value, the degree of usefulness varied between 9.1 % and 29.8 % that found the ECHA support extremely or very useful. Another 20.4 % to 7.3 evaluated it only slightly useful or not useful at all.
Stakeholders often highlighted that the supporting documents are too extensive and often too scientific which makes it difficult for some stakeholders to use them. It was further highlighted that the availability of supporting structures in national languages is core to improve understanding of REACH among the stakeholders.
Many comments have been received in the surveys that qualified the ECHA Website as a very useful instrument on its own. Another instrument that has been mentioned to be helpful is the registration
79 REACH Information Portal for Enforcement 80 See http://echa.europa.eu/addressing-chemicals-of-concern/substances-of-potential-concern/screening (status 03.06.2015) 81 http://echa.europa.eu/en/about-us/who-we-are/board-of-appeal/decisions 82 http://echa.europa.eu/web/guest/about-us/the-way-we-work/plans-and-reports 83 PriceWaterhouseCoopers (2012) on behalf of the EU-COM DG ENT (now Growth), The Review of the European Chemicals Agency Main report http://ec.europa.eu/enterprise/sectors/chemicals/documents/reach/review2012/echa_en.htm 84 Manufacturer and Importer, Formulators of mixtures, Distributors, Supplier of articles and End user of chemicals

Monitoring Impacts of REACH on Innovation, Competitiveness and SMEs – Draft Interim Report
Section 4 – Findings
122
database (Portal on registered substances: http://echa.europa.eu/information-on-chemicals/registered-substances.
Many stakeholders stated the further development of existing supporting instruments, in particular regarding their accessibility for SME with regard to 2018 is important. However, over 50% of the respondants across all stakeholder groups welcomed that tool updates are limited to only twice a year (even 65 % among the manufacturers).
With regard to the next registration phase ECHA started to reorganise their website structure and to
develop dedicated shorter guidance for SME85. When conducting the survey, no responses were
provided on these tools particularly developed for SME. Support structures are developed with
regard to the following expectations by ECHA86:
Number of registration dossiers and substances will be about three times the number of the
ones registered up to now
New SIEF will be smaller
It is expected that more importers and more SME will be involved
It is also expected that the last registration phase will also be the one with the largest number of
substances also for large enterprises (they will also register more substances than up to now)
There will be more registrations in the tonnage band 1 – 10 tpa than in the 10 -100 tpa band
(which means there will only be the need to provide a basic data set according to Annex VII and
no CSR). As a result from that it there is the expectation that costs for such registrations should
range between € 5,000 and 50,000.
Based on this assumptions new support instruments are being developed. These do not aim for the
large firms that will register a large number of substances but are already experienced. New
instruments aim for reduction of complexity of information materials and instruments that are
needed to perform registrations. In the following lines these new elements will be described:
IT-Systems: IUCLID 6 will be provided as a basic version with less functionalities that only covers
registration requirements needed for the lower tonnage bands and single substances. Installation
will be optimised. As a result the IUCLID 6 software will be provided self installing.
Additionally, a web interface will be developed to enable member registrants to generate their joint
dossier online.
Help texts will be directly integrated into the tool. The aim is to avoid the use of additional external
guidance documents as far as possible. The help texts will be translated in different languages.
Emergency team: A dedicated team of ECHA staff is providing help on ECHA´s own initiative when it
is noticed that problems occur with registration (e.g. repeated submission failures from the same
legal entity). Pragmatic support is offered via the telephone in a direct discussion.
Partner for development of specific guidance: Industry association and consortia for specific
substance groups often develop dedicated guidance to ensure successful registration for a specific
85 see http://echa.europa.eu/reach-2018 86 Interview with ECHA after data generation in the frame of this study.
Monitoring Impacts of REACH on Innovation, Competitiveness and SMEs – Draft Interim Report
Section 4 – Findings
123
sector of substance group. These often cover clarifications on substance identity (e.g. in case of
UVCB-substances, or substances with similar chemical structures87. ECHA served as discussion
partner and checked the approaches in a critical review. By such a process market actors gain
approval of a specific approach and predictability of the outcome of the registration process, when
such an approach is applied.
Capacity building: As described above one challenge for 2018 will be to inform new registrants on
the registration process. The basis of ECHA activities with this regard are two elements:
ECHA has set up a network of “networkers”. Aim is to facilitate information campaigns in
member states and dedicated target groups. Members of this network come from the member
states and other ECHA associated organisations. The network is open to any organisation that
wants to contribute and refers also to existing structures (e.g. the directors contact group). ECHA
provide information material, initiates campaigns via social media and short movies to target
various information channels. Local events in MS are intended to be initiated by members of the
network. ECHA will support such activities either by providing information material or if
reasonable with dedicated staff for presentations in events.
As already mentioned ECHA developed dedicated support websites for the registration phase
2018. The basic concept of this site is the division of the registration process in 7 phases88.
Phases will be complemented with information material (see above) and support will be
organised in a time line until 2018. Each phase will be announced with a press release and
accompanied by a webinar that explains the content of each phase (first phase started in June
2015). Press work will be organised in a concerted campaign with members states (press at
release the same time in MS, ECHA)
Further support is developed on a case by case basis where gaps are seen. In the frame of the
Commission initiative to develop an implementing act to implement further rules for cost sharing
among SIEF members, ECHA has developed a document with recommendations for co-registrants
with recommendations89 on cost sharing principles and what is seen as transparent, fair and non-
discriminatory.
4.11.4 Industry association tools
Industry associations provide assistance in REACH implementation on various levels. Assistance ranges from the development of general guidance documents that explain REACH through guidance documents that are aimed at dedicated industry sectors (e.g. for cars90, metals91 and others) to very
87 Examples in the past have been essential oils form plant extracts or pigments and dyes. 88 In principle these have to be performed in a row but it can be that some have to undergo an iterative process. 89 DIRECTORS’ CONTACT GROUP, DCG3/7/AP3a,1 October 2014, FIRST EDITION, FAIR, TRANSPARENT AND NON-DISCRIMINATORY COST SHARING IN SIEFS, http://echa.europa.eu/documents/10162/13559/dcg_fair_transparent_cost_sharing_en.pdf 90 ACEA 2012 REACH: Automotive Industry Guideline, http://www.acea.be/publications/article/reach-automotive-industry-guideline) available in six languages, three non EU (Chinese, Korean, Japanese) 91 Eurometaux and other industry assocciations: Industry REACH Authorisation Guidance for Downstream Users http://www.reach-metals.eu/index.php?option=com_content&task=view&id=171&Itemid=270
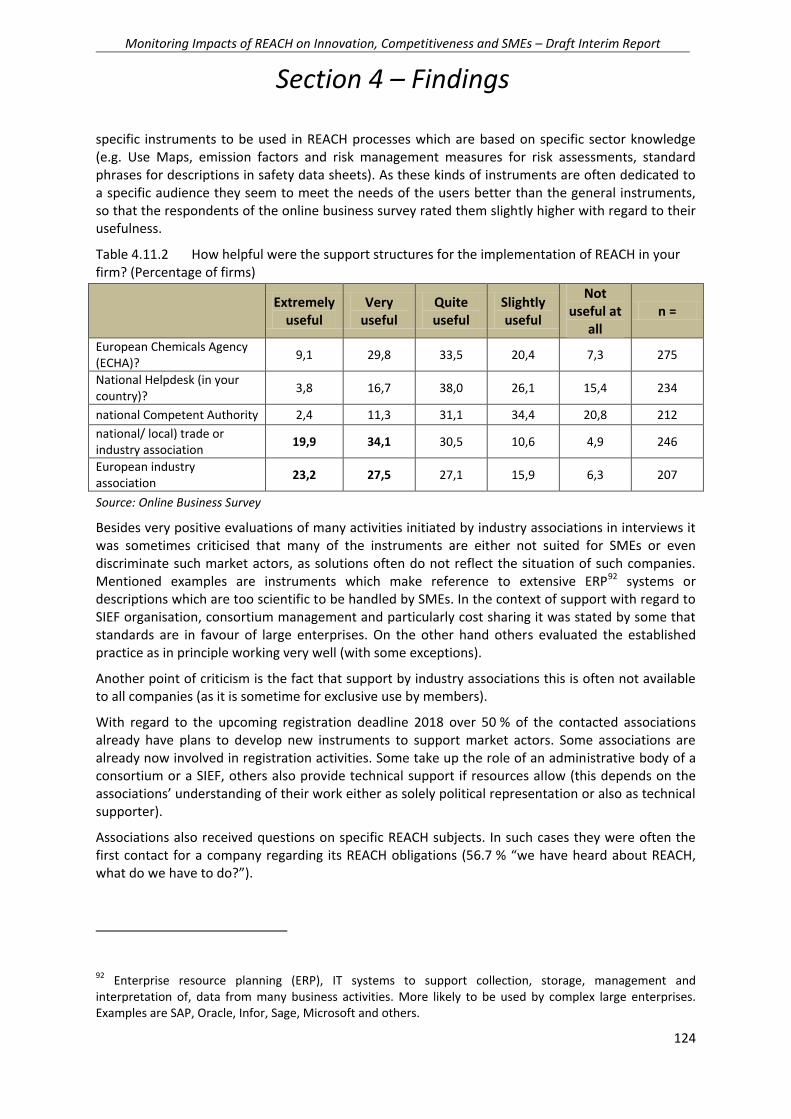
Monitoring Impacts of REACH on Innovation, Competitiveness and SMEs – Draft Interim Report
Section 4 – Findings
124
specific instruments to be used in REACH processes which are based on specific sector knowledge (e.g. Use Maps, emission factors and risk management measures for risk assessments, standard phrases for descriptions in safety data sheets). As these kinds of instruments are often dedicated to a specific audience they seem to meet the needs of the users better than the general instruments, so that the respondents of the online business survey rated them slightly higher with regard to their usefulness.
Table 4.11.2 How helpful were the support structures for the implementation of REACH in your firm? (Percentage of firms)
Extremely
useful Very
useful Quite useful
Slightly useful
Not useful at
all n =
European Chemicals Agency (ECHA)?
9,1 29,8 33,5 20,4 7,3 275
National Helpdesk (in your country)?
3,8 16,7 38,0 26,1 15,4 234
national Competent Authority 2,4 11,3 31,1 34,4 20,8 212
national/ local) trade or industry association
19,9 34,1 30,5 10,6 4,9 246
European industry association
23,2 27,5 27,1 15,9 6,3 207
Source: Online Business Survey
Besides very positive evaluations of many activities initiated by industry associations in interviews it was sometimes criticised that many of the instruments are either not suited for SMEs or even discriminate such market actors, as solutions often do not reflect the situation of such companies. Mentioned examples are instruments which make reference to extensive ERP92 systems or descriptions which are too scientific to be handled by SMEs. In the context of support with regard to SIEF organisation, consortium management and particularly cost sharing it was stated by some that standards are in favour of large enterprises. On the other hand others evaluated the established practice as in principle working very well (with some exceptions).
Another point of criticism is the fact that support by industry associations this is often not available to all companies (as it is sometime for exclusive use by members).
With regard to the upcoming registration deadline 2018 over 50 % of the contacted associations already have plans to develop new instruments to support market actors. Some associations are already now involved in registration activities. Some take up the role of an administrative body of a consortium or a SIEF, others also provide technical support if resources allow (this depends on the associations’ understanding of their work either as solely political representation or also as technical supporter).
Associations also received questions on specific REACH subjects. In such cases they were often the first contact for a company regarding its REACH obligations (56.7 % “we have heard about REACH, what do we have to do?”).
92 Enterprise resource planning (ERP), IT systems to support collection, storage, management and interpretation of, data from many business activities. More likely to be used by complex large enterprises. Examples are SAP, Oracle, Infor, Sage, Microsoft and others.

Monitoring Impacts of REACH on Innovation, Competitiveness and SMEs – Draft Interim Report
Section 4 – Findings
125
Besides guidance documents, training events and experience exchange workshops were most frequent used by market actors (see table below). Several interviewed SMEs said that they found the type of experience exchange program that was run by Essencia particularly useful. EEF also said these were most appreciated by SMEs but there were challenges in funding such programmes.
Table 4.11.3 : Use of Industry association tools during REACH implementation in your firm? (percentage of firms)
Manufac
turer Formulat
or Distribut
or Importer Supplier End user
All firm
s
Guidance documents 86,7 95,3 88,0 78,9 81,5 85,5 86,3
IT based support tools (e-learning, supportive IT solutions)
61,8 45,2 48,0 47,2 29,6 54,7 51,9
Online helpdesk 64,4 66,7 56,0 55,3 38,5 55,6 58,7
Training events 87,1 90,7 88,0 76,3 66,7 74,1 81,9
Experience exchange workshops / information networks
86,3 83,7 84,0 73,0 74,1 79,6 81,6
n 105 43 25 38 27 55 293
Source: Online Business Survey
These two instruments both have a high degree of acceptance with regard to usefulness (approximately 50 % considered either type of instrument as extremely or very useful and a very low share of market actors (app. 20%) found these tools not useful at all or only slightly useful). This high evaluation of usefulness differed from the evaluation of such events organised by member state public bodies (only about 30 % extremely or very useful).
Chart 4.11.1 How useful was the specific industry association tool (if used)?
Source: Online Business Survey
26
7
7
31
45
86
25
32
81
89
97
57
69
82
60
35
39
47
34
32
9
20
13
8
9
0% 10% 20% 30% 40% 50% 60% 70% 80% 90% 100%
Guidance documents
IT based support tools (e-learning, supportive ITsolutions)
Online helpdesk
Training events
Experience exchange workshops / informationnetworks
Extremely useful Very useful Quite useful Slightly useful Not useful at all
Monitoring Impacts of REACH on Innovation, Competitiveness and SMEs – Draft Interim Report
Section 4 – Findings
126
4.11.5 Member state support structures
The report on the operation of REACH (RPA, Ökopol 201293) stated that helpdesks have been
established in all member states. With regard to the effectiveness and diversity of the support
structures it was reported that some variance existed among the different helpdesks. Member state
authorities and the national helpdesks in parts mirrored the support structures of ECHA. Core
elements are the website of the helpdesk (sometimes integrated in websites of national authorities
or commissioned institutions), written guidance documents in national languages and often some
information material for certain sectors (often SME).
In some countries dedicated information events have been organised to inform industry on their
REACH obligations. In an interview it was stated that a roadshow on REACH was established initiating
workshops throughout the county to provide basic information on REACH. Sometime these events
were combined with other issues of interest for companies in order to reach firms that are not
aware of the own involvement in REACH. Some of these countries made use of a high mandatory
organisation of companies in national structures (e.g. some countries have mandatory memberships
in chambers).
The helpdesk are evaluated by the stakeholders as very important with regard to answering specific
questions, but it was often criticised in the interviews and the surveys that answers are often too
general or just making a link to the specific Article in the REACH text instead of going a step further
and provide legally robust interpretations of the REACH text or pragmatic advice how to proceed.
Another reason for critics was that some helpdesks often had rather long reaction times, which
often do not fit with the timing problems to be dealt with in firms or among stakeholders.
Nevertheless it was acknowledged that at least harmonised Q&A documents are available and that
the ECHA helpnet now intensifies its work to share best practice among the national helpdesks and
define shared approaches.
4.11.6 Consultants
Consultants provide a wide range of services with regard to REACH. Some are more technical others provide strategic consultancy or serve as administrative support for REACH activities.
In interviews especially smaller firms stated that the use of consultant during registrations is almost unavoidable, as the wide range of tasks cannot be covered by own staff, which in many cases not even is organised in a dedicated REACH unit but is fulfilling REACH task besides other activities.
With regard to registration services the interviewed persons often stated that there was a problem of finding the right consultant that could be
a. Trusted, and b. Had the right level of knowledge
It was reported that the cost of the consultant is not an indication of quality and cannot be judged from the start. The most expensive consultants partly did not deliver the best quality and the
93 http://ec.europa.eu/enterprise/sectors/chemicals/documents/reach/review2012/commission_report_en.htm
Monitoring Impacts of REACH on Innovation, Competitiveness and SMEs – Draft Interim Report
Section 4 – Findings
127
consultant with lowest rates may turn out to be rather costly as they work inefficiently (and spend many hours).
All actors were very clear that the complete REACH process would not be possible without the help of external services. Some market actors complained that the extension of discussions on chemical risks is not related to experience of the involved persons (often not an expert discussion, which increases efforts a lot).
4.11.7 Conclusions and recommendations
The assessment showed that there is no lack of supporting structures on all levels of supporting actors. Some issues with regard to quality have been reported. For companies that already have well established REACH structures the existing information seems to be suited very well. With regard to the 2018 registration deadline already first improvements can be observed to develop SME adapted support structures like e.g. the dedicated parts of the ECHA Website (this was already an outcome of the REACH review 2012 and is now under implementation). Issues that still need serious consideration are:
How can firms become involved in the REACH process that are still not aware? Some approaches have shown to be promising, e.g.
o linking REACH to other relevant issues in information events, o using high organisation grades of firms in national organisations to address the issue o intensify public events close to the companies – roadshow (low efforts in participation) o simplify content (at least in the beginning) to keep firms involved (wrong level of
information demotivates involved people as they can´t follow the debate – not able to handle REACH, REACH is very complicated)
- Some processes that have been implemented to provide new (scientific) instruments lack a pragmatic breakdown on a level suited for SME (e.g. activities on (e)SDS by content and by technical implementation
- Some firms stated that the complexity of industry processes cannot be reflected with an adequate detail in many guidance documents as these tend to generalise. In such cases more tailored support instrument may need to be developed. Such instruments could cover: - Collection of best practice for specific situations:
This requires openness by companies that already have experience and are willing to share these and invest some time, in order to make the system work better
- Generation of more sector specific solutions. This requires technical experts from the associations/the sector to provide expertise. Some sectors do not within associations. A starting point for this can be best practice examples.
- SME should be more strongly represented in panels that are intended to develop REACH implementation instruments (like CSR/ES) so that SME requirements are considered from the beginning. As it can be expected that resources are limited in this area it should be considered to provide financial support for external experts (is the outcome applicable for a wide range of firms? Is the outcome only “high level” or are they tested by e.g. SME?).

Monitoring Impacts of REACH on Innovation, Competitiveness and SMEs – Draft Interim Report
Section 4 – Findings
128
4.12 Objective 12 – Registration 2018
4.12.1 Introduction
The key study objectives in respect of Registration 2018 (Objective 12) are as follows:
Based on the findings in other subject areas, update the estimates with regard to the costs of the 2018 registration deadline if no changes are made in the implementation of REACH as compared to the current practice; and
establish specific cost categories with a highest room for achieving cost-efficiencies, as well as suggesting specific implementation measures to achieve them, while maintaining the capacity to deliver the expected health and environmental benefits.
Implications for updating of estimates of the 2018 registration costs
Objective 3 of this study (discussed in Section 4.3) provided an updated assessment of the costs of Registration 2013 using data from the CATI and OBS, comparing the resulting costs with those presented in the Commission’s Extended Impact Assessment (EIA). Conclusions were drawn on necessary adjustments for the estimation of the costs for the Registration 2018 exercise. Here it was concluded that the assessment should:
better reflect the costs of purchasing data from the owners of information; and
better reflect the administrative and legal costs of consortium/joint registration and SIEF formation (as the EIA pre-dated REACH provisions on SIEFs).
In terms of testing and information costs, for the 100-1000t substances both the survey and ECHA data suggest that far fewer new tests have been required for the 100-1,000t substances than were anticipated. This in spite of the fact that the EIA assumed wide use of QSARs to deliver some of the anticipated missing test information and this has not occurred to the extent that was envisaged at the time of the EIA.
With regard to the 1-10t and 10-100t substances to be registered in 2018, however, it does not necessarily follow that just because more information was available on the 100-1,000t substances than was anticipated, the same will be true for the remaining substances. As such, it does not seem reasonable to change estimates of the number of substances for which new information will be required for Annexes VII and VIII dramatically. What may need adjusting, however, is the extent to which QSARs will be used to fulfil these information requirements entirely. Here, drawing on the JRCs testing scenarios, the EIA was ambitious concerning the extent to which QSARs would satisfy information requirements without the need for testing. The EIA assumes that negative results from QSARs (or read across) would be an acceptable substitute for test information. Whilst in principle a negative result from a robust QSAR/Read Across (supported by appropriately robust expert opinion) can be used as a substitute for a test, ECHA has yet to accept a negative result for a QSAR as a substitute for a missing test endpoint. The necessary time and expertise also makes such detailed assessment more expensive than conducting the test. As such, estimates need to be based on the presumption that testing will be performed to satisfy the detailed information requirements in Annexes VII and VIII rather than QSARs (where the reverse was true in the EIA).
Approach to assessment
RPA recently updated the Excel® based Monte Carlo simulation model that was used by the Commission in its final assessment of revisions to REACH requirements for 1-10ts (in November 2006). The model was updated as part of a study to assess options for changing the information
Monitoring Impacts of REACH on Innovation, Competitiveness and SMEs – Draft Interim Report
Section 4 – Findings
129
requirements for 1-10t substances94 (for DG Environment). A detailed description of how the model works is provided in the 15 page Annex to the Final Report of that study and this section provides a brief overview of the approach and how the model has been adjusted so that it applies to substances to be registered only at 1-10t and also:
Substances to be registered only at 10-100t; and
10-100t substances also registered at 1-10t.
Overview of the Monte Carlo approach
The Monte Carlo model uses a probabilistic model to consider the registration of individual substances. It considers one substance at a time, using probabilities to generate a profile of each substance in respect of the key determinants of cost variation. Here, the costs of registering any given substance depend on a number of factors including:
Whether there is already toxicological or ecotoxicological information on that substance or whether there is some or none;
Whether that substance is identified by QSARs or other evidence as meeting one or more of the criteria in Annex III (or variants of in the options) and, hence, must generate the toxicological and ecotoxicological information in Annex VII (only applies to 1-10t substances);
The outcome of screening tests and, in particular, those for mutagenicity (where a positive result will require that further testing is undertaken);
For Chemical Safety Assessment (CSA), whether a exposure assessment and risk characterisation is required in addition to hazard assessments (applies only to 10-100t substances);
The number of companies registering that substance (which influences both the sharing of information costs in a SIEF and also the cost of administering a SIEF);
Whether the registrants of that substance will all support a joint registration or whether one or more individual registrations will be submitted also; and
The size of the companies registering that substance (which determines the registration fees due and also allows exploration of the impacts on SMEs versus larger companies).
Clearly, different permutations of the above have different results in terms of the cost of registering different substances. In addition, the number of possible permutations is very large (a few thousand possibilities). Some permutations will result in relatively large costs of registration and some relatively low costs. The Monte Carlo simulation model explores the different permutations, calculating and recording the costs associated with each. In this way, the circa. 150,000 rows of data produced by the simulation provide a cost distribution similar to that observed in the results of the cost estimation for REACH 2013.
The probability of each permutation is governed by the individual probability of each factor. Probabilities have been derived by consideration of statistical data and, where not available estimates. Table 4.12.1 provides a summary of the draft inputs to the model and the decision/costing rules that are applied within in it. These are based on a combination of data, previous assessments and estimation informed as much as possible by data including that from the
94 Technical assistance related to the review of REACH with regard to the obligations for substances manufactured/imported in the range 1-10t tonnes per year. Contract: 070307/2013/668917/SER/ENV.A.3

Monitoring Impacts of REACH on Innovation, Competitiveness and SMEs – Draft Interim Report
Section 4 – Findings
130
assessment of costs of Registration 2013 presented in Section 4.3. The numbers and values presented in the table are draft work in progress as we are still awaiting information from ECHA (if available) that may allow adjustments and refinements to be made to the values underpinning the cost model. We will also further consider adjustments in the light of other survey results on numbers for Registration 2018 alongside the data from ECHA (if available). Given the vast quantities of information generated by the model, it is not possible to provide a draft cost estimate.
Table 4.12.2 provides the test costs used and also the estimated cost of providing study summaries/ robust study summaries (as appropriate to tonnage band).

Monitoring Impacts of REACH on Innovation, Competitiveness and SMEs – Draft Interim Report
Section 4 – Findings
131
Table 4.12.1: Key data, estimates and rules applied in the model (Draft)
Substances registered 1-10t only Substances registered at 10-100t only Notes (where relevant)
Number of substances registered in each tonnage band
20,000 5,000 Applied in the Extended Impact Assessment
Percentage of 10-100t substances also registered at 1-10ts
N/A 30% Estimate
Availability of (test) information
17% of substances have information on all Annex VII endpoints; 13% have test information on skin/eye corrosion and irritation and acute toxicity (oral); and 70% have no test information
17% of substances have information on all Annex VII endpoints and also of these:
30% also have Annex VIII 8.5.3. Acute toxicity - Toxicity via Dermal routes
5% also have Annex VIII 8.5.2. Acute toxicity - Toxicity via Inhalation
5% also have Annex VIII 8.6.1. Repeat dose toxicity - Short term (1 route only)
30% also have Annex VIII 9.1.3. Aquatic Toxicity - Fish – short-term
13% have test information on all Annex VII endpoints 70% have no test information
Drawn from the 2006 ECB assumptions on the percentage of substances with a complete data set and altered to reflect availability of additional information
Number of substances requiring data from Annexes
40% require full Annex VII Information by the application of Article 12 and Annex III; 60% require information on physico-chemical information in Annex VII only by the application of Article 12 and Annex III.
100% require Annex VII and VIII information
Modelled from classification of substances on CLI combined with availability of data and applicability of screening QSARs and Read Across (RA) and assuming 40% of substances have a dispersive/diffuse use as per the Commission’s assessments in 2006 (see 1-10t report)
Cost of screening QSARs for Article 12 and Annex III
€1,500 per substance for which there is not existing test information on all Annex VII endpoints (83%) and for which there is not already QSAR information (assumed to be 60% of these – 50% overall)
N/A
Based on discussions with laboratories providing QSAR information but equally could apply to in-house assessments using QSAR software (which might be expected to take
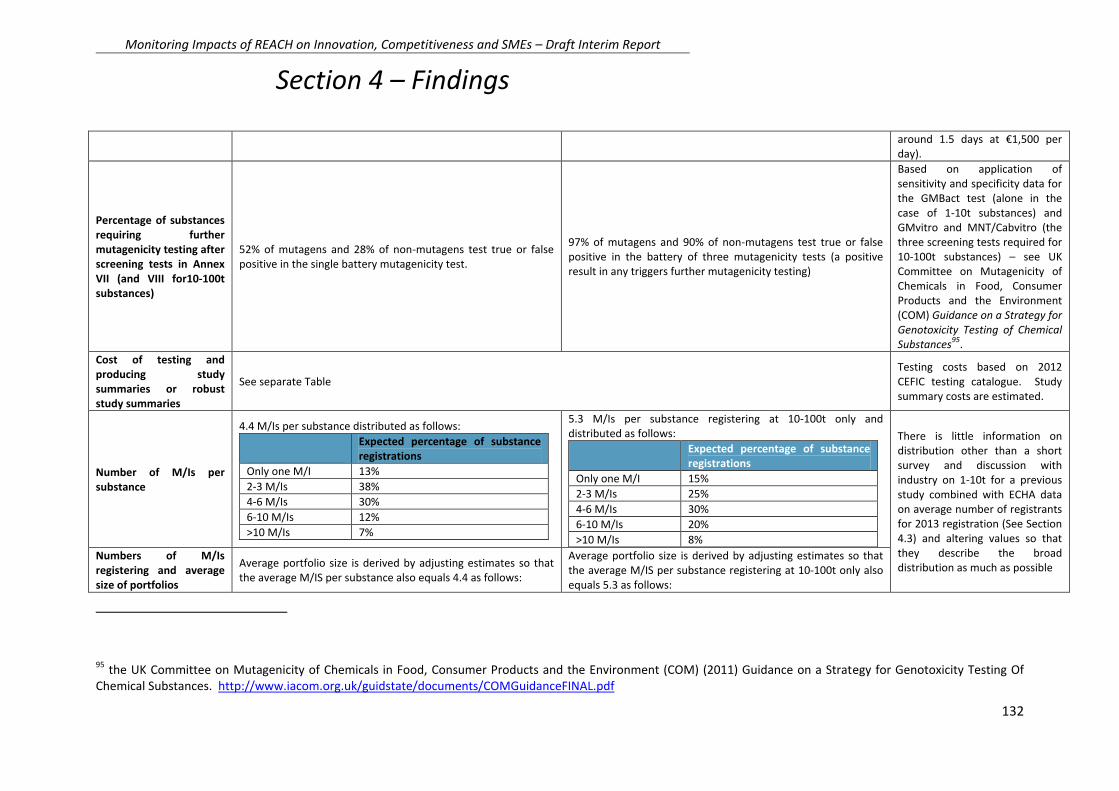
Monitoring Impacts of REACH on Innovation, Competitiveness and SMEs – Draft Interim Report
Section 4 – Findings
132
around 1.5 days at €1,500 per day).
Percentage of substances requiring further mutagenicity testing after screening tests in Annex VII (and VIII for10-100t substances)
52% of mutagens and 28% of non-mutagens test true or false positive in the single battery mutagenicity test.
97% of mutagens and 90% of non-mutagens test true or false positive in the battery of three mutagenicity tests (a positive result in any triggers further mutagenicity testing)
Based on application of sensitivity and specificity data for the GMBact test (alone in the case of 1-10t substances) and GMvitro and MNT/Cabvitro (the three screening tests required for 10-100t substances) – see UK Committee on Mutagenicity of Chemicals in Food, Consumer Products and the Environment (COM) Guidance on a Strategy for Genotoxicity Testing of Chemical Substances95.
Cost of testing and producing study summaries or robust study summaries
See separate Table Testing costs based on 2012 CEFIC testing catalogue. Study summary costs are estimated.
Number of M/Is per substance
4.4 M/Is per substance distributed as follows:
Expected percentage of substance registrations
Only one M/I 13%
2-3 M/Is 38%
4-6 M/Is 30%
6-10 M/Is 12%
>10 M/Is 7%
5.3 M/Is per substance registering at 10-100t only and distributed as follows:
Expected percentage of substance registrations
Only one M/I 15%
2-3 M/Is 25%
4-6 M/Is 30%
6-10 M/Is 20%
>10 M/Is 8%
There is little information on distribution other than a short survey and discussion with industry on 1-10t for a previous study combined with ECHA data on average number of registrants for 2013 registration (See Section 4.3) and altering values so that they describe the broad distribution as much as possible
Numbers of M/Is registering and average size of portfolios
Average portfolio size is derived by adjusting estimates so that the average M/IS per substance also equals 4.4 as follows:
Average portfolio size is derived by adjusting estimates so that the average M/IS per substance registering at 10-100t only also equals 5.3 as follows:
95 the UK Committee on Mutagenicity of Chemicals in Food, Consumer Products and the Environment (COM) (2011) Guidance on a Strategy for Genotoxicity Testing Of Chemical Substances. http://www.iacom.org.uk/guidstate/documents/COMGuidanceFINAL.pdf

Monitoring Impacts of REACH on Innovation, Competitiveness and SMEs – Draft Interim Report
Section 4 – Findings
133
Number of M/Is Registering
Average size of Portfolios
Micro 8,600 5
Small 2,500 7
Medium 1,100 12
Large 400 36
Number of M/Is Registering
Average size of Portfolios
Micro 4,300 1.5
Small 1,500 2
Medium 800 2.5
Large 1,100 13.5
10-100t substances also registered at 1-10t
30% of the 10-100t substances are also registered at 1-10t. The number of registrants at 1-10t is equal to 35-50% of number of M/Is registering the substance at 10-100t
Estimate
Individual versus joint registration
Where there is only one M/I the registration for the substance is, by default, an individual registration. Where there is more than one M/I:
in 70% of cases all M/Is submit a single joint registration;
in 30% is one joint registration plus one or more individual registrations for a substance
where the latter occurs between 20% and 30% of the M/Is registering that substance will submit individual submissions and the remainder will submit jointly.
Estimate
Cost of producing a full registration dossier for an individual registration
Lower bound Upper Bound
Micro € 2,200 € 3,200
Small € 2,000 € 3,000
Medium € 2,000 € 2,800
Large € 1,500 € 2,000
Lower bound Upper Bound
Micro € 8,000 € 10,000
Small
Medium
Large €7,000 €8,000
Estimation informed by the results of the cost components calculated for Registration 2013 (see Section 4.3).
Cost of producing a full registration dossier for a joint
Lower bound Upper Bound
All members are micro enterprises
€ 2,800 € 3,800
Small is the largest member (no medium or large M/Is)
€ 2,500 € 3,500
Medium is the largest member (no large M/Is)
€ 2,500 € 3,300
Large € 2,000 € 2,500
Lower bound Upper Bound
All members are micro enterprises
€ 11,000 € 15,000
Small is the largest member (no medium or large M/Is)
Medium is the largest member (no large M/Is)
Large € 10,000 € 13,000
Estimation informed by the results of the cost components calculated for Registration 2013 (see Section 4.3).
Cost of producing a registration dossier containing physico-chemical information only (for 1-10t substances only)
80-90% of the equivalent cost for a full registration N/A Estimate

Monitoring Impacts of REACH on Innovation, Competitiveness and SMEs – Draft Interim Report
Section 4 – Findings
134
Joint registration and SIEF administration costs
Cost of engaging on information (applies to each registrant) = € 1,000 per M/I registering. Cost of engaging on dossier preparation (applies to each registrant in a consortium) = € 750 per M/I jointly registering. For registrations that only include only physico-chemical information, costs are 80-90% of the above.
Cost of engaging on information (applies to each registrant) = € 2,000 per M/I registering. Cost of engaging on dossier preparation (applies to each registrant in a consortium) = € 3,000 per M/I jointly registering.
Estimation informed by the results of the cost components calculated for Registration 2013 (see Section 4.3).
Costs of revising Substance Safety Data Sheets (SDSs)/producing eSDS
€500 per substance – Needs adjustment Incorporated into cost of producing CSA/CSR (see costs below)
Estimation informed by the results of the cost components calculated for Registration 2013 (see Section 4.3).
Cost of Producing CSA/CSR
N/A
CSA element Lower bound Upper Bound
Physico-chemical, environmental and human health hazard assessment
€3000 €6000
Cost of PBT/vPvB screening
€750
Cost of exposure assessment and risk characterisation (when required)*
€4000 €7000
Cost of further testing for PBT/vPvB Assessment and write up**
€21,000
* only required for dangerous substances – assumed to be 40% as per EIA – see below ** only required where PBT/vPvB screening suggests may meet criteria – see below
Dangerous 10-100t substances
N/A As per the EIA, 40% of substances are estimated to have dangerous properties that will require exposure assessment and risk characterisation in addition to hazard assessment and
As per the EIA.
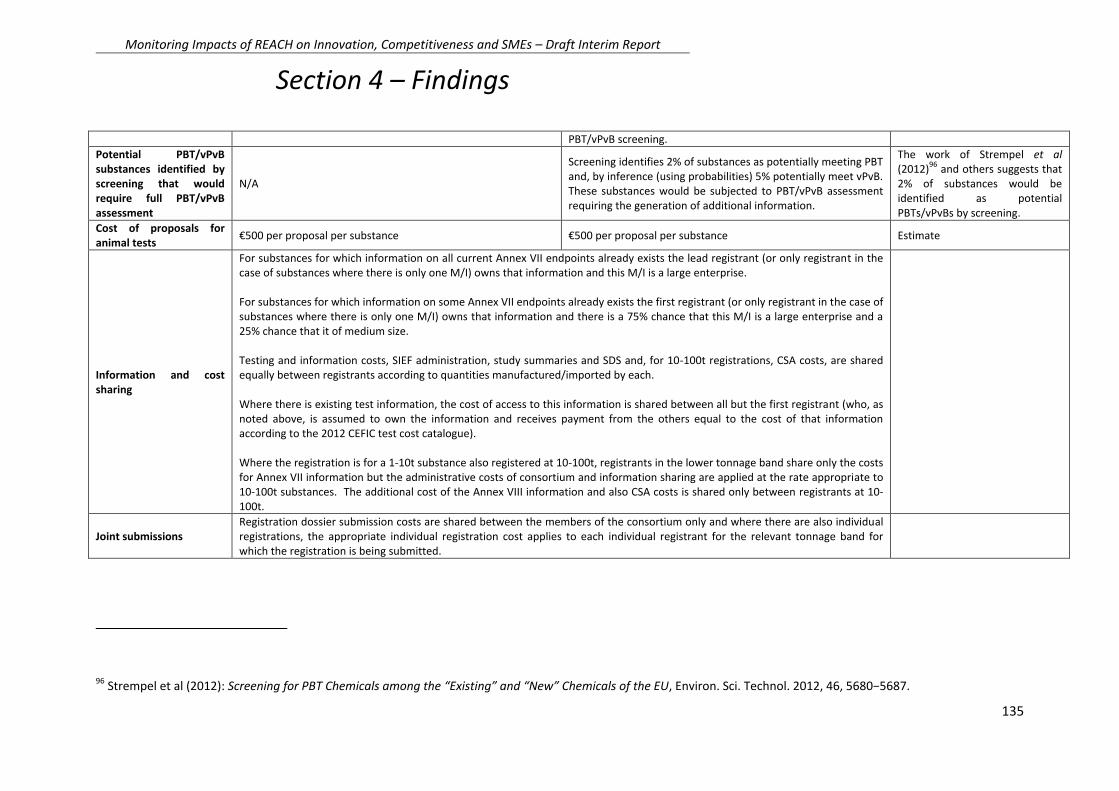
Monitoring Impacts of REACH on Innovation, Competitiveness and SMEs – Draft Interim Report
Section 4 – Findings
135
PBT/vPvB screening.
Potential PBT/vPvB substances identified by screening that would require full PBT/vPvB assessment
N/A
Screening identifies 2% of substances as potentially meeting PBT and, by inference (using probabilities) 5% potentially meet vPvB. These substances would be subjected to PBT/vPvB assessment requiring the generation of additional information.
The work of Strempel et al (2012)96 and others suggests that 2% of substances would be identified as potential PBTs/vPvBs by screening.
Cost of proposals for animal tests
€500 per proposal per substance €500 per proposal per substance Estimate
Information and cost sharing
For substances for which information on all current Annex VII endpoints already exists the lead registrant (or only registrant in the case of substances where there is only one M/I) owns that information and this M/I is a large enterprise. For substances for which information on some Annex VII endpoints already exists the first registrant (or only registrant in the case of substances where there is only one M/I) owns that information and there is a 75% chance that this M/I is a large enterprise and a 25% chance that it of medium size. Testing and information costs, SIEF administration, study summaries and SDS and, for 10-100t registrations, CSA costs, are shared equally between registrants according to quantities manufactured/imported by each. Where there is existing test information, the cost of access to this information is shared between all but the first registrant (who, as noted above, is assumed to own the information and receives payment from the others equal to the cost of that information according to the 2012 CEFIC test cost catalogue). Where the registration is for a 1-10t substance also registered at 10-100t, registrants in the lower tonnage band share only the costs for Annex VII information but the administrative costs of consortium and information sharing are applied at the rate appropriate to 10-100t substances. The additional cost of the Annex VIII information and also CSA costs is shared only between registrants at 10-100t.
Joint submissions Registration dossier submission costs are shared between the members of the consortium only and where there are also individual registrations, the appropriate individual registration cost applies to each individual registrant for the relevant tonnage band for which the registration is being submitted.
96 Strempel et al (2012): Screening for PBT Chemicals among the “Existing” and “New” Chemicals of the EU, Environ. Sci. Technol. 2012, 46, 5680−5687.

Monitoring Impacts of REACH on Innovation, Competitiveness and SMEs – Draft Interim Report
Section 4 – Findings
136
Fees As established under Commission Regulation97. Under Article 74(2) of REACH these fees do not apply when full toxicological and ecotoxicological data from Annex VII are provided.
As established under Commission Regulation.
Table 4.12.2: Costs of test information and presentation in (robust) study summaries
Cost of information
Study summaries/presentation of information in Dossier (1-10t)
Robust Study summaries/presentation of information in Dossier (10-100t)
Cost of QSARs for Annex III € 1,500 € 500 N/A
Annex VII 8.1. Skin irritation/ corrosion - In vitro skin corrosion/irritation € 2,580 € 100 € 150
Annex VII 8.2. Eye irritation - In vitro eye irritation € 1,552 € 100 € 150
Annex VII 8.3. Skin sensitisation - In vivo LLNA € 7,117 € 100 € 150
Annex VII 8.4.1 GMbact: gene mutation test in bacteria (Ames test) € 3,465 € 250 € 300
Annex VIII 8.4.2 CAbvitro, in vitro chromosome aberration test € 20,080 € 250 € 300
Annex VIII 8.4.2 MNTvitro, in vitro micronucleus test € 16,518 € 250 € 300
Annex VIII 8.4.3 GMvitro:gene mutation assay in mammalian cells € 17,615 € 250 € 300
Annex IX 8.4.4 Cytvivo:cytogenetic assay in experimental animals € 27,730 € 500 € 600
Annex VIII 8.4.3 GMvivo:gene mutation assay in experimental animals - Mouse micronucleus assay
€ 12,620 € 500 € 600
Annex VII 8.5. Acute toxicity - Oral toxicity € 1,486 € 100 € 150
Annex VIII 8.5.2. Acute toxicity - Toxicity via Inhalation € 12,267 N/A € 300
Annex VIII 8.5.3. Acute toxicity - Toxicity via Dermal routes € 2,486 N/A € 300
Annex VIII 8.6.1. Repeat dose toxicity - Short term (1 route only) € 52,925 € 250 € 300
Annex VII 9.1.1. Aquatic Toxicity - Invertebrate - short-term € 5,232 € 100 € 150
Annex VII 9.1.2. Aquatic Toxicity - Algal - short-term € 5,806 € 100 € 150
Annex VIII 9.1.3. Aquatic Toxicity - Fish – short-term € 4,845 € 100 € 150
Annex VII 9.2.1.1. Degradation - Biotic - Ready biodeg € 3,705 € 100 € 150
97 Regulation No 340/2008 of 16 April 2008, as amended by the Commission Implementing Regulation (EU) No 254/2013 of 20 March 2013.

Monitoring Impacts of REACH on Innovation, Competitiveness and SMEs – Draft Interim Report
Section 4 – Findings
137
Annex VIII 8.1.1 In vivo skin irritation € 1,535 N/A € 150
Annex VIII 8.2.1 In vivo eye irritation € 1,460 N/A € 150
Annex VIII 8.7.1.Screening for reproductive/ developmental toxicity, one species (OECD 421 or 422)
€ 97,120 N/A € 600
Annex VIII 9.1.4 Activated sludge respiration inhibition € 3,651 € 100 € 150
Annex VIII 9.2.2 Abiotic degradation 9.2.2.1. Hydrolysis as a function of pH € 13,055 € 100 € 100
Annex VIII 8.8.1 Aassessment of toxickinetic behaviour € 1,278 € 0 € 0
Annex VIII 9.3.1. Adsorption/desorption screening € 3,189 € 100 € 100
Monitoring Impacts of REACH on Innovation, Competitiveness and SMEs – Draft Interim Report
Section 4 – Findings
138
Costs of Registration 2018
Estimates of the cost of Registration 2018 will be calculated once we have information from ECHA (if available) that may allow adjustments and refinements to be made to the values underpinning the cost model. Given the vast quantities of information generated by the model, it is not possible to provide a draft cost estimate.

Monitoring Impacts of REACH on Innovation, Competitiveness and SMEs – Methodology Report
Section 5 – Next steps
139
5. Next steps
In this section we set out and summarise the next steps of the study. These are as follows:
5.1 ESPG presentation
Following the submission of the Interim Report, a presentation to the ESPG will be made on the 25th of June 2015.
5.2 Development of the Draft Final Report
Once feedback from the Steering Group and ESPG on the Interim Report is received, the Draft Final Report will be prepared.
5.3 Development of the Final Report
Following the submission of the Draft Final Report, any further comments and feedback will be incorporate dint the Final Report wich will be prepared subsequently.
Table 5.1: Final Report structure
(a) Executive summary (maximum 5 pages)
(b) Description of project background and objectives: contextual issues, structure and operational environment, the 12 key objectives.
(c) Description of the data gathering and analysis methodology: based on the write-up of task 1.
(d) Summary assessment of the findings of the 12 objectives
(e) Key findings and conclusions for each specific objective: as set out in task 3
(f) Conclusions and recommendations
Following the submission of the Final Report, the research team will prepare the relevant presentation to be used for the presentation to CARACAL.
.
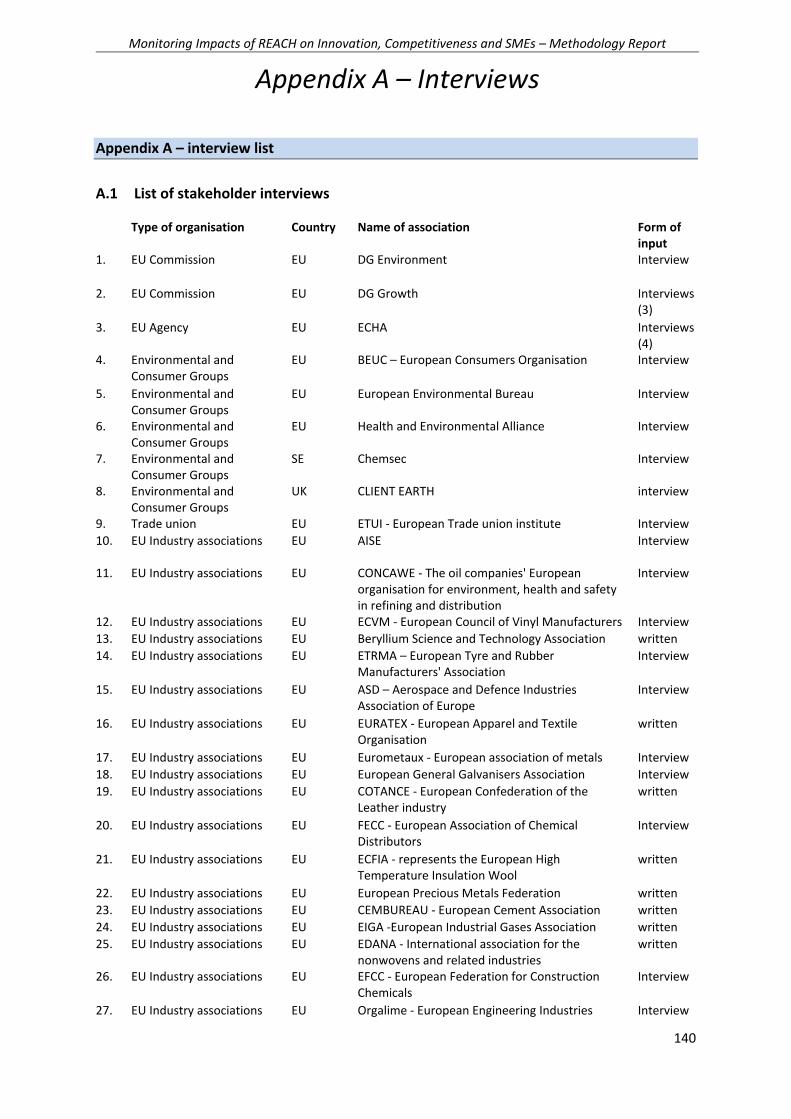
Monitoring Impacts of REACH on Innovation, Competitiveness and SMEs – Methodology Report
Appendix A – Interviews
140
Appendix A – interview list
A.1 List of stakeholder interviews
Type of organisation Country Name of association Form of input
1. EU Commission EU DG Environment Interview
2. EU Commission EU DG Growth Interviews (3)
3. EU Agency EU ECHA Interviews (4)
4. Environmental and Consumer Groups
EU BEUC – European Consumers Organisation Interview
5. Environmental and Consumer Groups
EU European Environmental Bureau Interview
6. Environmental and Consumer Groups
EU Health and Environmental Alliance Interview
7. Environmental and Consumer Groups
SE Chemsec Interview
8. Environmental and Consumer Groups
UK CLIENT EARTH interview
9. Trade union EU ETUI - European Trade union institute Interview
10. EU Industry associations EU AISE Interview
11. EU Industry associations EU CONCAWE - The oil companies' European organisation for environment, health and safety in refining and distribution
Interview
12. EU Industry associations EU ECVM - European Council of Vinyl Manufacturers Interview
13. EU Industry associations EU Beryllium Science and Technology Association written
14. EU Industry associations EU ETRMA – European Tyre and Rubber Manufacturers' Association
Interview
15. EU Industry associations EU ASD – Aerospace and Defence Industries Association of Europe
Interview
16. EU Industry associations EU EURATEX - European Apparel and Textile Organisation
written
17. EU Industry associations EU Eurometaux - European association of metals Interview
18. EU Industry associations EU European General Galvanisers Association Interview
19. EU Industry associations EU COTANCE - European Confederation of the Leather industry
written
20. EU Industry associations EU FECC - European Association of Chemical Distributors
Interview
21. EU Industry associations EU ECFIA - represents the European High Temperature Insulation Wool
written
22. EU Industry associations EU European Precious Metals Federation written
23. EU Industry associations EU CEMBUREAU - European Cement Association written
24. EU Industry associations EU EIGA -European Industrial Gases Association written
25. EU Industry associations EU EDANA - International association for the nonwovens and related industries
written
26. EU Industry associations EU EFCC - European Federation for Construction Chemicals
Interview
27. EU Industry associations EU Orgalime - European Engineering Industries Interview

Monitoring Impacts of REACH on Innovation, Competitiveness and SMEs – Methodology Report
Appendix A – Interviews
141
Type of organisation Country Name of association Form of input
Association
28. EU Industry associations EU UEAPME - The European Association of Craft, Small and Medium-sized Enterprises
Interview
29. EU Industry associations EU ORO - Only Representatives Association Interview
30. EU Industry associations EU Eucomed Conf Call
31. EU Industry associations EU EDMA Conf Call
32. EU Industry associations EU ISOPA Interview
33. EU Industry associations EU ALIPA Interview
34. EU Industry associations EU CEPE Interview
35. EU Industry associations EU EUROPUR
36. International industry association
CN China Petroleum and Chemical industry federation
written
37. Member States Authorities
AT Ministry for the Environment interview
38. Member States Authorities
BE Department of Economy,Science and Innovation Interview
39. Member States Authorities
BE Federal Public Service Health and Environment written
40. Member States Authorities
CY Department of Labour Inspection written
41. Member States Authorities
CZ Ministry of Industry and Trade written
42. Member States Authorities
DE Federal Ministry for Economic Affairs and Energy interview
43. Member States Authorities
DE Ministry for the environment interview
44. Member States Authorities
DK Environment Protection Agency Interview
45. Member States Authorities
EE Health Board written
46. Member States Authorities
ES Ministry of Agriculture, Food and Environment written
47. Member States Authorities
HU National Institute of Chemical Safety written
48. Member States Authorities
IE Environmental Protection Agency written
49. Member States Authorities
IE Irish Health and Safety Authority interview
50. Member States Authorities
IT Ministry of Health - Directorate-General for health prevention
written
51. Member States Authorities
LT Environmental protection agency written
52. Member States Authorities
LV Latvian Environment, Geology and Meteorology Centre"
written
53. Member States Authorities
MT Malta Competition and Consumer Affairs Authority, Technical Regulations Division
Interview
54. Member States Authorities
NL Inspectorate of Housing, Spatial Planning and the Environment
Interview
55. Member States Authorities
NO Norwegian Climate and Pollution Agency Interview

Monitoring Impacts of REACH on Innovation, Competitiveness and SMEs – Methodology Report
Appendix A – Interviews
142
Type of organisation Country Name of association Form of input
56. Member States Authorities
PL Ministry of Economy - Department of Innovation and Industry
57. Member States Authorities
PL Bureau for Chemical Substances written
58. Member States Authorities
RO Romanian Labour inspection written
59. Member States Authorities
SE KemI - Swedish Chemicals Agency Interview
60. Member States Authorities
SI Ministry of Health - National Chemicals office Interview
61. Member States Authorities
SK Ministry of Economy of the Slovak Republic, Dept. Centre for Chemical Substances and Preparations
written
62. Member States Authorities
UK Health and Safety Executive Interview
63. National industry association
AT WKÖ – Austrian Economic Chamber interview
64. National industry association
BE Belgian Association of Chemical Distributors interview
65. National industry association
CZ Czech Association of Chemical Industry written
66. National industry association
DE Chamber of commerce - DHIK interview
67. National industry association
DE ZVEI - German Electrical and Electronic Manufacturers' Association
interview
68. National industry association
DE BDI - Federation of German Industries interview
69. National industry association
DE Wirtschaftsvereinigung Metalle interview
70. National industry association
DK Brancheforeningen SPT written
71. National industry association
EE Federation of Estonian Chemical Industries (EKTL)
written
72. National industry association
ES Fedequim - Catalan Chemical Industry Federation
written
73. National industry association
ES FEIQUE - Spanish Chemical Industry Federation interview
74. National industry association
FI Kemianteollisuus - Chemical Industry Federation of Finland
Interview
75. National industry association
FR UIC - Union of Chemical Industries interview
76. National industry association
FR Union Française du Commerce Chimique interview
77. National industry association
GR HACI - Hellenic Association of Chemical Industries
interview
78. National industry association
IE Irish Association of Chemicals & Ingredients interview
79. National industry association
IT Associazione Italiana Commercio Chimico written
80. National industry association
IT Centro REACH interview
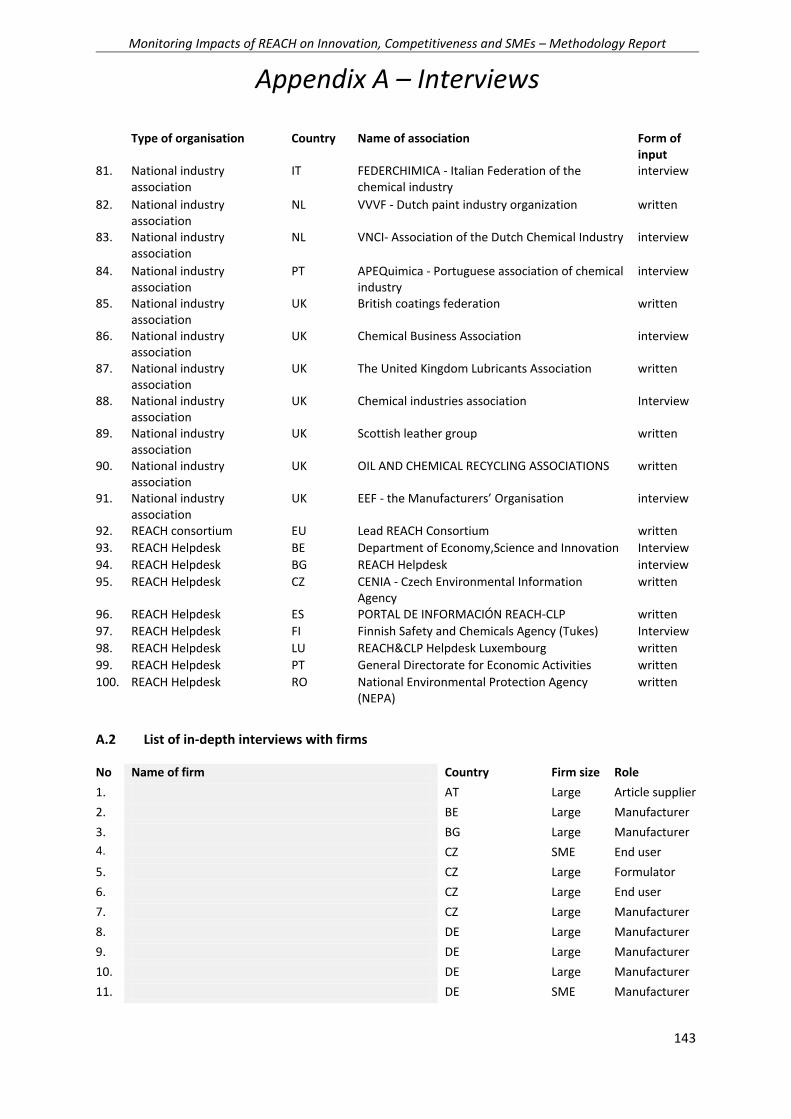
Monitoring Impacts of REACH on Innovation, Competitiveness and SMEs – Methodology Report
Appendix A – Interviews
143
Type of organisation Country Name of association Form of input
81. National industry association
IT FEDERCHIMICA - Italian Federation of the chemical industry
interview
82. National industry association
NL VVVF - Dutch paint industry organization written
83. National industry association
NL VNCI- Association of the Dutch Chemical Industry interview
84. National industry association
PT APEQuimica - Portuguese association of chemical industry
interview
85. National industry association
UK British coatings federation written
86. National industry association
UK Chemical Business Association interview
87. National industry association
UK The United Kingdom Lubricants Association written
88. National industry association
UK Chemical industries association Interview
89. National industry association
UK Scottish leather group written
90. National industry association
UK OIL AND CHEMICAL RECYCLING ASSOCIATIONS written
91. National industry association
UK EEF - the Manufacturers’ Organisation interview
92. REACH consortium EU Lead REACH Consortium written
93. REACH Helpdesk BE Department of Economy,Science and Innovation Interview
94. REACH Helpdesk BG REACH Helpdesk interview
95. REACH Helpdesk CZ CENIA - Czech Environmental Information Agency
written
96. REACH Helpdesk ES PORTAL DE INFORMACIÓN REACH-CLP written
97. REACH Helpdesk FI Finnish Safety and Chemicals Agency (Tukes) Interview
98. REACH Helpdesk LU REACH&CLP Helpdesk Luxembourg written
99. REACH Helpdesk PT General Directorate for Economic Activities written
100. REACH Helpdesk RO National Environmental Protection Agency (NEPA)
written
A.2 List of in-depth interviews with firms
No Name of firm Country Firm size Role
1. AT Large Article supplier
2. BE Large Manufacturer
3. BG Large Manufacturer
4. CZ SME End user
5. CZ Large Formulator
6. CZ Large End user
7. CZ Large Manufacturer
8. DE Large Manufacturer
9. DE Large Manufacturer
10. DE Large Manufacturer
11. DE SME Manufacturer
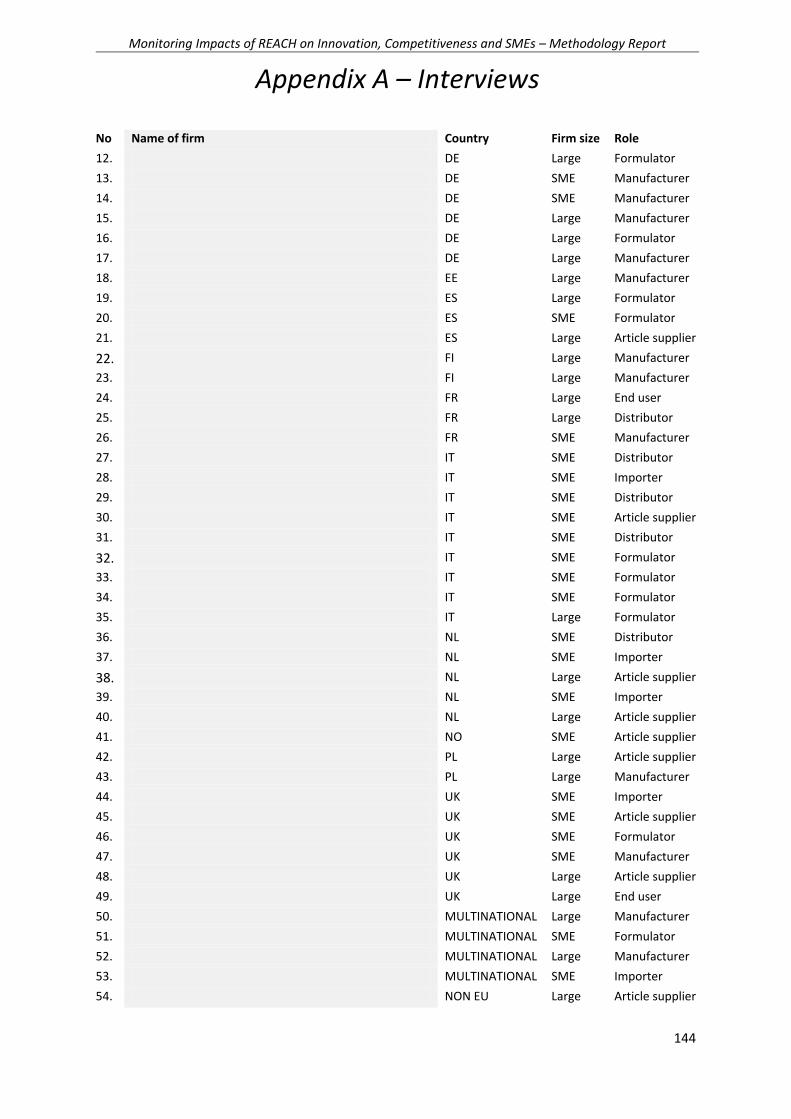
Monitoring Impacts of REACH on Innovation, Competitiveness and SMEs – Methodology Report
Appendix A – Interviews
144
No Name of firm Country Firm size Role
12. DE Large Formulator
13. DE SME Manufacturer
14. DE SME Manufacturer
15. DE Large Manufacturer
16. DE Large Formulator
17. DE Large Manufacturer
18. EE Large Manufacturer
19. ES Large Formulator
20. ES SME Formulator
21. ES Large Article supplier
22. FI Large Manufacturer
23. FI Large Manufacturer
24. FR Large End user
25. FR Large Distributor
26. FR SME Manufacturer
27. IT SME Distributor
28. IT SME Importer
29. IT SME Distributor
30. IT SME Article supplier
31. IT SME Distributor
32. IT SME Formulator
33. IT SME Formulator
34. IT SME Formulator
35. IT Large Formulator
36. NL SME Distributor
37. NL SME Importer
38. NL Large Article supplier
39. NL SME Importer
40. NL Large Article supplier
41. NO SME Article supplier
42. PL Large Article supplier
43. PL Large Manufacturer
44. UK SME Importer
45. UK SME Article supplier
46. UK SME Formulator
47. UK SME Manufacturer
48. UK Large Article supplier
49. UK Large End user
50. MULTINATIONAL Large Manufacturer
51. MULTINATIONAL SME Formulator
52. MULTINATIONAL Large Manufacturer
53. MULTINATIONAL SME Importer
54. NON EU Large Article supplier

Monitoring Impacts of REACH on Innovation, Competitiveness and SMEs – Methodology Report
Appendix A – Interviews
145
No Name of firm Country Firm size Role
55. NON EU Large Manufacturer
56. UK Large Article supplier