18-018 structural uhp final report
TRANSCRIPT


DISCLAIMER
Reference herein to any specific commercial product, process, or service by trade name, trademark, manufacturer, or otherwise does not constitute or imply its endorsement, recommendation, or approval by the United States Air Force. The views and opinions of authors expressed herein do not necessarily state or reflect those of the United States Air Force. This report was prepared as an account of work sponsored by the United States Air Force. Neither the United States Air Force, nor any of its employees, makes any warranty, expressed or implied, or assumes any legal liability or responsibility for the accuracy, completeness, or usefulness of any information, apparatus, product, or process disclosed, or represents that its use would not infringe privately owned rights.

NOTICE AND SIGNATURE PAGE
______________________________________ _______________________________________
Antonio-Lackland Air Force Base, Texas available to the general public, including foreignAFIMSC Public Affairs Office at Joint Base San
AFCEC-CX-TY-TR-2018-0006
Jeffery R. Owens, PhDContracting Officer Representative
//SIGNED//
Technical AdvisorJoseph D. Wander, PhD
//SIGNED//

Standard Form 298 (Rev. 8/98)
REPORT DOCUMENTATION PAGE
Prescribed by ANSI Std. Z39.18
Form Approved OMB No. 0704-0188
The public reporting burden for this collection of information is estimated to average 1 hour per response, including the time for reviewing instructions, searching existing data sources, gathering and maintaining the data needed, and completing and reviewing the collection of information. Send comments regarding this burden estimate or any other aspect of this collection of information, including suggestions for reducing the burden, to Department of Defense, Washington Headquarters Services, Directorate for Information Operations and Reports (0704-0188), 1215 Jefferson Davis Highway, Suite 1204, Arlington, VA 22202-4302. Respondents should be aware that notwithstanding any other provision of law, no person shall be subject to any penalty for failing to comply with a collection of information if it does not display a currently valid OMB control number. PLEASE DO NOT RETURN YOUR FORM TO THE ABOVE ADDRESS. 1. REPORT DATE (DD-MM-YYYY) 2. REPORT TYPE 3. DATES COVERED (From - To)
4. TITLE AND SUBTITLE 5a. CONTRACT NUMBER
5b. GRANT NUMBER
5c. PROGRAM ELEMENT NUMBER
5d. PROJECT NUMBER
5e. TASK NUMBER
5f. WORK UNIT NUMBER
6. AUTHOR(S)
7. PERFORMING ORGANIZATION NAME(S) AND ADDRESS(ES) 8. PERFORMING ORGANIZATION REPORT NUMBER
9. SPONSORING/MONITORING AGENCY NAME(S) AND ADDRESS(ES) 10. SPONSOR/MONITOR'S ACRONYM(S)
11. SPONSOR/MONITOR'S REPORT NUMBER(S)
12. DISTRIBUTION/AVAILABILITY STATEMENT
13. SUPPLEMENTARY NOTES
14. ABSTRACT
15. SUBJECT TERMS
16. SECURITY CLASSIFICATION OF: a. REPORT b. ABSTRACT c. THIS PAGE
17. LIMITATION OF ABSTRACT
18. NUMBER OF PAGES
19a. NAME OF RESPONSIBLE PERSON
19b. TELEPHONE NUMBER (Include area code)
15-03-2017 Final Technical Report 15-09-2015 - 15-06-2016
Evaluation of Ultra High Pressure (UHP) Firefighting in aRoom-and-Contents Fire
FA8051-14-P-0010
* Michael J. McDonald
* Vulcan Research & Controls, LLCP.O. Box 35233Panama City, FL 32412
Air Force Civil Engineer CenterReadiness DirectorateRequirements and Acquisition Division139 Barnes Drive, Suite 2Tyndall Air Force Base, FL 32403-5323
AFCEC/CXA
AFCEC-CX-TY-TR-2018-0006
Distribution A: Approved for public release; distribution unlimited.
Public Affairs Case # AFIMSC-022118B; 21 February 2018. Document contains color images.
For aircraft rescue firefighting response USAF uses a fleet of ultrahigh-pressure (UHP) (> 1,100 psi) fire trucks that are effective in extinguishing Class B fuel fires. As most fires extinguished by USAF firefighters involve structures, this study evaluated UHP technology responding to a room-and-contents structural fire. 3 response components were evaluated: extinguishment performance, hydraulic ventilation, and effort to deploy fire hoses. 30 fire tests were conducted in a 12-by-18-ft (3.66-by-5.49-m) burn room furnished to simulate a typical kitchen. Flashover fires were attacked using 15 and 20 gpm at both UHP and low pressure (LP) (90~110 psi) and using 100 gpm LP. All fires were extinguished. At 15 and 20 gpm UHP and LP consumed similar volumes of water; more water was required at 100 gpm. At equivalent flow rates, UHP cooled the burn room faster than LP. Cooling was fastest at 100 gpm delivery. Hydraulic ventilation properties were tested in a separate room with a 2- x 3-ft window opening. Each of 5 firefighting nozzles tested was installed perpendicular to the center of the window at several distances; a range of fog patterns was tested. Hydraulic ventilation was measured using an orifice flowmeter. LP, low-flow rate delivery provided less ventilation than UHP at the same water flow rate; 20 gpm UHP delivery caused the greatest airflow and 100-gpm LP produced nearly the same airflow. Hose pull force was measured by attaching fire hoses to a load cell and pulling them at 3 mph over gravel, asphalt and grass. On grass, the hose was also pulled around a vertical 4-in pipe. On all surfaces tested, pulling the LP hose required less force empty, but more force filled and pressurized than the LP hose.
fire truck, firefighting, hand line, structural, ultra high pressure
U U U SAR 52
Dr. Jeffery Owens

i DISTRIBUTION STATEMENT A. Approved for public release. Distribution is unlimited.
AFIMSC-022118B; 21 February 2018.
TABLE OF CONTENTS
LIST OF FIGURES ........................................................................................................................ ii LIST OF TABLES ......................................................................................................................... iii 1. SUMMARY .........................................................................................................................12. INTRODUCTION ...............................................................................................................2 3. METHODS, ASSUMPTIONS, AND PROCEDURES .......................................................3 3.1. Test Facility .........................................................................................................................4 3.1.1. Burn Room ...........................................................................................................................4 3.1.2. Hydraulic Ventilation ...........................................................................................................6 3.1.3. Hose Pull ..............................................................................................................................6 3.1.4. Water Delivery System ........................................................................................................6 3.1.5. Data Acquisition System......................................................................................................8 3.2. Room Fire Test Methods ...................................................................................................11 3.2.1. Procedural Steps .................................................................................................................11 3.2.2. Room Fire Test Matrix.......................................................................................................13 3.3. Hydraulic Ventilation Test Method ...................................................................................14 3.4. Hose Pull Test Method.......................................................................................................15 4. RESULTS AND DISCUSSION ........................................................................................17 4.1. Burn Room Fire Results.....................................................................................................17 4.1.1. Uncontrolled and Indirectly Controlled Parameters ..........................................................17 4.1.2. Line Losses ........................................................................................................................24 4.1.3. Extinguishment Quantities and Cooling Rates ..................................................................25 4.1.4. Oxygen Measurement ........................................................................................................29 4.1.5. Learning Curves .................................................................................................................31 4.2. Hydraulic Ventilation Results ............................................................................................32 4.3. Hose Pull Results ...............................................................................................................35 5. CONCLUSIONS................................................................................................................365.1. Room Fire Extinguishment Quantity and Cooling Time ...................................................36 5.2. Hydraulic Ventilation .........................................................................................................36 5.3. Hose Pull ............................................................................................................................37 6. RECOMMENDATIONS ...................................................................................................377. References ..........................................................................................................................38 Appendix A: Tabular Test Data .................................................................................................39 Appendix B: Test Checklist .......................................................................................................44 LIST OF SYMBOLS, ABBREVIATIONS, AND ACRONYMS .................................................50

iiDISTRIBUTION STATEMENT A. Approved for public release. Distribution is unlimited.
AFIMSC-022118B; 21 February 2018.
LIST OF FIGURES
Page Figure 1. The Test Room Exterior .................................................................................................. 4 Figure 2. Burn Room Interior ......................................................................................................... 5 Figure 3. Hydraulic Ventilation Apparatus ..................................................................................... 6 Figure 4. Plumbing Schematic ........................................................................................................ 7 Figure 5. Instrumentation Locations in the Burn Room ................................................................. 9 Figure 6. Oxygen Analyzer System Plumbing ............................................................................. 10 Figure 7. LabView® Front Screen ................................................................................................ 11 Figure 8. Infrared Photograph of the Initial Extinguishment ........................................................ 13 Figure 9. Hose Pull Apparatus ...................................................................................................... 16 Figure 10. Corner Hose Pull Setup ............................................................................................... 16 Figure 11. Burn Room and Hangar Temperature Prior to Ignition ............................................... 18 Figure 12. Effect of Temperature on Normalized Extinguishment Quantity ............................... 18 Figure 13. Relative Humidity Prior to Ignition ............................................................................. 19 Figure 14. Hangar Humidity Ratio Prior to Ignition..................................................................... 19 Figure 15. Effect of Humidity Ratio on Normalized Extinguishment Quantity ........................... 20 Figure 16. Comparison of Short Duration Preburn (Left) with Long Duration Preburn (Right) ....... 20 Figure 17. Fire Growth Time ........................................................................................................ 21 Figure 18. Effect of Fire Growth Time on Extinguishment Quantity ........................................... 21 Figure 19. Wood Moisture Content Prior to Test ......................................................................... 22 Figure 20. Maximum Average Temperature and Heat Flux ......................................................... 22 Figure 21. Effect of Maximum Average Aspirated Ceiling Temperature .................................... 23 Figure 22. Effect of Maximum Average Floor Heat Flux on Extinguishment Quantity .............. 23 Figure 23. Non-Aspirated Ceiling Temperature One Minute after Extinguishment .................... 24 Figure 24. Extinguishment Quantity as a Function of Pressure for Block 2 and 3 Tests ............. 25 Figure 25. Comparison of LP and UHP at Low Flow Rates ........................................................ 26 Figure 26. Cooling Time as a Function of Nozzle Pressure ......................................................... 27 Figure 27. Cooling Time (s) from 1450 °F to 750 °F ................................................................... 28 Figure 28. Tests with Oxygen Content Measurement .................................................................. Figure 29. Extinguishment Quantity Learning Curve ................................................................... 31 Figure 30. Cooling Time Learning Curve ..................................................................................... 32 Figure 31. Hydraulic Ventilation Test Results ............................................................................. 33 Figure 32. Hydraulic Ventilation Using High Flow (Left) and UHP (Right) ............................... 34 Figure 33. Hydraulic Ventilation Test #17 Using the 15 gal·min-1 UHP Nozzle at 24 in ............ 3 Figure 34. Hose Pull Test Results ................................................................................................. 35

iiiDISTRIBUTION STATEMENT A. Approved for public release. Distribution is unlimited.
AFIMSC-022118B; 21 February 2018.
LIST OF TABLES
Page Table 1. Pressures and Flow Rates Evaluated ................................................................................ 3 Table 2. Instrument List .................................................................................................................. 8 Table 3. Oxygen Monitor Test Numbers and Locations ............................................................... 10 Table 4. Test Matrix ...................................................................................................................... 14 Table 5. Line Losses between the Pressure Transducers at the Pump and the Nozzle ................. 25 Table 6. Extinguishment Quantity Statistics at Low Flow for LP and UHP ................................ 26 Table 7. Extinguishing Quantity Statistics for High Flow and Low Flow ................................... 27 Table 8. Cooling Time Statistics at Low Flow for LP and UHP .................................................. 28 Table 9. Cooling Time Statistics for High Flow and Low Flow .................................................. 29 Table 10. Statistical Data for Extinguishment Quantity Learning Curve ..................................... 31 Table 11. Statistical Data for Cooling Time Learning Curve ....................................................... 32 Table 12. Statistical Comparison of Hydraulic Ventilation at 20 gal·min-1 UHP and
100 gal·min-1 LP ............................................................................................................ 33 Table 13. Hydraulic Ventilation Data Summary .......................................................................... 33 Table 14 Hose Pull Force (lbf)...................................................................................................... 35

1DISTRIBUTION STATEMENT A. Approved for public release. Distribution is unlimited.
AFIMSC-022118B; 21 February 2018.
1. SUMMARY
The United States Air Force (USAF) has a fleet of ultra high pressure (UHP) (greater than 1,100 lb in-2) fire trucks for aircraft rescue firefighting (ARFF) response. Previous research demonstrated that UHP is highly effective in extinguishing Class B fuel fires. As most of the fires extinguished by the USAF firefighters involve structures, this study was conducted to evaluate the use of UHP technology for response to a room-and-contents structural fire. Three components of a typical fire department response were evaluated: (1) extinguishmentperformance, (2) hydraulic ventilation, and (3) effort required in deploying fire hoses.
Fire extinguishment performance was evaluated in a series of 30 fire tests conducted in a 12-by-18-ft (3.66-by-5.49-m) burn room that was constructed in a manner similar to fire training facil-ities. The burn room was furnished with wood cabinets, a table and four chairs, similar to a typical kitchen. Flashover fires were attacked using 15 and 20 gal·min-1 (0.95 and 1.26 L·s-1) at both UHP and low pressure (LP) (approximately 90 to 110 lb in-2) and using 100 gal·min-1 (6.31 L·s-1) with LP only. Performance was evaluated by analyzing extinguishment quantities and cooling properties of UHP and LP firefighting. All fires were extinguished. It was found that at 15 and 20 gal·min-1, UHP and LP extinguished fires using similar total quantities of water. More water was required to extinguish fires at the high (100 gal·min-1) flow rate. At equivalent flow rates, UHP cooled the burn room faster than LP. The 100 gal·min-1 flow rate cooled the room fastest.
Hydraulic ventilation properties were evaluated in a separate small room that included a 2- by 3-ft(0.61- by 0.91-m) window opening. The five firefighting nozzles evaluated were installed on a fixture that held the nozzle perpendicular to the center of the window opening at a range of distances from the window, and a range of fog patterns was used in testing. The quantity of airthat was removed from the room by hydraulic ventilation was measured using an orifice flowmeter. The LP, low (<100 gal·min-1)-flow rate experiments provided the least air flow. The UHP tests provided greater air flow than the LP tests at the same water flow rate. The highest air flow was achieved using the 20 gal·min-1 UHP system, although the 100 gal·min-1 LP system provided nearly the same air flow.
Hose pull force, the effort required to deploy fire hoses, was evaluated by attaching fire hoses to a load cell and pulling them at 3 miles·h-1 (4.9 km·h-1) over gravel, asphalt and grass. While on grass, the hose was also pulled around a vertical 4-in (102-cm) pipe. This was accomplished with empty hoses and with hoses filled and pressurized with water. Pulling the empty LP hose required less force than the empty UHP hose, however the UHP hose filled and pressurized required less pulling force than the filled and pressurized LP hose on gravel, asphalt, grass and when pulled around the pipe.

2DISTRIBUTION STATEMENT A. Approved for public release. Distribution is unlimited.
AFIMSC-022118B; 21 February 2018.
2. INTRODUCTION
In 2002, The USAF began research and development on the use of UHP fire suppression technology to extinguish hydrocarbon fuel fires resulting from aircraft crash fire-related events.UHP proved to be a very effective fire suppression tool for ARFF, and in general, forextinguishment of Class B fuel fires, which involve flammable liquids and gases. UHP demonstrated an improve-ment in firefighting efficiency compared to LP fire suppressiontechnology1 to accomplish the same ARFF-related extinguishment task [1]. It has since beeninstalled on Fire Emergency Services (FES)-purchased vehicles with application flow ratesranging from 15 gal·min-1 up to 300 gal·min-1 to fulfill a variety of USAF FES mission needs[2].
UHP performance on Class B fuel fire suppression drove the mass adoption of UHP-enabledFES vehicles by the USAF to update an aging vehicle fleet while also modernizing equipmentHowever, the USAF must also be prepared to combat other credible, non-Class B-related fuelfire threats such as structural and wildland–urban interface (WUI) fires. A structure fire contained in the area of origin and WUI fires are core services for FES [3]. Structural applications are of particular interest because they are the type of fires most frequently experienced. Throughout the Air Force, 141 building fires were experienced compared with 17aircraft fires during the first three quarters of FY 2014. Fires contained within a single room were considered to be the most likely type of structural fire that could be extinguished using the UHP equipment on the P-19 and P-34 UHP fire trucks.
This project was initiated to compare the effectiveness of UHP handlines with standard pressure handlines on a room and contents fire. It is intended to be read by fire research professionals, firefighters, and fire equipment manufacturers. The authors are fully aware that the UHP handlines on the P-19 and P-34 do not meet the National Fire Protection Association (NFPA) requirements for water flow upon entering a burning building, however the intent was to measure UHP and LP firefighting in a room and contents fire.
1 UHP is defined as aqueous firefighting agent applied at discharge pressures greater than 1,100 lb in-2. LP is aqueous firefighting agent applied at discharge pressures at approximately 90- to 110-lb in-2.

3DISTRIBUTION STATEMENT A. Approved for public release. Distribution is unlimited.
AFIMSC-022118B; 21 February 2018.
3. METHODS, ASSUMPTIONS, AND PROCEDURES
The UHP firefighting system was tested alongside standard LP firefighting systems bymeasuring extinguishment properties in a single room-and-contents fire, hydraulic ventilation properties, and hose pulling forces.
A series of single room-and-contents fire tests were conducted in the Air Force Civil Engineer Center (AFCEC) burn room using UHP and LP. The flow rates evaluated were selected based on the capabilities of ARFF truck UHP hand lines currently in Air Force inventory. The P-34 fire truck has 15-gal·min-1 (56.8-L·min-1) UHP handlines, and the P-19 has 20-gal·min-1 (75.7-L·min-1)UHP handlines. UHP fire testing was conducted at these low flow rates, and LP fire testing was conducted at these low flow rates and at a high flow rate of 100 gal·min-1 (379 L·min-1) (seeTable 1). Testing parameters of interest were extinguishment quantity and cooling performance.
Table 1. Pressures and Flow Rates EvaluatedFlow gal·min-1
(L·min-1)Pressure lb·in-1
(kPa)Low Flow 15 (56.8) 100 (689) 1,300 (8960)Low Flow 20 (75.7) 100 (689) 1,300 (8960)High Flow 100 (379) 100 (689) n/a
The room size was based on establishing a fire that would challenge the extinguishmentequipment used while staying with a single room-and-contents fire. Salzberg investigated minimum water usage for a single room-and-contents fire, and found that 0.046 gal·min-1
(0.174 L·min-1 ) provided the most efficient use of water; however, the slow extinguishment resulted in excessive exposure to the firefighter. Salzberg suggested 0.125 gal·ft-2·min-1 (0.0440L·m-2·min-1) as optimum [4]. For these experiments, the 15, 20, and 100 gal·min-1 ( 57.8, 75.7, and 378 L·min-1) discharged into a 216-ft2 (20.1-m2) room correspond to 0.0694, 0.0926 and 0.463gal·ft-2·min-1 (0.0244, 0.0325, and 0.163 L·m-2·min-1). Although the two lowest flow values were below Salzberg’s recommended minimum, all fires were successfully extinguished.
The 100-gal·min-1 (379 L·min-1) high-flow test condition was included to provide comparison with normal firefighting strategy. For safe entry into a burning residential home NFPA requires two hoses with a total flow of at least 300 gal·min-1 (1,137 L·min-1) and neither of the hoses can provide less than 100 gal·min-1 (379 L·min-1) [5].
Hydraulic ventilation tests were conducted in a small room with a window opening that was built specifically for the ventilation tests. Tests were conducted using the same pressures and flows as the room fire tests, at various distances from the window. Nozzle spray angle was adjusted for maximum air flow.
Hose pull tests were conducted to evaluate the force required to pull a 1-in (2.54-cm) UHP hose and a standard 1¾-in (4.45-cm) LP hose. Pull tests were conducted with dry, empty hoses and with hoses purged of air and filled/pressurized with water. The hoses were pulled over gravel, asphalt, grass, and around a vertical-pipe obstacle.
4DISTRIBUTION STATEMENT A. Approved for public release. Distribution is unlimited.
AFIMSC-022118B; 21 February 2018.
3.1. Test Facility
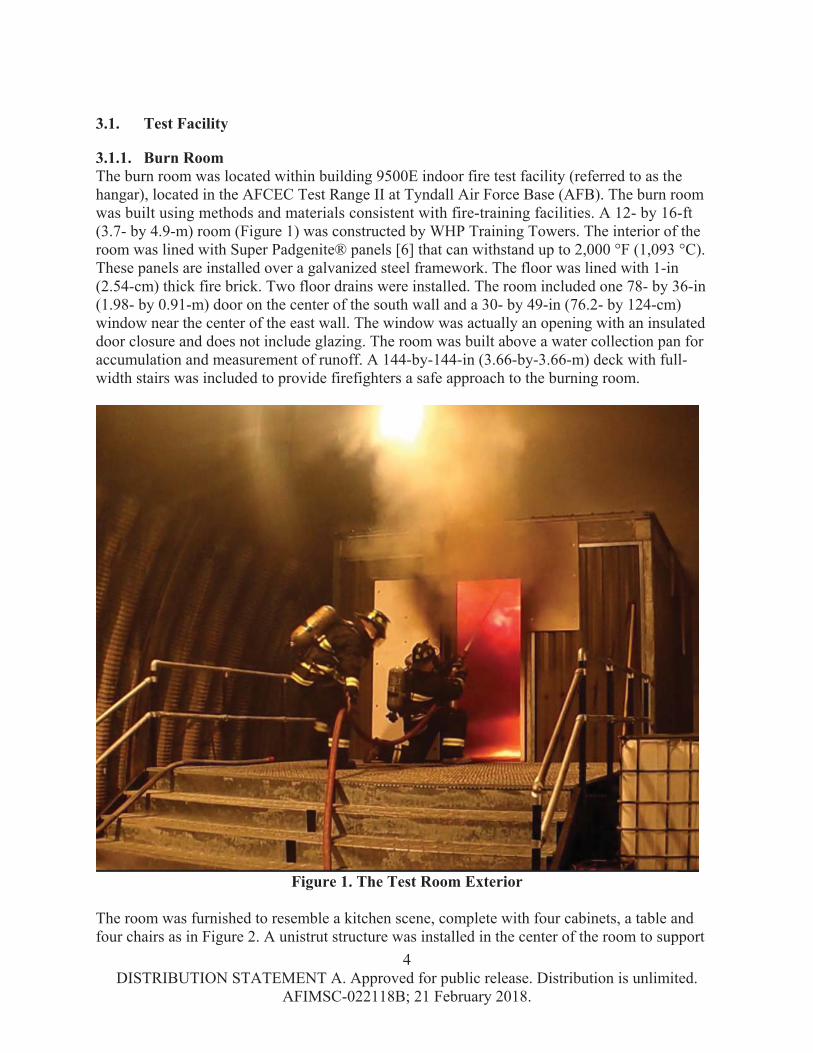
3.1.1. Burn RoomThe burn room was located within building 9500E indoor fire test facility (referred to as the hangar), located in the AFCEC Test Range II at Tyndall Air Force Base (AFB). The burn roomwas built using methods and materials consistent with fire-training facilities. A 12- by 16-ft(3.7- by 4.9-m) room (Figure 1) was constructed by WHP Training Towers. The interior of the room was lined with Super Padgenite® panels [6] that can withstand up to 2,000 °F (1,093 °C).These panels are installed over a galvanized steel framework. The floor was lined with 1-in (2.54-cm) thick fire brick. Two floor drains were installed. The room included one 78- by 36-in(1.98- by 0.91-m) door on the center of the south wall and a 30- by 49-in (76.2- by 124-cm) window near the center of the east wall. The window was actually an opening with an insulated door closure and does not include glazing. The room was built above a water collection pan for accumulation and measurement of runoff. A 144-by-144-in (3.66-by-3.66-m) deck with full-width stairs was included to provide firefighters a safe approach to the burning room.
Figure 1. The Test Room Exterior
The room was furnished to resemble a kitchen scene, complete with four cabinets, a table and four chairs as in Figure 2. A unistrut structure was installed in the center of the room to support

5DISTRIBUTION STATEMENT A. Approved for public release. Distribution is unlimited.
AFIMSC-022118B; 21 February 2018.
thermocouples at that location. Cabinets were constructed of a steel frame with sheet metal onthe surface that was covered with ½-in, (1.3-cm) four-ply CDX pine plywood. The plywood was secured to the frame using wing nuts and fender washers to provide for easy removal and replacement of the burned material. The steel frame provided a stable platform for thermocouples and heat flux gauges installed in the face of the cabinet. Tables and chairs were constructed using 2- by 3-in (5.1- by 7.6-cm) framing lumber and ½-in (1.3-cm) plywood.
Fires were initiated using Jet-A fuel in a 13-in (.33-m) diameter circular steel pan. A wood crib was placed over the pan to provide a sustained heat source for ignition of the table, chairs, and cabinets. The cribs consisted of 26 each, 12-in (0.305-m) long 2-by-2 (5.1 by 5.1 cm) (trade size) to form an approximately 12-by-12-by-9-in (0.305-by-0.305-by-0.229-m) cube with approximately50 percent void space. The crib included four legs that suspended the bottom of the crib approximately 4 in (10.2 cm) above the Jet-A surface. The pan and crib were placed under the table as in Figure 2.
Figure 2. Burn Room Interior

6DISTRIBUTION STATEMENT A. Approved for public release. Distribution is unlimited.
AFIMSC-022118B; 21 February 2018.
3.1.2. Hydraulic VentilationA special apparatus (Figure 3) was built for hydraulic ventilation tests. It consisted of a 4-by-5.5-by-8-ft (1.22-by-1.68-by-2.44-m) plywood structure with a 2-by-3-ft (0.61-by-0.91-m) window opening at the center of the front wall. Air entered the apparatus at the center of the rear wall through an 8-in (0.2-m) diameter by 20-ft (6.1-m) pipe that included an orifice flowmeter located at the midpoint. A round baffle was installed in the structure near the air inlet to divert flow radially. A water pipe was installed with the outlet directed at the center of the window. The pipe was 1½-in (38.1-cm) (trade size) schedule 80 pipe, having sufficient diameter for the high-flow tests and sufficient strength for the UHP tests. The pipe was mounted on Unistrut® channel to provide for installing the nozzles at different distances from the window.
Figure 3. Hydraulic Ventilation Apparatus
3.1.3. Hose PullThe hose pull was accomplished on dry grass, gravel and asphalt surfaces at the Tyndall AFB Silver Flag test site.
3.1.4. Water Delivery SystemThe water delivery system consisted of a pumping system located north of building 9500, 150 ft (45.7 m) of UHP and LP hoses, and a selection of five firefighting nozzles. The water pumping system (Figure 4) was capable of either LP at flow rates up to 150 gal·min-1, or of UHP at flow rates up to 35 gal·min-1(132 L·min-1).
Orifice Flowmeter
Inlet Air Baffle
Water Pipe
Unistrut Pipe Mount

7DISTRIBUTION STATEMENT A. Approved for public release. Distribution is unlimited.
AFIMSC-022118B; 21 February 2018.
Figure 4. Plumbing Schematic
Water was discharged from a tank to a centrifugal pump. A branch at the centrifugal pump discharge was included to provide cooling water for the six water-cooled heat flux gauges and the thermocouple aspiration system. Three-way valves were installed at the heat flux gauge discharge to verify flow to each heat flux gauge prior to starting a test.
Downstream of the branch, the main flow passed through a filter, flow meters, a check valve and then to a three-way valve. The three-way valve was used to select either LP or UHP. The LP branch provided flow directly to the LP fire hose and nozzle. Water directed to the UHP branch flowed through another filter and then into the UHP pump. Accumulators were located at the inlet and discharge of the UHP pump to suppress oscillations caused by the UHP pump. This was a positive-displacement pump with three plungers that caused fluctuations in pressure and flow. The pressures indicated at the accumulators in Figure 4 indicate the pre-charge pressure of the accumulator. The UHP pump discharged through another filter and on to the UHP unloader. The unloader diverted the pump discharge back to the pump inlet when the firefighting nozzle was closed, reducing the pump discharge pressure. A thermal vent valve was included in the unloading branch to prevent overheating the water circulating in this loop. A relief valve was included at the UHP discharge of the unloader to protect the system from overpressurization due to a malfunctioning unloader. A vent valve was also located in this branch. Any flow diverted from the firefighting nozzle through the pressure relief or vent valves would be indicated by the flowmeter as flow on the fire. A flow switch was installed at the relief and vent discharge to indicate such an occurrence.
The pumps were driven by electric motors with variable-frequency drives, providing the capability of varying pump speed. Two pressure transducers were installed at each pump discharge, one used for control in the variable-frequency drive and one used in the data

8DISTRIBUTION STATEMENT A. Approved for public release. Distribution is unlimited.
AFIMSC-022118B; 21 February 2018.
acquisition system. Elkhart Chief® nozzles were used, each with appropriate configurations for the pressures and flows to be tested.
The schematic includes three flowmeters. Initially, only the turbine flowmeter on the LP branch was installed. Additional flowmeters were included due to flow measurement problems experienced during the block 1 tests (see section 3.2.2).
3.1.5. Data Acquisition SystemThe data acquisition system consisted of transducers, a National Instruments PXI/SCXI® chassis, and a personal computer. The PXI/SCXI chassis, combined with LabView® software,provided signal amplification, filtration, analog to digital conversion, multiplexing for storage in an Excel® spreadsheet, and real time display of the measured data. The instrument list isprovided in Table 2. Figure 5 shows the locations of the instrumentation in the burn room. Instrument locations on the pump pad are indicated in Figure 4.
Several of the thermocouples were aspirated, that is, they were located inside a 0.5-in (1.27-cm) diameter tube, approximately 1 in (2.54 cm) from the end. Combustion products were drawn intothe tube using a vacuum system. This prevented errors in temperature measurement due to radiant heat transfer to the thermocouple from the flames [7].
Table 2. Instrument List Measurement Quantity Units Range Precision
Aspirated temperature near ceiling 4 °F 40–2300 °F 5 °FNon-aspirated temperature near ceiling 4 °F 40–2300 °F 5 °FAspirated temperature, front and back walls 8 °F 40–2300 °F 5 °FAspirated temperature in room center (24-in increments of elevation) 3 °F 40–2300 °F 5 °F
Aspirated temperature cabinet top front face center and bottom front face center 8 °F 40–2300 °F 5 °F
Non-aspirated temperature inside cabinets near floor 4 °F 40–2300 °F 5 °F
Heat flux on cabinets top front face near center 4 Btu·s-1 ·m-2 0–22
Btu·s-1 ·m-20.22
Btu·s-1 ·m-2
Heat flux floor center 2 Btu·s-1 ·m-2 0–22 Btu·s-1 ·m-2
0.22Btu·s-1 ·m-2
Runoff water quantity (posttest only) 1 gal 0–800 gal 2 gal
Agent pressure (UHP/LP) 1 lb·in-2 0–1500/ 0–150lb·in-2
15- /1.5 lb·in-2
Agent flow (UHP/LP) 1 gal·min-1 15–150/60–600gal·min-1
1.5/.5 gal·min-1
Ambient temperature 2 °F 40–100 °F 2 °FRelative humidity 2 % 0–100 % 1 %Hydraulic ventilation pressure 2 in H2O 0–10 in 0.01 inHydraulic ventilation temperature 1 °F 40–2300 °F 1 °FFog/straight stream position 1 % 0–100 % 0.1 %Oxygen concentration 1 % 0–25 0.5 %

9DISTRIBUTION STATEMENT A. Approved for public release. Distribution is unlimited.
AFIMSC-022118B; 21 February 2018.
Figure 5. Instrumentation Locations in the Burn Room
The flow path for all aspirated thermocouples was into the open-ended tube, past the thermocoupleand into a common manifold located below the floor along the center of the room. Flow through the manifold was drawn through a heat exchanger, which cooled the combustion gasses prior to entering the vacuum pump.
The thermocouples were obtained from Omega Engineering, (part number KMQXL-125E), Type K, 1/8-in sheathed with exposed junction. Various lengths were used. These thermocouples were selected primarily for their fast response, having a time constant2 of approximately 1.2 s due to the small wire size, 0.020 in (0.5 mm).
The heat flux sensors were Medtherm 64-25-20 Gardon gauge sensors. Cooling water was provided to these sensors from the fire pump system. The sensors mounted in the cabinets degraded in the first few fire tests. Because the sensors were cooled, condensation of incompletely burned combustion gasses on the sensor face resulted in loss of the coating on the sensor, as well as collection of sticky condensate from the burning wood. The sensors on the floor did not degrade, as they were not adjacent to burning wood.
2 The thermocouple response time is shown to be 1.2 s [12] for exposed junction thermocouples with 0.020-in (0.051-cm) wire size. The actual response will be somewhat slower because the referenced response time was for thermocouples subjected to a gas velocity of 213 ft·s-1(65 m·s-1).The velocity of the combustion products around the thermocouple was not evaluated; however, it was substantially less than 213 ft·s-1 (65 m·s-1).
Aspirated Thermocouples,Each Front and
Back Walls
Aspirated Thermocouples, 3
Each at 24-in Elevation Intervals
Floor Heat Flux, 2 Each
Top Cabinet Aspirated
Thermocouples and Heat Flux, 4
Each
Ceiling Thermocouples, 4 Aspirated and 4 Non-aspirated
Bottom Cabinet Aspirated
Thermocouples

10DISTRIBUTION STATEMENT A. Approved for public release. Distribution is unlimited.
AFIMSC-022118B; 21 February 2018.
The thermocouple and heat flux sensors located on the face of the cabinets were near the center of that face. Thermocouples located on the ceiling, front and rear walls were equally spaced between the edges of adjacent walls and each other. The thermocouples in the room center and on the walls were equally spaced between the floor and the ceiling. Oxygen content was measured in one of four locations (Table 3) during the final nine tests. The oxygen monitor was connected to the air aspiration system under the floor directly below a thermocouple location. The hot gasses were cooled using a coil of stainless steel tubing in a bucket of cold water, pressurized by a diaphragm pump, and passed through flexible tubing to the oxygen analyzer located in the control room (Figure 6). Following test # 48, the reaction time for the oxygen analyzer was found by exposing the open end near the thermocouple to a burning propane torch. The reduced oxygen due to the flame was detected 11 s after the thermocouple indicated exposure to the flame. The oxygen data are offset by 11 s in the data file to compensate for the delayed response.
Table 3. Oxygen Monitor Test Numbers and LocationsTest 48 Ceiling temperature, left rearTest 49 Ceiling temperature, left rearTest 50 Center of room temperature, lowest elevationTest 51 Center of room temperature, lowest elevationTest 52 Center of room temperature, highest elevationTest 53 Center of room temperature, highest elevationTest 54 Center of room temperature, middle elevationTest 55 Center of room temperature, middle elevationTest 56 Center of room temperature, middle elevation
Figure 6. Oxygen Analyzer System Plumbing
Data were collected using a Labview® program. The front screen is shown in Figure 7. Datawere collected at 4 kHz for 0.275 s, a net of 1,100 samples from each instrument. The average of these samples was computed, then written to the spreadsheet, at 0.5-s intervals. The gray area shownin the front screen represents the room, with the door at the bottom and the window on the right side. Data values were shown in real time on the screen, with thermocouple values and heat flux

11DISTRIBUTION STATEMENT A. Approved for public release. Distribution is unlimited.
AFIMSC-022118B; 21 February 2018.
values from inside the room indicated in and around the grey area. The average ceiling temperatureand heat flux values in the blue background at the top of the screen were used for flashover determination. Values for pressure, flow and oxygen content are also shown on the screen.
Figure 7. LabView® Front Screen
3.2. Room Fire Test Methods
Fire tests were conducted with a wood fuel load arranged to simulate a kitchen and dining area.The fire was initiated using Jet-A fuel in a circular steel pan. The pan was placed under the kitchentable. A wood crib placed over the pan aided in ignition of the chairs, table and cabinets. Extin-guishment commenced 90 s after flashover. The firefighter approached the burning room and extinguished the fire based on indirect attack methods. This included discharging straight stream into the ceiling, followed by a circular motion into the room until the fire was knocked down. Three blocks of 15 tests were completed, with three tests at each flow condition in each block. Performance was evaluated by comparing water usage and the rate of cooldown in the room.
Test procedures for interior structural fire suppression experiments followed the following steps:
3.2.1. Procedural StepsI. Condition the Test Room and Install the Fuel
A. Prior to starting a test sequence, the condition of the room was evaluated. The interior was cleaned, removing any residual effects or repairing any structural damage from previous fires. The facility was inspected for proper function of all equipment,

12DISTRIBUTION STATEMENT A. Approved for public release. Distribution is unlimited.
AFIMSC-022118B; 21 February 2018.
instruments and controls. The condition of the insulation on the walls was inspected and fasteners were checked for proper tightness. Fasteners were maintained at a snug, but not tight condition, to assure that the insulation did not leave any gaps where fire could damage the structure behind the insulation while allowing the insulation to expand and contract with temperature changes.B. The fuel load was installed in the room by fastening the plywood to the steel cabinet frames using wing nuts and fender washers. The table and chairs were placed in location. The table was located approximately1 ft (0.305 m) from the back wall and the left rear cabinet, with the chair backs located approximately 6 in (15.2 cm) from the table.The room was conditioned using a dehumidifier for at least 24 h before ignition. The dehumidifier ran continuously and provided an unregulated heat source that maintained the room slightly warmer than ambient.
II. Perform Pre-Test Instrument Operational ChecksA. Pretest preparations included the following operations:B. The exhaust fan in the test facility was switched on to verify operation.C. The gas analyzers were calibrated.D. Operation of the ignition torch was verified.E. The appropriate firefighting nozzle was installed.F. A 1-min flow check was performed. Flow was verified using a platform scale and a stopwatch.G. Data collected in the acquisition system during the flow test was reviewed for proper operation of all instrumentation channels.H. Cooling water flow to each of the heat flux gauges was verified.I. The water collection pan under the burn room was drained and the drain valve was closed.J. The MultiRAE Systems monitor was started, monitoring the hangar area for oxygen, carbon dioxide, carbon monoxide, and hydrogen cyanide.
III. Perform Pre-Test Safety BriefingsA. The safety briefing reviewed the specific objectives of the test, assigned personnel to specific tasks and reviewed safety procedures and emergency action plans.
IV. Initiate the Test by Igniting the BurnerA. The 13-in (0.33-m) diameter circular steel pan was placed beneath the table near the front left corner. Water was placed in the pan to a depth of 0.5 in (1.27 cm) followed by 33.8 fl oz (1 L) of Jet-A fuel and the crib was placed over the pan. The fire wasinitiated by igniting the fuel in the pan. The fire was allowed to continue to grow until flashover was achieved. Flashover was designated by achieving 1112 °F (600 °C) at the ceiling, 1.76 Btu·s-1·ft-2 (20 kW·m-2) in the center of the floor and steady flames out the door [8]. Once flashover conditions were met, a 90-s delay was initiated before commencing fire suppression operations.
V. Initiate Fire Suppression OperationsA. Starting 90 s after flashover conditions were met, the firefighters approached the doorway and discharged agent into the ceiling using a straight stream. After a few
13DISTRIBUTION STATEMENT A. Approved for public release. Distribution is unlimited.
AFIMSC-022118B; 21 February 2018.
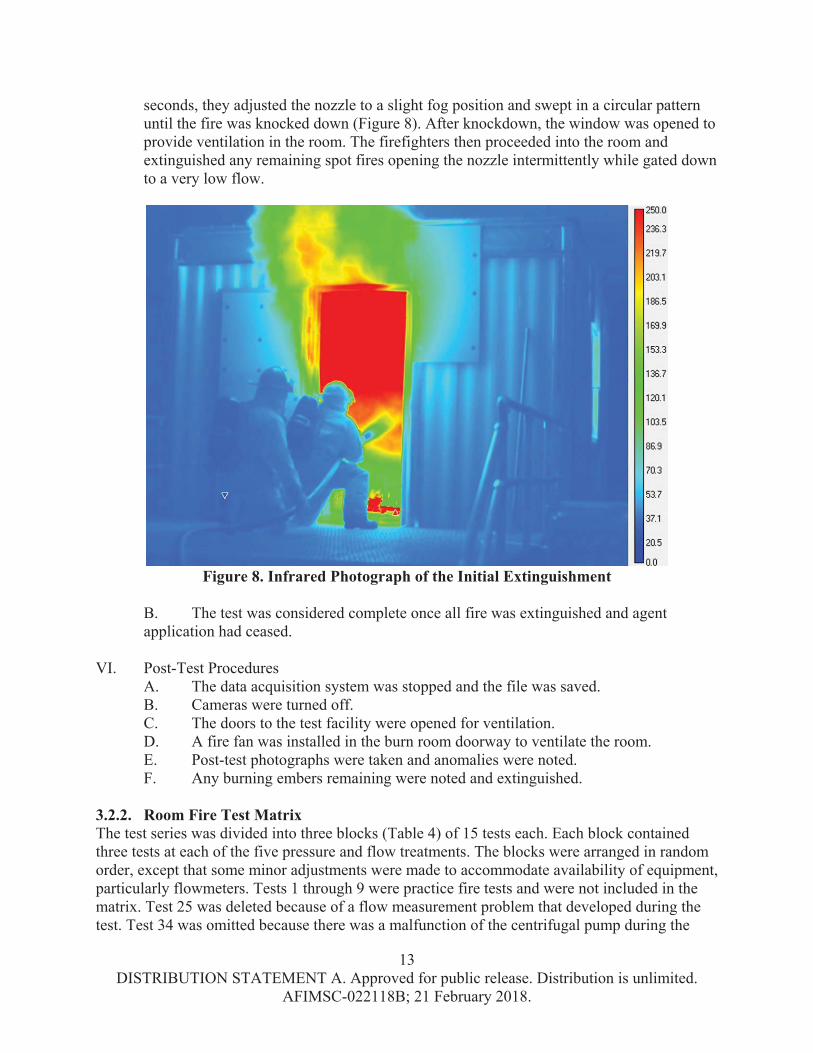
seconds, they adjusted the nozzle to a slight fog position and swept in a circular pattern until the fire was knocked down (Figure 8). After knockdown, the window was opened to provide ventilation in the room. The firefighters then proceeded into the room and extinguished any remaining spot fires opening the nozzle intermittently while gated downto a very low flow.
Figure 8. Infrared Photograph of the Initial Extinguishment
B. The test was considered complete once all fire was extinguished and agent application had ceased.
VI. Post-Test ProceduresA. The data acquisition system was stopped and the file was saved.B. Cameras were turned off.C. The doors to the test facility were opened for ventilation.D. A fire fan was installed in the burn room doorway to ventilate the room.E. Post-test photographs were taken and anomalies were noted.F. Any burning embers remaining were noted and extinguished.
3.2.2. Room Fire Test MatrixThe test series was divided into three blocks (Table 4) of 15 tests each. Each block contained three tests at each of the five pressure and flow treatments. The blocks were arranged in random order, except that some minor adjustments were made to accommodate availability of equipment, particularly flowmeters. Tests 1 through 9 were practice fire tests and were not included in the matrix. Test 25 was deleted because of a flow measurement problem that developed during the test. Test 34 was omitted because there was a malfunction of the centrifugal pump during the

14DISTRIBUTION STATEMENT A. Approved for public release. Distribution is unlimited.
AFIMSC-022118B; 21 February 2018.
test. The block one tests were not included in the test results because of inaccuracies in the flow measurement. These problems were resolved before the block 2 and block 3 tests.
Table 4. Test MatrixBlock 1 Block 2 Block 3
Test #/Date
P Flow Test #/Date
P Flow Test #/Date
P Flowpsi
(kPa)gal min-1
(L min-1)psi
(kPa)gal min-1
(L min-1)psi
(kPa)gal min-1
(L min-1)10
151228 100
(689) 100
(378) 31
160328 100
(689) 100
(378) 41
160427 100
(689) 100
(378) 11
151230 1300
(8960) 15
(56.8) 26
160304 1300
(8960) 15
(56.8) 44
160505 1300
(8960) 15
(56.8) 12
160107 100
(689) 20
(75.7) 29
160321 100
(689) 20
(75.7) 45
160509 100
(689) 20
(75.7) 13
160111 1300
(8960) 15
(56.8) 27
160309 1300
(8960) 15
(56.8) 46
160511 1300
(8960) 15
(56.8) 14
160114 1300
(8960) 20
(75.7) 28
160311 1300
(8960) 20
(75.7) 47
160513 1300
(8960) 20
(75.7) 15
160119 1300
(8960) 20
(75.7) 32
160331 1300
(8960) 20
(75.7) 48
1605017 1300
(8960) 20
(75.7) 16
160121 100
(689) 20
(75.7) 30
160323 100
(689) 20
(75.7) 49
160519 100
(689) 20
(75.7) 17
160125 100
(689) 100
(378) 35
160411 100
(689) 100
(378) 42
160429 100
(689) 100
(378) 18
160127 1300
(8960) 15
(56.8) 33
160404 1300
(8960) 15
(56.8) 50
160523 1300
(8960) 15
(56.8) 19
160129 100
(689) 100
(378) 40
160425 100
(689) 100
(378) 51
160525 100
(689) 100
(378) 20
160202 100
(689) 20
(75.7) 36
160413 100
(689) 20
(75.7) 52
160527 100
(689) 20
(75.7) 21
160204 100
(689) 15
(56.8) 37
160415 100
(689) 15
(56.8) 53
160607 100
(689) 15
(56.8) 22
160211 1300
(8960) 20
(75.7) 38
160419 1300
(8960) 20
(75.7) 54
160609 1300
(8960) 20
(75.7) 23
160216 100
(689) 15
(56.8) 39
160421 100
(689) 15
(56.8) 55
160613 100
(689) 15
(56.8) 24
160218 100
(689) 15
(56.8) 43
160503 100
(689) 15
(56.8) 56
160615 100
(689) 15
(56.8)
3.3. Hydraulic Ventilation Test Method
The hydraulic ventilation test was conducted by discharging water from firefighting nozzles located within a room (Figure 3) constructed for this test. The International Fire Training
15DISTRIBUTION STATEMENT A. Approved for public release. Distribution is unlimited.
AFIMSC-022118B; 21 February 2018.
Association recommends that nozzles be located 24 in from a window and set to a fog pattern that fills the window opening [9]. The nozzles were held securely in place perpendicular to the center of the window opening at various distances from the window ranging from12 to 28 in (0.305 to 0.711 m) from the window opening in 4-in (.102-m) increments. A fog/straight streamposition potentiometer was installed on each nozzle to record the nozzle stream shape position that provided maximum ventilation. Ventilation performance was evaluated by comparing air flow that was measured using the orifice flowmeter.
1. The appropriate nozzle and fire hose were installed in the hydraulic ventilation apparatus (Figure 3).
2. The appropriate water pump(s) speed was selected at the pump panel. The UHP/LP valve position was selected.
3. The data acquisition system was started. The span of the fog/straight stream position potentiometer was set by rotating the fog setting over the full range. The fog/straight stream setting was then adjusted close to the expected maximum room ventilationposition.
4. The pump(s) were started and fine adjustments were made to the fog/straight stream position setting as required to obtain maximum room ventilation.
5. The pump(s) and data acquisition software were turned off.
3.4. Hose Pull Test Method
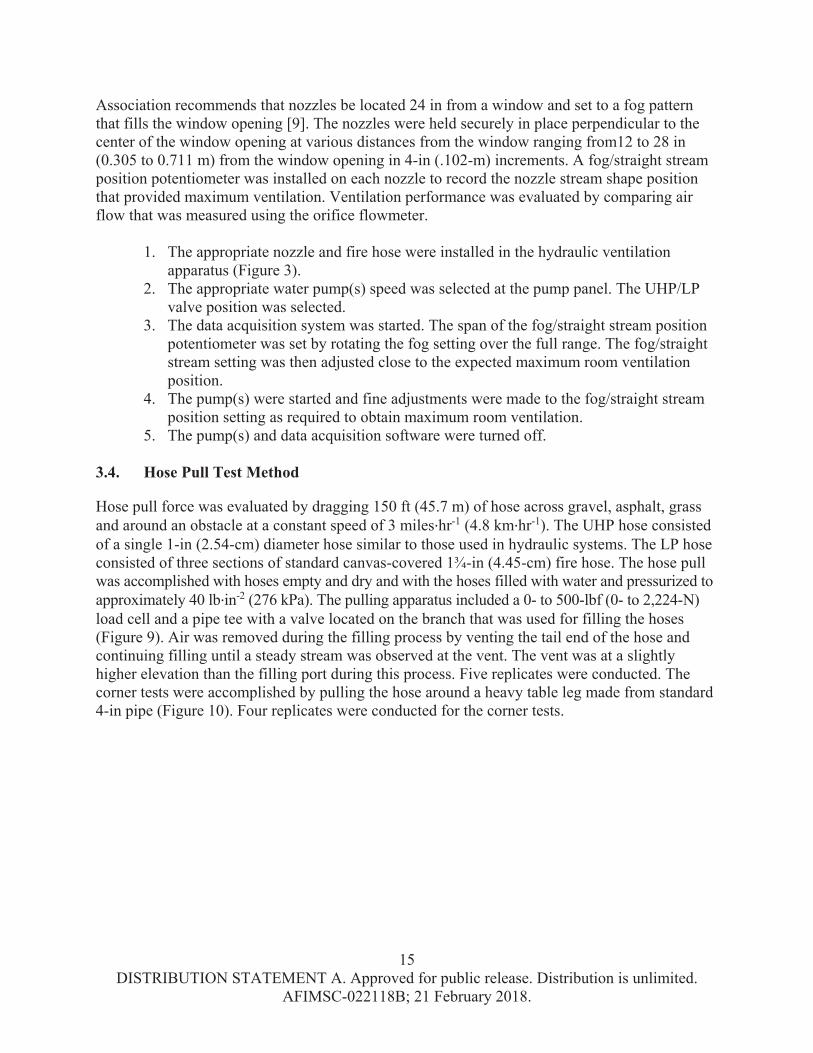
Hose pull force was evaluated by dragging 150 ft (45.7 m) of hose across gravel, asphalt, grass and around an obstacle at a constant speed of 3 miles·hr-1 (4.8 km·hr-1). The UHP hose consisted of a single 1-in (2.54-cm) diameter hose similar to those used in hydraulic systems. The LP hose consisted of three sections of standard canvas-covered 1¾-in (4.45-cm) fire hose. The hose pull was accomplished with hoses empty and dry and with the hoses filled with water and pressurized to approximately 40 lb·in-2 (276 kPa). The pulling apparatus included a 0- to 500-lbf (0- to 2,224-N)load cell and a pipe tee with a valve located on the branch that was used for filling the hoses(Figure 9). Air was removed during the filling process by venting the tail end of the hose and continuing filling until a steady stream was observed at the vent. The vent was at a slightly higher elevation than the filling port during this process. Five replicates were conducted. The corner tests were accomplished by pulling the hose around a heavy table leg made from standard 4-in pipe (Figure 10). Four replicates were conducted for the corner tests.

16DISTRIBUTION STATEMENT A. Approved for public release. Distribution is unlimited.
AFIMSC-022118B; 21 February 2018.
Figure 9. Hose Pull Apparatus
Figure 10. Corner Hose Pull Setup
Data acquisition was accomplished using a laptop computer equipped with a National Instruments USB 6216 data acquisition system. This was used to record excitation voltage to the load cell, output voltage, and pulling force. The USB 6216 provided excitation voltage to the load cell.

17DISTRIBUTION STATEMENT A. Approved for public release. Distribution is unlimited.
AFIMSC-022118B; 21 February 2018.
4. RESULTS AND DISCUSSION
4.1. Burn Room Fire Results
The burn room fire experiments were conducted in three blocks following a group of nine practice fire tests. The practice tests were conducted to experiment with extinguishment techniques and to familiarize the participants with all aspects of the experiment.
Following the first block of tests, inaccuracies in the flow measurement system were detected. As a consequence of this, the block one tests were not used in the results.
4.1.1. Uncontrolled and Indirectly Controlled ParametersThis test series was conducted in a manner that minimized uncontrollable parameters, to obtain consistent results. Unfortunately, some parameters, including weather and fire growth rate could not be controlled. Wood moisture content was partially controlled using a dehumidifier. Other parameters, such as maximum temperature, maximum heat flux, and ceiling temperature after extinguishment were indirectly or partially controlled by timing of suppression start and end.
The normalized extinguishment quantity is a derived parameter used to evaluate the effect of uncontrolled and partially controlled parameters. It is defined as:
(ne) = (e)(avg)Where
Q(ne) is the normalized extinguishment quantity;Q(e) is the total quantity of water used in a particular test;Q(avg) is the average extinguishment quantity used for all six tests of the same pressure and flow rate treatment.
Weather parameters included temperature and humidity. The block 2 and block 3 tests occurred over a four-month period extending from March 2016 through June 2016, which resulted in significant changes in weather. The ambient temperature in the hangar and in the burn room for the block 2 and block 3 tests are shown in Figure 11. The burn room temperature was consistentlyhigher because of the dehumidifier that was operating inside the insulated, closed burn room forat least 24 h prior to ignition. The dehumidifier removed moisture, which was condensed and pumped out of the burn room, and also added heat, raising the temperature. The dehumidifier operated continuously in an open loop fashion, that is, there were no controls for temperature or humidity. Temperature and relative humidity were measured using a Kestrel Model 4000 weather meter prior to conducting each fire test.
Normalized extinguishment quantity is plotted versus hangar and burn room temperature in Figure 12. The response is random and does not show any regular pattern. As a result, extinguishment quantities are judged as being independent of hangar and burn room temperature.

18DISTRIBUTION STATEMENT A. Approved for public release. Distribution is unlimited.
AFIMSC-022118B; 21 February 2018.
Figure 11. Burn Room and Hangar Temperature Prior to Ignition
Figure 12. Effect of Temperature on Normalized Extinguishment Quantity
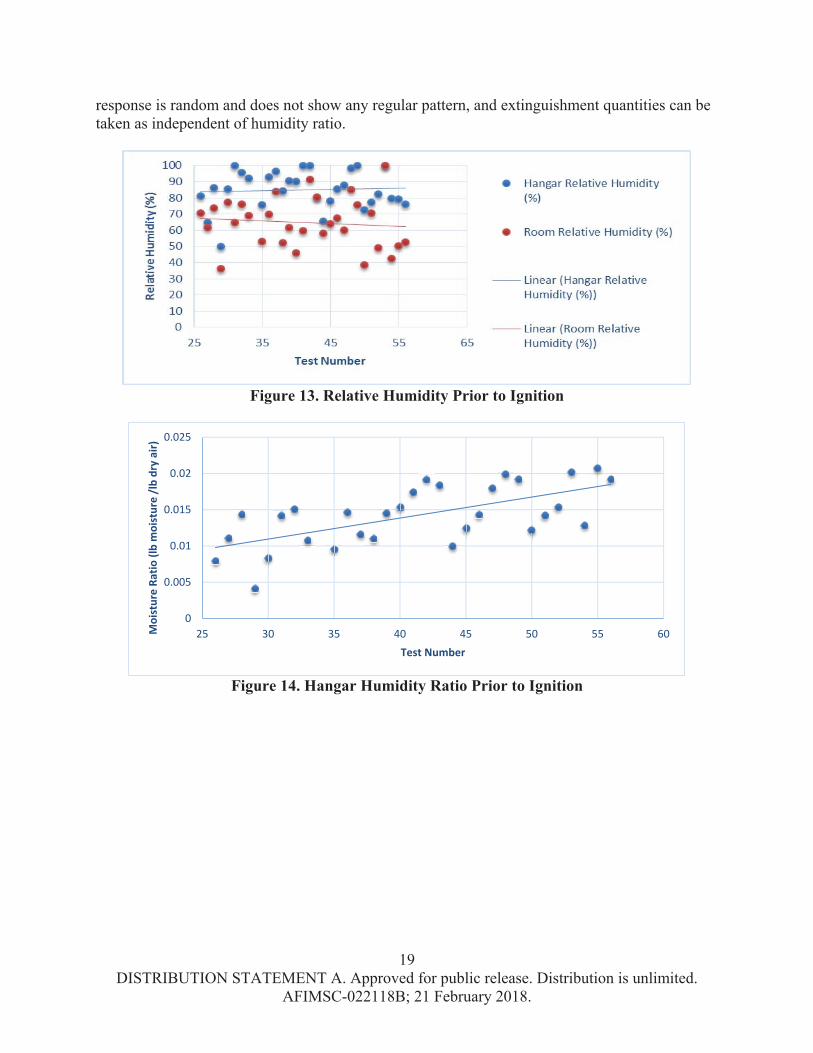
The relative humidity prior to ignition is shown in Figure 13. In all cases, the relative humidity in the hangar is higher than in the burn room because of the dehumidifier. The pattern is random so relative humidity should not bias the test results. Humidity ratio, a measure of the concentration of water vapor in the atmosphere, might exert a more significant effect on fire behavior. The humidity ratio is shown in Figure 14 and shows a general trend of increasing values as the test series progressed. Typically, the burn room door was open for about an hour prior to ignition, allowing the air in the burn room to mix with the air in the hangar. Once ignited, the fire drawsair from the hangar making the pretest humidity ratio in the burn room irrelevant to the fire growth. The humidity ratio was determined using an online calculator [10] with the Kestrel data as input. Normalized extinguishment quantity is plotted versus humidity ratio in Figure 15. The
0.0
10.0
20.0
30.0
40.0
50.0
60.0
70.0
80.0
90.0
100.0
0 20 40 60
Tem
pera
ture
(°F)
Test Number
HangarTemperature(F)
Burn RoomTemperature(F)
0.00
0.20
0.40
0.60
0.80
1.00
1.20
1.40
1.60
50.0 60.0 70.0 80.0 90.0 100.0
Nor
mal
ized
Extin
guish
men
t Qua
ntity
(d
imen
sionl
ess)
Hangar Temperature (°F)
Hangar Temperature
Burn Room Temperature
19DISTRIBUTION STATEMENT A. Approved for public release. Distribution is unlimited.
AFIMSC-022118B; 21 February 2018.
response is random and does not show any regular pattern, and extinguishment quantities can be taken as independent of humidity ratio.
Figure 13. Relative Humidity Prior to Ignition
Figure 14. Hangar Humidity Ratio Prior to Ignition
0
0.005
0.01
0.015
0.02
0.025
25 30 35 40 45 50 55 60Moi
stur
e Ra
tio (l
b m
oist
ure
/lb
dry
air)
Test Number

20DISTRIBUTION STATEMENT A. Approved for public release. Distribution is unlimited.
AFIMSC-022118B; 21 February 2018.
Figure 15. Effect of Humidity Ratio on Normalized Extinguishment Quantity
Fire growth time, that is, the time from ignition to commencement of extinguishment, could affect the dynamics of extinguishment, as the condition of the wood during extinguishment is different for a slow-growing fire than it is for a fast-growing fire. The most significant difference was observed in the left rear cabinet, which is closest to the location where fires were initiated. The left rear cabinet demonstrates (Figure 16) the most extreme cases of preburn duration. The posttest photograph on the left is from test #29, which had a fire growth time of 324 s, while the picture on the right is from test #37, which had a fire growth time of 732 s. The fast burning fire had lighter char while the slow burning fire had heavier char and significant portions of the wood in this cabinet were completely burned through. Slow fire growth may also change the behavior of the fire because the insulation in the walls were hotter at the time of extinguishment with a slow growing fire than a fast one. Figure 17 shows the history of fire growth time for the block 2and block 3 tests. Most of the values are grouped around 320 to 480 s, with three outliers that took considerably longer for achieving flashover. Figure 18 shows the effect of fire growth time on normalized extinguishment quantity. These values are random, consequently fire growth time does not affect the quantity of water used for extinguishment.
Figure 16. Comparison of Short Duration Preburn (Left) with Long Duration Preburn (Right)
0
0.2
0.4
0.6
0.8
1
1.2
1.4
1.6
0 0.005 0.01 0.015 0.02 0.025
Nor
mal
ized
Extin
guish
men
t Qua
ntity
(d
imen
sionl
ess)
Humidity Ratio (lb moisture·lb dry air-1)

21DISTRIBUTION STATEMENT A. Approved for public release. Distribution is unlimited.
AFIMSC-022118B; 21 February 2018.
Figure 17. Fire Growth Time
Figure 18. Effect of Fire Growth Time on Extinguishment Quantity
The moisture content of the wood was reduced prior to ignition, but not controlled. The wood was stacked and stored in an air conditioned building prior to installation in the burn room. It was installed in the burn room no less than one day before the fire. During that period, the dehumidifier was operating in the burn room, reducing but not controlling the moisture content of the air or the wood.
Moisture content of the wood (Figure 19) was measured within an hour of each test, using a Lignomat (brand) Mini Ligno DX/C. This device was self calibrating and was not processed through the Precision Measurement Equipment Laboratory at Tyndall. The device failed to operateprior to test 35, and was repaired by replacing the batteries. After installing new batteries, the measured moisture content of the wood was more consistent and lower than values measured using the old batteries. For all tests, the wood was stored in an air conditioned facility prior to installation on the cabinet frames, then after installation was exposed to dehumidified air for at least 24 h. The meter performance was judged to be proper after installation of the new batteries. Consequently, wood moisture content was not considered to affect the extinguishment test results.
0
100
200
300
400
500
600
700
800
25 30 35 40 45 50 55 60
Fire
Gro
wth
Tim
e (s
)
Test Number
0
0.2
0.4
0.6
0.8
1
1.2
1.4
1.6
300 400 500 600 700 800
Nor
mal
ized
Extin
guish
men
t Q
uant
ity (d
imen
sionl
ess)
Fire Growth Time (s)

22DISTRIBUTION STATEMENT A. Approved for public release. Distribution is unlimited.
AFIMSC-022118B; 21 February 2018.
Figure 19. Wood Moisture Content Prior to Test
Figure 20 shows the maximum average temperatures and heat flux in the burn room during firetests. Plotted temperature values are the averages of the four aspirated ceiling thermocouples and the average heat flux values are the averages of the two heat flux sensors located in the middle of the floor. The maximum average temperature shows a gradual increase during the test series, while the maximum floor heat flux shows a gradual decrease. The reasons for these trends areunknown. Figure 21 and Figure 22 show the effects of these parameters on normalized extinguishment quantity. In both cases, the response is random, indicating that these parameters do not affect the quantity of water required for extinguishment.
Figure 20. Maximum Average Temperature and Heat Flux
0
1
2
3
4
5
6
7
0 10 20 30 40 50 60
Moi
stur
e Co
nten
t (%
)
Test Number
20 25 30 35 40 45 50 55 600.000.501.001.502.002.503.003.504.004.505.00
100
300
500
700
900
1100
1300
1500
1700
1900
Max
imum
Ave
rage
Flo
or H
eat F
lux
(Btu
/s/f
t2 )
Max
imum
Ave
rage
Asp
irate
dCe
iling
Tem
pera
ture
(°F)
Test Number
Maximum Average Ceiling Temperature
Maximum Average Floor Heat Flux
Linear (Maximum Average Ceiling Temperature)
Linear (Maximum Average Floor Heat Flux)

23DISTRIBUTION STATEMENT A. Approved for public release. Distribution is unlimited.
AFIMSC-022118B; 21 February 2018.
Figure 21. Effect of Maximum Average Aspirated Ceiling Temperature
Figure 22. Effect of Maximum Average Floor Heat Flux on Extinguishment Quantity
The length of time that water was applied to the fire, the duration of extinguishment, was at the discretion of the firefighter based on his experience. The firefighter attempted to use the minimum amount of agent on each fire, but some fires had longer duration discharges that were not dictated by the conditions of the fire. Ideally, the firefighter would discharge the exact amount of water needed for extinguishment. Assuming that the fire is extinguished, the firefighter will always discharge more than the ideal amount of water. If the firefighter uses a large margin over the ideal extinguishment amount, the resultant ceiling temperature after
0
0.2
0.4
0.6
0.8
1
1.2
1.4
1.6
1600 1650 1700 1750 1800 1850 1900
Nor
mal
zied
Extin
guish
men
tQ
uant
ity (d
imen
sionl
ess)
Maximum Average Aspirated Ceiling Temperature (°F)
0.00
0.20
0.40
0.60
0.80
1.00
1.20
1.40
1.60
0.00 0.50 1.00 1.50 2.00 2.50 3.00 3.50 4.00
Nor
mal
ized
Extin
guish
men
tQ
uant
ity, (
dim
ensio
nles
s)
Maximum Average Floor Heat Flux (Btu/s/ft2)

24DISTRIBUTION STATEMENT A. Approved for public release. Distribution is unlimited.
AFIMSC-022118B; 21 February 2018.
extinguishment would be lower. More water would result in even lower temperature. The effect of excess water discharge was evaluated by comparing the non-aspirated ceiling temperature one minute after extinguishment. If the amount of water discharged were higher than what was necessary for extinguishment, then the temperature of the burn room as evaluated by the average of the non-aspirated ceiling thermocouples would be lower than if a lesser amount of water were discharged.
Figure 23 shows the ceiling temperature one minute after extinguishment for each of the block 2 and block 3 fire tests as a function of normalized extinguishment quantity for each group of tests, and the overall trend is also shown. Higher normalized extinguishment quantities produced lower temperature in the burn room. Ideally, this trend would not exist. However since each test condition (pressure and flow) has a random scatter above and below the trend line, this effect does not favor any particular test condition.
In all cases, the effects of the uncontrolled parameters and the indirectly controlled parameters were random, indicating that the extinguishment quantity test results were not affected bythese parameters.
Figure 23. Non-Aspirated Ceiling Temperature One Minute after Extinguishment
4.1.2. Line LossesThe pressure drop between the pressure transducers on the pump pad and the nozzle were measured to determine actual nozzle pressures for the tests. The data are presented in Table 5.
050
100150200250300350400450500
0.50 0.70 0.90 1.10 1.30 1.50 1.70
Ceili
ng T
empe
ratu
re (°
F)
Normalized Extinguishment Quantity (dimensionless)
Low Pressure 15 gpm Low Pressure 20 gpm Low Pressure 100 gpm
UHP 15 gpm UHP 20 gpm Overall Trend
Linear (Overall Trend)

25DISTRIBUTION STATEMENT A. Approved for public release. Distribution is unlimited.
AFIMSC-022118B; 21 February 2018.
Table 5. Line Losses between the Pressure Transducers at the Pump and the Nozzle
Nozzle Measured pressure drop (lb·in-2)
15 gal·min-1 LP 1.520 gal·min-1 LP 2.1100 gal·min-1 LP 37.515 gal·min-1 UHP 3020 gal·min-1 UHP 45
Pressure used in subsequent analysis was corrected by subtracting the measured pressure drop values in Table 5 from the values measured at the pump pad, indicating nozzle pressure rather than pump pressure.
4.1.3. Extinguishment Quantities and Cooling RatesThe primary objective of this series of tests was to compare the effectiveness of UHP hand lines with standard-pressure hand lines on a room-and-contents fire. This comparison was accomplished by:
1. Comparing the quantity of water required to extinguish the room and contents fire;2. Comparing the rate of temperature drop as evaluated by the non-aspirated ceiling
thermocouples.
4.1.3.1. Extinguishment QuantityFigure 24 shows the extinguishment quantity used for the block 2 and block 3 tests as a function of pressure. The high-flow, 100-gal·min-1 tests were conducted only at LP. Observation of this graph does not provide a clear indication of any advantage for LP or UHP at the low flow, however it does indicate that the high flow uses more water than low flow at UHP or LP.
Figure 24. Extinguishment Quantity as a Function of Pressure for Block 2 and 3 Tests
0
5
10
15
20
25
0 200 400 600 800 1000 1200 1400
Extin
guish
men
t Qua
ntity
(Gal
)
Pressure (Lbs/in2 )
15 gal/min 20 gal/min 100 gal/min

26DISTRIBUTION STATEMENT A. Approved for public release. Distribution is unlimited.
AFIMSC-022118B; 21 February 2018.
A bar chart comparison of UHP and LP at low flow rates is provided in Figure 25. The error bars represent one standard deviation.
Figure 25. Comparison of LP and UHP at Low Flow Rates
To determine statistical significance, t-tests (Excel function, t.test) were performed. The t-test indicates the probability that two samples of data are from the same population. The t-test requires performing an F-test (Excel function, f.test) to determine if the groups of data have equal variance. An F-test resulting in a value greater than 0.50 indicates choosing the equal variance option in the t-test, and values less than 0.50 indicate the unequal variance option.
Comparisons between the LP at low flow and UHP tests are shown in Table 6. For the tests at 15 gal·min-1, the F-test indicates that there is a 0.536 probability that the UHP and LP tests have the same variance, consequently the equal variance option was used in the t-test. The t-test indicates that there is a small chance (p-value = 0.04) that the LP and UHP are from the same population. This indicates that UHP makes a statistically significant difference. The mean values show that the UHP used less water than the LP tests.
Table 6. Extinguishment Quantity Statistics at Low Flow for LP and UHP15 gal·min-1 20 gal·min-1
F-Test 0.536 0.004LP Mean Value (gal) 14.3 12.0LP Std Dev (gal) 2.6 0.6UHP Mean Value (gal) 11.1 12.2UHP Standard Deviation (gal) 1.9 2.8t-Test (p-value) 0.04 0.85
For the 20 gal·min-1 (1.26-L·s-1) tests, the F-test indicates that an unequal variance option should be used in the t-test. The t-test indicates that there is a high probability that there is no significant statistical difference in results between LP and UHP at this flow rate.
Statistical comparisons between LP, at high flow and LP at low flow tests are provided in Table 7. LP at low flow includes 15 and 20 gal·min-1 (0.94 and 1.26 L·s-1) tests. Similarly, the UHP
0
5
10
15
20
15 gpm 20 gpm
Extin
guish
men
tQ
uant
ity (g
al)
LP UHP

27DISTRIBUTION STATEMENT A. Approved for public release. Distribution is unlimited.
AFIMSC-022118B; 21 February 2018.
data includes the 15 and 20 gal·min-1 (0.94 and 1.26 L·s-1) tests. The confidence levels that the high-flow and low-flow tests are from the same population are essentially zero, consequently the low-flow tests are from a different population than the high-flow tests. Because the mean values for the low-flow tests indicate less water usage, the low-flow demonstrates statistically significant reduced water usage compared to the high-flow for UHP, LP.
Table 7. Extinguishing Quantity Statistics for High Flow and Low Flow UHP Low Flow Compared to
LP High FlowLP Low Flow Compared to
LP High FlowF-Test 0.476 0.608Low Flow Mean Value (gal) 11.7 13.2Low Flow Std Dev (gal) 2.3 2.1High Flow Mean (gal) 21.6 21.6High Flow Standard Deviation (gal) 1.7 1.7
t-Test (p-value) 0.00 0.00
4.1.3.2. Rate of Temperature DropThe rate of temperature drop is included for comparison of UHP with LP firefighting. The elapsed time for cooling the average non-aspirated ceiling temperature from 1450 to 750 °F (788 to 399 °C) was compared between LP and UHP at low flow, and between high-flow and all low-flow conditions (Figure 26). These data were also represented in a bar chart (Figure 27) with error bars representing one standard deviation. These temperature values were chosen because they provided the widest range of temperature that was available for all block 2 and block 3 tests. For some tests, the average ceiling temperature did not increase far beyond 1450 °F (788 °C), and for others, extinguishment was terminated slightly below 750 °F (399 °C).
Figure 26. Cooling Time as a Function of Nozzle Pressure
0
2
4
6
8
10
12
14
16
18
20
0 200 400 600 800 1000 1200 1400
Cool
ing
Tim
e (s
)
Pressure (lb/in2)
15 gal/min 20 gal/min 100 gal/min

28DISTRIBUTION STATEMENT A. Approved for public release. Distribution is unlimited.
AFIMSC-022118B; 21 February 2018.
Figure 27. Cooling Time (s) from 1450 °F to 750 °F
Table 8 provides a comparison between the UHP and LP fire tests at low flow. The F-tests indicate that the UHP tests and LP tests had different variance at both flow rates. The t-tests indicate that there is a statistically significant difference in cooling performance between UHP and LP and, because the mean value for UHP cooling times is faster than that for the LP cooling time in all cases, that water applied at UHP cooled fires faster than at LP. This is consistent with results by Svensson and Lundstrøm, who concluded that “high-pressure water sprays reduce the temperature more than low-pressure sprays” [11].
Table 8. Cooling Time Statistics at Low Flow for LP and UHP15 gal·min-1 20 gal·min-1
F-Test 0.253 0.42LP Mean (s) 15.3 12.8LP Standard Deviation (s) 2.7 2.1UHP Mean (s) 9.2 7.6UHP Standard Deviation (s) 1.5 1.4t-Test 0.01 0.01
Table 9 compares the high flow fire tests with all combinations of the low flow fire tests. The F-test indicated that the variances between the high-flow and low-flow tests were different, however just barely in the UHP-only tests. The t-tests indicated that there is a statistically significant difference in high-flow and low-flow tests. Because the mean values for high flow cooling times is faster than for low flow in all cases, this indicates that water applied at high flowrates cooled fires faster than water applied at low flow.
0
2
4
6
8
10
12
14
16
18
20
Cool
ing
Tim
e(s)
15 gal/min UHP 20 gal/min UHP 15 gal/min LP 20 gal/min LP 100 gal/min LP

29DISTRIBUTION STATEMENT A. Approved for public release. Distribution is unlimited.
AFIMSC-022118B; 21 February 2018.
Table 9. Cooling Time Statistics for High Flow and Low FlowUHP Low Flow Compared
to LP High FlowLP Low Flow Compared
to LP High FlowF-Test 0.491 0.086Low Flow Mean Value (s) 8.4 14.0Low Flow Standard Deviation (s) 1.6 2.6High Flow Mean Value (s) 4.8 4.8High Flow Standard Deviation (s) 1.2 1.2t-Test 0.00 0.00
4.1.4. Oxygen MeasurementFigure 28 shows oxygen measurements from eight of the nine tests. One additional test with this measurement was obtained (Test 56), with the data sampled from the room center, middle elevation. The results from that test were similar to tests 54 and 55. During these tests, the oxygen was completely consumed in a significant portion of the room. The highest elevation of oxygen measurement in the center of the room (Tests 52 and 53) showed complete oxygen depletion. The middle elevation in the room center also showed complete oxygen consumption, though more slowly than tests 48 and 49. The ceiling measurement near the left rear did not indicate complete oxygen consumption, possibly due to vertical mixing in that area due to starting the fire directly below that location. The lowest elevation showed significant oxygenreduction, but not complete depletion.

30DISTRIBUTION STATEMENT A. Approved for public release. Distribution is unlimited.
AFIMSC-022118B; 21 February 2018.
Figure 28. Tests with Oxygen Content Measurement
-1.50
-0.50
0.50
1.50
2.50
3.50
0
10
20
30
40
50
0 500 1000
Heat
Flu
x [B
tu/s
/ft2
)
O2
(%)
Time (s)
Test 48, Left Rear CeilingThreshold
Oxygen (%)
HF Floor 5(Btu/s/sq ft)
-1.50
-0.50
0.50
1.50
2.50
3.50
0
10
20
30
40
50
0 500 1000
Heat
Flu
x (B
tu/s
/ft2
)
O2
(%)
Time (s)
Test 49, Left Rear Ceiling
Threshold
Oxygen(%)HF Floor 5(Btu/s/ft2)
-2.00
-1.00
0.00
1.00
2.00
3.00
0
10
20
30
40
50
0 500 1000
Heat
Flu
x (Bt
u/s/
ft2 )
O2
(%)
Time (s)
Test 52, Room Center, Highest ElevationThreshold
Oxygen (%)
HF Floor 5(Btu/s/ft2)
-1.50
-0.50
0.50
1.50
2.50
3.50
0
10
20
30
40
50
0 500 1000
Heat
Flu
x (Bt
u/s/
ft2 )
O2
(%)
Time (s)
Test 53, Room Center, Highest ElevationThreshold
Oxygen(%)HF Floor 5(Btu/s/ft2)
-1.50
-0.50
0.50
1.50
2.50
0
10
20
30
40
50
0 500 1000
Heat
Flu
x (Bt
u/s/
ft2 )
O2
(%)
Time (s)
Test 54, Room Center, Middle ElevationThreshold
Oxygen(%)HF Floor 5(Btu/s/ft2)
-1.50
-0.50
0.50
1.50
2.50
3.50
0
10
20
30
40
50
0 500 1000He
at F
lux (
Btu/
s/ft2 )
O2
(%)
Time (s)
Test 55, Room Center, Middle ElevationThreshold
Oxygen%(shifted)HF Floor 5(Btu/s/ft2)
-1.50
-0.50
0.50
1.50
2.50
3.50
0
10
20
30
40
50
0 500 1000
Heat
Flu
x (Bt
u/s/
ft2 )
O2
(%)
Time (s)
Test 50, Room Center, Lowest Elevation
Threshold
Oxygen(%)HF Floor 5(Btu/s/ft2)
-1.50
-0.50
0.50
1.50
2.50
0
10
20
30
40
50
0 500 1000
Heat
Flu
x (bt
u/s/
ft2 )
O2
(%)
Time (s)
Test 51, Room Center, Lowest Elevation
Threshold
Oxygen%(shifted)HF Floor 5(Btu/s/ft2))

31DISTRIBUTION STATEMENT A. Approved for public release. Distribution is unlimited.
AFIMSC-022118B; 21 February 2018.
4.1.5. Learning CurvesA series of nine practice fire tests were done before formal testing began. These tests were con-ducted to familiarize the firefighters with the equipment and facilities and to assure that consistentmethods were used in extinguishment of the fires. Subsequently, the block 1 tests were conducted but were not used in this analysis due to inaccuracies in flow measurement. One additional firetest (test 25) was not used because the flow measurement problem identified in block 1 had not been addressed. As a result, a total of 25 fire tests were conducted before accumulating data for analysis, which gave firefighters time and experience to perfect their technique.
The extinguishment quantity learning curve is provided in Figure 29. The triangles represent the average quantity for all tests in the appropriate block of tests. Table 10 shows the statistical data associated with Figure 29. This shows that only the difference in 100-gal·min-1 (379-L·min-1 )tests between blocks 2 and 3 was statistically significant, and because the block 3 average extinguishment at 100 gal·min-1 (379-L·min-1 ) was less than the block 2 average extinguishment quantity, this one test condition implies that a learning curve was still active. Taken together the results do not show a definitive improvement from block 2 to block 3.
Figure 29. Extinguishment Quantity Learning Curve
Table 10. Statistical Data for Extinguishment Quantity Learning Curve-1 LP -1 UHP Average
Value15 20 100 15 20F-Test 0.334 0.789 0.914 0.349 0.05 0.423Block 2 average (gal) 12.7 12.5 23.0 11.6 13.0 14.6Block 2 standard deviation (gal) 2.7 2.7 0.3 1.2 4.1 4.8Block 3 average (gal) 15.9 11.7 20.1 10.7 11.4 14.0Block 3 standard deviation (gal) 1.2 0.6 0.2 2.7 0.7 3.9t-Test (p-value) 0.17 0.17 0.00 0.61 0.58 0.70
The cooling time learning curve data is provided in Figure 30, and the statistical data are provided in Table 11. None of the t-test results indicated a statistically significant difference in
0
5
10
15
20
25
2 3
Extin
guisn
men
t Qua
ntity
(gal
)
Block Number15 gal/min low pressure 20 gal/min low pressure 100 gal/min low pressure
15 gal/min UHP 20 gal/min UHP Avg Extinguishment Qty

32DISTRIBUTION STATEMENT A. Approved for public release. Distribution is unlimited.
AFIMSC-022118B; 21 February 2018.
cooling time between the block 2 and 3 test series, which implies that firefighter technique or efficiency did not change significantly with additional fire tests over these two series.
Figure 30. Cooling Time Learning Curve
Table 11. Statistical Data for Cooling Time Learning Curve-1 LP -1 UHP Average
Value15 20 100 15 20F-Test 0.536 0.652 0.10 0.14 0.23 0.549block 2 average (s) 11.5 8.3 3.3 5.7 5.8 6.9block 2 standard deviation (s) 2.3 1.4 0.3 0.5 0.7 3.1Block 3 average (s) 12.7 11.1 4.1 7.1 6.2 8.3Block 3 standard deviation (s) 1.4 2.0 1.4 1.7 1.8 3.6t-Test (p-value) 0.47 .01 0.44 0.29 0.75 0.28
Although the firefighters did improve their extinguishment quantity in block 3 on the high flow tests, the overall learning curve data is not conclusive that the firefighters were still improving in their extinguishment technique based on the average of all tests. This implies that learning curve effects are not statistically significant and consequently do not affect the results of these tests.
4.2. Hydraulic Ventilation Results
Hydraulic ventilation test results (Figure 31) show that ventilation increases with increased flow and pressure. In all cases, the distance from the window does not significantly affect air flow. The 20 gal·min-1 (1.26 L·s-1) UHP discharge produced slightly higher average ventilation flow than the 100 gal·min-1 (6.31 L·s-1) flow. Table 12 shows the average air flow for all nozzle distances and the corresponding values for water use and time required for 50 percent smoke reduction in the room. Several additional periods of 50 percent reduction and the corresponding water quantity would be necessary to consider the smoke cleared. Table 13 shows that hydraulic ventilation using UHP at 20 gal·min-1 is not statistically different from using LP at 100 gal·min-1.Photographs showing UHP and LP ventilation discharge are provided in Figure 32.
02468
10121416
2 3
Cool
ing
Tim
e (s
)
Block15 gal/min low pressure 20 gal/min low pressure 100 gal/min low pressure
15 gal/min UHP 20 gal/min UHP Average

33DISTRIBUTION STATEMENT A. Approved for public release. Distribution is unlimited.
AFIMSC-022118B; 21 February 2018.
Figure 31. Hydraulic Ventilation Test Results
Table 12. Statistical Comparison of Hydraulic Ventilationat 20 gal·min-1 UHP and 100 gal·min-1 LP
F-Test, UHP 20 gal·min-1 compared to LP 100 gal·min-1 0.00UHP 20 gal·min-1 Mean Value ± SD, ft3·s-1 2.82 ± 0.25LP 100 gal·min-1 Mean Value ± SD, ft3·s-1 2.76 ± 0.15p-Value 0.62
The hydraulic ventilation flow was very sensitive to the position of the fog/straight stream adjustment. Figure 33 shows a sweep from nearly straight stream (100 percent nozzle position) to 57 percent (mid-fog position) and back to 80 percent (mostly straight stream). As the nozzle fog position was decreased (fog pattern becoming wider), very little ventilation was created. At approximately 72 percent nozzle fog position, the air flow started increasing rapidly to a peak at approximately 60 percent nozzle fog position. As this peak was passed, the ventilation flow suddenly reversed4, drawing air into the room through the window and out through the pipe.
3 Time for 50 percent smoke reduction was calculated by: = ln ( )/60 , The room volume was estimated to be 1728 ft3.4 Flow direction indicated in Figure 31 is shown as a value of 1 for flow out the window and -1for flow out the pipe.
0
0.5
1
1.5
2
2.5
3
3.5
0 5 10 15 20 25 30
Air F
low
(ft3 /
s)
Distance From Window Opening (in)
15 UHP
20 UHP
15 LP
20 LP
100 LP
Table 13. Hydraulic Ventilation Data Summary
Water Flow
(gal·min-1)
Average Air Flow for All Nozzle Distances
(ft3·s-1)
SD Air Flow for All Nozzle
Distance (ft3·s-1)
Water Used for 50% Smoke
Reduction (gal)
Time for 50% Smoke Reduction
(min)3
UHP LP UHP LP UHP LP UHP LP15 2.16 1.02 0.20 0.13 139 294 9.2 19.620 2.82 1.5 0.25 0.12 142 266 7.1 13.3
100 2.76 0.15 723 7.2

34DISTRIBUTION STATEMENT A. Approved for public release. Distribution is unlimited.
AFIMSC-022118B; 21 February 2018.
Figure 32. Hydraulic Ventilation Using High Flow (Left) and UHP (Right)
Figure 33. Hydraulic Ventilation Test #17 Using the 15 gal·min-1 UHP Nozzle at 24 in
Flow measurement in the reverse direction was inaccurate because the pressure taps at the orifice flowmeter were in the wrong position for flow in this direction. After a period of reverse flow, the nozzle fog position was increased and, again at approximately 60 percent, the flow direction reversed, drawing air out of the window. The air flow then rapidly diminished as the fog position continued to increase. This characteristic was observed in the UHP nozzles and the LP nozzles.
All nozzles were scaled with 0 percent at full flush and 100 percent at straight stream. For the UHP nozzles, this represented approximately 120 degrees of rotation and for the LP nozzles this represented approximately 270 degrees of rotation. For the UHP nozzle represented in Figure 33,the nozzle rotation from 72 percent to 60 percent represented just 4 degrees of nozzle rotation. A very small increase in the fog pattern would result in flow reversal.The sudden flow reversal happened when the nozzle spray pattern began to hit the inside of the wall surrounding the window. Since the window opening was rectangular and the fog pattern conical, water began hitting the sides of the window before the top and bottom. In a building, this phenomenon would cause room air/smoke to be forced into the rest of the building rather than drawing it out of the window. For most advantageous hydraulic ventilation, set the fog position and nozzle distance from the window such that the spray pattern fills the window to the greatest extent, while assuring that the spray does not hit the interior wall around the window.
-1.5
-1.0
-0.5
0.0
0.5
1.0
1.5
2.0
2.5
50
55
60
65
70
75
80
85
90
95
100
50 100 150 200 250 300 350Fl
ow D
irect
ion
(dim
ensio
nles
s) a
nd
Air F
low
(ft3 /
s)
Nozz
le P
ositi
on (%
)
Time (s)
Nozzle Position (%)
Air Flow (cu ft/s)
Flow Direction

35DISTRIBUTION STATEMENT A. Approved for public release. Distribution is unlimited.
AFIMSC-022118B; 21 February 2018.
4.3. Hose Pull Results
Force required to pull the hoses is provided in Table 14 and Figure 34. Appendix A providescomplete tabular data. Dry (empty), the LP hose required roughly half the pulling force required by the UHP hose, primarily due to the weight of the heavier UHP hose. Filled and pressurized with water, the UHP hose required less force due to having less water weight in the smaller-diameter hose. In general, the least force required was on grass, followed by gravel, asphalt, and the corner pull. The LP hose when filled and pressurized followed a different order of force required, with gravel being the lowest, followed by asphalt, grass, and the corner pull.
Table 14 Hose Pull Force (lbf)Hose Pull Force (lbf) UHP Wet Pull Force (lbf) UHP Dry
Surface Gravel Asphalt Grass Corner Gravel Asphalt Grass CornerMean 82.9 112.2 72.4 104.2 53.1 63.0 46.4 78.7
Std Dev 5.7 11.0 6.1 5.3 6.0 13.7 8.9 6.3Hose Pull Force (lbf) LP Wet Pull Force (lbf) LP Dry
Surface Gravel Asphalt Grass Corner Gravel Asphalt Grass CornerMean 114.0 144.9 152.2 260.1 25.0 26.4 23.6 41.2
Std Dev 21.8 36.6 10.2 76.2 2.5 0.7 8.6 9.2
Figure 34. Hose Pull Test Results
A test was conducted to determine the static pull required for comparison with the dynamic pulling force indicated in Table 14. A dry, LP hose was pulled very slowly using a come alongtool. The measured force did not exceed 11 lbf (48.9 N) while the corresponding dynamic dry grass pulling force was 23.6 lbf (105 N). Typically, static force exceeds dynamic force. With the static pull, the entire hose did not move at one time, but sections would stretch, then release, moving portions at a time. This resulted in the low pulling force, since the entire hose did not move as a unit. When pulling fast enough to move the entire hose, the force approached the dynamic value. As a result, the static pull was not considered a valid measurement.
0
50
100
150
200
250
300
350
UHP Wet LP Wet UHP Dry LP Dry
Pulli
ng Fo
rce
(lbf)
Gravel Asphalt Grass Corner
36DISTRIBUTION STATEMENT A. Approved for public release. Distribution is unlimited.
AFIMSC-022118B; 21 February 2018.
5. CONCLUSIONS
5.1. Room Fire Extinguishment Quantity and Cooling Time
The commonest structural-fire response on Air Force installations is a single room and contents fire not at flashover. This study was designed to evaluate and compare the performance of water applied at UHP (greater than 1,100 lb in-2) to that of water applied at LP (90 to 110 lb in-2) and flow appropriate to this most common fire. It was shown that a single room-and-contents fire at flashover can be extinguished using about 45 percent less water applied at 15 to 20 -1
(0.97 to 1.30 L·s-1) and 1200 to 1300 in-2 (8.2 to 9.0 MPa) than applied at the commoner flow and pressure of 100 -1 (6.48 -1 ) and 100 -2 (689 kPa). Handlines on UHP-equipped trucks in the Air Force inventory deliver water or water with foam in the range of 15 to 20
-1 (0.97 to 1.30 L·s-1) and 1200 to 1300 in-2 (8.2 to 9.0 MPa).
Knockdown and cooling the ceiling area from 1450 to 750 °F (788 to 399 °C) with conventional pressure and flow took about half the time as it did at UHP, but fire damage to the room contents was no different, and water damage to the room and contents due to excess water being used beyond that needed to extinguish the fire would be worse at conventional pressure.
Extinguishing and cooling performance were also compared at 15 and 20 -1 (0.97 and1.30 L·s-1) between water applied at UHP and at LP. Such low f in-2 (689 kPa) are not typical for Air Force firefighting vehicles, but the point of these tests was to look for asignificant difference in performance between UHP and LP at low flow rates. A comparison of the combined results for UHP to the combined results for LP showed no significant difference in the amount of water to extinguish fires. Data also showed that LP application resulted in faster knockdown times while UHP application resulted in faster room cooling. Taken altogether, test data indicated that extinguishment performance was about the same for UHP and LP application at the low flow rates.
Analysis of the effects of uncontrolled variables on outcomes showed that none of these variables, including firefighter efficiency, biased the results.
5.2. Hydraulic Ventilation
Ventilation or de-smoking is an important aspect of interior structural fires because overhaul and rescue operations can be dependent on the ability to see without the use of a thermal imaging device, and because rapid de-smoking can reduce the amount of time that first responders need to wear protective breathing apparatus. Hydraulic ventilation, using spray from a nozzle to draw smoke, and combustible and toxic gasses from a room is an important tool for de-smoking.
De-smoking air flow rate and time for 50 percent reduction in smoke inside the room for UHP and for conventional flow and pressure were comparable, but ventilating with UHP used about one-fifth the water that ventilating at conventional flow and pressure used for the same 50percent smoke reduction. Compared to low flow rate at LP, ventilating with UHP used significantly less water to clear the space in significantly less time.

37DISTRIBUTION STATEMENT A. Approved for public release. Distribution is unlimited.
AFIMSC-022118B; 21 February 2018.
In addition, it was noted that the distance of the nozzle from the window made little difference in the resultant ventilation flow, but firefighters must be careful not to use a fog pattern wide enough to hit the interior walls because that would result in increased water damage and reversed ventilation flow.
5.3. Hose Pull
The work required to pull a charged hose through rooms and around obstacles is an important consideration because it affects the speed at which firefighters may advance and because it affects firefighter fatigue. When empty and dry, the 1 ¾-in (4.45-cm) LP hose required significantly less force to pull over all surfaces than did the UHP hose. When full of water and pressurized, the UHP hose required slightly less pulling force over all surfaces.
6. RECOMMENDATIONS
USAF FES should consider the use of UHP- -19 and P-34 crash
UHP was shown to be safe for firefighters and effective at extinguishing a single room-and-contentsfire at flashover. If an UHP-equipped vehicle could be first at the scene of a single room-and-contents fire it would be safe and practical to commence firefighting with UHP equipment. An added benefit would be less potential for water damage to the structure and contents. This recom-mendation is given provided that all NFPA-specified minimum response requirements are metand that responding firefighters are experienced with the techniques unique to UHP firefighting.
Consideration should also be given to responding to interior structural fires confined to a single room with systems capable of delivering at least 15 -1 (0.97 L·s-1) at a minimum of 100 -2(689 kPa).
The durability of UHP hoses in fire environments has not been evaluated. A follow on effort should be considered that evaluates UHP hose degradation due to heat and abrasion.

38DISTRIBUTION STATEMENT A. Approved for public release. Distribution is unlimited.
AFIMSC-022118B; 21 February 2018.
7. References
[1] M.J. McDonald, D.S. Dierdorf, J.L. Kalberer, and K.D. Barrett, Fire Extinguishing Effectiveness Tests AFRL-ML-TY-TR-2004-4554, Defense Technical Information Center, 2004.
[2] J.L. Schroeder, M.J. McDonald, J.R. Hawk, and R.C. Mellerski Field Demonstration of a Centrifugal Ultra High Pressure (UHP) P-19, AFRL-RX-TY-TR-2010-0033, Defense Technical Information Center, 2010.
[3] Fire Emergency Services (FES) Program, Air Force Instruction 32-2001, 27 February2014.
[4] F.Salzberg, FJ. Vodvarka, and GL. Maatman, "Minimum Water Requirements for Supression of Room Fires," Fire Technology, vol. 6, no. 22, 1970.
[5] NFPA, Standard for the Organization and Deployment of Fire Suppression Operations, Emergency Medical Operations, and Special Operations to the Public by Career Fire Departments, NFPA 1710, National Fire Protection Association, Quincy, MA, 2016.
[6] J. Kirchner, Padgenite Specifications, [Online]. Available: http://www.trainingtowers.com/burn-rooms/padgenite-specs/.
[7] S.C. Kim and A.P. Hamins, "On the Temperature Measurement Bias and Time Response of an Aspirated Thermocouple in a Fire Environment," Journal of Fire Sciences, vol. 26, no. 6, 2008.
[8] ASTM. E603-13, Standard Guide for Room Fire Experiments ASTM International, 2013.[9] IFSTA, Essentials of Firefighting, R. Hall. and B. Adams, eds., International Fire Service
Training Association: Oklahoma State University, 1998. [10] Dayton-ASHRAE, "Psychrometric Properties, English Units," [Online]. Available:
http://www.daytonashrae.org/psychrometrics_imp.html.[11] S. Svensson and S.. Lundstrøm, "Live Fire Tests on Suppression of Post Flashover Fires
Using Manually Applied High and Low Pressure Water Sprays," in Interflam 99,Edinburgh Scotland, 1999.
[12] Omega Engineering, [Online]. Available: http://www.omega.com/techref/ThermocoupleResponseTime.html. [Accessed 20 June 2016].

39DISTRIBUTION STATEMENT A. Approved for public release. Distribution is unlimited.
AFIMSC-022118B; 21 February 2018.
Appendix A: Tabular Test Data
Table A-1. Sponsler Flowmeter October 23, 2015 Calibration
Voltage Current Flow from scale
Sponsler Factory Calibration Difference 151023
Calibration Difference
(amp) gal·min-1 gal·min-1 gal·min-1 gal·min-1 gal·min-1
1.27 5.10E-03 15.7 15.55 -0.15 15.52 -0.181.3 5.22E-03 17.4 17.23 -0.17 17.21 -0.19
1.33 5.34E-03 19.2 18.92 -0.28 18.90 -0.301.37 5.50E-03 21 21.17 0.17 21.15 0.151.4 5.62E-03 22.7 22.85 0.15 22.84 0.14
1.38 5.54E-03 21.9 21.73 -0.17 21.71 -0.191.44 5.78E-03 25 25.10 0.10 25.09 0.091.49 5.98E-03 28.2 27.91 -0.29 27.91 -0.291.55 6.22E-03 31.1 31.28 0.18 31.28 0.182.65 1.06E-02 93.2 93.10 -0.10 93.22 0.022.785 1.12E-02 100.88 100.69 -0.19 100.82 -0.06
1.2634 5.07E-03 15.2 15.18 -0.02 15.15 -0.051.2695 5.09E-03 15.5 15.52 0.02 15.49 -0.011.3638 5.47E-03 20.09 20.82 0.73 20.80 0.71
Std. deviation = 0.27 Std. deviation = 0.26
Table A-2. Sponsler Flowmeter January 22, 2016 CalibrationVoltage Current Flow from Scale Flow from 1/22/2016 Cal Difference
(amps) gal·min-1 gal·min-1 gal·min-1
1.07 4.31E-03 4.56 4.38 0.181.12 4.49E-03 6.96 7.02 -0.051.19 4.77E-03 10.80 10.93 -0.131.26 5.05E-03 14.29 14.81 -0.531.27 5.10E-03 15.70 15.47 0.231.30 5.22E-03 17.40 17.16 0.241.33 5.34E-03 19.20 18.85 0.351.37 5.50E-03 21.00 21.10 -0.101.40 5.62E-03 22.70 22.79 -0.091.38 5.54E-03 21.90 21.67 0.231.44 5.78E-03 25.00 25.05 -0.051.49 5.98E-03 28.20 27.87 0.331.55 6.22E-03 31.10 31.25 -0.152.65 1.06E-02 93.20 93.23 -0.032.79 1.12E-02 100.88 100.84 0.041.26 5.07E-03 15.20 15.10 0.101.27 5.09E-03 15.50 15.44 0.061.36 5.47E-03 20.09 20.75 -0.66
Standard Deviation = 0.27

40DISTRIBUTION STATEMENT A. Approved for public release. Distribution is unlimited.
AFIMSC-022118B; 21 February 2018.
Table A-3. McMaster–Carr Flowmeter Calibration
Pump Motor Frequency
(Hz)
Scale Weight
(lbs)
Scale Weight
(gal)
McMaster–Carr Flowmeter
reading (gal)Difference Difference
(%)
15 88 10.56 10.68 -0.12 -1.1420 116 13.93 13.98 -0.05 -0.3625 143 17.2 17.3 -0.1 -0.58
29.3159 19.1 19.24 -0.14 -0.7316 1.92 1.95 -0.03 -1.5643 5.16 5.26 -0.1 -1.94
Standard Deviation =0.61%
Table A-4. Badger Flowmeter CalibrationNozzle Scale Flowmeter Duration Difference % Flow Rate
(gal) (gal) (s) Difference gal·min-1
15 gal/min LP
15.49 15.5 60 -0.01 -0.06 15.52.88 3 30 -0.12 -4.00 67.15 7.75 40 -0.60 -7.74 11.6251.84 1.75 30 0.09 5.14 3.5
20 gal/min LP
21.01 21.75 60 -0.74 -3.40 21.753.64 3.75 30 -0.11 -2.93 7.51.31 1.25 30 0.06 4.80 2.56.57 7 30 -0.43 -6.14 142.27 2.5 30 -0.23 -9.20 53.05 3 30 0.05 1.67 6
100 gal/min LP
97.12 96.25 60 0.87 0.90 96.257.15 7.25 30 -0.10 -1.38 14.518.4 19 30 -0.60 -3.16 382.77 2.75 30 0.02 0.73 5.510.91 11 30 -0.09 -0.82 221.58 1.5 30 0.08 5.33 31.58 1.5 30 0.08 5.33 3
Std Dev =4.53%

41DISTRIBUTION STATEMENT A. Approved for public release. Distribution is unlimited.
AFIMSC-022118B; 21 February 2018.
Table A-5. Flow Check Calibration Data
TestNumber
Scale Badger Flowmeter% Deviationfrom Scale
McMaster–Carr UHP Turbine Flowmeter
Flowgal·min-1
% Deviationfrom Scale
Start (lbs)
End (lbs)
Flow (lbs)
Start (gal)
End(gal)
Flow gal·min-1
26 0 125 15.0 15.05 0.2927 0 129 15.5 14.49 -6.4328 0 164 19.7 19.28 -2.0729 0 169 20.3 929.0 949.3 20.3 0.1930 0 170 20.4 92.3 112.8 20.5 -0.4531 0 798 95.8 36.5 131.0 94.5 1.3632 0 161 19.3 4420.3 4439.7 19.4 -0.37 19.31 -0.0933 0 125 15.0 14.7 -2.0435 0 806 96.8 4752.6 4848.7 96.1 0.6836 0 169 20.3 4967.4 4987.6 20.2 0.4337 0 125 15.0 5009.7 5025.3 15.6 -3.9638 0 160 19.2 5092.0 5111.4 19.4 -1.00 19.31 0.5339 1706 1834 15.4 5136.6 5151.9 15.3 0.4340 901 1701 96.0 5185.7 5281.3 95.6 0.4641 1037 1840 96.4 5322.6 5418.5 95.9 0.5242 981 1782 96.2 5458.8 5554.3 95.5 0.6843 1724 1855 15.7 5580.8 5596.6 15.8 -0.4744 1787 1912 15.0 5615.7 5630.2 14.5 3.37 14.8 -1.3745 0 168 20.2 5644.9 5665.0 20.1 0.3446 0 123 14.8 5680.1 5694.9 14.8 -0.23 14.77 0.0347 0 160 19.2 5708.8 5727.6 18.8 2.12 19.22 0.0648 0 160 19.2 5742.7 5761.3 18.6 3.16 19.24 0.1749 0 168 20.2 5779.2 5799.3 20.1 0.3450 0 122 14.6 5814.5 5829.0 14.5 1.00 14.6 -0.3151 0 816 98.0 5881.9 5979.4 97.5 0.4752 0 168 20.2 6006.3 6026.6 20.3 -0.6553 0 129 15.5 6044.6 6060.1 15.5 -0.0954 0 160 19.2 6081.8 6100.7 18.9 1.60 19.28 0.3855 0 126 15.3 6132.6 6117.3 15.1 -1.1556 0 132 15.7 6171.4 6155.7 15.8 0.92
Standard Deviation =1.53%
Standard Deviation = 0.63%

42DISTRIBUTION STATEMENT A. Approved for public release. Distribution is unlimited. AFIMSC-022118B; 21 February 2018.
Table A-6. Extinguishment Test Data Summary
TestNumber
Pressure(lb·in-2)
InitialDischarge Time (s)
Flowgal·min-1
Flowtestgal·min-1
Max Ceiling
Temp (°F)
Max AvgCeiling
Temp (°F)
Max FloorHeat Flux
(Btu·s-1ft-2)
Knock-down
Quantity (gal)
Total ExtinguishmentQuantity (gal)
Fire Growthtime (s)
Knock-down
time (s)
HangarTemp (°F)
Hangar RH (%)
RoomTemp (°F)
Room RH(%)
Average Wood
Moisture (%)
Hangar Air Moisture
lb/lb Dry Air
Normalized Extinguishment
Quantity
Cooling Time1450 °F–750 °F
(s)
Ceiling temp 60 s after
Extinguishment (°F)
LP 15 gal·min-1
37 95.8 14.8 15.0 15.6 1694 1625 2.39 3.7 14.7 732 16.0 62.3 96.5 66.6 84.0 3.6 1.16E-02 1.03 11.2 36039 95.8 16.5 14.9 15.4 1735 1654 2.41 4.1 9.6 407 15.0 70.5 90.6 77.1 61.5 3.4 1.46E-02 0.67 16.8 41043 95.2 17.6 16.3 15.7 1735 1623 2.26 4.8 13.9 581 17.0 78.5 80.3 81.0 80.3 3.2 1.84E-02 0.97 16.0 38953 95.2 15.3 15.3 15.5 1809 1681 2.50 3.9 16.1 395 15.3 77.1 100.0 87.0 100.0 3.0 2.02E-02 1.12 19.0 40355 95 19.6 15.3 15.3 1828 1706 2.29 5.0 14.6 362 19.6 85.0 79.2 92.2 50.2 3.0 2.07E-02 1.02 13.8 40556 94.9 19.3 15.5 15.7 1872 1689 2.31 5.0 17.0 392 19.3 83.9 76.2 92.0 52.5 3.0 1.92E-02 1.19 15.0 427
Mean 95.3 17.2 15.4 15.5 1779 1663 2.36 4.4 14.3 478 17.0 76.2 87.1 82.7 71.4 3.2 1.75E-02Std Dev 0.392 2.02 0.51 0.17 68 35 0.09 0.58 2.57 147 2.01 8.6 9.9 9.9 19.8 0.24 3.61E-03
SD/Mean 4.11E-03 1.18E-01 3.30E-02 1.11E-02 3.82E-02 2.08E-02 3.84E-02 0.13 1.80E-01 3.07E-01 1.18E-01 1.13E-01 1.14E-01 1.20E-01 2.77E-01 7.58E-02 2.07E-01LP 20 gal·min-1
29 102.0 18.0 19.2 19.9 1832 1656 3.09 5.8 12.8 324 16.5 52.1 50.0 58.7 36.4 4.6 4.12E-03 1.06 10.6 34530 102.0 18.5 19.5 20.4 1687 1628 2.96 6.0 12.3 462 18.0 56.5 85.6 59.3 77.4 4.5 8.33E-03 1.02 12.1 32936 102.0 24.0 18.9 20.3 1729 1656 2.46 7.6 11.9 404 23.5 69.9 92.9 75.1 70.0 3.1 1.46E-02 0.99 11.5 38645 102.0 12.5 19.2 20.2 1813 1677 2.03 4.0 12.0 385 13.5 70.6 77.9 74.4 64.0 3.0 1.25E-02 1.00 16.4 39249 101.0 18.3 20.1 20.2 1820 1695 2.23 6.1 12.1 411 19.0 75.6 100.0 81.0 75.8 3.6 1.92E-02 1.01 12.2 39852 101.0 16.0 20.0 20.3 1823 1698 2.24 5.1 11.0 397 16.0 74.9 82.2 83.3 49.2 3.1 1.53E-02 0.92 13.8 433
Mean 101.7 17.9 19.5 20.2 1784 1668 2.50 5.8 12.0 397 17.8 66.6 81.4 72.0 62.1 3.7 1.24E-02Std Dev 0.516 3.75 0.47 0.17 61 27 0.43 1.18 0.57 45 3.39 9.9 17.3 10.6 16.2 0.72 5.39E-03
SD/Mean 5.08E-03 2.10E-01 2.42E-02 8.60E-03 3.40E-02 1.61E-02 1.72E-01 0.20 4.79E-02 1.12E-01 1.91E-01 1.48E-01 2.12E-01 1.47E-01 2.61E-01 1.97E-01 4.36E-01LP 100 gal·min-1
31 134.0 11.5 91.8 95.8 1767 1546 2.47 17.6 22.8 400 11.5 66.9 100.0 75.3 64.7 5.4 1.42E-02 1.06 3.8 25235 140.0 13.1 87.9 95.2 1726 1625 2.61 19.2 23.2 415 14.0 63.8 75.6 70.0 53.1 3.1 9.56E-03 1.07 4.5 33440 139.0 8.5 93.2 96.0 1801 1655 2.09 13.2 23.3 385 9.5 72.1 90.3 81.5 46.0 3.0 1.53E-02 1.08 4.2 39741 128.0 9.9 94.5 96.4 1771 1619 2.86 15.6 19.8 428 11.5 72.8 100.0 83.4 59.7 3.8 1.75E-02 0.92 5.6 35642 130.0 9.5 90.3 96.2 1718 1595 2.29 14.3 20.2 415 10.5 75.5 100.0 78.8 91.2 3.0 1.92E-02 0.94 6.8 36551 131.0 8.3 92.4 94.8 1804 1673 2.12 12.7 20.2 413 9.0 74.6 77.2 77.5 70.6 3.0 1.42E-02 0.94 4.0 464
Mean 133.7 10.1 91.7 95.7 1765 1619 2.41 15.4 21.6 409 11.0 71.0 90.5 77.8 64.2 3.6 1.50E-02Std Dev 4.9 1.86 2.31 0.61 36.292 45 0.30 2.56 1.68 15 1.79 4.6 11.6 4.8 15.8 0.98 3.29E-03
SD/Mean 3.69E-02 1.84E-01 2.52E-02 6.37E-03 2.06E-02 2.78E-02 1.24E-01 0.17 7.77E-02 3.63E-02 1.63E-01 6.50E-02 1.28E-01 6.12E-02 2.46E-01 2.76E-01 2.20E-01UHP 15 gal·min-1
26 1203 27.2 13.6 14.9 1812 1614 2.90 6.2 10.7 333 26.0 56.6 81.4 60.6 70.8 4.6 7.95E-03 0.96 9.2 29627 1282 21.2 13.7 15.0 1753 1669 3.08 4.8 13.0 397 20.0 72.5 64.9 72.5 61.5 6.0 1.11E-02 1.17 7.7 31933 1221 24.4 14.5 15.0 1787 1640 2.58 5.9 11.2 409 23.0 61.5 92.2 67.4 69.0 3.8 1.08E-02 1.00 7.7 33044 1224 18.3 14.1 15.0 1805 1630 2.38 4.3 8.8 401 19.0 69.1 65.6 72.1 58.0 3.0 9.97E-03 0.79 9.9 37346 1270 19.0 14.5 14.8 1834 1682 2.61 4.6 9.5 381 20.0 71.7 85.6 78.6 67.5 3.0 1.43E-02 0.85 11.8 43150 1300 20.5 14.9 14.5 1835 1680 2.30 5.1 13.7 367 21.0 72.0 72.5 82.6 38.8 3.1 1.22E-02 1.23 8.8 351
Mean 1250 21.8 14.2 14.9 1804 1653 2.64 5.1 11.1 381 21.5 67.2 77.0 72.3 60.9 3.9 1.11E-02Std Dev 39.1 3.40 0.53 0.20 31 28 0.30 0.73 1.92 28 2.59 6.6 11.1 7.8 11.9 1.21 2.14E-03
SD/Mean 3.13E-02 1.56E-01 3.73E-02 1.32E-02 1.72E-02 1.72E-02 1.14E-01 0.14 1.72E-01 7.37E-02 1.20E-01 9.86E-02 1.45E-01 1.08E-01 1.95E-01 3.07E-01 1.94E-01UHP 20 gal·min-1
28 1264 21.4 18.7 19.7 1721 1623 2.20 6.7 10.5 419 21.0 71.5 86.4 76.1 73.7 5.4 1.44E-02 0.86 7.6 33932 1270 19.1 18.8 19.4 1725 1584 2.24 6.0 10.8 441 19.0 70.0 95.8 73.8 76.0 5.2 1.51E-02 0.88 6.1 33938 1294 23.5 19.6 19.3 1747 1608 3.32 7.7 17.8 606 24.0 64.7 84.2 74.0 52.2 3.4 1.10E-02 1.45 8.1 27247 1273 18.5 17.2 19.2 1871 1715 2.19 5.3 12.1 362 18.5 77.6 87.8 82.2 60.2 3.0 1.80E-02 0.99 9.3 38848 1278 16.5 18.2 19.2 1818 1654 2.34 5.0 10.8 362 17.5 77.1 98.5 79.8 85.2 3.3 1.99E-02 0.88 5.9 38454 1196 15.5 18.2 19.2 1777 1654 2.37 4.7 11.4 410 15.5 70.7 79.6 91.0 42.5 3.0 1.28E-02 0.93 8.9 404
Mean 1263 19.1 18.4 19.3 1777 1640 1.01 5.9 12.2 433 19.3 71.9 88.7 79.5 65.0 3.9 1.52E-02Std Dev 34.1 3.00 0.80 0.20 59 46 0.43 1.13 2.77 90 2.95 4.8 7.1 6.5 16.1 1.10 3.28E-02
SD/Mean 2.70E-02 1.57E-01 4.35E-02 1.01E-02 3.31E-02 2.79E-02 0.42 0.19 2.27E-01 2.09E-01 1.53E-01 6.71E-02 8.06E-02 8.23E-02 2.48E-01 2.85E-01 2.16E-01

43DISTRIBUTION STATEMENT A. Approved for public release. Distribution is unlimited.
AFIMSC-022118B; 21 February 2018.
Table A-7 Hydraulic Ventilation Results Distance 15 UHP 20 UHP 15 LP 20 LP 100 LP
Flow (ft3/s) Test #
Flow (ft3/s) Test #
Flow (ft3/s)
Test #
Flow (ft3/s)
Test #
Flow (ft3/s)
Test #
8 2.36 35 3 34 0.91 55 1.45 48 2.86 4012 1.88 31 2.6 32 1.01 44 1.46 47 2.84 3916 1.96 30 3.25 33 1.15 45 1.29 46 2.95 4220 2.23 22 2.66 28 1.18 52 1.56 51 2.55 1224 2.19 18 2.74 26 0.84 53 1.58 50 2.67 1428 2.34 29 2.66 25 1.01 54 1.64 49 2.67 16
Average 2.16 2.82 1.02 1.50 2.76
Table A-8 Hose Pull Complete DataUHP Wet Gravel Asphalt Grass Corner
UHP Dry Gravel Asphalt Grass Corner
1 87 105.4 65.5 99.3 1 56.9 43.4 40.7 69.62 86.2 121.3 69.6 109.8 2 57.7 61.4 36.8 80.23 84.2 117 71.6 107.5 3 57.2 78 43.7 80.84 84.3 121.1 73.4 100.1 4 49.9 74 52.5 84.35 72.9 96.3 82.1 5 44 58.2 58.5
Mean 82.92 112.22 72.44 104.175 Mean 53.14 63 46.44 78.725Std Dev 5.730 11.001 6.147 5.262 Std Dev 6.030 13.746 8.882 6.346LP Wet Gravel Asphalt Grass Corner LP Dry Gravel Asphalt Grass Corner
1 101.6 112.1 93.8 151.3 1 28 26 21.7 28.62 127.9 165.2 145 275 2 25.4 27.2 28.6 40.23 132.5 175.4 159.4 329 3 24.4 26.7 9.5 49.24 126.6 173.1 285 4 31.2 46.85 81.6 98.6 98.7 5 22 25.7 27.2
Mean 114.04 144.88 152.2 260.075 Mean 24.95 26.4 23.64 41.2Std Dev 21.781 36.596 10.182 76.216 Std Dev 2.484 0.678 8.633 9.222

44DISTRIBUTION STATEMENT A. Approved for public release. Distribution is unlimited.
AFIMSC-022118B; 21 February 2018.
Appendix B: Test Checklist
B.1. Pre-Fire Test Identification
Date____________ Run Number___________ Pressure__________ Flow_________
B.2. Condition the Test Room and Fuel
Clean the interior of the room, removing any residual effects or repairing any structural damage from previous fires. It is also preferred that the test room temperature is within 15 degrees of the ambient temperature in the Fire Hangar, building 9500E.
Verify that the Interior/Structural Test Room screws that retain the Super Padgenite panels in place are secured per manufacturer’s instructions.
Assemble the fuel load in the room.
Install the dehumidifier in the test room and set the controls to <20 percent humidity.
B.3. Perform Pre-Test Instrument Operational Checks
Turn on the “Video” and “Solenoid” power switches. Turn on the PA system.
Using the small propane torch, verify response of all accessible thermocouples. Verify response of heat flux gauges by placing a warm object on the surface of the heat flux gauges.
Verify the operation of exhaust fan(s).
Calibrate gas analyzers as appropriate. Verify the performance of system components including pumps, filters, cold traps, and flow rate through the analyzer.
Ensure that the data acquisition system is recording pressure, flow, temperature, and heat flux.
Obtain 8 each humidity measurements of the wood. _______, ________, ________, ________, ________, ________, ________, ________
Record the temperature ________ and humidity________ in the room.Record the temperature ________ and humidity________ in the hangar.
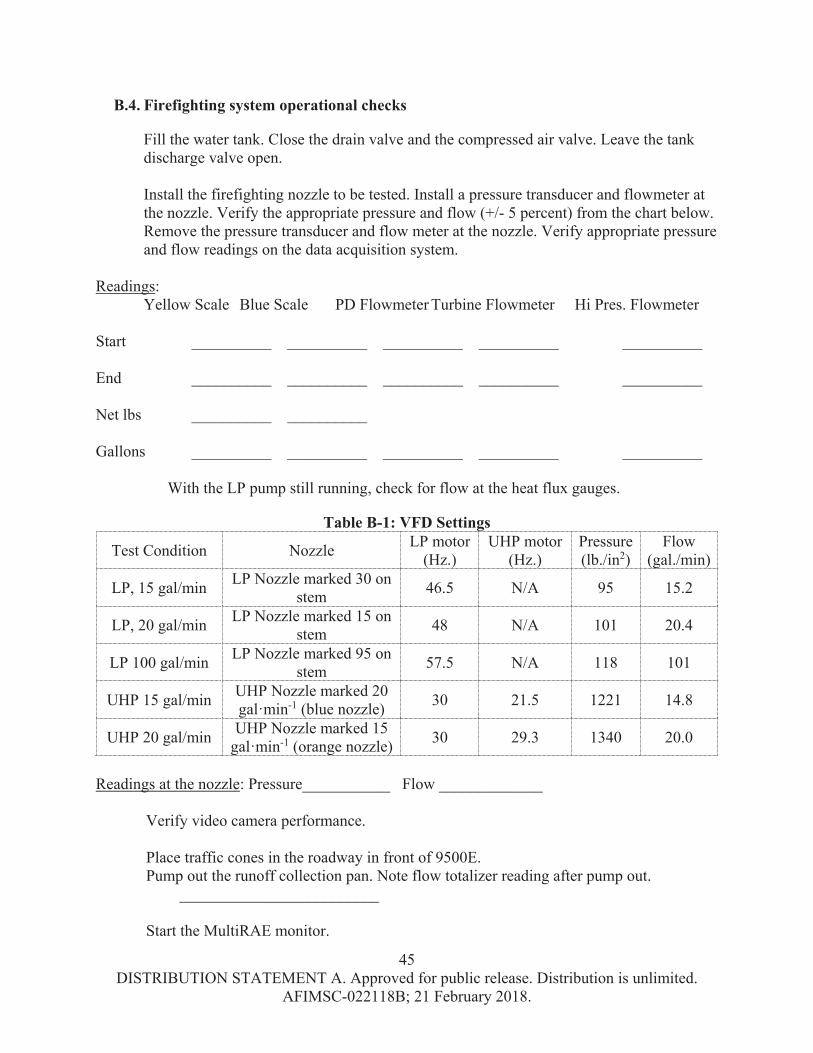
45DISTRIBUTION STATEMENT A. Approved for public release. Distribution is unlimited.
AFIMSC-022118B; 21 February 2018.
B.4. Firefighting system operational checks
Fill the water tank. Close the drain valve and the compressed air valve. Leave the tank discharge valve open.
Install the firefighting nozzle to be tested. Install a pressure transducer and flowmeter at the nozzle. Verify the appropriate pressure and flow (+/- 5 percent) from the chart below. Remove the pressure transducer and flow meter at the nozzle. Verify appropriate pressure and flow readings on the data acquisition system.
Readings:Yellow Scale Blue Scale PD Flowmeter Turbine Flowmeter Hi Pres. Flowmeter
Start __________ __________ __________ __________ __________
End __________ __________ __________ __________ __________
Net lbs __________ __________
Gallons __________ __________ __________ __________ __________
With the LP pump still running, check for flow at the heat flux gauges.
Table B-1: VFD Settings
Test Condition Nozzle LP motor (Hz.)
UHP motor (Hz.)
Pressure (lb./in2)
Flow (gal./min)
LP, 15 gal/min LP Nozzle marked 30 on stem 46.5 N/A 95 15.2
LP, 20 gal/min LP Nozzle marked 15 on stem 48 N/A 101 20.4
LP 100 gal/min LP Nozzle marked 95 on stem 57.5 N/A 118 101
UHP 15 gal/min UHP Nozzle marked 20 gal·min-1 (blue nozzle) 30 21.5 1221 14.8
UHP 20 gal/min UHP Nozzle marked 15 gal·min-1 (orange nozzle) 30 29.3 1340 20.0
Readings at the nozzle: Pressure___________ Flow _____________
Verify video camera performance.
Place traffic cones in the roadway in front of 9500E.Pump out the runoff collection pan. Note flow totalizer reading after pump out.
_________________________
Start the MultiRAE monitor.

46DISTRIBUTION STATEMENT A. Approved for public release. Distribution is unlimited.
AFIMSC-022118B; 21 February 2018.
B.5. Perform Pre-Test Safety Briefings
Review test conditions: Pressure: _________, Flow: _________, Date: __________
Ensure that there are a sufficient number of personnel to safely conduct a test.
Assignments:
Principal Investigator/ Safety Officer: __________________________
Firefighter 1: ________________________
Firefighter 2/ Fuel igniter/Safety Observer: ______________________
Data Acquisition operator: ____________________
Pump Panel Operator: ________________________
Casuals/Observers: __________________________________________
Warn all personnel about the possibility of dangerous wildlife such as bears, snakes, and venomous insects.
Abort Criteria and Procedures
If a fire has already been lit and an abort is necessary, the firefighter(s) will attempt to put out the fire by whatever means necessary. If this is not possible, evacuate the facility and wait until the fuel burns out.
Experiments will be halted if any of the following occur:
Thunderstorms within five miles of the test area or when Hurcon levels are at or below Hurcon 3.
Personnel and/or equipment become threatened for any reason at any point during testing.
Any item of PPE is determined to be unserviceable and cannot be replaced by a fully serviceable unit.Personnel experience any signs of heat stress.
Unsatisfactory performance or failure of equipment.

47DISTRIBUTION STATEMENT A. Approved for public release. Distribution is unlimited.
AFIMSC-022118B; 21 February 2018.
All personnel involved are responsible to report any issues, concerns or problems.The PI and SO will determine if testing will proceed.
All personnel without SCBA are to wear a N-95 fixed particulate respirator (dust mask). They are to leave Building 9500E if the alarm on the MultiRAE indicates limits have been exceeded. MultiRAE limits shall be set to:
O2 > __19.5%_____CO2< __5000 ppm__CO< __50 ppm____HCN< ___10 ppm___
B.6. Emergency Action Procedures
Initial emergency medical treatment will be by AFCEC personnel on scene. The SO or PI will immediately dial 911 for transport to a local Medical Center. Additionally, the SO or PI will ensure the Highway 98 gate is open (unlocked) before initiating live fire operations to allow access for emergency responders and an individual is sent to meet responding emergency personnel at the intersection of Range Road and Highway 98. In case of an emergency, perform the following actions:
Injuries
Give first aid.
If emergency services are needed dial 911. Provide your name, location, telephone number/radio call sign (Sky X), and type of injuries.
If injuries warrant as determined by base medical personnel or senior person on scene, transport the injured person(s) to a medical facility.
Unplanned Fires
Small/Contained Fires: Attempt to fight these fires if you are properly trained and have the proper equipment (extinguisher). Notify Base Fire Department using the Range Control Center (RCC) Crash Control Radio, or dial 911. Provide your name, location, telephone number/radio call sign (Sky X), and type of fire.Large/Not Contained Fire: Evacuate the area and notify the Base Fire Department immediately, using the RCC Crash Control Radio, or dial 911. Provide your name, location, telephone number and radio calls sign (Sky X), and type of fire.
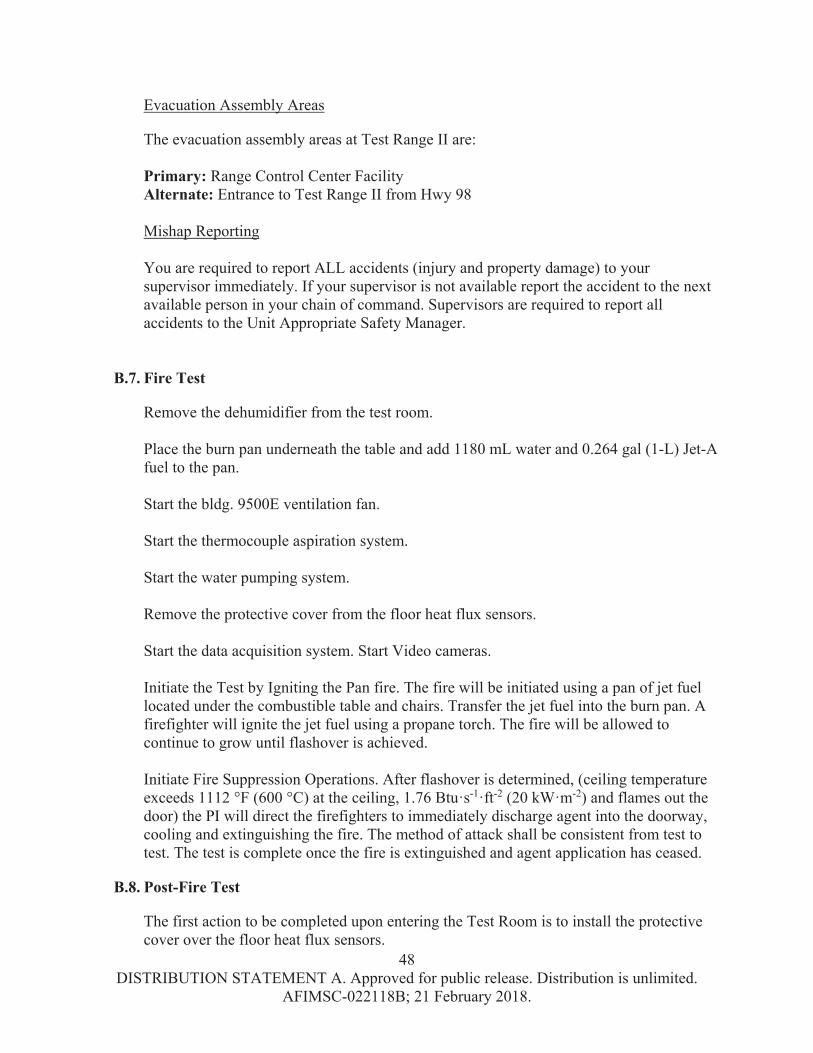
48DISTRIBUTION STATEMENT A. Approved for public release. Distribution is unlimited.
AFIMSC-022118B; 21 February 2018.
Evacuation Assembly Areas
The evacuation assembly areas at Test Range II are:
Primary: Range Control Center FacilityAlternate: Entrance to Test Range II from Hwy 98
Mishap Reporting
You are required to report ALL accidents (injury and property damage) to your supervisor immediately. If your supervisor is not available report the accident to the next available person in your chain of command. Supervisors are required to report all accidents to the Unit Appropriate Safety Manager.
B.7. Fire Test
Remove the dehumidifier from the test room.
Place the burn pan underneath the table and add 1180 mL water and 0.264 gal (1-L) Jet-Afuel to the pan.
Start the bldg. 9500E ventilation fan.
Start the thermocouple aspiration system.
Start the water pumping system.
Remove the protective cover from the floor heat flux sensors.
Start the data acquisition system. Start Video cameras.
Initiate the Test by Igniting the Pan fire. The fire will be initiated using a pan of jet fuel located under the combustible table and chairs. Transfer the jet fuel into the burn pan. Afirefighter will ignite the jet fuel using a propane torch. The fire will be allowed to continue to grow until flashover is achieved.
Initiate Fire Suppression Operations. After flashover is determined, (ceiling temperature exceeds 1112 °F (600 °C) at the ceiling, 1.76 Btu·s-1·ft-2 (20 kW·m-2) and flames out the door) the PI will direct the firefighters to immediately discharge agent into the doorway, cooling and extinguishing the fire. The method of attack shall be consistent from test to test. The test is complete once the fire is extinguished and agent application has ceased.
B.8. Post-Fire Test
The first action to be completed upon entering the Test Room is to install the protective cover over the floor heat flux sensors.
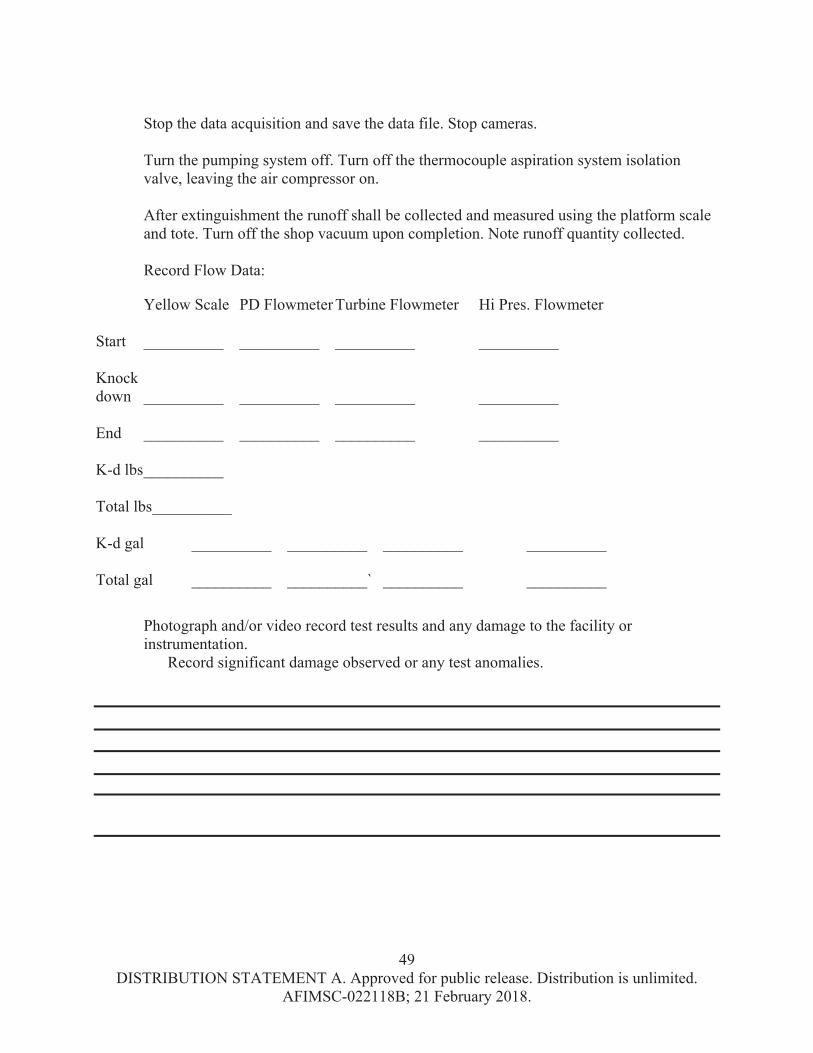
49DISTRIBUTION STATEMENT A. Approved for public release. Distribution is unlimited.
AFIMSC-022118B; 21 February 2018.
Stop the data acquisition and save the data file. Stop cameras.
Turn the pumping system off. Turn off the thermocouple aspiration system isolation valve, leaving the air compressor on.
After extinguishment the runoff shall be collected and measured using the platform scale and tote. Turn off the shop vacuum upon completion. Note runoff quantity collected.
Record Flow Data:
Yellow Scale PD Flowmeter Turbine Flowmeter Hi Pres. Flowmeter
Start __________ __________ __________ __________
Knockdown __________ __________ __________ __________
End __________ __________ __________ __________
K-d lbs__________
Total lbs__________
K-d gal __________ __________ __________ __________
Total gal __________ __________` __________ __________
Photograph and/or video record test results and any damage to the facility or instrumentation.
Record significant damage observed or any test anomalies.

50DISTRIBUTION STATEMENT A. Approved for public release. Distribution is unlimited.
AFIMSC-022118B; 21 February 2018.
LIST OF SYMBOLS, ABBREVIATIONS, AND ACRONYMS
AFB Air Force BaseAFCEC Air Force Civil Engineer CenterASHRAE American Society of Heating, Refrigerating and Air Conditioning EngineersARFF aircraft rescue firefightingavg averageBtu British thermal unitcm centimeterFES Fire and Emergency Servicesfl oz fluid ounceft footFY fiscal yeargal gallonhr hourHz hertzin inchkW kilowattkPa kilopascalL literlb poundlbf pound forceLP low pressurem metermPa millipascalmm millimetermin minuteN newtonNFPA National Fire Protection Associations secondsd standard deviationUHP ultra high pressureUSAF United States Air ForceWUI wildland–urban interface