1701 bank austria - investor presentation 9m16 en · • addressed italian legacy issues, through...
TRANSCRIPT

Presentation to Fixed Income Investors
Investor Relations
Vienna, 20 January 2017
Bank Austria

2
Opening remarks

After the CEE Demerger, new role of Bank AustriaFocus on Austrian market
3
New Bank Austria
Focus on Austria Transformation of Austrian activities
• CEE Demerger facts:
• Effective as of 1st October 2016
• Transfer of CEE business from BA AG to UC SpA
(including shift of management function for the CEE
subsidiaries to UniCredit)
• CEE Demerger rationale:
• Lower risk going forward
• Better capital structure with lower volatility
• Improvement of funding and market access
• In the future, lower complexity and higher focus
on the Austrian business
• New set-up aiming at:
• Strengthening profitability
• Customer centricity
• Strategic response to evolving digital
trends
• Streamlining of Austrian operations
Opening remarks

Bank Austria remains a leading bank in the local market
4
Leading domestic bank in Corporate
Banking, Corporate & Investment Banking
and Private Banking
Vienna remains the CEE competence center
of UniCredit Group
BA by far the largest bank in Austria at
individual institution level
Bank Austria is one of the best capitalized
large banks in the country
Corporates: client shares of up to 70%Private Banking: Every 5th HNWI a BA client
No impact of CEE transfer on Bank Austriaclients
With assets > € 100 bn, largest Austrian bankon unconsolidated level
Solid CET1 ratio of 12.9%
1) BA Group as of 30 September 2016, before CEE Demerger
Opening remarks

New Bank Austria – drivers of transformation until 2018
5
Streamline operations and standardize core processescore processes
Optimize internal organization
Revenue-generating initiatives in all business divisions
Increase focus on multichannel / digital sales
Customer centricity as guiding principle
Opening remarks

Agenda
6
• UniCredit Group
• Overview Bank Austria
• Business Model & Strategy
• Profit & Loss
• Balance Sheet & Capital Ratios
• Liquidity & Funding
• Funding Strategy & Position
• Transactions
• Cover Pool
• Annex
1
2
3
4

7
UniCredit at a glanceA clear international profile based on a strong European identity
UniCredit Group1 2 3
1) Source: UniCredit analysis on Sodali Shareholders' ID. All data based on ordinary shares as at 16 June 20162) Excluding figures for Koc Financial Group calculated at 100%. Figures as of Sep 30, 2016; still including Ukrsotsbank which has been sold as of 31 Oct, 20163) As of 15 November 20164) As of 30 September 2016
Main shareholders:• Stable shareholders, e.g. Foundations• Institutional investors• Retail investors
• Strong local roots in 17 countries2)
• ~ 122,000 employees2)
• ~ 6,500 branches2)
• ~ 31 mn customers in Europe
• One of the most important banks in Europe with total assets
of ~ € 875 bn
• One of the 30 Global Systemically Important Banks (“G-SIBs”)
worldwide
• Market capitalization of ~ € 13 bn 3)
• Common Equity Tier 1 (CET1) Ratio at 10.82% under Basel 3
fully loaded 4)
UniCredit Highlights Shareholder Structure1)
StrategicShareholders
43%
Miscellaneousand unidentified
Investors42%
InstitutionalShareholders
15%
4

Transform 2019UniCredit Strategic Plan 2016-19 (Address capital and legacy issue)
8
UniCredit Group
• Bold actions taken: Pioneer, Pekao and 30% ofFineco
• €13bn rights issue fully underwritten by volume1
• Conservative plan delivering organic capitalgeneration
• Addressed Italian legacy issues, through de-riskingof €17.7bn portfolio and proactive bad loansmanagement
• Detailed review of portfolio resulting instrengthened coverage ratio
• Tightened risk discipline to further improve creditportfolio risk profile
10.8% CET1ratio2
>12.5% CET1ratio
€8.1bn one-offLLP3
254bps4 CoR 49bps CoR
1. Pre-underwriting commitment, in line with market practice for similar transactions, of a consortium of primary financial institutions 2. Stated amount, 12.5% restated 3. Based on current
assessment and subject to final terms of FINO transaction 4. Including one-off LLP, if excluding LLP in 9M2016 cost of risk equal to 77bps
Note: 9M2016 figures restated assuming new Group perimeter; plan assumes cash dividend with a 20% payout
1 2 3 4
STRENGTHENAND OPTIMIZE
CAPITAL
IMPROVE ASSETQUALITY
9M16 2019

UniCredit Group1 2 3 4
Transform 2019UniCredit Strategic Plan 2016-19 (further transforming and building on competitiveadvantages)
TRANSFORMOPERATING
MODEL
MAXIMIZECOMMERCIALBANK VALUE
ADOPT LEAN BUTSTEERINGCENTER
• Operating model transformation to a sustainablelower cost structure
• Further improve customer focus, service andproducts
• IT investments to support businesstransformation
• Digitalization as enabler
• Capitalize on Retail client relationships potential• Leverage on "go to" bank status for Corporate
clients in Western Europe1
• Further strengthen leadership4 position in CEE• Enhance cross-selling across business lines and
countries
• Strong steering Group Corporate Center; KPIs todrive performance and ensure accountability
• Leaner support functions and transparent costallocation
€1.7bn net annual recurring cost savingsas of 2019
944 branches reduction in Western Europe1 by2019
€1.6bn2 IT investment cash out over planperiod
€80bn increase to reach €856bn TFAin 2019
Additional €363m joint CIB-CommercialBanking revenues3
Weight of Group Corporate Center of total
costs from 5.1% to 2.9% by 2019
1. Italy, Germany and Austria 2. Excluding regulatory, cumulated effect 2017-2019 3. Includes revenues on GTB, ECM, DCM, M&A, Markets products from Commercial Banking clients
and structured financing products from Corporate clients 4. Rank #1 for market share by assets as of 9M2016

Agenda
10
• UniCredit Group
• Overview Bank Austria
• Business Model & Strategy
• Profit & Loss
• Balance Sheet & Capital Ratios
• Liquidity & Funding
• Funding Strategy & Position
• Transactions
• Cover Pool
• Annex
1
2
3
4
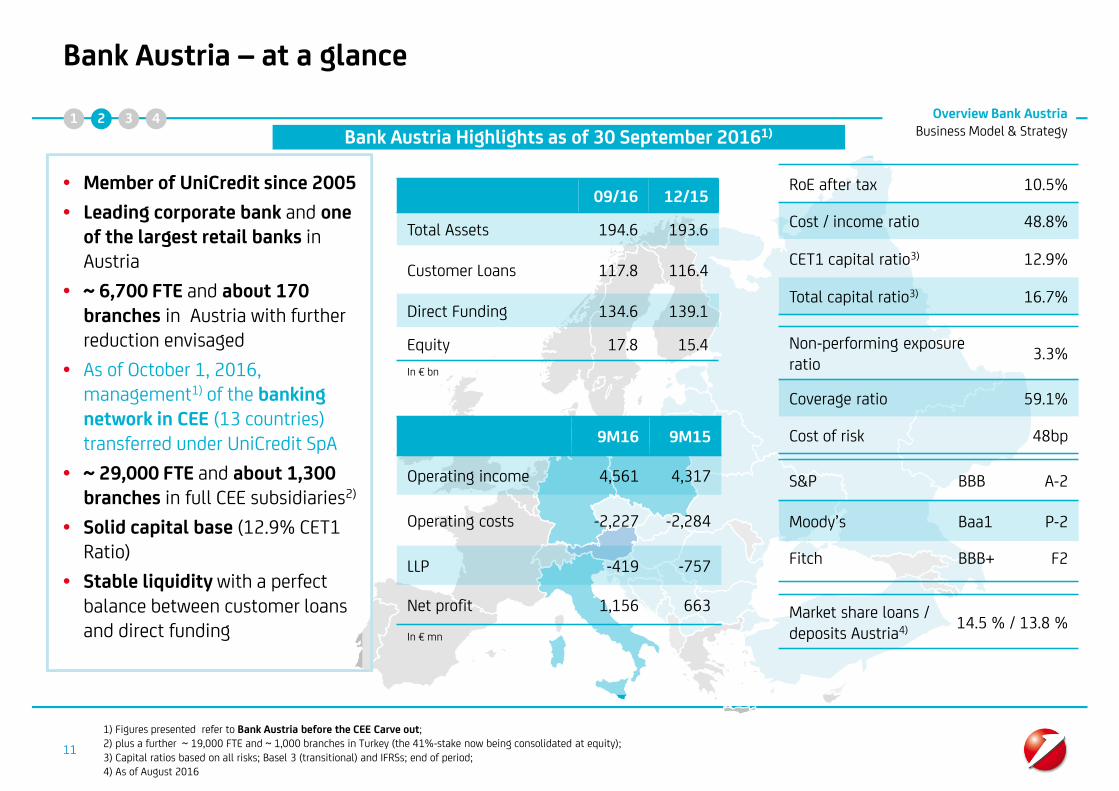
Bank Austria – at a glance
• Member of UniCredit since 2005
• Leading corporate bank and oneof the largest retail banks inAustria
• ~ 6,700 FTE and about 170branches in Austria with furtherreduction envisaged
• As of October 1, 2016,management1) of the bankingnetwork in CEE (13 countries)transferred under UniCredit SpA
• ~ 29,000 FTE and about 1,300branches in full CEE subsidiaries2)
• Solid capital base (12.9% CET1Ratio)
• Stable liquidity with a perfectbalance between customer loansand direct funding
1) Figures presented refer to Bank Austria before the CEE Carve out;2) plus a further ~ 19,000 FTE and ~ 1,000 branches in Turkey (the 41%-stake now being consolidated at equity);3) Capital ratios based on all risks; Basel 3 (transitional) and IFRSs; end of period;4) As of August 2016
11
RoE after tax 10.5%
Cost / income ratio 48.8%
CET1 capital ratio3) 12.9%
Total capital ratio3) 16.7%
09/16 12/15
Total Assets 194.6 193.6
Customer Loans 117.8 116.4
Direct Funding 134.6 139.1
Equity 17.8 15.4
In € bn
9M16 9M15
Operating income 4,561 4,317
Operating costs -2,227 -2,284
LLP -419 -757
Net profit 1,156 663
In € mn
Non-performing exposureratio
3.3%
Coverage ratio 59.1%
Cost of risk 48bp
S&P BBB A-2
Moody’s Baa1 P-2
Fitch BBB+ F2
Market share loans /deposits Austria4) 14.5 % / 13.8 %
Bank Austria Highlights as of 30 September 20161)
Overview Bank AustriaBusiness Model & Strategy
1 2 3 4
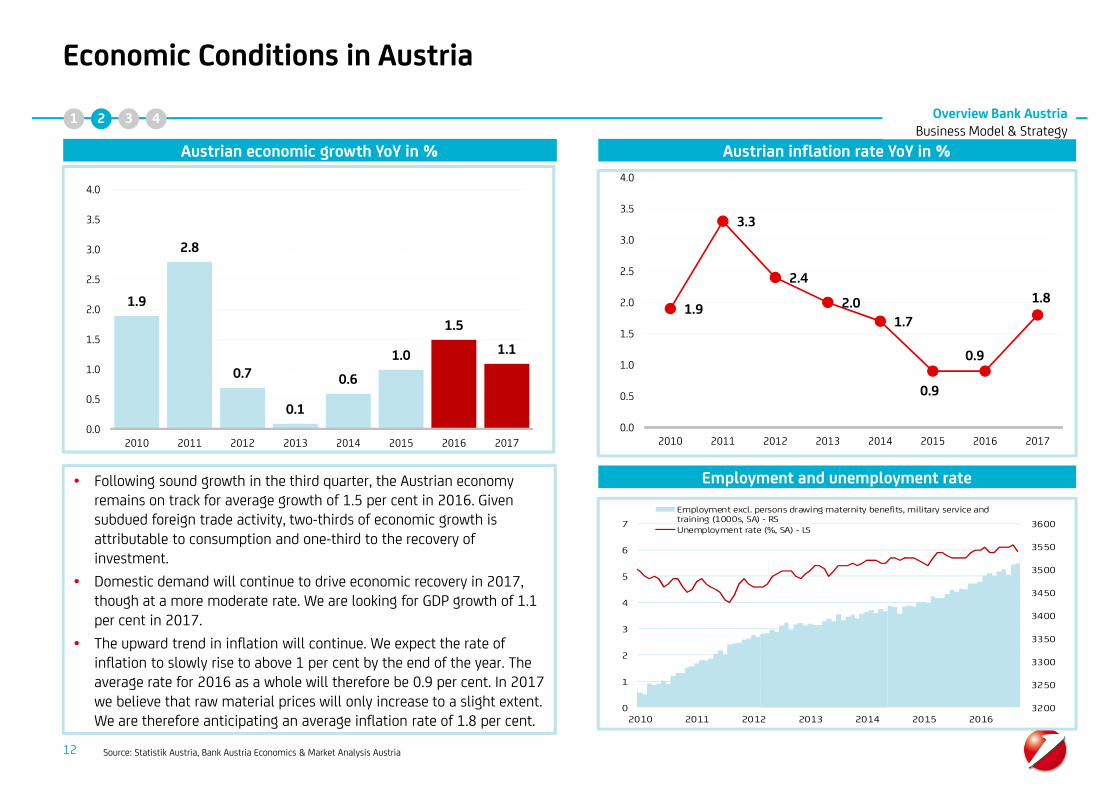
Economic Conditions in Austria
Source: Statistik Austria, Bank Austria Economics & Market Analysis Austria
Austrian economic growth YoY in %
1.9
2.8
0.7
0.1
0.6
1.0
1.5
1.1
0.0
0.5
1.0
1.5
2.0
2.5
3.0
3.5
4.0
2010 2011 2012 2013 2014 2015 2016 2017
1.9
3.3
2.4
2.0
1.7
0.9
0.9
1.8
0.0
0.5
1.0
1.5
2.0
2.5
3.0
3.5
4.0
2010 2011 2012 2013 2014 2015 2016 2017
Austrian inflation rate YoY in %
• Following sound growth in the third quarter, the Austrian economyremains on track for average growth of 1.5 per cent in 2016. Givensubdued foreign trade activity, two-thirds of economic growth isattributable to consumption and one-third to the recovery ofinvestment.
• Domestic demand will continue to drive economic recovery in 2017,though at a more moderate rate. We are looking for GDP growth of 1.1per cent in 2017.
• The upward trend in inflation will continue. We expect the rate ofinflation to slowly rise to above 1 per cent by the end of the year. Theaverage rate for 2016 as a whole will therefore be 0.9 per cent. In 2017we believe that raw material prices will only increase to a slight extent.We are therefore anticipating an average inflation rate of 1.8 per cent.
Employment and unemployment rate
3200
3250
3300
3350
3400
3450
3500
3550
3600
0
1
2
3
4
5
6
7
2010 2011 2012 2013 2014 2015 2016
Employment excl. persons drawing maternity benefits, military service andtraining (1000s, SA) - RSUnemployment rate (%, SA) - LS
12
Overview Bank AustriaBusiness Model & Strategy
1 2 3 4

13
Business Model and Market Position in Bank Austria‘s Home Market
Bank Austria is one of the strongest banks in Austria
CIB = Corporate & Investment Banking
CIB
• Leading corporate bank in the
country (7 of 10 large corporates
are clients)
• Focus on
• Multinationalcorporates
• International andinstitutional Real Estatecustomers requiringinvestment bankingsolutions and capitalmarkets-related products
• Financial Institutions
• Clients have access to the largest
banking network in CEE as well
as to UniCredit branches in
major financial centers
worldwide
Retail Banking
• The division covers 1,6mn Retail
and Small Business customers
(<€3mn turnover)
• Broad Multichannel offer via
• Physical branches
• Online branch (remote
advisory via video
telephony)
• Online shop and online
banking
• Nationwide complete range of
high-quality advisory for
complex products through on site
and remote experts
• Extended opening hours and
increasing online, mobile and
self-service offers covers
changing customer behavior
Private Banking
• Leading Private Banking in
Austria with every fifth Austrian
High Net Worth Individual as
customer of Bank Austria
• Clients benefit from the
combination of local
understanding and
international capabilities
• Tailored financial services to
High Net Worth Individuals and
foundations
• Successful client approach
through BA‘s PB Division and
Schoellerbank
Corporate Banking
• Strong market position in all
corporate segments
• The division covers
• Corporate customers(>€3mn turnover)
• Real Estate
• Public Sector (excludingRepublic of Austria)
• Nearly every second SME (€3-
50mn turnover) is customer of
Bank Austria
• Broad coverage through a
nationwide branch network,
offering its customers a
complete range of high-quality
products
Overview Bank AustriaBusiness Model & Strategy
1 2 3 4

9.9%
23.9%
• Retail Deposits
21.6%
Bank Austria‘s Market Shares1) in the Domestic Customer Business(as of September 2016)
Loans TOTAL Deposits TOTAL
1) UniCredit Bank Austria AG2) Pioneer Investments Austria + Bank Austria real estate funds
Source: Monthly Report Austrian National Bank (OeNB); VÖIG
14
• Retail Loans
• Corporate Loans
• Public Sector Loans
• Corporate Deposits
• Public Sector Deposits
• Funds2)
Very efficient network structure to cover the important size of customer share
with only 5% of all bank branches in Austria
14.2% 13.6%
11.9%
16.0%
16.4%
14.1%
Overview Bank AustriaBusiness Model & Strategy
1 2 3 4

1) Subordinated (Lower Tier II)2) Securities issued before 31 Dec. 2001 which benefit from a secondary liability by the City of Vienna (grandfathered debt) are also rated as shownabove by Standard & Poor´s, while by Moody´s the corresponding senior securities are rated A2 and the subordinated ones are rated Baa2
15
Rating Overview
(as of 9 November 2016)
1) 1) 1)
2)
Long-Term Short-Term Subordinated Long-Term Short-Term Subordinated Long-Term Short-Term Subordinated
Baa1 P-2 Ba1 BBB A-2 BB+ BBB+ F2 -
Stable Negative Negative
Baa1 P-2 Ba1 BBB- A-3 BB BBB+ F2 BBB
Stable Stable Negative
Public Sector
Covered Bond
Mortgage Covered
Bond
UniCreditS.p.A.
Moody's S&P Fitch
Bank Austria
Aaa - -
Aaa - -
Overview Bank AustriaBusiness Model & Strategy
1 2 3 4

Agenda
16
• UniCredit Group
• Overview Bank Austria
• Business Model & Strategy
• Profit & Loss
• Balance Sheet & Capital Ratios
• Liquidity & Funding
• Funding Strategy & Position
• Transactions
• Cover Pool
• Annex
1
2
3
4

1) As of 1 October 2016, CEE Division was transferred to UniCredit SpA. Figures presented refer to Bank Austria before the CEE Carve-out and before IFRS 5 (accounting ruleregarding the treatment of discontinued operations)
Note: Non-operating items include provisions for risks and charges, systemic charges, profit from investments and integration costs
17
P&L of Bank Austria Group1) – 9M16Net profit up by 74% based on good performance both in Austria and CEE
Overview Bank AustriaProfit & Loss
• Operating Income up 6% y/y, driven by strong CEE contribution and supported by sale of VISA shares (€ 183 mn contribution)• Operating Costs down by 2.5%, mainly due to cost savings in Austria (transfer of pension obligation and also lower FTE)• Net Write-Downs of Loans significantly down y/y, with improvements in CEE, and Austria with a very favorable development (net releases)• Non-Operating Items € -468 mn: mainly systemic charges (€ -272 mn), and integration costs (€ -218 mn, mainly related to legal changes in
Austria requiring a higher provision for the transfer of pension obligations to the state pension scheme)• Other positions includes the income tax of € -229 mn, mainly relating to CEE and minorities € -70mn
1-9/ 1-9/(€ mn) 2016 2015
Operating Income 4,561 4,317 5.6% 1,524 1,667 1,406 -8.6% 8.5%
Operating Costs -2,228 -2,284 -2.5% -733 -740 -752 -1.0% -2.6%
Operating Profit 2,333 2,034 14.7% 792 927 653 -14.6% 21.2%
Net Write-Downs of Loans -419 -757 -44.6% -129 -146 -365 -11.3% -64.6%
Net Operating Profit 1,915 1,277 49.9% 662 781 288 -15.2% >100.0%
Non-Operating Items -468 -287 63.3% -48 -67 -104 -28.4% -54.0%
Profit Before Tax 1,446 990 46.1% 615 714 184 -14.0% >100.0%
P/L discontinued operations 9 -158 >-100.0% 8 -12 25 >-100.0% -67.5%
Other positions -299 -169 76.7% -93 -135 -37 -31.2% >100.0%
Group Net Profit 1,156 663 74.3% 530 567 173 -6.6% >100.0%
Cost / Income Ratio (in %) 48.8% 52.9% -406 bp 48.1% 44.4% 53.5% 368 bp -546 bp
y/y 3Q16 2Q16 3Q15 q/q y/y
For comparabilityreasons, CEE resultsincluded herein arestill consolidated in
each P&L-line.When applying IFRS 5,CEE results are moved
to the line „P/Ldiscontinued
operations“; GroupNet Profit 1-9/2016 in
this scenario is €1,086 mn
1 2 3 4

Note: Non-operating items include provisions for risks and charges, systemic charges, profit from investments and integration costs
18
P&L of Austrian Segments – 9M16Net operating profit up by 48%; decrease in operating costs and positive LLPs
• Operating Income down 1% y/y, driven mainly by lower net fees and commissions and lower net trading• Operating Costs down by 8%, reflecting efficient cost savings measures• Net Write-Downs of Loans with a very favorable development (net releases)• Non-Operating Items € -361 mn: mainly systemic charges (€ -150 mn), and integration costs
(€ -204 mn in Q1 related to legal changes requiring a higher provision for the transfer of pension obligations to the state pension scheme)• Net Profit lower y/y due to aforementioned one-off (€ -204 mn regarding transfer of pension obligations)
1-9/ 1-9/(€ mn) 2016 2015
Operating Income 1,489 1,499 -0.7% 502 530 483 -5.4% 3.9%
Operating Costs -1,106 -1,197 -7.5% -350 -362 -391 -3.3% -10.5%
Operating Profit 383 303 26.6% 152 169 92 -10.0% 65.3%
Net Write-Downs of Loans 60 -2 >-100.0% 20 44 -6 -54.2% >-100.0%
Net Operating Profit 443 300 47.7% 172 212 86 -19.1% >100.0%
Non-Operating Items -361 -165 >100.0% -44 -32 -76 34.5% -42.8%
Profit Before Tax 82 135 -39.0% 128 180 10 -28.8% >100.0%
Income Tax -33 -47 -29.7% -17 -11 -32 62.9% -46.0%
Group Net Profit 27 155 -82.4% 108 144 11 -24.7% >100.0%
Cost / Income Ratio (in %) 74.3% 79.8% -553 bp 69.8% 68.2% 81.0% 155 bp -1,122 bp
y/y 3Q16 2Q16 3Q15 q/q y/y
Overview Bank AustriaProfit & Loss
1 2 3 4
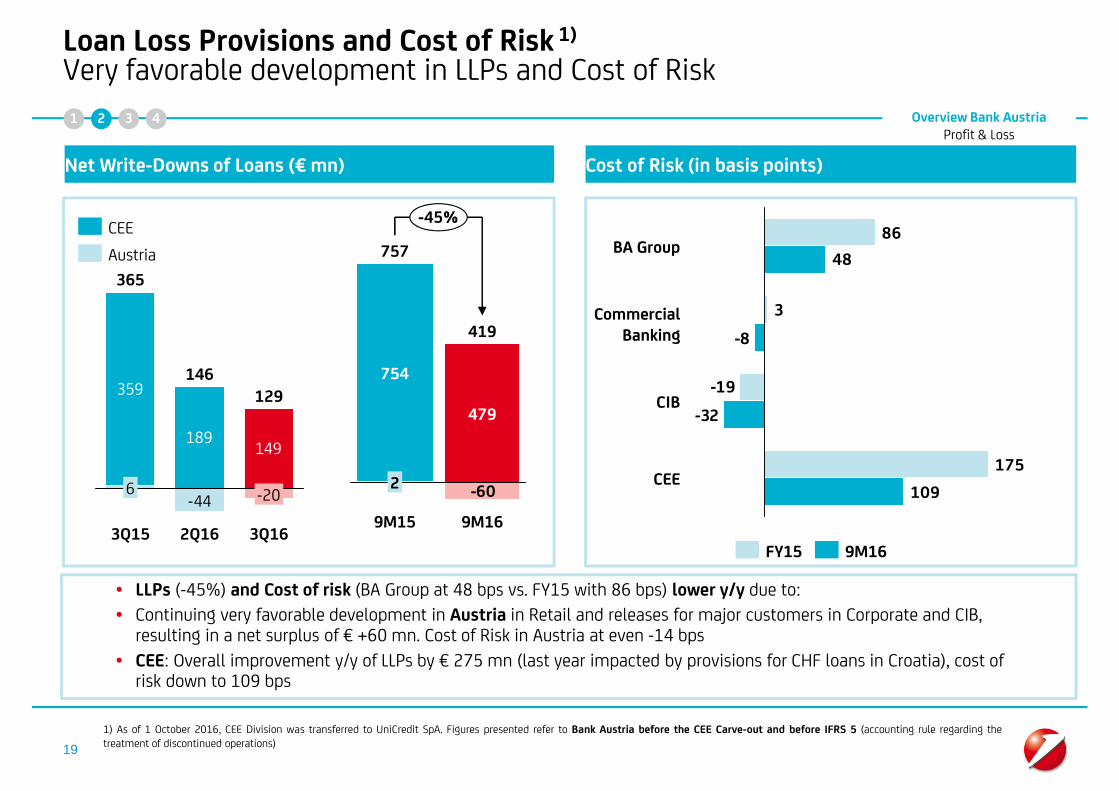
• LLPs (-45%) and Cost of risk (BA Group at 48 bps vs. FY15 with 86 bps) lower y/y due to:
• Continuing very favorable development in Austria in Retail and releases for major customers in Corporate and CIB,resulting in a net surplus of € +60 mn. Cost of Risk in Austria at even -14 bps
• CEE: Overall improvement y/y of LLPs by € 275 mn (last year impacted by provisions for CHF loans in Croatia), cost ofrisk down to 109 bps
19
Loan Loss Provisions and Cost of Risk 1)
Very favorable development in LLPs and Cost of Risk
Net Write-Downs of Loans (€ mn) Cost of Risk (in basis points)
359
189149
-44
3Q16
129
-20
2Q16
146
3Q15
365
6
Austria
CEE
-60
-45%
9M16
419
479
9M15
757
2
754
175
-19
3
86
109
-32
-8
48
CIB
CommercialBanking
CEE
BA Group
9M16FY15
1) As of 1 October 2016, CEE Division was transferred to UniCredit SpA. Figures presented refer to Bank Austria before the CEE Carve-out and before IFRS 5 (accounting rule regarding thetreatment of discontinued operations)
Overview Bank AustriaProfit & Loss
1 2 3 4

1) on-balance clients (non-banks) only
• In 3Q16 a furtherreduction of NonPerforming Exposure ledto improvements in theNPE Ratio and CoverageRatio
• In CEE, and in particularin Russia a remarkableimprovement of theCoverage Ratio wasachieved (CEE 58.4%,Russia 62.6%)
• High quality of loanportfolio in Austria;worsening of ratios onlydue to the shift of onemajor – fullycollateralized – singleloan into NPE
20
Asset QualityAsset Quality Ratios improving further in 3Q16
Net NPE 1)
(in bn €)% of Net NPE
on Total Net Loans 1) % Coverage Ratio on NPE 1)
-20%
3Q16
3.9
2Q16
4.0
3Q15
4.9
BA Group2) BA Group2)BA Group2)
Austria AustriaAustria
CEE CEECEE
3Q15
3.4%4.2%
2Q16
3.3%
-89bp
3Q16 3Q15
55.8%
2Q16
58.7%
+329bp
3Q16
59.1%
3Q16
-6%
1.2
2Q16
1.0
3Q15
1.2 2.0%
-9bp
3Q162Q16
1.7%
3Q15
2.1%
2Q16
-311bp
60.6%
3Q16
64.5%
3Q15
63.7%
3.0
2Q16
-25%
2.7
3Q163Q15
3.7
-177bp
5.0%6.4%
2Q163Q15 3Q16
4.6%56.3%
2Q16
58.4%52.3%
3Q15
+609bp
3Q16
2) As of 1 October 2016, CEE Division was transferred to UniCredit SpA. Figures presented refer to Bank Austria before the CEE Carveout.
Overview Bank AustriaProfit & Loss
1 2 3 4

Agenda
21
• UniCredit Group
• Overview Bank Austria
• Business Model & Strategy
• Profit & Loss
• Balance Sheet & Capital Ratios
• Liquidity & Funding
• Funding Strategy & Position
• Transactions
• Cover Pool
• Annex
1
2
3
4
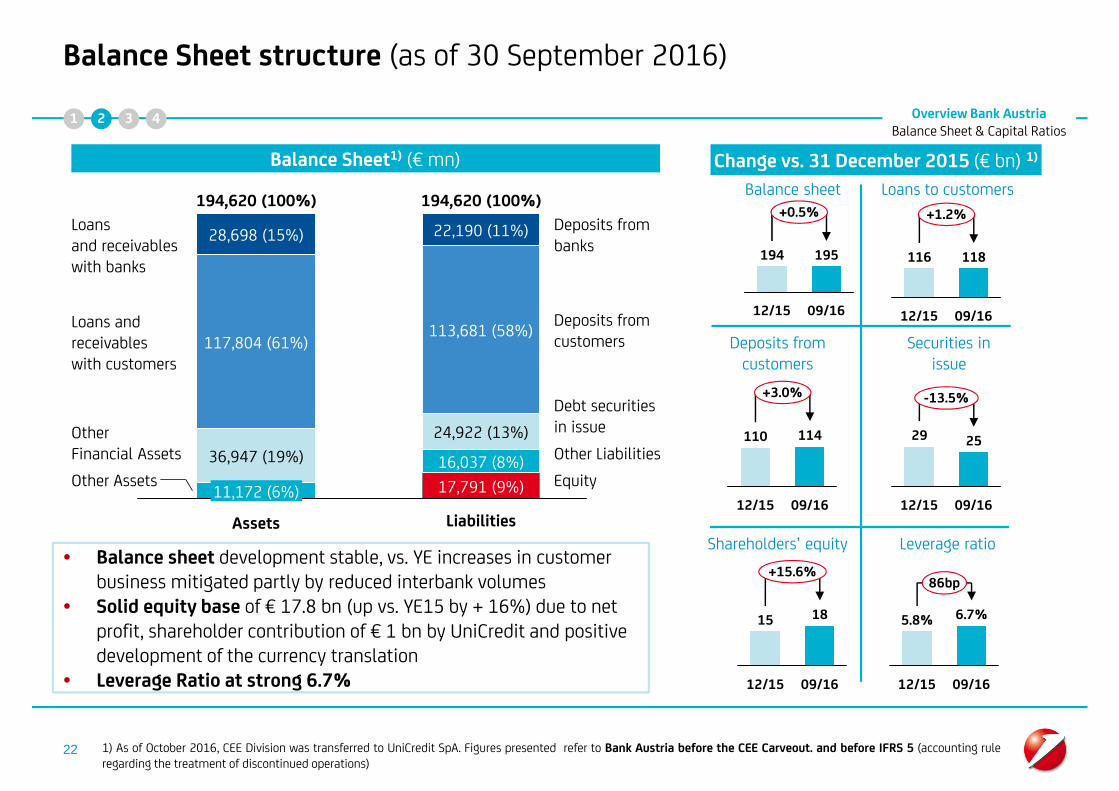
• Balance sheet development stable, vs. YE increases in customerbusiness mitigated partly by reduced interbank volumes
• Solid equity base of € 17.8 bn (up vs. YE15 by + 16%) due to netprofit, shareholder contribution of € 1 bn by UniCredit and positivedevelopment of the currency translation
• Leverage Ratio at strong 6.7%
22
Balance Sheet structure (as of 30 September 2016)
Overview Bank AustriaBalance Sheet & Capital Ratios
Balance Sheet1) (€ mn) Change vs. 31 December 2015 (€ bn) 1)
Balance sheet Loans to customers
Deposits fromcustomers
Securities inissue
Shareholders’ equity Leverage ratio
28,698 (15%)
11,172 (6%)
117,804 (61%)
36,947 (19%)
Assets
Loansand receivableswith banks
194,620 (100%)
Other Assets
OtherFinancial Assets
Loans andreceivableswith customers
Equity
Other Liabilities
Debt securitiesin issue
Deposits fromcustomers
Deposits frombanks
Liabilities
194,620 (100%)
17,791 (9%)
16,037 (8%)
24,922 (13%)
113,681 (58%)
22,190 (11%)+0.5%
09/16
195
12/15
194
+1.2%
09/16
118
12/15
116
+3.0%
09/16
114
12/15
110
-13.5%
09/16
25
12/15
29
+15.6%
09/16
18
12/15
15
86bp
09/16
6.7%
12/15
5.8%
1) As of October 2016, CEE Division was transferred to UniCredit SpA. Figures presented refer to Bank Austria before the CEE Carveout. and before IFRS 5 (accounting ruleregarding the treatment of discontinued operations)
1 2 3 4

0%
+1%
3Q16
117,804
57,935
59,868
2Q16
118,178
58,936
59,242
1Q16
117,064
59,019
58,045
4Q15
116,402
59,050
57,353
3Q15
116,530
58,438
58,092
Austria
CEE
+1%
2%
2Q16
113,006
56,013
56,993
1Q16
113,822
55,470
58,352
4Q15
110,337
54,557
55,780
3Q15
111,030
56,458
54,571
3Q16
113,681
55,756
57,925
Austria
CEE
84%82%83%83% 85%
1) All figures recast and excl. Turkey and Ukraine; figures presented refer to Bank Austria before the CEE Carveout. and before IFRS 5 (accounting rule regarding thetreatment of discontinued operations)2) Loans / (deposits + securities in issue + financial liabilities at fair value).
23
Loan and Deposit VolumesIncrease in loans and deposits y/y, very good Loans/Direct Funding Ratio
• Loans to customers y/y up 1% driven by CEE
• Deposits from customers with a growth of 2% y/y, driven by CEE countries)
• Overall excellent funding base, Loans/Direct Funding Ratio at very good 85%
Loans to Customers1) (€ mn) Deposits from Customers1) (€ mn)
Loans/Direct Funding Ratio2)
Overview Bank AustriaBalance Sheet & Capital Ratios
1 2 3 4

1) Capital ratios in accordance with Basel 3/CRR, transitional adjustments (phase-in)
24
Capital position and RWASound capital ratios1)
• Common Equity Tier 1 (CET1) ratio increased to 12.9% andTotal Capital ratio to 16.7% (both according to Basel 3 phase-in)
• Increase of regulatory capital driven by UniCredit’s shareholdercontribution of € 1bn and inclusion of 1H16 profit
• Total RWA decreased vs. YE15, driven by all RWA categoriesCET1
Tier 1
3Q16
16.7%
12.9%
12.9%
2015
14.9%
11.0%
11.0%
2014
13.4%
10.3%
10.3%
Credit risk
Operational risk
CVA charge
Market risk
3Q16
126.6
112.7
10.1
0.43.5
2015
128.3
113.2
10.7
0.44.0
2014
130.4
113.0
12.1
0.64.6
2) As of 1 October 2016, CEE Division was transferred to UniCredit SpA. Figures presented refer to Bank Austria before the CEE Carve-out.
Capital Ratios2)
Regulatory Capital2) (€bn) Risk-Weighted Assets 2) (€bn)
CET1
2015
19.1
13.5
17.5
2014
14.2
3Q16
21.1
16.3
Total Capital
Overview Bank AustriaBalance Sheet & Capital Ratios
1 2 3 4

Agenda
25
• UniCredit Group
• Overview Bank Austria
• Business Model & Strategy
• Profit & Loss
• Balance Sheet & Capital Ratios
• Liquidity & Funding
• Funding Strategy & Position
• Transactions
• Cover Pool
• Annex
1
2
3
4

Long-Term Ratings by (Moody’s/S&P/Fitch) as of 11 May 2016
*) Namensschuldverschreibungen26
Bank Austria Acts as Liquidity Reference Bank (LRB) for all Austrian GroupEntities and is a Strategic Issuing Platform for UniCredit Group
Liquidity & FundingFunding Strategy & Position
• Own Issue Programs• Presence on the local and global markets• During the liquidity crisis no state aid needed• Coordination of the global market presence through UniCredit Holding
UniCredit S.p.A. – Holding
• Bank capital
• OBG (covered bonds)
• Registered sec./Schuldschein-Darlehen(SSD)
• Senior benchmark
• Private placement
• Network issues
• Mortgage- and PublicSector Pfandbriefe
• Senior benchmark
• Registered sec. (SSD, NSV*))covered / senior
• Private placements
• Network Issues
• Certificates
• Mortgage- and Public SectorPfandbriefe
• Senior benchmark
• Housing-bank-bonds(Wohnbaubank-Anleihen)
• Registered sec. (SSD, NSV*))covered/senior
• Private placements
• Network issues
UniCredit S.p.A
(Baa1/BBB-/BBB+)
LRB Germany LRB Poland
• Network issues
• Bearer bonds
LRB AustriaLRB Italy/CEE
UniCredit Bank AG
(Baa1/BBB/A-)
Bank Pekao SA
(A2/BBB+/A-)
UniCredit Bank
Austria AG
(Baa2/BBB/BBB+)
1 2 3 4

27
Self-funding of Business Growth of Bank Austria Group
Liquidity & FundingFunding Strategy & Position
Business Growth of BA Group to be self-funded by a well-balanced mix of customer deposits and market issuances
Well-diversified funding base due to BA’s commercial banking model. Priority is on growth of local funding sources out
of customer business with a variety of products (sight, savings, term deposits) as well as medium- and long-term
placements of own issues
The self-funding strategy of Bank Austria was demonstrated by returning to the capital markets: from 2010 focus
was given to issuance of benchmark-sized Pfandbriefe and since 2013 also on Senior Unsecured Benchmarks
The strict principle of self-sufficient funding of Bank Austria
• ensures that the proceeds are used primarily for business development of entities of Bank Austria Group
• enables Bank Austria to calculate its own funding costs according to its own risk profile
1 2 3 4

28
Liquidity and Funding Management within BA Group based on clear andstrict Risk Management Principles
Liquidity & FundingFunding Strategy & Position
Clear Rules and Principles in Bank Austria for the Management of Liquidity and Funding
Liquidity strategy
• Bank Austria AG acting as an independent Liquidity Reference Bank (LRB) within UniCredit Group - in line with
the self-funding principle of the Group Strategy
• Bank Austria AG manages the liquidity development in Austria (including all Austrian Group entities)
Clear operative rules
• Active liquidity and funding management by defining short-term and structural liquidity and funding limits for
all subsidiaries of BA Group
• All national legal / regulatory constraints have to be followed on single entity level
• Bank Austria AG establishes a separate Funding and Liquidity Plan for Austria as part of the Funding and
Liquidity Plan of UniCredit Group
1 2 3 4

(1) Sum of net liquidity inflow + counterbalancing capacity(2) Assuming no roll-over of current outstanding wholesale debt(3) Calculated as ratio between liabilities (cumulative sum above one year) and assets (cumulative sum above one year)
29
BA Group-wide Liquidity Position (steered centrally by ALM BA)
Liquidity & FundingFunding Strategy & Position
• Positive primary GAP
• Cash horizon constantly above 3M, above the Group target
• Sound counterbalancing capacity increased by € 3.0 bn year
on year
• Liquidity Coverage Ratio as of 30th September 2016 at level
of 198% for BA AG and 141% for BA Group.
• Structural liquidity ratio3) well above limits.
• Internal rule of 0.90 for maturities above 1y
• Level as of September 2016: 1.09
• Structural Liquidity remains at comfortable levels despitelower FP execution due to DeLorean.
• Structural liquidity ratio point to NSFR fulfillment above100%.
• Stable development of L/D ratio
BA RLC 3 month available liquidity position 1) 2)
Structural liquidity ratio (1Y)
0
10,000
20,000
30,000
40,000
50,000
60,000
70,000
31
.12.
10
31
.03.
11
30
.06.
11
30
.09.
11
31
.12.
11
31
.03.
12
30
.06.
12
30
.09.
12
31
.12.
12
31
.03.
13
30
.06.
13
30
.09.
13
31
.12.
13
31
.03.
14
30
.06.
14
30
.09.
14
31
.12.
14
31
.03.
15
30
.06.
15
30
.09.
15
31
.12.
15
31
.03.
16
30
.06.
16
30
.09.
16
0.880.890.900.910.920.930.940.950.960.970.980.991.001.011.021.031.041.051.061.071.081.091.101.11
Nov
-10
Jan-
11
Mar
-11
May
-11
Jul-1
1
Sep-
11
Nov
-11
Jan-
12
Mar
-12
May
-12
Jul-1
2
Sep-
12
Nov
-12
Jan-
13
Mar
-13
May
-13
Jul-1
3
Sep-
13
Nov
-13
Jan-
14
Mar
-14
May
-14
Jul-1
4
Sep-
14
Nov
-14
Jan-
15
Mar
-15
May
-15
Jul-1
5
Sep-
15
Nov
-15
Jan-
16
Mar
-16
May
-16
Jul-1
6
Sep-
16
1Y Liquidity Ratio 1Y Limit
1 2 3 4

Agenda
30
• UniCredit Group
• Overview Bank Austria
• Business Model & Strategy
• Profit & Loss
• Balance Sheet & Capital Ratios
• Liquidity & Funding
• Funding Strategy & Position
• Transactions
• Cover Pool
• Annex
1
2
3
4

31
Overview of Pfandbrief Benchmark Issues 2015
Liquidity & FundingTransactions
• In February, successful issue of a 10-year Mortgage Pfandbrief Benchmark
Bank AustriaMortgage Pfandbrief
0.75% 25/02/2025 € 500 mn Feb. 2015 MS + 3bps
• In September, successful issue of a 7-year Mortgage Pfandbrief Benchmark
Bank AustriaMortgage Pfandbrief
0.75% 08/09/2022 € 500 mn Sept 2015 MS + 5bps
FranceSwitzerland
3%
Others
6%UK
3%5%
Germany
Asia
52%
6%
25%
Austria
Banks48%
4%
Insurance Companies
Funds
30%
Central Banks /Official Institutions 18%
36%4%
BeNeLux 7%
2%
Austria 35%
Germany3%5% 4%CH / Lichtenstein
OtherFranceUK / Ireland
Iberia / ItalyNordic Region
4%
Funds
32%
Banks40%
27%
Insurance CompaniesCentral Banks /
Official Institutions1%
1 2 3 4

32
Overview of Pfandbrief Benchmark Issues 2014
Liquidity & FundingTransactions
26/05/2021 € 500 mn May 2014 MS + 25bps
16/01/2020 € 500 mn Sept. 2014
1.375%
0.5% MS + 7bps
Bank AustriaPublic Sector Pfandbrief
Bank AustriaMortgage Pfandbrief
2.375% € 500 mn Jan. 2014 MS + 35bps22/01/2024
Bank AustriaMortgage Pfandbrief
1.25% €500 mn April 2014 MS + 23bps14/10/2019
Bank AustriaMortgage Pfandbrief
1 2 3 4

33
Overview of Pfandbrief Benchmark Issues prior to 2014
Liquidity & FundingTransactions
24/02/2021 € 1 bn Feb. 2011 Mid-Swap +694.125%
2.625% 25/04/2019 € 500 mn Apr 2012 Mid-Swap +88
Bank AustriaPublic Sector Pfandbrief
Bank AustriaPublic Sector Pfandbrief
Bank AustriaMortgage Pfandbrief
1.25% € 500 mn July 2013 Mid-Swap +2630/07/2018
Bank AustriaMortgage Pfandbrief /First Tap
1.25% €200 mn Sept. 2013 Mid-Swap +1030/07/2018
Bank AustriaPublic Sector Pfandbrief
1.875% € 500 mn Oct 2013 Mid-Swap +2529/10/2020
1 2 3 4

34
Overview of Senior Unsecured Benchmark Issues 2013
Liquidity & FundingTransactions
• Senior Unsecured Benchmarks (January 2013 and its first tap in May and an additional one in November 2013) weresuccessfully issued
Bank AustriaSenior Unsecured Bond
2.625% € 500 mn Jan. 2013 Mid-Swap +16330/01/2018
Bank AustriaSenior Unsecured Bond
2.625% € 250 mn May 2013 Mid-Swap +10530/01/2018
Bank AustriaSenior Unsecured Bond
2.5% € 500 mn Nov. 2013 Mid-Swap +13527/05/2019
• Overview of Investors
54% FundsBanks
31%
6%
Insurances8%
OtherOther
10%
Italy
3%Nordics
6%
UK
12%
Switzerland5%
Netherlands 11%
France
23%
Germany
17%Austria
13%
1 2 3 4

Agenda
35
• UniCredit Group
• Overview Bank Austria
• Business Model & Strategy
• Profit & Loss
• Balance Sheet & Capital Ratios
• Liquidity & Funding
• Funding Strategy & Position
• Transactions
• Cover Pool
• Annex
1
2
3
4

36
Executive Summary Bank AustriaPublic Sector Cover Pool
Liquidity & FundingCover Pool
Aaa Rating by Moody‘s
ECBC Covered Bond Label has been granted to the Public Sector Cover
Pool of Bank Austria
Cover Pool Volume as of 30 September 2016 amounts to EUR 6,850 mn
Average volume of loans is approx. € 1.84 mn
Average seasoning is 6.15 years
1 2 3 4

Parameters of Issues:
Total Number 36
Average Maturity (in years) 4,0
Average Volume (in EUR) 126.518.211
Parameters of Cover Pool
Weighted Average Life (in years incl. Amortization) 6,2
Contracted Weighted Average Life (in years) 8,5
Average Seasoning (in years) 6,4
Total Number of Loans 3.718
Total Number of Debtors 1.413
Total Number of Guarantors 279
Average Volume of Loans (in EUR) 1.842.394
Stake of 10 Biggest Loans 30,5%
Stake of 10 Biggest Guarantors 30,9%
Stake of Bullet Loans 60,9%
Stake of Fixed Interest Loans 35,5%
Amount of Loans 90 Days Overdue 0
Average Interest Rate 1,4%
37
Public SectorParameters of Cover Pool and Issues
Liquidity & FundingCover Pool Total Value of the Cover Pool as of 30 September 2016 in EUR equivalent: 6,850 mn
• thereof in EUR: 3,622 mn• thereof in CHF: 1,531 mn• thereof public sector bonds in EUR equivalent: 1,697 mn
Moody’s Rating: Aaa Nominal / Present Value Over-Collateralization*): 50.4% / 42.4% Total Value of Sold Covered Bonds as of 30 September 2016 in EUR: 4,555 mn
*) Austrian Mortgage Banking Act requires a nominal over-collateralisation of 2%. The basis for its calculation is a cover pool value reduced by legally defined haircuts. Taking these haircuts intoconsideration, the cover pool value amounts to EUR 6,510 mn, thus the overcollateralization is 42.9%.Additionally, in its Articles of Association, UniCredit Bank Austria commits itself to an over-collateralisation on a present value basis.
1 2 3 4

Maturity of Assets in the Cover Pool in mn EUR in %
Maturity up to 12 months 1.470 21,5%
Maturity 12 - 60 months 1.605 23,4%
thereof Maturity 12 - 36 months 1.011 14,8%
thereof Maturity 36 - 60 months 594 8,7%
Maturity 60 - 120 months 965 14,1%
Maturity longer than 120 months 2.810 41,0%
Total 6.850 100,0%
Maturity of Issued Covered Bonds in mn EUR in %
Maturity up to 12 months 560 12,3%
Maturity 12 - 60 months 3.585 78,7%
thereof Maturity 12 - 36 months 1.585 34,8%
thereof Maturity 36 - 60 months 2.000 43,9%
Maturity 60 - 120 months 127 2,8%
Maturity longer than 120 months 283 6,2%
Total 4.555 100,0%
38
Public SectorMaturity Structure of Cover Pool and Issues
Liquidity & FundingCover Pool
1 2 3 4

39
Public SectorRegional Breakdown of Assets*) in Austria
Liquidity & FundingCover Pool
*) Considering Guarantors
1 2 3 4

Assets: Type of Debtor / Guarantor in mn EUR Number
State 539 5
Federal States 2.305 52
Municipalities 964 2.131
Guaranteed by State 440 158
Guaranteed by Federal States 1.499 247
Guaranteed by Municipalities 606 442
Other 497 683
Total 6.850 3.718
40
Public SectorAssets Volume Breakdown by Type of Debtor / Guarantor
Liquidity & FundingCover Pool
1 2 3 4

Volume Breakdown by Size of Assets in mn EUR Number
below 300,000 249 2.266
thereof under 100,000 54 1.192
thereof 100,000 - 300,000 195 1.074
300,000 - 5,000,000 1.392 1.312
thereof 300,000 - 500,000 162 420
thereof 500,000 - 1,000,000 299 422
thereof 1,000,000 - 5,000,000 931 470
above 5,000,000 5.209 140
Total 6.850 3.718
41
Public SectorVolume Breakdown by Size of Assets
Liquidity & FundingCover Pool
1 2 3 4

42
Executive SummaryBank Austria Mortgage Cover Pool
Liquidity & FundingCover Pool
Aaa Rating by Moody‘s
Bank Austria decided to streamline its Mortgage Cover Pool targeting a simpleand transparent pool composition:
• focus on Austrian mortgages only
• change to whole loan reporting instead of collateral volume
Benefit:
• pure Austrian risk offer to our investor base
• no blending of risk, diversification to be decided by investor
• simple pricing logic
ECBC Covered Bond Label has been granted to the BA Mortgage Cover Pool
1 2 3 4

43
Bank Austria’s Whole Loan ApproachWhole Loan Approach and its Benefits for Investors
Liquidity & FundingCover Pool
According to the Austrian Mortgage Banking Act (HypBG), the maximum coverage volume of ”Beleihungswert” is 60%(maximum current outstanding of the loan)
Scenario II = Approach of Bank Austria = Whole Loan Approach
Loan Volume
&
Value to cover issuedPfandbriefe
Scenario I: Split Loan Approach = Minimum Approach
Loan Volumesplit
Value of Mortgage
&
€ 100 € 100 = €60 + €40 € 60
€ 100 € 100 € 100
For optimization of its collateralvalue loans are split into 2 parts:1. included in cover pool and2. not included in cover pool
The whole loan – and not only itslegally assigned value – isincluded in the cover pool tocollateralize BA‘s issued MortgagePfandbriefe.Thus, investors benefit fromcollateralization above legalrequirement in BA‘s cover pool.
€60 = MaximumPfandbrief volume issuedaccording to HypBG
€40 = Additional Poolvolume
Value ofMortgage
Not inCoverPool
Loan inCoverPool
Value to cover issuedPfandbriefe
Loan inCoverPool
€60 = Maximum Pfandbriefvolume issued according toHypBG
1 2 3 4

44
CHF Loans in mortgage Cover Poolare 100% private residential financing
Liquidity & FundingCover Pool The over-collateralization is approx. EUR 5.7 bn or 117% (as of 30th September 2016)
Covering of CHF risk in Cover Pool
• FX-risks are explicitly considered in the rating process of Moody´s andare reflected as part of their over-collateralization requirement
• Moody´s currently requires an OC of 28.0%
Internal Risk Management of Bank Austria
• According to the Cover Pool Regulation of Bank Austria NPLs are removed regularly (monthly).
• Less than 1% of the loans (175 of 26,000) were taken out in 2014 for this reason
• Special safety buffers are designated for CHF Loans
• The credit rating of FX-Loans is subject to additional and stricter standards andwill - as always - be evaluated regularly
• For CHF Loans an additional FX-buffer of 25% on the credit volume is considered,which must be covered by the credit rating of the client
No new CHF mortgage loans, therefore no inflows into Cover Pool since 2010
Overview 30.09.2016
Issue volume EUR 4.9 bn
Over-collateralization EUR 5.7 bn 31.12.2014 30.09.2016Total Asset Value EUR 10.5 bn o/w CHF EUR 1.6 bn EUR 1.5 bn (14.6% of total asset value)Total Cover Value EUR 7.1 bn o/w CHF EUR 670 mln EUR 555 mln (7.8% of cover value / HypBG)
(117%)
Changes due toCHF revaluation
1 2 3 4

Parameters of Issues:
Total Number 99
Average Maturity (in years) 5,1
Average Volume (in EUR) 49.121.898
Parameters of Cover Pool
Weighted Average Life (in years incl. Amortization) 9,2
Contracted Weighted Average Life (in years) 13,9
Average Seasoning (in years) 6,0
Total Number of Loans 30.954
Total Number of Debtors 29.110
Total Number of Mortgages 30.954
Average Volume of Loans (in EUR) 336.216
Stake of 10 Biggest Loans 14,8%
Stake of 10 Biggest Debtors 17,2%
Stake of Bullet Loans 36,5%
Stake of Fixed Interest Loans 15,6%
Amount of Loans 90 Days Overdue 0
Average Interest Rate 1,3%
45
Mortgage Cover PoolParameters of the Cover Pool and Issues
Liquidity & FundingCover Pool Total Value of the Cover Pool as of 30 September 2016 in EUR equivalent: 10,536 mn
• thereof in EUR: 8,885 mn• thereof in CHF: 1,523 mn• thereof substitute cover in EUR: 129 mn
Moody’s Rating: Aaa Nominal / Present Value Over-Collateralisation*): 116.7% / 124.9% Total Value of Issued Mortgage Pfandbriefe as of 30 September 2016 in EUR: 4,863 mn Total Value of Sold Mortgage Pfandbriefe as of 30 September 2016 in EUR: 4,263 mn
*) Austrian Mortgage Banking Act requires a nominal over-collateralization of 2%. The basis for its calculation is a cover pool value reduced by legally defined haircuts. Taking these haircuts intoconsideration, the cover pool value amounts to EUR 7,143 mn, thus the overcollateralization is 46.9%. Additionally, in its Articles of Association, UniCredit Bank Austria commits itself to an over-collateralization on a present value basis.
1 2 3 4

Maturity of Assets in the Cover Pool in mn EUR in %
Maturity up to 12 months 303 2,9%
Maturity 12 - 60 months 1.570 14,9%
thereof Maturity 12 - 36 months 761 7,2%
thereof Maturity 36 - 60 months 809 7,7%
Maturity 60 - 120 months 2.295 21,8%
Maturity longer than 120 months 6.367 60,4%
Total 10.536 100,0%
Maturity of Issued Covered Bonds in mn EUR in %
Maturity up to 12 months 131 2,7%
Maturity 12 - 60 months 2.638 54,3%
thereof Maturity 12 - 36 months 1.002 20,6%
thereof Maturity 36 - 60 months 1.636 33,6%
Maturity 60 - 120 months 1.738 35,7%
Maturity longer than 120 months 355 7,3%
Total 4.863 100,0%
46
Mortgage Cover PoolMaturity Structure of Cover Pool and Issues
Liquidity & FundingCover Pool
1 2 3 4

Volume Breakdown by Size of Loans in mn EUR Number
below 300,000 3.420 25.867
thereof under 100,000 613 10.697
thereof 100,000 - 300,000 2.807 15.170
300,000 - 5,000,000 2.956 3.766
thereof 300,000 - 500,000 891 2.290
thereof 500,000 - 1,000,000 553 769
thereof 1,000,000 - 5,000,000 1.512 707
above 5,000,000 4.160 181
Total 10.536 29.814
47
Mortgage Cover PoolAssets Volume Breakdown
Liquidity & FundingCover Pool
1 2 3 4

48
Mortgage Cover PoolRegional Breakdown *) of Mortgages in Austria
Liquidity & FundingCover Pool
1 2 3 4

Mortgages Breakdown by Type of Use in mn EUR Number
Residential 4.382 27.029
Residential subsidized 1.653 1.923
Residential used for business purposes 665 1.157
Commercial 3.707 845
thereof Office 1.621 139
thereof Trade 996 72
thereof Tourism 213 117
thereof Agriculture 25 113
thereof mixed Use / Others 852 404
Total 10.407 30.954
49
Mortgage Cover PoolBreakdown*) by Type of Use
Liquidity & FundingCover Pool
*) Without substitute cover (consists of bonds)
1 2 3 4

50
Mortgage Cover PoolBreakdown*) by Type of Use
Liquidity & FundingCover Pool
Bank Austria’s Mortgage Cover Pool Value accounts for € 10,407 mn as of 30 September2016(without substitute cover)
All mortgages in cover pool are located in Austria
• The main concentration is in the City of Vienna 43.9% and the state of Lower Austria23.7%
Breakdown of cover pool by type of use:
• 64.4% residential real estate (thereof 15.9% subsidized)
• 35.6% commercial real estate, divides as follows:
• Office 15.7%
• Trade 9.6%
• Tourism 2.1%
• Other / Mixed use 8.2%
*) all percent Values are respective cover pool value without substitute cover
1 2 3 4

Agenda
51
• UniCredit Group
• Overview Bank Austria
• Business Model & Strategy
• Profit & Loss
• Balance Sheet & Capital Ratios
• Liquidity & Funding
• Funding Strategy & Position
• Transactions
• Cover Pool
• Annex
• Real Estate Market Austria
• Legal Situation – Austrian Covered Bonds
1
2
3
4

52
Austrian Real Estate MarketOverview
AnnexReal Estate Market Austria
• The Austrian real estate market has the well-earned reputation as a relatively stable market. IPD/MSCI
annually analyses an Austrian portfolio consisting of office, retail, residential, logistics and other properties. In
2015 as a whole, the total return of this portfolio amounted to 5.9%. Over the last ten years annual average
total return was calculated as 5.7% and even in the crisis years 2008/2009 total return amounted to around
4%
• In 2015 investment in commercial real estate in Austria reached a new record volume of up to EUR 3.8bn
depending on the source. With ultra-low or even negative interest rates demand for real estate will stay
strong, although it is somewhat hampered by scarce supply of core property and high prices
• Residential real estate prices in Vienna have risen considerably over the last ten years. Nevertheless, price
increases slowed down last year, while prices in the rest of Austria accelerated
1 2 3 4

53
Austrian Real Estate MarketPrices for residential real estate
• The strong increase of real estate prices in Vienna has moderated considerably over the last quarters
• Prices in Austria excl. Vienna, which showed a more moderate development over the last ten years, recently
accelerated
0
50
100
150
200
250
2000 2001 2002 2003 2004 2005 2006 2007 2008 2009 2010 2011 2012 2013 2014 2015
Residential propertyPrice index 2000 = 100
Vienna Austria without Vienna
Source: OeNB, TU Wien, Institut für Stadt- und Regionalforschung
AnnexReal Estate Market Austria
1 2 3 4

54
Austrian Real Estate MarketIPD
Source: IPD/MSCI
• Austria’s real estate market scores through relatively high stability, which is confirmed by calculations done
by IPD/MSCI.
-2.0
-1.0
0.0
1.0
2.0
3.0
4.0
5.0
6.0
7.0
8.0
2005 2006 2007 2008 2009 2010 2011 2012 2013 2014 2015
IPD - Total Return of Austrian Porfolio
Income return Capital growth Total return
AnnexReal Estate Market Austria
1 2 3 4

Agenda
55
• UniCredit Group
• Overview Bank Austria
• Business Model & Strategy
• Profit & Loss
• Balance Sheet & Capital Ratios
• Liquidity & Funding
• Funding Strategy & Position
• Transactions
• Cover Pool
• Annex
• Real Estate Market Austria
• Legal Situation – Austrian Covered Bonds
1
2
3
4

56
Austrian Legal FrameworkMortgage and Public Sector Pfandbriefe
AnnexLegal situation – Austrian covered bonds
Austrian Covered Bonds
Pfandbriefe
Pfandbriefgesetz(Pfandbrief Law 1938)
Hypothekenbankgesetz(Mortgage Banking Act 1899)
FundierteSchuldverschreibungen
Law of 1905
Bank Austria
Remark:Austrian ‘Mortgage Pfandbriefe‘ also follow the same legal regulation as ‘Public Sector Pfandbriefe‘
1 2 3 4
57
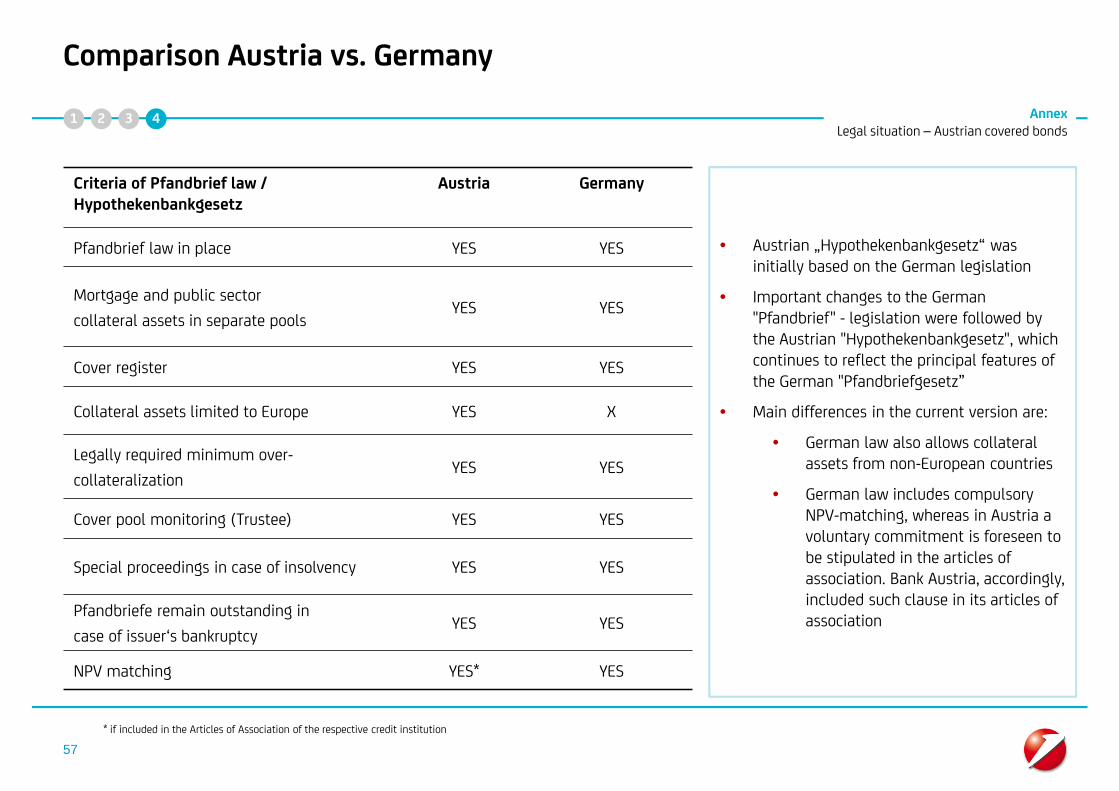
Comparison Austria vs. Germany
• Austrian „Hypothekenbankgesetz“ wasinitially based on the German legislation
• Important changes to the German"Pfandbrief" - legislation were followed bythe Austrian "Hypothekenbankgesetz", whichcontinues to reflect the principal features ofthe German "Pfandbriefgesetz”
• Main differences in the current version are:
• German law also allows collateralassets from non-European countries
• German law includes compulsoryNPV-matching, whereas in Austria avoluntary commitment is foreseen tobe stipulated in the articles ofassociation. Bank Austria, accordingly,included such clause in its articles ofassociation
* if included in the Articles of Association of the respective credit institution
Criteria of Pfandbrief law /Hypothekenbankgesetz
Austria Germany
Pfandbrief law in place YES YES
Mortgage and public sector
collateral assets in separate poolsYES YES
Cover register YES YES
Collateral assets limited to Europe YES X
Legally required minimum over-
collateralizationYES YES
Cover pool monitoring (Trustee) YES YES
Special proceedings in case of insolvency YES YES
Pfandbriefe remain outstanding in
case of issuer‘s bankruptcyYES YES
NPV matching YES* YES
AnnexLegal situation – Austrian covered bonds
1 2 3 4

Your Contacts
58
CFO FinanceUniCredit Bank Austria AG
Martin KlauzerHead of FinanceTel. +43 (0) 50505 [email protected]
Thomas Ruzek
Head of Strategic Funding
Tel. +43 (0) 50505 82560
Gabriele WiebogenHead of Long Term FundingTel. +43 (0) 50505 [email protected]
Werner Leitner
Head of Cover Pool Management
Tel. +43 (0) 50505 82647
CFO Planning & Controlling Austria
UniCredit Bank Austria AG
Günther StromengerHead of Corporate RelationsTel. +43 (0) 50505 [email protected]
Impressum
UniCredit Bank Austria AGCFO FinanceA-1010 Vienna, Schottengasse 6-8
Disclaimer
59
This publication is presented to you by:UniCredit Bank Austria AGJulius Tandler-Platz 3A-1090 Wien
The information in this publication is based on carefully selected sources believed to be reliable. However we do not make any representation as to its accuracy or completeness. Any opinions herein reflect our judgement at the date hereof and are subject to changewithout notice. Any investments presented in this report may be unsuitable for the investor depending on his or her specific investment objectives and financial position. Any reports provided herein are provided for general information purposes only and cannotsubstitute the obtaining of independent financial advice. Private investors should obtain the advice of their banker/broker about any investments concerned prior to making them. Nothing in this publication is intended to create contractual obligations. Corporate &Investment Banking of UniCredit Group consists of UniCredit Bank AG, Munich, UniCredit Bank Austria AG, Vienna, UniCredit S.p.A., Rome and other members of the UniCredit Group. UniCredit Bank AG is regulated by the German Financial Supervisory Authority (BaFin),UniCredit Bank Austria AG is regulated by the Austrian Financial Market Authority (FMA) and UniCredit S.p.A. is regulated by both the Banca d'Italia and the Commissione Nazionale per le Società e la Borsa (CONSOB).
Note to UK Residents:In the United Kingdom, this publication is being communicated on a confidential basis only to clients of Corporate & Investment Banking of UniCredit Goup (acting through UniCredit Bank AG, London Branch) who (i) have professional experience in matters relating toinvestments being investment professionals as defined in Article 19(5) of the Financial Services and Markets Act 2000 (Financial Promotion) Order 2005 (“FPO”); and/or (ii) are falling within Article 49(2) (a) – (d) (“high net worth companies, unincorporatedassociations etc.”) of the FPO (or, to the extent that this publication relates to an unregulated collective scheme, to professional investors as defined in Article 14(5) of the Financial Services and Markets Act 2000 (Promotion of Collective Investment Schemes)(Exemptions) Order 2001 and/or (iii) to whom it may be lawful to communicate it, other than private investors (all such persons being referred to as “Relevant Persons”). This publication is only directed at Relevant Persons and any investment or investment activityto which this publication relates is only available to Relevant Persons or will be engaged in only with Relevant Persons. Solicitations resulting from this publication will only be responded to if the person concerned is a Relevant Person. Other persons should not relyor act upon this publication or any of its contents.The information provided herein (including any report set out herein) does not constitute a solicitation to buy or an offer to sell any securities. The information in this publication is based on carefully selected sources believed to be reliable but we do not make anyrepresentation as to its accuracy or completeness. Any opinions herein reflect our judgement at the date hereof and are subject to change without notice.We and/or any other entity of Corporate & Investment Banking of UniCredit Group may from time to time with respect to securities mentioned in this publication (i) take a long or short position and buy or sell such securities; (ii) act as investment bankers and/orcommercial bankers for issuers of such securities; (iii) be represented on the board of any issuers of such securities; (iv) engage in “market making” of such securities; (v) have a consulting relationship with any issuer. Any investments discussed or recommended inany report provided herein may be unsuitable for investors depending on their specific investment objectives and financial position. Any information provided herein is provided for general information purposes only and cannot substitute the obtaining ofindependent financial advice.UniCredit Bank AG, London Branch is regulated by the Financial Services Authority for the conduct of business in the UK as well as by BaFIN, Germany.Notwithstanding the above, if this publication relates to securities subject to the Prospectus Directive (2005) it is sent to you on the basis that you are a Qualified Investor for the purposes of the directive or any relevant implementing legislation of a EuropeanEconomic Area (“EEA”) Member State which has implemented the Prospectus Directive and it must not be given to any person who is not a Qualified Investor. By being in receipt of this publication you undertake that you will only offer or sell the securities describedin this publication in circumstances which do not require the production of a prospectus under Article 3 of the Prospectus Directive or any relevant implementing legislation of an EEA Member State which has implemented the Prospectus Directive.
Note to US Residents:The information provided herein or contained in any report provided herein is intended solely for institutional clients of Corporate & Investment Banking of UniCredit Group acting through UniCredit Bank AG, New York Branch and UniCredit Capital Markets, Inc.(together “UniCredit”) in the United States, and may not be used or relied upon by any other person for any purpose. It does not constitute a solicitation to buy or an offer to sell any securities under the Securities Act of 1933, as amended, or under any other USfederal or state securities laws, rules or regulations. Investments in securities discussed herein may be unsuitable for investors, depending on their specific investment objectives, risk tolerance and financial position.In jurisdictions where UniCredit is not registered or licensed to trade in securities, commodities or other financial products, any transaction may be effected only in accordance with applicable laws and legislation, which may vary from jurisdiction to jurisdiction andmay require that a transaction be made in accordance with applicable exemptions from registration or licensing requirements.All information contained herein is based on carefully selected sources believed to be reliable, but UniCredit makes no representations as to its accuracy or completeness. Any opinions contained herein reflect UniCredit's judgement as of the original date ofpublication, without regard to the date on which you may receive such information, and are subject to change without notice.UniCredit may have issued other reports that are inconsistent with, and reach different conclusions from, the information presented in any report provided herein. Those reports reflect the different assumptions, views and analytical methods of the analysts whoprepared them. Past performance should not be taken as an indication or guarantee of further performance, and no representation or warranty, express or implied, is made regarding future performance.UniCredit and/or any other entity of Corporate & Investment Banking of UniCredit Group may from time to time, with respect to any securities discussed herein: (i) take a long or short position and buy or sell such securities; (ii) act as investment and/or commercialbankers for issuers of such securities; (iii) be represented on the board of such issuers; (iv) engage in “market-making” of such securities; and (v) act as a paid consultant or adviser to any issuer.The information contained in any report provided herein may include forward-looking statements within the meaning of US federal securities laws that are subject to risks and uncertainties. Factors that could cause a company's actual results and financial conditionto differ from its expectations include, without limitation: Political uncertainty, changes in economic conditions that adversely affect the level of demand for the company‘s products or services, changes in foreign exchange markets, changes in international anddomestic financial markets, competitive environments and other factors relating to the foregoing. All forward-looking statements contained in this report are qualified in their entirety by this cautionary statement.
This product is offered by UniCredit Bank Austria AG who is solely responsible for the Product and its performance and/or effectiveness. UEFA and its affiliates, member associations and sponsors (excluding UniCredit and UniCredit Bank Austria AG) do not endorse,approve or recommend the Product and accept no liability or responsibility whatsoever in relation thereto.
UniCredit Bank Austria AG, Viennaas of 20 January 2017