17 public finance - dst.dk · public finance statistical yearbook 2012 ... 12 16 20 24 28 32 ......
TRANSCRIPT

Public finance
Statistical Yearbook 2012
Public finance
Public sector
Composition of the public sector
The public sector comprises the general government sector and public enterprises
and public quasi corporations (corporate sector).
The general government sector produces non-market services that are primarily
funded through taxes. These services are wholly or partially available to private
households and enterprises (e.g. day-care institutions, education and hospitals).
The corporate sector is composed of institutions that are run commercially. The
difference between public enterprises and public quasi corporations is that public
quasi corporations are part of the public system of accounting whose accounts are
integrated into state or regional accounts (e.g. municipal utility enterprises), while
public corporations are organised as a company or similar according to civil law
and are owned or controlled by public authorities (e.g. DONG Energy A/S and the
Danish National Railways). This implies that the quasi corporations are 100 per
cent controlled by the general government sector, while the public enterprises are
controlled to a lesser extent.
In the following, a number of designations are used in describing the public area. It
will be explicitly stated if the description also comprises the public corporate sec-
tor. Otherwise, figures only relate to the general government sector.
Figure 1 General government sector by areas
Public sector
General government sector
Corporate sector
Central government
sector
Police
Queen Margrethe II
Defence
Danish Parliament
Motorways
Further education
Social security funds
Unemployment insu-
rance funds
Danish Employees'
Guarantee Fund
Municipal sector
Basic school
Home help
Child day-care
Town halls
Local roads
Rehabilitation
Local government
sector
Hospitals
Quasi public
corporations
Statens Serum Institut
Danish FSA
The Danish Civil Avia-
tion Administration
National IT and Telecom
Agency
Public corporations
Danmarks Radio
Danske Spil A/S
DONG Energy A/S
TV2
Post Danmark A/S
Danish National Rail-
ways
1
Microsoft Word − 17 Public finance.doc (X:100.0%, Y:100.0%) Created by Grafikhuset Publi PDF.
Public finance
Statistical Yearbook 2012
The structural reform of Danish municipalities 2007
The structural reform of Danish municipalities came into force on 1 January 2007
and gave rise to major changes in the public sector. The reform consists of three
main elements: A new municipal map of Denmark, a new distribution of tasks and
a reform of financing and monetary equalization.
The changes in the municipal structure implied that the number of municipalities
was reduced from 271 to 98. In addition to this, the counties were abolished and 5
regions were established.
There was at the same time a change in the distribution of tasks between the cen-
tral government, region and local government. For example, the responsibility of
most tasks related to nature and the environment was transferred from the coun-
ties to the municipalities, while the general government sector became responsible
for, among other tasks, further education, which was transferred from the coun-
ties.
Similarly, the redistribution of tasks among the sectors has resulted in an adjust-
ment of the municipal system of monetary equalization reflecting the distribution
of the new tasks. Hospitals are to be co-funded by the municipalities.
Developments in the public sector
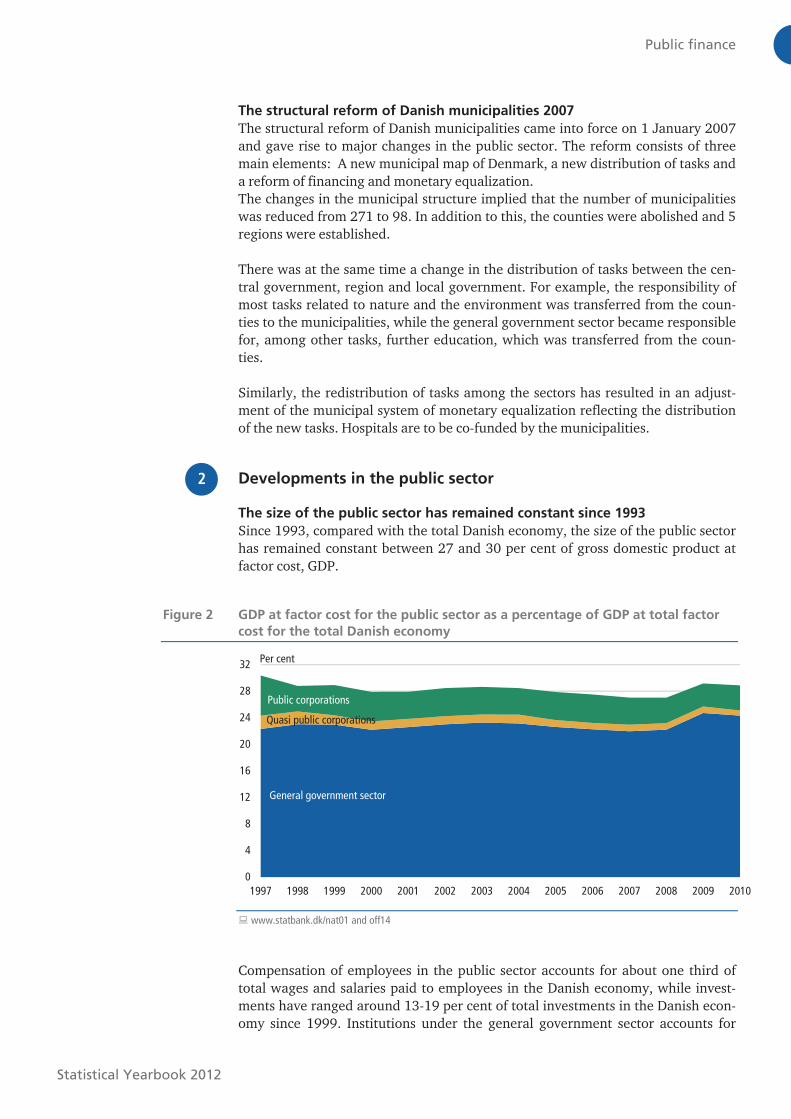
The size of the public sector has remained constant since 1993
Since 1993, compared with the total Danish economy, the size of the public sector
has remained constant between 27 and 30 per cent of gross domestic product at
factor cost, GDP.
Figure 2 GDP at factor cost for the public sector as a percentage of GDP at total factor
cost for the total Danish economy
0
4
8
12
16
20
24
28
32
1997 1998 1999 2000 2001 2002 2003 2004 2005 2006 2007 2008 2009 2010
Per cent
General government sector
Quasi public corporations
Public corporations
� www.statbank.dk/nat01 and off14
Compensation of employees in the public sector accounts for about one third of
total wages and salaries paid to employees in the Danish economy, while invest-
ments have ranged around 13-19 per cent of total investments in the Danish econ-
omy since 1999. Institutions under the general government sector accounts for
2
Microsoft Word − 17 Public finance.doc (X:100.0%, Y:100.0%) Created by Grafikhuset Publi PDF.

Public finance
Statistical Yearbook 2012
about 90 per cent of expenditure on wages and salaries, while they since 2006 has
accounted for about 2/3 of investments. Previously, investments have been more
evenly distributed between market units and the general government sector.
In recent years a number of privatisations within the public corporate sector have
been implemented. This has reduced the size of the public sector.
TDC A/S is an example of a company that has shifted status from public corpora-
tion to private enterprise, and consequently the company is no longer part of the
public sector.
One sixth of the public sector’s GDP were created by private corporations
16 per cent of the public sector’s GDP at factor costs were created by public corpo-
rations in 2010, but only 9 per cent of total wage and salary costs were paid by the
public corporations. At the same time, the public corporations account for 36 per
cent of total gross capital formation of the public sector.
Figure 3 The public sector divided into general gov. sector and public enterprises. 2010
General government sector
Public sector enterprises
GDP at factor cost Compensation of employees Gross capital formation
� www.statbank.dk/off14
Deficit on public finances since 2009
The years since 2009 have shown a deficit on public finances. In the 10 years pre-
viously between 1999 and 2008, there had been a surplus on public finances, ex-
cept for a small deficit in 2003
The years between 1975 and 1998 were primarily influenced by a deficit on public
finances, except for the period between 1986 and 1987 which saw a short period
of economic recovery.
Changes in the economic business cycle have a significant influence on public fi-
nances. Periods of economic recovery reduce the costs of unemployment benefits
and simultaneously increase revenue from taxes and duties. The opposite applies
in periods of recession.
Public net worth turned to net debt in 2011
A surplus or a deficit on public finances impacts the public debt. The size of net
debt is significant to the future economic development by having an impact on the
fiscal-policy scope in the future.
In 2011 the public net worth was turned to a net debt of 3.5 per cent of GDP
In the years between 1995, when the statistics of public net debt was introduced,
and 2006, the general government sector had a net debt that peaked in 1998 at
Figure 4
Public sector surplus
(net lending) as a per-
centage of GDP
-12
-10
-8
-6
-4
-2
0
2
4
6
76 81 86 91 96 01 06 11
Per cent
� www.statbank.dk/nat01 and off3
Microsoft Word − 17 Public finance.doc (X:100.0%, Y:100.0%) Created by Grafikhuset Publi PDF.
Public finance
Statistical Yearbook 2012
35.1 per cent of GDP. Public net debt was then declining until 2007, where it
turned to a net worth, which further increased until 2008 where it peaked at 6.1
per cent of GDP. Public net worth has then been declining, leading to public net
worth again was turned to net debt in 2011.
General government sector, public expenditure
Public expenditure stable since 2009
The size of the general government sector is decided politically and depends on
economic and social structure conditions. The expansion of, e.g. education, social
conditions and hospitals in the 1970s gave rise to a sharp growth of the public sec-
tor. Furthermore, women’s participation in the labour market resulted in an in-
creasing demand for child care.
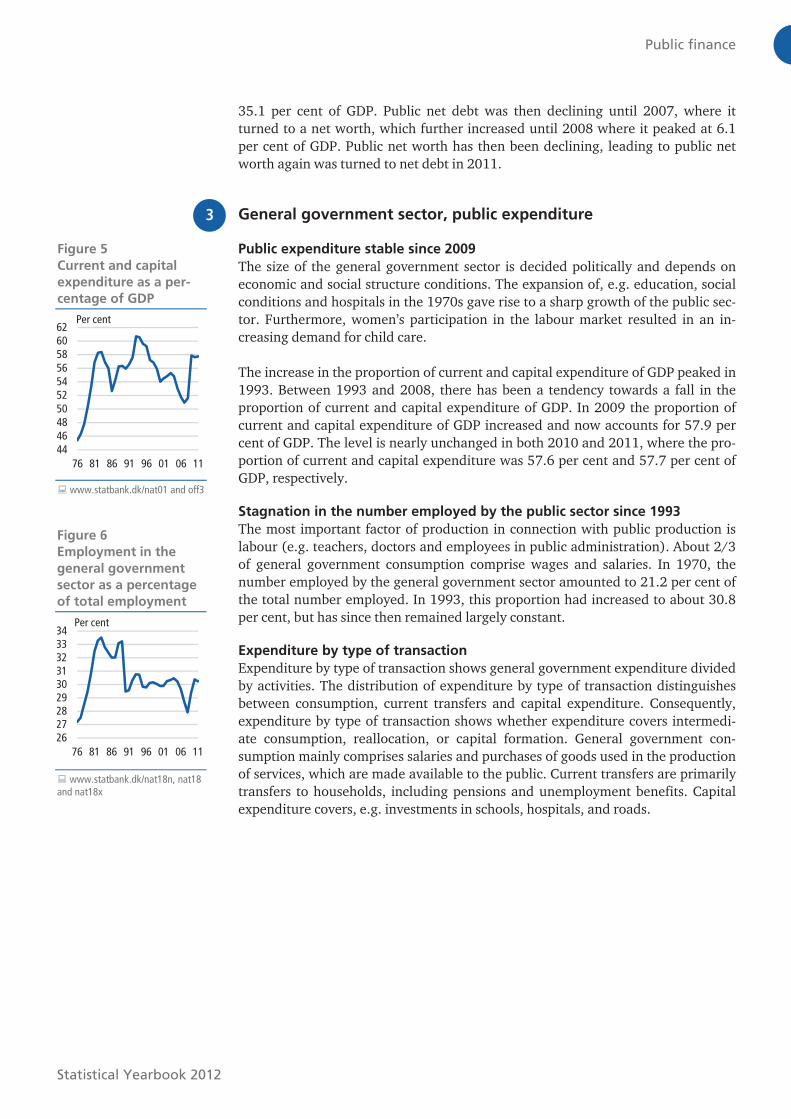
The increase in the proportion of current and capital expenditure of GDP peaked in
1993. Between 1993 and 2008, there has been a tendency towards a fall in the
proportion of current and capital expenditure of GDP. In 2009 the proportion of
current and capital expenditure of GDP increased and now accounts for 57.9 per
cent of GDP. The level is nearly unchanged in both 2010 and 2011, where the pro-
portion of current and capital expenditure was 57.6 per cent and 57.7 per cent of
GDP, respectively.
Stagnation in the number employed by the public sector since 1993
The most important factor of production in connection with public production is
labour (e.g. teachers, doctors and employees in public administration). About 2/3
of general government consumption comprise wages and salaries. In 1970, the
number employed by the general government sector amounted to 21.2 per cent of
the total number employed. In 1993, this proportion had increased to about 30.8
per cent, but has since then remained largely constant.
Expenditure by type of transaction
Expenditure by type of transaction shows general government expenditure divided
by activities. The distribution of expenditure by type of transaction distinguishes
between consumption, current transfers and capital expenditure. Consequently,
expenditure by type of transaction shows whether expenditure covers intermedi-
ate consumption, reallocation, or capital formation. General government con-
sumption mainly comprises salaries and purchases of goods used in the production
of services, which are made available to the public. Current transfers are primarily
transfers to households, including pensions and unemployment benefits. Capital
expenditure covers, e.g. investments in schools, hospitals, and roads.
Figure 5
Current and capital
expenditure as a per-
centage of GDP
44464850525456586062
76 81 86 91 96 01 06 11
Per cent
� www.statbank.dk/nat01 and off3
Figure 6
Employment in the
general government
sector as a percentage
of total employment
262728293031323334
76 81 86 91 96 01 06 11
Per cent
� www.statbank.dk/nat18n, nat18 and nat18x
3
Microsoft Word − 17 Public finance.doc (X:100.0%, Y:100.0%) Created by Grafikhuset Publi PDF.
Public finance
Statistical Yearbook 2012
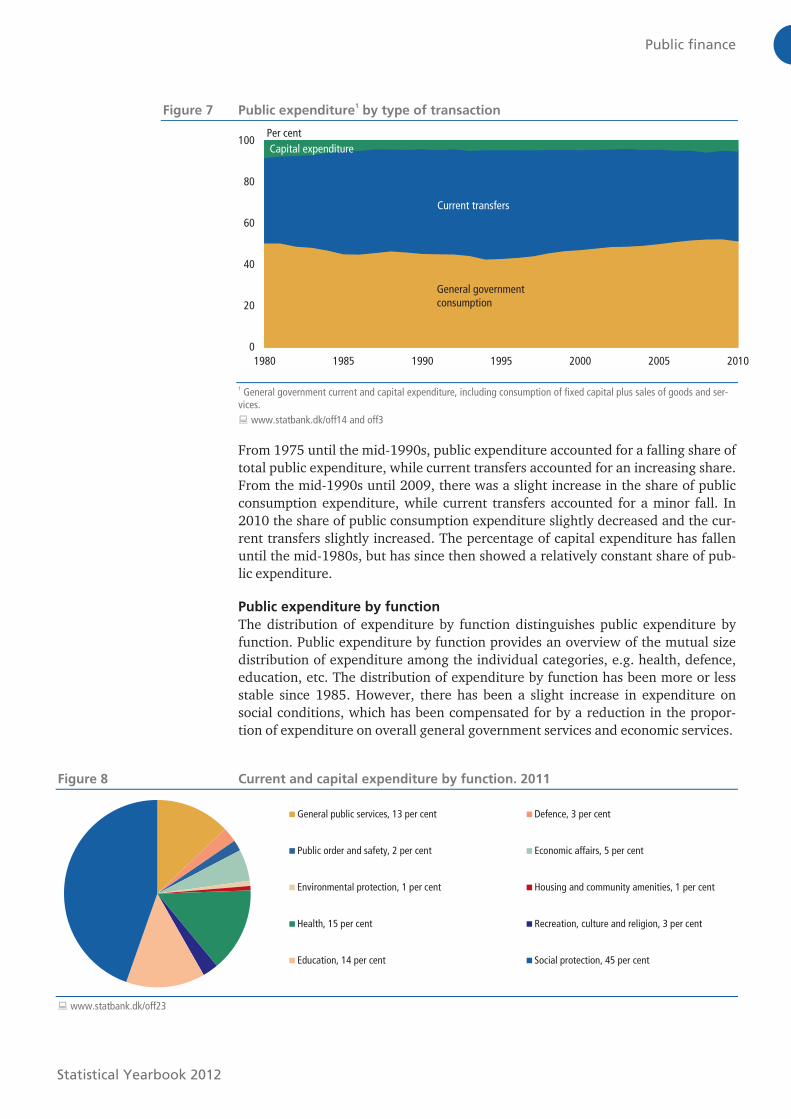
Figure 7 Public expenditure1 by type of transaction
0
20
40
60
80
100
1980 1985 1990 1995 2000 2005 2010
Per cent
General government consumption
Current transfers
Capital expenditure
1 General government current and capital expenditure, including consumption of fixed capital plus sales of goods and ser-
vices.
� www.statbank.dk/off14 and off3
From 1975 until the mid-1990s, public expenditure accounted for a falling share of
total public expenditure, while current transfers accounted for an increasing share.
From the mid-1990s until 2009, there was a slight increase in the share of public
consumption expenditure, while current transfers accounted for a minor fall. In
2010 the share of public consumption expenditure slightly decreased and the cur-
rent transfers slightly increased. The percentage of capital expenditure has fallen
until the mid-1980s, but has since then showed a relatively constant share of pub-
lic expenditure.
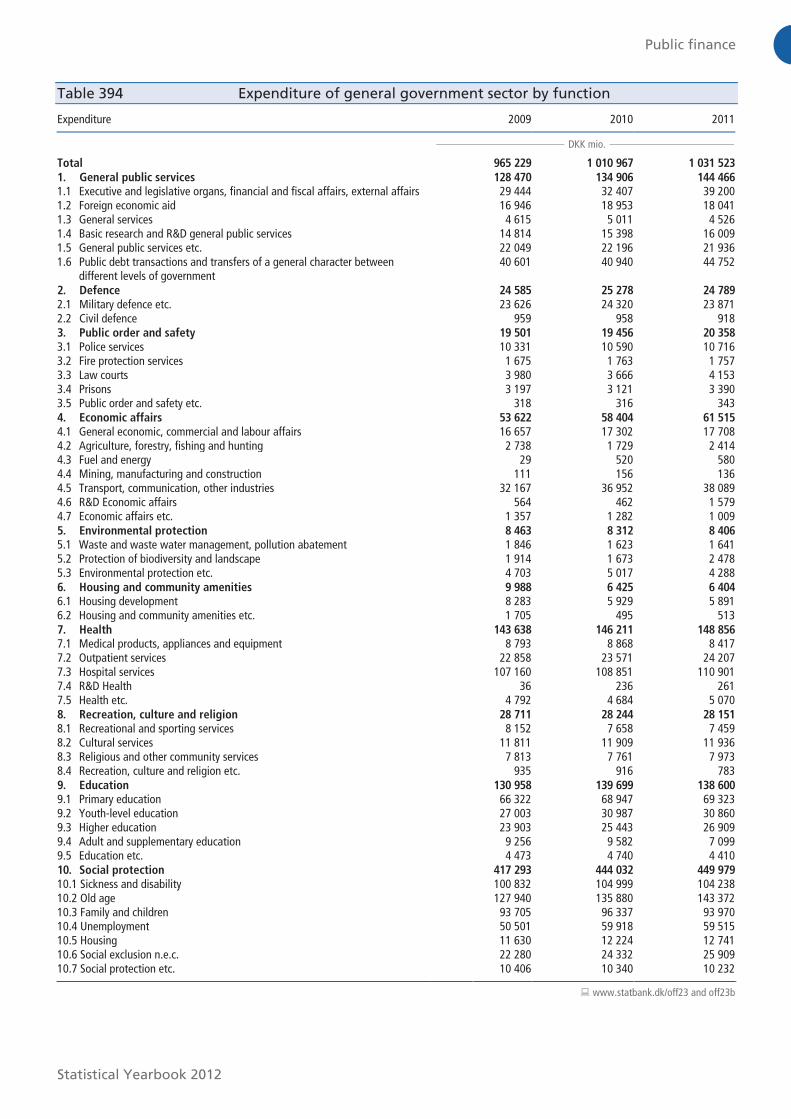
Public expenditure by function
The distribution of expenditure by function distinguishes public expenditure by
function. Public expenditure by function provides an overview of the mutual size
distribution of expenditure among the individual categories, e.g. health, defence,
education, etc. The distribution of expenditure by function has been more or less
stable since 1985. However, there has been a slight increase in expenditure on
social conditions, which has been compensated for by a reduction in the propor-
tion of expenditure on overall general government services and economic services.
Figure 8 Current and capital expenditure by function. 2011
General public services, 13 per cent Defence, 3 per cent
Public order and safety, 2 per cent Economic affairs, 5 per cent
Environmental protection, 1 per cent Housing and community amenities, 1 per cent
Health, 15 per cent Recreation, culture and religion, 3 per cent
Education, 14 per cent Social protection, 45 per cent
� www.statbank.dk/off23
Microsoft Word − 17 Public finance.doc (X:100.0%, Y:100.0%) Created by Grafikhuset Publi PDF.
Public finance
Statistical Yearbook 2012
Expenditure on overall public services along with defence, public order and safety,
are categories for which expenditure has historically been the basis for the general
government sector. Expenditure on general public services amounts to 13 per cent
of total public expenditure and comprises general government administration, etc.
Defence, public order and safety accounted for 3 per cent and 2 per cent of the
resources, respectively.
Education, health and social security are functions which are considered core ser-
vices in a modern welfare state. 72.8 per cent of expenditure in 2011 was spent on
these important functions. Expenditure on social security accounts for the largest
amount of resources (44.6 per cent). This includes expenditure on, e.g. old-age
pension, unemployment benefits, and cash benefits. Expenditure on education and
health amounts to 13.7 per cent and 14.5 per cent of total expenditure, respec-
tively. 5.4 per cent of expenditure was spent on economic services, which include
especially expenditure on economic, trade, labour market plus transport, commu-
nication, and other business services. 0.8 per cent and 2.7 per cent, respectively,
are spent on housing and public facilities and on religion, leisure and culture.
Funding general government expenditure
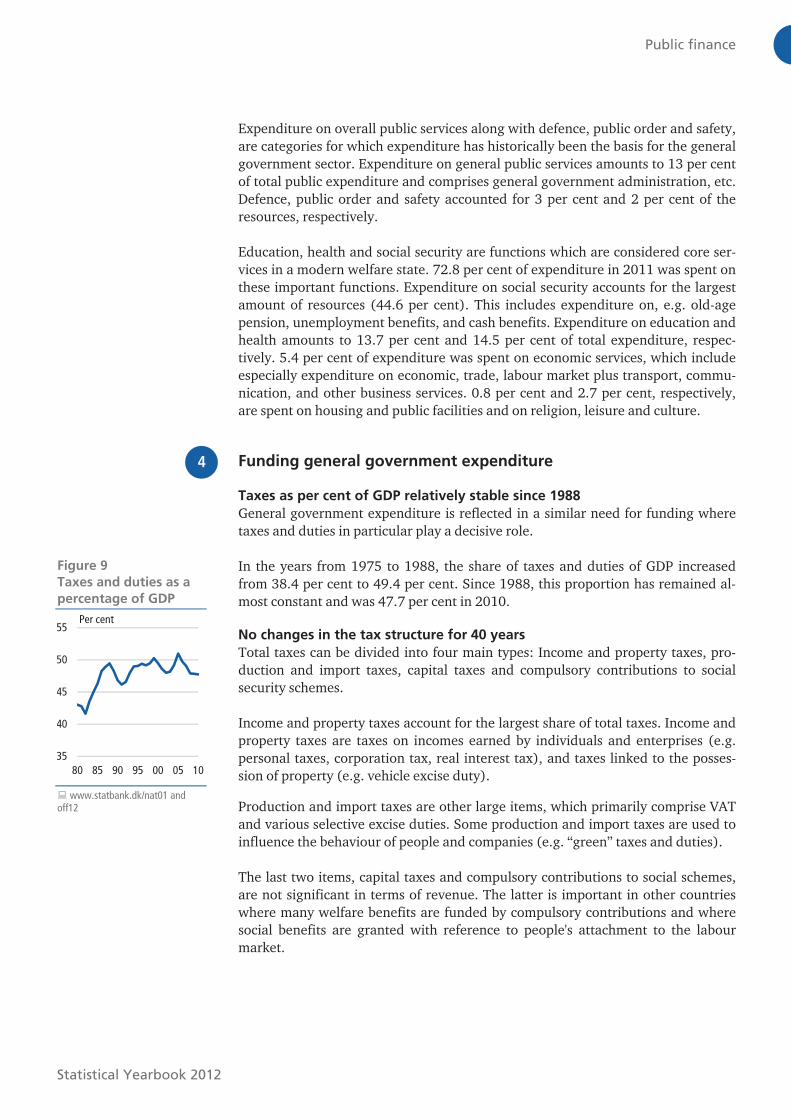
Taxes as per cent of GDP relatively stable since 1988
General government expenditure is reflected in a similar need for funding where
taxes and duties in particular play a decisive role.
In the years from 1975 to 1988, the share of taxes and duties of GDP increased
from 38.4 per cent to 49.4 per cent. Since 1988, this proportion has remained al-
most constant and was 47.7 per cent in 2010.
No changes in the tax structure for 40 years
Total taxes can be divided into four main types: Income and property taxes, pro-
duction and import taxes, capital taxes and compulsory contributions to social
security schemes.
Income and property taxes account for the largest share of total taxes. Income and
property taxes are taxes on incomes earned by individuals and enterprises (e.g.
personal taxes, corporation tax, real interest tax), and taxes linked to the posses-
sion of property (e.g. vehicle excise duty).
Production and import taxes are other large items, which primarily comprise VAT
and various selective excise duties. Some production and import taxes are used to
influence the behaviour of people and companies (e.g. “green” taxes and duties).
The last two items, capital taxes and compulsory contributions to social schemes,
are not significant in terms of revenue. The latter is important in other countries
where many welfare benefits are funded by compulsory contributions and where
social benefits are granted with reference to people's attachment to the labour
market.
Figure 9
Taxes and duties as a
percentage of GDP
35
40
45
50
55
80 85 90 95 00 05 10
Per cent
� www.statbank.dk/nat01 and off12
4
Microsoft Word − 17 Public finance.doc (X:100.0%, Y:100.0%) Created by Grafikhuset Publi PDF.
Public finance
Statistical Yearbook 2012
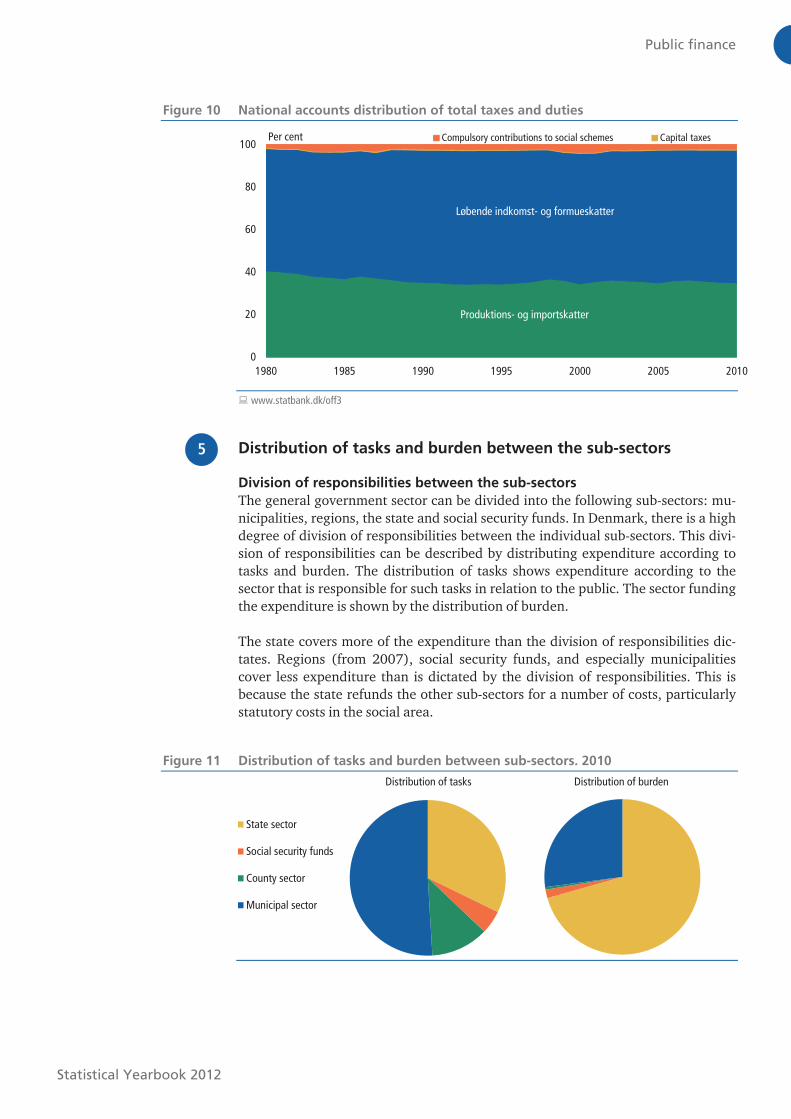
Figure 10 National accounts distribution of total taxes and duties
0
20
40
60
80
100
1980 1985 1990 1995 2000 2005 2010
Compulsory contributions to social schemes Capital taxesPer cent
Løbende indkomst- og formueskatter
Produktions- og importskatter
� www.statbank.dk/off3
Distribution of tasks and burden between the sub-sectors
Division of responsibilities between the sub-sectors
The general government sector can be divided into the following sub-sectors: mu-
nicipalities, regions, the state and social security funds. In Denmark, there is a high
degree of division of responsibilities between the individual sub-sectors. This divi-
sion of responsibilities can be described by distributing expenditure according to
tasks and burden. The distribution of tasks shows expenditure according to the
sector that is responsible for such tasks in relation to the public. The sector funding
the expenditure is shown by the distribution of burden.
The state covers more of the expenditure than the division of responsibilities dic-
tates. Regions (from 2007), social security funds, and especially municipalities
cover less expenditure than is dictated by the division of responsibilities. This is
because the state refunds the other sub-sectors for a number of costs, particularly
statutory costs in the social area.
Figure 11 Distribution of tasks and burden between sub-sectors. 2010
State sector
Social security funds
County sector
Municipal sector
Distribution of tasks Distribution of burden
5
Microsoft Word − 17 Public finance.doc (X:100.0%, Y:100.0%) Created by Grafikhuset Publi PDF.

Public finance
Statistical Yearbook 2012
International comparisons in EU-27 in 2010
On 1 January 2007, the EU was enlarged by two Eastern and Central European
Countries: Bulgaria and Romania. EU was founded with European Coal and Steel
Community in 1952 by the countries: France, West Germany, Italy, Belgium, Lux-
embourg and the Netherlands. EU has since then been expanded in 1973, were
Denmark joint, 1981, 1986, 1995, 2004 and latest in 2007. The biggest enlarge-
ment was in 2004 were EU were expanded with ten Eastern and Central European
Countries.
Size of the public sector
There are in the EU great variations in the size of the public sector measured in
terms of total public expenditure as a per cent of GDP, from 38.1 per cent (Bulgar-
ia) to 66.8 per cent (Ireland). These variations may reflect either a political choice
or the stage of development of the country.
The public sector in Denmark is among the largest in EU27, and in 2010, total pub-
lic expenditure is 58.2 per cent of GDP in Denmark, which is the second largest in
EU.
There is a tendency for the size of the public sector to increase concurrently with
the development of a country. Consequently, the size of the public sector is greater
in industrialized countries, compared to developing countries.
Figure 12 Public expenditure as a percentage of GDP in EU. 2010
0
10
20
30
40
50
60
70
80
Irel
and
Den
mar
k
Fran
ce
Finl
and
Bel
gium
Swed
en
Aus
tria
Port
ugal
Net
herl
ands
EU27
Uni
ted
Kin
gdom Ital
y
Gre
ece
Slov
enia
Hun
gary
Ger
man
y
Cyp
rus
Spai
n
Pola
nd
Latv
ia
Cze
ch R
epub
lic
Mal
ta
Luxe
mbo
urg
Lith
uani
a
Rom
ania
Esto
nia
Slov
akia
Per cent of GDP
Source: Eurostat, table tex00023
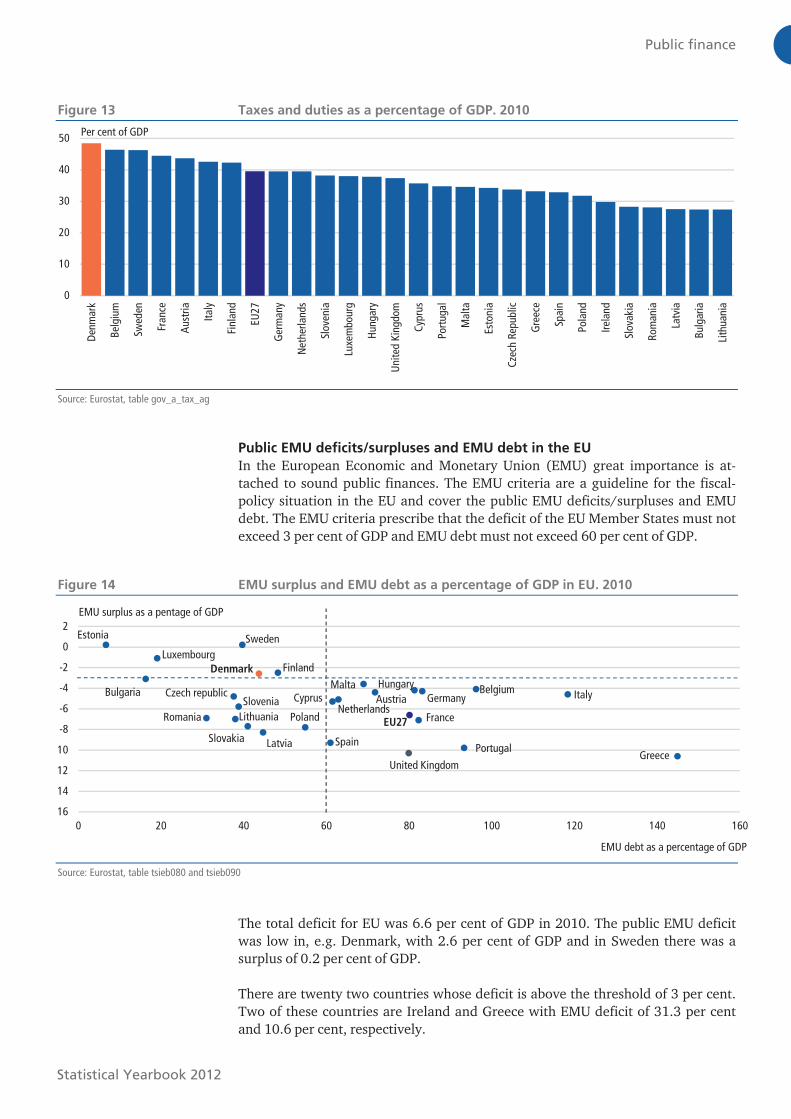
Comparison of taxes
There are in the EU great variations tax burden (taxes and duties as a per cent of
GDP), from 27.4 per cent (Lithuania) to 48.5 per cent (Denmark). Comparisons
between countries should be made with caution, as the tax burden depends, for
example, on whether income transfers (old-age pension, etc.) take place as net
transfers, gross transfers or allowances. Net transfers are transfers that are tax free
for the recipient, while gross transfers are subject to tax. In Denmark, gross trans-
fers are most prevalent, which means that tax revenues are greater.
6
Microsoft Word − 17 Public finance.doc (X:100.0%, Y:100.0%) Created by Grafikhuset Publi PDF.
Public finance
Statistical Yearbook 2012
Figure 13 Taxes and duties as a percentage of GDP. 2010
0
10
20
30
40
50
Den
mar
k
Bel
gium
Swed
en
Fran
ce
Aus
tria
Ital
y
Finl
and
EU27
Ger
man
y
Net
herl
ands
Slov
enia
Luxe
mbo
urg
Hun
gary
Uni
ted
Kin
gdom
Cyp
rus
Port
ugal
Mal
ta
Esto
nia
Cze
ch R
epub
lic
Gre
ece
Spai
n
Pola
nd
Irel
and
Slov
akia
Rom
ania
Latv
ia
Bul
gari
a
Lith
uani
a
Per cent of GDP
Source: Eurostat, table gov_a_tax_ag
Public EMU deficits/surpluses and EMU debt in the EU
In the European Economic and Monetary Union (EMU) great importance is at-
tached to sound public finances. The EMU criteria are a guideline for the fiscal-
policy situation in the EU and cover the public EMU deficits/surpluses and EMU
debt. The EMU criteria prescribe that the deficit of the EU Member States must not
exceed 3 per cent of GDP and EMU debt must not exceed 60 per cent of GDP.
Figure 14 EMU surplus and EMU debt as a percentage of GDP in EU. 2010
Greece
ItalyBelgium
Portugal
Germany
France
Hungary
EU27
United Kingdom
Austria
Malta
NetherlandsCyprus
Spain
Poland
Finland
Latvia
Denmark
Slovakia
Sweden
Slovenia
Lithuania
Czech republic
Romania
Luxembourg
Bulgaria
Estonia
-16
-14
-12
-10
-8
-6
-4
-2
0
2
0 20 40 60 80 100 120 140 160
EMU debt as a percentage of GDP
EMU surplus as a pentage of GDP
Source: Eurostat, table tsieb080 and tsieb090
The total deficit for EU was 6.6 per cent of GDP in 2010. The public EMU deficit
was low in, e.g. Denmark, with 2.6 per cent of GDP and in Sweden there was a
surplus of 0.2 per cent of GDP.
There are twenty two countries whose deficit is above the threshold of 3 per cent.
Two of these countries are Ireland and Greece with EMU deficit of 31.3 per cent
and 10.6 per cent, respectively.
Microsoft Word − 17 Public finance.doc (X:100.0%, Y:100.0%) Created by Grafikhuset Publi PDF.
Public finance
Statistical Yearbook 2012
The total EMU debt of EU was 80.1 per cent of GDP in 2010. In other words, the
average of EU is above the fixed limit of 60 per cent. The EMU debt of Italy and
Greece was high with 118.4 per cent and 144.9 per cent of GDP, respectively,
while the EMU debt of Estonia and Bulgaria was low with 6.7 per cent and 16.3 per
cent of GDP, respectively. In 2010, Denmark’s EMU debt was 43.7 per cent of GDP.
Microsoft Word − 17 Public finance.doc (X:100.0%, Y:100.0%) Created by Grafikhuset Publi PDF.

Public finance
Statistical Yearbook 2012
Table 372 Central government finance, summary
2011* 2012*
Operating budget Capital budget Operating budget Capital budget
Expenditure Revenue Expenditure Revenue
DKK mio.
§ 1. Queen Margrethe II 71.1 - - 71.8 - - § 2. Members of the Royal House 24.3 - - 24.6 - - § 3. Danish Parliament 975.1 - - 988.3 - - § 5. Prime Minister’s Department 125.6 - - 131.3 - - § 6. Royal Danish Ministry of Foreign Affairs 14 858.5 603.0 - 15 392.5 328.0 - § 7. Ministry of Finance 8 453.8 623.0 - 7 108.4 2 300.1 - § 8. Ministry of Business and Growth 1 966.2 494.1 - 1 772.1 1 591.4 - § 9. Ministry of Taxation 5 267.1 1 041.0 - 5 220.3 1 023.5 - § 10. Ministry of Economics and the Interior
194 028.9
8.0
-
204 391.1
8.0
-
§ 11. Ministry of Justice 16 499.9 1 765.0 - 16 615.7 1 865.0 - § 12. Ministry of Defence 22 283.9 18.8 771.5 22 803.6 18.8 501.2 § 14. Ministry of Housing, Urban and Rural Affairs
1 422.7
-
-
1 560.9
-
-
§ 15. Ministry of Social Affairs and Integration
132 609.7
-
-
138 894.0
-
-
§ 16. Ministry of Health 7 152.2 - - 6 087.1 - - § 17. Ministry of Employment 81 299.6 13 930.6 - 72 625.7 -3 909.7 - § 19. Ministry of Science, Innovation and Higher Education
41 566.2
22.9
-
44 156.3
20.7
-69.9
§ 20. The Ministry of Children and Education
28 549.8
-
-198.1
30 239.8
-
-92.1
§ 21. Ministry of Culture Affairs 6 313.1 76.5 258.9 6 332.4 23.0 228.2 § 22. Ministry of Equality and Ecclesiastical Affairs
629.2
-
16.5
604.1
-
3.7
§ 23. Ministry of the Environment 2 228.9 32.5 26.7 2 015.5 34.4 24.3 § 24. Ministry of Food, Agriculture and Fisheries 2 802.6 - 25.3 2 786.7 - -6.1 § 28. Ministry of Transport 6 782.0 356.3 10 217.8 6 837.2 203.0 16 436.9 § 29. Danish Ministry of Climate, Energy and Building
1 902.7
8 886.5
10.1
6 831.6
7 754.7
10.1
§ 35. General reserves 12 662.1 2 000.0 - 11 624.5 1 000.0 - § 36. Pensions 20 401.1 - - 21 786.0 - - Total 610 876.3 29 858.2 11 128.7 626 901.5 12 260.9 17 036.3
§ 37. Interests 24 838.1 9 163.7 • 26 044.9 9 851.1 • § 38. Taxes and duties 34 867.1 551 871.3 • 34 849.9 609 639.0 •
Total 671 771.1 649 348.3 11 128.7 687 328.2 616 669.4 17 036.3 Surplus • -22 422.8 -11 128.7 • -70 658.8 -17 036.3
Operating, capital and
lending budget • -33 551.5 • • -87 695.1 •
§ 40. Bond purchases. etc. 11 528.3 • • 2 833.4 • •
§ 41. Changes in investment
Portfolio, etc. • -4 093.9 • • 11 651.3 • § 42. Repayment of central government debt -49 173.7 • • -78 877.2 • • Total -37 645.4 -37 645.4 • -76 043.8 -76 043.8 •
Source: Appropriation Act 2012
Microsoft Word − Table 372.docx (X:100.0%, Y:100.0%) Created by Grafikhuset Publi PDF.

Public finance
Statistical Yearbook 2012
Table 373 Central government assets and liabilities
2008 2009 2010
DKK mio.
Assets, total 898 834.1 989 196.3 974 107.2
Fixed assets 350 963.1 449 494.3 443 248.9
Intangible assets 3 668.7 3 913.9 4 377.3 Tangible assets 192 699.5 207 400.6 204 726.4
Financial assets 154 594.9 238 179.8 234 145.2
Central government bonds for cost-based grants 1 131.1 1 297.4 1 107.6 Credits and long-term claims 104 420.4 139 992.0 140 392.3 Loss on bond issue, government loans -1 044.2 -3 472.9 -10 827.8 Securities and capital investment 50 087.6 100 363.3 103 473.1
Current assets 405 883.1 400 365.8 396 050.4
Inventories 15 214.4 13 692.3 13 750.7 Work in progress for the account of others 345.1 170.8 216.4 Debtors 56 969.6 106 179.9 94 043.9 Accruals and deferred income 8 929.1 9 238.7 6 422.6 Trade debtors concerning binding commitments 19 189.9 20 408.2 22 305.3 Trade debtors with the Export Credit Fund 381.7 768.1 467.9 Technical debtors counterbalancing long-term debt with the government’s corporate payment system
43 186.1
41 768.1
41 577.7
Other debtors 9 867.6 17 137.9 26 351.8
Accounts with Danmarks Nationalbank 230 642.0 193 278.3 177 089.9
Ministry of Finance’s ordinary account 230 615.2 193 228.2 177 089.5 Government institutions’ accounts with DK’s Nationalbank 26.8 50.1 0.4
Liquid funds 21 157.4 -2 276.5 13 824.6
Government institutions’ liquid funds 2 587.2 2 925.2 707.5 Liquid transfers in transit in the band system on 31 Dec. 18 570.2 -5 201.7 13 117.1
Other assets 141 987.9 139 336.2 134 807.9
Assets of special funds 141 987.9 139 336.2 134 807.9 Social Pension Fund 129 877.0 125 242.3 118 982.0 Danish National Advanced Technology Foundation 8 719.4 10 816.7 12 814.1 Other funds 3 391.5 3 277.2 3 011.8
Liabilities, total 898 834.1 989 196.3 974 107.2
Net capital -2 138.2 -12 295.5 -95 429.0
Balance -2 138.2 -12 295.5 -95 429.0
Provisions for liabilities 89 937.8 96 225.5 103 249.3
Provision for liabilities concerning government operation 1 977.7 2 084.3 1 735.4 Binding commitments 87 960.1 94 141.3 101 513.9
Long-term debt 628 536.8 696 340.2 761 370.0
Domestic government debt 429 508.6 487 915.5 576 413.3 Foreign government debt 133 091.7 139 588.4 114 730.8 Period interest on government debt 1 588.8 1 689.1 2 105.2 Mortgage debt 63.7 60.5 57.3 Other long-term debt 62 326.4 65 200.4 66 108.2 Donations 1 957.6 1 886.4 1 955.2
Short-term debt 40 509.8 69 589.8 70 109.0
Prepayments received for work in progress 419.4 452.3 488.9 Monetary liabilities concerning holiday pay 5 132.5 5 418.2 5 336.6 Suppliers of goods and services 14 489.0 42 230.7 26 425.9 Accruals and deferred income 1 203.4 563.5 1 275.2 Account with special funds 124.2 - - Debt to the Export Credit Fund 3 534.2 3 534.2 4 841.2 Debt to the Export Lending Scheme - 1 314.5 512.1 Renounced commitment 1 932.1 2 267.7 1 430.8 Liabilities concerning non-governmental deposits with the the government’s corporate payment system
13 727.8
13 291.6
11 851.1
Other short-term debt -52.6 517.1 17 947.1
Other liabilities 141 987.9 139 336.2 134 807.9
Capital for special funds 141 987.9 139 336.2 134 807.9
Source: Government accounts 2009 and 2010
Microsoft Word − Table 373.docx (X:100.0%, Y:100.0%) Created by Grafikhuset Publi PDF.
Public finance
Statistical Yearbook 2012
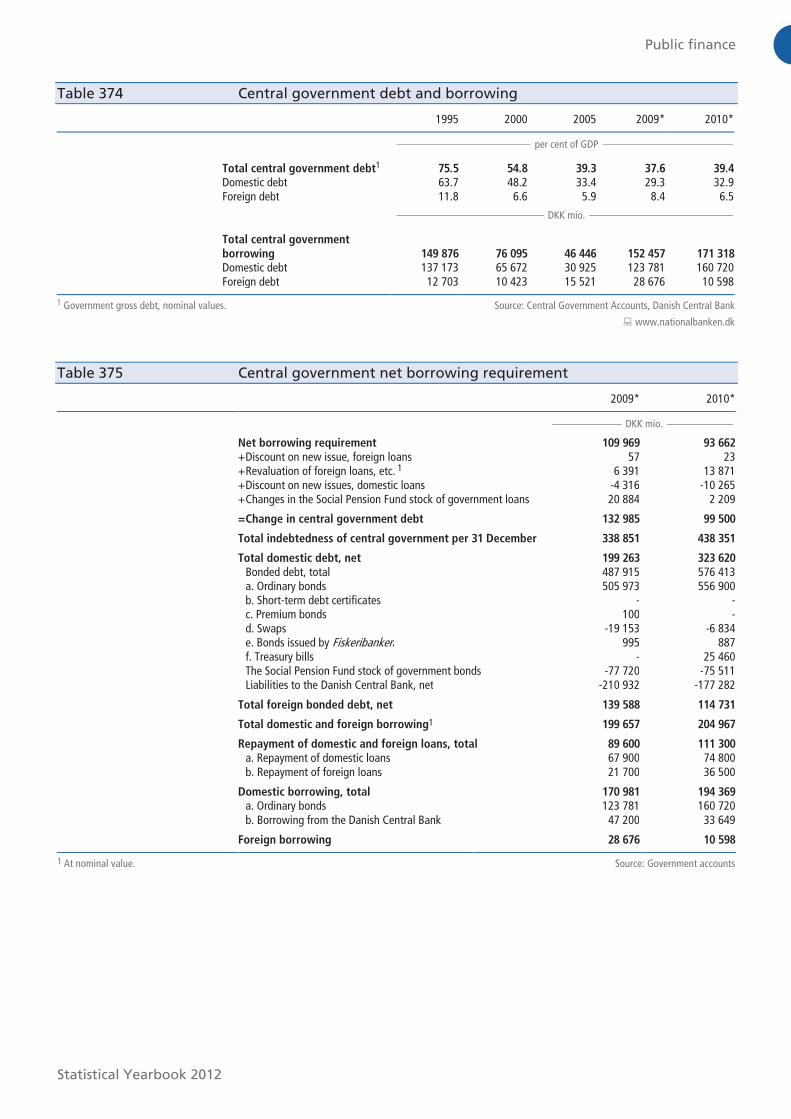
Table 374 Central government debt and borrowing
1995 2000 2005 2009* 2010*
per cent of GDP
Total central government debt1 75.5 54.8 39.3 37.6 39.4
Domestic debt 63.7 48.2 33.4 29.3 32.9 Foreign debt 11.8 6.6 5.9 8.4 6.5
DKK mio.
Total central government
borrowing 149 876 76 095 46 446 152 457 171 318
Domestic debt 137 173 65 672 30 925 123 781 160 720 Foreign debt 12 703 10 423 15 521 28 676 10 598
1 Government gross debt, nominal values. Source: Central Government Accounts, Danish Central Bank
� www.nationalbanken.dk
Table 375 Central government net borrowing requirement
2009* 2010*
DKK mio.
Net borrowing requirement 109 969 93 662
+ Discount on new issue, foreign loans 57 23 + Revaluation of foreign loans, etc. 1 6 391 13 871 + Discount on new issues, domestic loans -4 316 -10 265 + Changes in the Social Pension Fund stock of government loans 20 884 2 209
= Change in central government debt 132 985 99 500
Total indebtedness of central government per 31 December 338 851 438 351
Total domestic debt, net 199 263 323 620
Bonded debt, total 487 915 576 413 a. Ordinary bonds 505 973 556 900 b. Short-term debt certificates - - c. Premium bonds 100 - d. Swaps -19 153 -6 834 e. Bonds issued by Fiskeribanken 995 887 f. Treasury bills - 25 460 The Social Pension Fund stock of government bonds -77 720 -75 511 Liabilities to the Danish Central Bank, net -210 932 -177 282
Total foreign bonded debt, net 139 588 114 731
Total domestic and foreign borrowing1 199 657 204 967
Repayment of domestic and foreign loans, total 89 600 111 300
a. Repayment of domestic loans 67 900 74 800 b. Repayment of foreign loans 21 700 36 500
Domestic borrowing, total 170 981 194 369
a. Ordinary bonds 123 781 160 720 b. Borrowing from the Danish Central Bank 47 200 33 649
Foreign borrowing 28 676 10 598
1 At nominal value. Source: Government accounts
Microsoft Word − Table 374.docx (X:100.0%, Y:100.0%) Created by Grafikhuset Publi PDF.
Public finance
Statistical Yearbook 2012
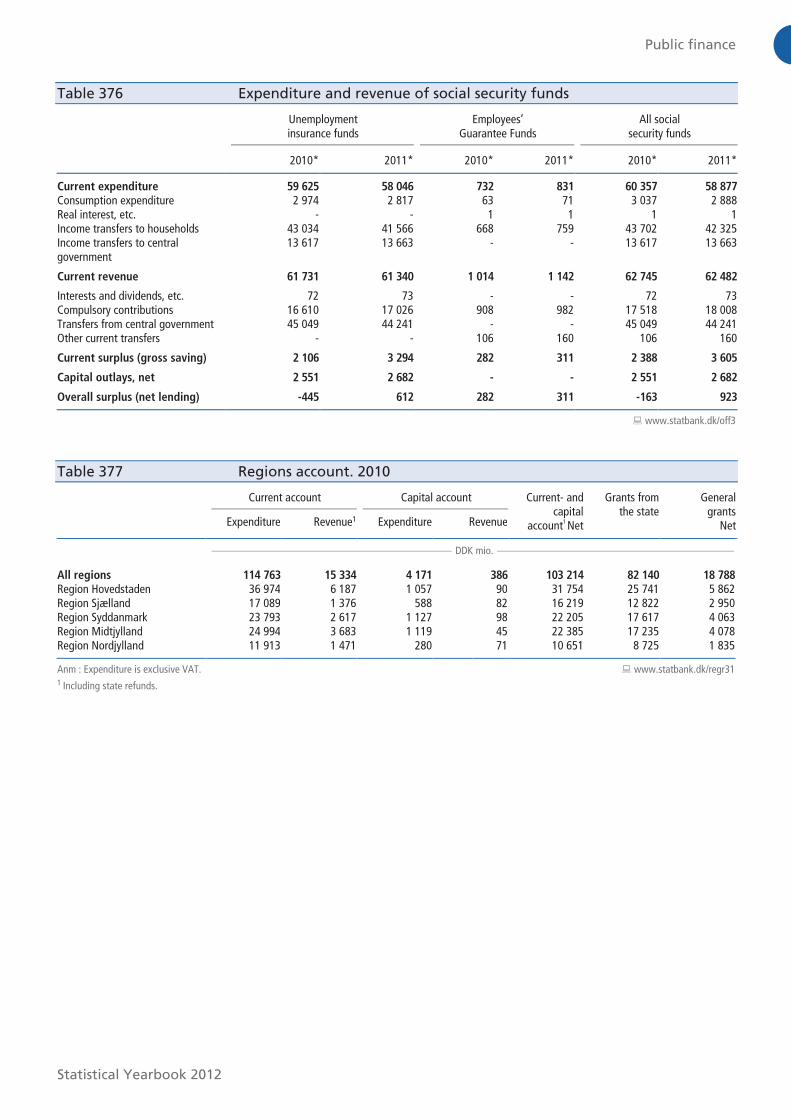
Table 376 Expenditure and revenue of social security funds
Unemployment insurance funds
Employees’ Guarantee Funds
All social security funds
2010* 2011* 2010* 2011* 2010* 2011*
Current expenditure 59 625 58 046 732 831 60 357 58 877
Consumption expenditure 2 974 2 817 63 71 3 037 2 888 Real interest, etc. - - 1 1 1 1 Income transfers to households 43 034 41 566 668 759 43 702 42 325 Income transfers to central government
13 617 13 663 - - 13 617 13 663
Current revenue 61 731 61 340 1 014 1 142 62 745 62 482
Interests and dividends, etc. 72 73 - - 72 73 Compulsory contributions 16 610 17 026 908 982 17 518 18 008 Transfers from central government 45 049 44 241 - - 45 049 44 241 Other current transfers - - 106 160 106 160
Current surplus (gross saving) 2 106 3 294 282 311 2 388 3 605
Capital outlays, net 2 551 2 682 - - 2 551 2 682
Overall surplus (net lending) -445 612 282 311 -163 923
� www.statbank.dk/off3
Table 377 Regions account. 2010
Current account Capital account Current- and capital
account1 Net
Grants from the state
General grants
Net Expenditure Revenue1 Expenditure Revenue
DDK mio.
All regions 114 763 15 334 4 171 386 103 214 82 140 18 788
Region Hovedstaden 36 974 6 187 1 057 90 31 754 25 741 5 862 Region Sjælland 17 089 1 376 588 82 16 219 12 822 2 950 Region Syddanmark 23 793 2 617 1 127 98 22 205 17 617 4 063 Region Midtjylland 24 994 3 683 1 119 45 22 385 17 235 4 078 Region Nordjylland 11 913 1 471 280 71 10 651 8 725 1 835
Anm : Expenditure is exclusive VAT. 1 Including state refunds.
� www.statbank.dk/regr31
Microsoft Word − Table 376.docx (X:100.0%, Y:100.0%) Created by Grafikhuset Publi PDF.
Public finance
Statistical Yearbook 2012
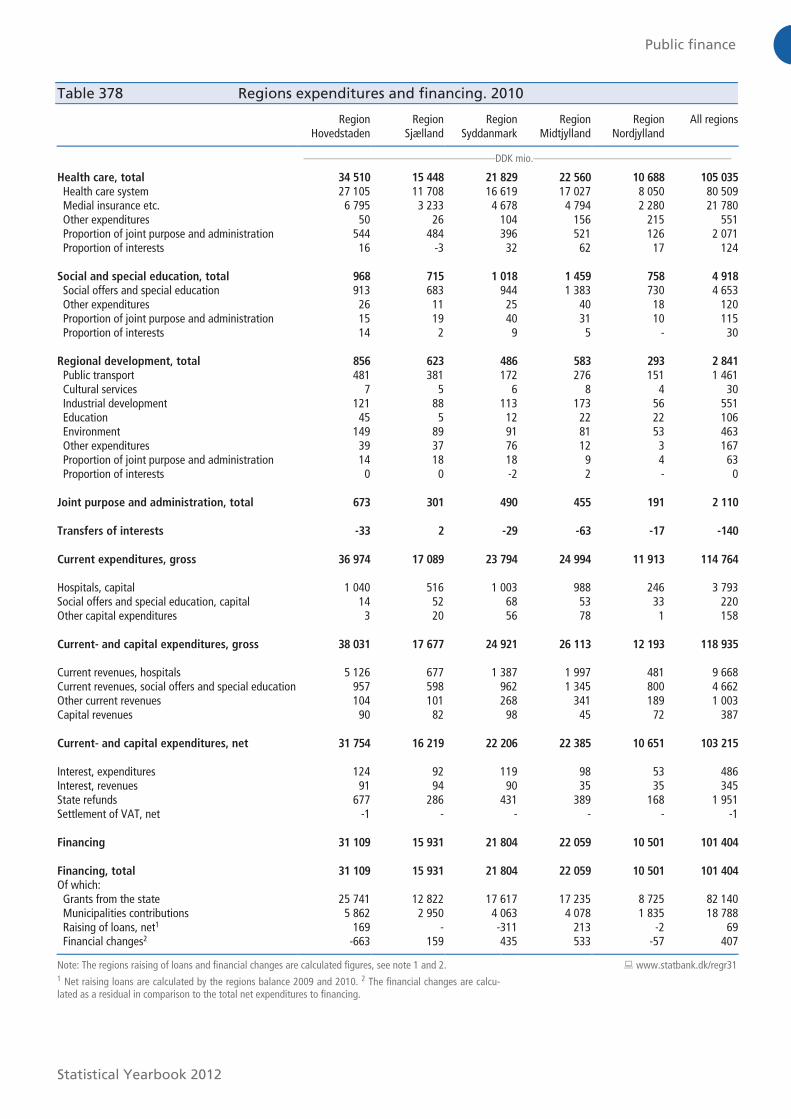
Table 378 Regions expenditures and financing. 2010
Region Hovedstaden
Region Sjælland
Region Syddanmark
Region Midtjylland
Region Nordjylland
All regions
DDK mio.
Health care, total 34 510 15 448 21 829 22 560 10 688 105 035
Health care system 27 105 11 708 16 619 17 027 8 050 80 509 Medial insurance etc. 6 795 3 233 4 678 4 794 2 280 21 780 Other expenditures 50 26 104 156 215 551 Proportion of joint purpose and administration 544 484 396 521 126 2 071 Proportion of interests 16 -3 32 62 17 124 Social and special education, total 968 715 1 018 1 459 758 4 918
Social offers and special education 913 683 944 1 383 730 4 653 Other expenditures 26 11 25 40 18 120 Proportion of joint purpose and administration 15 19 40 31 10 115 Proportion of interests 14 2 9 5 - 30 Regional development, total 856 623 486 583 293 2 841
Public transport 481 381 172 276 151 1 461 Cultural services 7 5 6 8 4 30 Industrial development 121 88 113 173 56 551 Education 45 5 12 22 22 106 Environment 149 89 91 81 53 463 Other expenditures 39 37 76 12 3 167 Proportion of joint purpose and administration 14 18 18 9 4 63 Proportion of interests 0 0 -2 2 - 0 Joint purpose and administration, total 673 301 490 455 191 2 110
Transfers of interests -33 2 -29 -63 -17 -140
Current expenditures, gross 36 974 17 089 23 794 24 994 11 913 114 764
Hospitals, capital 1 040 516 1 003 988 246 3 793 Social offers and special education, capital 14 52 68 53 33 220 Other capital expenditures 3 20 56 78 1 158
Current- and capital expenditures, gross 38 031 17 677 24 921 26 113 12 193 118 935
Current revenues, hospitals 5 126 677 1 387 1 997 481 9 668 Current revenues, social offers and special education 957 598 962 1 345 800 4 662 Other current revenues 104 101 268 341 189 1 003 Capital revenues 90 82 98 45 72 387
Current- and capital expenditures, net 31 754 16 219 22 206 22 385 10 651 103 215
Interest, expenditures 124 92 119 98 53 486 Interest, revenues 91 94 90 35 35 345 State refunds 677 286 431 389 168 1 951 Settlement of VAT, net -1 - - - - -1 Financing 31 109 15 931 21 804 22 059 10 501 101 404
Financing, total 31 109 15 931 21 804 22 059 10 501 101 404
Of which: Grants from the state 25 741 12 822 17 617 17 235 8 725 82 140 Municipalities contributions 5 862 2 950 4 063 4 078 1 835 18 788 Raising of loans, net1 169 - -311 213 -2 69 Financial changes2 -663 159 435 533 -57 407
Note: The regions raising of loans and financial changes are calculated figures, see note 1 and 2. 1 Net raising loans are calculated by the regions balance 2009 and 2010. 2 The financial changes are calcu-lated as a residual in comparison to the total net expenditures to financing.
� www.statbank.dk/regr31
Microsoft Word − Table 378.docx (X:100.0%, Y:100.0%) Created by Grafikhuset Publi PDF.

Public finance
Statistical Yearbook 2012
Table 379 Regions current- and capital accounts. 2010
Health Social services and special
education
Regional development
Joint purpose and
administration
Interests etc.
Total
DDK mio.
Net expenditure, total 98 347 408 2 623 1 979 -141 103 216
Gross expenditure, total 108 906 5 138 2 866 2 169 -141 118 938
Compensation of employees1 47 670 3 874 298 1 137 - 52 979
Intermediate consumption 15 443 384 26 197 - 16 050
Food 457 82 1 14 - 554 Fuels and lubricants 1 081 76 4 19 - 1 180 Purchase of land and buildings 19 18 - - - 37 Acquisitions 1 491 23 2 44 - 1 560 Other consumption goods 12 395 185 19 120 - 12 719
Services etc. 22 648 707 584 1 079 - 25 018
VAT-exempt services 9 740 226 125 150 - 10 241 Building contractors and craftsmen 2 353 201 45 47 - 2 646 Payments to the state 60 -1 - 0 - 59 Payments to municipalities 403 0 - 2 - 405 Payments to regions 5 185 2 - 3 - 5 190 Other services 4 907 279 414 877 - 6 477
Grants and transfers 20 978 24 1 894 2 122 - 25 018
Civil servant pensions 19 0 18 2 078 - 2 115 Other transfers to persons 20 926 24 - 39 - 20 989 Other grants and transfers 33 0 1 876 5 - 1 914
Financial expenditures - 10 - - - 10
Internal expenditure and revenue 2 167 139 64 -2 366 -141 -137
Regarding compensation of employees 101 26 0 277 - 404 Regarding intermediate consumption 826 1 1 2 - 830 Regarding services 3 415 218 66 -2 330 -141 1 228 Internal revenue -2 175 -106 -3 -315 - -2 599
Gross revenue, total 10 559 4 730 243 190 - 15 722
Revenue 10 466 4 722 242 189 - 15 619
Rent received 134 14 - 5 - 153 Sales of goods and services 1 052 120 0 12 - 1 184 Payments from the state 626 59 185 20 - 890 Payments from municipalities 966 4 406 2 11 - 5 385 Payments from regions 5 931 6 6 5 - 5 948 Other revenue 1 757 117 49 136 - 2 059
Financial revenues
2 93 8 1 1 - 103
Financial revenue 1 - 1 - - 2 Grants from municipalities 9 0 0 0 - 9 State refunds 83 2 - 1 - 86 Other financial revenue - 6 - - - 6
Note: Current- and capital expenditure is exclusive VAT. 1 Income deducted from the Daily Cash Benefits Fund. 2 Exclusive state refunds.
� www.statbank.dk/regr11
Microsoft Word − Table 379.docx (X:100.0%, Y:100.0%) Created by Grafikhuset Publi PDF.

Public finance
Statistical Yearbook 2012
Table 380 (page 1 of 2) Municipalities account. 2010
Current account Capital account Current- and capital account
1
Net
Taxes Net
General grants
Net Expenditure Revenue1 Expenditure Revenue
DDK mio.
All municipalities 409 693 119 384 18 973 6 077 303 205 223 588 77 384
Region Hovedstaden 125 237 33 730 6 555 1 753 96 309 78 674 17 033
Copenhagen 38 665 9 913 2 395 654 30 493 23 667 7 509 Frederiksberg 6 275 1 654 386 54 4 953 4 343 592 Albertslund 2 648 827 150 27 1 944 1 112 764 Allerød 1 555 365 32 13 1 209 1 291 -75 Ballerup 4 132 1 107 294 103 3 216 2 794 458 Bornholm 3 358 938 111 37 2 494 1 415 1 069 Brøndby 2 982 836 130 4 2 272 1 431 795 Dragør 807 152 32 20 667 666 -2 Egedal 2 610 657 124 24 2 053 1 853 142 Fredensborg 2 965 821 66 11 2 199 1 895 310 Frederikssund 3 296 902 153 102 2 445 1 901 523 Furesø 2 619 586 65 44 2 054 2 073 113 Gentofte 5 145 1 702 376 25 3 794 4 219 -931 Gladsaxe 5 217 1 784 271 45 3 659 2 918 687 Glostrup 1 772 533 46 18 1 267 1 025 233 Gribskov 2 923 832 75 53 2 113 1 894 276 Halsnæs 2 349 611 157 65 1 830 1 240 557 Helsingør 4 773 1 238 387 19 3 903 2 693 881 Herlev 2 150 549 79 14 1 666 1 160 434 Hillerød 3 694 1 249 82 104 2 423 2 099 321 Hvidovre 3 769 845 148 39 3 033 2 211 828 Høje-Taastrup 3 846 939 158 35 3 030 2 140 815 Hørsholm 1 551 346 123 40 1 288 1 609 -342 Ishøj 2 023 685 96 32 1 402 777 648 Lyngby-Taarbæk 3 642 867 110 135 2 750 2 981 -181 Rudersdal 3 807 1 104 186 11 2 878 3 366 -555 Rødovre 3 080 857 130 3 2 350 1 640 611 Tårnby 2 678 598 135 1 2 214 1 639 476 Vallensbæk 906 233 58 21 710 622 77 Region Sjælland 61 039 18 161 2 011 768 44 121 31 726 12 490
Faxe 2 495 711 80 15 1 849 1 379 491 Greve 3 024 719 168 27 2 446 1 960 432 Guldborgsund 4 762 1 310 121 19 3 554 2 203 1 255 Holbæk 4 939 1 435 166 77 3 593 2 533 1 130 Kalundborg 3 745 1 068 51 20 2 708 1 945 805 Køge 4 078 1 133 207 248 2 904 2 256 829 Lejre 1 708 432 82 8 1 350 1 138 162 Lolland 4 081 1 091 103 60 3 033 1 658 1 437 Næstved 5 806 1 741 149 72 4 142 2 943 1 239 Odsherred 2 639 816 47 3 1 867 1 338 586 Ringsted 2 546 859 61 21 1 727 1 341 473 Roskilde 6 100 1 839 178 117 4 322 3 723 473 Slagelse 6 628 2 451 210 22 4 365 2 727 1 586 Solrød 1 238 268 106 34 1 042 1 007 -21 Sorø 2 185 692 97 11 1 579 1 113 447 Stevns 1 482 417 64 1 1 128 825 299 Vordingborg 3 583 1 179 121 13 2 512 1 637 867
Note: Expenditure is exclusive VAT. 1 Including state refunds.
� www.statbank.dk/regk31and regk11
Microsoft Word − Table 380.docx (X:100.0%, Y:100.0%) Created by Grafikhuset Publi PDF.

Public finance
Statistical Yearbook 2012
Table 380 (page 2 of 2) Municipalities account. 2010
Current account Capital account Current- and capital account
1
Net
Taxes Net
General grants
Net Expenditure Revenue1 Expenditure Revenue
DDK mio.
Region Syddanmark 88 014 25 509 3 604 1 379 64 730 44 508 20 083
Assens 2 853 737 290 103 2 303 1 529 759 Billund 1 770 474 74 30 1 340 1 043 328 Esbjerg 9 314 3 122 307 178 6 321 4 363 1 982 Fanø 230 63 16 12 171 151 26 Fredericia 3 980 1 189 156 27 2 920 2 037 794 Faaborg-Midtfyn 3 677 1021 145 27 2 774 1 864 894 Haderslev 4 157 1 197 286 49 3 197 2 123 952 Kerteminde 1 607 399 69 107 1 170 900 360 Kolding 6 067 1 621 232 98 4 580 3 540 1 188 Langeland 1 138 282 26 5 877 514 370 Middelfart 2 777 910 119 18 1 968 1 460 484 Nordfyns 1 994 479 93 19 1 589 1 042 523 Nyborg 2 300 594 72 22 1 756 1 184 577 Odense 14 232 4 089 544 157 10 530 6 544 3 748 Svendborg 4 636 1 514 125 22 3 225 2 187 1 019 Sønderborg 5 263 1 316 190 66 4 071 2 756 1 313 Tønder 2 992 823 84 30 2 223 1 413 810 Varde 3 416 903 177 45 2 645 1 941 652 Vejen 2 783 675 114 37 2 185 1 447 732 Vejle 7 960 2 780 348 242 5 286 4 067 1 343 Ærø 519 151 24 5 387 238 142 Aabenraa 4 349 1 170 113 80 3 212 2 165 1 087 Region Midtjylland 91 769 28 416 5 052 1 577 66 828 47 489 17 677
Favrskov 2 963 733 160 32 2 358 1 667 547 Hedensted 2 929 768 158 96 2 223 1 646 612 Herning 6 039 1 836 342 101 4 444 3 129 1 203 Holstebro 4 155 1 327 200 81 2 947 2 175 762 Horsens 6 186 1 981 237 190 4 252 3 044 1 377 Ikast-Brande 2 909 882 128 42 2 113 1 448 639 Lemvig 1 632 497 69 17 1 187 831 371 Norddjurs 2 836 791 265 40 2 270 1 360 737 Odder 1 510 460 60 43 1 067 825 245 Randers 7 226 2 257 396 54 5 311 3 503 1 638 Ringkøbing-Skjern 3 962 1 103 157 27 2 989 2 225 700 Samsø 352 97 9 10 254 148 112 Silkeborg 5 791 1 527 311 62 4 513 3 528 996 Skanderborg 4 065 1 370 175 58 2 812 2 245 520 Skive 3 514 1 088 219 36 2 609 1 761 815 Struer 1 616 506 125 33 1 202 789 413 Syddjurs 2 754 713 71 31 2 081 1 596 584 Viborg 6 327 1 768 393 104 4 848 3 601 1 202 Aarhus 25 003 8 712 1 577 520 17 348 11 968 4 204 Region Nordjylland 43 634 13 568 1 751 600 31 217 21 191 10 101
Brønderslev 2 736 806 60 18 1 972 1 303 649 Frederikshavn 4 526 1 192 250 34 3 550 2 297 1 196 Hjørring 4 736 1 283 127 55 3 525 2 339 1 286 Jammerbugt 3 105 1 091 104 23 2 095 1 403 686 Læsø 183 38 13 6 152 76 73 Mariagerfjord 3 015 867 153 33 2 268 1 562 700 Morsø 1 666 449 65 6 1 276 726 517 Rebild 1 829 478 69 25 1 395 1 049 373 Thisted 3 378 1 042 91 37 2 390 1 619 817 Vesthimmerlands 3 028 1 026 93 33 2 062 1 396 752 Aalborg 15 432 5 296 726 330 10 532 7 421 3 052
Microsoft Word − Table 380.docx (X:100.0%, Y:100.0%) Created by Grafikhuset Publi PDF.
Public finance
Statistical Yearbook 2012
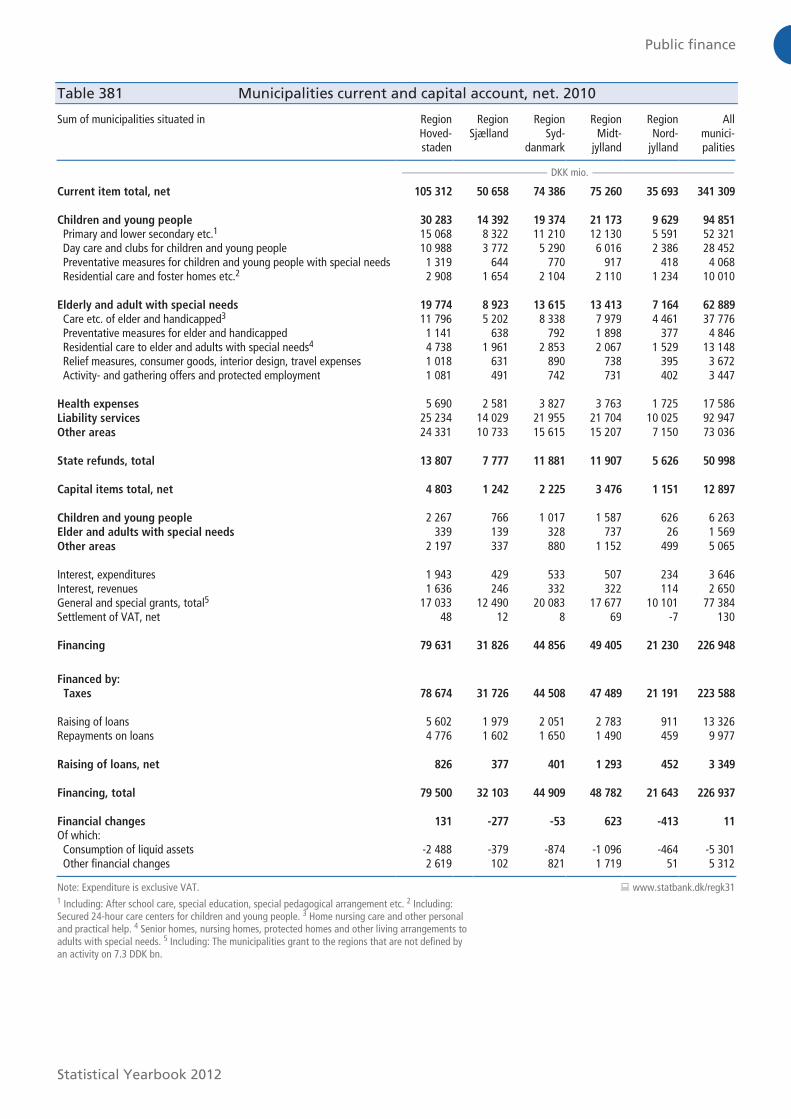
Table 381 Municipalities current and capital account, net. 2010
Sum of municipalities situated in Region Hoved-staden
Region Sjælland
Region Syd-
danmark
Region Midt-
jylland
Region Nord-
jylland
All munici- palities
DKK mio.
Current item total, net 105 312 50 658 74 386 75 260 35 693 341 309
Children and young people 30 283 14 392 19 374 21 173 9 629 94 851
Primary and lower secondary etc.1
15 068 8 322 11 210 12 130 5 591 52 321 Day care and clubs for children and young people 10 988 3 772 5 290 6 016 2 386 28 452 Preventative measures for children and young people with special needs 1 319 644 770 917 418 4 068 Residential care and foster homes etc.2 2 908 1 654 2 104 2 110 1 234 10 010 Elderly and adult with special needs 19 774 8 923 13 615 13 413 7 164 62 889
Care etc. of elder and handicapped3 11 796 5 202 8 338 7 979 4 461 37 776 Preventative measures for elder and handicapped 1 141 638 792 1 898 377 4 846 Residential care to elder and adults with special needs4 4 738 1 961 2 853 2 067 1 529 13 148 Relief measures, consumer goods, interior design, travel expenses 1 018 631 890 738 395 3 672 Activity- and gathering offers and protected employment 1 081 491 742 731 402 3 447 Health expenses 5 690 2 581 3 827 3 763 1 725 17 586 Liability services 25 234 14 029 21 955 21 704 10 025 92 947 Other areas 24 331 10 733 15 615 15 207 7 150 73 036 State refunds, total 13 807 7 777 11 881 11 907 5 626 50 998
Capital items total, net 4 803 1 242 2 225 3 476 1 151 12 897
Children and young people 2 267 766 1 017 1 587 626 6 263 Elder and adults with special needs 339 139 328 737 26 1 569 Other areas 2 197 337 880 1 152 499 5 065 Interest, expenditures 1 943 429 533 507 234 3 646 Interest, revenues 1 636 246 332 322 114 2 650 General and special grants, total5 17 033 12 490 20 083 17 677 10 101 77 384 Settlement of VAT, net 48 12 8 69 -7 130 Financing 79 631 31 826 44 856 49 405 21 230 226 948
Financed by:
Taxes 78 674 31 726 44 508 47 489 21 191 223 588
Raising of loans 5 602 1 979 2 051 2 783 911 13 326 Repayments on loans 4 776 1 602 1 650 1 490 459 9 977
Raising of loans, net 826 377 401 1 293 452 3 349
Financing, total 79 500 32 103 44 909 48 782 21 643 226 937
Financial changes 131 -277 -53 623 -413 11
Of which: Consumption of liquid assets -2 488 -379 -874 -1 096 -464 -5 301 Other financial changes 2 619 102 821 1 719 51 5 312
Note: Expenditure is exclusive VAT. 1 Including: After school care, special education, special pedagogical arrangement etc. 2 Including: Secured 24-hour care centers for children and young people. 3 Home nursing care and other personal and practical help. 4 Senior homes, nursing homes, protected homes and other living arrangements to adults with special needs. 5 Including: The municipalities grant to the regions that are not defined by an activity on 7.3 DDK bn.
� www.statbank.dk/regk31
Microsoft Word − Table 381.docx (X:100.0%, Y:100.0%) Created by Grafikhuset Publi PDF.

Public finance
Statistical Yearbook 2012
Table 382 Municipalities current- and capital accounts. 2010
Housing and
community amenities
Public utilities
etc.
Traffic and infra-structure
etc.
Education and
culture
Health care
Social services
and employ-
ment
Joint expen-ditures
and admini-stration
etc.
Total
DDK mio.
Net expenditures, total 4 730 65 11 636 67 258 17 779 217 703 35 032 354 203
Gross expenditures, total 12 281 9 849 15 299 77 963 18 106 256 206 38 964 428 667
Compensation of employees1 2 991 636 3 177 45 373 3 855 87 097 24 304 167 432
Consumption goods 1 974 3 050 2 115 4 854 298 8 972 1 685 22 947
Foods 33 2 10 396 9 1 765 173 2 388 Fuels and lubricants 512 2 528 746 1 366 24 1 322 305 6 803 Purchase of land and buildings 826 16 35 132 22 249 4 1 284 Acquisitions 81 58 239 232 28 234 166 1 038 Other consumption goods 522 446 1 085 2 727 216 5 402 1 037 11 435
Services etc. 6 302 6 079 7 679 22 460 13 423 58 813 10 193 124 949
VAT-exempt services 1 283 844 1 591 4 931 736 18 623 1 258 29 266 Building contractors and craftsmen 2 729 928 3 884 4 700 173 4 589 1 210 18 213 Payments to the state 69 9 79 4 514 1 4 452 258 9 382 Payments to municipalities 90 0 17 4 409 63 16 979 66 21 624 Payments to regions 5 - 81 452 12 218 4 177 2 16 935 Other services 2 125 4 299 2 027 3 454 232 9 993 7 399 29 529
Grants and transfers 989 47 2 633 4 891 526 100 580 3 744 113 411
Civil servant pensions etc. - 43 1 48 2 3 3 487 3 584 Transfers to persons 35 1 5 1 310 521 98 418 123 100 413 Other grants and transfers 954 3 2 628 3 533 3 2 159 134 9 414
Financial expenditures 16 36 1 0 - 10 0 63
Internal expenditure and revenue 10 - -307 385 4 735 -961 -135
Regarding compensation of employees 182 - 856 197 40 2 031 35 3 341 Regarding intermediate consumption 7 - 16 30 1 90 18 163 Regarding services 217 - 615 797 38 3 327 323 5 317 Internal revenue -397 - -1 794 -640 -75 -4 713 -1 338 -8 956
Gross revenues, total 7 550 9 783 3 663 10 705 327 38 503 3 932 74 463
Revenues 7 279 9 758 3 620 10 615 264 37 392 3 734 72 663
Rent received 820 - 6 85 5 2 053 57 3 026 Sales of goods and services 1 049 5 547 2 120 3 954 45 12 819 565 26 100 Payments from the state 199 - 43 413 42 566 197 1 461 Payments from municipalities 89 -7 249 4 231 63 17 562 174 22 362 Payments from regions 105 - - 37 14 382 15 554 Other revenues 5 016 4 217 1 201 1 895 95 4 010 2 726 19 160
Financial revenues2 271 25 43 90 63 1 111 198 1 801
State refunds 254 - 40 76 63 1 017 176 1 626 Other financial revenues 17 25 3 14 - 94 22 175
Note: Current- and capital expenditures is exclusive VAT. 1 Income deducted from the Daily Cash Benefits Fund. 2 Exclusive state refunds.
� www.statbank.dk/regk11
Microsoft Word − Table 382.docx (X:100.0%, Y:100.0%) Created by Grafikhuset Publi PDF.
Public finance
Statistical Yearbook 2012
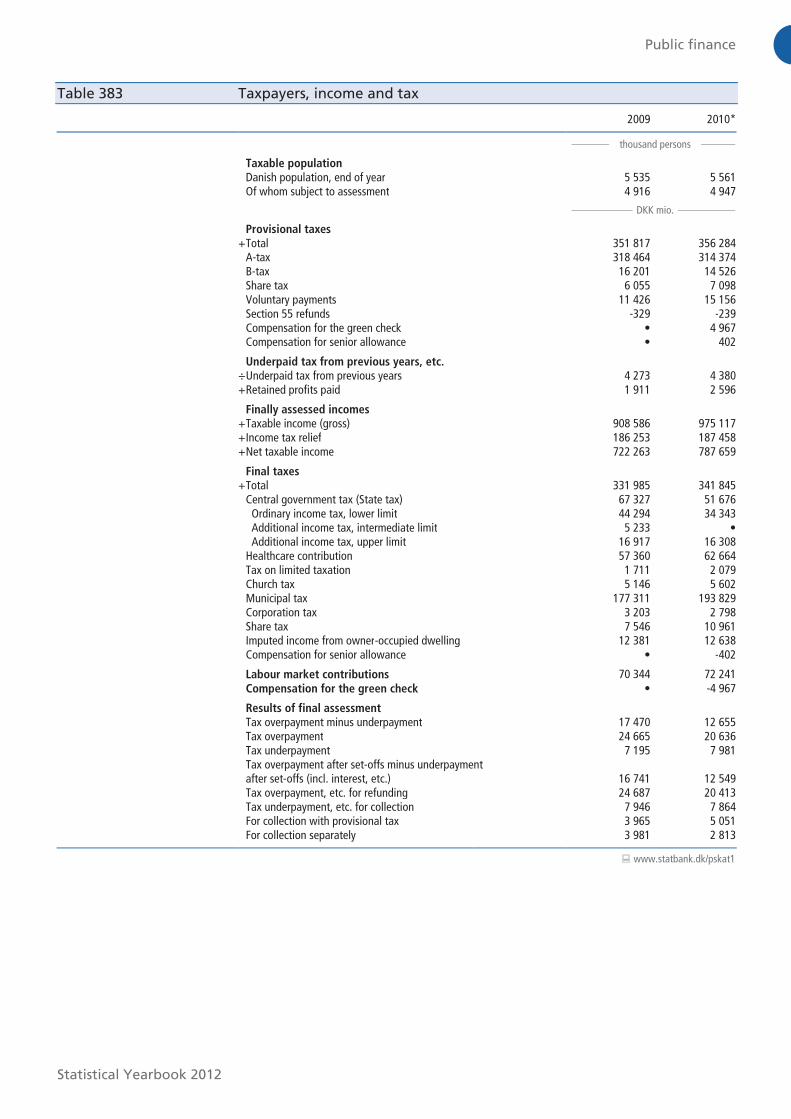
Table 383 Taxpayers, income and tax
2009 2010*
thousand persons
Taxable population
Danish population, end of year 5 535 5 561 Of whom subject to assessment 4 916 4 947
DKK mio.
Provisional taxes
+ Total 351 817 356 284 A-tax 318 464 314 374 B-tax 16 201 14 526 Share tax 6 055 7 098 Voluntary payments 11 426 15 156 Section 55 refunds -329 -239 Compensation for the green check • 4 967 Compensation for senior allowance • 402
Underpaid tax from previous years, etc.
÷ Underpaid tax from previous years 4 273 4 380 + Retained profits paid 1 911 2 596
Finally assessed incomes
+ Taxable income (gross) 908 586 975 117 + Income tax relief 186 253 187 458 + Net taxable income 722 263 787 659
Final taxes
+ Total 331 985 341 845 Central government tax (State tax) 67 327 51 676 Ordinary income tax, lower limit 44 294 34 343 Additional income tax, intermediate limit 5 233 • Additional income tax, upper limit 16 917 16 308 Healthcare contribution 57 360 62 664 Tax on limited taxation 1 711 2 079 Church tax 5 146 5 602 Municipal tax 177 311 193 829 Corporation tax 3 203 2 798 Share tax 7 546 10 961 Imputed income from owner-occupied dwelling 12 381 12 638 Compensation for senior allowance • -402
Labour market contributions 70 344 72 241 Compensation for the green check • -4 967
Results of final assessment
Tax overpayment minus underpayment 17 470 12 655 Tax overpayment 24 665 20 636 Tax underpayment 7 195 7 981 Tax overpayment after set-offs minus underpayment after set-offs (incl. interest, etc.) 16 741 12 549 Tax overpayment, etc. for refunding 24 687 20 413 Tax underpayment, etc. for collection 7 946 7 864 For collection with provisional tax 3 965 5 051 For collection separately 3 981 2 813
� www.statbank.dk/pskat1
Microsoft Word − Table 383.docx (X:100.0%, Y:100.0%) Created by Grafikhuset Publi PDF.

Public finance
Statistical Yearbook 2012
Table 384 (page 1 of 2) Local government taxation
Municipal tax rate
Church tax rate
Budgeted municipal income tax revenue
Municipal name 2011 2012 2011 2012 2011 2012 Increase
per cent DKK mio. per cent
All Denmark 24.92 24.92 0.89 0.89 200 952 204 818 1.9
Region Hovedstaden 24.26 24.25 0.71 0.72 67 096 68 998 2.8
101 Copenhagen 23.80 23.80 0.80 0.80 19 012 19 882 4.6 147 Frederiksberg 23.10 23.10 0.50 0.50 4 114 4 257 3.5
165 Albertslund 24.60 24.60 0.85 0.85 955 981 2.7 201 Allerød 25.30 25.30 0.58 0.58 1 136 1 177 3.6 151 Ballerup 25.50 25.50 0.75 0.75 1 896 1 949 2.8 400 Bornholm 25.90 25.90 0.93 0.93 1 373 1 404 2.2 153 Brøndby 24.50 24.50 0.80 0.80 1 202 1 226 2.0 155 Dragør 24.80 24.80 0.64 0.64 602 625 3.8 240 Egedal 25.70 25.70 0.76 0.76 1 751 1 805 3.1 210 Fredensborg 25.40 25.40 0.66 0.66 1 740 1 762 1.3 250 Frederikssund 25.90 25.90 0.96 0.96 1 722 1 772 2.9 190 Furesø1 26.00 26.00 0.65 0.65 1 896 1 941 2.4 157 Gentofte 22.80 22.80 0.44 0.44 4 039 4 165 3.1 159 Gladsaxe 24.10 24.10 0.75 0.75 2 482 2 556 3.0 161 Glostrup 24.20 24.20 0.66 0.67 825 855 3.6 270 Gribskov 24.50 24.50 0.94 0.94 1 448 1 478 2.0 260 Halsnæs 25.40 25.40 0.85 0.85 1 075 1 102 2.6 217 Helsingør 25.40 25.40 0.78 0.76 2 375 2 429 2.3 163 Herlev 23.70 23.70 0.77 0.77 987 1 007 2.0 219 Hillerød 25.60 25.60 0.69 0.69 1 943 2 005 3.2 167 Hvidovre 25.60 25.60 0.72 0.72 1 892 1 955 3.3 169 Høje-Taastrup 24.70 24.70 0.85 0.85 1 730 1 775 2.6 223 Hørsholm 23.50 23.50 0.59 0.62 1 384 1 347 -2.7 183 Ishøj 25.00 25.00 0.90 0.90 696 714 2.6 173 Lyngby-Taarbæk 23.70 23.70 0.63 0.63 2 476 2 498 0.9 230 Rudersdal 22.80 22.70 0.56 0.56 2 851 2 787 -2.2 175 Rødovre 25.70 25.70 0.72 0.72 1 409 1 455 3.2 185 Tårnby 23.50 23.50 0.61 0.61 1 455 1 508 3.7 187 Vallensbæk 25.10 25.10 0.64 0.68 630 582 -7.6
Region Sjælland 25.32 25.32 0.97 0.97 29 197 29 919 2.5
320 Faxe 26.10 26.10 1.08 1.08 1 254 1 271 1.4 253 Greve 23.90 23.90 0.73 0.73 1 872 1 910 2.0 376 Guldborgsund 25.80 25.80 1.17 1.17 2 065 2 121 2.7 316 Holbæk 25.10 25.10 0.96 0.96 2 396 2 468 3.0 326 Kalundborg 25.30 25.30 1.01 1.01 1 683 1 726 2.6 259 Køge 24.90 24.90 0.87 0.87 2 052 2 095 2.1 350 Lejre 25.40 25.40 1.06 1.06 1 050 1 080 2.8 360 Lolland 26.70 26.70 1.23 1.23 1 579 1 617 2.4 370 Næstved 25.00 25.00 0.98 0.98 2 777 2 842 2.3 306 Odsherred 26.60 26.60 0.98 0.98 1 141 1 164 2.0 329 Ringsted 26.70 26.70 0.99 0.99 1 213 1 246 2.7 265 Roskilde 25.20 25.20 0.84 0.84 3 339 3 438 2.9 330 Slagelse 24.70 24.70 0.96 0.96 2 544 2 631 3.4 269 Solrød 24.80 24.80 0.90 0.90 867 882 1.8 340 Sorø 26.40 26.40 0.95 0.95 1 069 1 110 3.8 336 Stevns 25.00 25.00 1.10 1.10 783 775 -1.0 390 Vordingborg 25.20 25.20 1.02 1.02 1 513 1 546 2.2
Region Syddanmark 25.27 25.27 0.92 0.92 41 342 41 877 1.3
420 Assens 26.10 26.10 0.99 0.97 1 419 1 453 2.4 530 Billund 25.20 25.20 0.89 0.89 930 921 -1.0 561 Esbjerg 25.40 25.40 0.81 0.81 4 107 4 150 1.0
1 There are special conditions applying to the municipality of Furesø. The tax rate of Farum is 27.20, while the tax rate of Værløse is 24.90.
� www.statbank.dk/pskat
Microsoft Word − Table 384.docx (X:100.0%, Y:100.0%) Created by Grafikhuset Publi PDF.

Public finance
Statistical Yearbook 2012
Table 384 (page 2 of 2) Local government taxation
Municipal tax rate
Church tax rate
Budgeted municipal income tax revenue
Municipal name 2011 2012 2011 2012 2011 2012 Increase
per cent DKK mio. per cent
563 Fanø 24.30 24.30 1.14 1.14 117 117 0.4 607 Fredericia 25.50 25.50 0.88 0.88 1 827 1 855 1.6 430 Faaborg-Midtfyn 26.10 26.10 1.05 1.05 1 779 1 798 1.1 510 Haderslev 26.50 26.50 0.95 0.95 2 013 2 014 0.0 440 Kerteminde 26.10 26.10 1.00 1.00 837 859 2.7 621 Kolding 25.00 25.00 0.94 0.94 3 157 3 165 0.3 482 Langeland 27.80 27.80 1.16 1.15 479 481 0.5 410 Middelfart 25.80 25.80 0.95 0.95 1 363 1 377 1.1 480 Nordfyns 26.10 26.10 1.04 1.04 986 1 007 2.1 450 Nyborg 26.40 26.40 1.15 1.15 1 121 1 154 2.9 461 Odense 24.50 24.50 0.68 0.68 6 230 6 487 4.1 479 Svendborg 26.80 26.80 1.06 1.06 2 077 2 107 1.4 540 Sønderborg 25.20 25.20 0.93 0.93 2 657 2 694 1.4 550 Tønder 25.30 25.30 1.20 1.20 1 307 1 292 -1.2 573 Varde 25.10 25.10 1.02 1.02 1 697 1 716 1.1 575 Vejen 25.20 25.20 1.06 1.06 1 396 1 364 -2.3 630 Vejle 23.40 23.40 0.91 0.91 3 579 3 609 0.8 492 Ærø 26.10 26.10 1.10 1.10 220 224 1.9 580 Aabenraa 25.40 25.40 0.95 0.95 2 044 2 032 -0.6
Region Midtjylland 25.09 25.10 0.94 0.94 43 516 44 038 1.2
710 Favrskov 25.70 25.70 1.03 1.03 1 635 1 659 1.5 766 Hedensted 25.40 25.40 1.08 1.08 1 583 1 575 -0.5 657 Herning 24.90 24.90 0.99 0.99 2 869 2 896 0.9 661 Holstebro 25.30 25.30 1.08 1.08 1 991 1 983 -0.4 615 Horsens 25.20 25.20 0.89 0.89 2 748 2 810 2.2 756 Ikast-Brande 25.10 25.10 1.00 1.00 1 349 1 339 -0.7 665 Lemvig 24.80 25.20 1.27 1.27 751 743 -1.0 707 Norddjurs 24.60 25.10 1.00 1.00 1 215 1 242 2.2 727 Odder 25.10 25.10 1.00 1.00 748 764 2.0 730 Randers 25.60 25.60 0.89 0.89 3 249 3 303 1.7 760 Ringkøbing-Skjern 24.70 24.70 1.05 1.05 1 987 1 983 -0.2 741 Samsø 26.00 26.00 1.50 1.50 134 137 2.0 740 Silkeborg 25.50 25.50 0.95 0.95 3 176 3 217 1.3 746 Skanderborg 25.70 25.70 0.86 0.86 2 116 2 160 2.1 779 Skive 25.50 25.50 1.00 1.00 1 651 1 652 0.1 671 Struer 24.90 24.90 1.20 1.20 775 758 -2.1 706 Syddjurs 25.40 25.30 1.00 1.00 1 427 1 421 -0.5 791 Viborg 25.80 25.80 0.95 0.95 3 325 3 373 1.4 751 Aarhus 24.40 24.40 0.79 0.79 10 788 11 025 2.2
Region Nordjylland 25.58 25.62 1.10 1.10 19 800 19 987 0.9
810 Brønderslev 26.90 26.90 1.10 1.10 1 201 1 222 1.7 813 Frederikshavn 25.20 25.60 1.03 1.03 2 109 2 148 1.8 860 Hjørring 25.40 25.40 1.19 1.19 2 229 2 211 -0.8 849 Jammerbugt 25.30 25.30 1.20 1.20 1 257 1 276 1.5 825 Læsø 25.60 25.60 1.30 1.30 61 61 0.7 846 Mariagerfjord 25.70 25.70 1.15 1.15 1 441 1 459 1.3 773 Morsø 25.30 25.30 1.20 1.20 723 711 -1.6 840 Rebild 25.10 25.10 1.20 1.20 987 993 0.6 787 Thisted 25.50 25.50 1.28 1.28 1 530 1 492 -2.4 820 Vesthimmerland 27.20 27.20 1.18 1.18 1 320 1 303 -1.3 851 Aalborg 25.40 25.40 0.98 0.98 6 943 7 110 2.4
Microsoft Word − Table 384.docx (X:100.0%, Y:100.0%) Created by Grafikhuset Publi PDF.
Public finance
Statistical Yearbook 2012
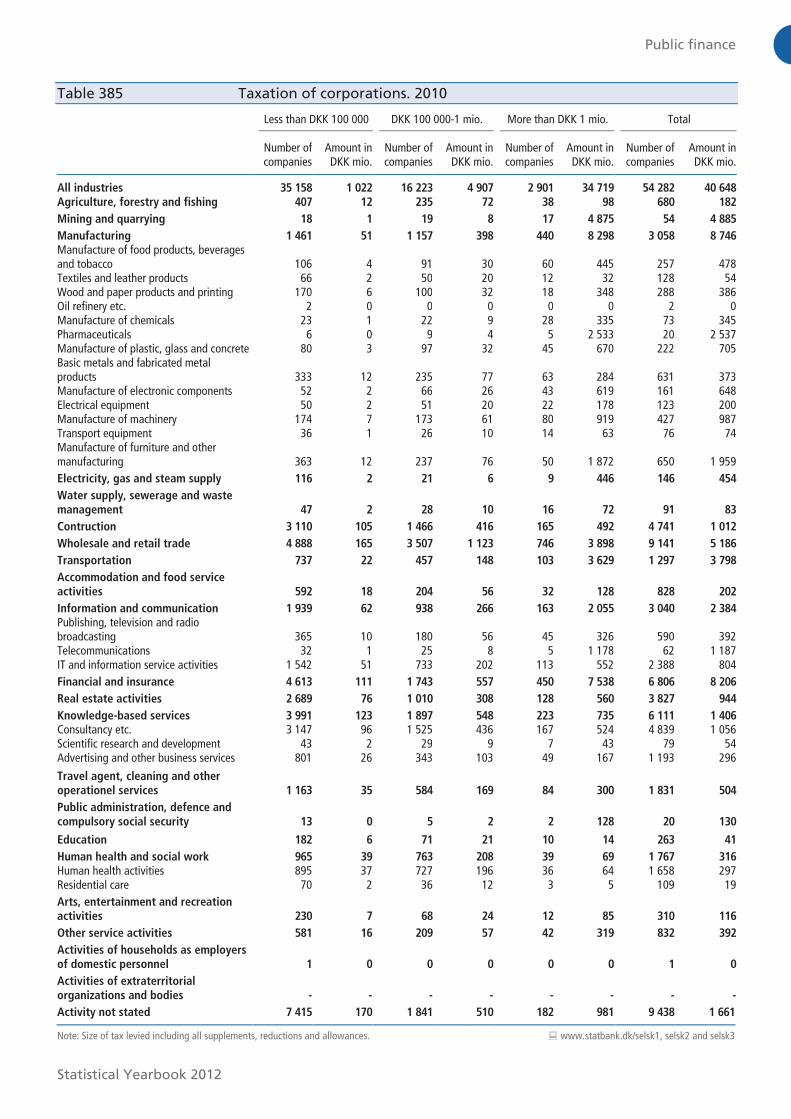
Table 385 Taxation of corporations. 2010
Less than DKK 100 000 DKK 100 000-1 mio. More than DKK 1 mio. Total
Number of companies
Amount in DKK mio.
Number of companies
Amount in DKK mio.
Number of companies
Amount in DKK mio.
Number of companies
Amount in DKK mio.
All industries 35 158 1 022 16 223 4 907 2 901 34 719 54 282 40 648
Agriculture, forestry and fishing 407 12 235 72 38 98 680 182
Mining and quarrying 18 1 19 8 17 4 875 54 4 885
Manufacturing 1 461 51 1 157 398 440 8 298 3 058 8 746
Manufacture of food products, beverages and tobacco 106 4 91 30 60 445 257 478 Textiles and leather products 66 2 50 20 12 32 128 54 Wood and paper products and printing 170 6 100 32 18 348 288 386 Oil refinery etc. 2 0 0 0 0 0 2 0 Manufacture of chemicals 23 1 22 9 28 335 73 345 Pharmaceuticals 6 0 9 4 5 2 533 20 2 537 Manufacture of plastic, glass and concrete 80 3 97 32 45 670 222 705 Basic metals and fabricated metal products 333 12 235 77 63 284 631 373 Manufacture of electronic components 52 2 66 26 43 619 161 648 Electrical equipment 50 2 51 20 22 178 123 200 Manufacture of machinery 174 7 173 61 80 919 427 987 Transport equipment 36 1 26 10 14 63 76 74 Manufacture of furniture and other manufacturing 363 12 237 76 50 1 872 650 1 959
Electricity, gas and steam supply 116 2 21 6 9 446 146 454
Water supply, sewerage and waste
management 47 2 28 10 16 72 91 83
Contruction 3 110 105 1 466 416 165 492 4 741 1 012
Wholesale and retail trade 4 888 165 3 507 1 123 746 3 898 9 141 5 186
Transportation 737 22 457 148 103 3 629 1 297 3 798
Accommodation and food service
activities 592 18 204 56 32 128 828 202
Information and communication 1 939 62 938 266 163 2 055 3 040 2 384
Publishing, television and radio broadcasting 365 10 180 56 45 326 590 392 Telecommunications 32 1 25 8 5 1 178 62 1 187 IT and information service activities 1 542 51 733 202 113 552 2 388 804
Financial and insurance 4 613 111 1 743 557 450 7 538 6 806 8 206
Real estate activities 2 689 76 1 010 308 128 560 3 827 944
Knowledge-based services 3 991 123 1 897 548 223 735 6 111 1 406
Consultancy etc. 3 147 96 1 525 436 167 524 4 839 1 056 Scientific research and development 43 2 29 9 7 43 79 54 Advertising and other business services 801 26 343 103 49 167 1 193 296
Travel agent, cleaning and other
operationel services 1 163 35 584 169 84 300 1 831 504
Public administration, defence and
compulsory social security 13 0 5 2 2 128 20 130
Education 182 6 71 21 10 14 263 41
Human health and social work 965 39 763 208 39 69 1 767 316
Human health activities 895 37 727 196 36 64 1 658 297 Residential care 70 2 36 12 3 5 109 19
Arts, entertainment and recreation
activities 230 7 68 24 12 85 310 116
Other service activities 581 16 209 57 42 319 832 392
Activities of households as employers
of domestic personnel 1 0 0 0 0 0 1 0
Activities of extraterritorial
organizations and bodies - - - - - - - -
Activity not stated 7 415 170 1 841 510 182 981 9 438 1 661
Note: Size of tax levied including all supplements, reductions and allowances. � www.statbank.dk/selsk1, selsk2 and selsk3
Microsoft Word − Table 385.docx (X:100.0%, Y:100.0%) Created by Grafikhuset Publi PDF.
Public finance
Statistical Yearbook 2012
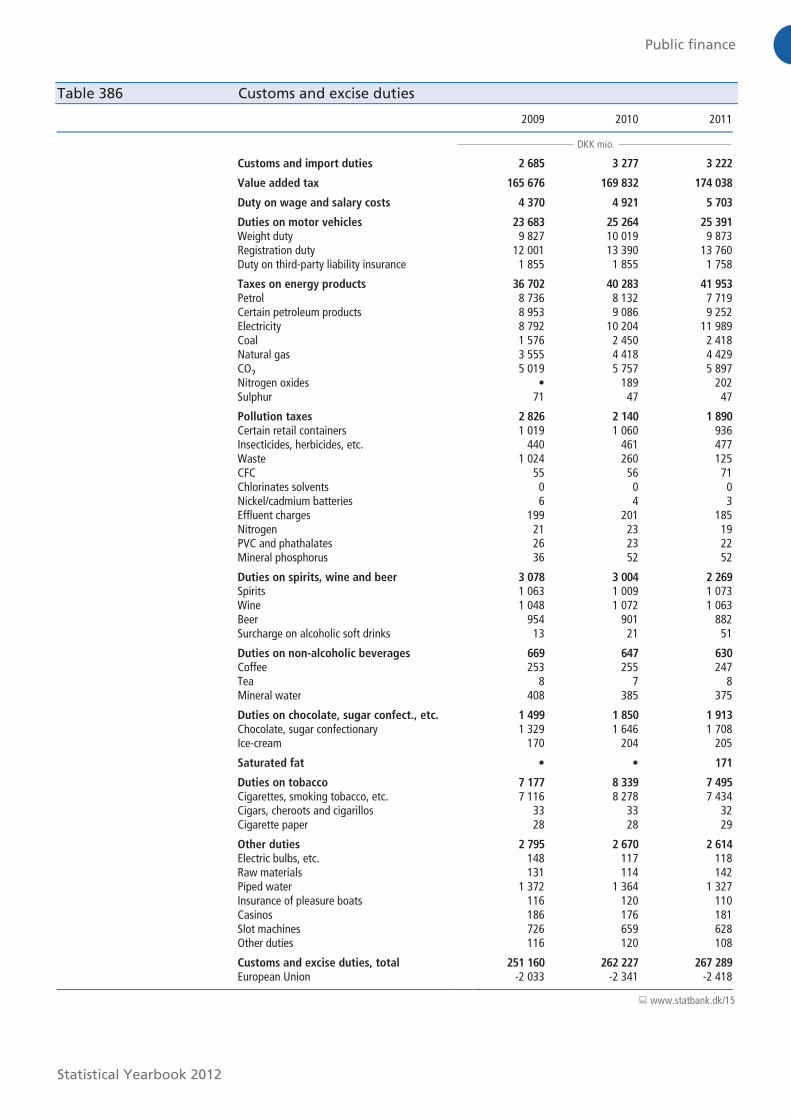
Table 386 Customs and excise duties
2009 2010 2011
DKK mio.
Customs and import duties 2 685 3 277 3 222
Value added tax 165 676 169 832 174 038
Duty on wage and salary costs 4 370 4 921 5 703
Duties on motor vehicles 23 683 25 264 25 391
Weight duty 9 827 10 019 9 873 Registration duty 12 001 13 390 13 760 Duty on third-party liability insurance 1 855 1 855 1 758
Taxes on energy products 36 702 40 283 41 953
Petrol 8 736 8 132 7 719 Certain petroleum products 8 953 9 086 9 252 Electricity 8 792 10 204 11 989 Coal 1 576 2 450 2 418 Natural gas 3 555 4 418 4 429 CO2 5 019 5 757 5 897 Nitrogen oxides • 189 202 Sulphur 71 47 47
Pollution taxes 2 826 2 140 1 890
Certain retail containers 1 019 1 060 936 Insecticides, herbicides, etc. 440 461 477 Waste 1 024 260 125 CFC 55 56 71 Chlorinates solvents 0 0 0 Nickel/cadmium batteries 6 4 3 Effluent charges 199 201 185 Nitrogen 21 23 19 PVC and phathalates 26 23 22 Mineral phosphorus 36 52 52
Duties on spirits, wine and beer 3 078 3 004 2 269
Spirits 1 063 1 009 1 073 Wine 1 048 1 072 1 063 Beer 954 901 882 Surcharge on alcoholic soft drinks 13 21 51
Duties on non-alcoholic beverages 669 647 630
Coffee 253 255 247 Tea 8 7 8 Mineral water 408 385 375
Duties on chocolate, sugar confect., etc. 1 499 1 850 1 913
Chocolate, sugar confectionary 1 329 1 646 1 708 Ice-cream 170 204 205
Saturated fat • • 171
Duties on tobacco 7 177 8 339 7 495
Cigarettes, smoking tobacco, etc. 7 116 8 278 7 434 Cigars, cheroots and cigarillos 33 33 32 Cigarette paper 28 28 29
Other duties 2 795 2 670 2 614
Electric bulbs, etc. 148 117 118 Raw materials 131 114 142 Piped water 1 372 1 364 1 327 Insurance of pleasure boats 116 120 110 Casinos 186 176 181 Slot machines 726 659 628 Other duties 116 120 108
Customs and excise duties, total 251 160 262 227 267 289
European Union -2 033 -2 341 -2 418
� www.statbank.dk/15
Microsoft Word − Table 386.docx (X:100.0%, Y:100.0%) Created by Grafikhuset Publi PDF.
Public finance
Statistical Yearbook 2012
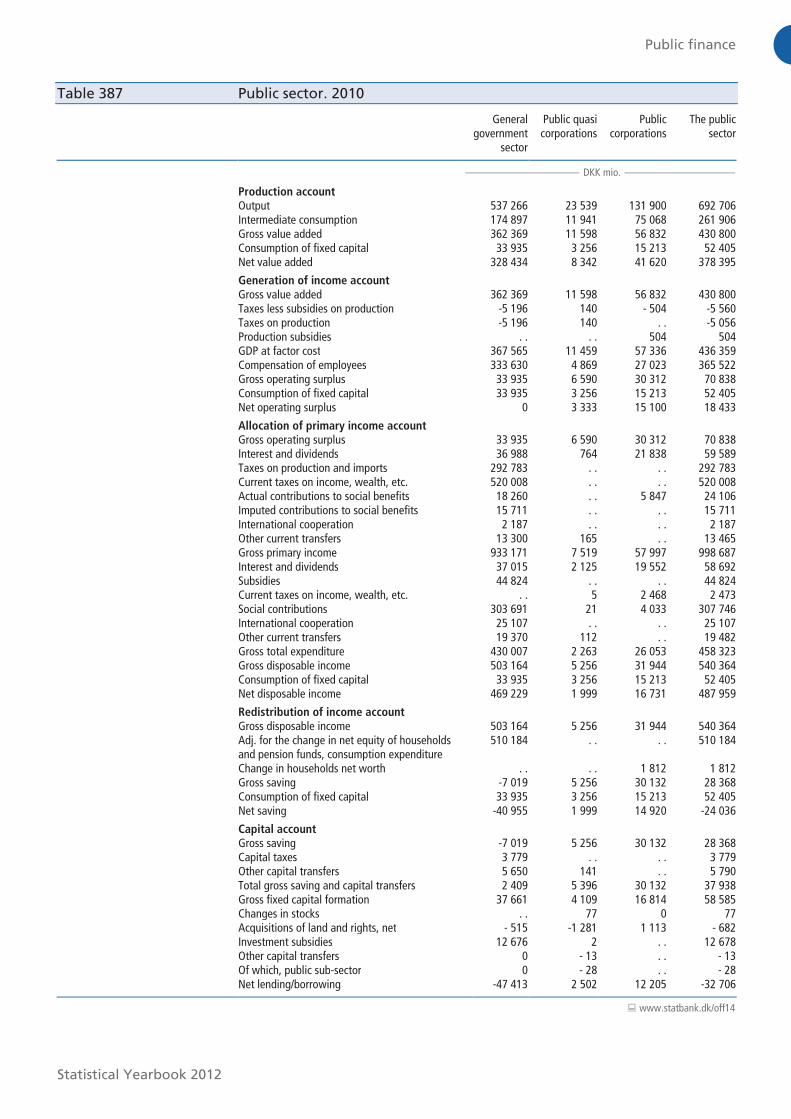
Table 387 Public sector. 2010
General government
sector
Public quasi corporations
Public corporations
The public sector
DKK mio.
Production account
Output 537 266 23 539 131 900 692 706 Intermediate consumption 174 897 11 941 75 068 261 906 Gross value added 362 369 11 598 56 832 430 800 Consumption of fixed capital 33 935 3 256 15 213 52 405 Net value added 328 434 8 342 41 620 378 395
Generation of income account
Gross value added 362 369 11 598 56 832 430 800 Taxes less subsidies on production -5 196 140 - 504 -5 560 Taxes on production -5 196 140 . . -5 056 Production subsidies . . . . 504 504 GDP at factor cost 367 565 11 459 57 336 436 359 Compensation of employees 333 630 4 869 27 023 365 522 Gross operating surplus 33 935 6 590 30 312 70 838 Consumption of fixed capital 33 935 3 256 15 213 52 405 Net operating surplus 0 3 333 15 100 18 433
Allocation of primary income account
Gross operating surplus 33 935 6 590 30 312 70 838 Interest and dividends 36 988 764 21 838 59 589 Taxes on production and imports 292 783 . . . . 292 783 Current taxes on income, wealth, etc. 520 008 . . . . 520 008 Actual contributions to social benefits 18 260 . . 5 847 24 106 Imputed contributions to social benefits 15 711 . . . . 15 711 International cooperation 2 187 . . . . 2 187 Other current transfers 13 300 165 . . 13 465 Gross primary income 933 171 7 519 57 997 998 687 Interest and dividends 37 015 2 125 19 552 58 692 Subsidies 44 824 . . . . 44 824 Current taxes on income, wealth, etc. . . 5 2 468 2 473 Social contributions 303 691 21 4 033 307 746 International cooperation 25 107 . . . . 25 107 Other current transfers 19 370 112 . . 19 482 Gross total expenditure 430 007 2 263 26 053 458 323 Gross disposable income 503 164 5 256 31 944 540 364 Consumption of fixed capital 33 935 3 256 15 213 52 405 Net disposable income 469 229 1 999 16 731 487 959
Redistribution of income account
Gross disposable income 503 164 5 256 31 944 540 364 Adj. for the change in net equity of households
and pension funds, consumption expenditure 510 184 . . . . 510 184
Change in households net worth . . . . 1 812 1 812 Gross saving -7 019 5 256 30 132 28 368 Consumption of fixed capital 33 935 3 256 15 213 52 405 Net saving -40 955 1 999 14 920 -24 036
Capital account
Gross saving -7 019 5 256 30 132 28 368 Capital taxes 3 779 . . . . 3 779 Other capital transfers 5 650 141 . . 5 790 Total gross saving and capital transfers 2 409 5 396 30 132 37 938 Gross fixed capital formation 37 661 4 109 16 814 58 585 Changes in stocks . . 77 0 77 Acquisitions of land and rights, net - 515 -1 281 1 113 - 682 Investment subsidies 12 676 2 . . 12 678 Other capital transfers 0 - 13 . . - 13 Of which, public sub-sector 0 - 28 . . - 28 Net lending/borrowing -47 413 2 502 12 205 -32 706
� www.statbank.dk/off14
Microsoft Word − Table 387.docx (X:100.0%, Y:100.0%) Created by Grafikhuset Publi PDF.

Public finance
Statistical Yearbook 2012
Table 388 Expenditure and revenue of general government
2009* 2010* 2011*
DKK mio.
Current outlays, total 922 402 961 144 970 168
Compensation of employees 322 188 333 630 330 684 Intermediate consumption 170 597 174 897 176 841 Other taxes on production and
other subsidies on production, net
-4 159
-5 196
-4 874 Social benefits in kind 27 116 27 806 27 474 Real interest, etc. 36 728 37 015 37 476 Subsidies 43 304 44 824 46 503 Other current transfers 326 629 348 168 356 064
Current revenue, total 911 313 954 124 981 101
Sales of goods and services 51 890 54 888 53 526 Income on wealth, earned income, etc. 39 408 36 987 39 675 Taxes on production and import 279 815 292 783 301 594 Current taxes on income, wealth, etc. 494 932 520 008 534 753 Social security contributions 32 062 33 971 35 198 Other current transfers 13 204 15 487 16 355
Capital outlays, total 42 827 49 823 61 355
Non-financial capital accumulation 34 646 37 147 38 114 Capital transfers 8 181 12 676 23 241
Capital revenue, total 8 062 9 429 15 681
Capital taxes 3 697 3 779 4 694 Other capital transfers 4 365 5 650 10 986
Current surplus (gross saving) -11 090 -7 019 10 932
Overall surplus (net lending) -45 854 -47 413 -34 742
� www.statbank.dk/off3 and off16
Table 389 Expenditure and revenue of general government by sub-sector. 2011*
Central government
Social security funds
Local government
General government1
DKK mio.
Current outlays, total 733 269 58 886 634 264 970 168
Compensation of employees 93 479 2 321 234 883 330 684 Intermediate consumption 62 268 574 113 999 176 841 Other taxes on production and other subsidies on production, net 811 1 -5 686 -4 874 Social benefits in kind 494 - 26 980 27 474 Real interest, etc. 34 456 1 3 019 37 476 Subsidies 23 169 - 23 334 46 503 Other current transfers 518 591 55 988 237 735 356 064
Current revenue, total 714 668 62 491 660 191 981 101
Sales of goods and services 22 223 9 31 294 53 526 Income on wealth, earned income, etc. 35 353 73 4 249 39 675 Taxes on production and import 276 279 - 25 315 301 594 Current taxes on income, wealth, etc. 329 900 - 204 853 534 753 Social security contributions 7 176 18 008 10 015 35 198 Other current transfers 43 737 44 401 384 466 16 355
Capital outlays, total 31 394 2 682 27 365 61 355
Non-financial capital accumulation 12 624 7 25 482 38 114 Capital transfers 18 770 2 675 1 882 23 241
Capital revenue, total 13 622 - 2 144 15 681
Capital taxes 4 694 - - 4 694 Other capital transfers 8 928 - 2 144 10 986
Current surplus (gross saving) -18 600 3 605 25 928 10 932
Overall surplus (net lending) -36 372 923 707 -34 742
1 Consolidated, i.e. excluding internal general government transfers. � www.statbank.dk/off3
Microsoft Word − Table 388.docx (X:100.0%, Y:100.0%) Created by Grafikhuset Publi PDF.
Public finance
Statistical Yearbook 2012
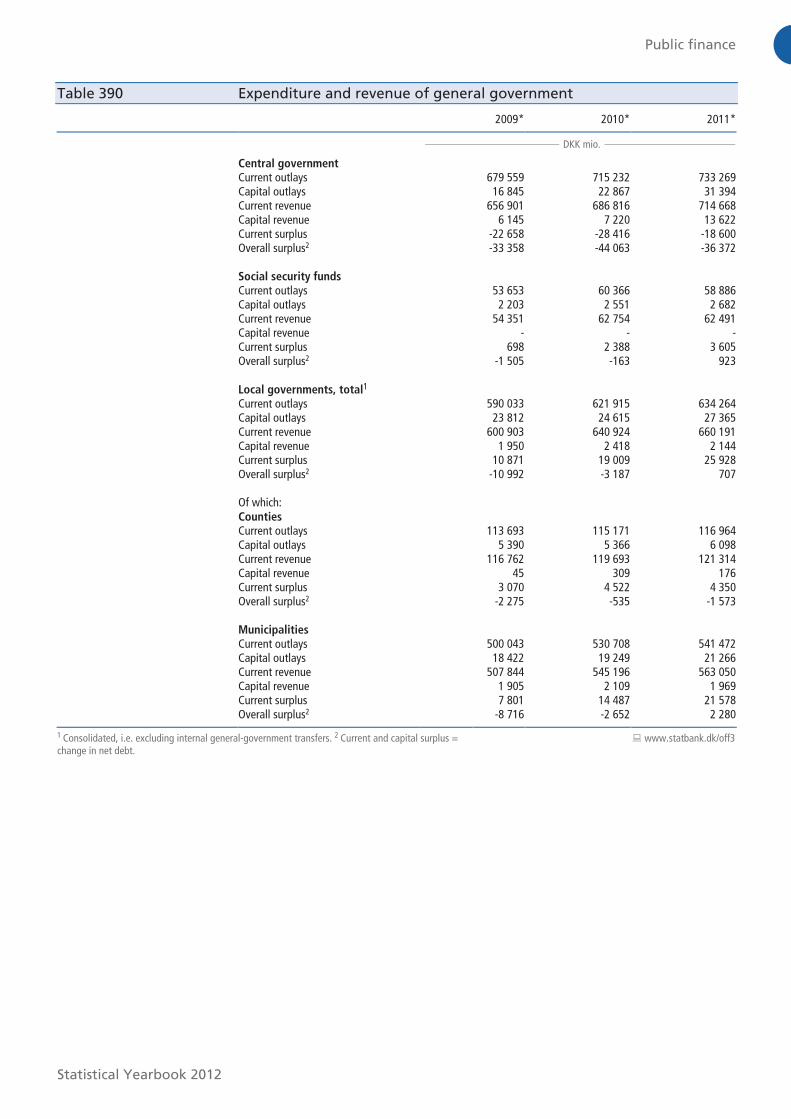
Table 390 Expenditure and revenue of general government
2009* 2010* 2011*
DKK mio.
Central government Current outlays 679 559 715 232 733 269 Capital outlays 16 845 22 867 31 394 Current revenue 656 901 686 816 714 668 Capital revenue 6 145 7 220 13 622 Current surplus -22 658 -28 416 -18 600 Overall surplus2 -33 358 -44 063 -36 372 Social security funds Current outlays 53 653 60 366 58 886 Capital outlays 2 203 2 551 2 682 Current revenue 54 351 62 754 62 491 Capital revenue - - - Current surplus 698 2 388 3 605 Overall surplus2 -1 505 -163 923 Local governments, total1 Current outlays 590 033 621 915 634 264 Capital outlays 23 812 24 615 27 365 Current revenue 600 903 640 924 660 191 Capital revenue 1 950 2 418 2 144 Current surplus 10 871 19 009 25 928 Overall surplus2 -10 992 -3 187 707 Of which: Counties Current outlays 113 693 115 171 116 964 Capital outlays 5 390 5 366 6 098 Current revenue 116 762 119 693 121 314 Capital revenue 45 309 176 Current surplus 3 070 4 522 4 350 Overall surplus2 -2 275 -535 -1 573 Municipalities Current outlays 500 043 530 708 541 472 Capital outlays 18 422 19 249 21 266 Current revenue 507 844 545 196 563 050 Capital revenue 1 905 2 109 1 969 Current surplus 7 801 14 487 21 578 Overall surplus2 -8 716 -2 652 2 280
1 Consolidated, i.e. excluding internal general-government transfers. 2 Current and capital surplus = change in net debt.
� www.statbank.dk/off3
Microsoft Word − Table 390.docx (X:100.0%, Y:100.0%) Created by Grafikhuset Publi PDF.

Public finance
Statistical Yearbook 2012
Table 391 Expenditure of general government sector by type of transaction
2009* 2010* 2011*
mio. kr.
Total outlays 965 229 1 010 967 1 031 523
Current outlays, total 922 402 961 144 970 168
Compensation of employees 322 188 333 630 330 684
Intermediate consumption 170 597 174 897 176 841
Other taxes on production and other
subsidies on production, net -4 159 -5 196 -4 874
Social benefits in kind 27 116 27 806 27 474
Income transfers, total 406 660 430 007 440 044
Interest, etc. 36 728 37 015 37 476
+Subsidies 43 304 44 824 46 503 To public quasi-corporations 13 372 13 791 13 463 To other corporations 29 932 31 033 33 040
+Other income transfers 326 629 348 168 356 064 To other levels of government - - -
To households 283 643 303 691 311 643
To NPIHs1 6 254 6 550 6 456
To the rest of the world (a-d) 36 732 37 926 37 966 a. To the Faroe Islands, net 753 733 744 b. To Greenland, net 3 734 3 691 3 834 c. To the EU 16 780 15 945 16 392 d. To others 15 465 17 556 16 996
Capital outlays, total 42 827 49 823 61 355
Non-financial capital accumulation, total 34 646 37 147 38 114
Acquisition of new fixed assets 34 190 37 340 39 624 +Acquisition of buildings, and other
existing investments, net -305 321 -1 389 +Changes in inventories - - -
+Acquisition of land and intangible assets, net 762 -515 -121
Capital transfers, total 8 181 12 676 23 241
Investment grants and
capital transfers 8 181 12 676 23 241
To public quasi-corporations 589 1 825 2 726 To other enterprises 2 145 2 451 14 644 To other levels of government - - -
To households 4 344 7 974 5 457 To NPIHs1 223 339 287
To the rest of the world (a-d) 880 86 126
a. To the Faroe Islands, net 3 8 0
b. To Greenland, net 25 25 25
c. To the EU 778 - - d. To others 74 53 101
1 To non-profit institutions (households). � www.statbank.dk/off3 and off16
Microsoft Word − Table 391.docx (X:100.0%, Y:100.0%) Created by Grafikhuset Publi PDF.
Public finance
Statistical Yearbook 2012
Table 392 Revenue of general government sector, by type of transaction
2009* 2010* 2011*
DKK mio.
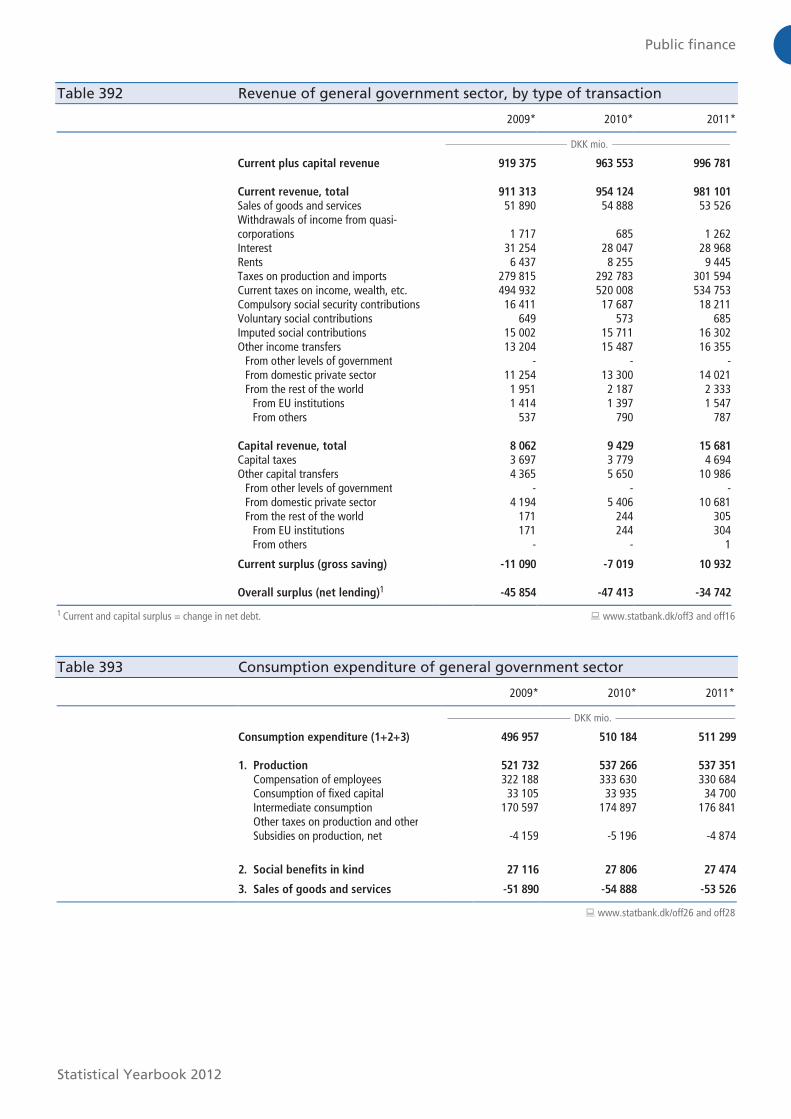
Current plus capital revenue 919 375 963 553 996 781
Current revenue, total 911 313 954 124 981 101
Sales of goods and services 51 890 54 888 53 526 Withdrawals of income from quasi-
corporations 1 717 685 1 262 Interest 31 254 28 047 28 968 Rents 6 437 8 255 9 445 Taxes on production and imports 279 815 292 783 301 594 Current taxes on income, wealth, etc. 494 932 520 008 534 753 Compulsory social security contributions 16 411 17 687 18 211 Voluntary social contributions 649 573 685 Imputed social contributions 15 002 15 711 16 302 Other income transfers 13 204 15 487 16 355 From other levels of government - - - From domestic private sector 11 254 13 300 14 021 From the rest of the world 1 951 2 187 2 333 From EU institutions 1 414 1 397 1 547 From others 537 790 787 Capital revenue, total 8 062 9 429 15 681
Capital taxes 3 697 3 779 4 694 Other capital transfers 4 365 5 650 10 986 From other levels of government - - - From domestic private sector 4 194 5 406 10 681 From the rest of the world 171 244 305 From EU institutions 171 244 304 From others - - 1
Current surplus (gross saving) -11 090 -7 019 10 932
Overall surplus (net lending)1 -45 854 -47 413 -34 742
1 Current and capital surplus = change in net debt. � www.statbank.dk/off3 and off16
Table 393 Consumption expenditure of general government sector
2009* 2010* 2011*
DKK mio.
Consumption expenditure (1+2+3) 496 957 510 184 511 299
1. Production 521 732 537 266 537 351
Compensation of employees 322 188 333 630 330 684 Consumption of fixed capital 33 105 33 935 34 700 Intermediate consumption 170 597 174 897 176 841 Other taxes on production and other Subsidies on production, net -4 159 -5 196 -4 874
2. Social benefits in kind 27 116 27 806 27 474
3. Sales of goods and services -51 890 -54 888 -53 526
� www.statbank.dk/off26 and off28
Microsoft Word − Table 392.docx (X:100.0%, Y:100.0%) Created by Grafikhuset Publi PDF.
Public finance
Statistical Yearbook 2012
Table 394 Expenditure of general government sector by function
Expenditure 2009 2010 2011
DKK mio.
Total 965 229 1 010 967 1 031 523
1. General public services 128 470 134 906 144 466
1.1 Executive and legislative organs, financial and fiscal affairs, external affairs 29 444 32 407 39 200 1.2 Foreign economic aid 16 946 18 953 18 041 1.3 General services 4 615 5 011 4 526 1.4 Basic research and R&D general public services 14 814 15 398 16 009 1.5 General public services etc. 22 049 22 196 21 936 1.6 Public debt transactions and transfers of a general character between different levels of government
40 601 40 940 44 752
2. Defence 24 585 25 278 24 789
2.1 Military defence etc. 23 626 24 320 23 871 2.2 Civil defence 959 958 918 3. Public order and safety 19 501 19 456 20 358
3.1 Police services 10 331 10 590 10 716 3.2 Fire protection services 1 675 1 763 1 757 3.3 Law courts 3 980 3 666 4 153 3.4 Prisons 3 197 3 121 3 390 3.5 Public order and safety etc. 318 316 343 4. Economic affairs 53 622 58 404 61 515
4.1 General economic, commercial and labour affairs 16 657 17 302 17 708 4.2 Agriculture, forestry, fishing and hunting 2 738 1 729 2 414 4.3 Fuel and energy 29 520 580 4.4 Mining, manufacturing and construction 111 156 136 4.5 Transport, communication, other industries 32 167 36 952 38 089 4.6 R&D Economic affairs 564 462 1 579 4.7 Economic affairs etc. 1 357 1 282 1 009 5. Environmental protection 8 463 8 312 8 406
5.1 Waste and waste water management, pollution abatement 1 846 1 623 1 641 5.2 Protection of biodiversity and landscape 1 914 1 673 2 478 5.3 Environmental protection etc. 4 703 5 017 4 288 6. Housing and community amenities 9 988 6 425 6 404
6.1 Housing development 8 283 5 929 5 891 6.2 Housing and community amenities etc. 1 705 495 513 7. Health 143 638 146 211 148 856
7.1 Medical products, appliances and equipment 8 793 8 868 8 417 7.2 Outpatient services 22 858 23 571 24 207 7.3 Hospital services 107 160 108 851 110 901 7.4 R&D Health 36 236 261 7.5 Health etc. 4 792 4 684 5 070 8. Recreation, culture and religion 28 711 28 244 28 151
8.1 Recreational and sporting services 8 152 7 658 7 459 8.2 Cultural services 11 811 11 909 11 936 8.3 Religious and other community services 7 813 7 761 7 973 8.4 Recreation, culture and religion etc. 935 916 783 9. Education 130 958 139 699 138 600
9.1 Primary education 66 322 68 947 69 323 9.2 Youth-level education 27 003 30 987 30 860 9.3 Higher education 23 903 25 443 26 909 9.4 Adult and supplementary education 9 256 9 582 7 099 9.5 Education etc. 4 473 4 740 4 410 10. Social protection 417 293 444 032 449 979
10.1 Sickness and disability 100 832 104 999 104 238 10.2 Old age 127 940 135 880 143 372 10.3 Family and children 93 705 96 337 93 970 10.4 Unemployment 50 501 59 918 59 515 10.5 Housing 11 630 12 224 12 741 10.6 Social exclusion n.e.c. 22 280 24 332 25 909 10.7 Social protection etc. 10 406 10 340 10 232
� www.statbank.dk/off23 and off23b
Microsoft Word − Table 394.docx (X:100.0%, Y:100.0%) Created by Grafikhuset Publi PDF.
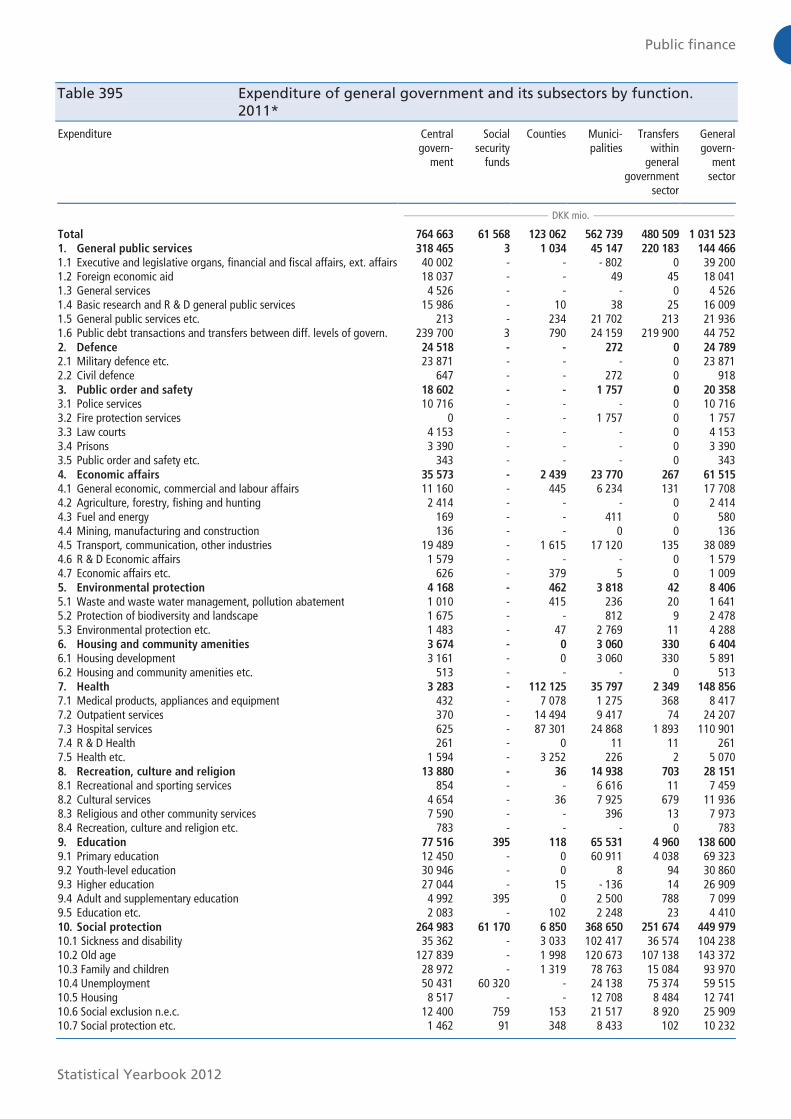
Public finance
Statistical Yearbook 2012
Table 395 Expenditure of general government and its subsectors by function.
2011*
Expenditure Central govern-
ment
Social security
funds
Counties Munici- palities
Transfers within
general government
sector
General govern-
ment sector
DKK mio.
Total 764 663 61 568 123 062 562 739 480 509 1 031 523 1. General public services 318 465 3 1 034 45 147 220 183 144 466 1.1 Executive and legislative organs, financial and fiscal affairs, ext. affairs 40 002 - - - 802 0 39 200 1.2 Foreign economic aid 18 037 - - 49 45 18 041 1.3 General services 4 526 - - - 0 4 526 1.4 Basic research and R & D general public services 15 986 - 10 38 25 16 009 1.5 General public services etc. 213 - 234 21 702 213 21 936 1.6 Public debt transactions and transfers between diff. levels of govern. 239 700 3 790 24 159 219 900 44 752 2. Defence 24 518 - - 272 0 24 789 2.1 Military defence etc. 23 871 - - - 0 23 871 2.2 Civil defence 647 - - 272 0 918 3. Public order and safety 18 602 - - 1 757 0 20 358 3.1 Police services 10 716 - - - 0 10 716 3.2 Fire protection services 0 - - 1 757 0 1 757 3.3 Law courts 4 153 - - - 0 4 153 3.4 Prisons 3 390 - - - 0 3 390 3.5 Public order and safety etc. 343 - - - 0 343 4. Economic affairs 35 573 - 2 439 23 770 267 61 515 4.1 General economic, commercial and labour affairs 11 160 - 445 6 234 131 17 708 4.2 Agriculture, forestry, fishing and hunting 2 414 - - - 0 2 414 4.3 Fuel and energy 169 - - 411 0 580 4.4 Mining, manufacturing and construction 136 - - 0 0 136 4.5 Transport, communication, other industries 19 489 - 1 615 17 120 135 38 089 4.6 R & D Economic affairs 1 579 - - - 0 1 579 4.7 Economic affairs etc. 626 - 379 5 0 1 009 5. Environmental protection 4 168 - 462 3 818 42 8 406 5.1 Waste and waste water management, pollution abatement 1 010 - 415 236 20 1 641 5.2 Protection of biodiversity and landscape 1 675 - - 812 9 2 478 5.3 Environmental protection etc. 1 483 - 47 2 769 11 4 288 6. Housing and community amenities 3 674 - 0 3 060 330 6 404 6.1 Housing development 3 161 - 0 3 060 330 5 891 6.2 Housing and community amenities etc. 513 - - - 0 513 7. Health 3 283 - 112 125 35 797 2 349 148 856 7.1 Medical products, appliances and equipment 432 - 7 078 1 275 368 8 417 7.2 Outpatient services 370 - 14 494 9 417 74 24 207 7.3 Hospital services 625 - 87 301 24 868 1 893 110 901 7.4 R & D Health 261 - 0 11 11 261 7.5 Health etc. 1 594 - 3 252 226 2 5 070 8. Recreation, culture and religion 13 880 - 36 14 938 703 28 151 8.1 Recreational and sporting services 854 - - 6 616 11 7 459 8.2 Cultural services 4 654 - 36 7 925 679 11 936 8.3 Religious and other community services 7 590 - - 396 13 7 973 8.4 Recreation, culture and religion etc. 783 - - - 0 783 9. Education 77 516 395 118 65 531 4 960 138 600 9.1 Primary education 12 450 - 0 60 911 4 038 69 323 9.2 Youth-level education 30 946 - 0 8 94 30 860 9.3 Higher education 27 044 - 15 - 136 14 26 909 9.4 Adult and supplementary education 4 992 395 0 2 500 788 7 099 9.5 Education etc. 2 083 - 102 2 248 23 4 410 10. Social protection 264 983 61 170 6 850 368 650 251 674 449 979 10.1 Sickness and disability 35 362 - 3 033 102 417 36 574 104 238 10.2 Old age 127 839 - 1 998 120 673 107 138 143 372 10.3 Family and children 28 972 - 1 319 78 763 15 084 93 970 10.4 Unemployment 50 431 60 320 - 24 138 75 374 59 515 10.5 Housing 8 517 - - 12 708 8 484 12 741 10.6 Social exclusion n.e.c. 12 400 759 153 21 517 8 920 25 909 10.7 Social protection etc. 1 462 91 348 8 433 102 10 232
Microsoft Word − Table 395.docx (X:100.0%, Y:100.0%) Created by Grafikhuset Publi PDF.

Public finance
Statistical Yearbook 2012
Table 396 Subsidies
2010* 2011*
DKK mio.
Subsidies, total 52 223 53 930
Analysed by recipients: Subsidies to public quasi corporations 13 791 13 463 Subsidies to other enterprises 30 750 32 545 Subsidies to EU schemes 7 683 7 922
Analysed by kind and scheme:
1. Subsidies on products, total 15 757 15 099
a. EU schemes, total 348 140 Of which: Export subsidy schemes 133 29 Other EU schemes 215 112 b. Danish schemes, total 15 409 14 959 Of which: Railways 8 490 8 255 Local government buses, etc. 3 284 3 243
2. Other subsidies on production, total 36 467 38 831
a. EU schemes, total 7 335 7 782 b. Danish schemes, total 29 132 31 049 Of which: Interest subsidies 3 458 2 918 Other private enterprises 18 431 20 280
Analysed by source of finance:
a. EU schemes, total 7 683 7 922 EU share of EU schemes, total 7 399 7 427 Danish share of EU schemes, total 283 495 b. Danish schemes, total 44 541 46 008 c. Financed by Denmark, total 44 824 46 503
� www.statbank.dk/off17
Microsoft Word − Table 396.docx (X:100.0%, Y:100.0%) Created by Grafikhuset Publi PDF.

Public finance
Statistical Yearbook 2012
Table 397 Current transfers to households from the general government sector
2010* 2011*
DKK mio.
Current transfers, total 303 691 311 643
Social benefits other than social
transfers in kind 296 911 306 093
Civil servants’ pensions 21 967 22 582 Old-age and early retirement pensions 94 060 100 996 Ordinairy and raised early retirement pensions 3 426 � Higher and mid-early retirement pensions 36 322 40 535 Personal allowance 1 409 1 435 Special pension schemes 204 200 Early retirement pay 21 345 20 281 Unemployment benefit 18 839 18 929 Cash benefits under the Social Assistance Act 13 418 14 466 Gross rehabilitation benefit 2 768 2 426 Sickness and maternity benefit 24 933 24 594 Funeral benefit 141 135 Child and youth allowances 4 030 4 076 Sabbatical leave, child care 105 17 Subsidies to free seat in day-care institutions 2 516 2 584 Family allowance 14 728 14 517 Compensations and presentations to victims of the occupation 366 330 Housing subsidies 12 184 12 701 Compensation for lost earnings 1 268 753 The Employees' Guarantee Fund 668 759 Education grants 14 823 16 171 Education benefit as substitution for employment quotation 3 802 3 627 Other transfers 3 590 3 979
Other current transfers, total 6 780 5 550
Transportation 1 474 1 304 Indexation 1 444 1 530 Free process and legal aid 425 451 Other transfers 3 436 2 264
� www.statbank.dk/off10 and off10B
Microsoft Word − Table 397.docx (X:100.0%, Y:100.0%) Created by Grafikhuset Publi PDF.

Public finance
Statistical Yearbook 2012
Table 398 Total taxation
2010* 2011*
DKK mio.
Total taxation 837 532 862 535
Distribution by type of tax:
Income taxes, total 511 919 526 681
Personal income tax 427 087 439 021 State income tax 123 105 128 821 Municipality income tax 194 227 200 790 Church tax 5 629 5 801 Special contribution to labour market funds 80 797 80 651 Tax on imp. income from owner-occupied dwelling 12 622 12 772 Other personal income taxes 10 707 10 187 Corporation tax 48 161 50 309 Real interest tax 36 670 37 351
Compulsory contrib. to social-security schemes 17 687 18 211
Social contributions from employees 16 772 17 220 Social contributions from employers 914 991
Other labour market contributions 4 160 4 860
Labour market contributions from employers 4 160 4 860
Taxes on wealth, real property, etc. 38 475 40 095
Inheritance tax and gift tax 3 779 4 694 Motor vehicle weight duty 10 535 10 382 Taxes on real property 24 161 25 018 Property release and surrender tax 0 0
Taxes on goods and services 265 149 272 537
VAT 173 114 178 953 Tax on wage totals 5 115 5 761 Customs and import duties 3 241 3 249 Taxes on specific goods 71 982 73 262 Vehicle registration duty 13 523 13 562 Energy taxes 40 039 41 139 Pollution duties 1 921 2 285 Tobacco duties 8 339 7 495 Duties on beer, wine and spirits 2 989 3 123 Other taxes on specific goods 5 171 5 657 Taxes on specific transactions 5 748 5 142 Stamp duty 5 686 5 060 Other taxes on specific transactions 62 82 Taxes on specific services 5 759 6 017 Turnover tax on football pools etc. 1 087 1 095 Tax on insurance of vehicles and leisure craft 1 975 1 854 Other taxes on specific services 2 698 3 068 Other duties 189 152
Other production taxes 143 151
Distribution by receiving sub-sector
Central government 593 603 610 883 Social security funds 17 518 18 008 Municipalities 223 137 230 362 Supranational authorities (EU) 3 275 3 282
� www.statbank.dk/off12
Microsoft Word − Table 398.docx (X:100.0%, Y:100.0%) Created by Grafikhuset Publi PDF.
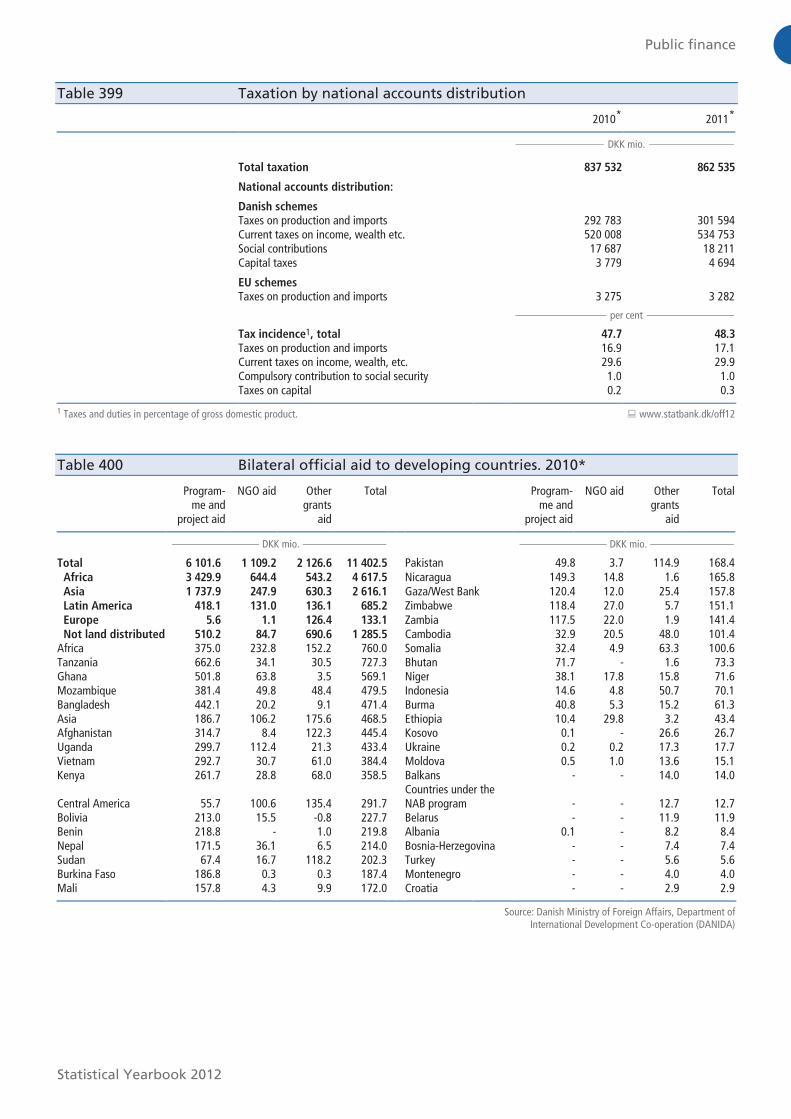
Public finance
Statistical Yearbook 2012
Table 399 Taxation by national accounts distribution
2010* 2011*
DKK mio.
Total taxation 837 532 862 535
National accounts distribution:
Danish schemes Taxes on production and imports 292 783 301 594 Current taxes on income, wealth etc. 520 008 534 753 Social contributions 17 687 18 211 Capital taxes 3 779 4 694
EU schemes Taxes on production and imports 3 275 3 282
per cent
Tax incidence1, total 47.7 48.3
Taxes on production and imports 16.9 17.1 Current taxes on income, wealth, etc. 29.6 29.9 Compulsory contribution to social security 1.0 1.0 Taxes on capital 0.2 0.3
1 Taxes and duties in percentage of gross domestic product. � www.statbank.dk/off12
Table 400 Bilateral official aid to developing countries. 2010*
Program- me and
project aid
NGO aid Other grants
aid
Total Program- me and
project aid
NGO aid Other grants
aid
Total
DKK mio. DKK mio.
Total 6 101.6 1 109.2 2 126.6 11 402.5 Pakistan 49.8 3.7 114.9 168.4 Africa 3 429.9 644.4 543.2 4 617.5 Nicaragua 149.3 14.8 1.6 165.8 Asia 1 737.9 247.9 630.3 2 616.1 Gaza/West Bank 120.4 12.0 25.4 157.8 Latin America 418.1 131.0 136.1 685.2 Zimbabwe 118.4 27.0 5.7 151.1 Europe 5.6 1.1 126.4 133.1 Zambia 117.5 22.0 1.9 141.4 Not land distributed 510.2 84.7 690.6 1 285.5 Cambodia 32.9 20.5 48.0 101.4 Africa 375.0 232.8 152.2 760.0 Somalia 32.4 4.9 63.3 100.6 Tanzania 662.6 34.1 30.5 727.3 Bhutan 71.7 - 1.6 73.3 Ghana 501.8 63.8 3.5 569.1 Niger 38.1 17.8 15.8 71.6 Mozambique 381.4 49.8 48.4 479.5 Indonesia 14.6 4.8 50.7 70.1 Bangladesh 442.1 20.2 9.1 471.4 Burma 40.8 5.3 15.2 61.3 Asia 186.7 106.2 175.6 468.5 Ethiopia 10.4 29.8 3.2 43.4 Afghanistan 314.7 8.4 122.3 445.4 Kosovo 0.1 - 26.6 26.7 Uganda 299.7 112.4 21.3 433.4 Ukraine 0.2 0.2 17.3 17.7 Vietnam 292.7 30.7 61.0 384.4 Moldova 0.5 1.0 13.6 15.1 Kenya 261.7 28.8 68.0 358.5 Balkans - - 14.0 14.0
Central America 55.7 100.6 135.4 291.7 Countries under the
NAB program - - 12.7 12.7 Bolivia 213.0 15.5 -0.8 227.7 Belarus - - 11.9 11.9 Benin 218.8 - 1.0 219.8 Albania 0.1 - 8.2 8.4 Nepal 171.5 36.1 6.5 214.0 Bosnia-Herzegovina - - 7.4 7.4 Sudan 67.4 16.7 118.2 202.3 Turkey - - 5.6 5.6 Burkina Faso 186.8 0.3 0.3 187.4 Montenegro - - 4.0 4.0 Mali 157.8 4.3 9.9 172.0 Croatia - - 2.9 2.9
Source: Danish Ministry of Foreign Affairs, Department of International Development Co-operation (DANIDA)
Microsoft Word − Table 399.docx (X:100.0%, Y:100.0%) Created by Grafikhuset Publi PDF.
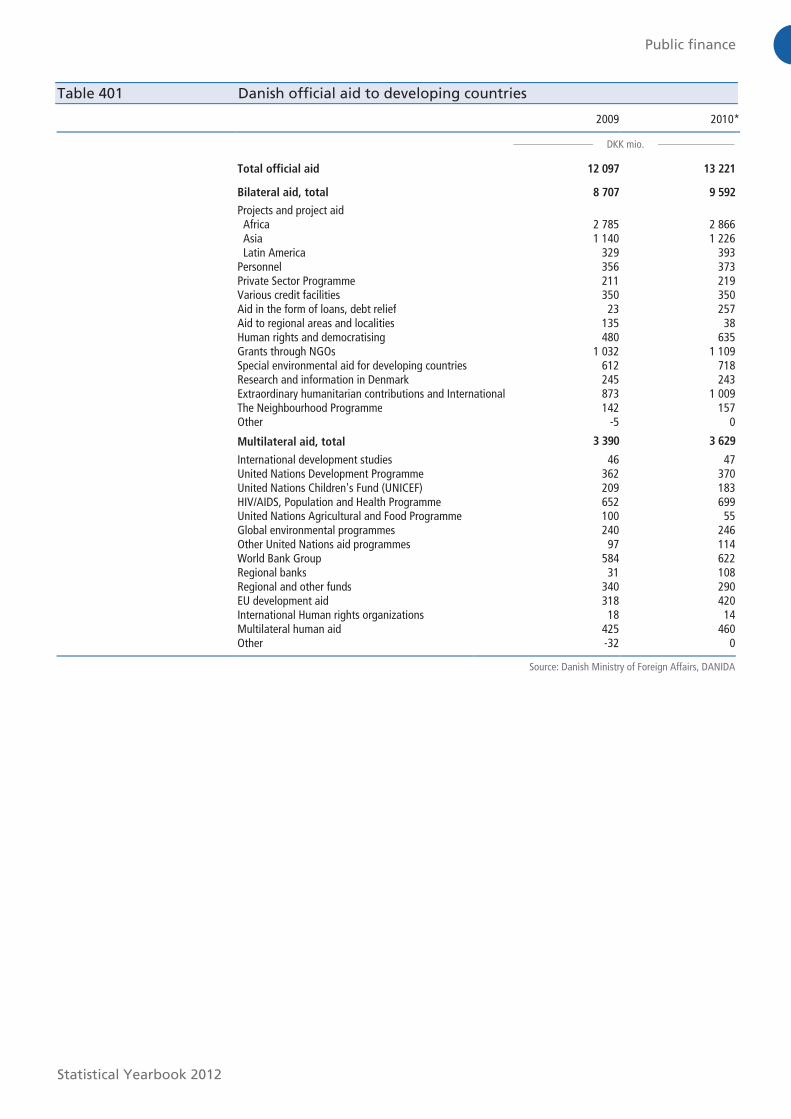
Public finance
Statistical Yearbook 2012
Table 401 Danish official aid to developing countries
2009 2010*
DKK mio.
Total official aid 12 097 13 221
Bilateral aid, total 8 707 9 592
Projects and project aid Africa 2 785 2 866 Asia 1 140 1 226 Latin America 329 393 Personnel 356 373 Private Sector Programme 211 219 Various credit facilities 350 350 Aid in the form of loans, debt relief 23 257 Aid to regional areas and localities 135 38 Human rights and democratising 480 635 Grants through NGOs 1 032 1 109 Special environmental aid for developing countries 612 718 Research and information in Denmark 245 243 Extraordinary humanitarian contributions and International 873 1 009 The Neighbourhood Programme 142 157 Other -5 0
Multilateral aid, total 3 390 3 629
International development studies 46 47 United Nations Development Programme 362 370 United Nations Children's Fund (UNICEF) 209 183 HIV/AIDS, Population and Health Programme 652 699 United Nations Agricultural and Food Programme 100 55 Global environmental programmes 240 246 Other United Nations aid programmes 97 114 World Bank Group 584 622 Regional banks 31 108 Regional and other funds 340 290 EU development aid 318 420 International Human rights organizations 18 14 Multilateral human aid 425 460 Other -32 0
Source: Danish Ministry of Foreign Affairs, DANIDA
Microsoft Word − Table 401.docx (X:100.0%, Y:100.0%) Created by Grafikhuset Publi PDF.