17. alignment of service characteristics with competitive ...933559/fulltext01.pdf ·...
TRANSCRIPT

Alignment of service characteristics with competitive strategy & customer
satisfaction: A Comparative study in fast food industry
MASTER THESIS WITHIN: General Management
NUMBER OF CREDITS: 15 ECTS
PROGRAMME OF STUDY: Engineering Management
AUTHOR: Muneeb Goraya and Ibrahim Zaaroura
TUTOR: Jonas Dahlqvist
JÖNKÖPING: June, 2016

i
ABSTRACT
Competitive strategies are an essential tool for sustainable competitive advantage. Particularly in the service industry, strategy has its significance as it plays a vital role in achieving customer satisfaction. This study investigates alignment of four service characteristics i.e. servicescape, service quality, quality and value with the firms’ strategy and how this alignment achieves customer satisfaction. A set of hypotheses were formulated to portray the significance of each of the four service characteristics and customer satisfaction in accordance with the firms’ competitive strategy. The investigations were done particularly within the fast-food industry, comparing two well-known fast-food chain restaurants namely, McDonalds and Max. A survey questionnaire covering the four service characteristics was prepared and distributed among the possible respondents. The analysis of the results was done with the help of SPSS. The results do not show any significant difference in McDonald’s or Max’s strategy in alignment of the four service characteristics. This thesis helps to understand the strategy dynamics of the service industry firms and what is or is not significant to them when customer satisfaction is to achieved; particularly for the fast-food industry.
Keywords: Competitive strategy, service characteristics, servicescape, service quality, quality, value, customer satisfaction, service industry.

ii
ACKNOWLEDGEMENTS
This thesis is part of the Engineering Management degree at Jönköping University. We would like to use this opportunity to thank the university management in general and Jönköping International Business School (JIBS) in particular for providing us the opportunity to take part in this unique degree program. We would like to extend a special thank you to our tutor Jonas Dahlqvist. It was his able guidance and support which helped us immensely from the beginning to the end of this course. He was always available with his comments and suggestion to guide us. Lastly, special gratitude to the 104 respondents, without them this thesis work, would not have been possible.
Thank you all!
Jönköping, June, 2016
Muneeb Goraya Ibrahim Zaaroura

iii
Table of Contents ABSTRACT ............................................................................... iACKNOWLEDGEMENTS ........................................................ iiList of Figures ......................................................................... vList of Tables ......................................................................... viList of Appendices ................................................................ vi1 Introduction ................................................................. 11.1 Background .................................................................................. 11.2 Problem ....................................................................................... 21.3 Purpose ....................................................................................... 3
2 Theoretical frame of reference ................................... 42.1 Competitive Strategy ................................................................... 42.2 Combination strategy ................................................................... 52.3 Service process matrix ................................................................ 62.4 Service characteristics ................................................................. 72.4.1 Servicescape ............................................................................... 72.4.2 Service quality ............................................................................. 72.4.3 Quality .......................................................................................... 82.4.4 Value ............................................................................................ 82.5 Customer satisfaction .................................................................. 82.6 Linking service characteristics and customer satisfaction ........... 92.7 Competitive Strategy: Linking service characteristics and customer satisfaction ................................................................................ 92.8 Development of hypotheses ...................................................... 10
3. Method ....................................................................... 123.1 Research strategy ...................................................................... 123.2 Research design ........................................................................ 123.3 Scientific approach .................................................................... 133.4 Research Method ...................................................................... 133.4.1 Construction of questionnaire .................................................... 133.4.2 Sample selection ....................................................................... 133.4.3 Data collection ........................................................................... 143.4.4 Data analysis ............................................................................. 153.5 Trustworthiness ......................................................................... 153.5.1 Reliability ................................................................................... 153.5.2 Validity ....................................................................................... 16
4. Results ....................................................................... 174.1 Fast-food overview .................................................................... 174.1.1 McDonald’s ................................................................................ 174.1.2 Max Burger ................................................................................ 184.2 Descriptive statistics of collected data ....................................... 194.3 Descriptive results: service characteristics ................................ 234.3.1 Servicescape ............................................................................. 23

iv
4.3.2 Service quality ........................................................................... 234.3.3 Quality ........................................................................................ 244.3.4 Value .......................................................................................... 254.4 Satisfaction ................................................................................ 25
5. Analysis ..................................................................... 275.1 Measures ................................................................................... 275.2 Reliability of Measures ............................................................... 275.2.1 Servicescape ............................................................................. 285.2.2 Service quality ........................................................................... 285.2.3 Quality ........................................................................................ 285.2.4 Value .......................................................................................... 295.2.5 Customer Satisfaction ................................................................ 295.3 Validity of measures .................................................................. 295.4 Analysis of hypotheses .............................................................. 30
6. Discussion ................................................................. 336.1 Conclusion ................................................................................. 336.2 Limitations .................................................................................. 346.3 Future Suggestions .................................................................... 34
References ............................................................................ 35APPENDICES ........................................................................ 38

v
List of Figures
Figure 1: Porters Generic Strategies Model (Adapted from Porter, 1980 p 39)2Figure 2: Competitive strategy in competitive environment. (Day et al., 1987, p.
1536) ................................................................................................... 5Figure 3: Service-process matrix. (Schmenner 2004 p 338) ........................... 6Figure 4: Modified service-process matrix. (Schmenner 2004 p 342) ............ 6Figure 5: Linking service characteristics and customer satisfaction ................ 9Figure 6: Theoretical model ........................................................................... 10Figure 7: Gender classification of respondents in pie chart form .................. 20Figure 8: Classification of respondents’ w.r.t. age ......................................... 20Figure 9: Classification of respondents based on visit to restaurant. ............ 21Figure 10: Pictorial representation of classification based of visit frequency 22Figure 11: Spending per week ...................................................................... 22Figure 12: Pie-chart of discounts offered ...................................................... 23Figure 13: Satisfaction levels from respondents ........................................... 26

vi
List of Tables
Table 1: Cultural diversity in McDonald’s menu (Nguyen Thi Bich and Balami, 2011 p 30) ......................................................................................... 18
Table 2: Gender classification of respondents .............................................. 20Table 3: Classification of respondents based on nationalities ....................... 20Table 4: Respondents based on restaurant visited ....................................... 21Table 5: Comparison based on visit frequency ............................................. 21Table 6: Comparison based on money spent per week. ............................... 21Table 7. Classification based on discounts offered ....................................... 23Table 8: Descriptive results for servicescape ................................................ 24Table 9: Descriptive results for service quality .............................................. 24Table 10: Descriptive results for quality ........................................................ 25Table 11: Descriptive results for value .......................................................... 25Table 12: Cronbach’s alpha for four service characteristics .......................... 27Table 13: Inter-item correlation matrix for five items of servicescape ........... 27Table 14: Inter-item correlation matrix for nine items of service quality ........ 28Table 15: Inter-item correlation matrix for five items of quality ...................... 29Table 16: Inter-item correlation matrix for three items of value ..................... 29Table 17: Component factor analysis ............................................................ 30Table 18: Descriptive Statistics for four observed service characteristics ..... 31Table 19: Independent sample t-test results ................................................. 32Table 20: Summarization of results of hypotheses analysis ......................... 32
List of Appendices
Appendix 1: Survey Questionnaire ................................................................ 38

1
1 Introduction
This Introduction chapter will provide the background of the thesis research and carries forward through problem explanation. The problem description delineates various problems which are associated to the alignment of competitive strategies with service characteristics. The problem description will end by pointing out objectives and purpose of the thesis
1.1 Background Strategy has been defined in many different ways by researchers, but a complete agreed upon definition is still not available. Lynch (2006) has used the term strategy and corporate strategy synonymously. He defined corporate strategy loosely as “the identification of the purpose of the organization and the plans and actions to achieve that purpose”. It can be said without much doubt that the study of strategy started with Igor Ansoff, considered by many as the father of modern concept of corporate strategy (Hussey, 1999). Hussey (1999) argues that Ansoff’s contribution to the study of strategy/corporate strategy is invaluable as he conceptualized not only corporate strategy but strategic management and the turbulence theory of strategy. Lynch (2006) further categorizes corporate strategy into corporate-level and business-level strategies, where corporate-level strategy is the plans, policies to achieve purpose or goals and business-level strategy is about matching internal capabilities with external relationships. This categorization of corporate strategy is one way to categorize and define strategy. Strategy has been defined fairly elaborately by Mintzberg (1987). He gave several definitions for strategy covering a variety of scenarios. He defined strategy as a plan i.e. a course of action; ploy i.e. a specific maneuver; pattern i.e. a pattern in a stream of actions; strategy as a position i.e. placing the organization in-line with the environment and lastly strategy as perspective i.e. a way of perceiving the world (Mintzberg, 1987). Another important and frequently used concept in strategy is competitive strategy. This idea was given initially by Michael Porter in 1980. It explains strategies of organizations that are entering a market and have to face competition in the market. These strategies essentially put competitors before the customers. Another way of setting strategy is customer driven strategy. This places more focus on customers as compared to the market competition. Lynch (2006) has explained this as a strategy of an organization with prime focus on customer satisfaction. Porter’s model of competitive strategies is shown in figure 1 and is arguably the most well-known strategic model when it comes to competition in the market and to achieve sustainable competitive advantage. These strategies are also known as generic strategies. The three generic strategies are: Cost leadership strategy – when the firm focuses on being the lowest cost service producer, by reducing operational costs below their competitors. Porter (1980) states that the cost leadership strategy is dominant when price is the dominant. Also firms are more inclined to use it when they have a considerable market share. Differentiation strategy – when the firms seek to produce unique product which differ significantly from competitors’ products (Porter, 1997). This strategy may limit the market share for the organization, it also requires high startup and running costs (Porter, 1997). Focus strategy–when the firms focus on a specific consumer segment within the total market. It can be a low cost focus strategy i.e. firms focus on low cost products or differentiation focus i.e. firms produce products for specific buyer segments (Porter 1980).

2
The core of Porter’s theory is not only about choosing a competitive strategy, but also about gaining competitive advantage and sustaining that particular advantage over their market competitors. Research in Operations Management (OM) has been focused on linking firm strategies with operational priorities. Miles (2013) suggest that although there have been positive developments in finding the most important services to generate competitive advantage but they still fall short. The reason is being that different industries e.g. services or production cannot use the same characteristics to gain competitive advantage. Schmenner (1986) suggested a service-process matrix with throughput on the Y-axis and labor intensity on the X-axis. He argues that the firms closer to the diagonal in the service-process matrix will have increased productivity and profitability. Schmenner (2004) acknowledges that all service firms need not to be on or close to the diagonal in the service-process matrix to be profitable. Porter and Schmenner provide the theoretical basis for service firms in competitive markets but do not mention how, for example a firm with differentiation strategy should best approach service operations (Kumar and Subramanian, 2011). Even if two firms are in service industry, this does not guarantee that their strategy will be same or similar to be profitable. Every firm will have their own focal service points and they may or may not depend on what competitive strategy is being used by the firm. These focal points or service characteristics may be associated with loyalty/satisfaction in different strategic groups.
1.2 Problem While continuous efforts attempt to link service characteristics with firm’s strategy, many changes in operational management taxonomies take place; for example, one way to categorize services within the organization is according to industries i.e. service industry, manufacturing industry etc. Miles (2013) and Kuo, Wu and Deng (2009) have studied some service characteristics related to cost leadership and differentiation strategies. Cost leadership service characteristics generally refer to price and efficiency, whereas product differentiation characteristics concern product or service uniqueness (Miles, 2013). Four service characteristics have therefore been included in this research which has been chosen with the help of previous research conducted by Miles (2013) and Kou et al. (2009). These characteristics are: servicescape, service quality, quality and value. Customer satisfaction is in focus for customer driven strategies and to retain market share in the competitive market it is absolutely essential to have satisfied customers; even more so in the services industry. In light of the above discussion the problem with different service firms in the same industry is that they are considered essentially the same but behave differently following a certain strategy. They may also be using different competitive strategies, plans or ploys to achieve customer satisfaction. We therefore in this thesis have limited the study to four service characteristics within the service industry. The chosen industry is the fast food industry and this thesis does a comparative study between two fast food chain restaurants i.e. McDonald’s and Max. The study is conducted in the Swedish market. The fact that both the chosen firm are in the same industry and similar type of business does not guarantee that they will be using similar strategies or plans to keep their customers satisfied or to have sustainable competitive advantage. Moreover, when it comes to competitive strategies, a mere selection of a competitive strategy or a hybrid of competitive strategies does not give the firms a framework of suggested service
Figure 1: Porters Generic Strategies Model (Adapted from Porter, 1980 p 39)

3
operations. (Miles, 2013; Kumar and Subramanian, 2011). By limiting the study to similar firms in the same industry we try to explore the alignment of these characteristics with the firm’s overall competitive strategy.
1.3 Purpose This study further investigates the link between the four named service characteristics i.e. servicescape, service quality, quality and value with the firm’s competitive strategy. We have chosen McDonald’s and Max for this comparative study who are using cost leadership and differentiation strategy respectively. So, our research questions are:
• How firm with cost leadership strategy aligns the four service characteristics with its competitive strategy to achieve customer satisfaction?
• How firm with product differentiation strategy aligns the four service characteristics with its competitive strategy to achieve customer satisfaction?
In this thesis we do not investigate that which firm is using which competitive strategy rather we assume this based on previous research and plans and ploys of the firms accessible through a web search. The focus is on the alignment of service characteristics with a given competitive strategy.

4
2 Theoretical frame of reference
This chapter highlights the literature considered to be relevant for the purpose of this thesis. A theoretical framework is presented to provide the reader with a thorough understanding of theoretical components and how they relate to our research.
In this section we are going to explore relevant literature pertaining to our topic and the research area. First, since our research involves competitive strategy, we start with a brief description of the concept of competitive strategy and the different types of strategies. Later we discuss the four service characteristics chosen in the study, as how they have been described in the literature. Then their relevancy to customer satisfaction. In doing so, we will then be able to describe the model which we have established and the relevant hypotheses pertaining to it.
2.1 Competitive Strategy Porter (1980) argues that firm can choose one of the three generic competitive strategies. Porter’s model of competitive strategies is shown in figure 1 and is arguably the most well-known strategic model when it comes to competition in the market. These strategies are also known as generic strategies. These three generic strategies are: Cost leadership strategy – when the firm focuses on being the lowest cost service producer, by reducing operational costs below their competitors. According to Porter (1980) firms are more inclined to use it when they have a considerable market share. furthermore, he states that the following strategy is powerful when the price is dominant, when differences from one brand to another do not matter to customers, when the product fully achieve the customers’ needs without considering to quality a dominant competitive force, finally, when buyers are a quite large and have power to claim for down prices (Porter, 1997). However, following the cost leadership will have some flaws such as needs for high initial market share cheap raw materials and wide distribution networks, existing product line will therefore shall be redesigned to provide the related products and achieve the customer base as possible and other rival in the industry will be easily reduce their cost also through imitation of the production process (Porter, 1997). Differentiation strategy – when the firms seek to produce unique product which differ significantly from competitors’ products (Porter, 1997). This strategy may limit the market share for the organization, it also requires high startup and running costs (Porter, 1997). However, pursuing this strategy leads to limit the market share, defection of existing customers since it involves cost trade off, it also requires high start-up and high running costs. Further, the products are subject to imitation by rivals if market’s differentiation declines (Porter, 1997). Focus strategy–when the firms focus on a narrower zone of the total market. It can be a low cost focus strategy i.e. firms focus on low cost products or it could be differentiation focus i.e. firms produce products for specific buyer segments (Porter 1980). However, the strategy leads to similar production costs and investments as differentiation strategy, it will lead to change in the product specification which in turn causes cost disadvantages, and the non-focused products begin to meet the demands. It makes competitors to identify more tightly the market segments (Porter, 1997). According to Day et al., (1988) competitive strategy is thus a result of external forces in the environment, which will in turn lead to particular competitive environment as shown in the model below. Therefore, managers need to determine the success factors which lead them to win over their rivals in the competitive environment and then select their competitive strategies based on these factors (Day et al., 1987).

5
Figure 2: Competitive strategy in competitive environment. (Day et al., 1987, p. 1536)
2.2 Combination strategy Porter (1980) argues that if firms follow both cost leadership and differentiation strategy, this will lead to having unclear strategy that increases the likelihood of failure. And the firms will therefore be stuck in the middle. As when the firm invests in high differentiation position, it results indeed in high overall cost position, hence the firm will be unable to compete since its cost structure is too high. Moreover, it’s unable also to compete for differentiation with premium price since products and/or services are less differentiated than other firms applying differentiation strategy However, many researchers oppose Porter’s hypothesis ‘Stuck in the middle’ and state that a firm can implement both cost leadership and differentiation strategy (Campell-Hunt, 2000). In addition, Karnani (1984) who concluded according to his model, firms not necessarily need to follow one of the three strategies and therefore is possible to pursue both high differentiation and low average cost position. Other investigations contradicted Porter’s ‘stuck in the middle’ hypothesis, when it was argued that customers in any marketplace buy products on the basis other than price and most industries offer these opportunities, to attract them. When they add, for example new features in the product or when they focus to differentiate their products in providing high quality products. As a result, this proves that there is great chance for firms to combine two strategies to meet market needs and outperform their rivals. Murray (1988) argues that a firm is not precluded to pursue hybrid strategy since external factors of viable cost leadership are independent from that of product differentiation. The first stems from industry’s structural characteristics and stems from customer’s tastes. Empirical investigations oppose Porter’s statement “a cost leader that competes against a product differentiator must also be a product differentiator, and vice versa” (Murray, 1988, p. 396). For example, Phillips, Chang and Buzzell (1983) found that quality of product i.e. product differentiation was negatively related to relative direct cost i.e. cost leadership (Murray, 1988). Moreover, other researchers found that costs declined faster for firms that pursue high quality i.e. differentiation than firms that produced low quality product, hence cost savings can be earned for quality products (Murray, 1988). However, recent empirical results produced some contradiction, for example some firms in Greece found that efficiency is better in pursuing one strategy rather than dual one. This has been also observed in some firms in South American countries, which has negative impacts on export performance (Li and Li, 2008).

6
2.3 Service process matrix A model for product-process lifecycle was created by Wheelright and Hayes (1979). Schmenner (1986) established a service process matrix as shown in figure 3. In this matrix, he suggested labour intensity on the X-axis (like process-variation) and throughput on the Y-axis (like process). Accordingly, movement towards the diagonal enhances the efficiency which in turn increases productivity, and ultimately profitability. Later Schmenner (2004) asserted that his original matrix was almost true, but needs slight adjustments as shown in figure 4. Schmenner (2004) noticed that not all service firms are essentially needed to be on diagonal, instead firm can be out of diagonal, suggesting by this new concept, the “theory of swift”. In this theory, he suggests that the faster materials flow, the more profitable firm is. In other words, increase in firm’s productivity has positive relationship with materials flow. However, years later, Schmenner concluded that firms can be profitable anywhere in the matrix but diagonal is just one suggestion (Miles, 2013).
Figure 3: Service-process matrix. (Schmenner 2004 p 338)
Figure 4: Modified service-process matrix. (Schmenner 2004 p 342)

7
2.4 Service characteristics Since the research investigation is fundamentally constructed on generic strategies suggested by Porter, it is necessary therefore to delineate service variables that categorize service firms (Miles, 2013). Two groups of variables are identified; product differentiation variable relative to service and/or product uniqueness. Specifically, variables that define differentiation strategy, i.e., quality, service quality and servicescape variables, in other words, firm’s service characteristics. Another group is related to cost leadership variables which concern efficiency and price. Specifically, variables that define the cost leadership strategy, i.e., value. On the other hand, it is imperatively important to measure such variables through customer perception and/or the satisfaction level due to variables’ intangibility (Miles, 2013). Therefore, according to Miles (2013) firms following differentiation strategy must understand the desired service characteristics to meet customer’s perception about quality, service quality and servicescape. Similarly, for firms following cost leadership strategy, they must understand how to influence customer’s perceptions about value.
2.4.1 Servicescape It is defined as a combination of many different dimensions which influence the customers’ holistic expectations and perceptions of the offered service (Miles, Miles and Cannon, 2012). Bitner et al. (1994) defines it as when customers use surroundings to categorize the service. Wakefield and Blodgett (1996) gave additional explanations and added facility aesthetics such as colour, music, lighting, and furniture to increase attract customers as well as the overall cleanliness, in other word, it means the overall atmospheric elements such as the physical designs and decor, posters, lighting, signs and advertisements. In summary, the literature suggests several ideas of servicescape. First, interactions between service provider and customers which lead to various needs in physical surroundings; second, servicescape could lead to categorize the service in particular ways in response to customer’s particular emotions; third, servicescape can play prominent role in design, plan and executions of any industry. All of these ideas are important because they suggest relationship between servicescape and firms’ strategy to obtaining customer satisfaction (Miles et al., 2012). As a result, servicescape has vital role in service industries such as fast food, retailing, restaurants and hotels (Miles, 2013).
2.4.2 Service quality Service quality has been broadly investigated over the past years. It is a multidimensional concept and can be measured using two methods. First method measures discrepancies between customers’ expectations and perceptions of service, the second is the “customers’ overall impression of the relative inferiority/superiority of the organization and its services” (Zhao, et al., 2011). The literature defines service quality as multidimensional concept regardless of the method. For example, Grönroos (1984) proposed two dimensions, technical quality which measure what consumers get from service encounter and functional quality pertained to service delivery. Later Parasuraman et al. (1988) created a five dimensional framework for service quality. It consists of five important factors, which are; reliability, responsiveness, assurance, empathy and tangibility (Zhao et al., 2012). Based on that, they developed a 22-item instrument called SERVQUAL which has been used widely for assessment of service quality in service marketing. Later Rust and Oliver (1994) established a three component service quality model, which measures service quality using three dimensions, which are service product, service delivery and service environment. However, Dabholkar et al. (1995) suggested a multilevel model which assesses service quality by five dimensions i.e. “physical aspects reliability, personal interactions problem solving and policy. And six sub dimensions (appearance, convenience, promises, doing it right, inspiring confidence and being courteous and helpful)”. Brady and Cronin (2001) built up a hierarchical model which measures the level of service quality based on three dimensions, i.e., interaction quality, physical environment quality and outcome quality, each of these dimensions has three sub dimensions and comprising attitudes, behaviour and expertise etc. As a result, many subsequent studies have implemented this model and deduced that the measurement of service quality changes according to the type of service being offered (Zhao et al., 2012).
8
In this paper, we will study customers’ perception in relation to service timing and communication between the customer and service provider as these factors affect negatively customer’s perception of quality, so this leads to conclude that service quality is an important element in defining success of service industries such as fast food and fast food industries.
2.4.3 Quality Quality is the consumer’s judgement about the excellence of a product (Zeithmal, 1984). Perceived quality as defined by Zeithmal (1984) distinguishes objective or actual quality, it is a “higher level of abstraction rather than a specific attribute of a product” (Zeithmal, 1984). It can be global judgment that is similar to certain attitude made by consumers about a certain product (Zeithmal, 1984). Some researches define quality as investment, and many firms invest in quality under the “revenue expansion” to increase the profitability in the firm (Miles, 2013). Previous literature explored the differentiation of objective and perceived quality as argued by Dodds and Monroe (1984). Objective quality is used to describe “the actual technical superiority or excellence of a product” (Dodds and Monroe, 1984). However, perceived quality on the other hand is the overall attitude perceived by consumers, managers or researchers. for example, products ’quality is assessed as low or high quality product based on its relevant excellence among other products as viewed by customers or consumers. Therefore, quality is a function of consumer’s evoked set (Zeithmal, 1984). The Literature defines quality in different aspects and many debates have argued the definition of quality. As a result, quality is pivotal in service industries and is considered as an important element from customer point of view.
2.4.4 Value The term value has many definitions and has been used in many different ways, for example in economics, value is relevant to utility or desirability, however in social science it can be understood in the context of human values (Miles, 2013). To understand the concept of value, a study was carried out by Zeithmal (1988), he studied four definitions. First, “value is price” this definition became consistent with previous researches carried by Schechter (1984) and Bishop (1984). Second, value is “whatever I want in a product” (Zeithmal, 1988). This definition is consistent with the economist’s definition, i.e. the measurement of usefulness that comes out from consumption, and conform with pervious literature which suggested that value is “whatever it is that customer seeks in marketing decisions as to which store to shop or which product to buy” (Zeithmal,1988, p. 13).Third, value is “the quality I get for the price I pay”(Zeithmal, 1988, p. 13).This definition is also consistent with many other literatures like (Dodds and Monroe 1984; Doyle 1984).Finally, value is defined as “what I get for what I give” (Zeithmal, 1988).The concept is consistent with the conceptualization given by Sawyer and Dickson(1986) as a “ratio of attributes weighted by their evaluations divided by price weighted by its evaluation” (Zeithmal, 1988 p.13). In conclusion, we can say that value is important factor in defining customer’s perceptions and performance of service organization.
2.5 Customer satisfaction The positive disconfirmation between the expectation and evaluation leads to satisfaction and the negative one leads to dissatisfaction (Zhao et al., 2011). Customer satisfaction is determined by two perspectives, that is, transaction-specific and cumulative perspectives (Kuo et al., 2009). Transaction-specific perspective measures level of satisfaction by recent purchase experiences, however, cumulative, on other hand indicates overall evaluations regardless to any specific purchase experience. The literature suggests that cumulative perspective is more effective when evaluating performance of service firms (Kuo, et al., 2009). Furthermore, it is a function of transaction-specific satisfaction. In addition to that, specific-satisfaction changes according to changes in experiences which in turn influences cumulative satisfaction positively or negatively (Zhao et al., 2011). Similarly, Shankar et al (2003) asserted that both types of satisfaction are different and transaction-specific

9
satisfaction has significant effect on cumulative satisfaction i.e. the overall satisfaction in both online and offline environments (Zhao et al., 2011). Customer satisfaction therefore, has vital role in service marketing since it is a good predictor in determining continuous intention in service firms (Zhao et al., 2011).
2.6 Linking service characteristics and customer satisfaction In reference to the existing literature, service characteristics influence customer satisfaction. For example, service quality has positive impacts on customer (Kuo et al., 2009). This element evaluates performance of service personnel to give the promised service perfectly (Miles, 2013). However, inconsistency of service timing and communication variables with promised service affects negatively customer’s perception of service quality (Miles, 2013). On the other hand, servicescape has direct correlation with customer satisfaction. Many empirical investigations have shown this correlation; for example, as said “fine dining” needs some normal conditions, while “fast food” needs another specific conditions, suggesting different places require different conditions to attract or impact customers’ perception. Similarly, studies have ascertained further effects of quality and value on customer satisfaction. Thus, changes with any characteristics would perceive differently from customer’s point of view. In this sense, this depends normally on firm’s activities and relationship with customers to achieve satisfaction.
Figure 5: Linking service characteristics and customer satisfaction
2.7 Competitive Strategy: Linking service characteristics and customer satisfaction The following four service characteristics are important for all industries. However, the degree of importance is based on the industry’s type. For example, one will find that servicescape is more important in hotel industry compared to other characteristics; or may be service quality is most important factor in fast food industry to satisfy customers compared to other characteristics and so forth. However, during this discussion about the importance level of services, the notion of Porter’s generic strategies has come into the way, suggesting that the importance of each service characteristic is varied depending on the strategy being pursued in the organization (Miles, 2013), i.e., whether the firms is following cost leadership or differentiation strategy. In this sense, the model is thus created in order to analyse the importance of every service characteristic in accordance to the existing strategy followed by each firm. For this purpose, we have chosen two fast food restaurants in Swedish market. McDonald’s as the first restaurant which pursues a cost leadership strategy (please refer to section fast-food overview) and the second is Max burger which pursues a differentiation strategy (please refer to section fast food overview). The reason behind why we chose particularly McDonald’s and Max is to assess importance level of service characteristics in two service firms having different competitive strategies. Thus, in order to develop the necessary analysis, five hypotheses have been constructed.

10
Figure 6: Theoretical model
2.8 Development of hypotheses Broadly speaking, researchers have found that service characteristic of servicescape varies according to the nature of the service being offered as well as to customer expectations (Bitner et al., 2010). However, this difference is not that much between firms working in the same industry and following cost leadership strategy. Further, customer would like to enjoy the impacts of servicescape for differentiator while in contrast is unlikely to demand servicescape from cost leader (Miles, 2013). Thus, Hypothesis H1 is formally constructed as follows:
H1: Alignment of servicescape is more significant to firms following differentiation strategy. Researchers have found that service quality characteristic varies according to type and complexity of the service delivered to customer (Miles, 2013). According to Bitner et al (2010) - customer expectations and the service being delivered using technology comes under the umbrella of service quality. On the other hand, since our research is to assess service quality with firm’s competitive strategy; for example, when firm follows a cost leadership strategy, it recognizes that this strategy comes at price rather than quality. While, in contrast, when firm applies differentiation strategy in its organization, then it recognizes that quality rather than the price is more important Thus, hypothesis H2 is formally constructed as follows:
H2: Alignment of service quality is more significant to firms following differentiation strategy. Researchers have found that quality also varies according to customer expectations. Zeithmal (1984) considered quality as a function of consumer’s evoked set. On the other hand, the research in target is to analyse the importance level of quality with firm’s strategy. In this vein, firms following cost leadership may not completely recognize quality to meet customer expectation while in contrast, firm having differentiation strategy recognizes quality to achieve customer expectations, and hence, hypothesis H3 is constructed as follows:
H3: Alignment of quality is more significant to firms following differentiation strategy. Researchers have found that value varies according to customer expectation. According to Miles (2013) value is an abstract of quality and it is perceived differently. For example, firm which follows cost leadership may

11
recognize value to meet customer expectation while in contrast firm following differentiation strategy may not fully recognize the value to achieve expectations (Miles, 2013). Thus, H4 hypothesis is constructed as follows:
H4: Alignment of value is more significant to firms following cost leadership strategy. Finally, generally speaking, it is argued that increased service quality would increase level of customer satisfaction (Miles, 2013). However, we expect that servicescape, service quality, quality and value are aligned differently in accordance to firm’s strategy but at the same time consistent with customer satisfaction (Miles, 2013). Broadly speaking, for example, customer may receive higher level of service quality and value simultaneously but lower level of servicescape. Thus one would expect good satisfaction level or let’s say one customer may receive high level of quality and servicescape but not value, then again one would also expect good of satisfaction (Miles, 2013). Thus, we formally construct hypothesis H5 as follows: H5: Regardless of firms’ strategy, customer satisfaction is consistent for firms following differentiation
strategy and cost leadership strategy.

12
3. Method
In this chapter we demonstrate the method which we applied to collect the data for this research. It starts with defining the research strategy and the research design, identify the scientific approach, research method as well what is implemented to illustrate the validity and reliability of survey.
3.1 Research strategy Broadly, research is a conduct to find appropriate solution for problems. However, in order to obtain that solution a plan is therefore required, defined as research strategy. The purpose of research strategy is to provide researchers with necessary materials tools and needed for data collection. Finally, these data will be analyzed to provide researchers with valid answers for their research questions. In this sense, the research strategy of this paper is established on the background of studied firm’s service characteristics in accordance with its competitive strategy. Accordingly, a questionnaire has been designed and planned thereafter to be distributed to customers of McDonald’s and Max restaurants prior to data collection. Based on this, results will be elicited accordingly suggesting appropriate conclusion and recommendations.
3.2 Research design Research design is a detailed working plan which is performed in order to construct subsequent flow of steps during the data collection. This helps researchers find relative answers for research problems. However, it is i.e. research design varies according to the nature of research study. Further, it has been classified by Bryman and Bell (2007) into five different groups as follows:
• Experimental design which is mainly based on experiment, that is, contains experimental data analysis
for causal research question. • Cross-sectional design: which is mainly based on case studies and contain two or more variables
simultaneously in different countries? • Longitudinal design where data is analyzed at several and different period of time. • Case study design which includes analysis of single case. • Comparative design which includes analysis of two or more cases.
In this sense, since our research was conducted to compare the alignments of firms’ service characteristics with competitive strategy and in relationship with customer satisfaction, therefore our research design is comparative research design. The reason behind using this design was, because the research is fundamentally based on comparative analysis between two service firms (McDonald’s and Max), thus two cases were involved to complete the research. On the other hand, there are two types of research methods for collection of data, that is, quantitative and qualitative methods.
• Quantitative method which is used to illustrate existing theories based on statistical data, where structured models, questionnaire, survey and observation, etc., are the tools implemented to collect required data.
• Qualitative method which is used to generate certain theories based on observations, where interviews, observations and notes, etc., are the tools used to collect required data.
Specifically, quantitative method is utilized to depict measurable phenomenon with measurable variables. In other words, gathered data is tested in numerical form, thus, developing of hypotheses and/or mathematical
13
models based on existing theories (Leedy and Ormrod, 2001). Furthermore, quantitative method covers larger number of respondents, thus it is utilized to establish any generalization about population through random or specific sample of respondents. Under this perspective, a quantitative method was conducted to serve the research, specifically to analyze the given hypotheses. For this purpose, questionnaire was developed and circulated among 174 fast food’s consumers especially at McDonald’s and Max restaurants. According to Graton and Jones (2004), the questionnaire helps researchers collect data from different geographical areas in less time and cost.
3.3 Scientific approach Scientifically, there are two distinct methods for research that is inductive and deductive method. According to Bryman and Bell (2007), the two methods are considered the basic guidance that help researchers determine whether to examine or construct certain theories during the analysis of empirical data, for example, when researchers want to build up a theory, then inductive method is implemented, however, when it is intended to emphasize existing theory, then deductive method is approached. Further, the deductive method is usually used to test hypotheses in order to prove general ideas. Since the aim of this paper is not structure a theory but to emphasize previous theories of customer perception on service characteristics being offered by fast food restaurants, namely McDonald’s and Max in accordance with their strategies, therefore, the research was developed in accordance with the deductive method.
3.4 Research Method
3.4.1 Construction of questionnaire To construct a questionnaire is not a simple process, since it shall be designed to encompass questions and information that are strongly correlated to research questions. Ultimately, it is a common tool used to collect primary data. On the hand, a questionnaire is constructed according to the nature and purpose of research. Thus it can be designed either with open or closed questions. In open question, respondents are free to answer in their own way and therefore qualitative information is elicited. However, in closed questions, respondents are bound to answer specific questions, thus quantitative information is elicited. According to Brymen and Bell (2007), respondents have chance to develop their knowledge in open questionnaire, while in closed questions, it is easier to analyze empirical data compared with open questions. Hence, closed questions survey is commonly used in comparative research design. In this sense, the questionnaire of this paper was designed to have closed questions and consisted of 22 questions. These question were divided into two parts, the first part comprises of general information about customers such as gender, ages which were categorized into three categories, that is, below 2o years old, between 2o and 40 and above 40 years old. It further included native language. However, part two encompassed specific closed questions pertained to customer perceptions about fast food restaurants, specifically McDonald’s and Max restaurants. In particular, questions were designed to get broad information on each service characteristic that is servicescape, service quality, quality and value. The arrangement of questions was established to elicit vast and precise perceptions of services afforded to customers. A detailed discussion for the questionnaire is in the analysis section.
3.4.2 Sample selection In research method, appropriate definition of sample is important because it reflects the accuracy of empirical data. Hence, choosing an accurate sample of respondents integrates the research design. According to Easterby-Smith, Thorpe and Jackson (2015) population is a “whole set of entities” while sample is a “subset of

14
those entities from which evidence is gathered”. Thus, it is essential to extract a sample that represents the characteristic of whole population. Bearing that in mind, right group of respondents should be chosen in terms of age of group, gender, demographics and so forth, in order to getting accurate results. According to Bryman and Bell (2007), there are two types of sampling, that is, probability and non-probability approaches. In probability approach, sample is selected randomly that is, any person has chance to be part of the sample, it consists of five types, namely: simple random, stratified, systematic random, cluster and multi stage sampling. However, in non-probability sampling, it is difficult to claim that selected sample represents the population. It contains four types of samplings: convenience, quota, purposive and snowball samplings (Easterby-Smith et al., 2015). With the perspective of this approach, it was therefore not possible to specify the whole population in Sweden, thus, convenience specimen was implemented. The reason behind this choice is easier access to collect empirical data. It provides researchers with a high rate of responses within a specific period of time, where resources and time are main delaying factors in the research. Another reason for choosing convenience sampling is: McDonald’s is global fast food restaurants known to everyone, Swedes and other people who live in Sweden, while Max is nationwide restaurant, most popular among Swedes. Thus conducting convenience sampling helped authors reach wide variety of respondents (in terms of ages, nationalities and gender) in a very short time, which in turn facilitated exemplifying population’s perceptions about Max and McDonald’s restaurants.
3.4.3 Data collection Besides sampling, collection of data is another important requirement needed in research method. Missing the required information will not help answer the research question of the study. Therefore, it is advisable to carefully collect most relative data in a planned and effective way that helps find answer to the research problem. There are two ways of data collection, primary data and secondary data. According to Bryman and Bell (2007), primary data is a primary source of information related to research problem and is collected by researcher himself, through interviews, surveys, experiments and questionnaire, however secondary data is secondary source of information pertaining to research problems. This information is done by other investigators and can be collected from the literature, articles, journals and internet, etc. Although time and cost are saved while conducting this way, researchers need to carefully investigate the reliability of data. In this paper, both ways were implemented in order to gather extensive information on customer’s perception towards firm’s service characteristics i.e., McDonald’s and Max restaurants. The questionnaires were circulated in two ways, online and paper based among customers in Sweden. The survey questionnaire was carried out during the month of April, 2016. With the intention to collect maximum number of sample size, 174 customers were approached, 60 through the online survey using the website www.freeonlinesurvey.com and 114 via printed version approached by authors themselves. Out of the 174 questionnaire, 114 responses were collected. There were 10 questionnaires which were invalid because of incomplete answers and incorrect answers. Therefore, they were excluded to avoid inaccurate results. In the online survey, different sample of customers were conducted with respect to gender, ages and profession like students etc. Similarly, the printed sheets contained two versions, English and Swedish to make it easier and motivate people to participate. The survey was distributed in three cities, Stockholm, Gothenburg and Jönköping. Specifically, at Stockholm central stations, Gothenburg central station and the central station in Jönköping. Furthermore, it includes A6, IKEA shopping centers and university campus in Jönköping. In addition to that collection of data was also done at Max and McDonald’s restaurants located outside the shopping centers and stations of the three cities. Another good of conducting the survey at Stockholm and Gothenburg is that:

15
Stockholm is the capital and most populous city in Sweden with plenty of fast food restaurants especially for Max and McDonald’s, thus it was easier to approach larger number of respondents. On the other hand, Gothenburg is considered as tourist city comprising various immigrants and visitors from different nationalities. Moreover, the literature and internet were credible secondary data sources. It was essential to conduct this way in order to assure the strategy of every restaurant individually, meaning that the competitive strategy of McDonald’s’ and Max restaurant. Throughout the literature, the authors ascertained the strategy at McDonald’s restaurant, which is the cost leadership strategy, on the other hand, Max’s website was the source that helped the authors ascertain competitive strategy followed at Max restaurants, which is the differentiation strategy.
3.4.4 Data analysis According to Finn and Wang (2014) valid measures are imperative for development and testing business theory, therefore, especially in classical test theory, in order to study the relationship between the construct (i.e. latent variable) and its indicators (i.e. observed variables). For this purpose, two measurement perspectives have been studied, namely formative and reflective perspectives. In formative, latent variable is measured and caused by indicators (observed variables) while in reflective, observed variables interpret latent variable (Diamantopoulos and Winklhofer,2001; Finn and Wang, 2014). In this paper, reflective perspective was implemented, each construct is interpreted by indicators, for example, servicescape as a construct is interpreted by fives indicators i.e. its relative questions, service quality is interpreted by nine indicators i.e. its relative questions, and so forth. The reason for choosing the reflective approach is that, indicators can be interchanged and removal of one indicator does not change the construct; thus, easy use and flexibility in interpreting each construct (Diamantopoulos and Winklhofer, 2001). Another important reason for choosing reflective rather than formative perspective is the ability to assess the validity and reliability of measures using factor analysis and assessment of internal consistency (Diamantopoulos and Winklhofer, 2001). For this purpose, SPSS software was used in the analysis, since the validity and reliability of measures can be carried out easily. The purpose of using SPSS (Statistical Package for the Social Sciences) was, it helped present data in more scientific and reliable way. It enabled the authors test hypotheses of the research using different tools like ANOVA one-Way, exploratory factor analysis (EFA) and finding mean the mean average and the standard deviation and error for every construct efficiently. Thus, it saved time and efforts during the analysis work
3.5 Trustworthiness
3.5.1 Reliability The reliability of measures is affected by four factors (Saunder, 2003). These factors are: participant error, participant bias, observer’s bias and observer’s error. However, some methods were suggested to overcome such problems. Muijis (2004) discussed two ways to identify the reliability. Either by repetition of measurement with which same results will be shown at different periods of time, or the internal consistency. Internal consistency is measured by finding the correlation among observed variables. According to Easterby-Smith et al. (2015), the reliability of latent variables depends on the average correlation between indicators that is the observed variables and is often measured by finding the Cronbach’s alpha coefficient. The greater value is (>0, 7), the better level of reliability (Easterby-Smith et al., 2015).

16
Therefore, in this paper, consistency method was used; SPSS was used to get the Cronbach’s alpha coefficient for every construct. The value of alpha was found for constructs for all the four service characteristics and customer satisfaction as shown by the analysis section.
3.5.2 Validity Since the validity of measures has become imperative in research, extensive techniques therefore have developed in the last decades (Diamantopoulos and Winklhofer, 2001). Among these techniques, exploratory factor analysis (EFA) and confirmatory factor analysis (CFA) were established. EFA is used to measure certain factors using a set of observed factors without “imposing a preconceived structure on the outcome” however; CFA is used to measure existing construct or questionnaire without exploring it in order just to confirm it (Suhr, 2006). EFA can be carried out using the SPSS software while CFA needs special equation model software (Easterby-Smith et al., 2015). Therefore, in this paper, EFA were implemented to measure the validity of constructs, the four service characteristics are the construct having 22 questions as observed variables, According to Easterby-Smith et al. (2015). EFA may have same number of common factors as observed variables, which have loading on all common factors. Common factor analysis and component factor analysis are commonly used in the analysis. Specifically, in this research principal component factor analysis were conducted, according to Suhr (2005) principal component factor analysis is a variable reduction technique, commonly used to reduce to number of observed variables into smaller principal components encompassing most of the variance in observed variables. Doing so, SPSS program was used for this purpose. Measurements and results discussions are shown in the analysis section.

17
4. Results
This chapter presents the results of the survey questionnaires with the classification of data based on a number of factors including the four service characteristics being studied.
4.1 Fast-food overview
The term fast food is given to foods that are served quickly. The idea of fast foods started in US when White castle restaurant opened first restaurant in 1920’s. People liked the idea and it became quite popular. This inspired other to gradually start open fast food restaurants, such as the seven–eleven, KFC and then McDonald’s (Nguyen Thi Bich andBalami, 2011). The reason behind the rapid increase of this industry is its market profitability compared to other food industries. It generates over $570 billion revenues which is greater than economic value of many countries. The industry opened 200, 000 job opportunities in 2015 in the United States (Franchise Help, 2016). Further, it has been expected that the industry is going to have and incremental growth of 2.5% in the next coming years. However, looking into Swedish market, fast food industries registered 2% growth in 2014 compared with 2013 in spite of wellness and strong health trend by Swedes. Strong and intensive competition is created between restaurants in two different corners that is price and quality. (Franchise Help, 2016) For example Max burger that produces special types of burgers in terms of quality, using organic and natural ingredients to achieve customer’s trend and McDonald’s in terms of price which led the market and accounted 26% of fast food sales in 2014 through very successful advertising campaigns (Nguyen Thi Bich andBalami, 2011).
4.1.1 McDonald’s McDonald’s was found by brothers Dick and Mac Donald’s in 1948 in California, United States. The restaurant started selling barbecue meals with different varieties of meals, the menu contained nine items which were: “hamburger, cheese burger, soft drinks, milk, coffee, potato chips and slice of pie” (Nguyen Thi Bich and Balami, 2011 p. 29). In 1954, Ray Kroc’s curiosity spurred to take a look at McDonald’s restaurant when he knew that they were using eight of his machines. That day he met one of his friends who suggested new ideas to improve burgers recipe He believed that McDonald’s was on the way of success (Wikipedia, history of McDonald’s, 2016), so, he suggested franchising the restaurant in the country which was not the brothers’ priority. He took the approval from the brothers and established the first Kroc’s McDonald’s restaurants in 1955. Few years later, the restaurant was purchased by Kroc for 2, 7 million USD aiming to reach all cities of US. In 1965, McDonald’s went public with common share price of 22, 5 $ per share. The rapid success of McDonald’s was due to skilful marketing mind-set and flexibility to achieve customer demands. It was always suggesting different types of meals with new tastes. In 1968, when McDonald’s launched the legendary Big Mac burger which has made big impact in fast food markets. In 1969, five billion of big Mac burger was sold (Wikipedia, history of McDonald’s, 2016). According to statistics, McDonald’s has 32000 restaurants in 119 countries in the world serving more than 60 million people every day (McDonald’s, 2016). However, in 1968 when McDonald’s had just went public Max burger was founded in Sweden by Curt Bergfors in Gällivare, Sweden. Today Max has 103 restaurants in Sweden (Max, 2016). On the other hand, McDonald’s as the largest fast food chain has expanded the food chain because of its observance to serve customers according to the culture and religious background of customers in every country as shown in the table 1 below. (Nguyen Thi Bich and Balami, 2011, p.30)

18
Table 1: Cultural diversity in McDonald’s menu (Nguyen Thi Bich and Balami, 2011 p 30)
S.N.
Country Popular Product Key ingredients Local Customs & Religious belief
1. India Maharja Mac instead of BigMac Chicken or Lamb Beef is prohibited
2. Norway McLaks- Asandwich Grilled salmon & Dillsauce Fish-loving
3. Germany Big Mac with PilsnerBeer Beer GermanBeer
4. Canada Mclobster- a lobsterroll Lobster
5. Japan
TeriyakiMcBurger Ebi-chiki
EbiFilet-O Green Tea flavoured
milkshake
Pork-patties Shrimp-nuggets Shrimp-burger
Japanese flavor
6. Chile Burger with avocado sauce Sauce made by avocado No ketchup
7. Saudi Arabia Mc Arabia
A grilled chicken served on a flatbread
sandwich
No pork products and all meat sold is halal
8. Sweden McFeast
A quarter pound patty, lettuce,
mayonnaise, tomato, onion.
Swedish flavor
9. Greece Greek Mac Burgers made of
patties wrapped in pita bread.
10. Hongkong Rice burgers Burger served in two
rice patties. Rice loving country
11. Uruguay McHuevo A regular hamburger
but topped with a poached egg.
On the other hand, it was imperative to emphasize on McDonald’s competitive strategy. According to Schmenner (2004) “Highly productive name companies such as Southwest Airlines, Wal-Mart, and McDonald’s are all examples of services that have been refashioned for lower throughput time and/or for less variation than their competitors, either by the design of the service itself or by the operation that has been developed to deliver that service” (p. 341). In this sense, the statement confirms that McDonald is following cost leadership strategy, further, this was also illustrated by Miles (2013).
4.1.2 Max Burger It is the oldest fast food restaurant in Sweden founded by Curt Bergfors in Gällivare in 1968.Richard Bergfors, the eldest son is currently the president since 2002. Max restaurant was considered as the largest fast food restaurant in northern Sweden till 1980’s. However, Bergfors decided not stay in north but to expand Max’s activities in 1990’s to become a nationwide fast food restaurant. In 2015, Max’s management opened the 100th restaurant in Lidingö, the place where Curt Bergfors came with the idea to open the first fast food chain in Sweden. Today Max chain has 103 restaurants in Sweden and opened new additional restaurants in Norway and Denmark. The core activities and features of Max is to serve the tastiest and healthier burgers. Furthermore, Max has worked several years to mitigate the climate and environmental impacts by planting

19
trees in Africa. According to Max website, below are some activities that differentiate Max from other fast food restaurants:
• Max’s brand depends on the heritage of Sweden as one of the tools to compete other fast food chains especially McDonald’s and Burger King (Nguyen Thi Bich and Balami, 2011).
• At Max, quality and fresh ingredients are key driver that differentiates it from other. Every year Max management assesses the fat statement to check whether the food they deliver are healthier, that is, a very low amount of fat. Max not only delivers regular burger but also the healthier such as the deli-fresh meals that varies from 4% to 12,5% fat. Max sells further its own made of salads sauce, local beef and chicken. “Max begins to describe how it works with the health issue in fat financial statements. Results during first year are minus 83 tons of fat in 2003” (Max Hamburgerrestauranger AB, 2016).
• Max offers free Wi-Fi and background music in all of its branches; furthermore, it was the first fast food restaurants that launched food order and payment directly into mobile phone apps ((Max Hamburgerrestauranger AB, 2016).
• Max has created unique products called the low-carbohydrate burger and low carb-burger to support carbohydrate diets like the Glycemic Index and Atkins (Max Hamburgerrestauranger AB, 2016).
• In 2009, Max won environmental current test against of McDonald’s and Burger King (Max Hamburgerrestauranger AB, 2016).
• CEO of Max, Richard Bergfors won the Publisher’s Award “This year’s Green Capitalist” (Max Hamburgerrestauranger AB, 2016).
• In December, 2015, Max revealed new menu of vegetarian. • In coordination with electric car manufacturer Tesla, Max initiated and build the first supercharger
stations in Sweden for Tesla's cars in 2014 (Max Hamburgerrestauranger AB, 2016) and so many active investments toward green and healthier environment.
• Max was awarded by ISI Wissing the brand survey for 13 years as the best restaurant in Sweden from customer satisfaction point of view, further, Max was awarded by SIFO and ISI Wissing as Sweden’s tastiest hamburger for almost last eight years (Max Hamburgerrestauranger AB, 2016).
In this sense, we elicit that Max burger delivers unique products with high quality and services to customers. Max burger differentiates its products from other. Therefore, it was imperative to emphasize that Max is pursuing differentiation strategy in its chains.
4.2 Descriptive statistics of collected data The survey questionnaires were distributed among respondents in two ways; 60 through online survey and 114 via printed copies. Printed copies of questionnaire were more effective than the online survey. From 60 online questionnaires we got only 4 responses, while 110 responses were collected from the printed questionnaires. Among these 114 responses ten were excluded due to invalidity, either uncompleted questionnaire or choosing two answers simultaneously. As a result, the response rate of the survey was above60 percent. After collection, we categorized them into different groups of participants in terms of gender, mother tongue, visiting frequency and amount of money spent on fast food, especially McDonald’s and Max burger restaurants. The results are demonstrated below. As shown in the table 2 below, among 1the 04 respondents 72 were male and 32 were female, representing 69% and 31% respectively.

20
Table 2: Gender classification of respondents
Male Female Standard Deviation Responses
All Data
72 (69 %)
32 (31 %)
20 104
Figure 7: Gender classification of respondents in pie chart form
Figure 8: Classification of respondents’ w.r.t. age
With regard to the ages we have categorized into three groups, as shown in figure 8.21 were below the age of 20, second group is of people with age between 20 and 40 years. They represent 73 out of 104 respondents. Lastly 10 respondents were over 40 years old. The highest age group is therefore between 20 to 40 years which comprise 70.19% of total respondents whereas 20 or younger are 20.19%. Over 40 represent 9.61% of respondents.
We further classified our respondents on the basis of nationalities. People from different nationalities were asked to fill in the survey questionnaire to try to get to a wide variety of answers. The categorization is shown in table 3 below.
Table 3: Classification of respondents based on nationalities All Data Swedish English German Arab Indian Other Responses
Respondents 75 4 3 8 5 9 104
Percent 72,1% 3,8 % 2,9 % 7,7 % 4,8 % 8,7 % 100 %

21
We also classified our data based on which restaurant they usually visit i.e. McDonald’s, Max or both. This gave us the number of respondents for each restaurant individually. This is shown in table 4 and a pictorial representation of the same in figure 9. Out of 104 respondents 66 usually visit McDonald’s, 33 usually visited Max and 5 respondents usually visited both restaurants. Which means 66% visited McDonald’s, 33 percent visited Max and 5 percent visited both. McDonald’s have a higher percentage which may be due to the fact that it is an internationally recognized fast-food chain restaurant and in business since 1948. Therefore, more people are attracted to it world over. For analysis purpose we included the ones who visit both restaurants as Max visitors only.
Table 4: Respondents based on restaurant visited
Figure 9: Classification of respondents based on visit to restaurant.
We also classified based on the visit frequency which is shown in table 5.; and also based on average spending in a week, which is shown in table 6.
Table 5: Comparison based on visit frequency
Table 6: Comparison based on money spent per week.
Number
Percentage
0
20
40
60
80
100
120
McDonalds Max Both Total
Numberofrespondentsforeachrestaurant
Number Percentage
McDonald’s MaxBurger Both Standard Deviation
Responses
All Data 66 (63.46%)
33 (31.73%)
5 (4.81 %)
23.27 104
1 to 2Times 3 or more 0Times Standard Deviation Responses
All Data
75 (72 %)
4 (4 %)
25 (24 %)
30.27 104
less than 100SEK 100-300SEK More than 300SEK Standard Deviation Responses
All Data 74 (71 %)
28 (27 %)
2 (2 %)
29.77 104

22
From table 5 we see that 72 percent visited once or twice a week, whereas 24 percent did not visit last week. Only 4% visited 3 or more times. Higher frequency of visits helps us with increased reliability of upcoming questions pertaining to our investigations of aligning the four service characteristics in both restaurants. Figure 10 shows a pictorial representation of these statistics.
Since the research is about satisfactions of customers and in order to get a clearer picture on satisfaction some questions were added like how much money do the respondent usually spend per week. From table 6 we see that majority of the respondents, 71% spend less 100 SEK in a week at these restaurants. Just 2% pay more than 300 SEK in a week. The results gave an impression that participants are satisfied to some extent since they revealed that majority visited once a week and are willing to pay some amount of money at McDonald’s and Max restaurants. However, the details handling the satisfaction analyzed in later section. Figure 11 shows these statistics in the form of a pie-chart.
Less than 100SEK 100-300SEK More than 300SEK
Another question added about satisfaction was about getting discount offers. The results showed that majority answered ‘NO’ representing 73% of total respondents and rest 27% answered by ‘YES’. We found that the question could give some level of satisfaction for analysis purposes in next section. The results are shown in table 7 below and a pictorial representation in figure 12.
Figure 10: Pictorial representation of classification based of visit frequency
Figure 11: Spending per week

23
Table 7. Classification based on discounts offered
4.3 Descriptive results: service characteristics In this section, results pertaining to the four service characteristics (i.e., servicescape, service quality, quality and value) are presented and show standard deviation and weighted average for every item, According to business dictionary (2016) weighted average is the mean commonly used in statistical analysis and is calculated by taking the average of each item and multiplied by a weight based on its relative importance, then the result is summed and then divided by “the sum of the weights”. On the other hand, standard deviation is used to measure dispersion of data from its mean, the higher value of standard deviation, means the more dispersion of data, it is calculated by taking square root of variance (Investopedia, 2016).
4.3.1 Servicescape In this part, results of servicescape characteristic are shown. It consists of five elements which were deemed relatively important in order to visualize clear image about the importance of servicescape in fast food restaurants especially McDonald’s and Max in Sweden. As shown in the table 8 shown below. The overall impression from 104 respondents is 3,43 out five that is relatively acceptable level of servicescape however this outcome will be analyzed in details in the analysis section.
4.3.2 Service quality In this section nine elements were considered relatively important in order to reflect the service quality characteristic and therefore were added into the questionnaire of our survey. Individual and overall results of these elements are shown in the table 9 below. As we see the overall average of service quality is 3,6 out of 5.
Yes No Standard Deviation Responses
All Data 28 (27 %)
76 (73 %)
22.5 104
Figure 12: Pie-chart of discounts offered

24
Table 8: Descriptive results for servicescape
Table 9: Descriptive results for service quality
4.3.3 Quality The service characteristic quality uses five elements which were considered important to define quality in service firms especially fast food restaurants. As shown in table 10 below. Results scored good level of quality
Strongly Disagree Disagree Neutral Agree
Strongly Agree
Standard Deviation
Responses Weighted Average
Staff are always neatly and smartly dressed
2 (2 %)
6 (6 %)
33 (32 %)
46 (44 %)
17 (16 %)
16.56 104 3.67/5
The decor (paintings, wall colors, pictures) is attractive
1 (1 %)
20 (19 %)
28 (27 %)
43 (41 %)
12 (12 %)
14.25 104 3.43/5
The light settings are appropriate.
2 (2 %)
7 (7 %)
15 (14 %)
68 (65 %)
12 (12 %)
24.01 104 3.78/5
The background music is good and gives a positive feeling.
7 (7 %)
18 (17 %)
47 (45 %)
26 (25 %)
6 (6 %)
15.04 104 3.06/5
The level of cleanliness is good. (floors, tables, toilets)
3 (3 %)
24 (23 %)
34 (33 %)
35 (34 %)
8 (8 %)
13.17 104 3.2/5
3.43/5
Strongly Disagree
Disagree Neutral Agree Strongly Agree
Standard Deviatio
n
Responses
Weighted Average
Attitude of staff is very professional.
2 (2 %)
13 (13 %)
30 (29 %)
52 (50 %)
7 (7 %)
18.24 104 3.47/5
Opening hours are suitable. 2 (2 %)
8 (8 %)
4 (4 %)
59 (57 %)
31 (30 %)
21.74 104 4.05/5
Access to booking counters inside and in drive-thru is easy.
0 (0 %)
1 (1 %)
22 (21 %)
61 (59 %)
19 (18 %)
22.11 103 3.95/5
Waiting times in the queue to order food are short.
0 (0 %)
16 (15 %)
29 (28 %)
48 (46 %)
11 (11 %)
16.49 104 3.52/5
Waiting time to get ordered food is short.
1 (1 %)
11 (11 %)
36 (35 %)
48 (46 %)
8 (8 %)
18.02 104 3.49/5
I receive the order food without any mistakes.
2 (2 %)
16 (15 %)
21 (20 %)
46 (44 %)
19 (18 %)
14.25 104 3.62/5
Staff are keen to give personalized information services.
5 (5 %)
10 (10 %)
39 (38 %)
45 (43 %)
5 (5 %)
17.51 104 3.34/5
Additional services are available (Wi- Fi, toys for children etc.).
2 (2 %)
12 (12 %)
32 (31 %)
42 (40 %)
16 (15 %)
14.34 104 3.56/5
I receive the order with attractive packing.
0 (0 %)
13 (13 %)
48 (46 %)
33 (32 %)
10 (10 %)
17.31 104 3.38/5
3.6/5

25
in McDonald’s and Max burger with overall weighted average 3,81/5. A detailed analysis will be done in the analysis chapter.
4.3.4 Value The service characteristic value is represented by three important elements, which were added in the survey of the research. The results are shown in table 11 below. The overall weighted average scored is 3,27/5 which is quite lower than other service characteristics, which shows that the respondents are generally not very happy with the value they get from these restaurants. A detailed analysis is presented in the analysis chapter.
Table 10: Descriptive results for quality Strongly
Disagree Disagree Neutral Agree Strongly
Agree Standard Deviation
Responses Weighted Average
The Burgers taste excellent. 3 (3 %)
12 (12 %)
20 (19 %)
50 (48 %)
19 (18 %)
15.82 104 3.67/5
I love the vegetables and salad that comes within the burger meal.
7 (7 %)
12 (12 %)
26 (25 %)
43 (41 %)
16 (15 %)
12.73 104 3.47/5
I love the French fries that come along with the meal.
1 (1 %)
5 (5 %)
21 (20 %)
44 (42 %)
33 (32 %)
16.3 104 3.99/5
A wide variety of drinks are available to choose from.
1 (1 %)
6 (6 %)
15 (14 %)
59 (57 %)
23 (22 %)
20.54 104 3.93/5
A wide variety of meals are there in the menu.
2 (2 %)
4 (4 %)
13 (13 %)
58 (56 %)
27 (26 %)
20.59 104 4/5
3.81/5
Table 11: Descriptive results for value
4.4 Satisfaction In this section, overall satisfaction levels were taken from the chosen customers of McDonald’s and Max. They were asked about the reason of visiting these restaurants. They were given opportunity to choose one or more options, even all of them. Four of the five choices presented the four service characteristics of the research. The results came as shown in figure 13 below. Detailed analysis is performed in next section.
Strongly Disagree
Disagree Neutral Agree Strongly Agree
Standard Deviation
Responses Weighted Average
I am happy with the price of the meal I usually order.
9 (9 %)
15 (14 %)
25 (24 %)
45 (43 %)
10 (10 %)
13.36 104 3.31/5
The restaurant has reasonable prices for all meals in the menu.
4 (4 %)
17 (17 %)
30 (29 %)
43 (42 %)
9 (9 %)
14.24 103 3.35/5
The price matches the quality of meal.
6 (6 %)
24 (23 %)
28 (27 %)
39 (38 %)
6 (6 %)
12.89 103 3.15/5
3.27/5

26
Figure 13: Satisfaction levels from respondents
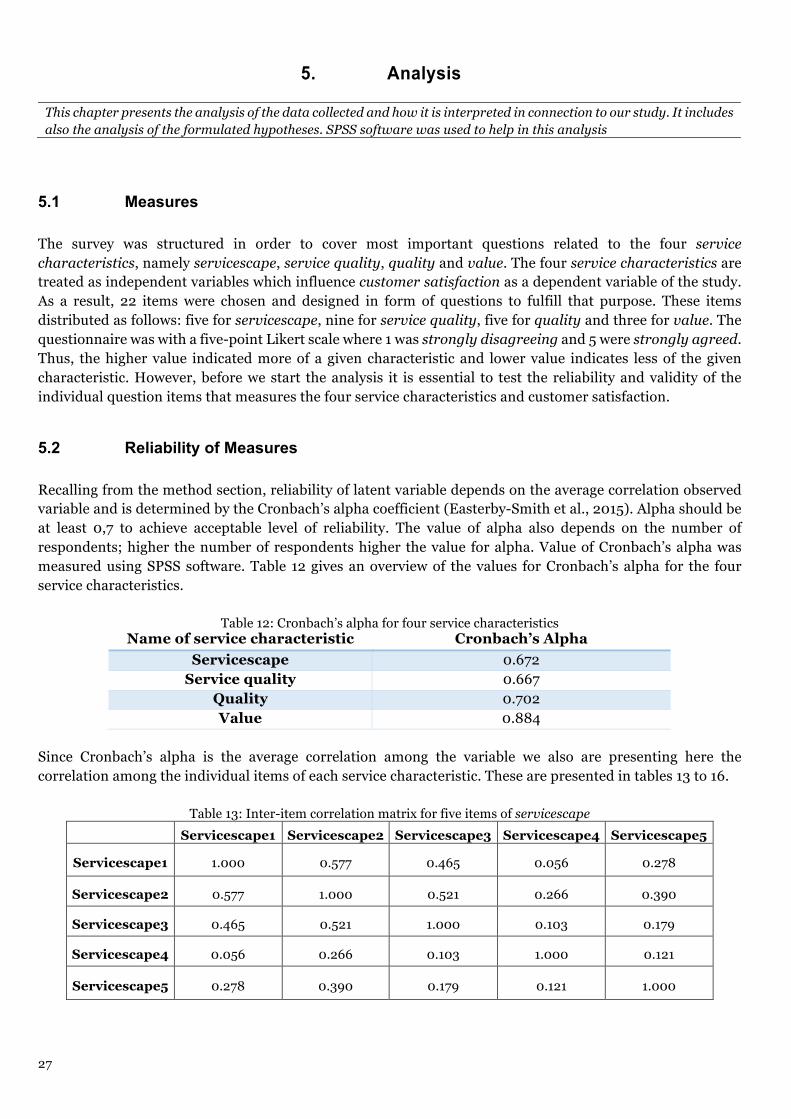
27
5. Analysis
This chapter presents the analysis of the data collected and how it is interpreted in connection to our study. It includes also the analysis of the formulated hypotheses. SPSS software was used to help in this analysis
5.1 Measures The survey was structured in order to cover most important questions related to the four service characteristics, namely servicescape, service quality, quality and value. The four service characteristics are treated as independent variables which influence customer satisfaction as a dependent variable of the study. As a result, 22 items were chosen and designed in form of questions to fulfill that purpose. These items distributed as follows: five for servicescape, nine for service quality, five for quality and three for value. The questionnaire was with a five-point Likert scale where 1 was strongly disagreeing and 5 were strongly agreed. Thus, the higher value indicated more of a given characteristic and lower value indicates less of the given characteristic. However, before we start the analysis it is essential to test the reliability and validity of the individual question items that measures the four service characteristics and customer satisfaction.
5.2 Reliability of Measures Recalling from the method section, reliability of latent variable depends on the average correlation observed variable and is determined by the Cronbach’s alpha coefficient (Easterby-Smith et al., 2015). Alpha should be at least 0,7 to achieve acceptable level of reliability. The value of alpha also depends on the number of respondents; higher the number of respondents higher the value for alpha. Value of Cronbach’s alpha was measured using SPSS software. Table 12 gives an overview of the values for Cronbach’s alpha for the four service characteristics.
Table 12: Cronbach’s alpha for four service characteristics Name of service characteristic Cronbach’s Alpha
Servicescape 0.672 Service quality 0.667
Quality 0.702 Value 0.884
Since Cronbach’s alpha is the average correlation among the variable we also are presenting here the correlation among the individual items of each service characteristic. These are presented in tables 13 to 16.
Table 13: Inter-item correlation matrix for five items of servicescape Servicescape1 Servicescape2 Servicescape3 Servicescape4 Servicescape5
Servicescape1 1.000 0.577 0.465 0.056 0.278
Servicescape2 0.577 1.000 0.521 0.266 0.390
Servicescape3 0.465 0.521 1.000 0.103 0.179
Servicescape4 0.056 0.266 0.103 1.000 0.121
Servicescape5 0.278 0.390 0.179 0.121 1.000
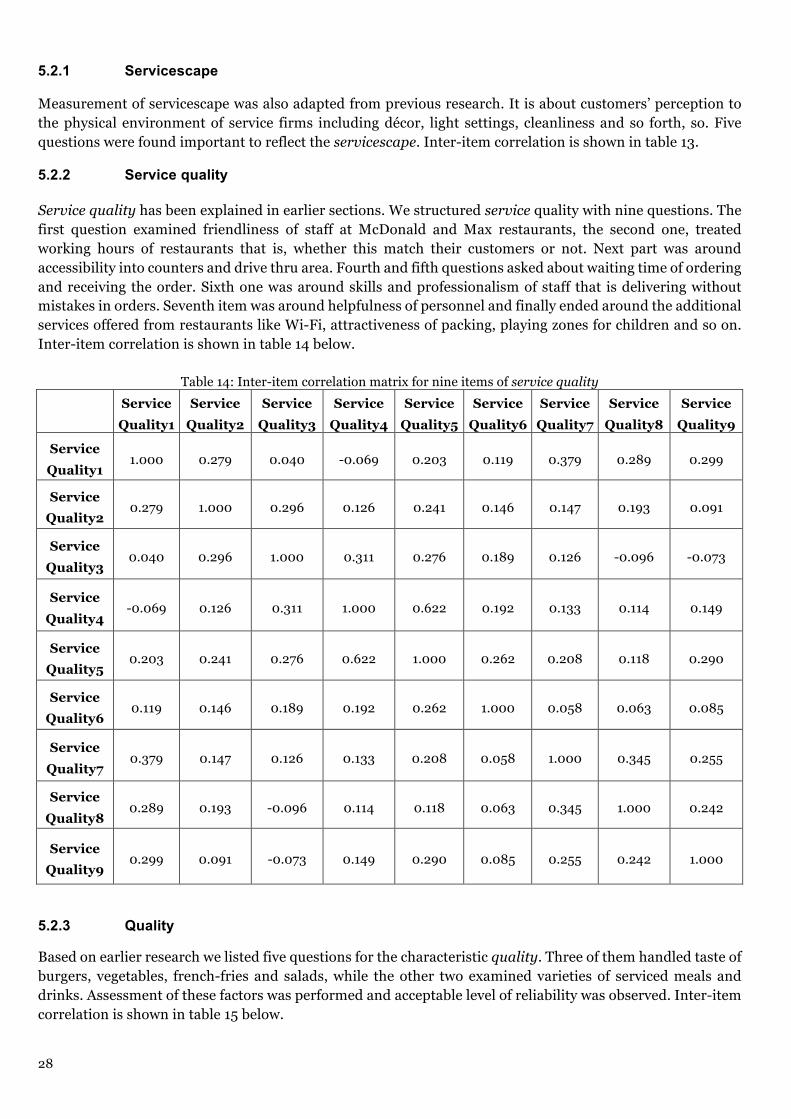
28
5.2.1 Servicescape Measurement of servicescape was also adapted from previous research. It is about customers’ perception to the physical environment of service firms including décor, light settings, cleanliness and so forth, so. Five questions were found important to reflect the servicescape. Inter-item correlation is shown in table 13.
5.2.2 Service quality Service quality has been explained in earlier sections. We structured service quality with nine questions. The first question examined friendliness of staff at McDonald and Max restaurants, the second one, treated working hours of restaurants that is, whether this match their customers or not. Next part was around accessibility into counters and drive thru area. Fourth and fifth questions asked about waiting time of ordering and receiving the order. Sixth one was around skills and professionalism of staff that is delivering without mistakes in orders. Seventh item was around helpfulness of personnel and finally ended around the additional services offered from restaurants like Wi-Fi, attractiveness of packing, playing zones for children and so on. Inter-item correlation is shown in table 14 below.
Table 14: Inter-item correlation matrix for nine items of service quality
ServiceQuality1
Service Quality2
Service Quality3
Service Quality4
ServiceQuality5
ServiceQuality6
ServiceQuality7
Service Quality8
Service Quality9
Service Quality1
1.000 0.279 0.040 -0.069 0.203 0.119 0.379 0.289 0.299
Service Quality2
0.279 1.000 0.296 0.126 0.241 0.146 0.147 0.193 0.091
Service Quality3
0.040 0.296 1.000 0.311 0.276 0.189 0.126 -0.096 -0.073
Service Quality4
-0.069 0.126 0.311 1.000 0.622 0.192 0.133 0.114 0.149
Service Quality5
0.203 0.241 0.276 0.622 1.000 0.262 0.208 0.118 0.290
Service Quality6
0.119 0.146 0.189 0.192 0.262 1.000 0.058 0.063 0.085
Service Quality7
0.379 0.147 0.126 0.133 0.208 0.058 1.000 0.345 0.255
Service Quality8
0.289 0.193 -0.096 0.114 0.118 0.063 0.345 1.000 0.242
Service Quality9
0.299 0.091 -0.073 0.149 0.290 0.085 0.255 0.242 1.000
5.2.3 Quality Based on earlier research we listed five questions for the characteristic quality. Three of them handled taste of burgers, vegetables, french-fries and salads, while the other two examined varieties of serviced meals and drinks. Assessment of these factors was performed and acceptable level of reliability was observed. Inter-item correlation is shown in table 15 below.

29
Table 15: Inter-item correlation matrix for five items of quality Quality1 Quality2 Quality3 Quality4 Quality5
Quality1 1.000 0.540 0.267 0.220 0.378
Quality2 0.540 1.000 0.222 0.185 0.428
Quality3 0.267 0.222 1.000 0.274 0.281
Quality4 0.220 0.185 0.274 1.000 0.415
Quality5 0.378 0.428 0.281 0.415 1.000
5.2.4 Value The measure of value has been defined earlier in relation to this research. Three questions were formed to evaluate customers’ perception value of products and services delivered by McDonalds and Max restaurants. First two questions examine overall prices of products sold to customers, while third questions constructed to ensure the level of quality with the price. The observed records showed a high value for reliability for value (Cronbach’s alpha = 0.884). Inter-item correlation is shown in table 16 below.
Table 16: Inter-item correlation matrix for three items of value Value1 Value2 Value3
Value1 1.000 0.781 0.660
Value2 0.781 1.000 0.724
Value3 0.660 0.724 1.000
5.2.5 Customer Satisfaction This evaluation is performed by structuring a set of questions that reflect customer satisfaction. Therefore, some questions were created to cover that concept, such as questions related to what make customers usually visit the restaurant. Measuring the visiting frequency and the amount of money spend during the visit and finally recommendations of these restaurants to friends and people.
5.3 Validity of measures
As mentioned earlier that it is more appropriate to use EFA for this study. Varimax rotated EFA was conducted using SPSS. As shown in table 17 below, four components were extracted from 22 items representing 23% of the total variance. In general, these factors represent the four service characteristics of the study. The table shows the loading of 22 observed items on the four factors. Factor loading of at least 0.4 was considered and shown in the table. Lower values were omitted. The first factor, labelled servicescape, accounts for 12% of the extracted variance. The second factor, labelled service quality, accounts for 8% of the extracted variance. The third factor, labelled quality accounts for 5% of the extracted variance and lastly the fourth factor, labelled value accounts for 4% of the extracted variance. There were 104 participants in our sample, divided into two groups, first group consisted of 38 participants and the second group comprised 66 participants. They were Max and McDonalds frequent visitors respectively. We analysed the data in order to assert that the 22 items i.e., the questions of survey were loaded on its appropriate factor. We have also earlier described that all the four factors had acceptable level of alpha. As a result, the items of each factor were averaged in order to have single score for every variable and these scores were implemented to analyse the given hypotheses.

30
Table 17: Component factor analysis Component
1 2 3 4 SERVICESCAPE1 0.779
SERVICESCAPE2 0.614 0.490
SERVICESCAPE3 0.543
SERVICESCAPE4 0.762
SERVICESCAPE5 0.410
SERVICE QUALITY1 0.646
SERVICE QUALITY2
SERVICE QUALITY3 0.538
SERVICE QUALITY4 0.784
SERVICE QUALITY5 0.747
SERVICE QUALITY6 0.488
SERVICE QUALITY7 0.448
SERVICE QUALITY8 0.520
SERVICE QUALITY9 0.609
QUALITY1 0.495 0.429
QUALITY2 0.514
QUALITY3 0.492
QUALITY4 0.412 0.407
QUALITY5 0.553 -0.403
VALUE1 0.841
VALUE2 0.870
VALUE3 0.845
5.4 Analysis of hypotheses In order to achieve the purpose of our study we created a dependent variable called customer satisfaction. SPSS eases the task of analysis. A descriptive statistics results was conducted to find the mean values of each of the four service characteristics for McDonald’s and Max independently. These statistical analysis results are shown in table 18 below. The dependent variable customer satisfaction contains the mean value of the individual means of the four service characteristics for every respondent. To test the hypotheses further, an independent samples t-test was conducted to compare the means of the two groups, i.e. McDonald’s and Max. The results of these tests for the four service characteristics i.e. servicescape, service quality, quality and value and the dependent variable i.e. customer satisfaction are shown in table 19.
H1: Alignment of servicescape is more significant to firms following differentiation strategy. H1 is not supported: The mean values for servicescape are 3.448 and 3.395 for McDonald’s and Max respectively. Max has the lower mean, which suggests that there is no significant difference for servicescape for cost leader and differentiator firms. Moreover, independent sample t-test results show a significance level of 0.666, which is greater than 0.05. This means that H1 is not supported. Hence servicescape is not of much significance to differentiator firms in comparison to cost leader firms.

31
H2: Alignment of service quality is more significant to firms following differentiation strategy. H2 is not supported: The mean values for service quality are 3.589 and 3.608 for McDonald’s and Max respectively. Although Max has the higher mean but the difference is very small, which suggests that there is no significant difference for service quality for cost leader and differentiator firms. Moreover, independent sample t-test results show a significance level of 0.853, which is greater than 0.05. This means that H2 is not supported. Hence service quality is not of much significance to differentiator firms in comparison to cost leader firms.
H3: Alignment of quality is more significant to firms following differentiation strategy.
H3 is not supported: The mean values for quality are 3.8 and 3.837 for McDonald’s and Max respectively. Although Max has the higher mean but the difference is very small, which suggests that there is no significant difference for quality for cost leader and differentiator firms. Moreover, independent sample t-test results show a significance level of 0.777, which is greater than 0.05. This means that H3 is not supported. Hence quality is not of much significance to differentiator firms in comparison to cost leader firms.
H4: Alignment of value is more significant to firms following cost leadership strategy.
H4 is not supported: The mean values for value are 3.321 and 3.158 for McDonald’s and Max respectively. Although McDonald’s has the higher mean but the difference is very small, which suggests that there is no significant difference for value for cost leader and differentiator firms. Moreover, independent sample t-test results show a significance level of 0.390, which is greater than 0.05. This means that H4 is not supported. Hence value is not of much significance to cost leader firms in comparison to differentiator firms.
H5: Regardless of firms’ strategy, customer satisfaction is consistent for firms following differentiation strategy and cost leadership strategy.
Independent sample t-test results show a significance level of 0.853 for the dependent variable customer satisfaction, which is greater than 0.05. This means that H5 is not supported. Hence a firm’s strategy (cost leadership or differentiation) does not play any significant role in achieving customer satisfaction when observed with the four service characteristics i.e., servicescape, service quality, quality and value.
Table 18: Descriptive Statistics for four observed service characteristics
N Mean Std. Dev. Variance
Statistic Statistic Std. Error Statistic Statistic McDONALD’S
SERVICESCAPE 66 3.348 0.079 0.642 0.412 SERVICE QUALITY 66 3.589 0.060 0.485 0.235
QUALITY 66 3.800 0.070 0.569 0.324 VALUE 66 3.321 0.119 0.966 0.934
MAX SERVICESCAPE 38 3.395 0.089 0.547 0.299
SERVICE QUALITY 38 3.608 0.068 0.417 0.174 QUALITY 38 3.837 0.120 0.742 0.551
VALUE 38 3.158 0.146 0.903 0.815

32
Table 19: Independent sample t-test results
Levene's Test for
Equality of Variances
t-test for Equality of Means
F Sig. t Df Sig. (2-
tailed) Mean Diff.
Std. Error Diff.
95% Confidence
Interval of the Difference
Lower Upper
SERVICESCAPE
Equal variances assumed
1.563 0.214 -0.433 102 0.666 -0.054 0.124 -0.300 0.192
Equal variances not assumed
-0.452 87.592 0.652 -0.054 0.119 -0.290 0.183
SERVICEQUALITY
Equal variances assumed
0.408 0.524 0.185 102 0.853 0.017 0.094 -0.168 0.203
Equal variances not assumed
0.193 86.692 0.848 0.017 0.090 -0.162 0.196
QUALITY
Equal variances assumed
0.493 0.484 0.284 102 0.777 0.037 0.13 -0.221 0.294
Equal variances not assumed
0.264 62.209 0.792 0.037 0.139 -0.242 0.315
VALUE
Equal variances assumed
0.017 0.897 -0.863 102 0.390 -0.166 0.192 -0.546 0.215
Equal variances not assumed
-0.878 81.416 0.383 -0.166 0.188 -0.540 0.210
SATISFACTION
Equal variances assumed
0.157 0.693 -0.207 102 0.837 -0.019 0.094 -0.206 0.167
Equal variances not assumed
-0.205 75.997 0.838 -0.019 0.0944 -0.207 0.169
Table 20 shows a summarization of the results of five hypotheses. Whether they are supported or not.
Table 20: Summarization of results of hypotheses analysis Number Hypothesis Statement Result
H1 Alignment of servicescape is more significant to firms following differentiation strategy. Not supported
H2 Alignment of service quality is more significant to firms following differentiation strategy. Not supported
H3 Alignment of quality is more significant to firms following differentiation strategy. Not supported
H4 Alignment of value is more significant to firms following cost leadership strategy. Not supported
H5 Regardless of firms’ strategy, customer satisfaction is consistent for firms following differentiation strategy and cost leadership strategy.
Not supported

33
6. Discussion
This chapter’s first part is comments on the analysis from the previous chapter. It discusses the results of the hypotheses and later section provides the limitations of this research and future suggestions.
According to our analysis, none of the hypotheses were supported, indicating that there is no significance difference of aligning the four studied service characteristics (i.e. servicescape, service quality, quality and value) with in service firms working in the same industry, specifically, fast food industry. Looking in to each service characteristic individually, for example, starting from hypothesis H1 is not supported, pertained to servicescape characteristic (i.e. physical environment, décor, paintings pictures and overall cleanliness), we found that service firms that is McDonald’s and Max burger prioritize servicescape factor in order to maintain customer satisfaction, although McDonald’s is pursuing cost leadership strategy i.e. focusing to minimize in labour cost and or efficiencies in supply chain and so forth to keep low prices. The reason behind this could be of the market type, in other words, different market could compel firms to change and/or modify in their strategies. It is found that following the strategy of low prices is not the right choice for service firms specifically fast food restaurants to compete at least in Swedish market, regardless of firm size or whether the firm is global or not like in McDonald’s. Thus, servicescape factor plays prominent role in for all firms and this has made McDonald’s acknowledge the situation and invest more in servicescape factor.
Further, according to the analysis, hypothesis H2 is not supported, that is pertained to service quality characteristic (i.e. fast delivery of food, professionalism of staff and so forth), meaning that service quality factor represents also another important factor for both firms to satisfy customers. As shown there were no significant differences in the importance level to this factor. It looks that McDonald’s and Max burger is investing largely to deliver high quality of service to satisfy their customers. Similarly, hypothesis H3 also was not supported, that is related to quality service characteristic, giving sign that McDonalds and Max are also taking in consideration to have higher level of quality in their products, regardless of strategies especially when we talk about McDonald’s competitive strategy. The reason behind this could be due to requirement of specific or higher level of quality in their products and thus has made McDonald’s meet the needs, however, Max burger on the other hand, as we have found is investing more in service quality and quality factors rather than in value. It focuses to be always the best in terms of customer satisfaction and tastiest food in Sweden
On the other hand, we found that hypothesis H4 that is pertained to the value is not supported also, meaning that McDonald’s and Max have the same level of prioritizing the value factor. It is not strange for McDonald’s to focus value since it generally pursues cost leadership strategy and delivers products at low prices. However, what is interesting, Max restaurant in addition to its differentiating strategy focuses also on prices of products and therefore competing intensively McDonald’s and other fast food restaurants. The reason behind this, is customers besides the quality look also for low or acceptable level of prices in this industry. A value service characteristic is therefore vital and important factor in fast food industry. Finally, what is interesting to notice that hypothesis H5 is not supported, meaning that, customers have recognized what is expected from both firms to be satisfied, at least in terms of the four services and the outputs match their expectations.
Another possible reason for the hypotheses not being supported could be that Max may not be following differentiation strategy or McDonald’s may not be following cost leadership strategy. In the Swedish market they could be following different strategies. Speaking of different strategies, they could be using a combination strategy; combining cost-leadership and product differentiation strategies to achieve market needs and satisfy customers accordingly. Therefore, such a possibility would generate very similar mean values for the four observed service characteristics.
6.1 Conclusion Our assumption was that some service characteristics will be more significant to the firms following cost leadership strategy and some will be more significant to the firms following differentiation strategy. These assumptions were not supported from the collected data. We conclude from this that firms working similar industry would align their service characteristics in similar ways with their competitive strategies to maintain customer satisfaction. Specifically speaking, due to intensive competition as in Sweden, fast-food restaurants,

34
would prioritize all of their service characteristics in order differentiate themselves and capture the market. This conforms to Schmenner (2004) when he found that service firms can be hugely profitable anywhere in his matrix. This would therefore, make firms combine two strategies together to achieve customer needs and create competitive advantage and ultimately increase profitability. Studying firms’ characteristics individually rather than the whole industry gives clearer and specific picture of understanding all relevant nuances and finer issues in how they utilize their own service characteristics in accordance with competitive strategies. This clearly gives conclusion that not only increase of productivity would increase profitability; however, there are some other factors such as quality and servicescape for example are also important for firms to be profitable. As a result, this research highlights the importance of linking firms’ competitive strategies with service characteristics choices in order to improve customer satisfaction which in turn can make companies more profitable. We hope that our empirical results and outcome help contribute in providing management levels with some important tools to define the most payoff service characteristics in accordance with market needs.
6.2 Limitations Time limitation was the biggest limitation in our thesis. Due to the shortage of time getting the survey questionnaires filled was a real challenge. Ideally received survey questionnaires should have had equal number for Max and McDonalds respondents. This unfortunately was not the case in our study. We received total of 104 responses; 66 out of them were from McDonald’s visitors and 33 from Max visitors, 5 visited both which we assigned to Max for the analysis. The response percentage was very high for McDonald’s. An equal response percentage for both restaurants should have given more than authenticity to the results.
Due to time constraints our research had another limitation that we could not investigate the competitive strategy being followed by the firms thoroughly. Instead we based this on study from existing literature and studying the companies’ policies and actions. With more time, a detailed investigation could be done through interviews and meeting with the firm’s management to authentically identifies the strategy being followed.
Another limitation in this research is that we chose only two chain fast-food restaurants. The research was conducted in the Swedish market and the respondents were residents of three cities i.e. Jönköping, Gothenburg and Stockholm. By including more chain restaurants, a more elaborative study could have been performed.
6.3 Future Suggestions Our study is a comparative study between McDonald’s and Max. A more elaborative study can be done by including more fast-food chain restaurants. Another suggestion is to use more than one organizations in strategic groups. Still another way is to compare companies who are using a hybrid competitive strategic model. Different industries can also be chosen for similar analysis. The scope of our thesis and time constraints prevented us to conduct a detailed investigation through interviews or meeting with firm’s management to determine their strategy. An investigation about this could be done to authentically identify the strategy chosen by firms under study.

35
References
Acquaah, M., & Yasai-Ardekani, M. (2008). Does the implementation of a combination competitive strategy yield incremental performance benefits? A new perspective from a transition economy in Sub-Saharan Africa. Journal of Business Research, 61(4), 346-354. Baroto, M. B., Abdullah, M. M. B., & Wan, H. L. (2012). Hybrid strategy: a new strategy for competitive advantage. International Journal of Business and Management, 7(20), 120. Brady, M. K., & Cronin Jr, J. J. (2001). Some new thoughts on conceptualizing perceived service quality: a hierarchical approach. Journal of marketing, 65(3), 34-49. Business Dictionary (2016). Definition of weighted average. Retrieved May, 18th , 2016, from source. http://www.businessdictionary.com/definition/weighted-average.html Bitner, M. J., Booms, B. H., & Mohr, L. A. (1994). Critical service encounters: The employee's viewpoint. The Journal of Marketing, 95-106. Bishop Jr, W. R. (1984). Competitive intelligence. Progressive Grocer, 63(3), 19-20. Bitner, M. J., Zeithaml, V. A., & Gremler, D. D. (2010). Technology’s impact on the gaps model of service quality. In Handbook of service science (pp. 197-218). Springer US. Bryman, A., & Bell, E. (2007). Business Research Methods (Second uppl.). New York: OxfordUniversity Press Inc., . Campbell-Hunt, C. (2000). What have we learned about generic competitive strategy? A meta-analysis. Strategic Management Journal, 21(2), 127-154. Claver-Cortés, E., Pertusa-Ortega, E. M., & Molina-Azorín, J. F. (2012). Characteristics of organizational structure relating to hybrid competitive strategy: Implications for performance. Journal of Business Research, 65(7), 993-1002. Collett Miles, P. (2013). Competitive strategy: the link between service characteristics and customer satisfaction. International Journal of Quality and Service Sciences, 5(4), 395-414. Day, D. L., DeSarbo, W. S., & Oliva, T. A. (1987). Strategy maps: A spatial representation of intra-industry competitive strategy. Management Science, 33(12), 1534-1551. Dabholkar, P. A., Thorpe, D. I., & Rentz, J. O. (1995). A measure of service quality for retail stores: scale development and validation. Journal of the Academy of marketing Science, 24(1), 3-16. Dissertation Help (2016). Importance of SPSS. Retrieved May,18th,2016, from source. http://dissertation-help-uk.blogspot.se/2011/11/importance-of-spss-in-data-presentation.html Dodds, W. B., & Monroe, K. B. (1985). The effect of brand and price information on subjective product evaluations. Advances in consumer research, 12(1). Dickson, P. R., & Sawyer, A. G. (1986). Point-of-purchase behavior and price perceptions of supermarket shoppers. Marketing Science Institute. Damantopoulos, A., & Winklhofer, H. M. (2001). Index construction with formative indicators. Journal of Marketing Research, 38, 269-277. Easterby-Smith, M., Thorpe, R., & Jackson, P. R. (2015). Management and business research. Sage. Finn, A., & Wang, L. (2014). Formative vs. reflective measures: Facets of variation. Journal of Business Research, 67(1), 2821-2826.

36
Franchise Help (2016). Fast food industry report. Retrieved April, 15th, 2016, from source. https://www.franchisehelp.com/industry-reports/fast-food-industry-report/ Gratton, C., & Jones, I. (2004). Research methods for sport studies. Research methods for sport studies. Grönroos, C. (1984). A service quality model and its marketing implications. European Journal of marketing, 18(4), 36-44. Hayes, R. H., & Wheelwright, S. G. (1979). Dynamics of Process-Product Life-Cycles. Harvard business review, 57(2), 127-136 Hussey, D. (1999). Igor Ansoff's continuing contribution to strategic management. Strategic Change, 8(7), 375. Investopedia (2016). Standard deviation. Retrieved May,18th,2016, from source. http://www.investopedia.com/terms/s/standarddeviation.asp Karnani, A. (1984). Generic competitive strategies—an analytical approach. Strategic Management Journal, 5(4), 367-380. Kumar, K., & Subramanian, R. (2011). Porter’s Strategic Types: Differences in Internal Processes and Their Impact On Performance. Journal of Applied Business Research (JABR), 14(1), 107-124. Kuo, Y. F., Wu, C. M., & Deng, W. J. (2009). The relationships among service quality, perceived value, customer satisfaction, and post-purchase intention in mobile value-added services. Computers in human behaviour, 25(4), 887-896. Leedy, P., & Ormrod, J. (2001). Practical research: Planning and design (7th edit). Upper Saddle River, NJ: Merrill Prentice Hall. Li, C. B., & Li, J. J. (2008). Achieving superior financial performance in China: Differentiation, cost leadership, or both?. Journal of international Marketing, 16(3), 1-22. Lynch, R. L. (2006). Corporate strategy. Harlow, England: FT/Prentice Hall. Mintzberg, H. (1987). The strategy concept I: Five Ps for strategy. California management review, 30(1), 11-24. McDonald’s (2016). History of McDonald’s. Retrieved May,14th,2016, from source, http://www.aboutmcdonalds.com/content/mcd/our_company/mcdonalds-history.html Max Hamburgerrestauranger AB (2016).History of Max. Retrieved May, 14th, 2016,from source, https://www.max.se/sv/Om-Max/Historia/ Miles, P., Miles, G., & Cannon, A. (2012). Linking servicescape to customer satisfaction: exploring the role of competitive strategy. International Journal of Operations & Production Management, 32(7), 772-795. Muijs, D. (2004). Doing Quantitative Research in Education with SPSS. SAGE Publications. Murray, A. I. (1988). A contingency view of Porter's “generic strategies”. Academy of Management Review, 13(3), 390-400. Nguyen Thi Bich, D., & Balami, J. M. (2011). Research on response and relations between customers and brand equity: A comparative study of McDonald and Max in Sweden. Oliver, R. L., & Rust, R. T. (1994). Service quality: Insights and managerial implication from the frontier. Parasuraman, A., Zeithaml, V. A., & Berry, L. L. (1988). Servqual. Journal of retailing, 64(1), 12-40.

37
Phillips, L. W., Chang, D. R., & Buzzell, R. D. (1983). Product quality, cost position and business performance: A test of some key hypotheses. The Journal of Marketing, 26-43. Porter, M. E. (1997). Competitive strategy. Measuring Business Excellence, 1(2), 12-17. Saunders, M., Lewis, P., & Thornhill, A. (2003). Research methods for business students. (3rd ed.), England Prentice Hall. Schechter, L. (1984). A normative conception of value. Progressive Grocer, executive report, 2, 12-14. Shankar, V., Smith, A. K., & Rangaswamy, A. (2003). Customer satisfaction and loyalty in online and offline environments. International journal of research in marketing, 20(2), 153-175. Schmenner, R. W. (1986). How can service businesses survive and prosper?. Sloan Management Review (1986-1998), 27(3), 21. Schmenner, R. W. (2004). Service businesses and productivity*. Decision Sciences, 35(3), 333-347. Skinner, W. (1969). Strategy: The missing link in Operations Management. Harvard Business Review, 47(3), 136-145. Suhr, D. D. (2006). Exploratory or confirmatory factor analysis? (pp. 1-17). Cary: SAS Institute. Suhr, D. D. (2005). Principal component analysis vs. exploratory factor analysis. SUGI 30 proceedings, 203, 230. Wakefield, K. L., & Blodgett, J. G. (1996). The effect of the servicescape on customers' behavioral intentions in leisure service settings. Journal of Services Marketing, 10(6), 45-61. Wikipedea. History of Max Humbergers. Retrieved May,14th,2016, from source. https://en.wikipedia.org/wiki/Max_Hamburgers Wikipedea. History of McDonald’s. Retrieved May,14th,2016, from source. https://en.wikipedia.org/wiki/History_of_McDonald's Zeithaml, V. A. (1988). Consumer perceptions of price, quality, and value: a means-end model and synthesis of evidence. The Journal of marketing, 2-22. Zhao, L., Lu, Y., Zhang, L., & Chau, P. Y. (2012). Assessing the effects of service quality and justice on customer satisfaction and the continuance intention of mobile value-added services: An empirical test of a multidimensional model. Decision Support Systems, 52(3), 645-656.

38
APPENDICES
Appendix 1: Survey Questionnaire
SURVEY OF CUSTOMER PERCEPTION OF FAST FOOD RESTAURANT
GENERAL INORMATION
8. How much money do you spend on fast food meals in a week? Less than 100 kr.
100-300 kr. More than 300 kr.
9. Please mark (X) in one the empty boxes opposite each statement for the restaurant you visit
• SERVICESCAPE • Strongly Disagree
• Disagree • Neither agree nor disagree
• Agree • Strongly agree
• Staff are always neatly and smartly dressed • The decor (paintings, wall colours, pictures) is attractive • The light settings are appropriate. • The background music is good and gives a positive feeling. • The level of cleanliness is good. (floors, tables, toilets) SERVICE QUALITY
• Attitude of staff is very professional
• Opening hours are suitable. • Access to booking counters inside and in drive-thru is easy. • Waiting times in the queue to order food are short. • Waiting time to get ordered food is short. • I receive the order food without any mistakes • Staff are keen to give personalized information services • Additional services are available (Wi-Fi, toys for children etc.) • • I receive the order with attractive packing
QUALITY
• The Burgers taste excellent • I love the vegetables and salad that comes within the burger meal
This survey is a part our Master’s thesis in General Management. The questionnaire is formulated in order to have an understanding of the alignment of service characteristics (servicescape, service quality, quality and value) with overall strategy at McDonald and Max Burger.
1. Do you visit McDonald’s or Max Burger? Yes No
2. Which fast food restaurant do you usually visit? McDonald’s Max
3. How many times you visited last week? 0 times 1 to 2 times 3 or more
4. Do you get discounts or special offers on your purchases Yes No
5. Gender Male Female 6. Age 7. Native
Language

39
• I love the French fries that come along with the meal. • A wide variety of drinks are available to choose from. • A wide variety of meals are there in the menu.. VALUE • I am happy with the price of the meal I usually order. • The restaurant has reasonable prices for all meals in the menu. • The price matches the quality of meal.
10. I choose McDonald’s/Max because of: (you may choose more than one)
Price Service Food Quality Environment All
Thank you for your support! If you are interested with the results of the research, please feel free to contact us on the following emails: [email protected] and [email protected]