1687 vol 43#5 art 20.indd
TRANSCRIPT
1687
The Canadian MineralogistVol. 43, pp. 1687-1710 (2005)
PLATINUM-GROUP MINERALS FROM FIVE PLACER DEPOSITS IN BRITISH COLUMBIA, CANADA
ANDREI Y. BARKOV§ AND MICHAEL E. FLEET
Department of Earth Sciences, University of Western Ontario, London, Ontario N6A 5B7, Canada
GRAHAM T. NIXON¶ AND VICTOR M. LEVSON
British Columbia Geological Survey, Ministry of Energy, Mines and Petroleum Resources, PO Box 9320, Stn. Prov. Govt., Victoria, British Columbia V8W 9N3, Canada
ABSTRACT
Platinum-group minerals (PGM) from a selected suite of gold- and platinum-group-element (PGE) placer deposits in British Columbia have been analyzed using the electron-microprobe (EMP). The PGM placer grains (n = 70, 0.1–1.5 mm in size) prin-cipally comprise various Pt–Fe–(Cu) alloys: “Pt3Fe”-type alloys [Fe-rich platinum (formerly, ferroan platinum: Bayliss et al. 2005) or isoferroplatinum], Fe-rich Pt with an atomic �PGE:(Fe + Cu + Ni) ratio of 3.6–5.6, “(Pt,Ir)2Fe”-type alloy, members of the tulameenite–tetraferroplatinum solid-solution series extending from Pt2Fe(Cu,Ni) toward PGE1+x(Fe,Cu,Ni)1–x, less common Ir-dominant Ir–Os–(Ru–Pt) alloys, subordinate Os-dominant alloys, and minor Ru-rich alloys and rutheniridosmine, the latter with an atomic Ir:Os:Ru proportion close to 1:1:1. Trace amounts of PGE sulfi des and sulfarsenides: cooperite PtS, Ni-rich cuproiridsite (Cu,Ni,Fe)(Ir,Rh,Pt)2S4, unusual sperrylite-type [(Pt,Rh,Fe)(As,S)2–x] and platarsite-type [PtAs1–xS1+x, or unnamed Pt(S,As)2–x] phases, and unnamed (Ir,Rh,Pt)S (?) crystallized at a late stage in low-S environments. Some PGM grains contain micro-inclusions of diopside, augite, ferro-edenite, a potassian sodic-calcic amphibole (richterite?), talc, clinochlore and euhedral quartz. High values of mg# [100Mg/(Mg + Fe)] of the ferromagnesian minerals in these inclusions suggest highly magnesian source-rocks. Textural and compositional data, in particular the zoned intergrowths of Pt–Fe–(Cu) alloy grains, which broadly resemble the zoned Pt–Pd–Cu stannides from the Noril’sk complex, indicate the following sequence of crystallization: (Pt,Ir,Rh)3Fe → (Pt,Ir,Rh)1+x(Fe,Cu)1–x or Pt2Fe(Cu,Ni). The zoned Pt–Fe–Cu alloys likely formed by fractional crystallization of primary solid-solutions under closed-system conditions as a result of increase in the activity of Cu in the residual liquid after an early-stage (magmatic) crystallization of the Cu-poor core. The Cu-rich Pt–Fe alloys formed around these core zones and at their peripheries during a signifi cant drop in temperature at a late stage of crystallization of the composite alloy grains. The compositions of micro-inclusions and exsolution lamellae of Os- and Ir-dominant alloys in Pt–Fe alloys imply uniform temper-atures of equilibration within the range 750–800°C. The compositions of Cu-rich Pt–Fe alloys, PGE sulfi des and sulfarsenides, and exsolution lamellae of Os- and Ir-dominant alloys, observed in intimate association with Pt–Fe alloys, are likely related to the crystallization of the coexisting Pt–Fe alloys. Narrow zones of Pt–Fe alloys richer in Pt and poor in Fe, observed at the boundary of placer Pt–Fe alloy grains, provide evidence for a removal of Fe and corresponding addition of Pt as a result of interaction with a low-temperature fl uid. The terrane affi nities, compositions and associations of the placer PGM examined appear consistent with two types of potential source-rocks, associated with Alaskan-type intrusions and the Atlin ophiolite complex. The preservation of faceted morphologies on many of the placer PGM grains implies a relatively short distance of transport from their source.
Keywords: platinum-group elements, platinum-group minerals, Pt–Fe alloys, Pt–Fe–Cu alloys, zoning, Ir–Os alloys, Ir–Os–Ru alloys, PGE mineralization, placer deposits, Alaskan–Uralian-type complexes, ultramafi c-mafi c rocks, British Columbia, Canada.
SOMMAIRE
Nous avons analysé les minéraux du groupe du platine (MGP) d’une suite choisie de gisements placer d’or et d’éléments du groupe du platine (EGP) en Colombie-Britannique au moyen d’une microsonde électronique. Les grains des MGP des placers (n = 70, 0.1–1.5 mm de diamètre) sont faits d’une variété d’alliages Pt–Fe–(Cu): alliage de type “Pt3Fe” (platine riche en fer ou isoferroplatinum), platine riche en fer avec un rapport atomique �PGE:(Fe + Cu + Ni) de 3.6 à 5.6, alliage de type “(Pt,Ir)2Fe”,
§ Present address: Department of Earth and Planetary Sciences, McGill University, 3450 University Street, Montreal, Quebec H3A 2A7, Canada. E-mail address: [email protected]
¶ E-mail address: [email protected]
1688 THE CANADIAN MINERALOGIST
membres de la solution solide tulameenite–tétraferroplatinum allant de Pt2Fe(Cu,Ni) vers PGE1+x(Fe,Cu,Ni)1–x, et moins couram-ment, un alliage Ir–Os–(Ru–Pt) à dominance d’iridium, des alliages subordonnés à dominance d’Os, et une proportion mineure d’alliages riches en Ru et rutheniridosmine, cette dernière avec une proportion Ir:Os:Ru voisine de 1:1:1. Des quantités en traces de sulfures et de sulfarséniures des EGP: cooperite PtS, cuproiridsite nickelifère (Cu,Ni,Fe)(Ir,Rh,Pt)2S4, des phases inhabituelles de type sperrylite [(Pt,Rh,Fe)(As,S)2–x] et platarsite [PtAs1–xS1+x, ou Pt(S,As)2–x sans nom], ainsi que (Ir,Rh,Pt)S (?) sans nom, ont cristallisé à un stage tardif dans un milieu relativement dépourvu en soufre. Certains des grains de MGP contiennent des micro-inclusions de diopside, augite, ferro-édenite, une amphibole sodi-calcique riche en potassium (richtérite?), talc, clinochlore et quartz idiomorphe. Des valeurs élevées de mg# [100Mg/(Mg + Fe)] des minéraux ferromagnésiens inclus semblent indiquer une source fortement magnésienne. Les données texturales et compositionnelles, en particulier les intercroissances zonées des grains d’alliage Pt–Fe–(Cu), qui ressemblent grosso modo aux grains de stannures de Pt–Pd–Cu zonés du complexe de Noril’sk, indiquent la séquence de cristallisation (Pt,Ir,Rh)3Fe → (Pt,Ir,Rh)1+x(Fe,Cu)1–x ou Pt2Fe(Cu,Ni). Les alliages Pt–Fe–Cu zonés se seraient formés par cristallisation fractionnée de solutions solides primaires en système fermé suite à une augmentation de l’activité du cuivre dans le liquide résiduel après un stade précoce qui a produit un noyau à faible teneur en Cu. Les alliages Pt–Fe riches en Cu se sont formés autour de ces noyaux au cours d’une chute importante de la température à un stade tardif de la cristallisation. Les compositions des micro-inclusions et des lamelles d’exsolution des alliages à dominance de Os et de Ir dans un hôte Pt–Fe implique des températures uniformes d’équilibrage autour de 750–800°C. Les compositions des alliages cuprifères de Pt–Fe, des sulfures et des sulfarséniures des EGP, et les lamelles d’exsolution des alliages à dominance de Os et Ir étroitement associées aux alliages Pt–Fe, seraient liées à la cristallisation des alliages Pt–Fe coexistants. Les étroites zones d’alliages Pt–Fe plus riches en Pt et pauvres en Fe à la bordure des grains témoignent d’un lessivage de Fe et d’une addition correspondante de Pt suite à une interaction avec une phase fl uide à faible température. Selon les affi nités avec les socles, la composition et les associations des MGP des placers, il semble y avoir deux sortes de roches-mères, des massifs intrusifs de type Alaska et le complexe ophiolitique de Atlin. La préservation des cristaux idiomorphes dans plusieurs cas fait penser que ces minéraux seraient près de leurs sources.
(Traduit par la Rédaction)
Mots-clés: éléments du groupe du platine, minéraux du groupe du platine, alliages Pt–Fe, alliages Pt–Fe–Cu, zonation, alliages Ir–Os, alliages Ir–Os–Ru, minéralisation, placers, complexe de type Alaska–Ourales, roches ultramafi ques-mafi ques, Colom-bie-Britannique, Canada.
present in some of these PGM, (4) to make a compa-rison with PGM from other PGE deposits, (5) to suggest likely primary sources for these placer PGM grains and nuggets, and (6) to discuss some aspects of the crystal-lization history of these PGM.
SAMPLE DESCRIPTIONS AND GEOLOGICAL SETTING
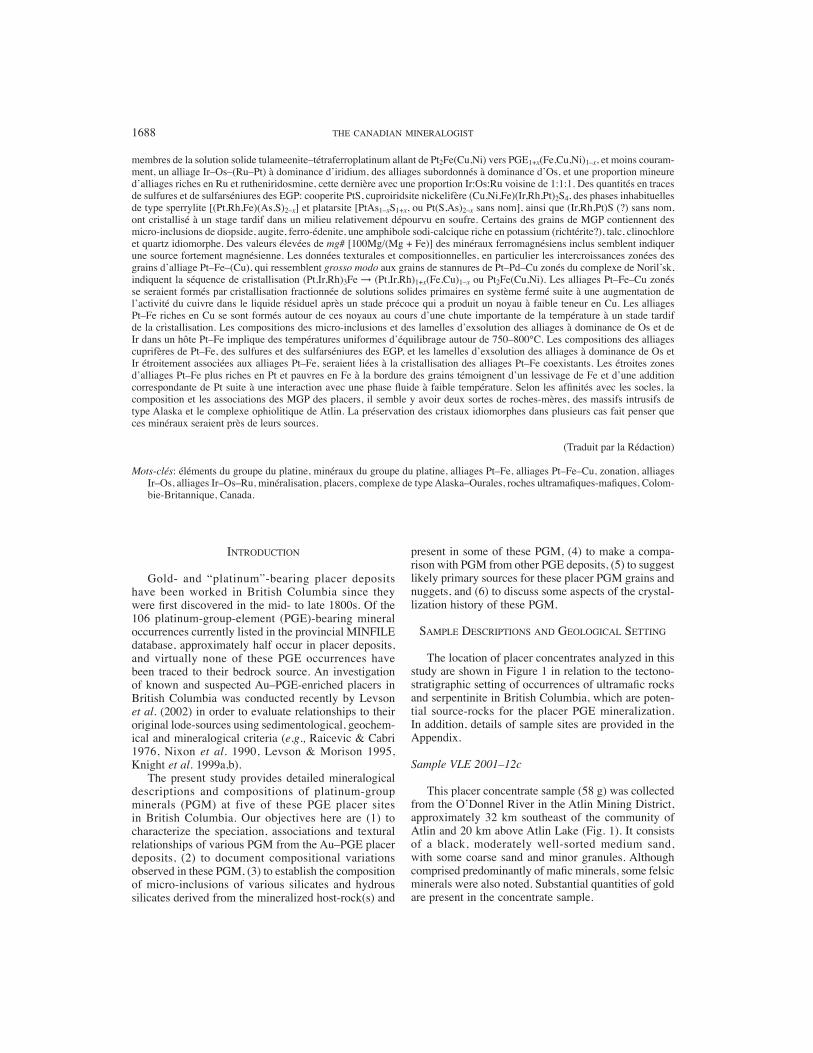
The location of placer concentrates analyzed in this study are shown in Figure 1 in relation to the tectono-stratigraphic setting of occurrences of ultramafi c rocks and serpentinite in British Columbia, which are poten-tial source-rocks for the placer PGE mineralization. In addition, details of sample sites are provided in the Appendix.
Sample VLE 2001–12c
This placer concentrate sample (58 g) was collected from the O’Donnel River in the Atlin Mining District, approximately 32 km southeast of the community of Atlin and 20 km above Atlin Lake (Fig. 1). It consists of a black, moderately well-sorted medium sand, with some coarse sand and minor granules. Although comprised predominantly of mafi c minerals, some felsic minerals were also noted. Substantial quantities of gold are present in the concentrate sample.
INTRODUCTION
Gold- and “platinum”-bearing placer deposits have been worked in British Columbia since they were fi rst discovered in the mid- to late 1800s. Of the 106 platinum-group-element (PGE)-bearing mineral occurrences currently listed in the provincial MINFILE database, approximately half occur in placer deposits, and virtually none of these PGE occurrences have been traced to their bedrock source. An investigation of known and suspected Au–PGE-enriched placers in British Columbia was conducted recently by Levson et al. (2002) in order to evaluate relationships to their original lode-sources using sedimentological, geochem-ical and mineralogical criteria (e.g., Raicevic & Cabri 1976, Nixon et al. 1990, Levson & Morison 1995, Knight et al. 1999a,b).
The present study provides detailed mineralogical descriptions and compositions of platinum-group minerals (PGM) at five of these PGE placer sites in British Columbia. Our objectives here are (1) to characterize the speciation, associations and textural relationships of various PGM from the Au–PGE placer deposits, (2) to document compositional variations observed in these PGM, (3) to establish the composition of micro-inclusions of various silicates and hydrous silicates derived from the mineralized host-rock(s) and
PGM FROM FIVE PLACER DEPOSITS IN BRITISH COLUMBIA 1689
Sample VLE 2001–16a
This sample (39 g) was recovered from Dease Creek, about 25 km northwest of Dease Lake townsite and 7 km upstream from where the creek enters Dease Lake. The concentrate comprises a black, well-sorted fi ne sand. Fine gold and possible PGM grains are visible in the sand. The concentrate was sluiced from gravels resting on bedrock at depths of about 1–2 m below the surface. The analyzed sample includes only the non-magnetic fraction, but magnetite is abundant in sluice concentrates from the site. Other minerals reported in the concentrates include abundant pyrite and hematite as well as Au–Ag alloy, platinum mineral(s), garnet and galena.
Sample VLE 2001–40a
This sample (18 g) was collected from Lockie Creek, approximately 1 km from its mouth at Otter Lake and 4 km north of Tulameen. The concentrate is a dark gray to black, well-sorted fi ne sand. Fine gold and possible PGM grains are visible in the sample. Magnetite, pyrite and rare chalcopyrite also are present.
Sample VLE 2001–93
This concentrate sample (205 g) is from the Quesnel River, approximately 3 km east of the town of Quesnel in the Cariboo Mining District. The analyzed sample is a light brown, moderately well-sorted fi ne sand. The concentrate has an unusually high concentration of felsic minerals as well as silt and clay. Some magnetite and visible gold grains are also present.
FIG. 1. Sample locations of PGM placer concentrates analyzed in this study and their tectonostratigraphic setting. Also shown are the distribution of potential source-rocks for the placer PGM: ultramafi c rocks and serpentinite in oceanic (ophiolitic) terranes, and known occurrences of Alaskan-type ultramafi c-mafi c complexes (including Tulameen) in British Columbia.

1690 THE CANADIAN MINERALOGIST
Sample VLE 2001–95a
This sample (140 g) is from the Similkameen River, about 15 km above its confl uence with the Tulameen River near the town of Princeton. The sample comprises a black to dark brown, well-sorted, non-magnetic fi ne sand. The observed minerals include abundant mafi c constituents, including olivine, garnet, pyrite and chalcopyrite.
SAMPLE PREPARATION AND ANALYTICAL METHODS
All placer concentrate samples were processed by Overburden Drilling Management Limited, Ontario. A table concentrate was produced from the submitted sample and then micro-panned to recover fi ne-grained sediment; the table concentrate was processed through heavy liquid (SG 3.3), and ferromagnetic separations were prepared. PGM grains were hand picked and iden-tifi ed by SEM. Grains were mounted in a quick-setting araldite medium (~2.5-cm-diameter grain mount) and polished for analysis.
Electron-microprobe (EMP) analyses of the PGM were carried out using a JEOL JXA–8600 electron microprobe (A.D. Edgar Laboratory, University of Western Ontario, London, Ontario) in wavelength-dispersion spectrometry mode (WDS) at 25 kV and 30 nA, with a fi nely focused beam (<2 �m) and CITZAF on-line correction procedures. The following X-ray lines (and standards) were used: NiK�, FeK�, CoK�, CuK�, IrL�, PtL�, OsL�, RuL�, PdL� (pure metals), RhL� (synthetic Pt90Rh10), AsL� (FeAsS), and SK� (FeS). The PdL� line was used instead of PdL� in order to eliminate overlap between emission lines of Rh and Pd. We preferred to use the AsL� line, because the alternative K� line would overlap with lines of some of the heavy PGE. All possible peak-overlaps were examined and corrected during a careful analysis of relevant standards. The EMP data for silicates included in the PGM were obtained using WDS analysis at 15 kV and 20 nA, and a set of well-defi ned synthetic and natural mineral standards.
NOMENCLATURE OF PT–FE–(CU–NI) AND IR–OS–RU ALLOYS
In accordance with existing nomenclature (Cabri & Feather 1975), three natural Pt–Fe alloys are presently recognized. Pt–Fe alloy with a disordered structure (fcc), space group Fm3m, is known as Fe-rich platinum [20–50 at.% Fe , and formerly “ferroan” platinum: Bayliss et al. (2005)] or “native Pt” (Fe<20 at.% and Pt>80 at.%). Isoferroplatinum, ideally Pt3Fe, has an ordered primitive cubic (pc) structure, space group Pm3m, and typically contains 25 to 35 at.% Fe. Tetraferroplatinum (PtFe) is tetragonal, space group P4/mmm, and typically contains 45 to 55 at.% Fe and may also exhibit elevated levels of Cu (e.g., 0.25 atoms
per formula unit, apfu; Cabri et al. 1977). A copper-bearing alloy, tulameenite (Pt2FeCu), with an ordered tetragonal structure, was fi rst described in PGE-bearing placers along the Tulameen River, which are associated with the Tulameen Alaskan-type complex (Cabri et al. 1973, Nixon et al. 1990). Tulameenite forms two solid-solution series: one with ferronickelplatinum (Pt2FeNi: Rudashevsky et al. 1983), which is isostructural with tulameenite, and another with tetraferroplatinum (Nixon et al. 1990, Bowles 1990). In the system Os–Ir–Ru, the following species are recognized: osmium, hexagonal with Os as the major element, iridium, cubic with Ir dominant, ruthenium, hexagonal with Ru being the major element, and rutheniridosmine, hexagonal with Ir>Os or Ru (Harris & Cabri 1991).
RESULTS AND DISCUSSION
PGM species
A total of 70 PGM grains, varying from ca. 0.1 to 1.5 mm in cross section, were examined in the fi ve samples of heavy-mineral concentrates (Fig. 1). Of the 70 grains analyzed, 47 represent various Pt–Fe–(Cu) alloys, and 23 are various alloys of Ir, Os, and Pt, some of which are enriched in Ru. Of the 47 Pt–Fe(–Cu) grains, 22 consist principally of Pt3Fe-type alloys [with an atomic �PGE:(Fe + Cu + Ni) ratio of 2.5–3.5]: Fe-rich platinum or isoferroplatinum or both, 13 grains are Fe-rich Pt with �PGE:(Fe + Cu + Ni) of 3.6–5.6, fi ve are members of the observed tetraferroplatinum–tula-meenite series, and seven are “Pt2Fe”-type alloy. Thus, the Pt3Fe-type alloy dominates the Pt–Fe–(Cu) alloy population. Among the 23 grains of Ir–Os–(Pt–Ru) alloys, 14 are Ir-dominant alloy (i.e., the mineral iridium), fi ve are Os-dominant alloy (osmium), and four are Ru-enriched alloys, the composition of which is close to that of rutheniridosmine. In addition, Ir- and Os-dominant alloys occur as exsolution products in host Pt–Fe alloys.
Minor to trace amounts of PGE-bearing sulfi des and sulfarsenides are intimately associated with the Pt–Fe alloys: cooperite (PtS), a PGE thiospinel enriched in Ni and corresponding to Ni-rich cuproiridsite [(Cu,Ni,Fe)(Ir,Rh,Pt)2S4], unusual sperrylite-type [(Pt,Rh,Fe)(As, S)2–x] and platarsite-type [PtAs1–xS1+x, or unnamed Pt(S,As)2–x] phases, and unnamed (Ir,Rh,Pt)S(?). In addition, minute inclusions of various anhydrous and hydrous silicates, including quartz, are present in some of the placer PGM grains. The compositions and characteristic textural features of these PGM are described below.
Pt3Fe-type alloys: Fe-rich platinum or isoferroplatinum
EMP analyses of Pt3Fe-type alloys are given in Tables 1 and 2. The principal alloys have the composi-

PGM FROM FIVE PLACER DEPOSITS IN BRITISH COLUMBIA 1691
tion (Pt,Ir,Rh)3(Fe,Cu,Ni), which approximates the ideal isoferroplatinum (Pt3Fe) composition (e.g., Cabri & Feather 1975, Malitch & Thalhammer 2002), but in the absence of X-ray-diffraction data, we cannot distinguish Fe-rich platinum from isoferroplatinum. Placer grains of Pt3Fe-type alloy(s) are subhedral, partly faceted to anhedral, up to 1.5 mm in size, and many grains display well-developed crystal faces (Figs. 2A, B). Some grains contain micro-inclusions or fi ne exsolution lamellae of various Os–Ir or Ir–Os–(Ru–Pt) alloys, which are locally abundant (Figs. 3A, 4A). Composite grains also are present and consist of Pt–Fe alloys (Pt3Fe or “Pt2Fe”) intergrown with Ir-dominant alloys, or zoned intergrowths of various Pt–Fe and Pt–Fe–Cu alloys. An example of an Ir-dominant alloy grain enclosing a droplet-like inclusion of Pt3Fe is illustrated in Figure 3E. Such a texture is commonly interpreted to indicate entrapment in a liquid state.
In terms of apfu, calculated on the basis of �atoms = 4, the following compositional ranges in the Pt3Fe-type alloys are observed, based on results of thirty-two WDS analyses (hereafter: n = 32): Pt 2.35–3.04, Ir 0–0.44, Rh 0.02–0.15, Os 0–0.07, Pd 0–0.13, Ru 0–0.02, Fe 0.57–1.10, Cu 0.005–0.35, and Ni 0–0.08, with �PGE and (Fe + Cu + Ni) values ranging from 2.84 to 3.12 and
from 0.88 to 1.16, respectively. The mean composition yields the formula [(Pt2.84Ir0.05Rh0.05Pd0.03Ru<0.01)�2.99 (Fe0.88Cu0.12Ni0.01)�1.01: n = 32], which is very close to being ideal, and displays equal proportions of Ir and Rh (0.05 apfu each), with an atomic Ir:Rh ratio of 1.0. From these EMP data, there appears to be a coupled substitution involving the replacement of (Ir + Rh + Pd) for Pt, and (Cu + Ni) for Fe (0.13 apfu each). However, the correlation (Ir + Rh + Pd) versus (Cu + Ni) is weak over the entire dataset [n = 32; correlation coeffi cient (R) = –0.39]. The correlation between Ir and Rh also is weak, although positive (R = 0.42). A positive Ir–Rh correlation (the R value was not given) was also noted by Tolstykh et al. (2002) in Pt–Fe alloys from the Salmon River placers, Goodnews Bay, Alaska, which are associated with the Red Mountain Alaskan-type complex.
The maximum contents of Ir and Rh in the analyzed Pt3Fe-type alloys are 13.4 wt.% (10.9 at.%) and 2.5 wt.% (3.9 at.%), respectively (n = 32: Tables 1, 2) which deviate signifi cantly from the mean composi-tion. These abundances of Ir and Rh closely approach those reported in Pt3Fe-type alloys from the Salmon River placers in Alaska (15.4 wt.% Ir and 2.3 wt.% Rh; Tolstykh et al. 2002). Most reported abundances of Ir

1692 THE CANADIAN MINERALOGIST
FIG. 2. A. A subhedral grain of Pt3Fe-type alloy mantled by a narrow and porous rim of members of the tulameenite–ferro-nickelplatinum series [Tul: (Pt1.97–1.98Ir0–0.02Rh0.02)�2.00–2.02Fe0.92–0.99(Cu0.63–0.73Ni0.35–0.37)�1.00–1.08]. B. A subhedral grain of Pt3Fe-type alloy, which is partly mantled by a Cu-rich variety of tetraferroplatinum, Tfp [(Pt0.98Ir0.04Rh0.02)�1.04(Fe0.74 Cu0.20Ni0.01)�0.95: gray rim). Note the presence of a very narrow “Pt2Fe” rim [(Pt1.92Ir0.08Rh0.02)�2.02(Fe0.91Cu0.06Ni0.01)�0.98], which is developed after the tetraferroplatinum rim. C. Magnifi cation of Figure 2B, showing the outer “Pt2Fe” rim, which is somewhat porous, and has an irregular boundary with the tetraferroplatinum rim (Tfp). D. A subhedral grain of Pt3Fe-type alloy poor in Cu [(Pt3.04Os0.04Rh0.03Ru 0.01)�3.12(Fe0.80Cu0.08)�0.88], which compositionally ranges up to Fe-rich platinum with the atomic PGE:(Fe + Cu + Ni) ratio of 4.3. These Cu-poor Pt–Fe alloys are mantled by a Pt3(Fe,Cu) alloy enriched in Cu [e.g., (Pt2.93Rh0.04Os0.03)�3.00(Fe0.80Cu0.19)�0.99: gray]. E. An anhedral grain of Pt3Fe-type alloy (original alloy: dark gray), consisting of alteration zones (AZ), which are rim- and veinlet-like zones (light gray). F. Exsolution lamellae of Ni-rich cuproiridsite (Cpr: black), which are “crystallographically” oriented almost perpendicular to each other in the host Pt3Fe-type alloy. Figures 2A–F are back-scattered-electron images.

PGM FROM FIVE PLACER DEPOSITS IN BRITISH COLUMBIA 1693
FIG. 3. A. “Crystallographically” oriented lamellae of Ir-dominant alloy [white: Ir71.02–71.10Os9.51–9.61Pt7.34–7.37Fe5.08–5.18Rh3.29–3.44Ru3.14–3.26Ni0.25–0.28], enclosed by heterogeneous “Pt2Fe” alloy [(Pt1.65Ir0.21Rh0.04Pd0.01)�1.91(Fe1.00Cu0.05Ni0.04)�1.09: gray]. B. A blocky grain of Rh–Fe–S-bearing sperrylite (Spy), which occurs at the margin of Pt3Fe-type alloy. Note that lamellar grains or veinlets of this sperrylite-type phase (?) are also present close to the center of the host Pt–Fe alloy grain. C. Subparallel orientation of the sperrylite-type phase (?) enclosed within the Pt3Fe-type alloy (Fig. 3B). D. A subhedral composite grain of Ir–Pt–Os alloy [Ir, white: Ir72.52Pt8.30Os7.13Fe5.92Ru3.70Rh2.18Ni0.25], that displays evidence of exsolution of “(Pt,Ir)2Fe” [(Pt1.72Ir0.21Rh0.03)�1.96(Fe0.98Cu0.04Ni0.01)�1.03: gray] within this Ir–Pt–Os alloy. Note that these “(Pt,Ir)2Fe” lamellae are oriented roughly subparallel to each other and also to crystal faces of the host Ir-rich alloy. A two-mineral sili-cate inclusion (diopside and ferro-edenite: anal. 1,3, Table 12) is present in the center of this grain. E. A grain of Ir–Os–Pt alloy [Ir51.37Os33.53Pt7.02Ru4.07Rh3.16Fe0.80Ni0.05] containing a droplet-like inclusion of a Pt3Fe-type alloy (gray). The upper portion of this grain is subrounded in cross-section, whereas its lower part displays preserved crystal faces. F. A large grain of Ir–Os–Pt alloy [Ir59.10Os18.82Pt14.12Ru3.82Rh2.03Fe1.92Ni0.15] contains a euhedral inclusion of quartz (Qtz). Figures 3A–F are back-scattered-electron images.

1694 THE CANADIAN MINERALOGIST
FIG. 4. A. A well-formed hexagonal crystal of native Os [Os98.67Pt0.81Rh0.25Pd0.25Fe0.02] enclosed by an anhedral grain of Pt3Fe-type alloy [(Pt2.91Rh0.03Pd0.03)�2.97(Fe0.93Cu0.09)�1.02]. B. Minute crystals of native Os [Os87.64Ir6.60Ru2.49Pt1.66Rh1.14Fe0.19Pd0.13: labeled “Os”] in intergrowth with a potassian sodic-calcic amphibole (Amp; anal. 4, Table 12), which are enclosed within Fe-rich Pt with the atomic PGE:(Fe + Cu + Ni) ratio of 4.0 (Pt–Fe). C. A narrow rim of cooperite (Cp), which is developed around a Pt3Fe-type alloy grain. D. Fragments of a broken grain of Ir–Rh sulfi de [unnamed (Ir,Rh)S(?)], which are preserved at the margin of a Pt–Fe alloy grain. Details of these fragments are shown in Figure 4E, which is a further magnifi cation of Figure 4D. F. Magnifi cation of the quartz inclusion (Qtz), which is observed in the Ir–Os–(Pt) alloy shown in Figure 3F. Figures 4A–F are back-scattered-electron images.

PGM FROM FIVE PLACER DEPOSITS IN BRITISH COLUMBIA 1695
in Pt–Fe alloys are lower, with the exception of Pt–Fe alloy from the Saskatchewan River placer, Alberta (22.97 wt.% Ir: Cabri et al. 1996), for example, or an Ir-dominant analogue of isoferroplatinum (chengdeite) from the Luanhe River placer, China (Yu 1995). Iridium clearly substitutes for Pt and forms a well-defined negative Ir versus Pt correlation (R = –0.88; Fig. 5).
The content of PGE and of base metals, and the atomic �PGE:(Fe + Cu + Ni) ratio, show variations (Tables 1, 2, Fig. 6); the atomic proportions of minor Ir, Rh and Pd are generally close to those observed in related alloys from Alaska (Fig. 7; cf. Tolstykh et al. 2002). The mean content of Cu in analyzed Pt3Fe-type alloys is 1.2 wt.% (Tables 1, 2), which is identical to the mean content of Cu in similar alloys [Pt2.5(Fe,Ni,Cu)1.5] associated with the Tulameen Alaskan-type complex (Nixon et al. 1990). The maximum Cu content (3.6 wt.%: n = 32) is somewhat greater than that reported in Pt3Fe-type alloys from Alaska (up to 1.15 wt.% Cu; Tolstykh et al. 2002). Copper contents are negatively correlated with Fe (R = –0.83; n = 32), indicative of Cu-for-Fe substitution. Ni contents are generally low and have a maximum value of 0.74 wt.% (Table 1), somewhat greater than the amount of Ni observed in a Pt3Fe-type alloy from Alaska (0.33 wt.% Ni; Tolstykh et al. 2002). The Pt–Fe alloys associated with the Tulameen complex are richer in Ni (1.2 to 3.2 wt.%; Nixon et al. 1990), as are Pt3Fe-type alloys (4.8 to 7.2 wt.% Ni) from the Kytlym Alaskan-type complex, Urals. However, the Cu content of these Uralian alloys (1.3 to 2.35 wt.%, Garuti et al. 2002) is similar to those of the Pt–Fe alloys analyzed in this study (Tables 1, 2). Compositions of Pt-rich alloys with higher values of the ratio �PGE:(Fe + Cu + Ni), ranging from 3.6 to 5.6, correspond to Fe-rich Pt (Tables 3, 4). One of these alloy samples contains 80.5 at.% Pt (anal. 9, Table 4); it is “native platinum”, a variety of Fe-rich platinum (Cabri & Feather 1975).
FIG. 5. A Pt–Ir correlation (in atoms per formula unit, apfu: �atoms = 4) in electron-microprobe-derived compositions of Pt3Fe-type alloys from placer deposits, British Columbia (this study).
FIG. 6. Compositional variations (in at.%) of the analyzed Pt–Fe–(Cu) alloys from placer deposits, British Columbia, in terms of the plot of �PGE versus (Fe + Cu + Ni). Com-positions of ideal Pt3Fe, “Pt2Fe” and PtFe are shown for comparison (fi lled symbols).

1696 THE CANADIAN MINERALOGIST
“Pt2Fe”-type alloys
Some of the analyzed grains of Pt–Fe alloy have an atomic �PGE:(Fe + Cu + Ni) ratio close to 2 (Tables 5, 6). In the �PGE–(Fe + Cu + Ni) diagram (Fig. 6), these compositions fall on a line between ideal Pt3Fe and PtFe. Although the existence of “Pt2Fe” is not reported in the Pt–Fe system because of a miscibility gap (Cabri & Feather 1975), natural “Pt2Fe”-type alloys have been reported from several localities (Johan et al. 1989, Malitch & Thalhammer 2002, Oberthür et al. 2002). In addition, Nixon et al. (1990) have reported a Pt2.5(Fe,Ni,Cu)1.5 alloy derived from the Tulameen complex. In some cases, the naturally occurring “Pt2Fe” may represent a submicroscopic intergrowth of Pt3Fe and PtFe (<1 �m in size) exsolved upon cooling within the miscibility gap (e.g., Zhernovsky et al. 1985), including some of the observed “Pt2Fe” composition of the placer grains (e.g., Fig. 3A) and of the narrow rim (Fig. 2C). One composite alloy grain, however,
appears to consist of a single “(Pt,Ir)2Fe” phase. It forms a generally subparallel “crystallographically” oriented intergrowth (Fig. 3D). Malitch & Thalhammer (2002) recently described examples of “homogeneous Pt2Fe”, having a disordered fcc structure.
We suggest that the “(Pt,Ir)2Fe” alloy (Fig. 3D), which is enriched in Ir [(Pt1.72Ir0.21Rh0.03)�1.96(Fe0.98Cu0.04Ni0.01)�1.03] and coexists with an Ir-dominant alloy enriched in Pt [Ir72.5Pt8.3Os7.1Fe5.9Ru3.7Rh2.2], could have formed by exsolution from a complex primary solid-solution at a high temperature. This mode of origin may have been a signifi cant factor in stabilizing the “(Pt,Ir)2Fe” alloy phase and the incorporation of substantial Ir.
Tulameenite–tetraferroplatinum series: deviations from ideal stoichiometry
The results of EMP analyses of alloys belonging to the tulameenite–tetraferroplatinum solid-solution series
FIG. 7. Contents of minor elements (Pd, Ir, and Rh) in various Pt–Fe–(Cu) alloys from placer deposits, British Columbia. The following symbols are used in this diagram: (1) Pt3Fe-type alloys, (2) Fe-rich Pt with the �PGE:(Fe + Cu + Ni) ratio of 3.6–5.6, (3) members of the tetraferroplatinum–tulameenite series, and (4) “Pt2Fe”-type alloys. Note that these data points generally extend along the Ir–Rh and Rh–Pd joins, and, in contrast, the Pd–Ir join is clearly avoided.
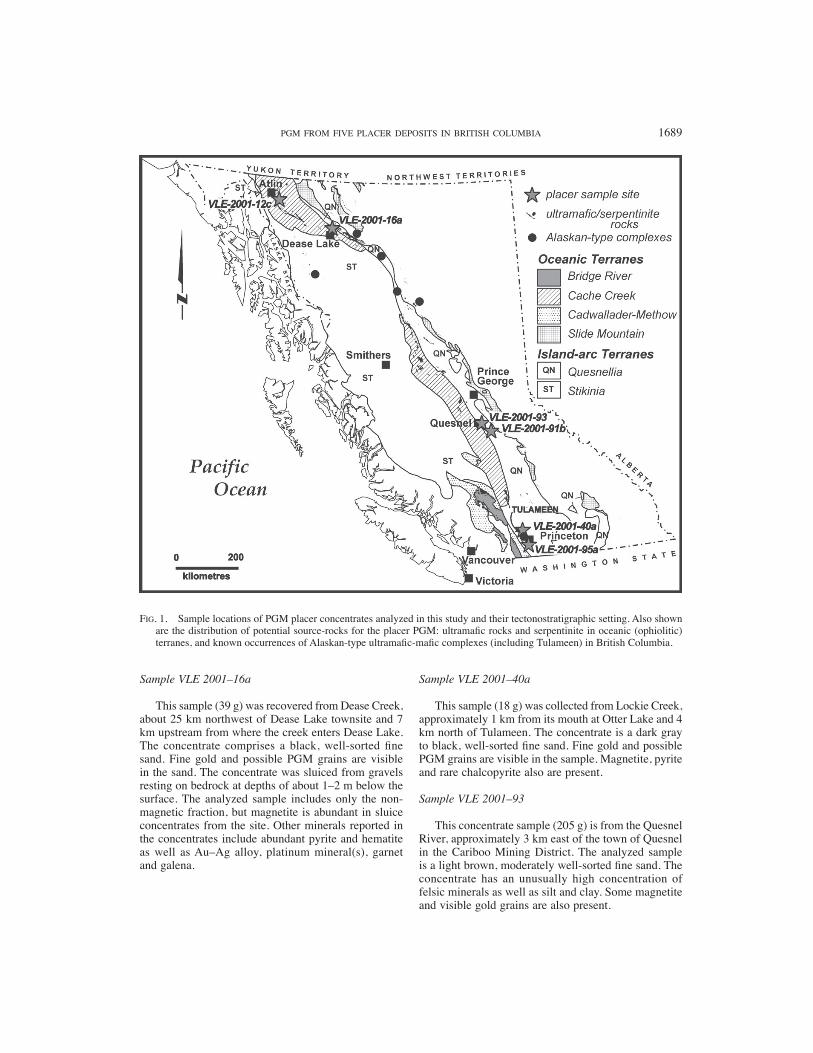
PGM FROM FIVE PLACER DEPOSITS IN BRITISH COLUMBIA 1697
are given in Tables 7 and 8. Most of the placer grains examined in this series (ca., 0.1 to 0.5 mm across) are texturally heterogeneous, with abundant fractures. Relics of “Pt2Fe” are locally preserved in some of these grains. Nickel is a not uncommon component of tulameenite from various localities. The maximum Ni content observed in this study (4.3 wt.%: Table 7) is close to that reported in tulameenite from the Tulameen
River placer (3.8 wt.% Ni, Cabri et al. 1996), and to that in tulameenite hosted in situ by chromitite of the Tulameen complex (2.9 wt.% Ni, Nixon et al. 1990). Tolstykh et al. (2002) reported up to 2.6 wt.% Ni in members of the tulameenite–tetraferroplatinum series from Alaska. A Ni–(Cu)-rich Pt–Fe alloy, believed to be tetraferroplatinum [Pt0.97Pd0.03)�1.00(Fe0.66Cu0.25 Ni0.10)�1.01], was also reported from the Wellgreen intru-sion, Yukon (Barkov et al. 2002).
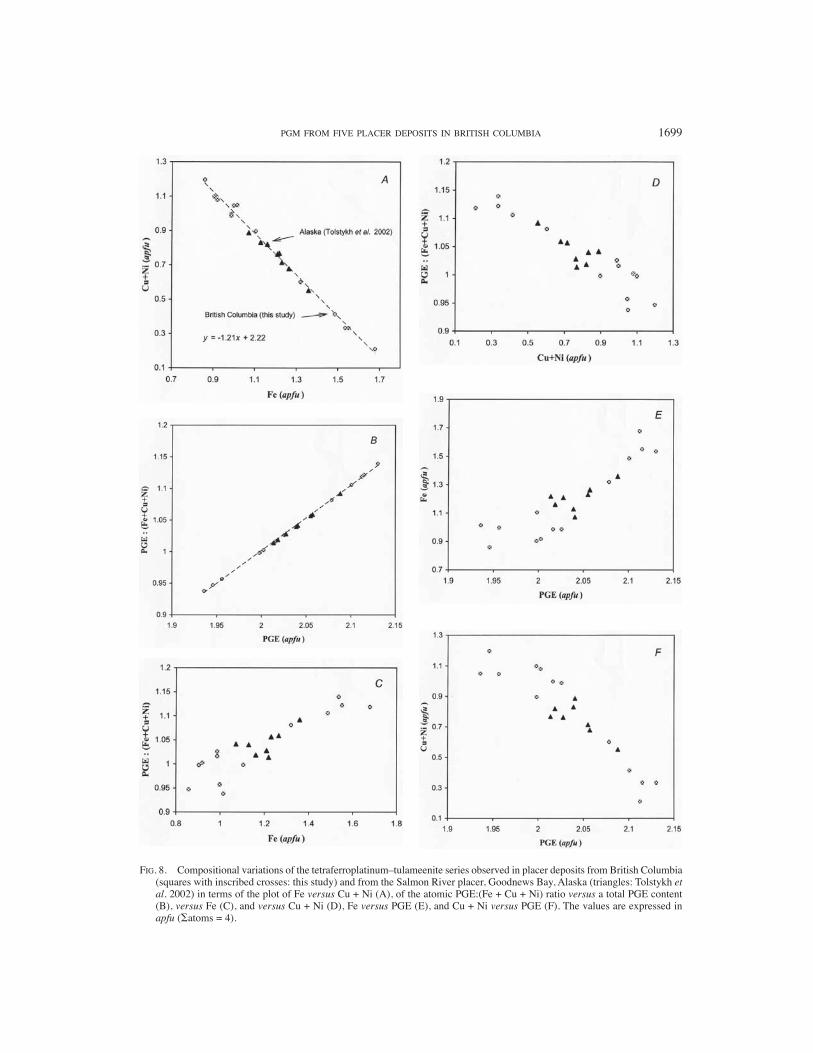
Our EMP data (Tables 7, 8, Figs. 8A–F) lead to some original observations. The ideal scheme of element substitutions requires an atomic Pt:(Fe + Cu + Ni) ratio of 1.0 in members of the tulameenite–tetraferroplatinum [Pt2FeCu–“Pt2FeFe”] series. However, the �PGE:(Fe + Cu + Ni) ratio observed in the analyzed placer grains is 0.94–1.14, which deviates from the ideal (Tables 7, 8, Fig. 8B), and is positively correlated with Fe
1698 THE CANADIAN MINERALOGIST
(Fig. 8C) and negatively with (Cu + Ni) (Fig. 8D). Also, the �PGE value of this series in the analyzed grains exhibits a notable departure (up to 2.13) from the ideal value of 2.0, and is positively correlated with Fe (Fig. 8E) and negatively with (Cu + Ni) (Fig. 8F). Although these deviations are quite minor, they are unlikely to refl ect analytical error, since compositions of this series from Alaska (Tolstykh et al. 2002) lie along the same trend (Figs. 8A–F). It is noteworthy that the PGE-rich members of the tulameenite–tetraferroplatinum series from British Columbia [PGE�2.13(Fe1.54Cu0.32 Ni0.01)�1.87: this study] and Alaska [PGE�2.09(Fe1.36Cu0.32Ni0.23)�1.91: recalculated from Tolstykh et al. 2002] display about the same degree of deviation from the ideal stoichiometry. These compositional data thus imply that members of the tulameenite–tetraferro-platinum series are somewhat nonstoichiometric and extend toward PGE1+x(Fe,Cu,Ni)1–x, where 0 < x < 0.1, rather than toward ideal PGE(Fe,Cu,Ni) compositions.
The presence of “Pt2Fe” relics in the tulameenite–tetraferroplatinum grains implies a secondary origin, consistent with a late-stage deuteric event, such as serpentinization, for example (cf., Cabri & Genkin 1991). Thus, the pre-existing Pt–Fe alloy(s) may have reacted with a late fl uid rich in Cu to form members of the tulameenite–tetraferroplatinum series.
Zoned intergrowths of Pt–Fe–Cu alloys
Some placer grains of Pt–Fe–Cu alloys are zoned. For example, a subhedral grain of Pt3Fe-type alloy (Fig. 2A) has a relatively Cu-poor core [(Pt2.88Ir0.03Rh0.03)�2.94(Fe0.95Cu0.08Ni0.03)�1.06: anal. 4, Tables 1, 2] and is mantled by a narrow rim of tulameenite enriched in Ni: ca. 37% of the ferronickelplatinum component [(Pt1.97–1.98Ir0–0.02Rh0.02)�2.00–2.02Fe0.92–0.99(Cu0.63–
0.73Ni0.35–0.37)�1.00–1.08: anal. 1, 2, Tables 7, 8]. The porous texture of this rim (Fig. 2A) is consistent with
the presence of abundant microvolumes of a fl uid phase that possibly became concentrated in the environment at the fi nal stage of crystallization.
The composite grain shown in Figure 2B has a core of Cu-poor isoferroplatinum or Fe-rich platinum (in at. %) [Pt58.8–63.6Ir6.7–10.9Rh2.1–2.3Os0.4–1.7Pd0.4–0.5Fe24.4–
25.4Cu0.9–1.1Ni0.3] (anal. 16, 17, Tables 1, 2). Replace-ment zones in this grain (i.e., the “gray rim”: Fig. 2B) consist of a tetraferroplatinum-type alloy enriched in Cu [Pt47.4–49.1Ir1.9–3.7Rh1.0–1.5Os0.0–0.4Pd0.1–0.2Fe37.2–
38.8Cu7.9–9.9Ni0.4] (anal. 3, 4, 12, Tables 7, 8]. In addition, this “gray rim” of tetraferroplatinum is partly mantled by an irregular and narrow “outer rim” (Figs. 2B, C) that has the following composition: [Pt64.0Ir2.5Rh0.7Os0.1Pd<0.1Fe30.2Cu1.9Ni0.4], corresponding to “(Pt,Ir)2(Fe,Cu)” (anal. 10, Tables 5, 6).
The subhedral grain shown in Figure 2D is composi-tionally zoned, and consists of a Pt3Fe-type alloy in the core [(Pt3.04Os0.04Rh0.03Ru0.01)�3.12(Fe0.80Cu0.08)�0.88: anal. 15, Tables 1, 2], mantled by texturally heteroge-neous Pt–Fe–Cu alloy(s). The latter are fi ne-grained, enriched in Cu, and range in composition from [(Pt2.93Os0.03Rh0.04)�3.00(Fe0.80Cu0.19)�0.99: anal. 25, Tables 1, 2] to [(Pt3.14Os0.03Rh0.03Pd0.02Ru0.02)�3.24(Fe0.64Cu0.11)�0.75: anal. 8, Tables 3, 4].
In all cases (Figs. 2A–D), a Pt3Fe-type alloy(s) (isoferroplatinum or Fe-rich platinum) occurs in the core, which is poor in Cu (up to 2 at.%), and is mantled by Cu-enriched alloys, such as tetraferroplatinum [Pt1+x(Fe,Cu)1–x with 7.9–9.9 at.% Cu], Pt3(Fe,Cu) with 4.7 at.% Cu, or tulameenite with 15.6–18.2 at.% Cu. Compositional zoning of this type is not uncommon in naturally occurring Pt–Fe–(Cu) alloys. For example, Tolstykh et al. (2000) reported a Pt–Fe alloy rimmed by a “Pt3Cu”-type alloy in the Pustaya River placer deposit from the Koryak–Kamchatka belt of Alaskan-type intru-sions, eastern Russia. Presumably, special conditions are required to stabilize a “Pt3(Cu,Fe)”-type solid solution.
PGM FROM FIVE PLACER DEPOSITS IN BRITISH COLUMBIA 1699
FIG. 8. Compositional variations of the tetraferroplatinum–tulameenite series observed in placer deposits from British Columbia (squares with inscribed crosses: this study) and from the Salmon River placer, Goodnews Bay, Alaska (triangles: Tolstykh et al. 2002) in terms of the plot of Fe versus Cu + Ni (A), of the atomic PGE:(Fe + Cu + Ni) ratio versus a total PGE content (B), versus Fe (C), and versus Cu + Ni (D), Fe versus PGE (E), and Cu + Ni versus PGE (F). The values are expressed in apfu (�atoms = 4).

1700 THE CANADIAN MINERALOGIST
This suggestion is consistent with the evidence for unmixing between Pt3Cu and Pt3Fe, which was reported from a placer derived from an Alaskan-type complex in eastern Madagascar (Augé & Legendre 1992).
Origin of the zoning in Pt–Fe–Cu alloys
There is a general similarity between the observed patterns of zoning (Figs. 2A–D) and those of zoned inter-metallic compounds from the Noril’sk complex, Siberia, which consist of atokite–rustenburgite [(Pt,Pd)3Sn] in the core mantled by Cu-rich stannides of the taimyr ite–tatyanaite series (Barkov et al. 2000b). Therefore, A3B-type cubic phases form the Cu-poor core in these zoned PGM intergrowths, which are mantled by the Cu-rich PGM. We infer that this zoning is likely primary in origin, and formed by fractional crystallization of original solid-solutions under closed-system conditions, as a result of increase in the activity of Cu species in the remaining liquid after an early-stage crystallization of the Cu-poor core(s). The Cu-rich Pt–Fe alloys were then deposited, after a signifi cant decrease in temperature, around the core zone, or at their periphery, at a late or fi nal stage of crystallization of the zoned alloys.
In summary, the textures (Figs. 2B,C) and composi-tions indicate the following sequence of crystallization: [Pt,Ir,Rh)3Fe: “core”] → [(Pt,Ir,Rh)1 + x(Fe,Cu)1–x: “rim”] → [“(Pt,Ir)2Fe”: narrow “outer rim”]. Our EMP data suggest that this “core” and the “outer rim” have approximately the same maximum content of Pt (64 at.%), which points to the existence of a genetic rela-tionship between these zones. We thus infer that the Cu-rich “rim” deposited after the Cu-poor “core” as a result of decrease in temperature and increase in the activity of Cu. The “outer rim” [“(Pt,Ir)2(Fe,Cu)”] could represent a residual liquid, a small volume of which may have remained after crystallization of the rim-like tetraferroplatinum zone (Figs. 2B, C). Alternatively, this “rim” may represent a reaction or alteration-induced feature, a possibility that is discussed below.
Reaction or alteration features: evidence for a late-stage Pt enrichment
A placer grain (~1 mm) with a “Pt2Fe”-type bulk composition [Pt61.0Ir2.8Rh1.1Pd0.2Fe31.3Cu3.14Ni0.4] exhibits a narrow zone (30–50 �m across), at the grain boundary of a Pt3Fe-type alloy [Pt69.8Ir2.1Rh0.4Fe27.4Cu0.1Ni0.1], interpreted to be a reaction zone. The EMP data indicate that this zone is enriched in Pt and is somewhat poorer in Ir and Rh, and relatively poor in Fe, Cu, and Ni relative to the bulk grain. Possibly, this zone lost Fe as a result of high-temperature reaction or subso-lidus re-equilibration between the “Pt2Fe” alloy and a coexisting chromite or magnetite. However, the corres-ponding depletion in Cu and Ni cannot be explained by a reaction of this type. The EMP data indicate that the �PGE value is greater by 7.2 at.%, whereas (Fe + Cu +
Ni) is lower by 7.2 at.% in the reaction zone relative to the bulk grain. Thus, the Pt–Fe alloy may have locally reacted with a sulfi de liquid or, alternatively, with a fl uid phase during crystallization in a primary environment. Such reaction could have resulted in a partial removal of the base metals in the sulfi de or fl uid, and in the propor-tional increase in Pt, thus promoting the local formation of “Pt3Fe” instead of “Pt2Fe”. A general similarity exists between textures observed in this placer grain and in a tiny crystal of Pt–Fe–(Cu) alloys, which consists of a PtFe-type alloy in the core and a Pt3Fe-type alloy in the rim, enclosed within chromite in the Tulameen complex (Nixon et al. 1990).
The characteristic texture of another grain of placer Pt–Fe alloys (Fig. 2E) also provides evidence for a Pt enrichment and removal of Fe late in the crystallization history or after crystallization. The original alloy is of a Pt3(Fe,Cu)-type (unaltered and gray in Fig. 2E) and having the composition Pt 85.62, Ir 1.51, Os 1.86, Rh 1.40, Pd 0.38, Ru 0.25, Fe 5.08, Cu 1.92, Ni 0.11, a total 98.13 wt.%, which corresponds to [Pt73.2Rh2.3Os1.6Ir1.3Pd0.6Ru0.4Fe15.2Cu5.0Ni0.3]. This alloy is rimmed and replaced by a veinlet-like alloy phase [i.e., “alteration zones”, AZ, which are brighter in Fig. 2E] of the following composition: Pt 88.55, Ir 1.70, Os 1.84, Rh 1.41, Pd 0.29, Ru 0.21, Fe 1.85, Cu 1.96, Ni 0.04, a total 97.88 wt.%, or [Pt81.7Rh2.4Os1.8Ir1.6Pd0.5Ru0.4Fe6.0Cu5.5Ni0.1]. These data indicate that the original alloy and the alloy developed in the AZ are distinct in their contents of Pt and Fe, whereas they are quite uniform in terms of contents of the other elements: Rh, Os, Ir, Pd, Ru, and Cu. In addition, the �PGE:(Fe + Cu + Ni) ratio of the latter alloy (AZ) is 7.6, which is much greater than that of the original alloy before alteration (3.9), or than the maximum value of this ratio (ca. 6) observed in all compositions of the analyzed grains of Pt–Fe alloy.
We suggest that these rim- and veinlet-like zones richer in Pt and poor in Fe (Fig. 2E) formed as a result of interaction of the original Pt–Fe alloy with a low-temperature fl uid, leading to a selective removal of Fe and simultaneous addition of Pt. Thus, Fe and Pt were remobilized and redistributed in the scale of this alloy grain; in contrast, the other elements remained essentially immobile. The evidence for hydrothermal mobilization of Pt, Pd and Ni was reported in zoned Pd–Pt–Ni sulfi des from the Penikat complex in Finland, for example (Barkov et al. 2004).
Interestingly, a certain degree of similarity may exist between the observed textures in the placer Pt–Fe alloy grains and textures of placer Au–Ag alloy, which consist of a Au-rich rim (poor in Ag) , possibly formed under supergene conditions (e.g., Knight et al. 1999a, and references therein). Such analogy would lead to an alternative, though less probable, hypothesis, implying that some of the Pt-rich and Fe-poor zones observed in the placer Pt–Fe–Cu alloy grains could have formed as a result of Fe removal in supergene processes.

PGM FROM FIVE PLACER DEPOSITS IN BRITISH COLUMBIA 1701
Minor Ir, Rh, and Pd in various Pt–Fe–Cu alloys
Our EMP data on minor contents of Ir, Rh, and Pd in various Pt–Fe–Cu alloys [i.e., Pt3Fe-type alloys, Fe-rich Pt with the �PGE:(Fe + Cu + Ni) ratio of 3.6–5.6, members of the tetraferroplatinum–tulameenite series, and “Pt2Fe”-type alloys] reveal that the data points generally plot along, or relatively near, the Ir–Rh and Rh–Pd joins. In contrast, no data points plot along the Pd–Ir join (Fig. 7). A compositional trend was previously reported for Pt3Fe-type alloys from various localities, extending from the Ir corner toward the Rh corner and then to the Pd corner in the Pd–Ir–Rh diagram, and was interpreted to refl ect a compositional change with decreasing temperature (Tolstykh et al. 2002, and references therein). In general, our data (Fig. 7) are consistent with these compositions, and imply the existence of Pd-It avoidance for the various Pt–Fe–Cu alloys, which are associated in the placer deposits examined.
Ir- and Os-dominant alloys, and Ru-rich alloys
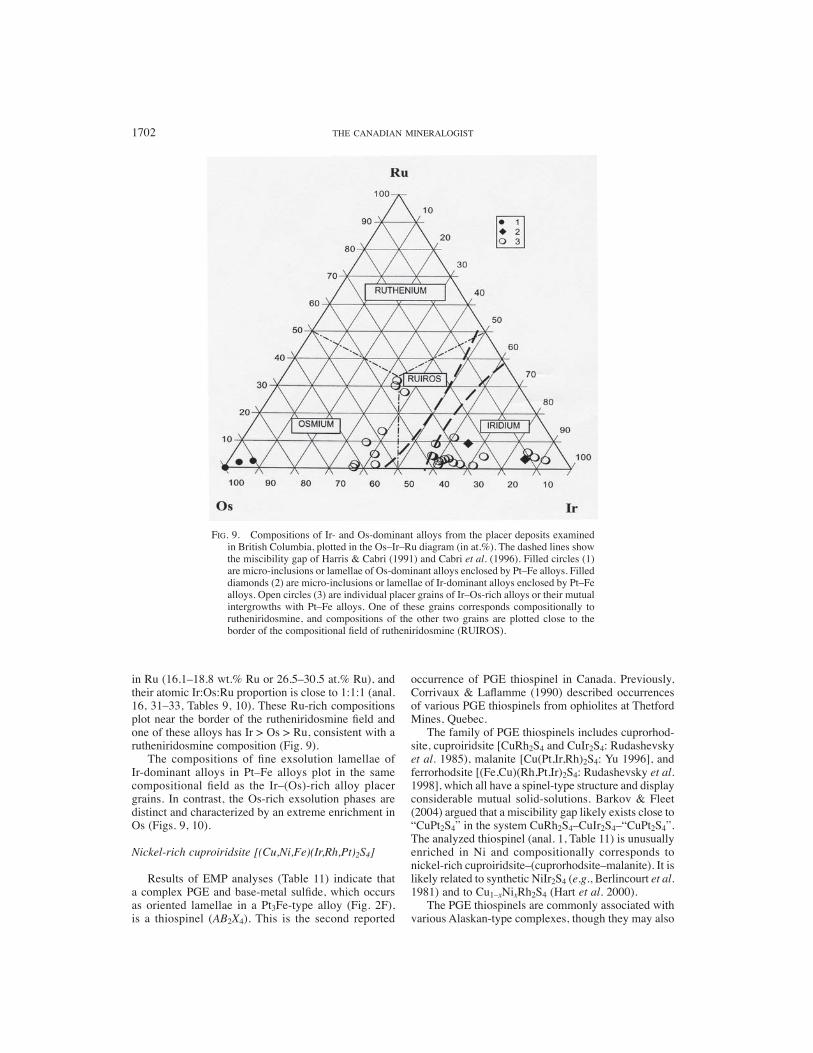
The EMP analyses of various Ir- and Os-dominant alloys and Ru-rich alloys (Tables 9, 10), which occur as individual grains or mutual intergrowths with Pt–Fe alloys, yielded the following mean composi-tion and compositional ranges (in at.% for n = 23): Ir 53.20 (31.45–82.58), Os 33.56 (5.31–62.51), Ru 7.39 (0.71–30.47), Pt 3.41 (0.0–14.12), Rh 1.06 (0.0–3.16), Pd 0.03 (0.0–0.16), Fe 1.17 (0.2–5.92), and Ni 0.18 (0.0–0.42). Note that the compositions of exsolution lamellae or micro-inclusions of Ir–Os–Ru–(Pt) alloys are not included here. The predominance of Ir in the mean composition of the grains of Ir-, Os-, and Ru-rich alloys refl ects the preponderance of Ir-dominant alloys (ca. 61% of the Ir–Os–Ru alloy grains). The overall compositional variations of Ir–Os–Ru–(Pt) alloys are shown in an Ir–Os–Ru diagram in Figure 9. The compo-sitions of the majority of these alloy grains plot in the Ir fi eld, outside the immiscibility region defi ned by Harris & Cabri (1991) and Cabri et al. (1996). Grain compo-sitions form a broad array extending along the Ir–Os join, and Ru contents are generally minor (Fig. 9). Four of these alloy grains, however, are relatively enriched
1702 THE CANADIAN MINERALOGIST
in Ru (16.1–18.8 wt.% Ru or 26.5–30.5 at.% Ru), and their atomic Ir:Os:Ru proportion is close to 1:1:1 (anal. 16, 31–33, Tables 9, 10). These Ru-rich compositions plot near the border of the rutheniridosmine fi eld and one of these alloys has Ir > Os > Ru, consistent with a rutheniridosmine composition (Fig. 9).
The compositions of fi ne exsolution lamellae of Ir-dominant alloys in Pt–Fe alloys plot in the same compositional fi eld as the Ir–(Os)-rich alloy placer grains. In contrast, the Os-rich exsolution phases are distinct and characterized by an extreme enrichment in Os (Figs. 9, 10).
Nickel-rich cuproiridsite [(Cu,Ni,Fe)(Ir,Rh,Pt)2S4]
Results of EMP analyses (Table 11) indicate that a complex PGE and base-metal sulfi de, which occurs as oriented lamellae in a Pt3Fe-type alloy (Fig. 2F), is a thiospinel (AB2X4). This is the second reported
occurrence of PGE thiospinel in Canada. Previously, Corrivaux & Lafl amme (1990) described occurrences of various PGE thiospinels from ophiolites at Thetford Mines, Quebec.
The family of PGE thiospinels includes cuprorhod-site, cuproiridsite [CuRh2S4 and CuIr2S4: Rudashevsky et al. 1985), malanite [Cu(Pt,Ir,Rh)2S4: Yu 1996], and ferrorhodsite [(Fe,Cu)(Rh,Pt,Ir)2S4: Rudashevsky et al. 1998], which all have a spinel-type structure and display considerable mutual solid-solutions. Barkov & Fleet (2004) argued that a miscibility gap likely exists close to “CuPt2S4” in the system CuRh2S4–CuIr2S4–“CuPt2S4”. The analyzed thiospinel (anal. 1, Table 11) is unusually enriched in Ni and compositionally corresponds to nickel-rich cuproiridsite–(cuprorhodsite–malanite). It is likely related to synthetic NiIr2S4 (e.g., Berlincourt et al. 1981) and to Cu1–xNixRh2S4 (Hart et al. 2000).
The PGE thiospinels are commonly associated with various Alaskan-type complexes, though they may also
FIG. 9. Compositions of Ir- and Os-dominant alloys from the placer deposits examined in British Columbia, plotted in the Os–Ir–Ru diagram (in at.%). The dashed lines show the miscibility gap of Harris & Cabri (1991) and Cabri et al. (1996). Filled circles (1) are micro-inclusions or lamellae of Os-dominant alloys enclosed by Pt–Fe alloys. Filled diamonds (2) are micro-inclusions or lamellae of Ir-dominant alloys enclosed by Pt–Fe alloys. Open circles (3) are individual placer grains of Ir–Os-rich alloys or their mutual intergrowths with Pt–Fe alloys. One of these grains corresponds compositionally to rutheniridosmine, and compositions of the other two grains are plotted close to the border of the compositional fi eld of rutheniridosmine (RUIROS).
PGM FROM FIVE PLACER DEPOSITS IN BRITISH COLUMBIA 1703
occur in ophiolitic chromitites (Corrivaux & Lafl amme 1990, Augé & Maurizot 1995), in podiform chromi-tites in orogenic lherzolite complexes (Garuti et al.
1995), and in layered intrusions (Barkov et al. 2000a). Although most of these thiospinels are commonly poor in Ni, their Ni-dominant (unnamed) analogues likely exist, as is implied by synthetic NiIr2S4 (Berlincourt et al. 1981) or by nickel-rich cuprorhodsite (0.44 apfu Ni) from the Baimka placer deposit, which is associated with Alaskan-type complexes, northeastern Russia (Gornostayev et al. 1999). The observed Fe content of the analyzed cuproiridsite is relatively high (0.12 apfu: Table 11), and points to the presence of the ferrorhod-site component. PGE thiospinels rich in Fe have been reported from the Penikat layered complex, Finland, where Fe is incorporated via a coupled substitution mechanism of the type: [AFe3 + + 2 BRh3 + ACu + + 2 BPt4 + (+ 2 Ir4 + )] (Barkov et al. 2000a).
A metal-rich ferrous rhodian sulfurian sperrylite [(Pt,Rh,Fe)(As,S)2–x]
An unusual sulfarsenide of Pt (anal. 3, Table 11), containing appreciable Rh (4.2 wt.%), Fe (1.2 wt.%), and S (1.9 wt.%), occurs as blocky and interlaced lamellar grains at the boundary of a Pt3Fe-type alloy grain, and as abundant veinlets within this placer grain
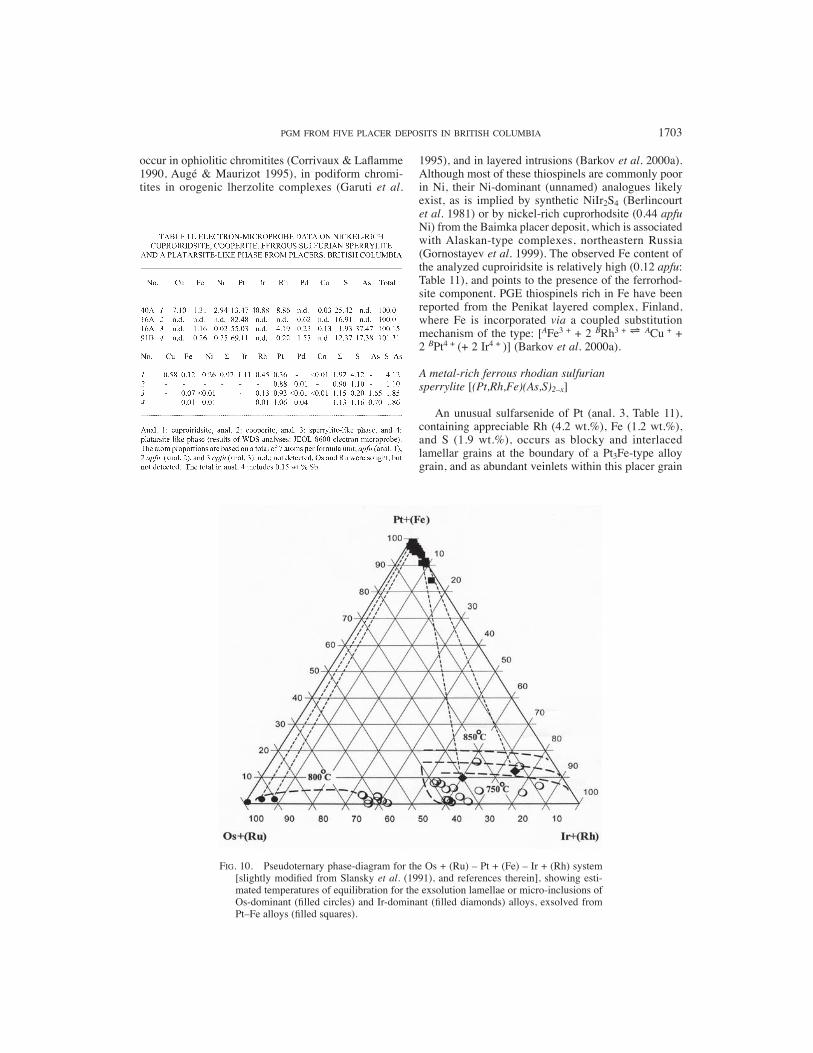
FIG. 10. Pseudoternary phase-diagram for the Os + (Ru) – Pt + (Fe) – Ir + (Rh) system [slightly modifi ed from Slansky et al. (1991), and references therein], showing esti-mated temperatures of equilibration for the exsolution lamellae or micro-inclusions of Os-dominant (fi lled circles) and Ir-dominant (fi lled diamonds) alloys, exsolved from Pt–Fe alloys (fi lled squares).

1704 THE CANADIAN MINERALOGIST
(Figs. 3B, C). An EMP analysis yields a sperrylite-type formula [(Pt0.93Rh0.13Fe0.07)�1.15(As1.65S0.20)�1.85]. The atomic (Rh + Fe):S ratio is 1.0, and indicates that Rh and Fe may be incorporated as a sulfarsenide compo-nent (“hollingworthite–arsenopyrite”) according to the following scheme: [(Rh + Fe)3 + + (AsS)3– = Pt2+ + (As2)2–]. This is consistent with reaction mechanisms previously formulated for the sperrylite–hollingworthite (RhAsS) series (Barkov & Fleet 2004), which has been reported from the Nomgon complex, Mongolia (Izokh & Mayorova 1990). Barkov et al. (2004) suggested that Fe occurs as the arsenopyrite component in a zoned grain of irarsite (IrAsS)–hollingworthite from the Penikat layered complex, and that the incorporation of Fe is governed there by the following mechanism of substitution: [(Rh + Fe)3+ = Ir3+]. Note that Rh and Fe are closely associated in this substitution; the association of these elements is also implied by the composition of the sperrylite-type phase from British Columbia. Rhodian sulfurian sperrylite was previously reported from the Imandra complex in Russia, implying a limited solid-solution toward the pyrite-type Rh1–xS2 (i.e., “Rh2S5” or Rh0.8S2): [0.4 Rh3+ + 0.4 Rh2+ + 0.2 Me� + (S2)2– = Pt2+ + (As2)2–: Barkov & Fleet 2004].
On the other hand, the (As + S) value of the presently analyzed sperrylite-type phase is relatively low (1.85 apfu: anal. 3, Table 11), which may imply the presence of vacancies at the As site. Thus, an alternative substi-tution-scheme may be proposed, which assumes limited incorporation of Rh and Fe in the form of a monosulfi de phase, (Rh,Fe)S, possibly related to the (Rh,Fe,Ni)S described from Ethiopia (Cabri et al. 1996). Natural solid-solutions between mono- and dichalcogenides are uncommon, though possible (especially for NiAs-type derivative structures), as indicated, for example, by the existence of an extensive solid-solution series between the Pd–Ni mono- and ditellurides (Barkov et al. 2002).
Platarsite-type phase [PtAs1–xS1+x] or unnamed Pt(S,As)2–x
This phase is highly unusual; it forms a narrow rim (ca. 5 �m across) around a Pt3Fe-type placer grain [(Pt2.85Pd0.25Rh0.05Os0.02Ir0.01Ru0.01)�3.19(Fe0.72Cu0.09 Ni0.01)�0.82; sample no. VLE–2001–91B: Fig. 1]. Its formula is (Pt1.06Pd0.04Rh0.01Fe0.01Ni0.01)�1.13S1.16As0.70Sb<0.01, with the Me:(As + S) atomic propor-tions virtually identical to those of the ferrous rhodian sulfurian sperrylite (anal. 3, 4, Table 11). This phase may be related to platarsite, PtAsS (Cabri et al. 1977, Szymanski 1979, Cabri & Lafl amme 1981). Barkov & Fleet (2004) suggested that the incorporation of Me3+ (Rh, Ir or Ni) in platarsite, which is probably a mixed-valence compound [Pt4+
0.5Pt2+0.5[AsS]3–], is governed
by the [2Me3+ = (Pt4+ + Pt2+)] substitution. On the other hand, the analyzed phase from British Columbia has the S-dominant composition, which contrasts with
As-excess compositions of platarsite and platarsite-type compounds (e.g., Cabri & Lafl amme 1981, Barkov & Fleet 2004). This phase may thus represent a new (unnamed) species having the following formula: (Pt,Pd,Rh)(S,As)2–x. A more detailed characterization of this phase is impossible because of its minute grain-size.
Cooperite [PtS] and unnamed (Ir,Rh,Pt)S (?)
Cooperite occurs as a partial rim around a Pt3Fe-type alloy grain (Fig. 4C). Platinum and S are its main constituents, and Pd is minor (0.6 wt.%); all the other elements were found to be below the limit of detection (anal. 2, Table 11).
Fragments of an Ir–Rh–(Pt) sulfi de, likely relics of a single broken grain, are preserved at the margin of a Pt3Fe-type alloy (Figs. 4D, E). Only preliminary and semiquantitative compositional data could be obtained owing to the minute grain-size (<5 �m). However, the estimated atomic proportions differ from those of kashinite [(Ir,Rh)2S3], and, instead, seem consistent with the (Ir,Rh,Pt)S-type formula [(Ir0.45Rh0.37Pt0.08)�0.9S1.1: �atoms = 2; Cu, Fe, Ni, Co, Os, Ru, Pd, and As were not detected]. If this suggestion is correct, a possible relationship with “IrS” is implied (cf. Berlincourt et al. 1981). The “IrS” phase has been fi rst synthesized by heating “IrS3” (Ir1–xS2) or IrS2 in N2 at 700°C (Wöhler et al. 1933). Biltz et al. (1937) did not confi rm the presence of “IrS”, however. The other reported phases with similar atomic proportions are [(Ir0.56Rh0.25Ni0.15Pt0.03)�1.0S1.0] from China (Yu et al. 1974), (Rh,Pd)S from Borneo, Malaysia, and (Rh,Ir,Fe,Ni)S from Yubdo, Ethiopia (Cabri et al. 1996).
Implications from silicate micro-inclusions in PGM
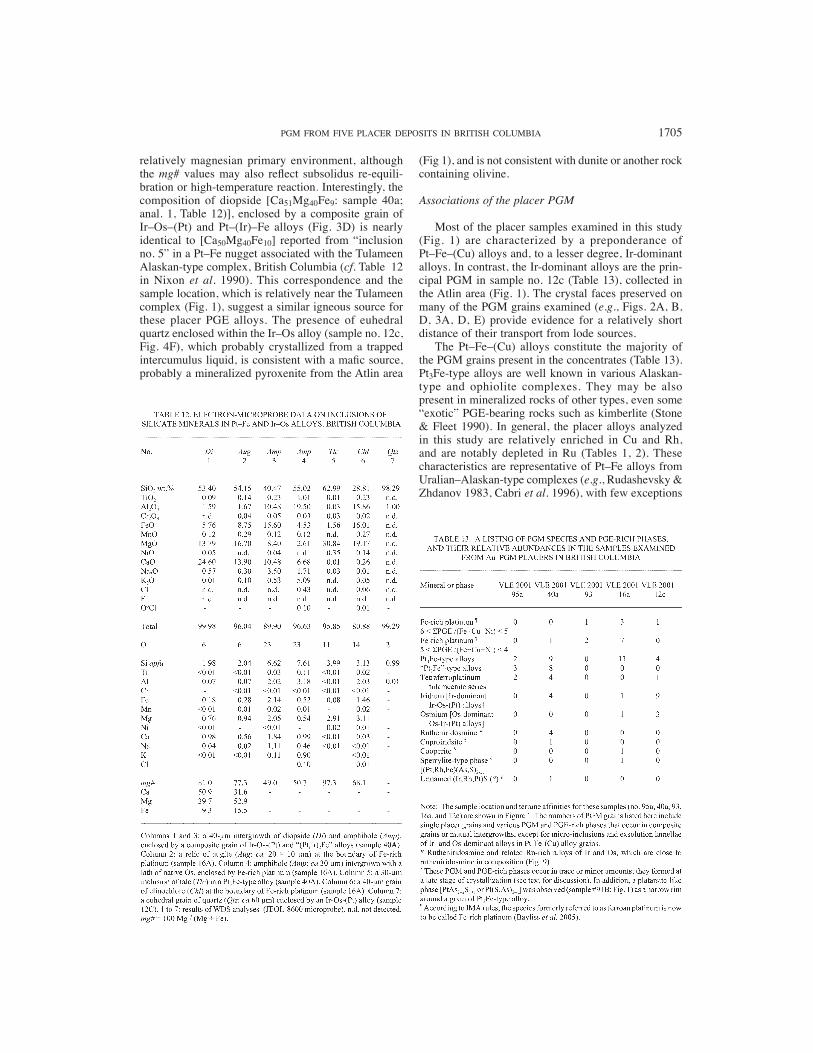
The EMP data for silicate inclusions in various PGE alloy grains are given in Table 12 [diopside: anal. 1, Fig. 3D; augite: anal. 2; amphiboles: anal. 3, 4; talc: anal. 5, and clinochlore: anal. 6; which show high values of mg#, i.e., 100 Mg/(Mg + Fe), where all Fe is FeO]. The lower analytical totals in some cases refl ect grain sizes less than the excitation volume of the electron beam. An inclusion of euhedral quartz (Figs. 3F, 4F, anal. 7, Table 12) is enclosed in the Ir-dominant alloy [Ir59.10Os18.82Pt14.12Ru3.82Rh2.03Fe1.92Ni0.15]. Compo-sitionally, the amphiboles are ferro-edenite (anal. 3), which is intergrown with diopside (Fig. 3D), and a potassian sodic-calcic amphibole like richterite (anal. 4) intergrown with native Os (Fig. 4B). These high-Mg amphiboles are generally devoid of Cl, consistent with the Mg–Cl avoidance principle. However, the potassian richterite grain contains minor Cl (0.4 wt.%: Table 12) whose incorporation into the amphibole structure was likely promoted by its K-rich composition (cf. Oberti et al. 1993). The high mg# values of these ferromagne-sian silicates (Table 12) suggest that they formed in a
PGM FROM FIVE PLACER DEPOSITS IN BRITISH COLUMBIA 1705
relatively magnesian primary environment, although the mg# values may also refl ect subsolidus re-equili-bration or high-temperature reaction. Interestingly, the composition of diopside [Ca51Mg40Fe9: sample 40a; anal. 1, Table 12)], enclosed by a composite grain of Ir–Os–(Pt) and Pt–(Ir)–Fe alloys (Fig. 3D) is nearly identical to [Ca50Mg40Fe10] reported from “inclusion no. 5” in a Pt–Fe nugget associated with the Tulameen Alaskan-type complex, British Columbia (cf. Table 12 in Nixon et al. 1990). This correspondence and the sample location, which is relatively near the Tulameen complex (Fig. 1), suggest a similar igneous source for these placer PGE alloys. The presence of euhedral quartz enclosed within the Ir–Os alloy (sample no. 12c, Fig. 4F), which probably crystallized from a trapped intercumulus liquid, is consistent with a mafi c source, probably a mineralized pyroxenite from the Atlin area
(Fig 1), and is not consistent with dunite or another rock containing olivine.
Associations of the placer PGM
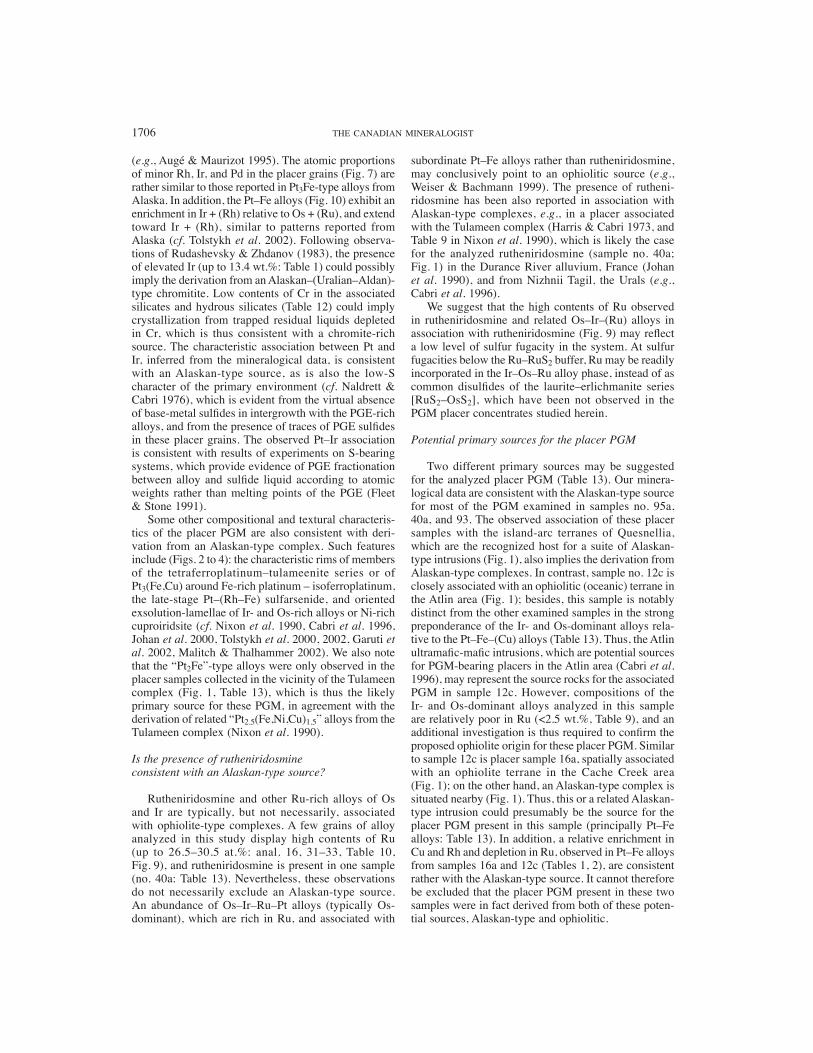
Most of the placer samples examined in this study (Fig. 1) are characterized by a preponderance of Pt–Fe–(Cu) alloys and, to a lesser degree, Ir-dominant alloys. In contrast, the Ir-dominant alloys are the prin-cipal PGM in sample no. 12c (Table 13), collected in the Atlin area (Fig. 1). The crystal faces preserved on many of the PGM grains examined (e.g., Figs. 2A, B, D, 3A, D, E) provide evidence for a relatively short distance of their transport from lode sources.
The Pt–Fe–(Cu) alloys constitute the majority of the PGM grains present in the concentrates (Table 13). Pt3Fe-type alloys are well known in various Alaskan-type and ophiolite complexes. They may be also present in mineralized rocks of other types, even some “exotic” PGE-bearing rocks such as kimberlite (Stone & Fleet 1990). In general, the placer alloys analyzed in this study are relatively enriched in Cu and Rh, and are notably depleted in Ru (Tables 1, 2). These characteristics are representative of Pt–Fe alloys from Uralian–Alaskan-type complexes (e.g., Rudashevsky & Zhdanov 1983, Cabri et al. 1996), with few exceptions
1706 THE CANADIAN MINERALOGIST
(e.g., Augé & Maurizot 1995). The atomic proportions of minor Rh, Ir, and Pd in the placer grains (Fig. 7) are rather similar to those reported in Pt3Fe-type alloys from Alaska. In addition, the Pt–Fe alloys (Fig. 10) exhibit an enrichment in Ir + (Rh) relative to Os + (Ru), and extend toward Ir + (Rh), similar to patterns reported from Alaska (cf. Tolstykh et al. 2002). Following observa-tions of Rudashevsky & Zhdanov (1983), the presence of elevated Ir (up to 13.4 wt.%: Table 1) could possibly imply the derivation from an Alaskan–(Uralian–Aldan)-type chromitite. Low contents of Cr in the associated silicates and hydrous silicates (Table 12) could imply crystallization from trapped residual liquids depleted in Cr, which is thus consistent with a chromite-rich source. The characteristic association between Pt and Ir, inferred from the mineralogical data, is consistent with an Alaskan-type source, as is also the low-S character of the primary environment (cf. Naldrett & Cabri 1976), which is evident from the virtual absence of base-metal sulfi des in intergrowth with the PGE-rich alloys, and from the presence of traces of PGE sulfi des in these placer grains. The observed Pt–Ir association is consistent with results of experiments on S-bearing systems, which provide evidence of PGE fractionation between alloy and sulfi de liquid according to atomic weights rather than melting points of the PGE (Fleet & Stone 1991).
Some other compositional and textural characteris-tics of the placer PGM are also consistent with deri-vation from an Alaskan-type complex. Such features include (Figs. 2 to 4): the characteristic rims of members of the tetraferroplatinum–tulameenite series or of Pt3(Fe,Cu) around Fe-rich platinum – isoferroplatinum, the late-stage Pt–(Rh–Fe) sulfarsenide, and oriented exsolution-lamellae of Ir- and Os-rich alloys or Ni-rich cuproiridsite (cf. Nixon et al. 1990, Cabri et al. 1996, Johan et al. 2000, Tolstykh et al. 2000, 2002, Garuti et al. 2002, Malitch & Thalhammer 2002). We also note that the “Pt2Fe”-type alloys were only observed in the placer samples collected in the vicinity of the Tulameen complex (Fig. 1, Table 13), which is thus the likely primary source for these PGM, in agreement with the derivation of related “Pt2.5(Fe,Ni,Cu)1.5” alloys from the Tulameen complex (Nixon et al. 1990).
Is the presence of rutheniridosmine consistent with an Alaskan-type source?
Rutheniridosmine and other Ru-rich alloys of Os and Ir are typically, but not necessarily, associated with ophiolite-type complexes. A few grains of alloy analyzed in this study display high contents of Ru (up to 26.5–30.5 at.%: anal. 16, 31–33, Table 10, Fig. 9), and rutheniridosmine is present in one sample (no. 40a: Table 13). Nevertheless, these observations do not necessarily exclude an Alaskan-type source. An abundance of Os–Ir–Ru–Pt alloys (typically Os-dominant), which are rich in Ru, and associated with
subordinate Pt–Fe alloys rather than rutheniridosmine, may conclusively point to an ophiolitic source (e.g., Weiser & Bachmann 1999). The presence of rutheni-ridosmine has been also reported in association with Alaskan-type complexes, e.g., in a placer associated with the Tulameen complex (Harris & Cabri 1973, and Table 9 in Nixon et al. 1990), which is likely the case for the analyzed rutheniridosmine (sample no. 40a; Fig. 1) in the Durance River alluvium, France (Johan et al. 1990), and from Nizhnii Tagil, the Urals (e.g., Cabri et al. 1996).
We suggest that the high contents of Ru observed in rutheniridosmine and related Os–Ir–(Ru) alloys in association with rutheniridosmine (Fig. 9) may refl ect a low level of sulfur fugacity in the system. At sulfur fugacities below the Ru–RuS2 buffer, Ru may be readily incorporated in the Ir–Os–Ru alloy phase, instead of as common disulfi des of the laurite–erlichmanite series [RuS2–OsS2], which have been not observed in the PGM placer concentrates studied herein.
Potential primary sources for the placer PGM
Two different primary sources may be suggested for the analyzed placer PGM (Table 13). Our minera-logical data are consistent with the Alaskan-type source for most of the PGM examined in samples no. 95a, 40a, and 93. The observed association of these placer samples with the island-arc terranes of Quesnellia, which are the recognized host for a suite of Alaskan-type intrusions (Fig. 1), also implies the derivation from Alaskan-type complexes. In contrast, sample no. 12c is closely associated with an ophiolitic (oceanic) terrane in the Atlin area (Fig. 1); besides, this sample is notably distinct from the other examined samples in the strong preponderance of the Ir- and Os-dominant alloys rela-tive to the Pt–Fe–(Cu) alloys (Table 13). Thus, the Atlin ultramafi c-mafi c intrusions, which are potential sources for PGM-bearing placers in the Atlin area (Cabri et al. 1996), may represent the source rocks for the associated PGM in sample 12c. However, compositions of the Ir- and Os-dominant alloys analyzed in this sample are relatively poor in Ru (<2.5 wt.%, Table 9), and an additional investigation is thus required to confi rm the proposed ophiolite origin for these placer PGM. Similar to sample 12c is placer sample 16a, spatially associated with an ophiolite terrane in the Cache Creek area (Fig. 1); on the other hand, an Alaskan-type complex is situated nearby (Fig. 1). Thus, this or a related Alaskan-type intrusion could presumably be the source for the placer PGM present in this sample (principally Pt–Fe alloys: Table 13). In addition, a relative enrichment in Cu and Rh and depletion in Ru, observed in Pt–Fe alloys from samples 16a and 12c (Tables 1, 2), are consistent rather with the Alaskan-type source. It cannot therefore be excluded that the placer PGM present in these two samples were in fact derived from both of these poten-tial sources, Alaskan-type and ophiolitic.

PGM FROM FIVE PLACER DEPOSITS IN BRITISH COLUMBIA 1707
Crystallization history of the associated PGM
A high-temperature origin of the associated Pt–Fe alloys and Ir–Os alloys, and a similar temperature of their crystallization, are implied by the observed exsolution of Ir–(Os)-rich alloy from the host Pt–Fe alloy (Fig. 3A), and, vice versa, by the exsolution of Pt–Fe alloy from the Ir-rich alloy (Fig. 3D). We note the following points.
(1) Most of the observed PGM species and varie-ties, such as the Cu-rich Pt–Fe alloys [tetraferropla-tinum–tulameenite and Pt3(Fe,Cu)], cooperite, Ni-rich cuproiridsite, Pt-rich sulfarsenides [(Pt,Rh,Fe)(As,S)2–x and Pt(S,As)2–x], and “(Ir,Rh,Pt)S”], are only present in minor or trace quantities and in intimate association with Pt–Fe alloy grains, not with Ir–Os-rich alloys, and their speciation and compositions are likely related to the crystallization of the coexisting Pt–Fe alloys.
(2) Apparently, these minor PGM formed at an advanced or late stage of magmatic (or postmagmatic) crystallization, after the coexisting (host) Pt–Fe alloys, as is indicated by their textural characteristics: the presence of rims and rim-like grains (Figs. 2A, B, 3B, 4C), veinlets (Fig. 3C), micrograins at the boundary of Pt–Fe alloy(s) (Figs. 4D, E), and of “crystallographi-cally” oriented lamellae (Fig. 2F).
(3) The fi ne exsolution-induced domains of Ir-domi-nant alloy (Fig. 3A) and of native Os (Fig. 4A), which display intergrowth relationships with the “potassic richterite” (Fig. 4B) and occur at the Pt–Fe alloy grain boundary, in common with micrograins of Ir–Os alloys, also imply crystallization at a lower temperature, which was controlled to a large degree by the crystallization of the coexisting (host) Pt–Fe alloy(s).
(4) A high temperature of crystallization of a Pt3Fe-type alloy would clearly promote the incorporation of elevated levels of Ir, in accordance with the experi-mental data of Makovicky & Karup-Møller (2000), who observed that, in the system Pt–Ir–Fe–S, the solubility of Ir in synthetic Pt3Fe decreases with decreasing temperature (29.3 at.% Ir at 1100°C, and 23.6 at.% Ir at 1000°C). Thus, a normal drop in temperature, associated with cooling, and corresponding decrease in the solubi-lity of Ir could likely produce the exsolution lamellae or micro-inclusions of Ir–(Os)-rich alloys, which are “crystallographically” oriented and are enclosed within the host Pt–Fe alloy(s). The compositions of Os- and Ir-dominant alloys, which exsolved from the coexisting Pt–Fe alloys, imply uniform temperatures of equilibra-tion of approximately 750 to 800°C (Fig. 10).
(5) The Cu-rich Pt–Fe alloys observed in the “rim-like zones” of zoned intergrowths appear to have formed as a result of a drop in temperature and increase in the activity of Cu in the remaining liquid after an early crystallization of the Cu-poor Pt–Fe alloys (i.e., the “core zones”: Figs. 2A, B, D). The observed similarity with the zoned intergrowths of Pt–Pd–(Cu) stannides
from the Noril’sk complex is noteworthy (cf. Barkov et al. 2000b).
(6) The Cu-poor Pt–Fe alloys likely crystallized under conditions of a low sulfur fugacity in a magmatic environment poor in overall S. Presumably, levels of sulfur fugacity have increased with progressive crystal-lization of these alloys, thus promoting the local forma-tion of the Ni-rich cuproiridsite by exsolution (Fig. 2F), of the rim-like grains of late-stage Ir–Rh–Pt sulfi de (Fig. 4E), cooperite (Fig. 4C) and of the Pt–Rh–(Fe) sulfarsenides (e.g., Fig. 3B). Similar to S, As must have been an incompatible component during the crystalliza-tion of the Pt–Fe alloy. Relative levels of As must have increased at a late stage of crystallization, when the lamellar and rim-like grains of this sulfarsenide (e.g., Fig. 3C) precipitated from a late-stage fl uid.
ACKNOWLEDGEMENTS
The fi rst author expresses his sincere gratitude and appreciation to Professor Michael E. Fleet. This study was made possible with financial support from the British Columbia Geological Survey and the Natural Sciences and Engineering Research Council of Canada, which is gratefully acknowledged. Menghua Liu of the A.D. Edgar Laboratory, University of Western Ontario, London, Ontario, is thanked for his technical assistance with the EMP analyses. V.M.L. is grateful to the following individuals for providing informa-tion, access to placer mining properties and samples of concentrate: Peter Burjoski, Mike Swenson, Ken Herron, Dale and Debora Harrison, and John English. Dave Mate and Travis Ferbey assisted with fi eld work, data analysis and fi gure preparation. We thank Louis J. Cabri and Yuanming Pan for constructive criticism on this contribution.
REFERENCES
AUGÉ, T. & LEGENDRE, O. (1992): Platinum–iron nuggets from alluvial deposits in eastern Madagascar. Can. Mineral. 30, 983-1004.
________ & MAURIZOT, P. (1995): Stratiform and alluvial platinum mineralization in the New Caledonia ophiolite complex. Can. Mineral. 33, 1023-1045.
BARKOV, A.Y. & FLEET, M.E. (2004): An unusual association of hydrothermal platinum-group minerals from the Iman-dra layered complex, Kola Peninsula, northwestern Russia. Can. Mineral. 42, 455-467.
________, ________, MARTIN, R.F. & ALAPIETI, T.T. (2004): Zoned sulfi des and sulfarsenides of the platinum-group elements from the Penikat layered complex, Finland. Can. Mineral. 42, 515-537.
________, LAFLAMME, J.H.G., CABRI, L.J. & MARTIN, R.F. (2002): Platinum-group minerals from the Wellgreen

1708 THE CANADIAN MINERALOGIST
Cu–Ni–PGE deposit, Yukon, Canada. Can. Mineral. 40, 651-669.
________, MARTIN, R.F., HALKOAHO, T.A.A. & POIRIER, G. (2000a): The mechanism of charge compensation in Cu–Fe–PGE thiospinels from the Penikat layered intrusion, Finland. Am. Mineral. 85, 694-697.
________, ________, POIRIER, G. & YAKOVLEV, Y.N. (2000b): The taimyrite–tatyanaite series and zoning in intermetallic compounds of Pt, Pd, Cu, and Sn from Noril’sk, Siberia, Russia. Can. Mineral. 38, 599-609.
BAYLISS, P., KAESZ, H.D. & NICKEL, E.H. (2005): The use of chemical-element adjectival modifi ers in mineral nomen-clature. Can. Mineral. 43, 1429-1433.
BERLINCOURT, L.E., HUMMEL, H.H. & SKINNER, B.J. (1981): Phases and phase relations of the platinum-group ele-ments. In Platinum-Group Elements: Mineralogy, Geology, Recovery (L.J. Cabri, ed.). Can. Inst. Mining, Metall., Petroleum, Spec. Vol. 23, 19-45.
BILTZ, W., LAAR, J., EHRLICH, P. & MEISEL, K. (1937): The sys-tematic study of affi nity. LXXIV. The sulfi des of iridium. Z. anorg. allgem. Chem. 233, 257-281.
BOWLES, J.F.W. (1990): Platinum–iron alloys, their structural and magnetic characteristics in relation to hydrothermal and low-temperature genesis. Mineral. Petrol. 43, 37-47.
CABRI, L.J. & FEATHER, C.E. (1975): Platinum–iron alloys. Nomenclature based on a study of natural and synthetic alloys. Can. Mineral. 13, 117-126.
________ & GENKIN, A.D. (1991): Re-examination of pla-tinum alloys from lode and placer deposits, Urals. Can. Mineral. 29, 419-425.
________, HARRIS, D.C. & WEISER, T.W. (1996): Mineralogy and distribution of platinum-group mineral (PGM) placer deposits of the world. Explor. Mining Geol. 5, 73-167.
________ & LAFLAMME, J.H.G. (1981): Analyses of minerals containing platinum-group elements. In Platinum-Group Elements: Mineralogy, Geology, Recovery (L.J. Cabri, ed.). Can. Inst. Mining Metall., Petroleum, Spec. Vol. 23, 151-173.
________, ________ & STEWART, J.M. (1977): Platinum-group minerals from Onverwacht. II. Platarsite, a new sulfarsenide of platinum. Can. Mineral. 15, 385-388.
________, OWENS, D.R. & LAFLAMME, J.H.G. (1973): Tula-meenite, a new platinum–iron–copper mineral from pla-cers in the Tulameen River area, British Columbia. Can. Mineral. 12, 21-25.
________, ROSENZWEIG, A. & PINCH, W.W. (1977): Platinum-group minerals from Onverwacht. I. Pt–Fe–Cu–Ni alloys. Can. Mineral. 15, 380-384.
CORRIVAUX, L. & LAFLAMME, J.H.G. (1990): Minéralogie des éléments du groupe du platine dans les chromitites
de l’ophiolite de Thetford Mines, Québec. Can. Mineral. 28, 579-595.
FLEET, M.E. & STONE, W.E. (1991): Partitioning of platinum-group elements in the Fe–Ni–S system and their fractiona-tion in nature. Geochim. Cosmochim. Acta 55, 245-253.
GARUTI, G., GAZZOTTI, M. & TORRES-RUIZ, J. (1995): Iridium, rhodium, and platinum sulfi des in chromitites from the ultramafi c massifs of Finero, Italy, and Ojen, Spain. Can. Mineral. 33, 509-520.
________, PUSHKAREV, E.V. & ZACCARINI, F. (2002): Com-position and paragenesis of Pt alloys from chromitites of the Uralian–Alaskan-type Kytlym and Uktus complexes, northern and central Urals, Russia. Can. Mineral. 40, 1127-1146.
GORNOSTAYEV, S.S., CROCKET, J.H., MOCHALOV, A.G. & LAA-JOKI, K.V.O. (1999): The platinum-group minerals of the Baimka placer deposits, Aluchin horst, Russian Far East. Can. Mineral. 37, 1117-1129.
HARRIS, D.C. & CABRI, L.J. (1973): The nomenclature of the natural alloys of osmium, iridium and ruthenium based on new compositional data of alloys from world-wide occur-rences. Can. Mineral. 12, 104-112.
________ &________ (1991): Nomenclature of platinum-group-element alloys: review and revision. Can. Mineral. 29, 231-237.
HART, G.L.W., PICKETT, W.E., KURMAEV, E.Z., HARTMANN, D., NEUMANN, M., MOEWES, A., EDERER, D.L., ENDOH, R., TANIGUCHI, K. & NAGATA, S. (2000): Electronic structure of Cu1–xNixRh2S4 and CuRh2Se4: band-structure calculations, X-ray photoemission, and fl uorescence measurements. Phys. Rev. B: Condens. Matter Mater. Phys. 61, 4230-4237.
IZOKH, A.E. & MAYOROVA, O.N. (1990): A rhodium-bearing sperrylite from the Nomgon complex (Mongolia). Dokl. Akad. Nauk SSSR 313, 1212-1215 (in Russ.).
JOHAN, Z., OHNENSTETTER, M., FISCHER, W. & AMOSSÉ, J. (1990): Platinum-group minerals from the Durance River alluvium, France. Mineral. Petrol. 42, 287-306.
________, ________, SLANSKY, E., BARRON, L.M. & SUPPEL, D. (1989): Platinum mineralization in the Alaskan-type intrusive complexes near Fifi eld, New South Wales, Aus-tralia. 1. Platinum-group minerals in clinopyroxenites of the Kelvin Grove prospect, Owendale intrusion. Mineral. Petrol. 40, 289-309.
________, SLANSKY, E. & KELLY, D. (2000): Platinum nug-gets from the Kompiam area, Enga Province, Papua New Guinea: evidence for an Alaskan-type complex. Mineral. Petrol. 68, 159-176.
KNIGHT, J.B., MORISON, S.R. & MORTENSEN J.K. (1999a): The relationship between placer gold particle shape, rimming, and distance of fl uvial transport as exemplifi ed by gold from the Klondike District, Yukon Territory, Canada. Econ. Geol. 94, 635-648.

PGM FROM FIVE PLACER DEPOSITS IN BRITISH COLUMBIA 1709
__________, MORTENSEN, J.K. & MORISON, S.R. (1999b): Lode and placer gold composition in the Klondike District, Yukon Territory, Canada: implications for the nature and genesis of Klondike placer and lode gold deposits. Econ. Geol. 94, 649-664.
LEVSON, V.M. & GILES, T.R. (1993): Geology of Tertiary and Quaternary gold-bearing placers in the Cariboo Region, British Columbia. British Columbia Ministry of Energy and Mines, Bull. 89.
________, MATE, D. & FERBEY, T. (2002): Platinum-group-element (PGE) placer deposits in British Columbia: characterization and implications for PGE potential. In Geological Fieldwork 2001. British Columbia Geological Survey, Pap. 2002–1, 303-312.
________ & MORISON, S. (1995): Geology of placer deposits in glaciated environments. In Past Glacial Environments – Sediments, Forms and Techniques (J. Menzies, ed.). Pergamon Press, Oxford, U.K. (441-478).
MAKOVICKY, E. & KARUP-MØLLER, S. (2000): Phase relations in the metal-rich portions of the phase system Pt–Ir–Fe–S at 1000°C and 1100ºC. Mineral. Mag. 64, 1047-1056.
MALITCH, K.N. & THALHAMMER, O.A.R. (2002): Pt–Fe nug-gets derived from clinopyroxenite–dunite massifs, Russia: a structural, compositional and osmium-isotope study. Can. Mineral. 40, 395-418.
NALDRETT, A.J. & CABRI, L.J. (1976): Ultramafi c and related mafi c rocks: their classifi cation and genesis with special reference to the concentration of nickel sulfi des and plati-num-group elements. Econ. Geol. 71, 1131-1158.
NIXON, G.T., CABRI, L.J. & LAFLAMME, J.H.G. (1990): Pla-tinum-group-element mineralization in lode and placer deposits associated with the Tulameen Alaskan-type com-plex, British Columbia. Can. Mineral. 28, 503-535.
OBERTHÜR, T., WEISER, T.W., GAST, L., SCHOENBERG, R. & DAVIS, D.W. (2002): Platinum-group minerals and other detrital components in the Karoo-age Somabula gravels, Gweru, Zimbabwe. Can. Mineral. 40, 435-456.
OBERTI, R., UNGARETTI, L., CANNILLO, E. & HAWTHORNE, F.C. (1993): The mechanism of Cl incorporation in amphibole. Am. Mineral. 78, 746-752.
RAICEVIC, D. & CABRI, L.J. (1976): Mineralogy and concen-tration of Au- and Pt-bearing placers from the Tulameen River area in British Columbia. Can. Inst. Mining Metall., Bull. 69(770), 111-119.
RUDASHEVSKY, N.S., MEN’SHIKOV, YU.P., MOCHALOV, A.G., TRUBKIN, N.V., SHUMSKAYA, N.I. & ZHDANOV, V.V. (1985): Cuprorhodsite CuRh2S4 and cuproiridsite CuIr2S4 – new natural thiospinels of platinum-group elements. Zap. Vses. Mineral. Obshchest. 114, 187-195 (in Russ.).
________, MOCHALOV, A.G., MEN’SHIKOV, YU.P. & SHUMS-KAYA, N.I. (1983): Ferronickelplatinum Pt2FeNi – a new
mineral species. Zap. Vses. Mineral. Obshchest. 112, 487-494 (in Russ.).
________, ________, ________ & ________ (1998): Ferro-rhodsite (Fe,Cu)(Rh,Pt,Ir)2S4 – a new mineral. Zap. Vses. Mineral. Obshchest. 127(5), 37-41 (in Russ.).
________ & ZHDANOV, V.V. (1983): Accessory platinum mine-ralization of a mafi c-ultramafi c intrusion in Kamchatka. Bull. Moscow Obshchest. Ispyt. Prirody, Otd. Geol. 58, 49-59 (in Russ.).
SLANSKY, E., JOHAN, Z, OHNENSTETTER, M., BARRON, L.M. & SUPPEL, D. (1991): Platinum mineralization in the Alaskan-type intrusive complexes near Fifi eld, N.S.W., Australia. 2. Platinum-group minerals in placer deposits at Fifi eld. Mineral. Petrol. 43, 161-180.
STONE, W.E. & FLEET, M.E. (1990): Platinum–iron alloy (Pt3Fe) in kimberlite from Fayette County, Pennsylvania. Am. Mineral. 75, 881-885.
SZYMANSKI, J.T. (1979): The crystal structure of platarsite, Pt(As,S)2, and a comparison with sperrylite, PtAs2. Can. Mineral. 17, 117-123.
TOLSTYKH, N.D., FOLEY, J.Y., SIDOROV, E.G. & LAAJOKI, K.V.O. (2002): Composition of the platinum-group mine-rals in the Salmon River placer deposit, Goodnews Bay, Alaska. Can. Mineral. 40, 463-471.
________, SIDOROV, E.G., LAAJOKI, K.V.O., KRIVENKO, A.P. & PODLIPSKIY, M. (2000): The association of platinum-group minerals in placers of the Pustaya River, Kamchatka, Rus-sia. Can. Mineral. 38, 1251-1264.
WEISER, T.W. & BACHMANN, H.-G. (1999): Platinum-group minerals from the Aikora river area, Papua New Guinea. Can. Mineral. 37, 1131-1145.
WÖHLER, L., EWALD, K. & KRALL, H. (1933): The sulfi des, selenides and tellurides of the six platinum metals. G. Ber. 66B, 1638-1652.
YU, T.-H., LIN, S.-J., CHAO, P., FANG, C.-S. & HUANG, C.-S. (1974): A preliminary study of some new minerals of the platinum-group and another associated new one in plati-num-bearing intrusions in a region in China. Acta Geol. Sinica 2, 202-218 (in Chinese).
YU, ZUXIANG (1995): Chengdeite – an ordered natural iron–iri-dium alloy. Dizhi Xuebao 69, 215-220 (in Chinese).
________ (1996): New data on the cupric platinum (Pt3+) and iridium (Ir3+) sulfi de – malanite. Dizhi Xuebao 70, 309-314 (in Chinese).
ZHERNOVSKY, I.V., MOCHALOV, A.G. & RUDASHEVSKY, N.S. (1985): Phase inhomogeneity of isoferroplatinum enriched in iron. Dokl. Akad. Nauk SSSR 283, 196-200 (in Russ.).
Received August 30, 2004, revised manuscript accepted June 15, 2005.

1710 THE CANADIAN MINERALOGIST
Sample VLE 2001–12c
The concentrate sample was derived from the lower few meters of a paleochannel gravel deposit that overlies bedrock and underlies approximately 20 m of glacial sediments. The paleochannel deposits are strongly oxidized and, although mostly buried, they locally outcrop along the sides of the O’Donnel River valley. The overburden sequence consists of a capping diamicton underlain by crudely stratifi ed gravels and several meters of horizontally bedded silts and sands. These deposits are interpreted, respectively, as till, proximal glaciofluvial gravels and glaciolacustrine sediments. The paleochannel gravels consist mainly of large-scale trough cross-bedded sands and pebble gravels with some cobble to boulder gravel beds up to about a meter thick. Sample 2001–12c was a heavy-mineral concentrate processed from the lower few meters of the unit and the upper half- meter of the bedrock.
Sample VLE 2001–16a
The site was not visited, but the following descrip-tion is summarized from information provided by the miner. Mined materials occur on a low terrace about 25 m wide and one to six meters deep, with very little over-burden (usually less than one meter). The gravels are horizontally stratifi ed and subrounded to well rounded. Clasts are mainly in the pebble size-range, with up to about 40% cobbles and boulders. Clast lithologies, in order of abundance, include granitic rocks, schist, shale, quartz, limestone, and ultramafi c rocks (serpentinite and jade). The local bedrock is highly altered shale and limestone with numerous quartz veins. Recovered gold is coarse (mainly >5 mm diameter), with rounded edges.
Sample VLE 2001–40a
The sample was collected at a small open-pit mine exploiting an alluvial fan placer. The placer gravels sit directly on bedrock and are one to two meters thick. They probably represent fl uvial and colluvial sediments deposited prior to, and in the early stages
of, fan development. They are overlain by three to four meters of bouldery fan gravels with relatively low concentrations of placer minerals. The mined gravels are clast-supported, matrix-fi lled, large pebble to large cobble gravels with a muddy sand matrix. The gravels are mainly subangular and local in origin, although subrounded erratic boulders also are present. Cobble clusters and thin pebble gravel beds also occur. Gold nuggets are mostly fl attened with rounded edges. They become more angular and coarser upstream. Reported gangue minerals include abundant magnetite, minor pyrite and rare garnet. The overburden sequence consists mainly of massive to crudely stratifi ed, matrix- to clast-supported, cobble to boulder gravels. The clasts are subrounded, and erratic lithologies are common. The sequence is interpreted as an alluvial fan deposit consisting mainly of reworked glacial sediments.
Sample VLE 2001–93
The sample was derived from surface fl uvial gravels overlying bedrock on a low terrace a few meters above river level. The geology of the site and detailed descrip-tions of the placer deposits are provided by Levson & Giles (1993). Holocene terrace gravels in the region generally overlie older, probably Tertiary, cemented gravels. Clasts are rounded to well rounded, and the gravels are well stratifi ed. Gold grains are typically small (less than 1 mm) and fl at with rounded edges. Reported gangue minerals include garnet, magnetite, pyrite and copper.
Sample VLE 2001–95a
The sample was derived from the upper meter of a modern river bar overlying bedrock, downstream of a steep, narrow channel. The gravels are variably rounded, sandy, and mainly in the pebble to cobble size-range. They are commonly iron-stained and poorly stratifi ed. River gravels in the area are typically one to two meters deep and locally overlain by fi ne sands and muds. Reported gangue minerals include magnetite, copper minerals, garnet, and chromite. Gold grains up to about 0.25 g and platinum grains to 0.1 g are reported.
APPENDIX: DESCRIPTIONS OF SAMPLE SITES OF THE PLACER CONCENTRATES