1604 icp brazil, regional - annual report 3,902 tc in services of soil, leaf and quality analysis; x...
TRANSCRIPT


1
Executive Summary Project Objective: Empowering small scale coffee farmers for global markets and climate change resilience in Minas Gerais, Brazil Main activities of project in past year
x The project is working in 8 municipalities of Minas: 4 in the Sul de Minas and 4 in Matas. x Project activities included training in four components: productivity and quality,
organizational strengthening, marketing & commercialization and climate change adaptation.
x Yields and production costs were monitored by use of the Farmer Field Book. x The project facilitated bulking of coffee and inputs. Also, the project organized a second
coffee quality competition with participation of international buyers. x Farmers are implementing climate change adaptation practices and the project is
systematizing experiences to make them available to the general public. x Experiences and learnt lessons of the ICP Project were used in design of S&D Coffee
and Tea Inc. financed project in Sul de Minas. Main achievements in 2016
x 73 farmer organizations established: 67 community groups, 5 associations and 1 cooperative – 2,948 farmers from 8 municipalities organized.
x 15,544 training contacts realized in 2015. x On average productivity increased by 27%. At the same time production costs increased
by 8% due the rise in the cost of labor and the appreciation of the dollar impacting the cost of inputs. Despite rising costs, gross margin increased by 20% due the positive yield effect compared to the previous crop.
x 1,164 tons of fertilizers purchased in bulk and 1,969 tons of coffee sold in bulk (crop 2014/15).
x 4 case studies on climate change adaptation experiences published, 2 info points established where experiences and learnings are shared. The project approach is replicated in Sul de Minas in a recent project with S&D Coffee & Tea Inc.
Main challenges encountered in 2015
x Climate change impacts on productivity and income of farmers. Although project farmers are by now better prepared, extreme weather events still affect coffee production.
x Organizations need to improve leadership to improve their operations and governance. Project needs to design and implement activities to support the professionalization of these groups.
Main lessons learnt so far
x Through bulk sales and purchases, farmers appreciate working jointly. This is, for example, evident through participation levels in meetings. Thus, the project will focus its activities on the professionalization of farmer organizations as an element of its exit strategy.
x The coffee quality competition is helping to promote the coffee produced by smallholders in international markets. Quality is appreciated and the demand is increasing year by year.

2
Content Executive Summary.......................................................................................................................... 1
Content ............................................................................................................................................. 2
High Level Progress & Project Outreach ......................................................................................... 3
Project Objective .......................................................................................................................... 3 Project Outreach .......................................................................................................................... 4
Progress on Specific Objectives ...................................................................................................... 6
Specific Objective I ....................................................................................................................... 6 Specific Objective II ...................................................................................................................... 8 Specific Objective III ................................................................................................................... 10 Specific Objective IV .................................................................................................................. 13 Specific Objective V ................................................................................................................... 16
Project Finance & Strategic Partners ............................................................................................. 18
Project Context ............................................................................................................................... 19
3
High Level Progress & Project Outreach Project Objective Empowering small scale coffee farmers for global markets and climate change resilience in Minas Gerais, Brazil
Indicator Season 13/14
Season 14/15 Progress Project
Target 1 Average1 Gross Margin per hectare
(in BRL / ha) 3,963 4,736 + 773 4,000
2 Average Unit Cost (BRL / lbs green) 2.05 2.22 + 0.17 2.00
3 Average productivity (60 kg bags gbe / ha) 22.5 28.5 + 5.99 30.00
4 Coffee production sold at higher value than the local market (60 Kg bags)
1,745 20,860 + 19,115 30,000
The gross margin per hectare in the crop season 2014/15 (4,736 BRL / ha) improved by 19.5% compared with the previous season (3,963 BRL). The difference was influenced by a positive effect of market price (+267 BRL) and yield (+2,748 BRL), even though production cost increased both per area and per unit of output. (-2,243 BRL / ha). The average unit cost increased by 0.17 BRL / lb in the crop season 2014/15 (2.22 BRL) compared to 2.05 BRL in 2013/14. Also, production costs increased from 6,111 BRL / hectare in 2013/2014 to 8,354 BRL / hectare. The drivers for this rise were an increase of the minimum wage from 724 BRL / month in 2014 to 788 BRL / month in 2015, and the appreciation of the Dollar (USD) against the Brazilian Real (BRL) impacting expenses on imported inputs, especially on fertilizer.
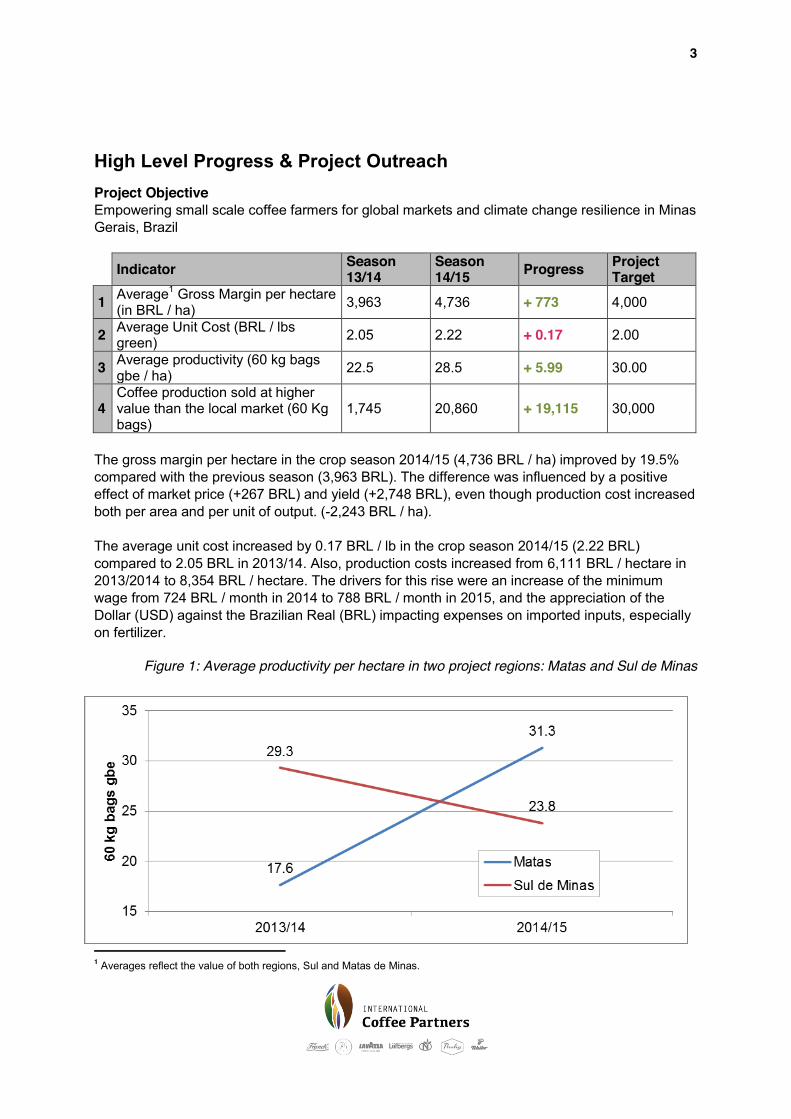
Figure 1: Average productivity per hectare in two project regions: Matas and Sul de Minas
1 Averages reflect the value of both regions, Sul and Matas de Minas.
4
The average productivity per hectare in the crop season 2014/15 (28.53 bags/ha) was 27% above that of crop season 2013/14 (22.54 bags/ha). The main reason for this increase was the high yield per hectare in 2014/15 in Matas region after a year of low yields in 2013/14 due to drought. Productivity in Sul de Minas decreased due to the biannuality of coffee. Supporting the commercialization of coffee into markets of higher value than the local market advanced significantly in the crop season of 2014/15 (20,850 bags) compared to the previous season of 2013/14 (1,745). The total value of the sales was 9,622,727 BRL. Farmers realized a 3.4% price increase compared to the reference price of Centro do Comercio de Café de Minas Gerais (CCCMG)2 and 4.6% compared to the quotations of local markets.
Project Outreach
Indicator 1.1.2015 31.12.2015 Progress Project Target
1 Total Beneficiaries 2,561 2,948 +387 2,000 2 Total Household Members 9,718 11,029 +1,311 6,500 3 Total Farmer Organizations 72 73 +00 40 4 Total of Impacted Farmland (ha) 16,522 19,058 +2,536 12,000 5 Area under Coffee (ha) 7,104 8,081 +977 6,000
Indicator Season 13/14
Season 14/15 Progress Project
Target 1 Coffee sold through farmer
organizations (60 kg bags gbe) 1,916 32,816 +30,900 50,000
2 Total production of project coffee (60 kg bags gbe) 150,938 239,408 +88,471 200,000
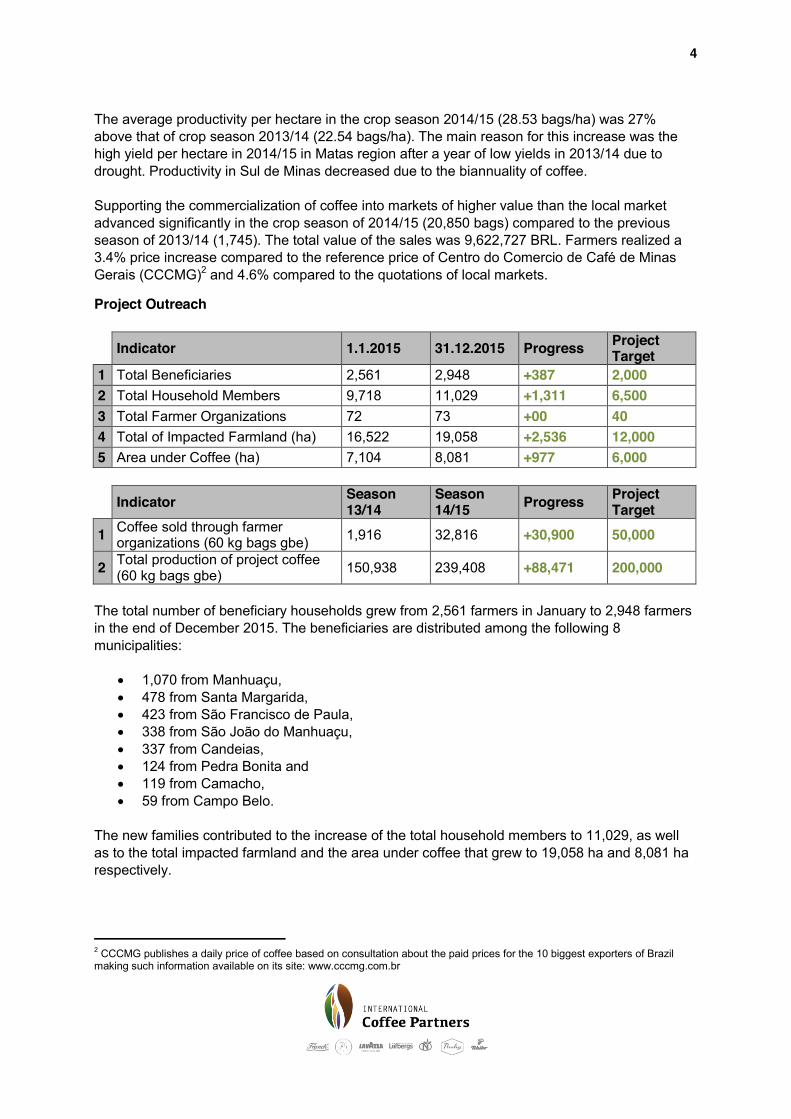
The total number of beneficiary households grew from 2,561 farmers in January to 2,948 farmers in the end of December 2015. The beneficiaries are distributed among the following 8 municipalities:
x 1,070 from Manhuaçu, x 478 from Santa Margarida, x 423 from São Francisco de Paula, x 338 from São João do Manhuaçu, x 337 from Candeias, x 124 from Pedra Bonita and x 119 from Camacho, x 59 from Campo Belo.
The new families contributed to the increase of the total household members to 11,029, as well as to the total impacted farmland and the area under coffee that grew to 19,058 ha and 8,081 ha respectively.
2 CCCMG publishes a daily price of coffee based on consultation about the paid prices for the 10 biggest exporters of Brazil making such information available on its site: www.cccmg.com.br

5
With the entry of the cooperative COORPOL from Manhuaçu, the total number of farmer organizations participating in the project increased to 73. Of those, 67 are community groups (informal group of farmers from one or more communities), 5 are farmer associations and one is the aforementioned cooperative. The project supported farmers and their organizations to improve their bulk marketing. From July to December of 2015, 32,816 bags of 60 kg were sold in bulk. In the Matas region, 35 farmer organizations sold 24,151 bags for 10,938,995 BRL and 19 farmer organizations from Sul de Minas sold 8,665 bags for 3,941,735 BRL. Although the volume of coffee sold so far in the crop season of 2014/15 through the farmer organization increased compared the crop season of 2013/14 (1,916 bags), the 32,816 bags represent just 14% of the total production of project coffee sold collectively. The total production of project coffee increased by 44% in the crop season of 2014/15 (239,408 bags) compared to the total production of the crop season of 2013/14 (150,938 bags). The increase is due to the rise in the number of project beneficiaries and consecutively an expansion of the coffee area included in the project by 977 hectares, The yield increased f from 23.5 bags to 28.5 bags per hectare.

6
Progress on Specific Objectives
Specific Objective I Improve productivity, efficiency, economic returns and environmental sustainability at farm level. Main activities of project on specific objective During the reporting period the following activities were realized:
x 6,391 training contacts (TC) in individual technical assistance; x 6,286 TC in training in good practices of crop management; x 3,902 TC in services of soil, leaf and quality analysis; x 1,840 TC in training in good coffee quality practices. x 997 TC in monitoring of farmer field book;
Main achievements
Indicator Season 13/14
Season 14/15 Progress Project
Target 1 Average productivity (60 kg bags
gbe / ha) 23.5 28.5 +6 25
2 Average Unit Cost (BRL / 60 kg bag) 271.10 292.10 +21,00 280
3 Coffee quality according to locally accepted coffee quality standards
57% fine; 29% good; 14% riado / rio flavor
58% fine; 26% good; 16% riado / rio flavor
+1% fine -0,3% good +0,2 riado / rio flavor
70% fine 20% good 10% riado flavor / rio flavor
Indicator 1.1.2014 31.12.2015 Progress Project Target
1 Farmers trained in Good Agricultural Practices (GAPs) on production, harvest and post-harvest
2,008 3,138 +1,130 2,800
Coffee yield per hectare in crop season 2014/15 (28.53 bags/ha) increased by 27% compared with crop season 2013/14 (22.54 bags/ha). Production cost increased in crop season 2014/15 as result of the increment of the minimum salary from 724 BRL in 2014 to 788 BRL in 2015 with impacts in the cost of labor, and the valuation of dollar (USD) from 2.28 BRL to 2.70 BRL per dollar with impact in the costs of imported inputs, especially on fertilizer. The quality profile of analyzed samples in crop season 2014/15 was not different to the previous crop season. Although the percentage of “fine cup” quality increased in 1%, “good cup” decreased in 3% and low quality “riado/rio favor” increased by 2%.

7
Figure 2: Quality results in project regions
Main challenges encountered The yield in crop season 2014/15 was affected by different climate anomalies. After a late start of the rains (November instead of September), coffee trees flowered late. Then, rainfall was below the historic average from December to February, a period which is important for the growth of the coffee bean. Finally, rainfall above the historic average came later in the months of March to May, delaying the start of the harvesting period. As a result, yields came in below potential. Also bean sizes of coffee were smaller in the end of the crop season. However, the crop in the season 2014/15 was less affected by drought than in the season 2013/14, not just in the project region, but also at country level. Main lessons learnt
x Information on productivity, production cost, quality and gross margin are increasingly appreciated by farmers. It is necessary to improve the access to this information on the level of farmer organizations as a strategy to build sustainable organizations.
x Climate threats are happening more frequently. Climate variability, exacerbated in an environment of climate change is the main factor responsible for the fluctuations of coffee production in Brazil.

8
Specific Objective II Organize farmers into farmer organizations and strengthen and improve the governance, management, and operations of those organizations. Main activities of project on specific objective During the reporting period the following activities were realized:
x 1,066 TC on the application of the organizational/business matrix; x 1,054 TC in meetings of farmer organizations topics; and x 18 TC in technical trips.
The organizational topics in the trainings were: access to markets of scale and design of business strategies for community groups (sales of coffee and inputs purchases); SWOT analyses, definition of objectives, components, activities and working plans; associations and cooperatives. Main achievements
Indicator Season 13/14
Season 14/15 Progress Project
Target
1
Community groups formed by the project rate a minimum of “C” according to the HRNS organizational/business matrix
0 “A” 0 “B” 3 “C” 55 “D”
0 “A” 0 “B”
17 “C” 44 “D”
0 “A” 0 “B”
+14 “C” -11 “D”
100% of CG are in phase 3
with high performance- at least
“B”
2 Farmers are active members of legally structured organizations 128 246 +118 1,000
3 Volume of fertilizer bought in bulk (metric tons) 2,484.5 1,164.2 -1,320.30 2,000
Indicator 1.1.2014 31.12.2015 Progress Project Target
1 Community groups (CG), farmer associations (FA) or cooperative (COOP) formed by the project (#)
72 community groups, and
farmer associations
67 community groups, 5
farmer associations
and 1 cooperative
+1 40
There are 73 farmer organizations in the project: 01 FA in Camacho, 04 CGs in Campo Belo, 12 CGs in Candeias, 23 CGs and 01 COOP in Manhuaçu, 05 CG in Pedra Bonita, 10 CGs in Santa Margarida, 05 CGs and 05 FAs in São Francisco de Paula, and 09 CGs in São João do Manhuaçu. Some of the community groups are established as legal organizations: farmer associations or cooperatives. 246 farmers belong to legally structured organizations. The organizational/business matrix has three stages of performance (phases). To advance to the next phase the group must complete at least 75% of the phase´s indicators. FOs in phase I are joint in a category “D”, FOs in phase II are joint in category “C”, FO in phase III are joint in

9
category “B” and FO in phase III with more than 75% of score are in category “A”. A level B organization is recognized as a sustainable organization. In 2014, 55 FOs (95%) were in category “D” and 3 FOs (5%) were in category “C”. In 2015, 44 FOs (72%) did classify in category “D” and 17 FOs (28%) in category “C”.
Figure 3: Results of the organizational/business matrix in 2015
In the beginning of the crop season 2015/16 (between August and September), 1,164.2 tons of fertilizer were purchased in bulk. 192 farmers from 28 organizations participated in the purchase with a total value of 1,473,114 BRL. The price was 6.6% lower compared to the regular price in the local market leading to total cost savings of 96,933 BRL. Main challenges encountered Collective sales of coffee increased due to the training and commercial assistances realized by project staff. However, the organizations must improve their governance and operational processes to gain confidence and participation of their members and increase their targets. With the engagement of the project’s Organizational Coordinator, it is envisaged to improve the support to the organizations and the formation of leadership to professionalize farmer groups. Main lessons learnt
x Through bulk sales and purchases, farmers increasingly appreciate to work together. This is, for example, evident in participation levels of farmer field school meetings. Now, the project will focus its organizational activities in the professionalization of farmer organizations as a core element of the exit strategy.
x Leadership of farmer groups is key to motivate the establishment and development of local organizations and to encourage the members to participate in the collective purchase of inputs and sales of coffee. However, leadership skills need to develop. The project is developing corresponding leadership training in the next operative year 2016.
Category "D" Category "C"
2014 20150
25
50
75
100
Per
cent
age
95%
5%
72%
28%
Category "D" Category "C"

10
Specific Objective III Improve commercial capacity of organizations and improve farmer market access and value addition. Main activities of project on specific objective During the reporting period, the following activities were realized:
x 714 TC on business topics. x 181 TC in field days about marketing and commercialization. x 88 TC in courses about the coffee market. x 79 TC for exchanging experiences about commercialization. x 19 TC in seminars.
The main topics in trainings were: farm certification (Fairtrade and Certifica Minas), aspects to be considered in the coffee commercialization, commercial planning of groups, adjustment of expectations with exporters, collective sales of coffee, and preparation of coffee for the Coffee Quality Competition. The Coordinator of Marketing and Commercialization supported the groups in preparing lots and executing sales. To achieve this, the field staff coordinated the interest of farmers, collected samples and sent them to the cupping room in Santo Antonio de Amparo. After that, the coordinator classified and tested the coffees and searched appropriate market options on which producers could decide upon the best offer. Based on the experience of the 1st Coffee Quality Competition, the second edition of the event was held fostering the exchange between guests (international importers/roasters) and farmer organizations. A virtual auction was realized to sell the winning coffees. The competition received 640 samples from all project regions, including Matas and Sul de Minas (ICP area). During the week of the competition, an international jury was made up of guests from Lavazza (Italy), InterAmercian Coffee (USA and Germany) and Löfberg (Sweden). Next to rewarding the winners, their coffees were promoted in the international market through cuppings in Germany, USA, Italy, United Kingdom and Russia. Finally, the lots were offered and sold by a virtual auction adding value to the smallholders’ coffees. Main achievements
Indicator Season 13/14
Season 14/15 Progress Project
Target
1
Farmer organizations or associations and/or small groups of farmers offering and/or commercializing coffee collectively (#)
11 60 +49 20
2 Farmers commercialize coffee collectively through community groups or associations (#)
24 514 +490 500
3 Farmers satisfy standards of a market-recognized certification initiative (#)
- - - 1,000
4 Farmers sell coffee into higher value markets (% of farmers) 1.2% 11.3% +10.1% 20%
5 Farmers trained on marketing and commercialization (#) 291 535 +244 1,500
11
60 of 73 farmer organizations sold their coffee collectively. Of them, 41 farmer organizations are from Matas and 19 from Sul de Minas. However, just 514 (363 from Matas and 151 from Sul de Minas) of 2,948 total farmer beneficiaries in the project joined this way of commercialization, so that the project has still to undertake substantial work to sensitize and support farmers in selling their coffee jointly through their organizations. In crop the season 2014/15 (commercial season still going on), 32,816 bags of 60 Kg were sold for 14,880,730 BRL. Of these sales, 24,151 bags of 60 kg were from Matas region sold for 10,938,995 BRL and 8,665 bags of 60 kg were from Sul de Minas sold for 3,941,735 BRL. Sul de Minas Marketing Channel Coffee
Volume handled Price
bags % of total farmer price (BRL / bag) % mark-up Total Value
Addition (BRL) Coffee at farmgate 36,075 80.6 450.4 Collective sales 8,665 19.4 464,0 3% 129,431 BRL
Matas of Minas Marketing Channel Coffee
Volume handled Price
bags % of total farmer price (BRL / bag) % mark-up Total Value
Addition Coffee at farmgate 170,517 87,59 436.6 Collective sales 24,151 12.41 451.6 3.4% 355,698 BRL
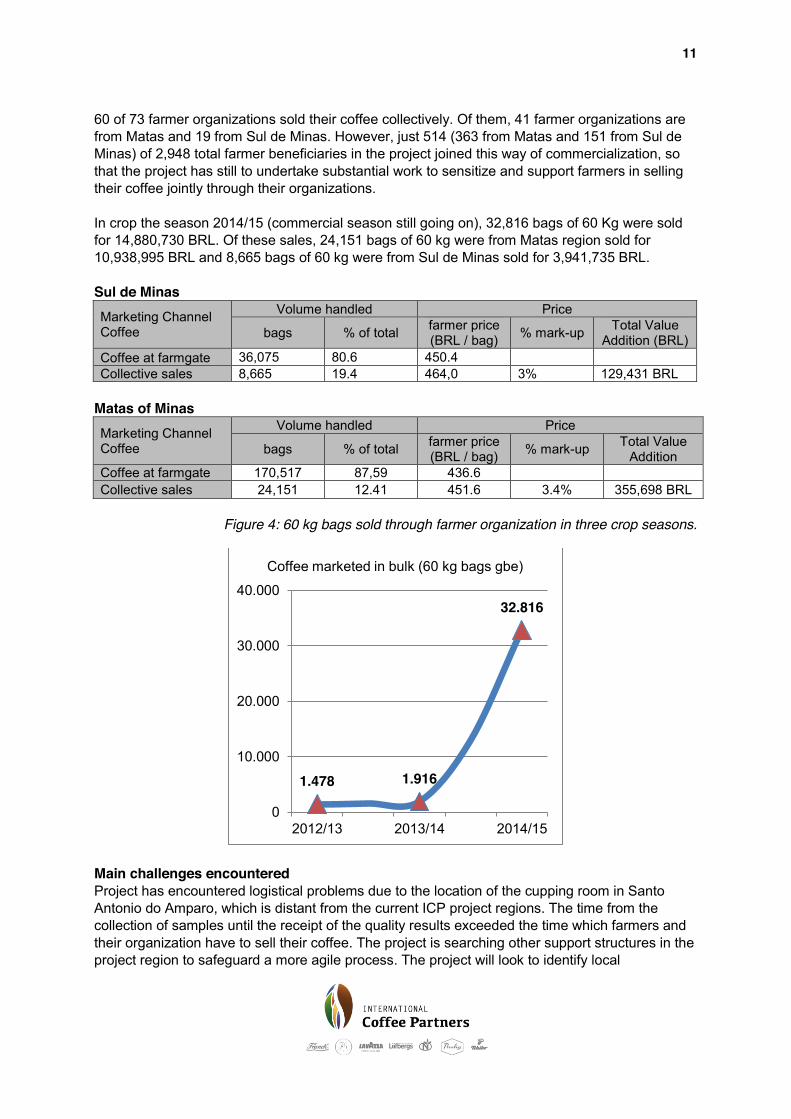
Figure 4: 60 kg bags sold through farmer organization in three crop seasons.
Main challenges encountered Project has encountered logistical problems due to the location of the cupping room in Santo Antonio do Amparo, which is distant from the current ICP project regions. The time from the collection of samples until the receipt of the quality results exceeded the time which farmers and their organization have to sell their coffee. The project is searching other support structures in the project region to safeguard a more agile process. The project will look to identify local
1.478 1.916
32.816
0
10.000
20.000
30.000
40.000
2012/13 2013/14 2014/15
Coffee marketed in bulk (60 kg bags gbe)

12
organizations for service delivery which should be able to continue the work once the project will be finalized. Main lessons learnt
x The results of commercialization, including the aggregation of value and the relationship with exporters, importers and roaster were key factors to motivate further growth of the collective sales of coffee in all the project regions.
x The Coffee Quality Competition is helping to promote the coffee produced by smallholders and supports its recognition in the international market. The quality is appreciated and demand increases every year.
13
Specific Objective IV Improve the capacity of farmers to adapt their livelihoods and production systems to climate change. Main activities of project on specific objective During the reporting period the following activities were realized:
x 481 TC in field days about adaptation practices to climate change and payment for environmental services.
x 338 TC in accompanying adaptation practices implemented in coffee farms. x 198 TC in technical assistance on setting up adaptation practices in coffee farms. x 172 TC in other topics regarding adaptation to climate change.
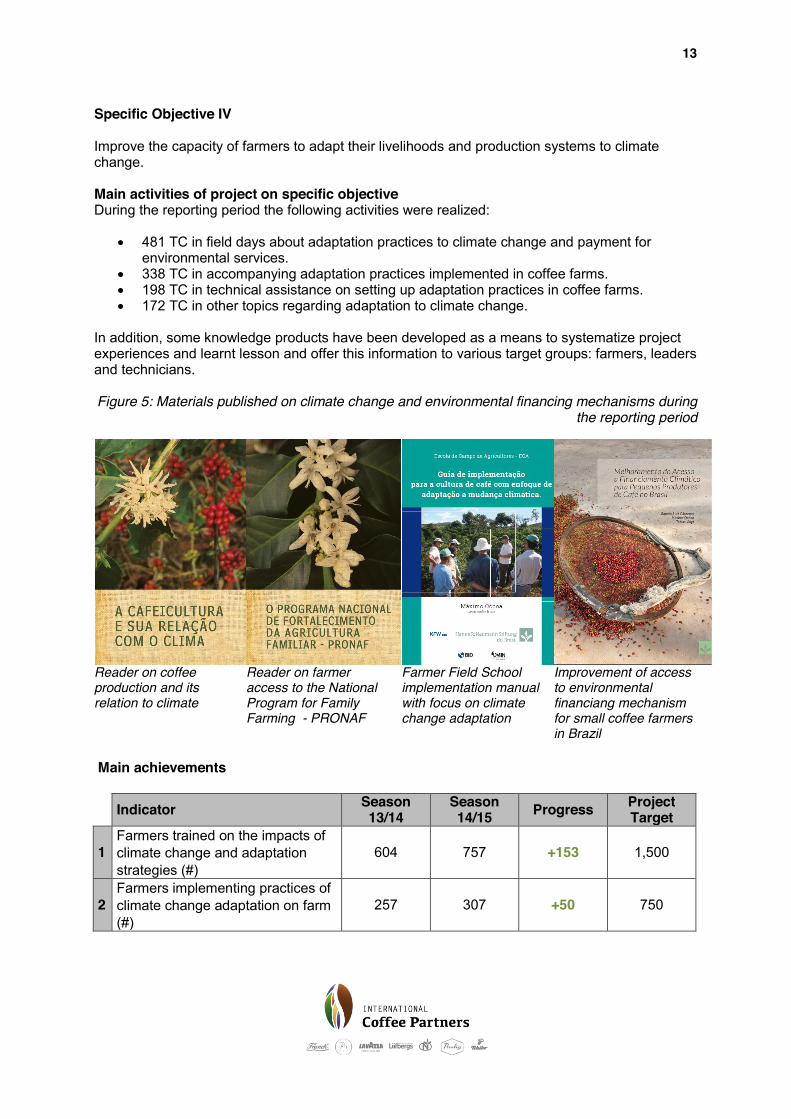
In addition, some knowledge products have been developed as a means to systematize project experiences and learnt lesson and offer this information to various target groups: farmers, leaders and technicians. Figure 5: Materials published on climate change and environmental financing mechanisms during
the reporting period
Reader on coffee production and its relation to climate
Reader on farmer access to the National Program for Family Farming - PRONAF
Farmer Field School implementation manual with focus on climate change adaptation
Improvement of access to environmental financiang mechanism for small coffee farmers in Brazil
Main achievements
Indicator Season 13/14
Season 14/15 Progress Project
Target
1 Farmers trained on the impacts of climate change and adaptation strategies (#)
604 757 +153 1,500
2 Farmers implementing practices of climate change adaptation on farm (#)
257 307 +50 750
14
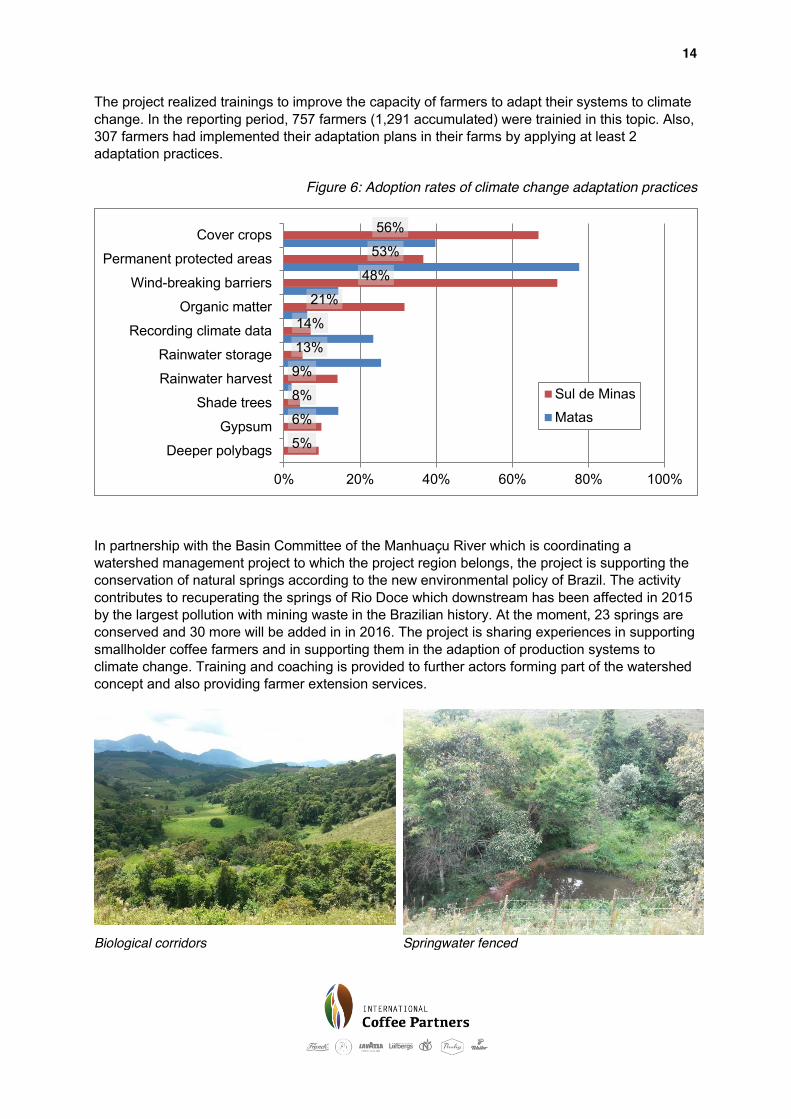
The project realized trainings to improve the capacity of farmers to adapt their systems to climate change. In the reporting period, 757 farmers (1,291 accumulated) were trainied in this topic. Also, 307 farmers had implemented their adaptation plans in their farms by applying at least 2 adaptation practices.
Figure 6: Adoption rates of climate change adaptation practices
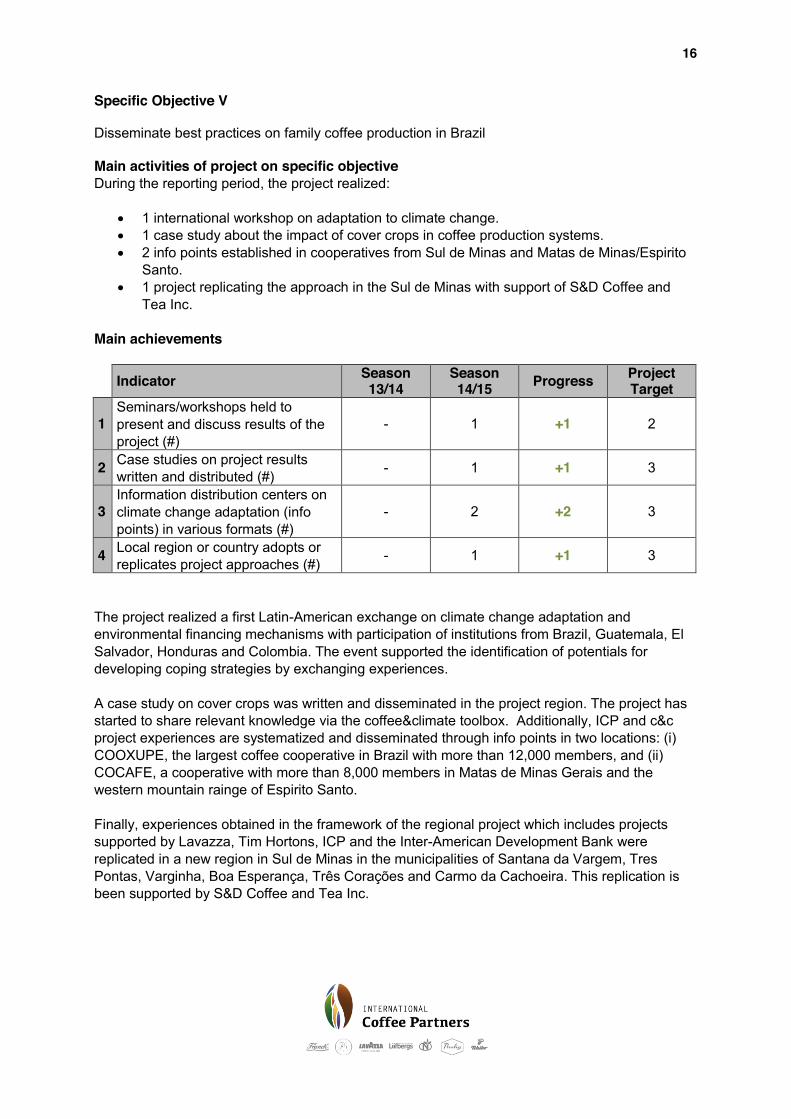
In partnership with the Basin Committee of the Manhuaçu River which is coordinating a watershed management project to which the project region belongs, the project is supporting the conservation of natural springs according to the new environmental policy of Brazil. The activity contributes to recuperating the springs of Rio Doce which downstream has been affected in 2015 by the largest pollution with mining waste in the Brazilian history. At the moment, 23 springs are conserved and 30 more will be added in in 2016. The project is sharing experiences in supporting smallholder coffee farmers and in supporting them in the adaption of production systems to climate change. Training and coaching is provided to further actors forming part of the watershed concept and also providing farmer extension services.
Biological corridors Springwater fenced
5%
6%
8%
9%
13%
14%
21%
48%
53%
56%
0% 20% 40% 60% 80% 100%
Deeper polybags
Gypsum
Shade trees
Rainwater harvest
Rainwater storage
Recording climate data
Organic matter
Wind-breaking barriers
Permanent protected areas
Cover crops
Sul de Minas
Matas

15
Main challenges encountered Farmers are sensitized about climate threats and are increasingly interested to use the recommended adaptation practices. The project strives to enhance farmer access to inputs. For example, the project together with EPAMIG established nurseries to produce seedlings in deeper polybags and train the producer of seedlings on this technology. The same applies to seeds of cover crops and seedlings of native tree species. Main lessons learnt
x Farmers are willing to integrate adaptation practices into their production system. However, the project does not only need to concentrate on matters inside the farm. The project also needs to get on board suppliers of inputs and technologies such as seeds, seedlings, organic matter, technical assistance and others.
x Experiences and learnt lesson must be systematized to transform them into public goods - for example in the form of manuals or case studies – so that project experiences can more easily be replicated. The documents published in the reporting period and the demand from farmers, technicians and stakeholders encourage the project to continue sharing its experiences.
16
Specific Objective V Disseminate best practices on family coffee production in Brazil Main activities of project on specific objective During the reporting period, the project realized:
x 1 international workshop on adaptation to climate change. x 1 case study about the impact of cover crops in coffee production systems. x 2 info points established in cooperatives from Sul de Minas and Matas de Minas/Espirito
Santo. x 1 project replicating the approach in the Sul de Minas with support of S&D Coffee and
Tea Inc. Main achievements
Indicator Season 13/14
Season 14/15 Progress Project
Target
1 Seminars/workshops held to present and discuss results of the project (#)
- 1 +1 2
2 Case studies on project results written and distributed (#) - 1 +1 3
3 Information distribution centers on climate change adaptation (info points) in various formats (#)
- 2 +2 3
4 Local region or country adopts or replicates project approaches (#) - 1 +1 3
The project realized a first Latin-American exchange on climate change adaptation and environmental financing mechanisms with participation of institutions from Brazil, Guatemala, El Salvador, Honduras and Colombia. The event supported the identification of potentials for developing coping strategies by exchanging experiences. A case study on cover crops was written and disseminated in the project region. The project has started to share relevant knowledge via the coffee&climate toolbox. Additionally, ICP and c&c project experiences are systematized and disseminated through info points in two locations: (i) COOXUPE, the largest coffee cooperative in Brazil with more than 12,000 members, and (ii) COCAFE, a cooperative with more than 8,000 members in Matas de Minas Gerais and the western mountain rainge of Espirito Santo. Finally, experiences obtained in the framework of the regional project which includes projects supported by Lavazza, Tim Hortons, ICP and the Inter-American Development Bank were replicated in a new region in Sul de Minas in the municipalities of Santana da Vargem, Tres Pontas, Varginha, Boa Esperança, Três Corações and Carmo da Cachoeira. This replication is been supported by S&D Coffee and Tea Inc.
17
Main challenges encountered The project did not yet create a communication plan which identifies core topics, experiences and related target groups. Also, the project still needs to assemble suitable formats/templates to share the messages identified in the plan in the best way. In the beginning of the next year, project hopes to establish the plan, strategies and formats/templates. Main lessons learnt
x Farmers, technicians and stakeholders are interested and open to sharing information amongst their members. Also, stakeholders are supportive to the project by applying different validation plots, field days and other formats.
x Strategies, methods and techniques of the project can be applied in different contexts and regions. In the next period, the project envisages to assist stakeholders interested in the adaptation of these elements in other coffee producing states of the country.

18
Project Finance & Strategic Partners Financial contributions to the project Private
Partners Public
Partners NGO /
Foundation ICP 800,000.00 Multilateral Investment Fund of the Inter-American Development Bank 598,516.91
Fundação Banco do Brasil 36,360.09 % Share 55% 42% 3% Total Contributions 1,434,877 International Coffee Partners is the responsible for 55% of project financing, the Multilateral Investment Fund of Inter-American Development Bank contributes with 42 % and Fundação Banco do Brasil with 3%. The total value of the project is €1,434,877 for 4 years. The funds of Fundação Banco do Brasil were only considered for the first year of implementation as the corresponding project finished in January 2014.
19
Project Context Brazil is the world’s largest coffee producing country, accounting for over 35% of global coffee production in 2011. Large- and medium-scale producers in Brazil have well developed and technically advanced production systems achieving high yields. They are estimated to account for 62% of total production. The country’s small-scale family farmers (called agricultores familiares), despite constituting over 75% of all Brazilian coffee producers, only produce 38% of the country’s coffee due basic, low-technology, and under-performing production systems. 50% of Brazil’s coffee comes from Minas Gerais, a state with a large population of small-scale family farmers and communities that depend heavily on coffee production. In 2005, 74% of the income from agricultural activities in Minas Gerais resulted from coffee sales. Unlike shade-grown coffee plantations in other areas of Latin America where coffee trees are planted at least under minimal forest cover, coffee in most parts of Brazil – and especially in Minas Gerais – is grown in an intensive, high-input, full-sun production system which, if not properly managed, can result in accelerated land degradation and soil fertility decline. The ICP intervention is part of the Regional Project “Empowering small scale coffee farmers for global markets and climate change resilience in Minas Gerais, Brazil” which involves 18 municipalities from the regions Sul and Matas de Minas, in the most important coffee producing state of Brazil. The project is financed by the Multilateral Investment Fund (MIF) of the Inter-American Development Bank (IDB), International Coffee Partners (ICP), Fondazione Giuseppe and Pericle Lavazza Onlus, and Tim Hortons. The ICP project benefits 44% of the municipalities and 45% of farmers participating in the project. Also, the project counts with contributions of Fundação Banco do Brasil, and public institutions focusing to support socio-economic aspects. Other interventions of the regional project are
x located in the municipality of Lambari, where funds of MIF-IDB together with Fondazione Giuseppe and Pericle Lavazza Onlus provide support to 16% of the municipalities while
x the other 40% of municipalities is supported by MIF-IDB together with Tim Hortons. At that moment, Hanns R. Neumann Stiftung do Brasil (AHRNSB) has established regional offices in: (i) Lavras (headquarters) and in (ii) Nepomuceno, (iii) Sao Francisco de Paula, (iv) Lambari, (v) Santa Margarida, and (vi) Manhuacu (field offices). Public and private stakeholders complement the actions through partnership agreements which have been established with Empresa de Assistência Técnica e Extensão Rural de Minas Gerais (EMATER), Empresa de Pesquisa Agropecuaria de Minas Gerais (EPAMIG), Serviço Nacional de Aprendizagem Rural (SENAR), and the 18 municipalities where the project is working. Furthermore, the municipality of São Francisco de Paula is one of the locations where Hanns R. Neumann Stiftung do Brasil is implementing a pilot of the initiative on coffee & climate, a supra regional Development Partnership with a focus on adapting coffee production to climate change. Partners of the initiative are: Tchibo GmbH, Gustav Paulig Ltd., Fondazione Giuseppe e Pericle Lavazza Onlus, Löfbergs Lila AB, Neumann Gruppe GmbH, Joh. Johannson AS, Ecom Coffee, Franck d.d., Tim Hortons, Starbucks, the Deutsche Gesellschaft für Internationale Zusammenarbeit (GIZ), the Swedish International Development Cooperation Agency (Sida) and the Sustainable Coffee Partnership including Nestlé, Jacobs Douwe Egberts and IDH. Additonally, Hanns R. Neumann Stiftung do Brasil implements the project “Climate resilience, farmer empowerment, and sustainable coffee production in Sul de Minas, Brazil“ which is supported for S&D Coffee and Tea Inc. targeting 300 farmers in a new region neighboring current project areas.
Annex 1: ICP KPI Reporting Sheet
Project
Location
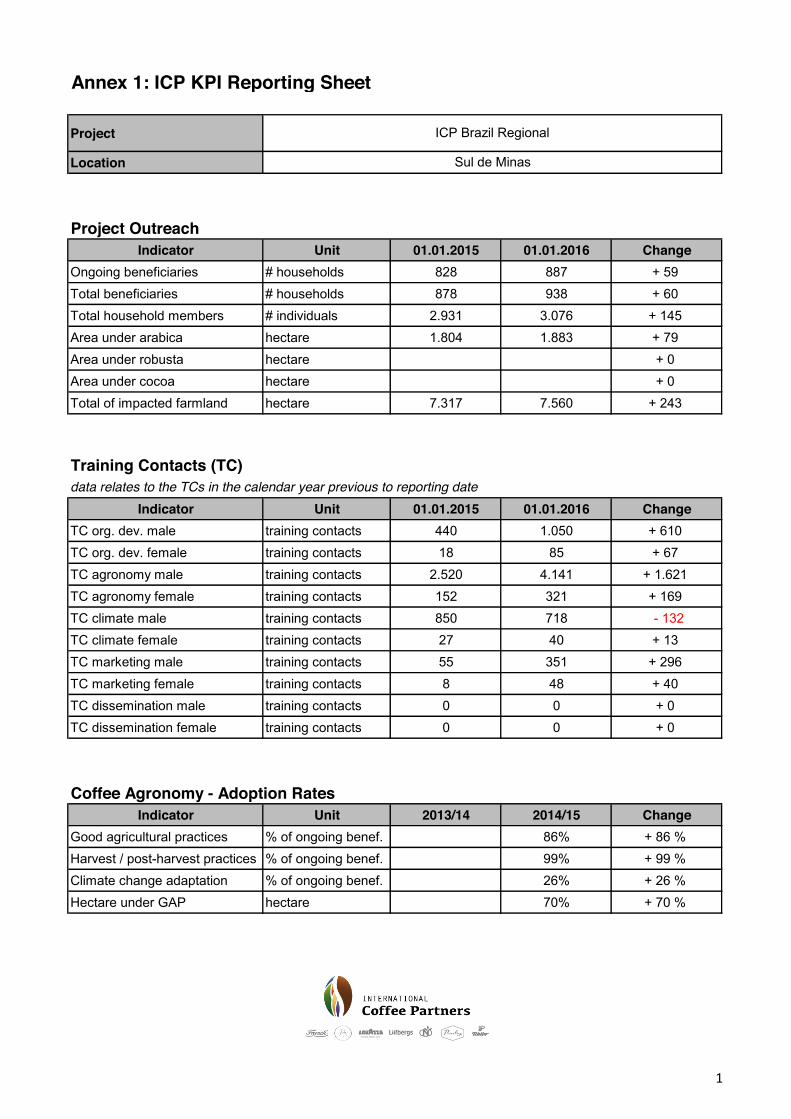
Project Outreach Indicator Unit 01.01.2015 01.01.2016 Change
Ongoing beneficiaries # households 828 887 + 59 Total beneficiaries # households 878 938 + 60 Total household members # individuals 2.931 3.076 + 145 Area under arabica hectare 1.804 1.883 + 79 Area under robusta hectare + 0 Area under cocoa hectare + 0 Total of impacted farmland hectare 7.317 7.560 + 243
Training Contacts (TC) data relates to the TCs in the calendar year previous to reporting date
Indicator Unit 01.01.2015 01.01.2016 ChangeTC org. dev. male training contacts 440 1.050 + 610 TC org. dev. female training contacts 18 85 + 67 TC agronomy male training contacts 2.520 4.141 + 1.621 TC agronomy female training contacts 152 321 + 169 TC climate male training contacts 850 718 - 132TC climate female training contacts 27 40 + 13 TC marketing male training contacts 55 351 + 296 TC marketing female training contacts 8 48 + 40 TC dissemination male training contacts 0 0 + 0 TC dissemination female training contacts 0 0 + 0
Coffee Agronomy - Adoption RatesIndicator Unit 2013/14 2014/15 Change
Good agricultural practices % of ongoing benef. 86% + 86 % Harvest / post-harvest practices % of ongoing benef. 99% + 99 % Climate change adaptation % of ongoing benef. 26% + 26 % Hectare under GAP hectare 70% + 70 %
Sul de Minas
ICP Brazil Regional
1

Total Production and Bulking of target cropIndicator Unit 2013/14 2014/15 Change
Arabica: total production 60 kg bags gbe 52.887 44.740 - 8.147Arabica: sold via FOs. 60 kg bags gbe 576 8.665 + 8.089 Robusta: total production metric tons faq + 0 Robusta: sold via FOs. metric tons faq + 0 Cocoa: total production metric tons faq + 0 Cocoa: sold via FOs. metric tons faq + 0
Farmer Organizations - First Tier organizations by sustainability statusIndicator Unit 01.01.2015 01.01.2016 Change
Exceptional (A) # organizations + 0 Sustainable (B) # organizations + 0 Transition phase (C ) # organizations 1 6 + 5 Inception phase (D) # organizations 21 16 - 5Dysfunctional # organizations + 0 TOTAL # organizations 22 22 + 0
Farmer Organizations - Second Tier organizations by sustainability statusIndicator Unit 01.01.2015 01.01.2016 Change
Exceptional (A) # organizations + 0 Sustainable (B) # organizations + 0 Transition phase (C ) # organizations + 0 Inception phase (D) # organizations + 0 Dysfunctional # organizations + 0 TOTAL # organizations 0 0 + 0
Farmer Organizations - Third Tier organizations by sustainability statusIndicator Unit 01.01.2015 01.01.2016 Change
Exceptional (A) # organizations + 0 Sustainable (B) # organizations + 0 Transition phase (C ) # organizations + 0 Inception phase (D) # organizations + 0 Dysfunctional # organizations + 0 TOTAL # organizations + 0
2

Farmer Organizations - Value Addition Total value added directly by farmer organizations to beneficiaries
Indicator Unit 2013/14 2014/15 ChangeBulk marketing BRL 14.160 129.431 + 115.271 Input bulking BRL 14.933 18.811 + 3.878 Access to finance BRL + 0 TOTAL BRL 29.093 148.242 + 119.149
Profitability - Arabica All values in the below table are on per hectare basis Indicator Unit 2013/14 2014/15 Change
Yield 60 kg bags gbe 29,3 23,8 - 5,6Planting Density produc. trees / ha 3.508 3.507 - 1Variable Production Costs BRL 7.585 8.496 + 910 Cost reduction through value addition BRL 8 10 + 2
Avg. farm gate price BRL / 60kg gbe 424 450 + 26 Avg. Price via FO BRL / 60kg gbe 454 464 + 10 Share sold via FO % total production 1% 19% + 18 %
Profitability - Robusta All values in the below table are on per hectare basis Indicator Unit 2013/14 2014/15 Change
Yield metric tons + 0,0 Planting density produc. trees / ha + 0 Variable production costs BRL + 0 Cost reduction through value addition BRL + 0
Avg. farm gate price BRL / mt + 0 Avg. price via FO BRL / mt + 0 Share sold via FO % total production + 0 %
Profitability - Cocoa All values in the below table are on per hectare basis Indicator Unit 2013/14 2014/15 Change
Yield ton dried cocoa + 0,0 Planting density produc. trees / ha + 0 Variable production costs BRL + 0 Cost reduction through value addition BRL + 0
Avg. farm gate price BRL / ton dried cocoa + 0
Avg. price via FO BRL / ton dried cocoa + 0
Share sold via FO % total production + 0 %
3

Gross Margin CalculationIndicator Unit 2013/14 2014/15 Change
Arabica / ha BRL / ha 4.856 2.268 - 2.588Arabica / lbs green BRL / lbs gbe 1,25 0,72 - 0,53Arabica / tree BRL / prod tree 1,38 0,65 - 1Robusta / ha BRL / ha 0 0 + 0 Robusta / metric ton BRL / mt 0 0 + 0 Robusta / tree BRL/ prod tree 0 0 + 0 Cocoa / ha BRL / ha 0 0 + 0 Cocoa / ton dried cocoa BRL / ton dry 0 0 + 0 Cocoa / tree BRL / prod tree 0 0 + 0
4
Annex 2: ICP KPI Reporting Sheet
Project
Location
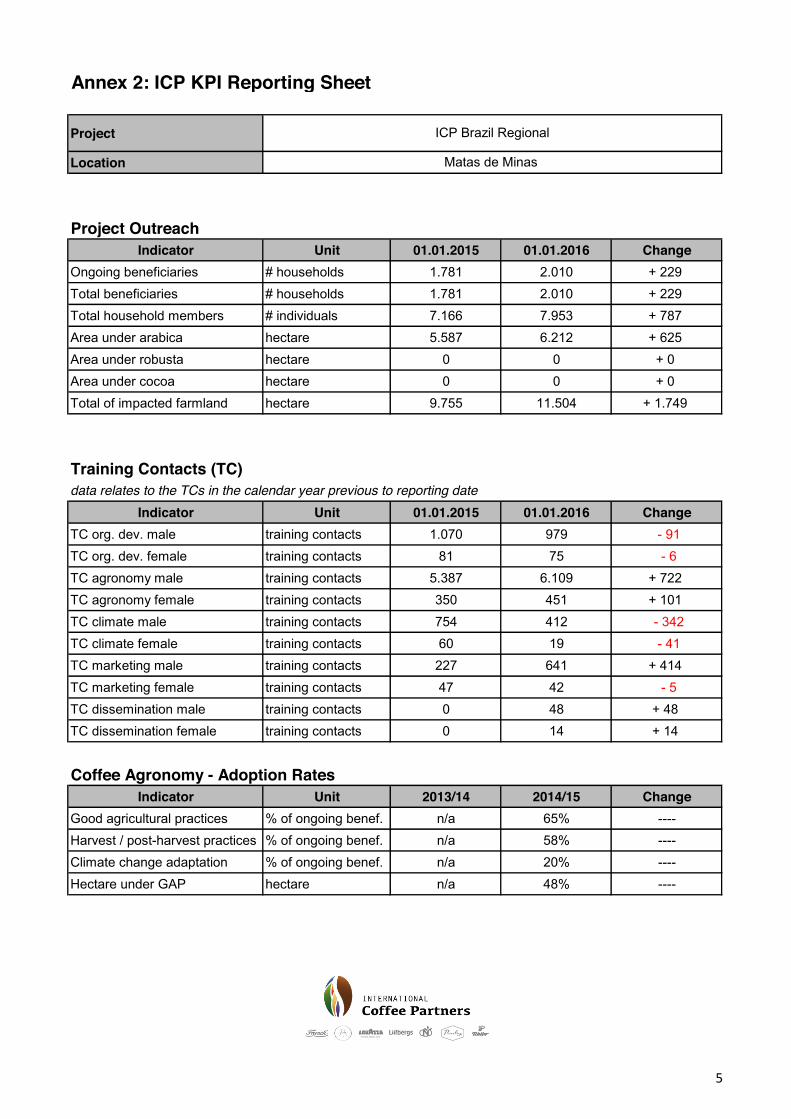
Project Outreach Indicator Unit 01.01.2015 01.01.2016 Change
Ongoing beneficiaries # households 1.781 2.010 + 229 Total beneficiaries # households 1.781 2.010 + 229 Total household members # individuals 7.166 7.953 + 787 Area under arabica hectare 5.587 6.212 + 625 Area under robusta hectare 0 0 + 0 Area under cocoa hectare 0 0 + 0 Total of impacted farmland hectare 9.755 11.504 + 1.749
Training Contacts (TC) data relates to the TCs in the calendar year previous to reporting date
Indicator Unit 01.01.2015 01.01.2016 ChangeTC org. dev. male training contacts 1.070 979 - 91TC org. dev. female training contacts 81 75 - 6TC agronomy male training contacts 5.387 6.109 + 722 TC agronomy female training contacts 350 451 + 101 TC climate male training contacts 754 412 - 342TC climate female training contacts 60 19 - 41TC marketing male training contacts 227 641 + 414 TC marketing female training contacts 47 42 - 5TC dissemination male training contacts 0 48 + 48 TC dissemination female training contacts 0 14 + 14
Coffee Agronomy - Adoption RatesIndicator Unit 2013/14 2014/15 Change
Good agricultural practices % of ongoing benef. n/a 65% ----Harvest / post-harvest practices % of ongoing benef. n/a 58% ----Climate change adaptation % of ongoing benef. n/a 20% ----Hectare under GAP hectare n/a 48% ----
ICP Brazil Regional
Matas de Minas
5

Total Production and Bulking of target cropIndicator Unit 2013/14 2014/15 Change
Arabica: total production 60 kg bags gbe 98.050 194.668 + 96.618 Arabica: sold via FOs. 60 kg bags gbe 1.340 24.151 + 22.811 Robusta: total production metric tons faq 0 0 + 0 Robusta: sold via FOs. metric tons faq 0 0 + 0 Cocoa: total production metric tons faq 0 0 + 0 Cocoa: sold via FOs. metric tons faq 0 0 + 0
Farmer Organizations - First Tier organizations by sustainability statusIndicator Unit 01.01.2015 01.01.2016 Change
Exceptional (A) # organizations 0 0 + 0 Sustainable (B) # organizations 0 0 + 0 Transition phase (C ) # organizations 2 11 + 9 Inception phase (D) # organizations 34 28 - 6Dysfunctional # organizations 0 0 + 0 TOTAL # organizations 36 39 + 3
Farmer Organizations - Second Tier organizations by sustainability statusIndicator Unit 01.01.2015 01.01.2016 Change
Exceptional (A) # organizations 0 0 + 0 Sustainable (B) # organizations 0 0 + 0 Transition phase (C ) # organizations 0 0 + 0 Inception phase (D) # organizations 0 0 + 0 Dysfunctional # organizations 0 0 + 0 TOTAL # organizations 0 0 + 0
Farmer Organizations - Third Tier organizations by sustainability statusIndicator Unit 01.01.2015 01.01.2016 Change
Exceptional (A) # organizations + 0 Sustainable (B) # organizations + 0 Transition phase (C ) # organizations + 0 Inception phase (D) # organizations + 0 Dysfunctional # organizations + 0 TOTAL # organizations + 0
6

Farmer Organizations - Value Addition Total value added directly by farmer organizations to beneficiaries
Indicator Unit 2013/14 2014/15 ChangeBulk marketing BRL 27.566 355.698 + 328.132 Input bulking BRL 320.509 78.122 - 242.387Access to finance BRL 0 0 + 0 TOTAL BRL 348.075 433.820 + 85.745
Profitability - Arabica All values in the below table are on per hectare basis Indicator Unit 2013/14 2014/15 Change
Yield 60 kg bags gbe 17,6 31,3 + 13,8 Planting Density produc. trees / ha 3.551 3.573 + 22 Variable Production Costs BRL 4.937 7.982 + 3.045 Cost reduction through value addition BRL 57 13 - 45
Avg. farm gate price BRL / 60kg gbe 424 437 + 13 Avg. Price via FO BRL / 60kg gbe 447 452 + 5 Share sold via FO % total production 1% 12% + 11 %
Profitability - Robusta All values in the below table are on per hectare basis Indicator Unit 2013/14 2014/15 Change
Yield metric tons + 0,0 Planting density produc. trees / ha + 0 Variable production costs BRL + 0 Cost reduction through value addition BRL + 0
Avg. farm gate price BRL / mt + 0 Avg. price via FO BRL / mt + 0 Share sold via FO % total production + 0 %
Profitability - Cocoa All values in the below table are on per hectare basis Indicator Unit 2013/14 2014/15 Change
Yield ton dried cocoa + 0,0 Planting density produc. trees / ha + 0 Variable production costs BRL + 0 Cost reduction through value addition BRL + 0
Avg. farm gate price BRL / ton dried cocoa + 0
Avg. price via FO BRL / ton dried cocoa + 0
Share sold via FO % total production + 0 %
7

Gross Margin CalculationIndicator Unit 2013/14 2014/15 Change
Arabica / ha BRL / ha 2.510 5.758 + 3.248 Arabica / lbs green BRL / lbs gbe 1,08 1,39 + 0,31 Arabica / tree BRL / prod tree 0,71 1,61 + 1 Robusta / ha BRL / ha 0 0 + 0 Robusta / metric ton BRL / mt 0 0 + 0 Robusta / tree BRL/ prod tree 0 0 + 0 Cocoa / ha BRL / ha 0 0 + 0 Cocoa / ton dried cocoa BRL / ton dry 0 0 + 0 Cocoa / tree BRL / prod tree 0 0 + 0
8
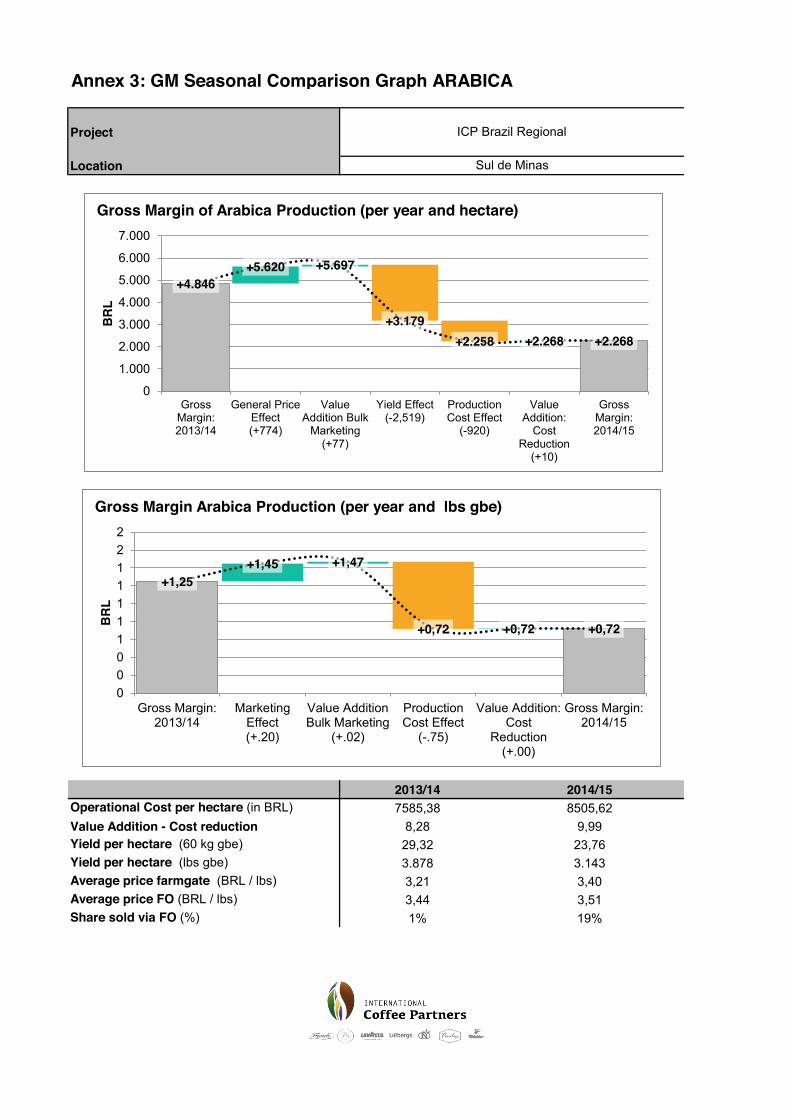
Annex 3: GM Seasonal Comparison Graph ARABICA
Project
Location
2013/14 2014/15Operational Cost per hectare (in BRL) 7585,38 8505,62Value Addition - Cost reduction 8,28 9,99Yield per hectare (60 kg gbe) 29,32 23,76Yield per hectare (lbs gbe) 3.878 3.143Average price farmgate (BRL / lbs) 3,21 3,40Average price FO (BRL / lbs) 3,44 3,51Share sold via FO (%) 1% 19%
Sul de Minas
ICP Brazil Regional
+4.846 +5.620 +5.697
+3.179 +2.258 +2.268 +2.268
0
1.000
2.000
3.000
4.000
5.000
6.000
7.000
GrossMargin:2013/14
General PriceEffect(+774)
ValueAddition Bulk
Marketing(+77)
Yield Effect(-2,519)
ProductionCost Effect
(-920)
ValueAddition:
CostReduction
(+10)
GrossMargin:2014/15
BR
L
Gross Margin of Arabica Production (per year and hectare)
+1,25 +1,45 +1,47
+0,72 +0,72 +0,72
0001111122
Gross Margin:2013/14
MarketingEffect(+.20)
Value AdditionBulk Marketing
(+.02)
ProductionCost Effect
(-.75)
Value Addition:Cost
Reduction(+.00)
Gross Margin:2014/15
BR
L
Gross Margin Arabica Production (per year and lbs gbe)

Annex 3: GM Seasonal Comparison Graph ARABICA
Project
Location
2013/14 2014/15Operational Cost per hectare (in BRL) 4936,64 7994,56Value Addition - Cost reduction 57,37 12,58Yield per hectare (60 kg gbe) 17,55 31,34Yield per hectare (lbs gbe) 2.321 4.146Average price farmgate (BRL / lbs) 3,21 3,30Average price FO (BRL / lbs) 3,38 3,41Share sold via FO (%) 1% 12%
Matas de Minas
ICP Brazil Regional
+2.505 +2.725 +2.757
+8.803
+5.745 +5.758 +5.758
01.0002.0003.0004.0005.0006.0007.0008.0009.000
10.000
GrossMargin:2013/14
GeneralPrice Effect
(+220)
ValueAddition Bulk
Marketing(+33)
Yield Effect(+6,046)
ProductionCost Effect
(-3,058)
ValueAddition:
CostReduction
(+13)
GrossMargin:2014/15
BR
L
Gross Margin of Arabica Production (per year and hectare)
+1,08 +1,17 +1,19
+1,39 +1,39 +1,39
000111112
Gross Margin:2013/14
MarketingEffect(+.09)
Value AdditionBulk Marketing
(+.01)
ProductionCost Effect
(+.20)
Value Addition:Cost
Reduction(+.00)
Gross Margin:2014/15
BR
L
Gross Margin Arabica Production (per year and lbs gbe)