16. xbrl cookbook: examples of using xbrl -...
TRANSCRIPT

FINANCIAL REPORTING USING XBRL – IFRS AND US GAAP EDITION (2006-03-01)
© 2006 UBmatrix, Inc 441
16. XBRL Cookbook: Examples of Using XBRL
This section provides somewhat of a "cookbook" which can be followed to create various types of XBRL instance documents. This is where we really get out hands dirty with real financial statements.
We assume that readers, at this point, have an understanding of the basics and an exposure to everything we have covered this far. Here, we will expand your understanding and further consolidate the "pieces" of understanding into overall understanding.
We will do this by starting easy and adding more and more, exposing the reader to the real life issues of expressing financial information using XBRL. We will point out specific areas where you will likely have questions (or should have questions) and point out options you have available.
In the end, we will also provide you with a complete set of financial statements in XBRL. This can act somewhat of a "template" to help you get started expressing your own financial statements using XBRL. See the files section for this chapter for this sample financial expressed in XBRL.
We will cover, the following:
• Financial Highlights – an easy way to get started using XBRL.
• Balance Sheet – which is fairly straight forward
• Income Statement – which is likewise straight forward
• Cash Flow Statement – again, relatively straight forward
• Statement of Changes in Equity – getting a little more complicated due to the size and because you have a "movement analysis" which is a little more difficult to get your mind around and validation involves more steps.
• Accounting Policies – we start dealing with textual type information, expressing that in XBRL.
• Explanatory Disclosures – the most complicated area due to the diversity of information which needs to be expressed and the sheer volume of information. But, we will cover most of the types of explanatory disclosures such as:
o Movement in Property, Plant and Equipment (movement analysis)
o Property, Plant and Equipment Pledged as Security (simple tuple)
o Ordinary share information (complex tuple)
o Segment information (dimensions)
o Share option scheme (complex tuple, tuple in a tuple, movement in tuples)
This section actually exposes you to nothing new, everything has been covered in one of the previous sections; but it does consolidate many things together and introduces real world issues. Again, it is important that you have worked through the other areas of this material, if you start here, this could be more complex to you.
We will use the IFRS-GP taxonomy for this exercise. The reason is that the existing IFRS-GP taxonomy has a complete set of explanatory disclosures,

FINANCIAL REPORTING USING XBRL – IFRS AND US GAAP EDITION (2006-03-01)
© 2006 UBmatrix, Inc 442
whereas the USFRTF does not. The concepts are the same no matter which set of accounting standards you use.
After we create the financial statement, we will also provide a number of specific examples of the more complicated aspects of using XBRL. Again, we want to show you the realities, but we also expect that this is your first time expressing financial information using XBRL, so we don’t want to overwhelm you or provide too much complexity at once. We will ease into the complexity.
Lastly, we will try and explain everything in as generic terms as possible, making this discussion "software independent". A lot of what we will do will be using generic software applications. But for the validation aspects, creating extension taxonomies, etc, you will need robust XBRL tools to create a true, release quality financial statement expressed using XBRL.
Note that we will not be working with extending taxonomies in this section. We don’t want to introduce too many things at a time and make something which is already somewhat complicated even more complicated. Additionally, taxonomy creation software is not at a point where it is easily useable by business users. We will cover extending taxonomies at another time.
16.1. Overview Again, we will start with simple examples and gradually build in increasing complexity.
A local copy of the IFRS-GP taxonomy is provided for you, see the chapter subdirectory. We will use this copy in what we create to allow you to do this exercise without an internet connection.
We will use a fairly simple financial statement from an accounting perspective, but it will cover most of the general areas of XBRL. The most complex area of using XBRL is actually the disclosures because you have to deal with two complex areas together: the accounting aspects and the XBRL aspects. If we introduce an approach once, that approach can be applied to similar situations. So, our struggle here is to be complete, without being overly complex.
For each reporting scenario, we describe the scenario, provide the data set used, create any required extension taxonomy concepts, basically everything that is required. The user of this document should be able to literally use this chapter as a "cookbook" of templates that can be applied to real-world reporting situations.
These examples build on one another, so it is important to start at the beginning and work to the end. Easier stuff is first, it gets more complicated as we go along. Each example stands on its own and the subdirectory of each section shows the completed results. You should create your own versions in separate subdirectories to keep these examples intact.
For this exercise, we will use sample data created for "Sample Company". The final result will NOT be an IFRS-perfect financial statement, that is not the goal. The goal is to do enough to get the main points of creating financials using XBRL across.
XBRL instance documents contain a number of components which work together which express the financial information desired to be expressed by the instance document. Taxonomies are used to express the information used in instance documents. We will create the components for all examples in the following order:
• Taxonomies
o Create required Taxonomies/linkbases – A place to put the concepts

FINANCIAL REPORTING USING XBRL – IFRS AND US GAAP EDITION (2006-03-01)
© 2006 UBmatrix, Inc 443
o Concepts – the concepts
o Relations – required relations
• Instance document
o DTS information relating to which taxonomies are used in the instance document, etc.
o Contexts which provide contextual information relating to fact values such as entity information, period information and reporting scenario information.
o Units which provide contextual-type information relating to the units relating to a fact value
o Fact values or the actual data itself.
o Footnotes which can provide ad hoc relationships between fact values.
We will be covering less and less detail as we move further on the examples. We will do this for two reasons. First, you will get more and more comfortable with what we are doing. Secondly, once we have set things up, such as contexts and units, there is no need to repeat these again.
When we are done, we will have an entire financial statement which has many, many of the things you might run up against when creating your own financial statement. You can then simply apply these ideas to your specific situations.
16.2. Creating Financial Highlights Financial highlights tend to be fragments of information from many different parts of a financial statement. The financial highlights tend to be somewhat "flat" meaning that there are no relationships expressed in the financial highlights, only a list of information.
This make financial highlights the perfect starting point for beginning with XBRL; it is very simple.
There really is not "Financial Highlights" area of the IFRS-GP taxonomy. We will create our own XBRL taxonomy extension. This is simply an exercise of selecting a few concepts from the taxonomy and entering some values. A good, simple place to start.
In this financial highlights basic example, we will look at the core of XBRL instances: contexts, units, and fact values. Footnotes and other information will be covered later in this document
16.2.1. Overview The goals of the financial highlights example are to:
1. Learn how to reference a taxonomy.
2. Create a simple extension taxonomy, adding only one concept.
3. Create a very basic instance document.
4. Create a very basic taxonomy.
5. Setting up the contexts and units you will use.
6. Add the fact values.
7. Help you see what information goes into the instance document and what information goes in taxonomies.

FINANCIAL REPORTING USING XBRL – IFRS AND US GAAP EDITION (2006-03-01)
© 2006 UBmatrix, Inc 444
8. Provide an introduction to dimensional information which we will build on later.
The following is a screen shot of the data we will use for this exercise. It represents a small portion of what might make up the financial highlights of an entity's financial statement. Adding more information to the financial highlights would simply mean repeating more of what we will do in this exercise. The information included in this exercise is specifically included to make specific points.
16.2.2. Taxonomy We will use the IFRS-GP taxonomy, as we are doing IFRS-based financial reporting for this exercise. We will need to create an extension taxonomy as there is one concept we wish to disclose which is not in the IFRS-GP taxonomy; and commonly, you will need to create extensions.
The following is the information you will need about the taxonomy:
Name Value Namespace Prefix: samp Namespace Identifier: http://www.SampleCompany.com/Taxonomy File name: SampleCompany-Taxonomy.xsd Referenced taxonomies: • "ifrs-gp-2005-05-15.xsd", the IFRS-GP taxonomy (in the "Taxonomy"
subdirectory) • Dimensions.xsd, in the Dimensions subdirectory
16.2.2.1. Concepts The following concepts are defined in your taxonomy:
Element Label Element Name (Auto
Created) Data Type
Balance Type
Period Type
Financial Highlights (Presentation) FinancialHighlightsPresentation String (abstract) Duration
Free Cash Flow FreeCashFlow Monetary Duration
There are no real issues to discuss here, this is all straight forward stuff thus far.
16.2.2.2. Relations We will define a presentation relation to help us organize our concepts so we can use them effectively. These relations are summarized below:
Element Label Comments Financial Highlights One of the concepts we created
Sales IFRS-GP concept

FINANCIAL REPORTING USING XBRL – IFRS AND US GAAP EDITION (2006-03-01)
© 2006 UBmatrix, Inc 445
Element Label Comments Profit (Loss) from Operations IFRS-GP concept Profit (Loss) IFRS-GP concept Cash Flow from (Used In) Operations IFRS-GP concept Free Cash Flow One of the concepts we created Number of Employees at End of Period IFRS-GP concept
Basically, the relations above are created in order to put the financial highlights into the desired order. If no parent element is provided, then there is no way to organize the elements into a specific order.
16.2.3. Instance Document The following is the information you will need to create the actual instance document:
Name Value File name: SampleCompany-Instance.xml schemaRef: • SampleCompany.xsd
Note that we only need to reference (via the schemaRef) the company extension taxonomy we created. That taxonomy references all the other taxonomies.
16.2.3.1. Contexts The following are the steps to follow in building this example:
Context ID Entity ID Entity Scheme Start Date
End Date or Instant Scenario
I-2004 ABC Company http://www.ABCCompany.com 2004-12-31 <dim:For><dim:Group /></dim:For>
I-2003 ABC Company http://www.ABCCompany.com 2003-12-31 <dim:For><dim:Group /></dim:For>
I-2002 ABC Company http://www.ABCCompany.com 2002-12-31 <dim:For><dim:Group /></dim:For>
I-2001 ABC Company http://www.ABCCompany.com 2001-12-31 <dim:For><dim:Group /></dim:For>
I-2000 ABC Company http://www.ABCCompany.com 2000-12-31 <dim:For><dim:Group /></dim:For>
D-2004 ABC Company http://www.ABCCompany.com 2004-01-01 2004-12-31 <dim:For><dim:Group /></dim:For>
D-2003 ABC Company http://www.ABCCompany.com 2003-01-01 2003-12-31 <dim:For><dim:Group /></dim:For>
D-2002 ABC Company http://www.ABCCompany.com 2002-01-01 2002-12-31 <dim:For><dim:Group /></dim:For>
D-2001 ABC Company http://www.ABCCompany.com 2001-01-01 2001-12-31 <dim:For><dim:Group /></dim:For>
D-2000 ABC Company http://www.ABCCompany.com 2000-01-01 2000-12-31 <dim:For><dim:Group /></dim:For>
Note that:
• The "Context ID" can be any valid ID, it just needs to start with a string. The context IDs have no meaning, they just indicate the name of the context, which will be used on the fact values.
• The "Entity ID" we just made up here, as with the "Entity Scheme" to which the ID belongs. Normally, you would be given an ID by a regulator, or use some publicly available scheme. This identifies the company which created the instance document.
• The "Start Date" and "End Date" are rather straight forward, so we don’t need to discuss them.
• The "Scenario" is a placeholder for now. We will discuss this later.

FINANCIAL REPORTING USING XBRL – IFRS AND US GAAP EDITION (2006-03-01)
© 2006 UBmatrix, Inc 446
16.2.3.2. Units The following are the steps to follow in building this example:
Next, we add the required units; we will use Euros for this example:
Unit Ref Measure U-Monetary iso4217:EUR U-Pure xbrli:pure
There are two types of units which we know we will use thus far: monetary for most of our numbers, and we will be expressing our numbers in "Euros", therefore we will reference the ISO-4217 code for Euros, which is "EUR".
The second type of numeric value we have is not monetary, but rather the number of employees. We will use a "pure" number for that, it is simply a decimal value.
16.2.3.3. Fact Values These are the fact values we will be using in this exercise:
Concept Name Context
Ref Unit Ref Decimals Value ifrs-gp:RevenueTotalByFunction D-2004 U-Monetary 0 1300000
ifrs-gp:RevenueTotalByFunction D-2003 U-Monetary 0 1200000
ifrs-gp:RevenueTotalByFunction D-2002 U-Monetary 0 1100000
ifrs-gp:RevenueTotalByFunction D-2001 U-Monetary 0 1000000
ifrs-gp:RevenueTotalByFunction D-2000 U-Monetary 0 900000
ifrs-gp:ProfitLossFromOperations D-2004 U-Monetary 0 650000
ifrs-gp:ProfitLossFromOperations D-2003 U-Monetary 0 507000
ifrs-gp:ProfitLossFromOperations D-2002 U-Monetary 0 400000
ifrs-gp:ProfitLossFromOperations D-2001 U-Monetary 0 300000
ifrs-gp:ProfitLossFromOperations D-2000 U-Monetary 0 200000
ifrs-gp:ProfitLoss D-2004 U-Monetary 0 554000
ifrs-gp:ProfitLoss D-2003 U-Monetary 0 422000
ifrs-gp:ProfitLoss D-2002 U-Monetary 0 300000
ifrs-gp:ProfitLoss D-2001 U-Monetary 0 200000
ifrs-gp:ProfitLoss D-2000 U-Monetary 0 100000
ifrs-gp:CashFlowsFromUsedInOperationsTotal D-2004 U-Monetary 0 620000
ifrs-gp:CashFlowsFromUsedInOperationsTotal D-2003 U-Monetary 0 427000
ifrs-gp:CashFlowsFromUsedInOperationsTotal D-2002 U-Monetary 0 200000
ifrs-gp:CashFlowsFromUsedInOperationsTotal D-2001 U-Monetary 0 100000
ifrs-gp:CashFlowsFromUsedInOperationsTotal D-2000 U-Monetary 0 90000
samp:FreeCashFlow D-2004 U-Monetary 0 400000
samp:FreeCashFlow D-2003 U-Monetary 0 300000
samp:FreeCashFlow D-2002 U-Monetary 0 200000
samp:FreeCashFlow D-2001 U-Monetary 0 100000
samp:FreeCashFlow D-2000 U-Monetary 0 90000
ifrs-gp:NumberOfEmployeesAtEndOfPeriod I-2004 U-Pure 0 1231
ifrs-gp:NumberOfEmployeesAtEndOfPeriod I-2003 U-Pure 0 1165
ifrs-gp:NumberOfEmployeesAtEndOfPeriod I-2002 U-Pure 0 985
ifrs-gp:NumberOfEmployeesAtEndOfPeriod I-2001 U-Pure 0 912

FINANCIAL REPORTING USING XBRL – IFRS AND US GAAP EDITION (2006-03-01)
© 2006 UBmatrix, Inc 447
ifrs-gp:NumberOfEmployeesAtEndOfPeriod I-2000 U-Pure 0 855
16.2.3.4. Footnotes We will not be adding any footnotes here at this point.
16.2.4. Process So, we have all the data we will be using, you can see that data above. But, is this how we are going to be creating financial statements from now on, keying in all this information? Of course the answer is no.
There are several approaches which could be used to generate financial information in the form of an XBRL instance document:
• Auto-generated from an accounting system.
• Mapping of the information which already exists in another location, probably Excel, and then using software to generate the instance document.
• In a tool specifically for creating instance documents.
• Or even some combination of the above.
We will be using a simple tool for creating the instance document, but then an XBRL specific tool for validating the XBRL and the data contained in the document.
The application is in the folder for this chapter, in the "Financial Highlights" subfolder. In fact, the data has already been entered, so you don’t have to enter it. But you can edit the data, if you like, and change the data and create your own financial statement.
16.2.4.1. Enter Information All the information above should be entered using some instance document creation application. We have a generic tool, as discussed above. The interface looks like this:
16.2.4.2. Validate Another important aspect of creating a financial report in XBRL is making sure (a) the right data has the right XBRL concepts, contexts, and units associated with it and (b) all the data is in the instance document and ONLY the data you want in the instance document. The example below shows using Excel comments to help review information which will be put into an XBRL instance document:

FINANCIAL REPORTING USING XBRL – IFRS AND US GAAP EDITION (2006-03-01)
© 2006 UBmatrix, Inc 448
We are not showing the report which says that the instance document is valid per the XBRL 2.1 specification, nor are we showing the taxonomy validation reports.
16.2.4.3. Final Thoughts So, there you have created an instance document. It is fairly simple, but we will build on what you have done in the next exercises.
16.3. Balance Sheet Another fairly straight forward part of a financial statement to create in XBRL is the balance sheet. We will now add a balance sheet to the financial highlights we have already created.
Like the financial highlights above, the balance sheet is nothing more than a collection of fairly straight forward fact values.
16.3.1. Overview The goals of the balance sheet example is to:
1. Add linkbases to a taxonomy.
2. Add another taxonomy to an existing taxonomy.
3. Validate calculations.
4. Validate formulas.
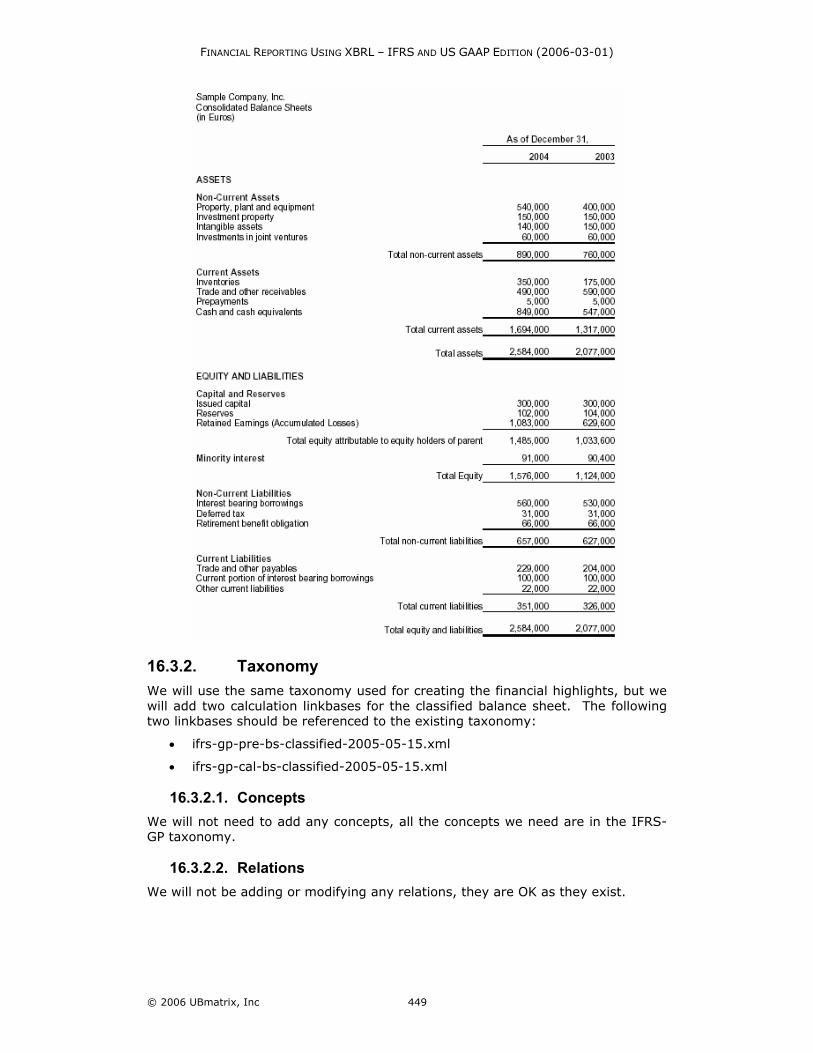
The following is a screen shot of the balance sheet we will be using:
FINANCIAL REPORTING USING XBRL – IFRS AND US GAAP EDITION (2006-03-01)
© 2006 UBmatrix, Inc 449
16.3.2. Taxonomy We will use the same taxonomy used for creating the financial highlights, but we will add two calculation linkbases for the classified balance sheet. The following two linkbases should be referenced to the existing taxonomy:
• ifrs-gp-pre-bs-classified-2005-05-15.xml
• ifrs-gp-cal-bs-classified-2005-05-15.xml
16.3.2.1. Concepts We will not need to add any concepts, all the concepts we need are in the IFRS-GP taxonomy.
16.3.2.2. Relations We will not be adding or modifying any relations, they are OK as they exist.

FINANCIAL REPORTING USING XBRL – IFRS AND US GAAP EDITION (2006-03-01)
© 2006 UBmatrix, Inc 450
16.3.3. Instance We will add a taxonomy directly to the instance document which contains business rules to test a relation, to see if the balance sheet balances. The taxonomy contains a proprietary implementation of business rule and is publicly available.
• /UBmatrix/UBmatrix-ifrs-gp-rules-2005-05-15.xsd
16.3.3.1. Contexts All the contexts we need are available as they were added when we created the financial highlights information.
16.3.3.2. Units All the units are OK.
16.3.3.3. Fact Values We will add fact values to the taxonomy, but we will not list them here. By now, you should understand what should be added. You can look at the mappings by (a) looking at the Excel spreadsheet provided and/or (b) looking at the actual instance document.
16.3.3.4. Footnotes XBRL footnotes offer a way to connect ad hoc information to an XBRL instance document item, tuple, or set of items and/or tuples. These add hock relations can be used for several things, for example:
• Connecting together two or more fact values which are intended to be used together to be correctly understood.
• Attach a fragment of XHTML to an item(s) or tuple(s), for example presentation information.
• Create a "complex data fragment" in XHTML and having that be the value for a fact in an instance document. For example, an entire XHTML fragment for a balance sheet could be the value of one concept in an instance document.
We just wanted to point out the possibilities here, not actually create these footnotes. Footnotes are more like comments which you make in an instance document. They should contain no additional meaning, meaning belongs in XBRL fact values expressed using XBRL concepts from a taxonomy. We will not be discussing footnotes in further sections.
16.3.4. Process The balance sheet information will likely come directly from the accounting system if adjustments to the trial balance are done there, or from an Excel spreadsheet or other source. We have the balance sheet information in an Excel spreadsheet for you.
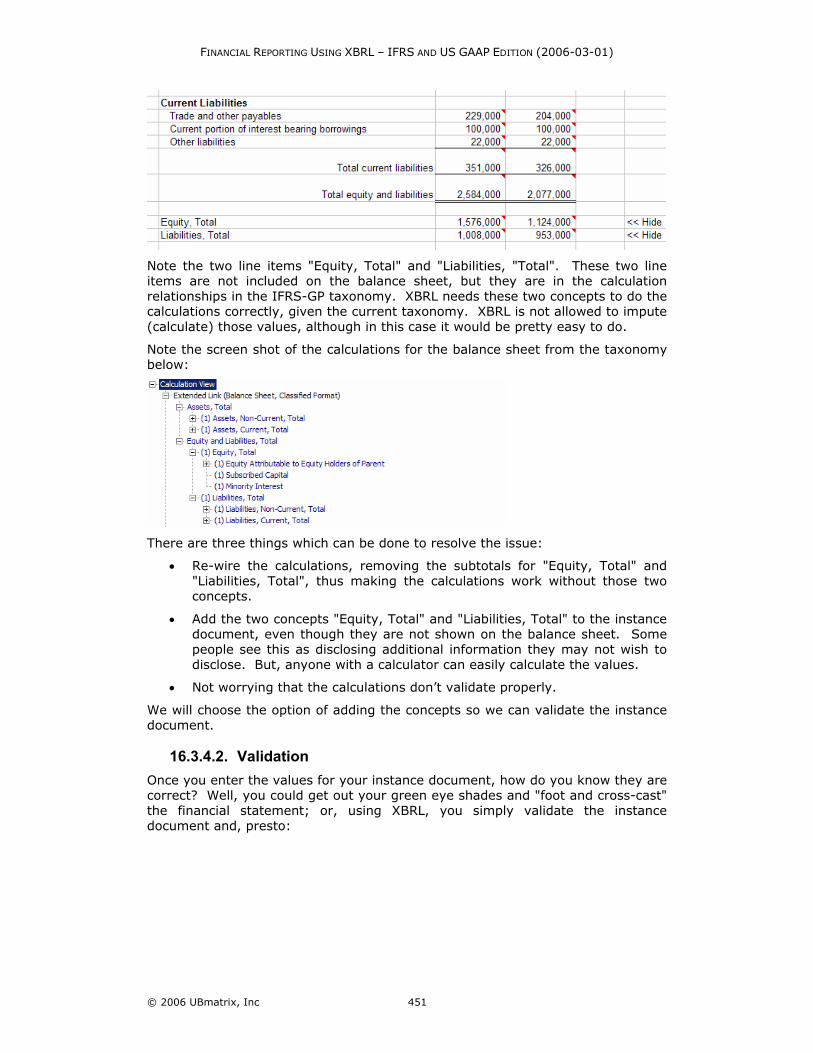
16.3.4.1. Entering Information Again, all this is very straight forward, but there is one item we need to discuss. There are two numbers in the XBRL instance document which do not appear on the printed document:
FINANCIAL REPORTING USING XBRL – IFRS AND US GAAP EDITION (2006-03-01)
© 2006 UBmatrix, Inc 451
Note the two line items "Equity, Total" and "Liabilities, "Total". These two line items are not included on the balance sheet, but they are in the calculation relationships in the IFRS-GP taxonomy. XBRL needs these two concepts to do the calculations correctly, given the current taxonomy. XBRL is not allowed to impute (calculate) those values, although in this case it would be pretty easy to do.
Note the screen shot of the calculations for the balance sheet from the taxonomy below:
There are three things which can be done to resolve the issue:
• Re-wire the calculations, removing the subtotals for "Equity, Total" and "Liabilities, Total", thus making the calculations work without those two concepts.
• Add the two concepts "Equity, Total" and "Liabilities, Total" to the instance document, even though they are not shown on the balance sheet. Some people see this as disclosing additional information they may not wish to disclose. But, anyone with a calculator can easily calculate the values.
• Not worrying that the calculations don’t validate properly.
We will choose the option of adding the concepts so we can validate the instance document.
16.3.4.2. Validation Once you enter the values for your instance document, how do you know they are correct? Well, you could get out your green eye shades and "foot and cross-cast" the financial statement; or, using XBRL, you simply validate the instance document and, presto:
FINANCIAL REPORTING USING XBRL – IFRS AND US GAAP EDITION (2006-03-01)
© 2006 UBmatrix, Inc 452
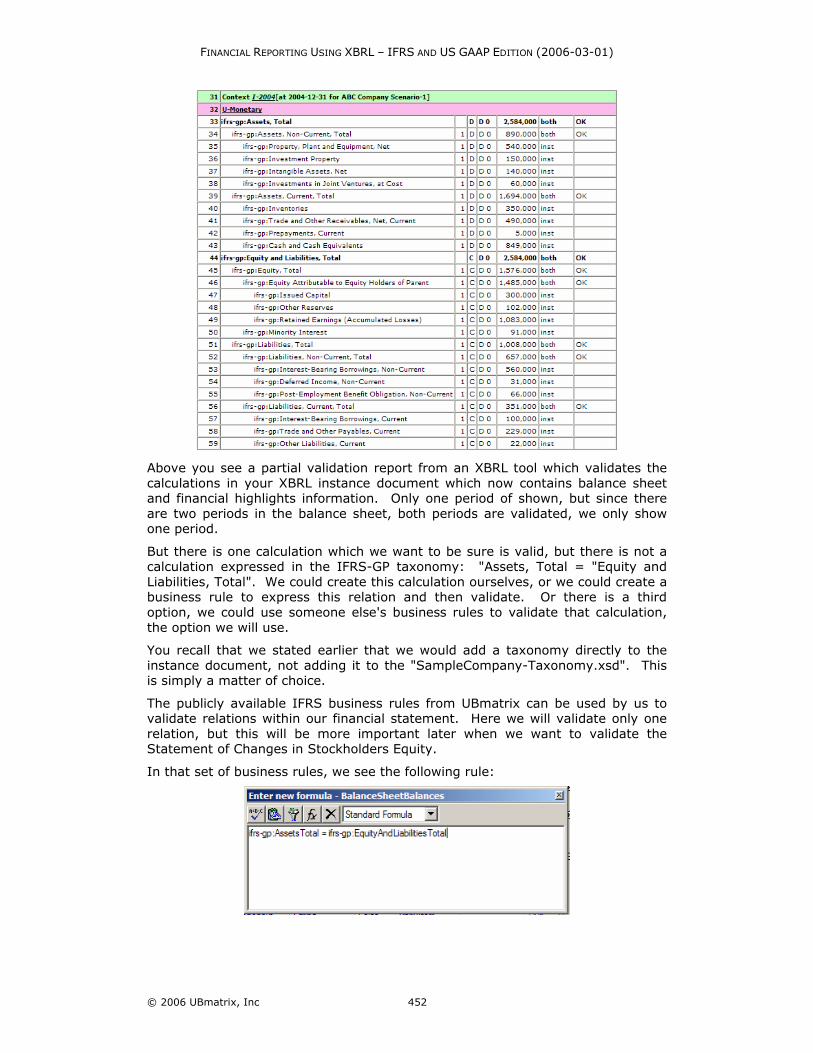
Above you see a partial validation report from an XBRL tool which validates the calculations in your XBRL instance document which now contains balance sheet and financial highlights information. Only one period of shown, but since there are two periods in the balance sheet, both periods are validated, we only show one period.
But there is one calculation which we want to be sure is valid, but there is not a calculation expressed in the IFRS-GP taxonomy: "Assets, Total = "Equity and Liabilities, Total". We could create this calculation ourselves, or we could create a business rule to express this relation and then validate. Or there is a third option, we could use someone else's business rules to validate that calculation, the option we will use.
You recall that we stated earlier that we would add a taxonomy directly to the instance document, not adding it to the "SampleCompany-Taxonomy.xsd". This is simply a matter of choice.
The publicly available IFRS business rules from UBmatrix can be used by us to validate relations within our financial statement. Here we will validate only one relation, but this will be more important later when we want to validate the Statement of Changes in Stockholders Equity.
In that set of business rules, we see the following rule:

FINANCIAL REPORTING USING XBRL – IFRS AND US GAAP EDITION (2006-03-01)
© 2006 UBmatrix, Inc 453
The business rule is called "Balance Sheet Balances". When we run the validation report, we see the following reported:
The message is a bit appears a bit funky, but you can see that the rule "ifrs-rules:Balance Sheet Balances", and the formula is shown, has a value of "TRUE", meaning that the balance sheet does valance. You can also see on the right information as to how the value was calculated. This is helpful if there is an error and you need to investigate and correct the error.
One last thing we want to mention is the "decimals" attribute on instance document fact values. A safe thing to do would be to provide the value "INF" for every monetary fact value, this means that "what was provided was what you get", don’t assume any further precision of the values. Another way to do this is to explicitly state the precision, which is what we have done by entering a value of "0", meaning there are no decimal places of precision which you should be assuming. What is entered for decimals impacts the way XBRL does calculations.
16.4. Income Statement The income statement is another relatively straight forward statement to express using XBRL. There are a few things which we will point out, which will be our focus.Another relatively simple financial statement to create in XBRL is the income statement. Again, the income statement is simply a collection of numeric items. There is one small twist in that there are two types of numeric items: monetary such as the vast majority of items on the statement, and earnings per share, which is a slightly different type of numeric item, requiring a different units.
16.4.1. Overview The goals of the financial highlights example are to:
1. Show the difference between presentation and calculations.
2. Discuss "scaling" values.
3. Validate calculations.
The following is a screen shot of the income statement we will be using:

FINANCIAL REPORTING USING XBRL – IFRS AND US GAAP EDITION (2006-03-01)
© 2006 UBmatrix, Inc 454
16.4.2. Taxonomy We will use the same taxonomy used for creating the financial highlights and balance sheet, but we will add two calculation linkbases for the by function income statement. The following two linkbases should be referenced to the existing taxonomy:
• ifrs-gp-pre-is-byFunction-2005-05-15.xml
• ifrs-gp-cal-is-byFunction-2005-05-15.xml
16.4.2.1. Concepts We will not need to add any concepts, all the concepts we need are in the IFRS-GP taxonomy.
16.4.2.2. Relations We will not be adding or modifying any relations, they are OK as they exist.
16.4.3. Instance We have all the taxonomies we need and will be adding nothing to the instance document which we need, except for the income statement fact values, which we will add.

FINANCIAL REPORTING USING XBRL – IFRS AND US GAAP EDITION (2006-03-01)
© 2006 UBmatrix, Inc 455
16.4.3.1. Contexts All the contexts we need are available as they were added when we created the financial highlights information.
16.4.3.2. Units All the units are OK.
16.4.3.3. Fact Values We will add fact values to the taxonomy, but we will not list them here.
We do want to talk a bit about "scaling" values for a moment. If you notice the income statement printout, all of the expenses are expressed in negative numbers. However in the instance document, the fact values are not negative, they are positive values. We will need to "flip" the signs. This is done by simply multiplying the values by "-1" during the process of mapping the instance document data contained in Excel, to the actual XBRL instance document.
Additionally, there are times when the Excel spreadsheet and printout have values expressed in thousands or millions of dollars. In XBRL instance documents, the actual values are provided. So, if "1,000" appears on the income statement, it may be "1,000,000" in the instance document for that fact value. Again, this is achieved during the mapping process by scaling the value by multiplying it by 1000 or dividing it by 1000, depending which way you are going.
So, in the above screenshot, you can see that the scale is "1" for Revenue and Gross profit and "-1" for Cost of Sales.
There is one more issue with the fact values entered into the instance document. Remember that we entered some financial highlights. Four of those were from the income statement. If we map the fact values twice, they will appear twice in the instance document, which is not desired; fact values should appear once, although they may appear in more than on place in the printed financial statement.
As such, we need to remove the mappings from the financial highlights area and map them on the income statement, the primary location of the concept. It really does not matter where you actually map it, but you do need to have some strategy, and more importantly, map fact values only once.
One more thing to point out is that we do need to add three sub totals which do not appear on the actual income statement, but are needed for your calculations to work correctly.
16.4.4. Process The income statement information will also likely come directly from the accounting system if adjustments to the trial balance are done there, or from an

FINANCIAL REPORTING USING XBRL – IFRS AND US GAAP EDITION (2006-03-01)
© 2006 UBmatrix, Inc 456
Excel spreadsheet or other source. We have the income statement information in an Excel spreadsheet for you.
However, the earnings per share information is not in the accounting system. That will come from another source.
16.4.4.1. Entering Information Again, all this is very straight forward, we will not show the actual values here, see the Excel spreadsheet.
We discussed the fact that we will remove mappings of several fact values from the financial highlights, and map them from the income statement.
16.4.4.2. Validation Again, the validation is straight forward, similar to the balance sheet. We will not cover validation again here other than to say that if you actually created the income statement you can see that if you get the polarity (plus a as a minus; or a minus as a plus) of the value wrong in the instance document, it will not validate correctly. The preference of how the values appear on paper have no bearing on how the values are entered into the instance document; that is determined by the taxonomy along, specifically the balance attribute value and the concept documentation.
16.4.4.3. Differences Between Calculations and Presentation It has been pointed out before, but we will point it out again here and discuss it a bit more; but, there are two different ways you commonly view information in XBRL: using the presentation view and using the calculations view.
The income statement is a good place to do this because the differences in the two views are the greatest. Consider the screen shot below:
There are several important things to notice about the differences between the presentation and calculation views of a taxonomy.
• Notice that the calculations view looks "upside down". Take a look at the location of the concept "Profit (Loss)" in each view. It looks to be in a reasonable location in the presentation view, but it is at the "top" in the calculation view. The only reason for this is the way the taxonomy tools abstract the relationships in their tools. This is not an XBRL requirement; it is just the way the hierarchies are expressed. For the calculation of "Profit (Loss)", it is the end of the calculation, the sum of all the stuff on the income statement. That is why it is on the top.
FINANCIAL REPORTING USING XBRL – IFRS AND US GAAP EDITION (2006-03-01)
© 2006 UBmatrix, Inc 457
• Notice the location of "Basic Earnings (Loss) Per Share". In the presentation view, again, it is where you might expect it; toward the bottom of the income statement. But in the calculation view, again it is at the top. This time, the reason "Basic Earnings (Loss) Per Share" is at the top is because XBRL does not have a way of specifying the order of the "root" or top most concepts in calculations, or for presentation for that matter. Therefore, it is somewhat arbitrary which order these root concepts of calculations show up in the calculations view. Commonly, XBRL software simply puts the concepts in alphabetical order, as was done with this concept.
• What if the calculation and presentation don’t match? Well, that might indicate an error.
16.5. Cash Flows Statement Another fairly straight forward statement to create is the cash flow statement. Again, the cash flow statement, like everything thus far, is simply a collection of numeric items. There is one little twist though.
The balance sheet contained concepts which were all "as of" a point in time, an instant. The income statement contains concepts which were all "for the period ended", or a duration in time. The cash flow statement contains both. The majority of the concepts are durations, the actual cash flows themselves. The balances as of a point in time are cash itself; the balance at the beginning of the period, and the balance at the end of the period. The cash flow statement is our first movement analysis.
16.5.1. Overview The goals of the cash flow statement example are to:
1. Introduce you to the movement analysis
2. Validate formulas
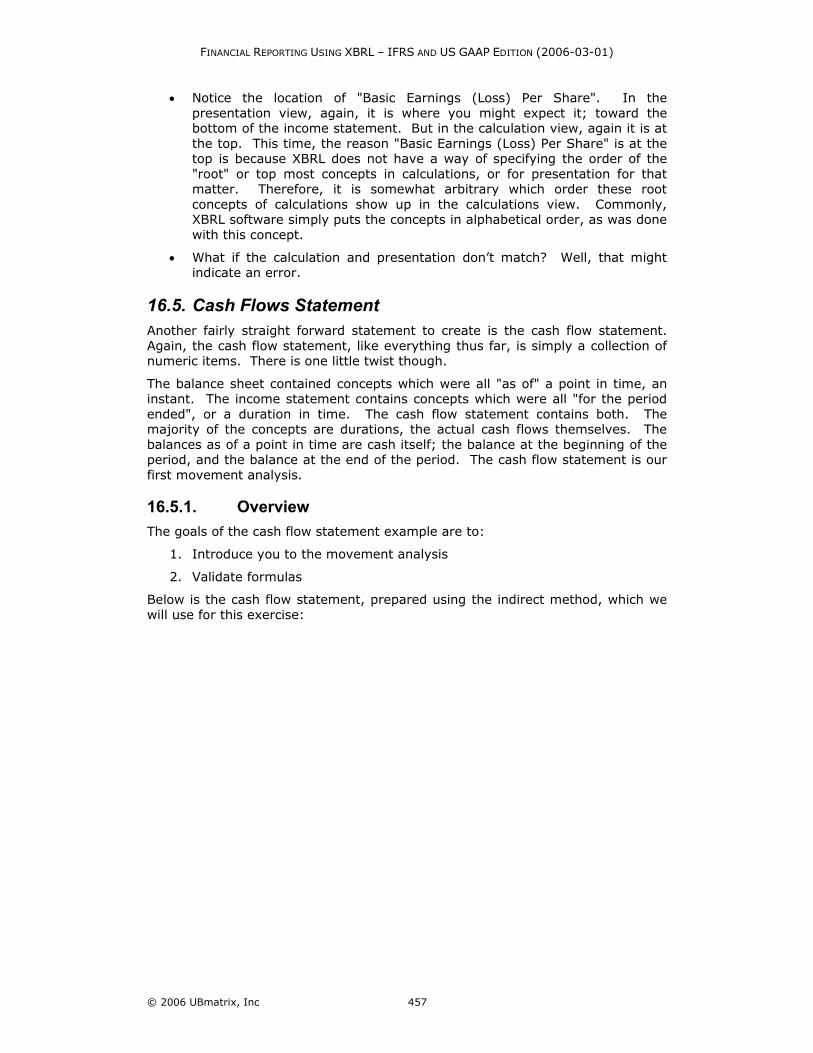
Below is the cash flow statement, prepared using the indirect method, which we will use for this exercise:

FINANCIAL REPORTING USING XBRL – IFRS AND US GAAP EDITION (2006-03-01)
© 2006 UBmatrix, Inc 458
16.5.2. Taxonomy We will again use the same taxonomy used for creating the financial highlights, the balance sheet, and the income statement; but we will add two more calculation linkbases for the indirect method cash flows statement. The following two linkbases should be referenced to the existing taxonomy:
• ifrs-gp-pre-cf-indirect-2005-05-15.xml
• ifrs-gp-cal-cf-indirect-2005-05-15.xml
16.5.2.1. Concepts We will not need to add any concepts, all the concepts we need are in the IFRS-GP taxonomy.
16.5.2.2. Relations We will not be adding or modifying any relations, they are OK as they exist.
16.5.3. Instance We have all the taxonomies we need and will be adding nothing to the instance document which we need, except for the cash flow statement fact values, which we will add.

FINANCIAL REPORTING USING XBRL – IFRS AND US GAAP EDITION (2006-03-01)
© 2006 UBmatrix, Inc 459
16.5.3.1. Contexts All the contexts we need are available as they were added when we created the financial highlights information.
16.5.3.2. Units All the units are OK.
16.5.3.3. Fact Values We will add fact values to the taxonomy, but we will not list them here. Like the income statement, this is another statement where the sign of the values jump all around. And again remember, the way values are presented on the paper-based cash flow statement have no bearing on the polarity with which they must be entered in the XBRL instance document. That, again, is determined by the taxonomy. Validating the document is the only way to really know if you got them correct.
Also, there are fact values which must appear in the instance document for validation purposes, which don’t show up in the paper-based cash flow statement. These are just subtotals.
16.5.4. Process Unlike the balance sheet and income statement information which might come from an accounting system's trial balance, the cash flow information is not on the trial balance. Most accounting systems don’t even generate a quality cash flow statement, if any cash flow statement. The cash flow statements are generally created in Excel.
16.5.4.1. Entering Information Again, all this is very straight forward. There is no real need to discuss this in detail. We will point out though that you need to remove the mapping for the one cash flow concept which is on the financial highlights. Also, we will add a few subtotals which do not appear in the printed cash flow statement, but are needed for XBRL validation. Again, we will follow the strategy started with the balance sheet.
One thing worth pointing out is that the cash flow statement uses several concepts from the income statement. These appear with the opposite polarity on the cash flow statement than they did on the income statement. This is because we are reversing the flow from the income statement, adding concepts back to arrive at cash flow from operations. But these are the exact same fact values as they are the same concepts in the taxonomy. See these below:

FINANCIAL REPORTING USING XBRL – IFRS AND US GAAP EDITION (2006-03-01)
© 2006 UBmatrix, Inc 460
So, again, we don’t want the same concept in the XBRL instance document more than once, so we don’t need to map these concepts which already get into the XBRL instance document via the income statement.
16.5.4.2. Validation The cash flow statement is where we can really begin to see one of the values of business rules and XBRL in general.
Above you see a partial validation report from an XBRL tool which validates the calculations in your XBRL instance document which now contains cash flow information. Again, only one period of shown, but since there are two periods in the cash flow statement, both periods are validated, we only show one period.
Remember how for the balance sheet we added a business rule to help us make sure that the balance sheet balances; well, there are several places where business rules can help us out in the cash flows statement:
• The reconciliation of beginning, net cash flow, exchange gains, and ending cash (note that these relations are not on the calculation validation report, as they are calculations across contexts)
• The increase (decrease) in the current asset and current liability accounts, see line 70 to 73 on the above report (again, this shows the calculation in the cash flow statement, but here the cash flow statement and the balance sheet have relations)
These rules already exist in the UBmatrix IFRS-GP business rules taxonomy which we used for the balance sheet, so we don’t have to add them.
Here are the business rule validation report results:

FINANCIAL REPORTING USING XBRL – IFRS AND US GAAP EDITION (2006-03-01)
© 2006 UBmatrix, Inc 461
Note the difference in the number of rules validated in 2004 s compared to 2003; for 2004 there are six results, for 2003 there are only 2. The reason for this is that in the 2004 financial statement, prior period information exists for 2003, but prior period data does not exist for 2002. Now, we are not required (nor should we) present 2002 information which is not required in our released financial statement; but we can use prior period information for validating the current year financial information.
In this exercise folder there is a file which contains this information, see the file "SampleCompany-Instance-PriorYearInfo.xml". That file contains balance sheet information for Inventories, Trade Receivables, Prepayments, and Trade Payables for 2002 which we can use to validate the increases and decreases in working capital.
To do that, what we do is, from within your application from the menu ribbon select "File | Load | Instance Data". You select the file indicated above, and then run the validation again. You should have more results for 2003 validation, as you have more data:
Note how easy it is to test the current period based on the prior period to be sure your beginning balances are correct.
16.5.4.3. Adding custom labels XBRL taxonomies, such as the IFRS-GP taxonomy, provide labels for concepts contained in the taxonomy. Users of the taxonomy, if they wish, add additional labels to concepts and use their label, if they desire.
The best way to add custom labels is to create your own label linkbase and attach it to your instance document directly, or to your extension taxonomy.
Typically, it is better to use the taxonomy label if you can. But, you may not like the taxonomy label for some reason, which is fine. For example, some taxonomy labels are quite verbose in order to make them unique. For example, "Net Increase (Decrease) in Cash and Cash Equivalents" is what is used in the taxonomy and you simply may want to say "Net Increase in Cash".
You create an custom label linkbase in a similar fashion to creating the labels of a taxonomy.

FINANCIAL REPORTING USING XBRL – IFRS AND US GAAP EDITION (2006-03-01)
© 2006 UBmatrix, Inc 462
16.6. Statement of Changes in Equity We will now move on to the Statement of Changes in Equity. We exposed you to the movement analysis with the cash flow statement, which is really a movement analysis. The statement of change in equity is the mother of all movement analyses; it is a collection of movement analyses for every equity account.
Again though, it is still only numeric items and relatively easy from some perspectives, it can be challenging to create this statement because there is a lot going on. But there is really nothing that you have not already seen.
16.6.1. Overview The goals of the statement of changes in equity example are to:
1. Further explain the movement analysis
2. Expand on our discussion of business rules/formulas
The following is the statement of equity which we will be using for this exercise. Not too complicated, but it will point out what we need to see with respect to this statement:
A few notes about the statement of changes in equity which make this statement somewhat unique.
First, this statement can be shown "horizontally" or "vertically". What this means is that what is headings in this statement and line items in this statement could be reversed, and you still show the exact same information. There is no difference in what is presented, and there is no difference in the data, the difference is only in the preparer's preference of how they desire to show the information. The statement of equity can get quite large, sometimes the choice is driven by how to get it to fit onto a piece of paper.
Another point is that some of these statements of changes in equity tend to be quite large, split across multiple pages. If you break this statement down into components it is easier to digest, it is really a collection of a lot of little movement analysis hung together.
Because the statement of changes in equity can be quite large and because some things may be material, may not be material, or may change in materiality over the years, the groupings of what is shown on the statement of equity can change

FINANCIAL REPORTING USING XBRL – IFRS AND US GAAP EDITION (2006-03-01)
© 2006 UBmatrix, Inc 463
significantly. The major thing that changes is the groupings of the "Other Reserves", of which there are 13 classes of other reserves in the IFRS-GP taxonomy.
As the groupings change, so to change the need for extension taxonomies to express the groupings desired, if they are different than what is provided in the taxonomy.
The fact is that a lot of these issues are nothing more than personal preference.
16.6.2. Taxonomy Like we did for all the other statements, we will add calculation and presentation linkbases to our taxonomy for the statement of changes in equity. The following two linkbases should be referenced to the existing taxonomy:
• ifrs-gp-pre-sce-2005-05-15.xml
• ifrs-gp-cal-sce-2005-05-15.xml
16.6.2.1. Concepts We will not need to add any concepts, all the concepts we need are in the IFRS-GP taxonomy.
16.6.2.2. Relations We will not be adding or modifying any relations, they are OK as they exist.
16.6.3. Instance We have all the taxonomies we need and will be adding nothing to the instance document which we need, except for the statement of changes in equity fact values, which we will add.
16.6.3.1. Contexts All the contexts we need are available as they were added when we created the financial highlights information.
16.6.3.2. Units All the units are OK.
16.6.3.3. Fact Values We will add fact values to the taxonomy, but we will not list them here. Like the income statement and cash flow statement, this is another statement where the sign of the values jump all around. And again remember, the way values are presented on the paper-based cash flow statement have no bearing on the polarity with which they must be entered in the XBRL instance document. That, again, is determined by the taxonomy. Validating the document is the only way to really know if you got them correct.
Also, there are fact values which must appear in the instance document for validation purposes, which don’t show up in the paper-based cash flow statement. These are just subtotals. There are several of these for the statement of changes in equity.

FINANCIAL REPORTING USING XBRL – IFRS AND US GAAP EDITION (2006-03-01)
© 2006 UBmatrix, Inc 464
16.6.4. Process Again, like the cash flow statement, the statement of changes in equity information typically does not come from the accounting system but rather from an Excel spreadsheet an accountant has prepared after analyzing accounting transactions. The accounting system helps to some degree, and even some accounting system can generate this information, but having no modifications to the statement of changes in equity from data generated from the accounting system would be quite rare. Therefore, the statement of changes in equity is generally created in Excel.
16.6.4.1. Entering Information Again, all this is very straight forward. There is no real need to discuss this in detail. We will point out though that you need to remove the mapping for the one cash flow concept which is on the financial highlights. Also, we will add a few subtotals which do not appear in the printed cash flow statement, but are needed for XBRL validation. Again, we will follow the strategy started with the balance sheet.
One thing worth pointing out is that the cash flow statement uses several concepts from the income statement. These appear with the opposite polarity on the cash flow statement than they did on the income statement. This is because we are reversing the flow from the income statement, adding concepts back to arrive at cash flow from operations. But these are the exact same fact values as they are the same concepts in the taxonomy. See these below:
So, again, we don’t want the same concept in the XBRL instance document more than once, so we don’t need to map these concepts which already get into the XBRL instance document via the income statement.
16.6.4.2. Validation We will really see the value of business rules with the statement of changes in equity as there are a number of business rules which we will validate. And again, these are contained in the UBmatrix business rule set for the IFRS-GP taxonomy. This is the validation for the 2004 relations.
But first let's look at the normal XBRL calculations. Below is a screen shot of the 2004 validation results. You will notice that there are two sets of validation results.
The first set validates the calculations that go from left to right in the financial statement. The totals are in the left most column of the statement of equity, the column title is "Equity, Total". You see that validation report here:

FINANCIAL REPORTING USING XBRL – IFRS AND US GAAP EDITION (2006-03-01)
© 2006 UBmatrix, Inc 465
This next section of the report shows the calculations as they validate from top to bottom on the page. Note that the total changes is on the validation report, but they don’t show on the actual statement of changes in equity. Note how the individual changes are detailed under the total changes for each category.
Now, below are the business rules. XBRL calculations, again, cannot do cross context (i.e., beginning to ending balance) calculations. So, we achieve this with business rules. Note the rule on row 16 which reconciles total equity (ifrs-gp:EquityTotal [-P1Y] + ifrs-gp:ChangesInEquityTotal = ifrs-gp:EquityTotal). Other business rules are intermingled with the equity reconciliation business rules.
Hopefully you are seeing how important business rules are, and how helpful they are, to getting a set of financial statements to "foot" and "cross-cast".

FINANCIAL REPORTING USING XBRL – IFRS AND US GAAP EDITION (2006-03-01)
© 2006 UBmatrix, Inc 466
16.6.4.3. Extended Links While we have been using extended links in all of our examples above – by picking sets of things such as the set, or network, of relations which make up the classified balance sheet – we have not really discussed them.
We discuss them here with the statement of equity a bit because they are used in a bit of a different way.
If you look at the calculations for the statement of equity, you will note that there are two different extended links:
• One for the "Statement of Changes in Equity" and
• One for the "Statement of Changes in Equity – Lines".
And remember how in the validation section, we discussed calculations going across the page left to right and calculations going top to bottom on the page. What is going on here is that if you look at the statement of equity, calculations exist in two dimensions:
• One dimension is adding things across the page, such as "Net Profit for the Period"
• One dimension is adding things down the page, such as the total changes for "Translation Reserves".
Each of these is contained in a separate extended link, in the statement of changes in equity case to make each calculation more clear. In other cases, they must be in separate extended links so the calculations don’t physically collide. It is impossible to have two sets of calculations exist in one tree or network. We use extended links to partition the calculations into individual sets so they don’t collide.
16.7. Primary Financial Statements So, now we have completed a set of the primary financial statements. We really have not run into anything too terribly difficult thus far. The primary financial statements have their challenges, but these are just the details of working with XBRL, nothing really is that challenging once you get used to what is going on.
In the next section we introduce more new things and a few fairly challenging areas.
What we have expressed thus far has been simply numbers. Expressing numbers in XBRL have fewer challenges than expressing textual information. Also, we have not run into complex data which is expressed using tuples. This can get even more complicated if you have a tuple imbedded within another tuple.
So, we will now move on to the accounting policies and then disclosures.
16.8. Accounting Policies Previously we were working with only numeric data. In this exercise, we will begin working with text items and some simple tuples. The major task with the policies is two things:
• Assigning the correct concept to a piece of text, be that text one work, one sentence, or one or more paragraphs.
• How to break up a sentence or paragraph when there are two or more concepts to report what is in the sentence or paragraph.

FINANCIAL REPORTING USING XBRL – IFRS AND US GAAP EDITION (2006-03-01)
© 2006 UBmatrix, Inc 467
Chapter 12, "Assigning Instance Fact Values" goes over this in detail. We will not cover every possibility here, but show you common things accountants will run into.
16.8.1. Overview The goals we will achieve in the accounting policies section are to:
1. Show you how textual type information is entered
2. Go over the strategies of entering blocks of textual type information
The following are the policies which we will be using for this exercise:
All this looks rather straight forward. But, there is one primary issue when expressing accounting policies, which tend to be paragraphs of text, in XBRL, which breaks down financial into discrete pieces of data, which we will point out now.
Take a look at the first paragraph of text, which is shown below:

FINANCIAL REPORTING USING XBRL – IFRS AND US GAAP EDITION (2006-03-01)
© 2006 UBmatrix, Inc 468
This one paragraph of text has the following pieces of information in it:
• Name of the reporting entity
• Domicile of reporting entity
• Legal form of reporting entity
• Country of incorporation
• Presentation currency
• Number of employees at end of the period
There are three approaches to expressing this information in XBRL:
A. Tag everything with one tag. All of the information in that paragraph is in the IFRS-GP taxonomy category of "Entity Information". That single concept can be used to tag everything. The problem with this is that a consumer of this information can only get details at the level which the information was tagged. For example, the name of the reporting entity would be buried within the entity information with everything else.
B. Tag everything at the detailed level. Rather than writing the paragraph of text, show the information in more discrete sets. The style sheet which renders the information into the paragraph might be more difficult to create, but the consumers of the information will be very pleased because they can get at their discrete pieces of data.
C. Do both. Make the paragraph of text available with one concept and also make the discrete fact values available as concepts also. Information is duplicated, and you have to keep it in sync so there are no discrepancies, but it is easy to present and easy to extract information.
There really is no "right" answer here. This is more about what goals are you trying to achieve.
16.8.2. Taxonomy Like we did for all the other statements, we will add linkbases, but this time we will only add the presentation linkbase. Now, there is a calculation linkbase for the accounting policies, but we are not using any of those calculations, so we will not add it to our extension taxonomy. The following linkbase should be referenced to the existing taxonomy:
• ifrs-gp-pre-policies-2005-05-15.xml
16.8.2.1. Concepts We will not need to add any concepts, all the concepts we need are in the IFRS-GP taxonomy.
16.8.2.2. Relations We will not be adding or modifying any relations, they are OK as they exist.
FINANCIAL REPORTING USING XBRL – IFRS AND US GAAP EDITION (2006-03-01)
© 2006 UBmatrix, Inc 469
16.8.3. Instance We have all the taxonomies we need and will be adding nothing to the instance document which we need, except for the accounting policies fact values, which we will add.
16.8.3.1. Contexts All the contexts we need are available as they were added when we created the financial highlights information.
Generally duration contexts are used for textual information. This is determined by the taxonomy, rather than the users of the taxonomy; users simply have to follow what the taxonomy creators have specified.
16.8.3.2. Units Textual information does not use units. So, the units we have already are OK.
16.8.3.3. Fact Values We will add fact values to the taxonomy, but we will not list them here. There are no numbers related issues to deal with such as the sign of the number, as we are using only text here. We did point out the issue related to tagging a block of text, we will cover that specifically when we cover entering the information below.
16.8.4. Process Accounting policies do not come from the accounting system. These are generally maintained in the financial statement itself, in accounting manuals for the entity, etc. We will use our Excel spreadsheet to express and then generate the XBRL, similar to the other statements which we have covered thus far.
16.8.4.1. Entering Information Again, all this is very straight forward. The biggest issue is determining the strategy which we will use: tag big chunks of text, tag individual facts, or do both.
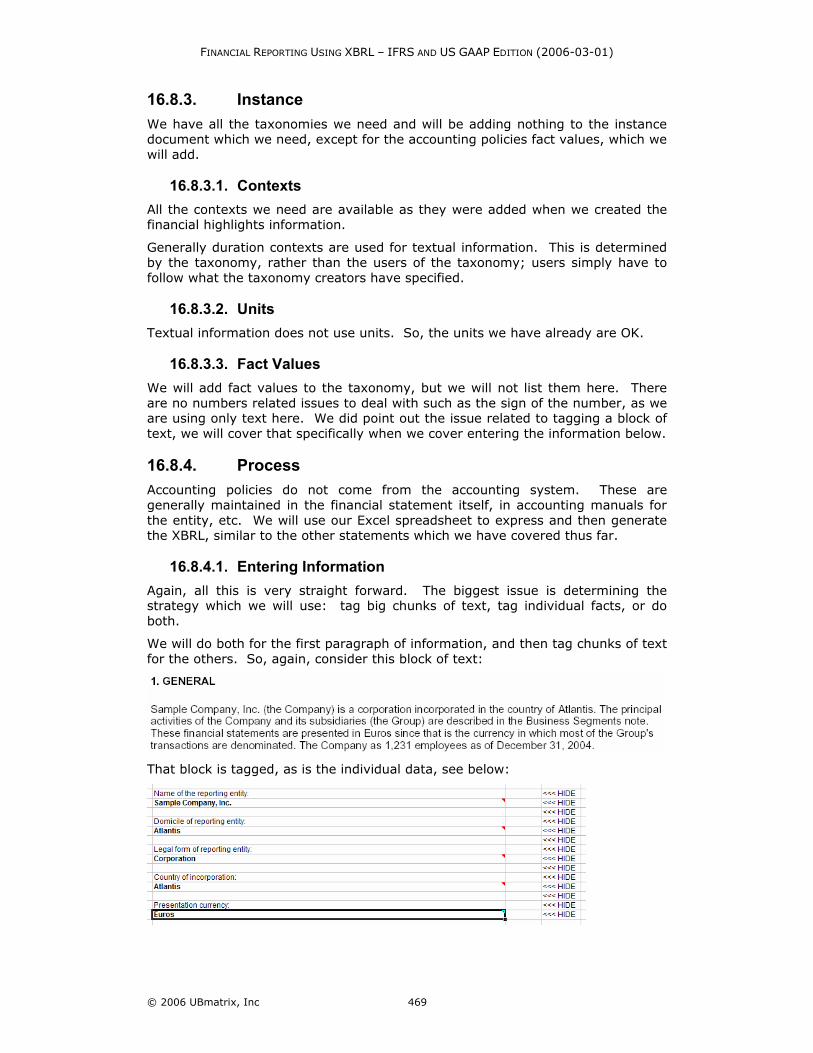
We will do both for the first paragraph of information, and then tag chunks of text for the others. So, again, consider this block of text:
That block is tagged, as is the individual data, see below:

FINANCIAL REPORTING USING XBRL – IFRS AND US GAAP EDITION (2006-03-01)
© 2006 UBmatrix, Inc 470
The individual fact values are not used to generate the printed report, the style sheet uses the paragraph of text, but the consumers of the information can get at the individual pieces of information. More sophisticated software and solutions can be created to keep the data synchronized; we are just using this simple solution.
We used the same approach to breaking out the paragraph of text explaining property, plant and equipment policies; breaking measurement basis, depreciation method, and useful lives into discrete values in addition to disclosing the chunk of text. For the other policies, we simply disclosed a chunk of text.
We will point out one additional thing here. This is not unique to accounting policies, but we will point it out here. Take a look at the property, plant and equipment disclosures from the Excel spreadsheet:
There are several concepts to point out. First, if you look at the measurement basis for land, building, and furniture and fixtures, you will see the values of "RevaluationModel" and "CostModel". If you look in the taxonomy, you will see that the data type for these is "ModelItemType". ModelItemType specifies that the values in the instance document must be either "RevaluationModel" or "CostModel". Nothing else is allowed. The data type constrains what is allowed for the concept. If you enter something else, you will get an error. And this is fine, as there are only two possible models.
If you look at the depreciation method and useful lives, those concepts allow any string data. This is more flexible as there are more options and the taxonomy creators did not constrain the users of the taxonomy. However, this does reduce comparability.
That is really all the issues related to expressing accounting policies in an XBRL-based financial statement. Most policies are discrete values. We only covered a portion of what is required to be disclosed in an IFRS financial statement, but this is plenty to get the point across.
There are a few calculations within the accounting polices and there are a few tuples. But, we will cover these in the explanatory disclosures section.
One final thing we want to point out is that you notice that we are not mapping section headings such as "Property, Plant and Equipment" or "Inventories" and so forth to values in the XBRL instance document. These section headings are presentation information, not fact values. What goes in the sections are data. The section headings simply makes reading the information easier for readers and preparing the information easer for creators.

FINANCIAL REPORTING USING XBRL – IFRS AND US GAAP EDITION (2006-03-01)
© 2006 UBmatrix, Inc 471
16.8.4.2. Validation There are no calculations which need to be validated in this section, so these concepts will not show up in our validation report.
However, if you did not enter the proper values for the measurement basis for land, buildings, or furniture and fixtures, when you load the instance document into an XBRL application, you will get an error.
16.9. Explanatory Disclosures Now we move into explanatory disclosures. You should have a pretty good feel about how to use XBRL in financial reporting. The explanatory disclosures can be more challenging that what we have covered earlier only because there is so much diversity in the explanatory disclosures. All the concepts of how we achieve what we desire to achieve are identical, but with explanatory disclosures the data is more diverse, thus the differences become more diverse.
But don’t get overwhelmed.
There are several strategies to make the explanatory disclosures a bit less difficult. One thing to consider is that the explanatory disclosures are not just "one big thing". It is really lots and lots of little things that look like one big thing. Of all the complicated areas of the taxonomy, there are really less than 10 extremely complicated areas, and those are complicated because the financial reporting surrounding those areas is complicated.
Here is a listing of some of he more complicated areas of the IFRS-GP taxonomy. You will note that all of these are rather large tuples:
• Biological Assets Where Fair Value Information is Unreliable
• Ordinary Share Capital Disclosures
• Preference Share Capital Disclosures
• Defined Benefit Plans
• Acquisitions
• Disposals
• Related Party Transactions
• Share-Based Payment Arrangements
• Segment Information
That is about it for the complex areas. But, look at the other areas of the taxonomy. Everything else is:
• Single numeric or textual fact values which must be disclosed,
• Rather simple calculations, several of concepts adding up to another concept,
• Movement analysis type schedules
• Fairly straightforward tuples having less then 10 concepts within them
All this easy stuff makes up 80% of the volume of the disclosures. We will learn by tackling easier areas, then you can apply those same concepts to the other areas which look complicated due to the volume of information. There is no difference between a tuple containing 5 fact values and a tuple containing 47 fact values, except for the number of fact values you are dealing with.

FINANCIAL REPORTING USING XBRL – IFRS AND US GAAP EDITION (2006-03-01)
© 2006 UBmatrix, Inc 472
And, as mentioned, the explanatory disclosures are quite large, we cannot cover everything. But what we can do is point out certain patterns that apply. If you learn how to work with one pattern, and you learn all the patterns, you can apply what you know to any area of the taxonomy and achieve what you need to achieve. It really is that simple.
16.9.1. Overview We will handle this section a bit differently. We are not going to go into as much detail in areas which we have already covered. We will focus on new areas. Each disclosure will be covered in a separate section. In this section we will create several common explanatory disclosure patterns in order to expose you to the types of things you will be running into, so you can get a good feel for working with XBRL. After covering these patterns we will point you to similar areas of the taxonomy and show you the similarities.
Again, remember that every possibility, at least for what appears in the IFRS-GP taxonomy is covered in the "Modeling Financial Data Using XBRL" section of this document.
16.9.2. Movements in Property, Plant and Equipment We will start with another movement analysis. You should be quite familiar with the issues related to creating a movement analysis. The statement of changes in equity is nothing more than a big movement analysis. The movements in property, plant and equipment is identical to the statement of changes in equity, except for you are using different financial reporting concepts.
So, this is the data for the movement analysis we will prepare:
16.9.2.1. Steps These are the steps for creating your movement analysis. Again, we will not going into as much detail, we assume you can apply the concepts you learned previously to these the financial reporting areas. We will focus on new concepts.
1. You will need to add the explanatory disclosures presentation and calculation linkbases to your extension taxonomy. This time we will be adding four linkbases, for disclosures and for class breakdowns:
a. ifrs-gp-pre-disclosures-2005-05-15.xml

FINANCIAL REPORTING USING XBRL – IFRS AND US GAAP EDITION (2006-03-01)
© 2006 UBmatrix, Inc 473
b. ifrs-gp-cal-disclosures-2005-05-15.xml
c. ifrs-gp-pre-classes-2005-05-15.xml
d. ifrs-gp-cal-classes-2005-05-15.xml
2. We tried to make this as similar to the statement of changes in equity as possible, so that the only thing which is changing is the concepts. You should be quite familiar with what you need to do; if not, go back to the statement of equity section and read through that.
That is really it. No new topics are brought up.
16.9.2.2. Adding a New Class of PPE One common task creators of financial statements will need to do is add information to add concepts to their taxonomy for things which do not exist in the base taxonomy they are using.
Let's suppose that you had a property, plant and equipment class which is not in the list of what is provided, say "Ships" and/or "Airplanes". If you do, you will need to create an extension. When creating an extension for a new concept, just follow the pattern for existing concepts as closely as possible. We will not actually create this extension here, we did want to point out that a good way to understand how to build an extension is to use the existing taxonomy and simply copy it.
Let's say that Sample Company has a fleet of airplanes. Simple enough, we add the concept "Airplanes" to the taxonomy. Done. Well, not quite. Airplanes is a class of Property, Plant and Equipment. So, we have to disclose all the things required to be disclosed for each class, including:
• Concept for the class, in this case "Airplanes"
• Beginning balance and ending balance labels for Airplanes which will be used in our Movements Analysis, see below
• References for Airplanes, indicating why the class was added
• Measurement Basis for Airplanes
• Depreciation Method for Airplanes
• Life or Rate for Airplanes
• Airplanes under Financing Leases
• Pro Forma Airplanes, Net, at Cost
• Movement Analysis for Airplanes (which includes about 18 concepts which participate in the movements such as "Additions, Airplanes"; "Disposals, Airplanes"; "Depreciation Expense, Airplanes", and so forth)
Once all of these concepts are added, we will need to put the concepts in the correct spot in the presentation view, wire the concepts to the calculations, etc. In particular, the movement analysis calculations need to be created and in addition, the airplane movements need to be wired to the total movements in property plant and equipment in two dimensions: adding, say, Airplanes to the total of "Property, Plant and Equipment, Net" and adding "Additions, Airplanes" to total additions.
This can best be achieved by looking closely to what already exists in the taxonomy and copying that pattern, being sure not to miss anything.

FINANCIAL REPORTING USING XBRL – IFRS AND US GAAP EDITION (2006-03-01)
© 2006 UBmatrix, Inc 474
Property, Plant and Equipment is a rather cumbersome class to extend, yet fairly common. Intangible Assets and Provisions are similar to Property, Plant and Equipment in this respect if a class is added to either of those two balance sheet items. Yet other extensions are fairly easy.
We did not actually add Airplanes to our example, you can do this if you desire.
16.9.2.3. Similar Disclosures There are approximately 61 movement analysis type disclosures in the IFRS-GP taxonomy, and they all work the same way. With the statement of changes in equity, the movements in property, plant and equipment, and the information relating to modeling the movement analysis in Chapter 11 section 11.6.8 "Movement analysis", you should be well on your way in understanding how to express this type information using XBRL.
16.9.3. Property, Plant and Equipment Pledged as Security Next we will look at our first tuple. This is a fairly simple tuple, but we can use it to effectively raise a number of issues with expressing certain types of financial information. The following is the disclosure of property, plant and equipment pledged as security:
This disclosure is required for each period for which a balance sheet is presented. When you create this, it may be helpful to read Chapter 11.6.14 "Complex concept with multiple periods" pattern.
16.9.3.1. Tuples This disclosure in the IFRS-GP taxonomy requires a description and an amount for property, plant and equipment pledged as security per IAS 16 74 a. No total is required, therefore no total exists in the IFRS-GP taxonomy. The disclosure is not by class of property, plant and equipment; the term class is not used. There can be any number of assets pledged. Therefore, this disclosure is in the form of a tuple. The tuple "wraps" the description and the amount together. If there were no tuple, the description and amounts would not be tied together. So, the tuple achieves two things.
16.9.3.2. Mapping Tuples The way the Excel spreadsheet mapping of the tuples is achieved is a bit odd perhaps, so we will describe it here. Below is a screenshot of the mapping of the first tuple.
FINANCIAL REPORTING USING XBRL – IFRS AND US GAAP EDITION (2006-03-01)
© 2006 UBmatrix, Inc 475
The mapping is the same as the mapping of normal fact values not in tuples except for the following. First, each tuple mapping starts and ends with the name of the tuple. In the cell field, the rage of the tuple is indicated. In the row indicating the start of the tuple (see row 391 above), note that the scale field has a "1". This indicates that this is the first tuple. The second tuple has "2", etc. The reason for this is for extracting data from the instance document and repopulating the spreadsheet.
Other than what was described above, tuples are very similar to normal fact values.
16.9.3.3. Similar Disclosures For the most part all smaller tuples, say with the number of concepts with less than 10 are similar to this example. One difference is when there is a movement analysis contained in a tuple. An example of this will be shown later. Larger tuples with 20 to 50 fact values within them and tuples with other tuples nested inside tuples appear different, but they really are more similar than different. However, we will provide examples of both of these.
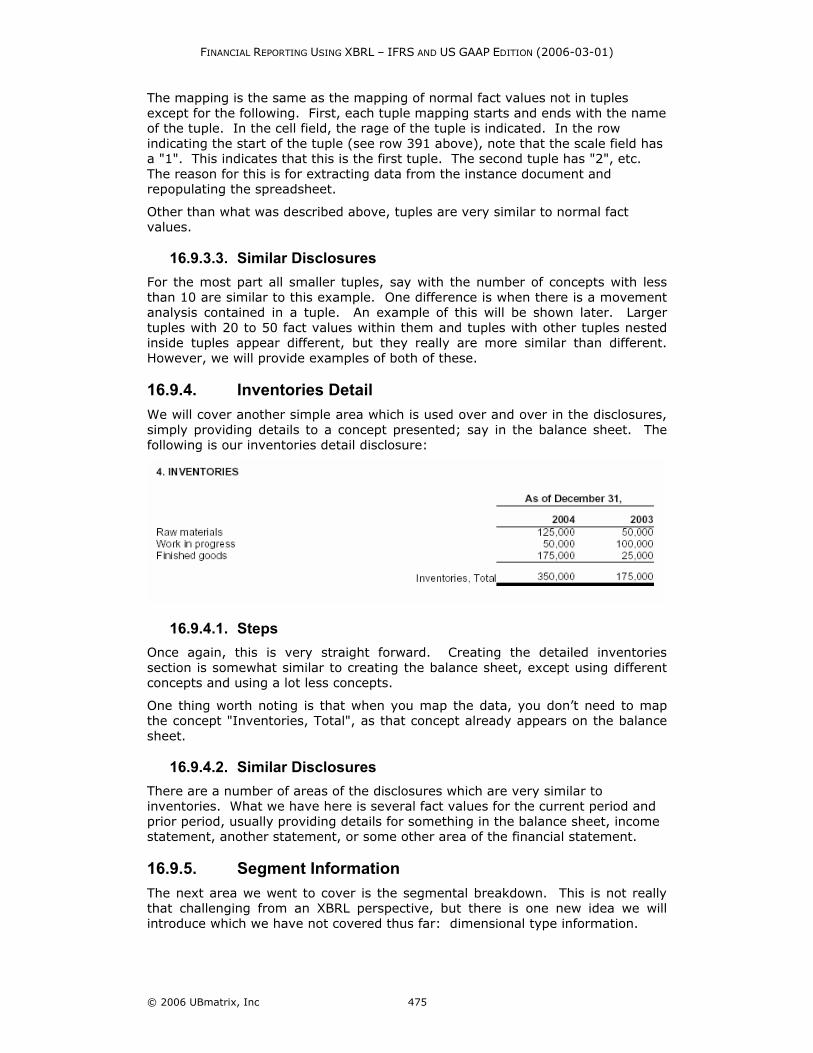
16.9.4. Inventories Detail We will cover another simple area which is used over and over in the disclosures, simply providing details to a concept presented; say in the balance sheet. The following is our inventories detail disclosure:
16.9.4.1. Steps Once again, this is very straight forward. Creating the detailed inventories section is somewhat similar to creating the balance sheet, except using different concepts and using a lot less concepts.
One thing worth noting is that when you map the data, you don’t need to map the concept "Inventories, Total", as that concept already appears on the balance sheet.
16.9.4.2. Similar Disclosures There are a number of areas of the disclosures which are very similar to inventories. What we have here is several fact values for the current period and prior period, usually providing details for something in the balance sheet, income statement, another statement, or some other area of the financial statement.
16.9.5. Segment Information The next area we went to cover is the segmental breakdown. This is not really that challenging from an XBRL perspective, but there is one new idea we will introduce which we have not covered thus far: dimensional type information.

FINANCIAL REPORTING USING XBRL – IFRS AND US GAAP EDITION (2006-03-01)
© 2006 UBmatrix, Inc 476
Segment disclosures basically break down group or consolidated information into geographic or business segments. This may include segregating information by continuing and discontinued operations also. Some information is only applicable on a segment basis, such as inter-segment sales as all inter-segment sales are eliminated in the consolidation process. Other information is only applicable to the group such as income tax and profit (loss), they are not broken down by segment.
This is the information we will be working with:
The breakdown above is for business segments which are the primary segment of the group. We will not tackle continuing and discontinuing operations information, we will assume all operations are continuing.
Also there is another issue we need to deal with and that is that the IFRS-GP taxonomy was constructed prior to the XBRL Dimensions specification was created therefore does not use that specification. Several things about this disclosure would change if XBRL Dimensions were available.
16.9.5.1. Two Approaches We approached this disclosure in two ways in order to show what XBRL Dimensions actually provides in creating a financial statement.
The first way we use XML Schema-based dimensions to express the segment information for our financial statement. We have been using XML Schema-based dimensions throughout these examples thus far. And this was OK as dimensions really did not matter much as we only were providing information for one dimension up until this point, consolidated information for the group.

FINANCIAL REPORTING USING XBRL – IFRS AND US GAAP EDITION (2006-03-01)
© 2006 UBmatrix, Inc 477
The best way to contrast XBRL Dimensions with XML Schema-based dimensional information is to look at what you get with XBRL Dimensions. Take a look at the calculation report below:
This looks like other calculation reports we have looked at up to this point. This really isn’t anything new. It is shown however to make the point of what you don’t get if you now add dimensions. Take a look at this calculation validation report:

FINANCIAL REPORTING USING XBRL – IFRS AND US GAAP EDITION (2006-03-01)
© 2006 UBmatrix, Inc 478
We have not seen this yet as we have not had dimensions expressed as of yet. What it is, is a calculation across the contexts of several line items of our segmental disclosure, it validates calculations which go across the page in our business segments example. Expressing this calculation is not possible without using XBRL Dimensions. The first calculation validation report adds up things going down the page. That is performed using normal XBRL calculations.
We have provided two subdirectories of explanatory disclosures in the set of sample files. The first named "Explanatory Disclosures" has the business segment disclosure using XML Schema-based dimensional information. The second subdirectory titled "Explanatory Disclosures + XBRL Dimensions" has the same data, but this time using XBRL Dimensions to express the segmental information.
Within the set of files containing XBRL Dimensional information is a taxonomy called "Segments.xsd". This taxonomy contains the dimensional information we are using. The key piece of that taxonomy is the definition view, which is shown below:
If you recall from our discussion in a prior chapter about XBRL Dimensions, you will see the following in the definition linkbase above:
• The domains "By Operations" and "By Business Segment" defined
• The members of those domains
• A hypercube which connects those two domains called "Company Hypercube"
• That hypercube connected to the primary concept "Sales to External Customers for Segment", which is connected to the other primary concepts we are using in our business segment disclosure.
There are a few things which are misleading in the IFRS-GP taxonomy which we should mention. Like we said earlier, the IFRS-GP taxonomy was created without the knowledge of XBRL Dimensions. As such, the taxonomy basically defines concepts for each "cell" of data. For example looking at "Revenue", there is a

FINANCIAL REPORTING USING XBRL – IFRS AND US GAAP EDITION (2006-03-01)
© 2006 UBmatrix, Inc 479
concept "Revenue for Primary Segment, Total", "Revenue, Eliminations" and "Consolidated Revenue".
The proper way to do this in the IFRS-GP taxonomy is not to have even defined any new concepts, but rather use the existing concept "Revenues, Total [by Function]", and then using dimensions to express that it is for a primary segment, for eliminating entries, and for the group as a whole.
What we did consistently in our example files was to use the existing IFRS-GP concept for segmental disclosures, but not the consolidated or eliminating concepts. That way, we can use XBRL dimensions to make things add up. The way concepts are currently expressed in the IFRS-GP taxonomy makes it impossible to make things add up across business segments.
Take a look at the sample files and perhaps refresh your memory by taking a look at the chapter relating to "Understanding and Using XBRL Dimensions". This may appear a bit confusing right now as the taxonomy is really not what it needs to be and tools are only beginning to implement this functionality; but the point here is to show what XBRL Dimensions are used for, why they are important, and to show you one way of expressing business segment information.
16.9.6. Ordinary Shares Disclosures Ordinary share disclosures is somewhat of a massive tuple and we wanted to cover this now. Take a look at the disclosure we must create:
The disclosure does not look that bad, but if you look at the tuple, you will quickly become overwhelmed. The tuple has approximately 60 concepts within it! But, if you really look at the disclosure information within the tuple, you will not use the concepts in the tuple unless you have everything which is possible to have for a class of ordinary share capital, which few financial statement creators actually have. For example:
• We have no movements in share capital, therefore we don’t need to show a movement analysis (which is 8 of the concepts)
• We have no treasury shares so we don’t need to report that information or the movements in treasury shares (another 13 concepts)
• We paid no dividends in our example (another 28 concepts which we will not use)
The point is that if these options are eliminated, then we have a rather simple tuple, which will be the case for our example.
Enough said about this example, you can look at the Excel spreadsheet which is rather simple if you simply ignore all the things we don’t have.

FINANCIAL REPORTING USING XBRL – IFRS AND US GAAP EDITION (2006-03-01)
© 2006 UBmatrix, Inc 480
16.9.7. Share-Based Payment Arrangements A company may have zero to any number of share-based payment arrangements or option schemes. Each of those share option schemes may have zero to any number of share-based payment arrangement awards. Each award has certain disclosures and each share option scheme has disclosures, one of those disclosures is a movement analysis of the share options outstanding.
In XBRL terms what we have here is a tuple within a tuple (awards within a share option scheme). And the nested tuple (the award) has a movement analysis within it. In XBRL terms this sounds rather overwhelming, particularly since the amount of information we are dealing with, much of which will actually not be applicable, is so large.
But take a look at the disclosure we will be creating shown below:
We have information about the scheme and one award for the scheme, so we will have one tuple with one additional tuple nested within it. That nested tuple has the movement analysis.
16.9.7.1. Steps If you break this down into pieces, the pieces look rather simple, and there is nothing which we have not covered. There are a few things worth mentioning however.
First of all, the movement analysis, although like any other movement analysis, has to be arranged in a bit of a unique order within the instance document. This is caused by the way XBRL works in terms of XML Schema validation of the fact values within the tuple. Just realize that they must be in a certain order, not the order presented generally. This will all be handled by XBRL software most likely.
The taxonomy specifies the order, and all concepts must appear together. The order within our movement analysis is:
• All outstanding balances, 2002, 2003, and 2004,
• All options granted,
• All options forfeited,

FINANCIAL REPORTING USING XBRL – IFRS AND US GAAP EDITION (2006-03-01)
© 2006 UBmatrix, Inc 481
• All options exercised,
• All options expired,
• Lastly, all changes.
This is caused by the way the tuple is created in the IFRS-GP taxonomy, which is per the FRTA specification. It causes us no troubles, but just be aware that the order of the concepts in the instance document does matter.
The next thing we need to consider is that, being a movement analysis, and because XBRL calculations don’t work across contexts, we need to use a business rule to validate the movement analysis calculation.
Now, it so happens, as mentioned, that the movement analysis concepts are contained within a tuple, which is also within a tuple. But, the UBmatrix rules engine not only can handle this, but there is also a rule already specified in the set of IFRS-GP business rules, so we don’t even have to create the business rule, we just use the rule.
The following is the validation report which shows that the 2003 and 2004 movement analysis reconciles.
Lastly, like with other movement analysis, we added the total changes concept to our Excel spreadsheet and to our XBRL instance document, even though it is not shown in our financial statement. Again, like the other movement analysis exercises, for the XBRL calculations to work, we need to have this concept in the XBRL instance document in order for the calculations to work.
16.10. Supporting and Audit Schedules Those who create financial statements understand the amount of detail which is accumulated to support what exists in a financial statement. Years ago before the personal computer, the detail was a 10 column piece of paper with supporting schedule after supporting schedule, ticked and tied, detailing and supporting what was contained in a financial statement.
The 10 column piece of paper gave way to the electronic spreadsheet when the personal computer was introduced. Spreadsheets were created to support the financial statements.
While electronic spreadsheets were vastly superior to paper based support, spreadsheets still had their weaknesses.
These spreadsheets are commonly printed out and stored in a "file folder" or set of file folders or in a notebook. These electronic spreadsheets were sometimes linked together, and sometimes they were successfully linked together.
Is XBRL the next solution for the accumulated schedules supporting a set of financial statements? Perhaps it is.
We will show two of many supporting schedules which provide the detail of what is contained in a set of financial statements: an aging of trade accounts receivable and an audit schedule for long term debt.

FINANCIAL REPORTING USING XBRL – IFRS AND US GAAP EDITION (2006-03-01)
© 2006 UBmatrix, Inc 482
16.10.1. Trade Accounts Receivable Aging A trade accounts receivable aging is a simple example of a supporting schedule. One number, trade accounts receivable, is detailed in one manner on this schedule. It details by customer the total amount receivable by the customer, plus a breakdown of what is receivable by aging category.
The following is a screen shot of what an aging schedule might look like:
In the subdirectory for this section, you can see the XBRL taxonomy which supports this aging schedule and an XBRL instance document which contains data for this schedule.
You will note that the XBRL version of the aging schedule can be generated from the Excel spreadsheet. Also, the spreadsheet can read the data from the Excel spreadsheet to populate the aging schedule in the spreadsheet.
Imagine how business rules can be used to test the aging schedule and tie the totals to the financial statement.
This is a fairly simple example, but hopefully it communicates what might be possible using XBRL to readers.
16.10.2. Long-Term Debt Audit Schedule A bit more complex than the trade accounts receivable trial balance, but along the same lines, we provide an example of what might be contained on a long-term debt audit schedule. See the example below:

FINANCIAL REPORTING USING XBRL – IFRS AND US GAAP EDITION (2006-03-01)
© 2006 UBmatrix, Inc 483
This schedule supports a number of numbers contained on a financial statement. (Note that this schedule does not tie to the example financial statement used in other examples). For example,
• Total long-term debt ties to the explanatory disclosure,
• The breakdown of the current and non current portion of long term debt ties to the financial statement,
• The amount of debt repaid and the amount of additional borrowings ties to the cash flow statement,
• The breakdown of long term debt by maturity ties to the explanatory disclosures,
• Cash interest paid ties to the cash flow statement,
• The beginning and ending balances of accrued interest payable ties to the balance sheet,
• Interest expense ties to the income statement.
Again, all these relations can be automatically generated and tested and/or enforced using business rules to ensure that everything "foots and cross-castes". This frees accountants from manually ticking and tying things together in many cases, and also reduces errors from the inevitable errors made by humans.
16.11. Disclosure Checklist Disclosure checklists, typically always created for externally released financial statements and sometimes also created for internally released financials, help make sure that nothing is forgotten. These paper based financial statements are checklists which are filled out by accountants.
But what if we could automate some of these checklists? For example, what if we could have a computer test the following:
• If the concept "Buildings" exists in the explanatory disclosures, then the concept "Measurement Basis for Buildings", "Depreciation Method for Buildings" and "Life or Rate for Buildings" or "Minimum Life or Rate for Buildings" and "Maximum Life or Rate for Buildings" must exist in an instance document.
• If the concept "Buildings" exists and the beginning balance and the ending balance are not the same, then a movements analysis must exist in the financial statements.
• If "Buildings" exists, the user would be warned that "Buildings Under Financing Leases, Net" must be disclosed, if it exists.
• If "Buildings" exists, any buildings pledged as security must be disclosed.
• If "Buildings" exists, "Pro Forma Buildings, Net, at Cost" may need to be disclosed.
You get the idea. This is some of the information which a computer application can either autonomously analyze or certainly help the accountant work through the process of ensuring that the required disclosures have been met.
16.12. Extending Taxonomies We have not focused on extending taxonomies thus far. The reason for this is to not introduce too much complexity at the same time. We did add one extension

FINANCIAL REPORTING USING XBRL – IFRS AND US GAAP EDITION (2006-03-01)
© 2006 UBmatrix, Inc 484
concept to our financial highlights, remember "Free Cash Flow" which was not in the IFRS-GP taxonomy, but we needed it, so we defined it.
We will not cover extension taxonomies at this time, perhaps in another version of this book.
These are the types of extensions which you might run into:
• Adding leaf nodes: The need to add a concept which does not exist. For example, if "Airplanes" is not provided as a class of Property, Plant and Equipment, and you have airplanes, then you need to add the concept "Airplanes" via an extension taxonomy. This is a very straight forward task.
• Adding a movement analysis: Let's say that you needed to add "Airplanes", which is a class of Property, Plant and Equipment. Property, Plant and Equipment requires a movement analysis. As such, we need to add a movement analysis for the class "Property, Plant and Equipment", therefore all the concepts which would be involved in that movement analysis. We then have to put concepts added into calculations for total Property, Plant and Equipment, etc.
• Moving Calculation: Let's say that you don’t like the way something adds up in the IFRS-GP taxonomy for some reason. This would likely be rare, but possible. Or, if there is an error. You may need to "rewire" a calculation.
• Inserting a Subtotal: Suppose a taxonomy had the concepts "Trade Receivables" and "Other Receivables". But you wanted to disclose "Trade and Other Receivables" together.
• Changing Labels: Suppose you did not care for a label in the IFRS-GP taxonomy, rather than have "Assets, Non Current", you wanted the label to read "Total Non-Current Assets".
• Adding References: Suppose you felt a reference was omitted from the IFRS-GP taxonomy and you wanted to provide that reference to justify something you did in your financial statement.