15628452 jardine matheson holdings ltd jardine strategic holdings
TRANSCRIPT
Asia Pacific Equity Research 10 December 2009
Jardine Matheson/Jardine Strategic
JARD.SI, JM SP Overweight $29.78
Price Target: $36.00
2010 earnings recovery expected; valuations still look attractive
JSH.SI, JS SP Overweight $17.38
Price Target: $22.21
Hong Kong Singapore Conglomerates & Multi-industry
Steven Li, CFAAC
(852) 2800-8598 [email protected]
J.P. Morgan Securities (Asia Pacific) Limited
Billy Ng, CFA (852) 2800-8597 [email protected]
J.P. Morgan Securities (Asia Pacific) Limited
Joanne Cheung (852) 2800-8596 [email protected]
J.P. Morgan Securities (Asia Pacific) Limited
Christopher Gee, CFA (65) 6882-2345 [email protected]
J.P. Morgan Securities Singapore Private Limited
See page 12 for analyst certification and important disclosures, including non-US analyst disclosures. J.P. Morgan does and seeks to do business with companies covered in its research reports. As a result, investors should be aware that the firm may have a conflict of interest that could affect the objectivity of this report. Investors should consider this report as only a single factor in making their investment decision.
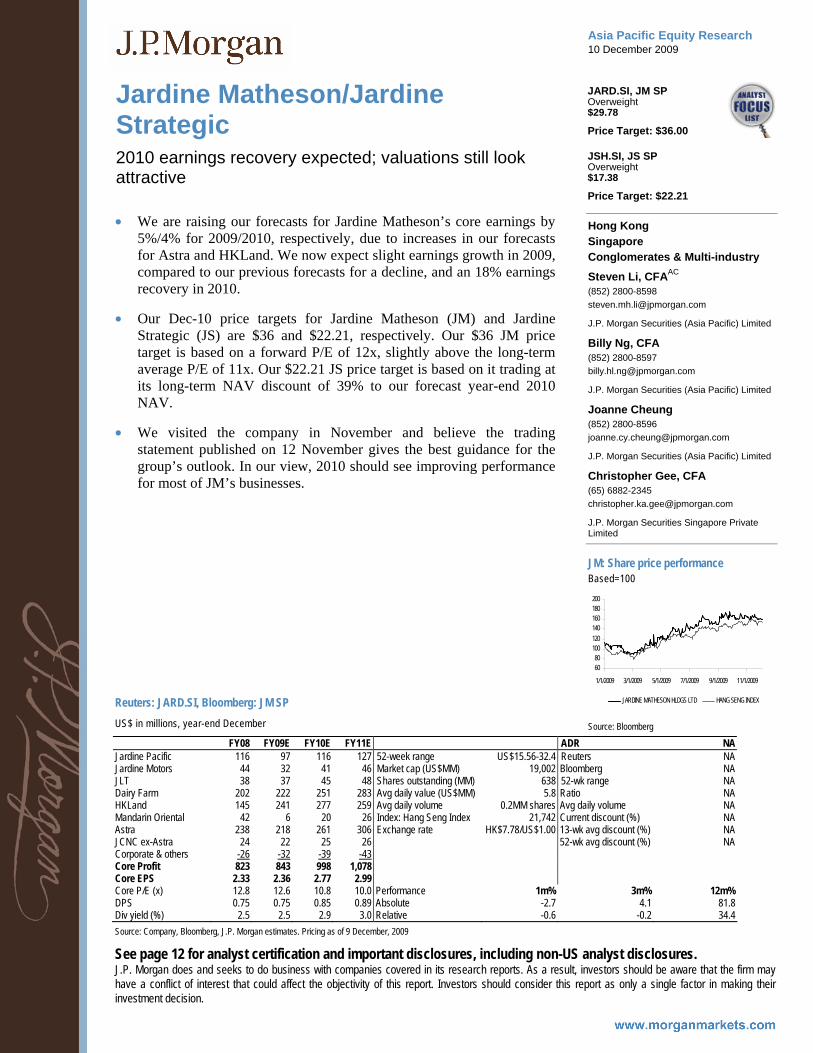
JM: Share price performanceBased=100
6080
100120140160180200
1/1/2009 3/1/2009 5/1/2009 7/1/2009 9/1/2009 11/1/2009
JARDINE MATHESON HLDGS LTD HANG SENG INDEX
Source: Bloomberg
• We are raising our forecasts for Jardine Matheson’s core earnings by 5%/4% for 2009/2010, respectively, due to increases in our forecasts for Astra and HKLand. We now expect slight earnings growth in 2009, compared to our previous forecasts for a decline, and an 18% earnings recovery in 2010.
• Our Dec-10 price targets for Jardine Matheson (JM) and Jardine Strategic (JS) are $36 and $22.21, respectively. Our $36 JM price target is based on a forward P/E of 12x, slightly above the long-term average P/E of 11x. Our $22.21 JS price target is based on it trading at its long-term NAV discount of 39% to our forecast year-end 2010 NAV.
• We visited the company in November and believe the trading statement published on 12 November gives the best guidance for the group’s outlook. In our view, 2010 should see improving performance for most of JM’s businesses.
Reuters: JARD.SI, Bloomberg: JM SP US$ in millions, year-end December
FY08 FY09E FY10E FY11E ADR NAJardine Pacific 116 97 116 127 52-week range US$15.56-32.4 Reuters NAJardine Motors 44 32 41 46 Market cap (US$MM) 19,002 Bloomberg NAJLT 38 37 45 48 Shares outstanding (MM) 638 52-wk range NADairy Farm 202 222 251 283 Avg daily value (US$MM) 5.8 Ratio NAHKLand 145 241 277 259 Avg daily volume 0.2MM shares Avg daily volume NAMandarin Oriental 42 6 20 26 Index: Hang Seng Index 21,742 Current discount (%) NAAstra 238 218 261 306 Exchange rate HK$7.78/US$1.00 13-wk avg discount (%) NAJCNC ex-Astra 24 22 25 26 52-wk avg discount (%) NACorporate & others -26 -32 -39 -43 Core Profit 823 843 998 1,078 Core EPS 2.33 2.36 2.77 2.99 Core P/E (x) 12.8 12.6 10.8 10.0 Performance 1m% 3m% 12m%DPS 0.75 0.75 0.85 0.89 Absolute -2.7 4.1 81.8Div yield (%) 2.5 2.5 2.9 3.0 Relative -0.6 -0.2 34.4Source: Company, Bloomberg, J.P. Morgan estimates. Pricing as of 9 December, 2009
2
Asia Pacific Equity Research 10 December 2009
Steven Li, CFA (852) 2800-8598 [email protected]
Company Description NAV sensitivity metrics (impact on JM’s see-through NAV) impact (%) Share price of DFI
Impact of +5% 1.6% Impact of +10% 3.1% Share price of HKL Impact of +5% 1.4% Impact of +10% 2.8% Share pricesof JCNC Impact of +5% 1.2% Impact of +10% 2.3% Source: Datastream, J.P. Morgan estimates Price target and valuation analysis
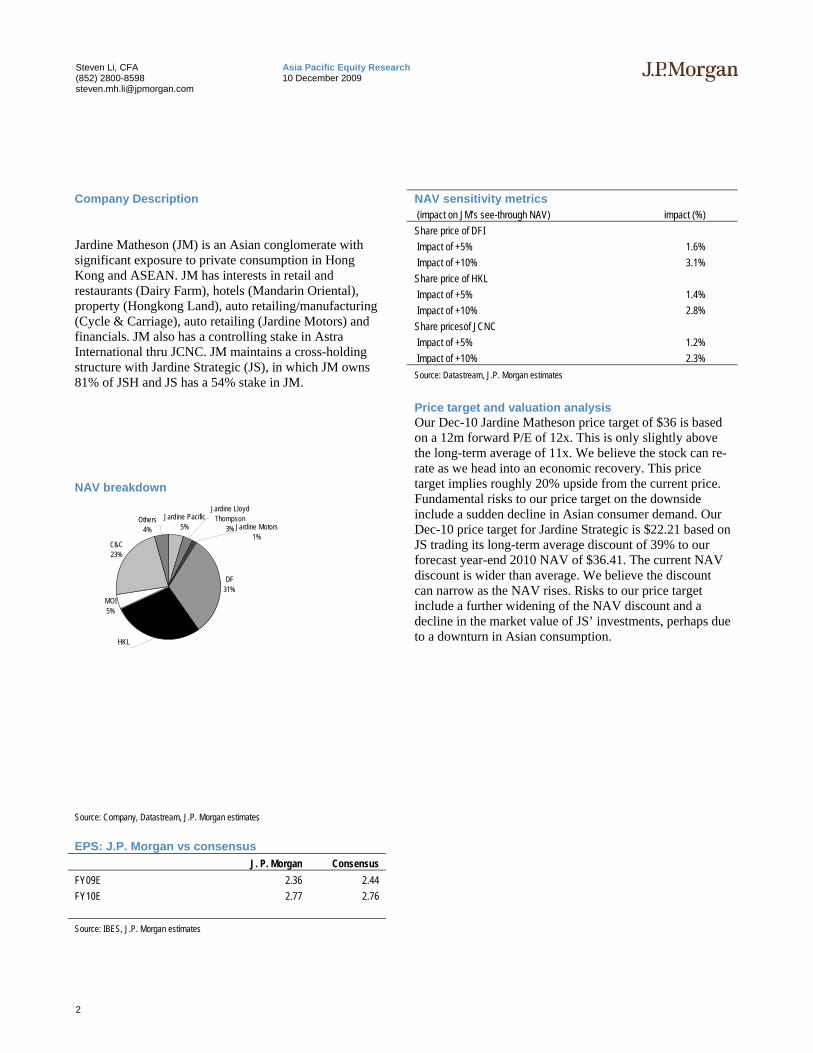
Jardine Matheson (JM) is an Asian conglomerate with significant exposure to private consumption in Hong Kong and ASEAN. JM has interests in retail and restaurants (Dairy Farm), hotels (Mandarin Oriental), property (Hongkong Land), auto retailing/manufacturing (Cycle & Carriage), auto retailing (Jardine Motors) and financials. JM also has a controlling stake in Astra International thru JCNC. JM maintains a cross-holding structure with Jardine Strategic (JS), in which JM owns 81% of JSH and JS has a 54% stake in JM.
NAV breakdown
Jardine Pacific5%
Jardine Lloyd Thompson
3% Jardine Motors1%
Others4%
C&C23%
MOI5%
HKL
DF31%
Our Dec-10 Jardine Matheson price target of $36 is based on a 12m forward P/E of 12x. This is only slightly above the long-term average of 11x. We believe the stock can re-rate as we head into an economic recovery. This price target implies roughly 20% upside from the current price. Fundamental risks to our price target on the downside include a sudden decline in Asian consumer demand. Our Dec-10 price target for Jardine Strategic is $22.21 based on JS trading its long-term average discount of 39% to our forecast year-end 2010 NAV of $36.41. The current NAV discount is wider than average. We believe the discount can narrow as the NAV rises. Risks to our price target include a further widening of the NAV discount and a decline in the market value of JS’ investments, perhaps due to a downturn in Asian consumption.
Source: Company, Datastream, J.P. Morgan estimates EPS: J.P. Morgan vs consensus J. P. Morgan Consensus FY09E 2.36 2.44 FY10E 2.77 2.76 Source: IBES, J.P. Morgan estimates
3
Asia Pacific Equity Research 10 December 2009
Steven Li, CFA (852) 2800-8598 [email protected]
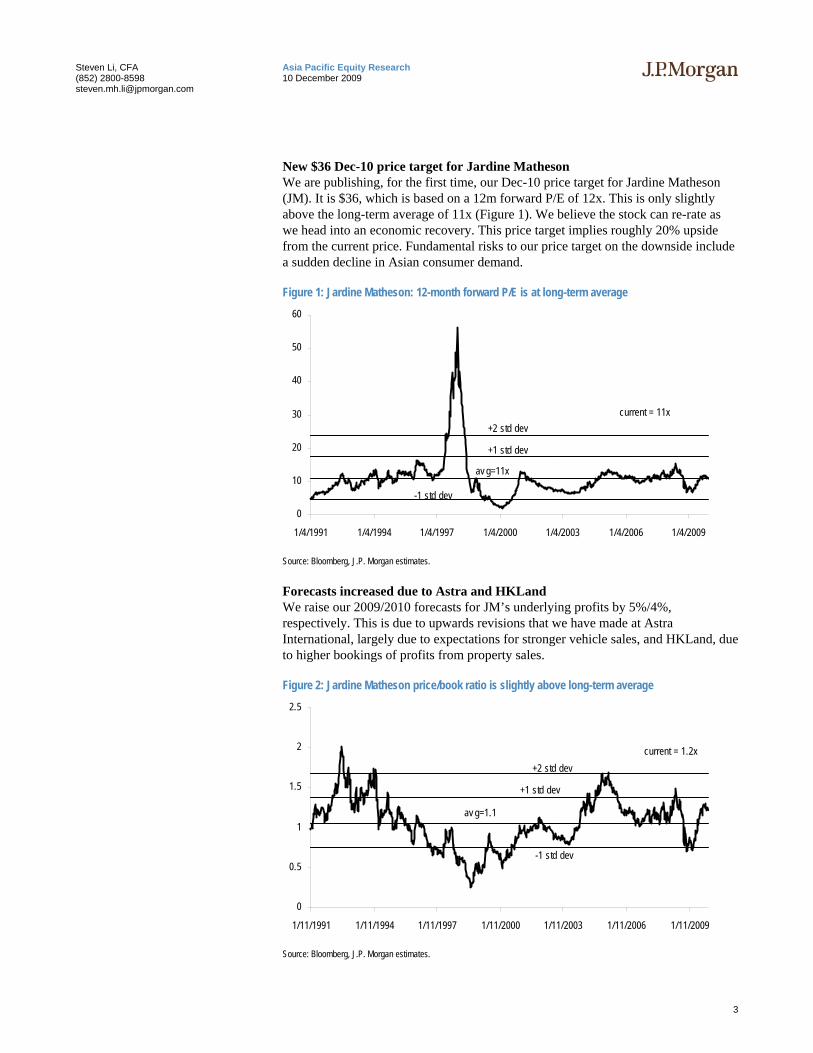
New $36 Dec-10 price target for Jardine Matheson We are publishing, for the first time, our Dec-10 price target for Jardine Matheson (JM). It is $36, which is based on a 12m forward P/E of 12x. This is only slightly above the long-term average of 11x (Figure 1). We believe the stock can re-rate as we head into an economic recovery. This price target implies roughly 20% upside from the current price. Fundamental risks to our price target on the downside include a sudden decline in Asian consumer demand.
Figure 1: Jardine Matheson: 12-month forward P/E is at long-term average
0
10
20
30
40
50
60
1/4/1991 1/4/1994 1/4/1997 1/4/2000 1/4/2003 1/4/2006 1/4/2009
current = 11x
av g=11x
+1 std dev
+2 std dev
-1 std dev
Source: Bloomberg, J.P. Morgan estimates.
Forecasts increased due to Astra and HKLand We raise our 2009/2010 forecasts for JM’s underlying profits by 5%/4%, respectively. This is due to upwards revisions that we have made at Astra International, largely due to expectations for stronger vehicle sales, and HKLand, due to higher bookings of profits from property sales.
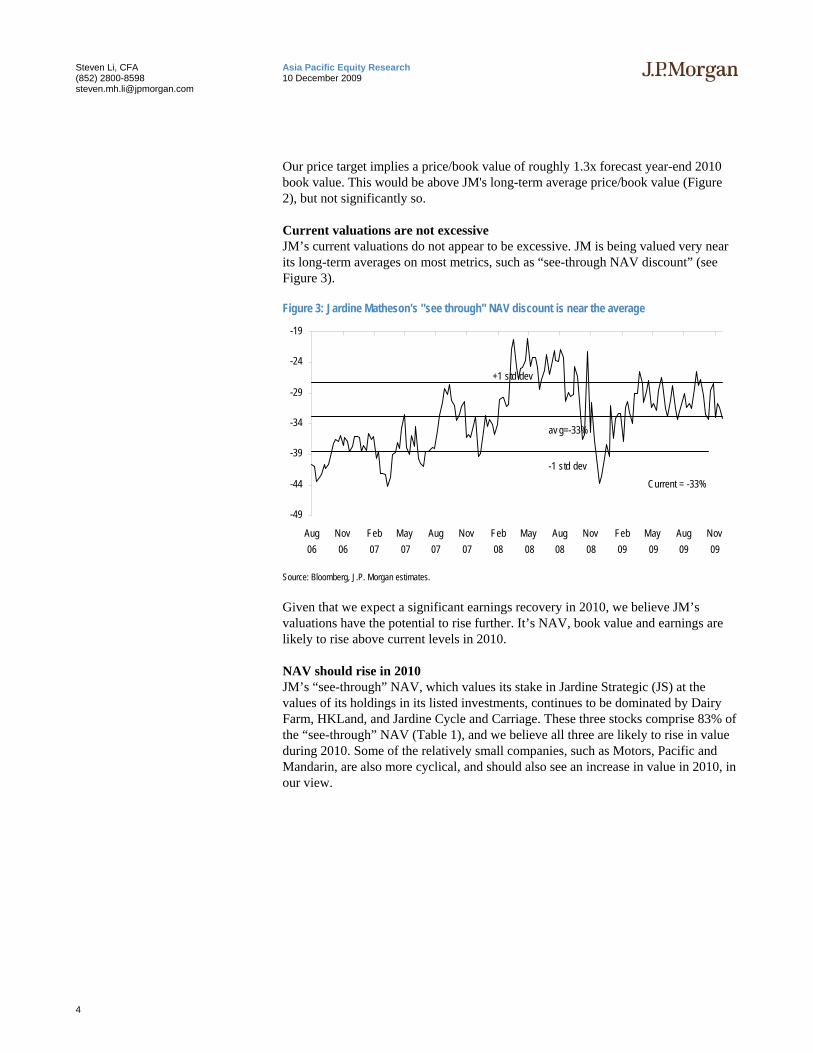
Figure 2: Jardine Matheson price/book ratio is slightly above long-term average
0
0.5
1
1.5
2
2.5
1/11/1991 1/11/1994 1/11/1997 1/11/2000 1/11/2003 1/11/2006 1/11/2009
current = 1.2x
av g=1.1
+1 std dev
+2 std dev
-1 std dev
Source: Bloomberg, J.P. Morgan estimates.
4
Asia Pacific Equity Research 10 December 2009
Steven Li, CFA (852) 2800-8598 [email protected]
Our price target implies a price/book value of roughly 1.3x forecast year-end 2010 book value. This would be above JM's long-term average price/book value (Figure 2), but not significantly so.
Current valuations are not excessive JM’s current valuations do not appear to be excessive. JM is being valued very near its long-term averages on most metrics, such as “see-through NAV discount” (see Figure 3).
Figure 3: Jardine Matheson's "see through" NAV discount is near the average
-49
-44
-39
-34
-29
-24
-19
Aug06
Nov06
Feb07
May07
Aug07
Nov07
Feb08
May08
Aug08
Nov08
Feb09
May09
Aug09
Nov09
av g=-33%
-1 std dev
+1 std dev
Current = -33%
Source: Bloomberg, J.P. Morgan estimates.
Given that we expect a significant earnings recovery in 2010, we believe JM’s valuations have the potential to rise further. It’s NAV, book value and earnings are likely to rise above current levels in 2010.
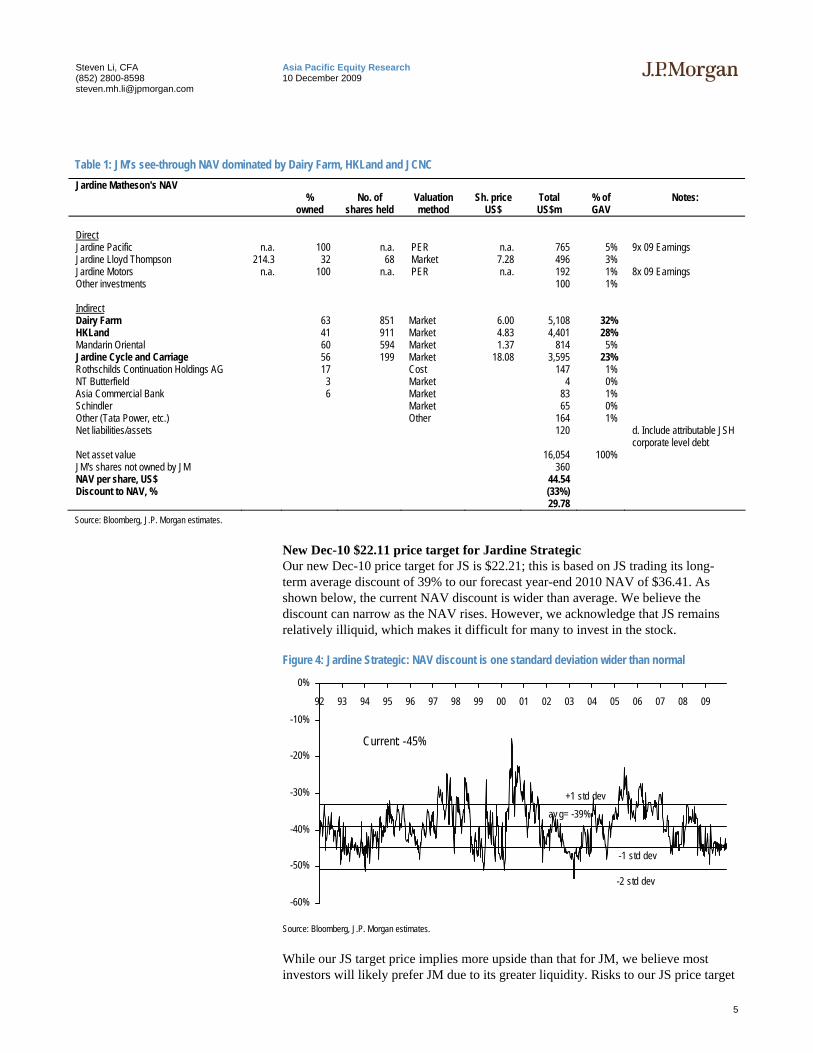
NAV should rise in 2010 JM’s “see-through” NAV, which values its stake in Jardine Strategic (JS) at the values of its holdings in its listed investments, continues to be dominated by Dairy Farm, HKLand, and Jardine Cycle and Carriage. These three stocks comprise 83% of the “see-through” NAV (Table 1), and we believe all three are likely to rise in value during 2010. Some of the relatively small companies, such as Motors, Pacific and Mandarin, are also more cyclical, and should also see an increase in value in 2010, in our view.
5
Asia Pacific Equity Research 10 December 2009
Steven Li, CFA (852) 2800-8598 [email protected]
Table 1: JM’s see-through NAV dominated by Dairy Farm, HKLand and JCNC Jardine Matheson's NAV
% No. of Valuation Sh. price Total % of Notes: owned shares held method US$ US$m GAV
Direct Jardine Pacific n.a. 100 n.a. PER n.a. 765 5% 9x 09 Earnings Jardine Lloyd Thompson 214.3 32 68 Market 7.28 496 3% Jardine Motors n.a. 100 n.a. PER n.a. 192 1% 8x 09 Earnings Other investments 100 1%
Indirect Dairy Farm 63 851 Market 6.00 5,108 32% HKLand 41 911 Market 4.83 4,401 28% Mandarin Oriental 60 594 Market 1.37 814 5% Jardine Cycle and Carriage 56 199 Market 18.08 3,595 23% Rothschilds Continuation Holdings AG 17 Cost 147 1% NT Butterfield 3 Market 4 0% Asia Commercial Bank 6 Market 83 1% Schindler Market 65 0% Other (Tata Power, etc.) Other 164 1% Net liabilities/assets 120 d. Include attributable JSH
corporate level debt Net asset value 16,054 100% JM's shares not owned by JM 360 NAV per share, US$ 44.54 Discount to NAV, % (33%)
29.78 Source: Bloomberg, J.P. Morgan estimates.
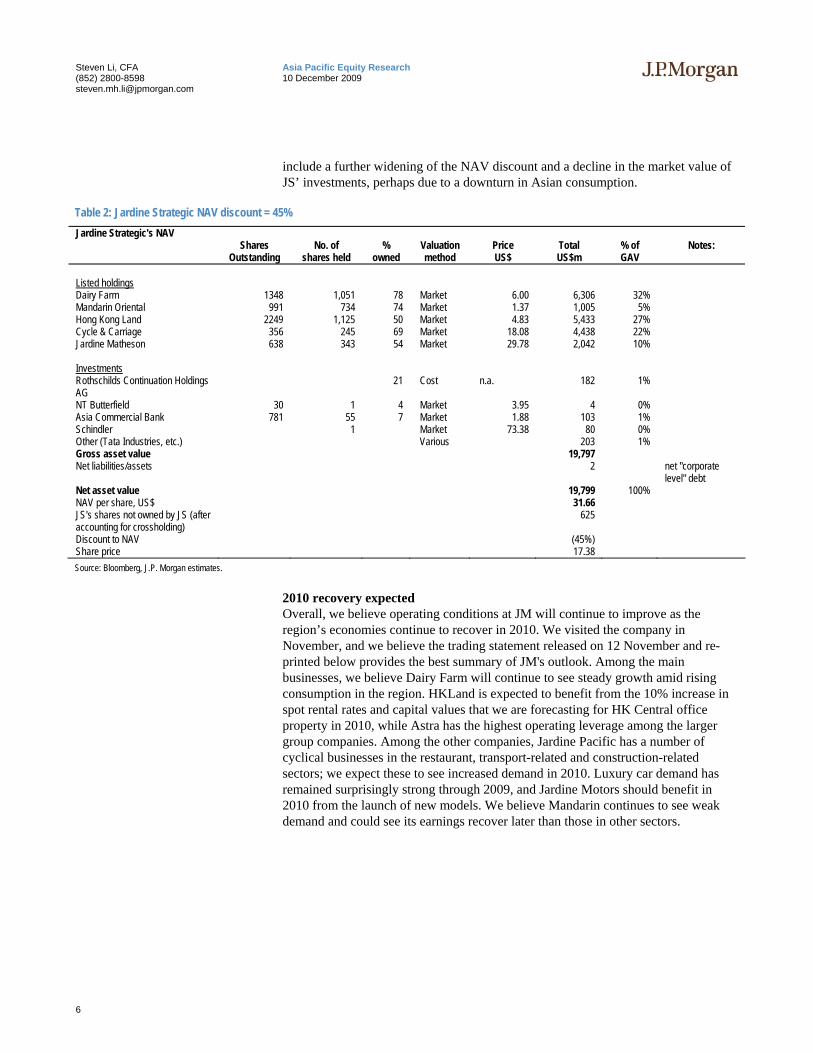
New Dec-10 $22.11 price target for Jardine Strategic Our new Dec-10 price target for JS is $22.21; this is based on JS trading its long-term average discount of 39% to our forecast year-end 2010 NAV of $36.41. As shown below, the current NAV discount is wider than average. We believe the discount can narrow as the NAV rises. However, we acknowledge that JS remains relatively illiquid, which makes it difficult for many to invest in the stock.
Figure 4: Jardine Strategic: NAV discount is one standard deviation wider than normal
-60%
-50%
-40%
-30%
-20%
-10%
0%
92 93 94 95 96 97 98 99 00 01 02 03 04 05 06 07 08 09
av g= -39%
Current: -45%
+1 std dev
-1 std dev
-2 std dev
Source: Bloomberg, J.P. Morgan estimates.
While our JS target price implies more upside than that for JM, we believe most investors will likely prefer JM due to its greater liquidity. Risks to our JS price target
6
Asia Pacific Equity Research 10 December 2009
Steven Li, CFA (852) 2800-8598 [email protected]
include a further widening of the NAV discount and a decline in the market value of JS’ investments, perhaps due to a downturn in Asian consumption.
Table 2: Jardine Strategic NAV discount = 45% Jardine Strategic's NAV
Shares No. of % Valuation Price Total % of Notes: Outstanding shares held owned method US$ US$m GAV
Listed holdings Dairy Farm 1348 1,051 78 Market 6.00 6,306 32% Mandarin Oriental 991 734 74 Market 1.37 1,005 5% Hong Kong Land 2249 1,125 50 Market 4.83 5,433 27% Cycle & Carriage 356 245 69 Market 18.08 4,438 22% Jardine Matheson 638 343 54 Market 29.78 2,042 10%
Investments Rothschilds Continuation Holdings AG
21 Cost n.a. 182 1%
NT Butterfield 30 1 4 Market 3.95 4 0% Asia Commercial Bank 781 55 7 Market 1.88 103 1% Schindler 1 Market 73.38 80 0% Other (Tata Industries, etc.) Various 203 1% Gross asset value 19,797 Net liabilities/assets 2 net "corporate
level" debt Net asset value 19,799 100% NAV per share, US$ 31.66 JS's shares not owned by JS (after accounting for crossholding)
625
Discount to NAV (45%) Share price 17.38 Source: Bloomberg, J.P. Morgan estimates.
2010 recovery expected Overall, we believe operating conditions at JM will continue to improve as the region’s economies continue to recover in 2010. We visited the company in November, and we believe the trading statement released on 12 November and re-printed below provides the best summary of JM's outlook. Among the main businesses, we believe Dairy Farm will continue to see steady growth amid rising consumption in the region. HKLand is expected to benefit from the 10% increase in spot rental rates and capital values that we are forecasting for HK Central office property in 2010, while Astra has the highest operating leverage among the larger group companies. Among the other companies, Jardine Pacific has a number of cyclical businesses in the restaurant, transport-related and construction-related sectors; we expect these to see increased demand in 2010. Luxury car demand has remained surprisingly strong through 2009, and Jardine Motors should benefit in 2010 from the launch of new models. We believe Mandarin continues to see weak demand and could see its earnings recover later than those in other sectors.
7
Asia Pacific Equity Research 10 December 2009
Steven Li, CFA (852) 2800-8598 [email protected]
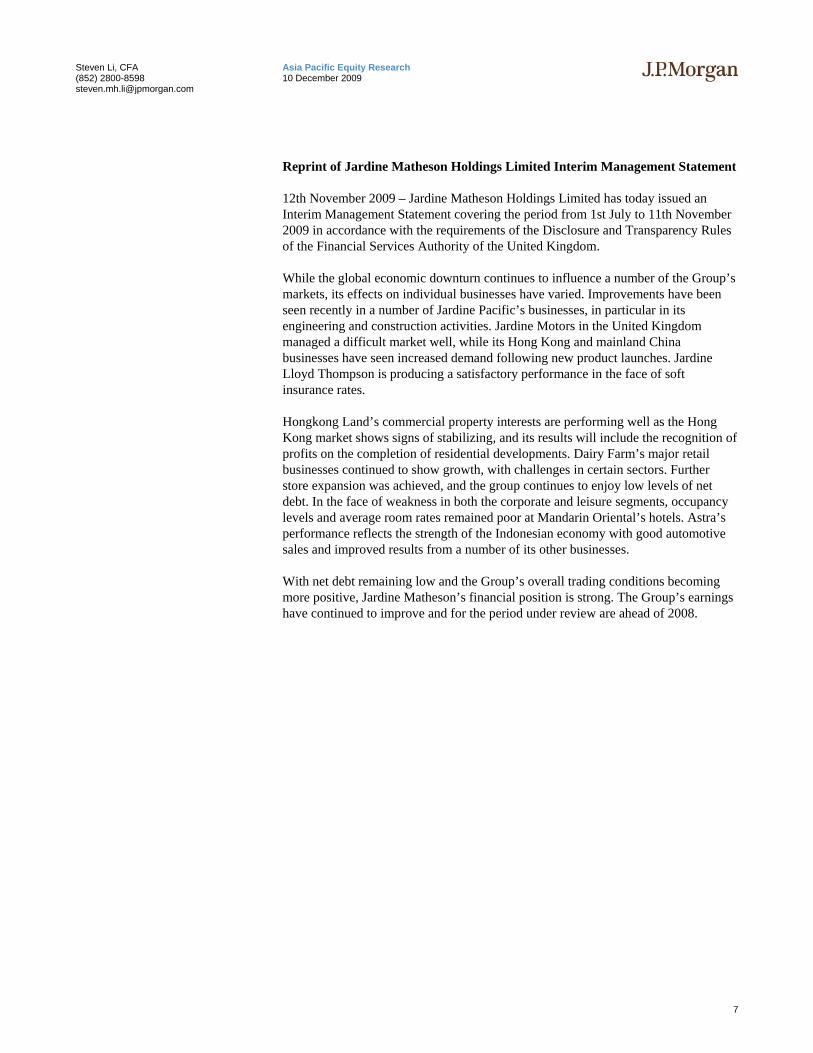
Reprint of Jardine Matheson Holdings Limited Interim Management Statement
12th November 2009 – Jardine Matheson Holdings Limited has today issued an Interim Management Statement covering the period from 1st July to 11th November 2009 in accordance with the requirements of the Disclosure and Transparency Rules of the Financial Services Authority of the United Kingdom.
While the global economic downturn continues to influence a number of the Group’s markets, its effects on individual businesses have varied. Improvements have been seen recently in a number of Jardine Pacific’s businesses, in particular in its engineering and construction activities. Jardine Motors in the United Kingdom managed a difficult market well, while its Hong Kong and mainland China businesses have seen increased demand following new product launches. Jardine Lloyd Thompson is producing a satisfactory performance in the face of soft insurance rates.
Hongkong Land’s commercial property interests are performing well as the Hong Kong market shows signs of stabilizing, and its results will include the recognition of profits on the completion of residential developments. Dairy Farm’s major retail businesses continued to show growth, with challenges in certain sectors. Further store expansion was achieved, and the group continues to enjoy low levels of net debt. In the face of weakness in both the corporate and leisure segments, occupancy levels and average room rates remained poor at Mandarin Oriental’s hotels. Astra’s performance reflects the strength of the Indonesian economy with good automotive sales and improved results from a number of its other businesses.
With net debt remaining low and the Group’s overall trading conditions becoming more positive, Jardine Matheson’s financial position is strong. The Group’s earnings have continued to improve and for the period under review are ahead of 2008.
8
Asia Pacific Equity Research 10 December 2009
Steven Li, CFA (852) 2800-8598 [email protected]
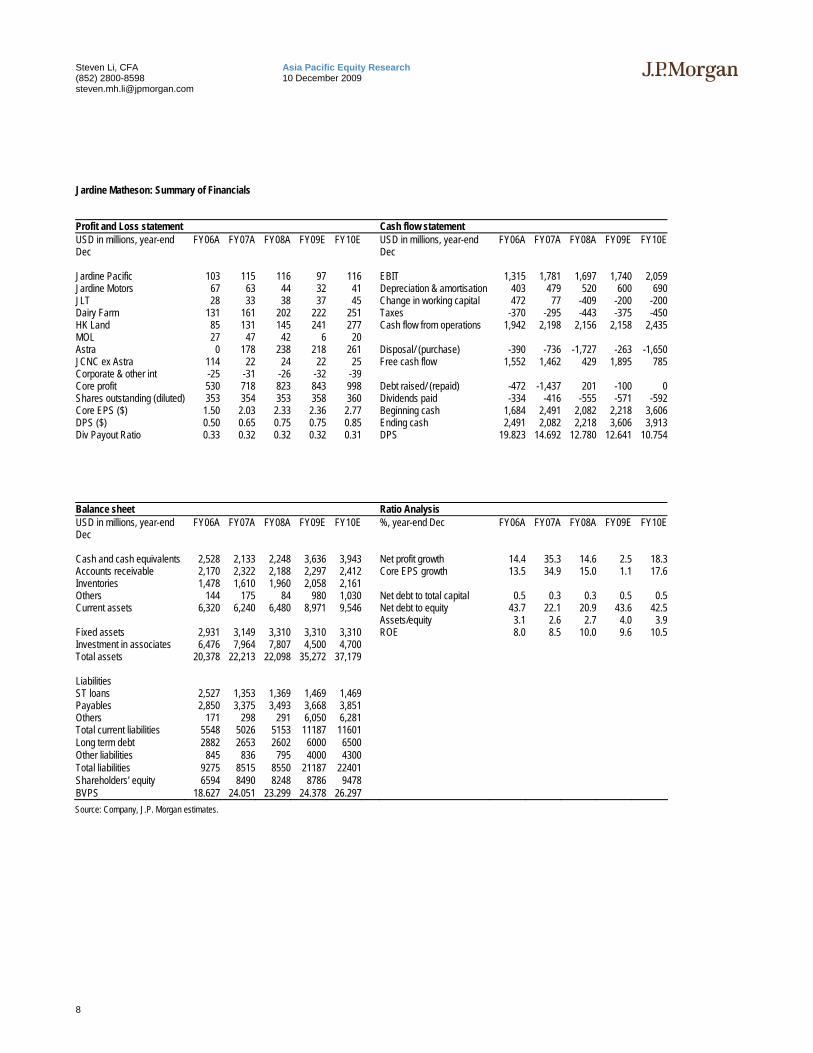
Jardine Matheson: Summary of Financials
Profit and Loss statement Cash flow statement USD in millions, year-end Dec
FY06A FY07A FY08A FY09E FY10E USD in millions, year-end Dec
FY06A FY07A FY08A FY09E FY10E
Jardine Pacific 103 115 116 97 116 EBIT 1,315 1,781 1,697 1,740 2,059Jardine Motors 67 63 44 32 41 Depreciation & amortisation 403 479 520 600 690JLT 28 33 38 37 45 Change in working capital 472 77 -409 -200 -200Dairy Farm 131 161 202 222 251 Taxes -370 -295 -443 -375 -450HK Land 85 131 145 241 277 Cash flow from operations 1,942 2,198 2,156 2,158 2,435MOL 27 47 42 6 20 Astra 0 178 238 218 261 Disposal/ (purchase) -390 -736 -1,727 -263 -1,650JCNC ex Astra 114 22 24 22 25 Free cash flow 1,552 1,462 429 1,895 785Corporate & other int -25 -31 -26 -32 -39 Core profit 530 718 823 843 998 Debt raised/ (repaid) -472 -1,437 201 -100 0Shares outstanding (diluted) 353 354 353 358 360 Dividends paid -334 -416 -555 -571 -592Core EPS ($) 1.50 2.03 2.33 2.36 2.77 Beginning cash 1,684 2,491 2,082 2,218 3,606DPS ($) 0.50 0.65 0.75 0.75 0.85 Ending cash 2,491 2,082 2,218 3,606 3,913Div Payout Ratio 0.33 0.32 0.32 0.32 0.31 DPS 19.823 14.692 12.780 12.641 10.754 Balance sheet Ratio Analysis USD in millions, year-end Dec
FY06A FY07A FY08A FY09E FY10E %, year-end Dec FY06A FY07A FY08A FY09E FY10E
Cash and cash equivalents 2,528 2,133 2,248 3,636 3,943 Net profit growth 14.4 35.3 14.6 2.5 18.3Accounts receivable 2,170 2,322 2,188 2,297 2,412 Core EPS growth 13.5 34.9 15.0 1.1 17.6Inventories 1,478 1,610 1,960 2,058 2,161 Others 144 175 84 980 1,030 Net debt to total capital 0.5 0.3 0.3 0.5 0.5Current assets 6,320 6,240 6,480 8,971 9,546 Net debt to equity 43.7 22.1 20.9 43.6 42.5 Assets/equity 3.1 2.6 2.7 4.0 3.9Fixed assets 2,931 3,149 3,310 3,310 3,310 ROE 8.0 8.5 10.0 9.6 10.5Investment in associates 6,476 7,964 7,807 4,500 4,700 Total assets 20,378 22,213 22,098 35,272 37,179 Liabilities ST loans 2,527 1,353 1,369 1,469 1,469 Payables 2,850 3,375 3,493 3,668 3,851 Others 171 298 291 6,050 6,281 Total current liabilities 5548 5026 5153 11187 11601 Long term debt 2882 2653 2602 6000 6500 Other liabilities 845 836 795 4000 4300 Total liabilities 9275 8515 8550 21187 22401 Shareholders' equity 6594 8490 8248 8786 9478 BVPS 18.627 24.051 23.299 24.378 26.297 Source: Company, J.P. Morgan estimates.
9
Asia Pacific Equity Research 10 December 2009
Steven Li, CFA (852) 2800-8598 [email protected]
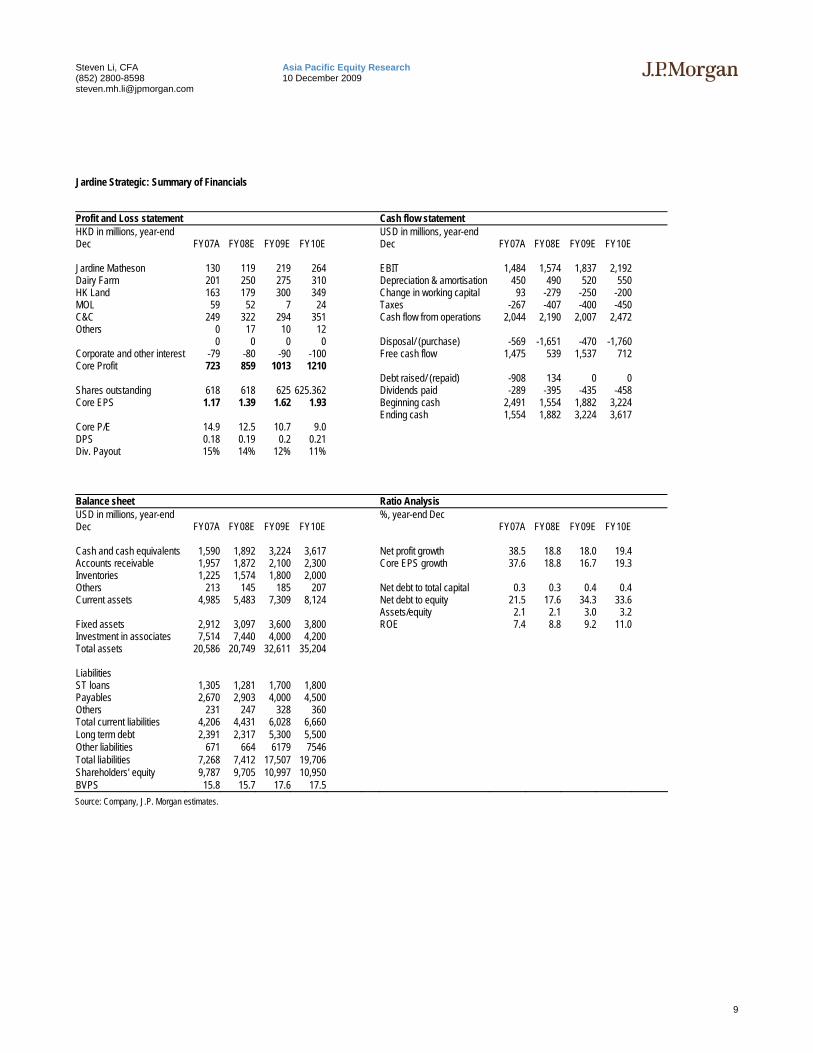
Jardine Strategic: Summary of Financials
Profit and Loss statement Cash flow statement HKD in millions, year-end Dec FY07A FY08E FY09E FY10E
USD in millions, year-end Dec FY07A FY08E FY09E FY10E
Jardine Matheson 130 119 219 264 EBIT 1,484 1,574 1,837 2,192 Dairy Farm 201 250 275 310 Depreciation & amortisation 450 490 520 550 HK Land 163 179 300 349 Change in working capital 93 -279 -250 -200 MOL 59 52 7 24 Taxes -267 -407 -400 -450 C&C 249 322 294 351 Cash flow from operations 2,044 2,190 2,007 2,472 Others 0 17 10 12 0 0 0 0 Disposal/ (purchase) -569 -1,651 -470 -1,760 Corporate and other interest -79 -80 -90 -100 Free cash flow 1,475 539 1,537 712 Core Profit 723 859 1013 1210 Debt raised/ (repaid) -908 134 0 0 Shares outstanding 618 618 625 625.362 Dividends paid -289 -395 -435 -458 Core EPS 1.17 1.39 1.62 1.93 Beginning cash 2,491 1,554 1,882 3,224 Ending cash 1,554 1,882 3,224 3,617 Core P/E 14.9 12.5 10.7 9.0 DPS 0.18 0.19 0.2 0.21 Div. Payout 15% 14% 12% 11% Balance sheet Ratio Analysis USD in millions, year-end Dec FY07A FY08E FY09E FY10E
%, year-end Dec FY07A FY08E FY09E FY10E
Cash and cash equivalents 1,590 1,892 3,224 3,617 Net profit growth 38.5 18.8 18.0 19.4 Accounts receivable 1,957 1,872 2,100 2,300 Core EPS growth 37.6 18.8 16.7 19.3 Inventories 1,225 1,574 1,800 2,000 Others 213 145 185 207 Net debt to total capital 0.3 0.3 0.4 0.4 Current assets 4,985 5,483 7,309 8,124 Net debt to equity 21.5 17.6 34.3 33.6 Assets/equity 2.1 2.1 3.0 3.2 Fixed assets 2,912 3,097 3,600 3,800 ROE 7.4 8.8 9.2 11.0 Investment in associates 7,514 7,440 4,000 4,200 Total assets 20,586 20,749 32,611 35,204 Liabilities ST loans 1,305 1,281 1,700 1,800 Payables 2,670 2,903 4,000 4,500 Others 231 247 328 360 Total current liabilities 4,206 4,431 6,028 6,660 Long term debt 2,391 2,317 5,300 5,500 Other liabilities 671 664 6179 7546 Total liabilities 7,268 7,412 17,507 19,706 Shareholders' equity 9,787 9,705 10,997 10,950 BVPS 15.8 15.7 17.6 17.5 Source: Company, J.P. Morgan estimates.
10
Asia Pacific Equity Research 10 December 2009
Steven Li, CFA (852) 2800-8598 [email protected]
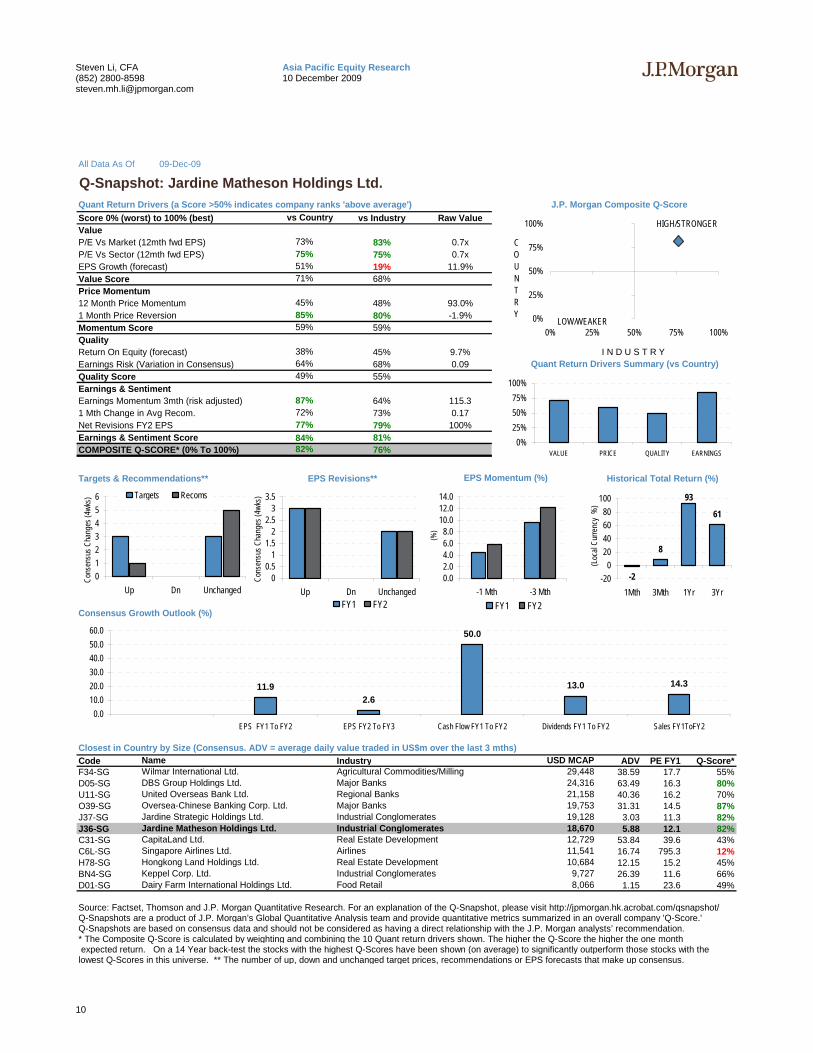
All Data As Of 09-Dec-09
Quant Return Drivers (a Score >50% indicates company ranks 'above average') J.P. Morgan Composite Q-ScoreScore 0% (worst) to 100% (best) vs Industry Raw ValueValueP/E Vs Market (12mth fwd EPS) 83% 0.7xP/E Vs Sector (12mth fwd EPS) 75% 0.7xEPS Growth (forecast) 19% 11.9%Value Score 68%Price Momentum12 Month Price Momentum 48% 93.0%1 Month Price Reversion 80% -1.9%Momentum Score 59%QualityReturn On Equity (forecast) 45% 9.7%Earnings Risk (Variation in Consensus) 68% 0.09 Quant Return Drivers Summary (vs Country)Quality Score 55%Earnings & SentimentEarnings Momentum 3mth (risk adjusted) 64% 115.31 Mth Change in Avg Recom. 73% 0.17Net Revisions FY2 EPS 79% 100%Earnings & Sentiment Score 81%COMPOSITE Q-SCORE* (0% To 100%) 76%
Targets & Recommendations** EPS Revisions** Historical Total Return (%)
Consensus Growth Outlook (%)
Closest in Country by Size (Consensus. ADV = average daily value traded in US$m over the last 3 mths)Code Industry ADV PE FY1 Q-Score*F34-SG 38.59 17.7 55%D05-SG 63.49 16.3 80%U11-SG 40.36 16.2 70%O39-SG 31.31 14.5 87%J37-SG 3.03 11.3 82%J36-SG 5.88 12.1 82%C31-SG 53.84 39.6 43%C6L-SG 16.74 795.3 12%H78-SG 12.15 15.2 45%BN4-SG 26.39 11.6 66%D01-SG 1.15 23.6 49%
Source: Factset, Thomson and J.P. Morgan Quantitative Research. For an explanation of the Q-Snapshot, please visit http://jpmorgan.hk.acrobat.com/qsnapshot/Q-Snapshots are a product of J.P. Morgan’s Global Quantitative Analysis team and provide quantitative metrics summarized in an overall company 'Q-Score.'Q-Snapshots are based on consensus data and should not be considered as having a direct relationship with the J.P. Morgan analysts’ recommendation. * The Composite Q-Score is calculated by weighting and combining the 10 Quant return drivers shown. The higher the Q-Score the higher the one month expected return. On a 14 Year back-test the stocks with the highest Q-Scores have been shown (on average) to significantly outperform those stocks with the lowest Q-Scores in this universe. ** The number of up, down and unchanged target prices, recommendations or EPS forecasts that make up consensus.
Major BanksIndustrial ConglomeratesIndustrial Conglomerates
72%
Name
Jardine Strategic Holdings Ltd.
vs Country
75%73%
71%
45%85%59%
51%
Food Retail
84%
DBS Group Holdings Ltd.United Overseas Bank Ltd.
CapitaLand Ltd.Singapore Airlines Ltd.
Oversea-Chinese Banking Corp. Ltd.
Industrial ConglomeratesDairy Farm International Holdings Ltd.
19,128
12,729
10,68411,541
9,7278,066
AirlinesReal Estate Development
18,670
Hongkong Land Holdings Ltd.Keppel Corp. Ltd.
Wilmar International Ltd.
82%
Jardine Matheson Holdings Ltd.
49%
38%64%
21,158
87%
77%
Agricultural Commodities/MillingMajor BanksRegional Banks
USD MCAP
Real Estate Development
Q-Snapshot: Jardine Matheson Holdings Ltd.
EPS Momentum (%)
I N D U S T R Y
19,753
29,44824,316
-2
8
93
61
-200
20406080
100
1Mth 3Mth 1Yr 3Yr(L
ocal
Curre
ncy
%)
0123456
Up Dn Unchanged
Cons
ensu
s Cha
nges
(4wk
s) Targets Recoms
00.5
11.5
22.5
33.5
Up Dn Unchanged
Cons
ensu
s Cha
nges
(4wk
s)
FY1 FY2
0.02.04.06.08.0
10.012.014.0
-1 Mth -3 Mth
(%)
FY1 FY2
HIGH/STRONGER
0%
25%
50%
75%
100%
0% 25% 50% 75% 100%LOW/WEAKER
COUNTRY
11.92.6
50.0
13.0 14.3
0.010.020.030.040.050.060.0
EPS FY1 To FY2 EPS FY2 To FY3 Cash Flow FY1 To FY2 Dividends FY1 To FY2 Sales FY1ToFY2
0%25%50%75%
100%
VALUE PRICE QUALITY EARNINGS
11
Asia Pacific Equity Research 10 December 2009
Steven Li, CFA (852) 2800-8598 [email protected]
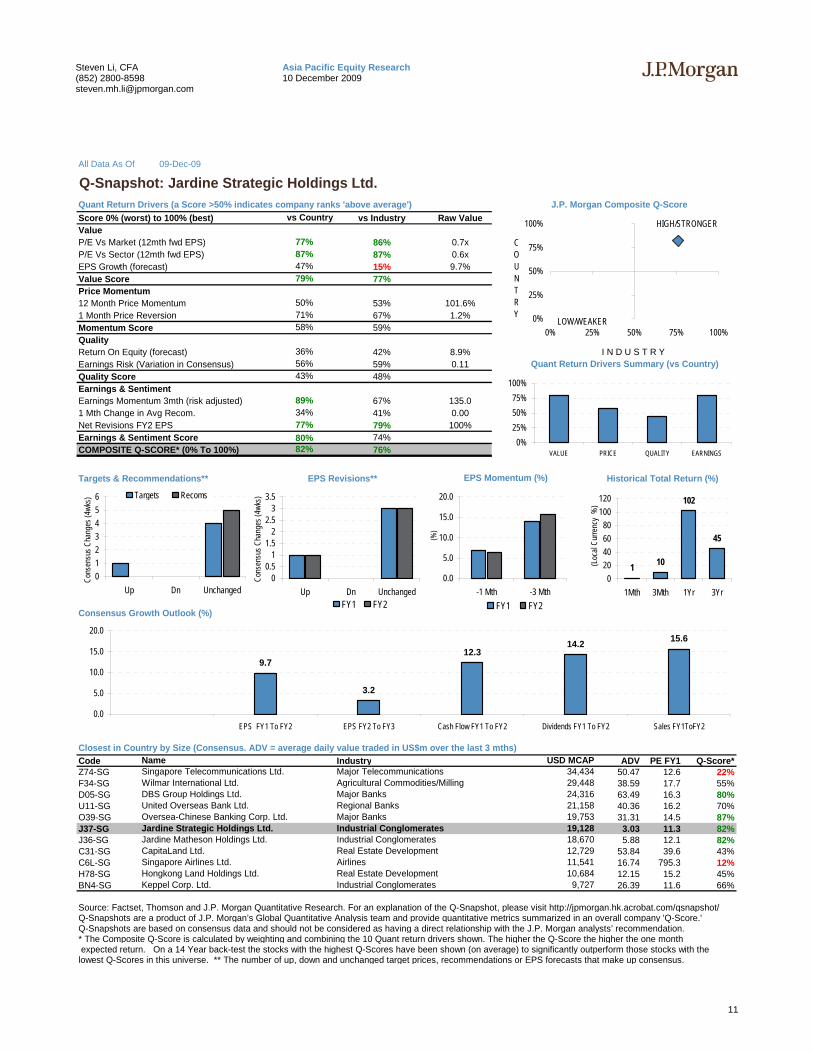
All Data As Of 09-Dec-09
Quant Return Drivers (a Score >50% indicates company ranks 'above average') J.P. Morgan Composite Q-ScoreScore 0% (worst) to 100% (best) vs Industry Raw ValueValueP/E Vs Market (12mth fwd EPS) 86% 0.7xP/E Vs Sector (12mth fwd EPS) 87% 0.6xEPS Growth (forecast) 15% 9.7%Value Score 77%Price Momentum12 Month Price Momentum 53% 101.6%1 Month Price Reversion 67% 1.2%Momentum Score 59%QualityReturn On Equity (forecast) 42% 8.9%Earnings Risk (Variation in Consensus) 59% 0.11 Quant Return Drivers Summary (vs Country)Quality Score 48%Earnings & SentimentEarnings Momentum 3mth (risk adjusted) 67% 135.01 Mth Change in Avg Recom. 41% 0.00Net Revisions FY2 EPS 79% 100%Earnings & Sentiment Score 74%COMPOSITE Q-SCORE* (0% To 100%) 76%
Targets & Recommendations** EPS Revisions** Historical Total Return (%)
Consensus Growth Outlook (%)
Closest in Country by Size (Consensus. ADV = average daily value traded in US$m over the last 3 mths)Code Industry ADV PE FY1 Q-Score*Z74-SG 50.47 12.6 22%F34-SG 38.59 17.7 55%D05-SG 63.49 16.3 80%U11-SG 40.36 16.2 70%O39-SG 31.31 14.5 87%J37-SG 3.03 11.3 82%J36-SG 5.88 12.1 82%C31-SG 53.84 39.6 43%C6L-SG 16.74 795.3 12%H78-SG 12.15 15.2 45%BN4-SG 26.39 11.6 66%
Source: Factset, Thomson and J.P. Morgan Quantitative Research. For an explanation of the Q-Snapshot, please visit http://jpmorgan.hk.acrobat.com/qsnapshot/Q-Snapshots are a product of J.P. Morgan’s Global Quantitative Analysis team and provide quantitative metrics summarized in an overall company 'Q-Score.'Q-Snapshots are based on consensus data and should not be considered as having a direct relationship with the J.P. Morgan analysts’ recommendation. * The Composite Q-Score is calculated by weighting and combining the 10 Quant return drivers shown. The higher the Q-Score the higher the one month expected return. On a 14 Year back-test the stocks with the highest Q-Scores have been shown (on average) to significantly outperform those stocks with the lowest Q-Scores in this universe. ** The number of up, down and unchanged target prices, recommendations or EPS forecasts that make up consensus.
Regional BanksMajor BanksIndustrial Conglomerates
34%
Name
Oversea-Chinese Banking Corp. Ltd.
vs Country
87%77%
79%
50%71%58%
47%
Industrial Conglomerates
80%
Wilmar International Ltd.DBS Group Holdings Ltd.
Jardine Matheson Holdings Ltd.CapitaLand Ltd.
United Overseas Bank Ltd.
Real Estate DevelopmentKeppel Corp. Ltd.
19,753
18,670
11,54112,729
10,6849,727
Real Estate DevelopmentIndustrial Conglomerates
19,128
Singapore Airlines Ltd.Hongkong Land Holdings Ltd.
Singapore Telecommunications Ltd.
82%
Jardine Strategic Holdings Ltd.
43%
36%56%
24,316
89%
77%
Major TelecommunicationsAgricultural Commodities/MillingMajor Banks
USD MCAP
Airlines
Q-Snapshot: Jardine Strategic Holdings Ltd.
EPS Momentum (%)
I N D U S T R Y
21,158
34,43429,448
1 10
102
45
020406080
100120
1Mth 3Mth 1Yr 3Yr(L
ocal
Curre
ncy
%)
0123456
Up Dn Unchanged
Cons
ensu
s Cha
nges
(4wk
s) Targets Recoms
00.5
11.5
22.5
33.5
Up Dn Unchanged
Cons
ensu
s Cha
nges
(4wk
s)
FY1 FY2
0.0
5.0
10.0
15.0
20.0
-1 Mth -3 Mth
(%)
FY1 FY2
HIGH/STRONGER
0%
25%
50%
75%
100%
0% 25% 50% 75% 100%LOW/WEAKER
COUNTRY
9.7
3.2
12.314.2 15.6
0.0
5.0
10.0
15.0
20.0
EPS FY1 To FY2 EPS FY2 To FY3 Cash Flow FY1 To FY2 Dividends FY1 To FY2 Sales FY1ToFY2
0%25%50%75%
100%
VALUE PRICE QUALITY EARNINGS
12
Asia Pacific Equity Research 10 December 2009
Steven Li, CFA (852) 2800-8598 [email protected]
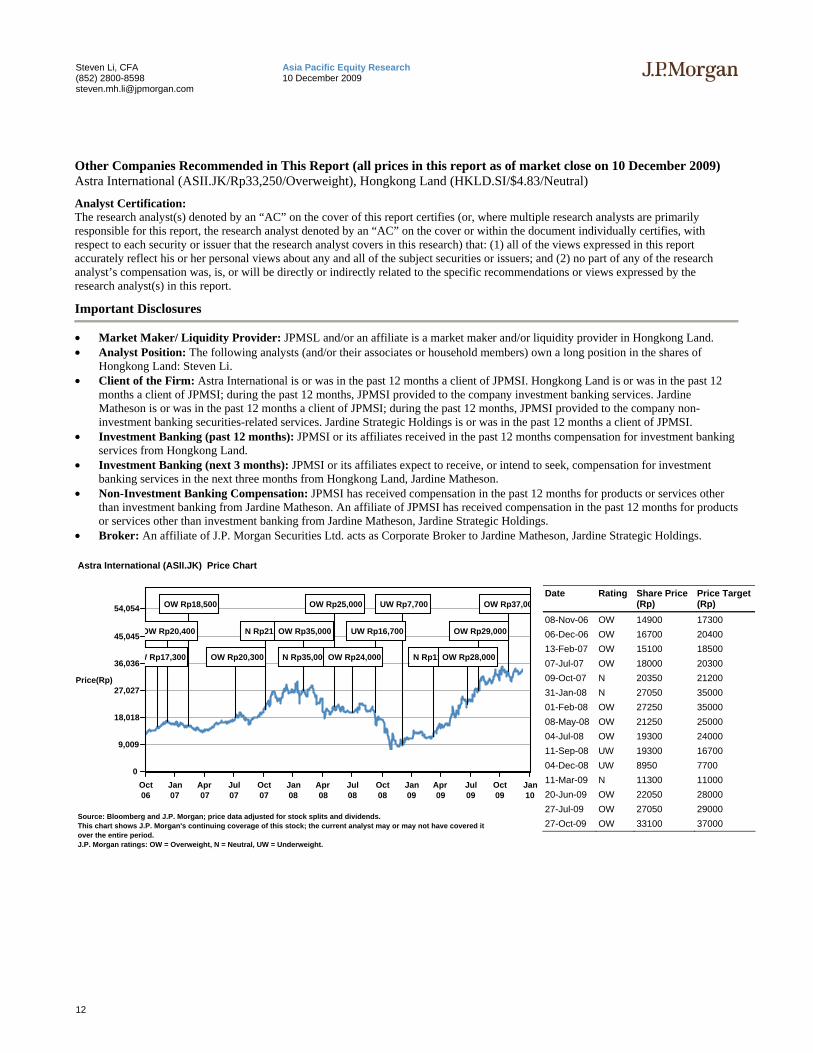
Other Companies Recommended in This Report (all prices in this report as of market close on 10 December 2009) Astra International (ASII.JK/Rp33,250/Overweight), Hongkong Land (HKLD.SI/$4.83/Neutral)
Analyst Certification: The research analyst(s) denoted by an “AC” on the cover of this report certifies (or, where multiple research analysts are primarily responsible for this report, the research analyst denoted by an “AC” on the cover or within the document individually certifies, with respect to each security or issuer that the research analyst covers in this research) that: (1) all of the views expressed in this report accurately reflect his or her personal views about any and all of the subject securities or issuers; and (2) no part of any of the research analyst’s compensation was, is, or will be directly or indirectly related to the specific recommendations or views expressed by the research analyst(s) in this report.
Important Disclosures
• Market Maker/ Liquidity Provider: JPMSL and/or an affiliate is a market maker and/or liquidity provider in Hongkong Land. • Analyst Position: The following analysts (and/or their associates or household members) own a long position in the shares of
Hongkong Land: Steven Li. • Client of the Firm: Astra International is or was in the past 12 months a client of JPMSI. Hongkong Land is or was in the past 12
months a client of JPMSI; during the past 12 months, JPMSI provided to the company investment banking services. Jardine Matheson is or was in the past 12 months a client of JPMSI; during the past 12 months, JPMSI provided to the company non-investment banking securities-related services. Jardine Strategic Holdings is or was in the past 12 months a client of JPMSI.
• Investment Banking (past 12 months): JPMSI or its affiliates received in the past 12 months compensation for investment banking services from Hongkong Land.
• Investment Banking (next 3 months): JPMSI or its affiliates expect to receive, or intend to seek, compensation for investment banking services in the next three months from Hongkong Land, Jardine Matheson.
• Non-Investment Banking Compensation: JPMSI has received compensation in the past 12 months for products or services other than investment banking from Jardine Matheson. An affiliate of JPMSI has received compensation in the past 12 months for products or services other than investment banking from Jardine Matheson, Jardine Strategic Holdings.
• Broker: An affiliate of J.P. Morgan Securities Ltd. acts as Corporate Broker to Jardine Matheson, Jardine Strategic Holdings.
0
9,009
18,018
27,027
36,036
45,045
54,054
Price(Rp)
Oct06
Jan07
Apr07
Jul07
Oct07
Jan08
Apr08
Jul08
Oct08
Jan09
Apr09
Jul09
Oct09
Jan10
Astra International (ASII.JK) Price Chart
OW Rp18,500 OW Rp25,000 UW Rp7,700 OW Rp37,00
OW Rp20,400 N Rp21,200OW Rp35,000 UW Rp16,700 OW Rp29,000
W Rp17,300 OW Rp20,300 N Rp35,000OW Rp24,000 N Rp11,000OW Rp28,000
Source: Bloomberg and J.P. Morgan; price data adjusted for stock splits and dividends.This chart shows J.P. Morgan's continuing coverage of this stock; the current analyst may or may not have covered itover the entire period.J.P. Morgan ratings: OW = Overweight, N = Neutral, UW = Underweight.
Date Rating Share Price (Rp)
Price Target (Rp)
08-Nov-06 OW 14900 17300 06-Dec-06 OW 16700 20400 13-Feb-07 OW 15100 18500 07-Jul-07 OW 18000 20300 09-Oct-07 N 20350 21200 31-Jan-08 N 27050 35000 01-Feb-08 OW 27250 35000 08-May-08 OW 21250 25000 04-Jul-08 OW 19300 24000 11-Sep-08 UW 19300 16700 04-Dec-08 UW 8950 7700 11-Mar-09 N 11300 11000 20-Jun-09 OW 22050 28000 27-Jul-09 OW 27050 29000 27-Oct-09 OW 33100 37000
13
Asia Pacific Equity Research 10 December 2009
Steven Li, CFA (852) 2800-8598 [email protected]
0
1
2
3
4
5
6
7
8
Price($)
Oct06
Jan07
Apr07
Jul07
Oct07
Jan08
Apr08
Jul08
Oct08
Jan09
Apr09
Jul09
Oct09
Jan10
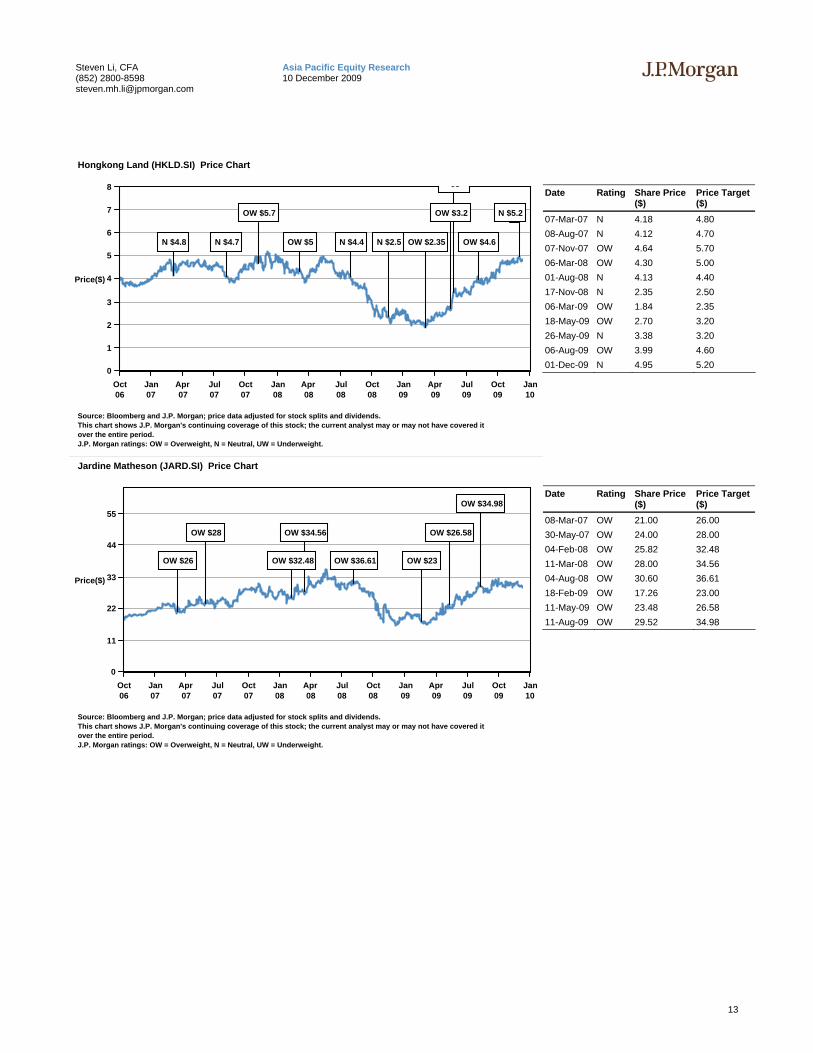
Hongkong Land (HKLD.SI) Price Chart
$3
OW $5.7 OW $3.2 N $5.2
N $4.8 N $4.7 OW $5 N $4.4 N $2.5 OW $2.35 OW $4.6
Source: Bloomberg and J.P. Morgan; price data adjusted for stock splits and dividends.This chart shows J.P. Morgan's continuing coverage of this stock; the current analyst may or may not have covered itover the entire period.J.P. Morgan ratings: OW = Overweight, N = Neutral, UW = Underweight.
Date Rating Share Price ($)
Price Target ($)
07-Mar-07 N 4.18 4.80 08-Aug-07 N 4.12 4.70 07-Nov-07 OW 4.64 5.70 06-Mar-08 OW 4.30 5.00 01-Aug-08 N 4.13 4.40 17-Nov-08 N 2.35 2.50 06-Mar-09 OW 1.84 2.35 18-May-09 OW 2.70 3.20 26-May-09 N 3.38 3.20 06-Aug-09 OW 3.99 4.60 01-Dec-09 N 4.95 5.20
0
11
22
33
44
55
Price($)
Oct06
Jan07
Apr07
Jul07
Oct07
Jan08
Apr08
Jul08
Oct08
Jan09
Apr09
Jul09
Oct09
Jan10
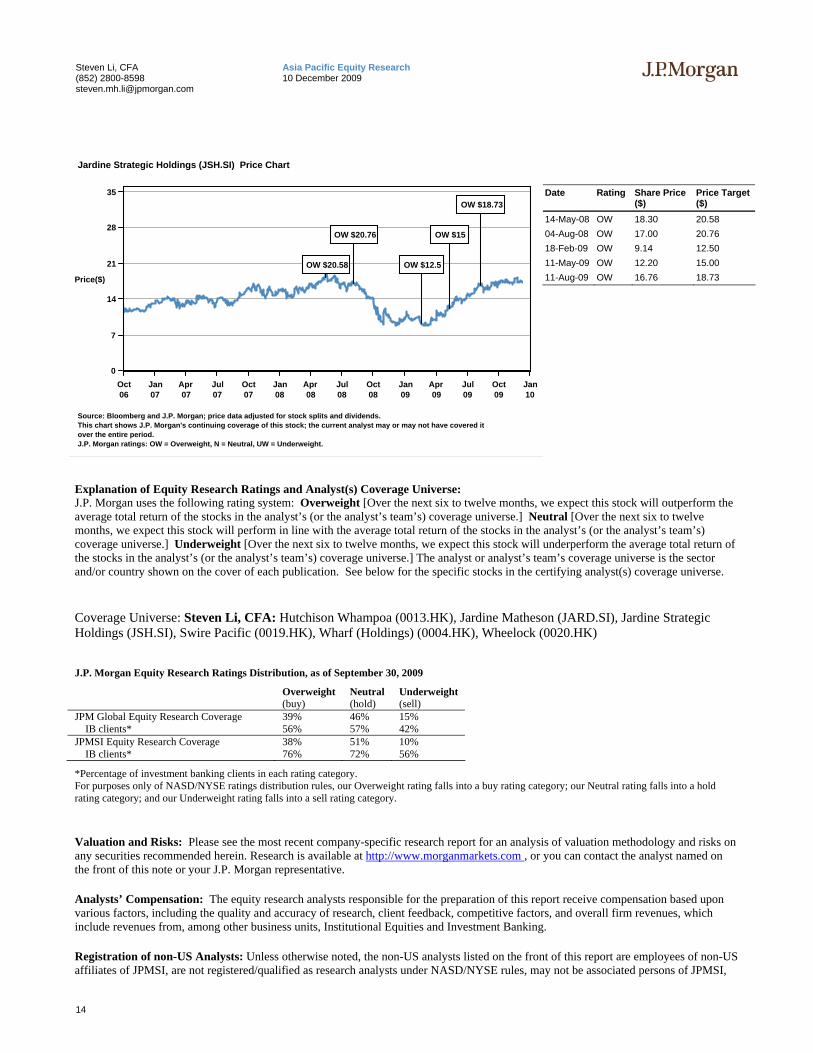
Jardine Matheson (JARD.SI) Price Chart
OW $34.98
OW $28 OW $34.56 OW $26.58
OW $26 OW $32.48 OW $36.61 OW $23
Source: Bloomberg and J.P. Morgan; price data adjusted for stock splits and dividends.This chart shows J.P. Morgan's continuing coverage of this stock; the current analyst may or may not have covered itover the entire period.J.P. Morgan ratings: OW = Overweight, N = Neutral, UW = Underweight.
Date Rating Share Price ($)
Price Target ($)
08-Mar-07 OW 21.00 26.00 30-May-07 OW 24.00 28.00 04-Feb-08 OW 25.82 32.48 11-Mar-08 OW 28.00 34.56 04-Aug-08 OW 30.60 36.61 18-Feb-09 OW 17.26 23.00 11-May-09 OW 23.48 26.58 11-Aug-09 OW 29.52 34.98
14
Asia Pacific Equity Research 10 December 2009
Steven Li, CFA (852) 2800-8598 [email protected]
0
7
14
21
28
35
Price($)
Oct06
Jan07
Apr07
Jul07
Oct07
Jan08
Apr08
Jul08
Oct08
Jan09
Apr09
Jul09
Oct09
Jan10
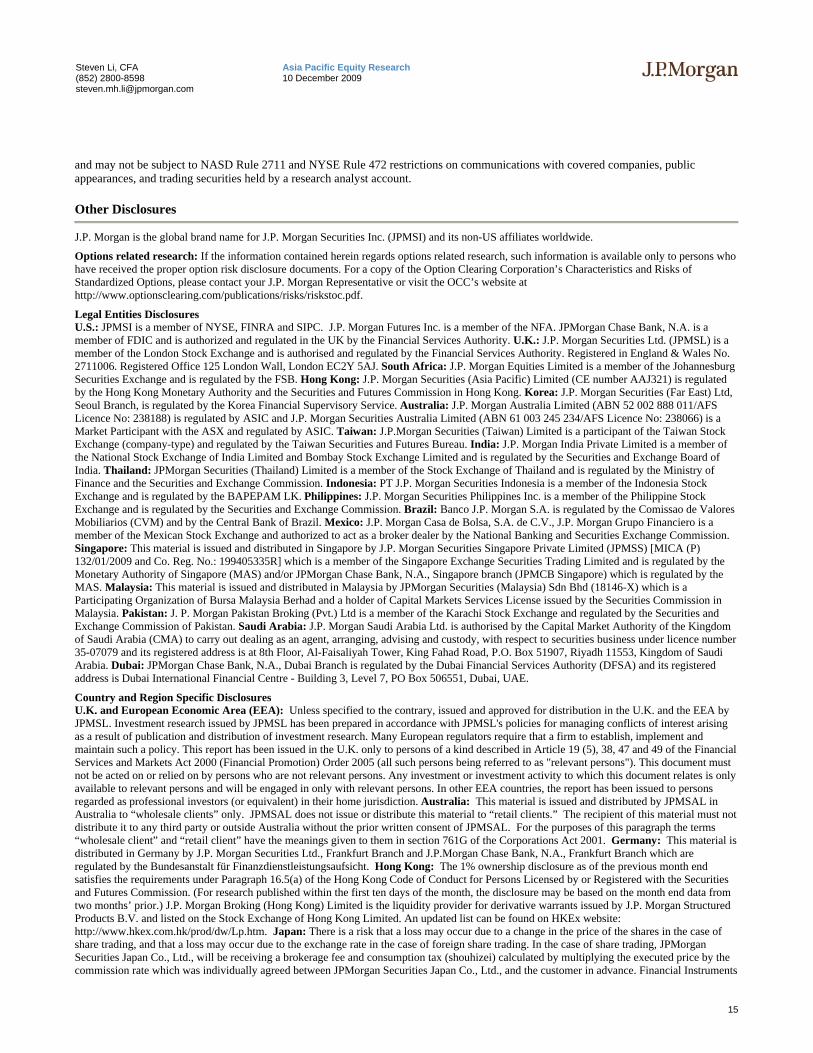
Jardine Strategic Holdings (JSH.SI) Price Chart
OW $18.73
OW $20.76 OW $15
OW $20.58 OW $12.5
Source: Bloomberg and J.P. Morgan; price data adjusted for stock splits and dividends.This chart shows J.P. Morgan's continuing coverage of this stock; the current analyst may or may not have covered itover the entire period.J.P. Morgan ratings: OW = Overweight, N = Neutral, UW = Underweight.
Date Rating Share Price ($)
Price Target ($)
14-May-08 OW 18.30 20.58 04-Aug-08 OW 17.00 20.76 18-Feb-09 OW 9.14 12.50 11-May-09 OW 12.20 15.00 11-Aug-09 OW 16.76 18.73
Explanation of Equity Research Ratings and Analyst(s) Coverage Universe: J.P. Morgan uses the following rating system: Overweight [Over the next six to twelve months, we expect this stock will outperform the average total return of the stocks in the analyst’s (or the analyst’s team’s) coverage universe.] Neutral [Over the next six to twelve months, we expect this stock will perform in line with the average total return of the stocks in the analyst’s (or the analyst’s team’s) coverage universe.] Underweight [Over the next six to twelve months, we expect this stock will underperform the average total return of the stocks in the analyst’s (or the analyst’s team’s) coverage universe.] The analyst or analyst’s team’s coverage universe is the sector and/or country shown on the cover of each publication. See below for the specific stocks in the certifying analyst(s) coverage universe.
Coverage Universe: Steven Li, CFA: Hutchison Whampoa (0013.HK), Jardine Matheson (JARD.SI), Jardine Strategic Holdings (JSH.SI), Swire Pacific (0019.HK), Wharf (Holdings) (0004.HK), Wheelock (0020.HK)
J.P. Morgan Equity Research Ratings Distribution, as of September 30, 2009
Overweight (buy)
Neutral (hold)
Underweight (sell)
JPM Global Equity Research Coverage 39% 46% 15% IB clients* 56% 57% 42% JPMSI Equity Research Coverage 38% 51% 10% IB clients* 76% 72% 56%
*Percentage of investment banking clients in each rating category. For purposes only of NASD/NYSE ratings distribution rules, our Overweight rating falls into a buy rating category; our Neutral rating falls into a hold rating category; and our Underweight rating falls into a sell rating category.
Valuation and Risks: Please see the most recent company-specific research report for an analysis of valuation methodology and risks on any securities recommended herein. Research is available at http://www.morganmarkets.com , or you can contact the analyst named on the front of this note or your J.P. Morgan representative.
Analysts’ Compensation: The equity research analysts responsible for the preparation of this report receive compensation based upon various factors, including the quality and accuracy of research, client feedback, competitive factors, and overall firm revenues, which include revenues from, among other business units, Institutional Equities and Investment Banking.
Registration of non-US Analysts: Unless otherwise noted, the non-US analysts listed on the front of this report are employees of non-US affiliates of JPMSI, are not registered/qualified as research analysts under NASD/NYSE rules, may not be associated persons of JPMSI,
15
Asia Pacific Equity Research 10 December 2009
Steven Li, CFA (852) 2800-8598 [email protected]
and may not be subject to NASD Rule 2711 and NYSE Rule 472 restrictions on communications with covered companies, public appearances, and trading securities held by a research analyst account.
Other Disclosures
J.P. Morgan is the global brand name for J.P. Morgan Securities Inc. (JPMSI) and its non-US affiliates worldwide.
Options related research: If the information contained herein regards options related research, such information is available only to persons who have received the proper option risk disclosure documents. For a copy of the Option Clearing Corporation’s Characteristics and Risks of Standardized Options, please contact your J.P. Morgan Representative or visit the OCC’s website at http://www.optionsclearing.com/publications/risks/riskstoc.pdf.
Legal Entities Disclosures U.S.: JPMSI is a member of NYSE, FINRA and SIPC. J.P. Morgan Futures Inc. is a member of the NFA. JPMorgan Chase Bank, N.A. is a member of FDIC and is authorized and regulated in the UK by the Financial Services Authority. U.K.: J.P. Morgan Securities Ltd. (JPMSL) is a member of the London Stock Exchange and is authorised and regulated by the Financial Services Authority. Registered in England & Wales No. 2711006. Registered Office 125 London Wall, London EC2Y 5AJ. South Africa: J.P. Morgan Equities Limited is a member of the Johannesburg Securities Exchange and is regulated by the FSB. Hong Kong: J.P. Morgan Securities (Asia Pacific) Limited (CE number AAJ321) is regulated by the Hong Kong Monetary Authority and the Securities and Futures Commission in Hong Kong. Korea: J.P. Morgan Securities (Far East) Ltd, Seoul Branch, is regulated by the Korea Financial Supervisory Service. Australia: J.P. Morgan Australia Limited (ABN 52 002 888 011/AFS Licence No: 238188) is regulated by ASIC and J.P. Morgan Securities Australia Limited (ABN 61 003 245 234/AFS Licence No: 238066) is a Market Participant with the ASX and regulated by ASIC. Taiwan: J.P.Morgan Securities (Taiwan) Limited is a participant of the Taiwan Stock Exchange (company-type) and regulated by the Taiwan Securities and Futures Bureau. India: J.P. Morgan India Private Limited is a member of the National Stock Exchange of India Limited and Bombay Stock Exchange Limited and is regulated by the Securities and Exchange Board of India. Thailand: JPMorgan Securities (Thailand) Limited is a member of the Stock Exchange of Thailand and is regulated by the Ministry of Finance and the Securities and Exchange Commission. Indonesia: PT J.P. Morgan Securities Indonesia is a member of the Indonesia Stock Exchange and is regulated by the BAPEPAM LK. Philippines: J.P. Morgan Securities Philippines Inc. is a member of the Philippine Stock Exchange and is regulated by the Securities and Exchange Commission. Brazil: Banco J.P. Morgan S.A. is regulated by the Comissao de Valores Mobiliarios (CVM) and by the Central Bank of Brazil. Mexico: J.P. Morgan Casa de Bolsa, S.A. de C.V., J.P. Morgan Grupo Financiero is a member of the Mexican Stock Exchange and authorized to act as a broker dealer by the National Banking and Securities Exchange Commission. Singapore: This material is issued and distributed in Singapore by J.P. Morgan Securities Singapore Private Limited (JPMSS) [MICA (P) 132/01/2009 and Co. Reg. No.: 199405335R] which is a member of the Singapore Exchange Securities Trading Limited and is regulated by the Monetary Authority of Singapore (MAS) and/or JPMorgan Chase Bank, N.A., Singapore branch (JPMCB Singapore) which is regulated by the MAS. Malaysia: This material is issued and distributed in Malaysia by JPMorgan Securities (Malaysia) Sdn Bhd (18146-X) which is a Participating Organization of Bursa Malaysia Berhad and a holder of Capital Markets Services License issued by the Securities Commission in Malaysia. Pakistan: J. P. Morgan Pakistan Broking (Pvt.) Ltd is a member of the Karachi Stock Exchange and regulated by the Securities and Exchange Commission of Pakistan. Saudi Arabia: J.P. Morgan Saudi Arabia Ltd. is authorised by the Capital Market Authority of the Kingdom of Saudi Arabia (CMA) to carry out dealing as an agent, arranging, advising and custody, with respect to securities business under licence number 35-07079 and its registered address is at 8th Floor, Al-Faisaliyah Tower, King Fahad Road, P.O. Box 51907, Riyadh 11553, Kingdom of Saudi Arabia. Dubai: JPMorgan Chase Bank, N.A., Dubai Branch is regulated by the Dubai Financial Services Authority (DFSA) and its registered address is Dubai International Financial Centre - Building 3, Level 7, PO Box 506551, Dubai, UAE.
Country and Region Specific Disclosures U.K. and European Economic Area (EEA): Unless specified to the contrary, issued and approved for distribution in the U.K. and the EEA by JPMSL. Investment research issued by JPMSL has been prepared in accordance with JPMSL's policies for managing conflicts of interest arising as a result of publication and distribution of investment research. Many European regulators require that a firm to establish, implement and maintain such a policy. This report has been issued in the U.K. only to persons of a kind described in Article 19 (5), 38, 47 and 49 of the Financial Services and Markets Act 2000 (Financial Promotion) Order 2005 (all such persons being referred to as "relevant persons"). This document must not be acted on or relied on by persons who are not relevant persons. Any investment or investment activity to which this document relates is only available to relevant persons and will be engaged in only with relevant persons. In other EEA countries, the report has been issued to persons regarded as professional investors (or equivalent) in their home jurisdiction. Australia: This material is issued and distributed by JPMSAL in Australia to “wholesale clients” only. JPMSAL does not issue or distribute this material to “retail clients.” The recipient of this material must not distribute it to any third party or outside Australia without the prior written consent of JPMSAL. For the purposes of this paragraph the terms “wholesale client” and “retail client” have the meanings given to them in section 761G of the Corporations Act 2001. Germany: This material is distributed in Germany by J.P. Morgan Securities Ltd., Frankfurt Branch and J.P.Morgan Chase Bank, N.A., Frankfurt Branch which are regulated by the Bundesanstalt für Finanzdienstleistungsaufsicht. Hong Kong: The 1% ownership disclosure as of the previous month end satisfies the requirements under Paragraph 16.5(a) of the Hong Kong Code of Conduct for Persons Licensed by or Registered with the Securities and Futures Commission. (For research published within the first ten days of the month, the disclosure may be based on the month end data from two months’ prior.) J.P. Morgan Broking (Hong Kong) Limited is the liquidity provider for derivative warrants issued by J.P. Morgan Structured Products B.V. and listed on the Stock Exchange of Hong Kong Limited. An updated list can be found on HKEx website: http://www.hkex.com.hk/prod/dw/Lp.htm. Japan: There is a risk that a loss may occur due to a change in the price of the shares in the case of share trading, and that a loss may occur due to the exchange rate in the case of foreign share trading. In the case of share trading, JPMorgan Securities Japan Co., Ltd., will be receiving a brokerage fee and consumption tax (shouhizei) calculated by multiplying the executed price by the commission rate which was individually agreed between JPMorgan Securities Japan Co., Ltd., and the customer in advance. Financial Instruments
16
Asia Pacific Equity Research 10 December 2009
Steven Li, CFA (852) 2800-8598 [email protected]
Firms: JPMorgan Securities Japan Co., Ltd., Kanto Local Finance Bureau (kinsho) No. 82 Participating Association / Japan Securities Dealers Association, The Financial Futures Association of Japan. Korea: This report may have been edited or contributed to from time to time by affiliates of J.P. Morgan Securities (Far East) Ltd, Seoul Branch. Singapore: JPMSS and/or its affiliates may have a holding in any of the securities discussed in this report; for securities where the holding is 1% or greater, the specific holding is disclosed in the Important Disclosures section above. India: For private circulation only, not for sale. Pakistan: For private circulation only, not for sale. New Zealand: This material is issued and distributed by JPMSAL in New Zealand only to persons whose principal business is the investment of money or who, in the course of and for the purposes of their business, habitually invest money. JPMSAL does not issue or distribute this material to members of "the public" as determined in accordance with section 3 of the Securities Act 1978. The recipient of this material must not distribute it to any third party or outside New Zealand without the prior written consent of JPMSAL. Canada: The information contained herein is not, and under no circumstances is to be construed as, a prospectus, an advertisement, a public offering, an offer to sell securities described herein, or solicitation of an offer to buy securities described herein, in Canada or any province or territory thereof. Any offer or sale of the securities described herein in Canada will be made only under an exemption from the requirements to file a prospectus with the relevant Canadian securities regulators and only by a dealer properly registered under applicable securities laws or, alternatively, pursuant to an exemption from the dealer registration requirement in the relevant province or territory of Canada in which such offer or sale is made. The information contained herein is under no circumstances to be construed as investment advice in any province or territory of Canada and is not tailored to the needs of the recipient. To the extent that the information contained herein references securities of an issuer incorporated, formed or created under the laws of Canada or a province or territory of Canada, any trades in such securities must be conducted through a dealer registered in Canada. No securities commission or similar regulatory authority in Canada has reviewed or in any way passed judgment upon these materials, the information contained herein or the merits of the securities described herein, and any representation to the contrary is an offence. Dubai: This report has been issued to persons regarded as professional clients as defined under the DFSA rules.
General: Additional information is available upon request. Information has been obtained from sources believed to be reliable but JPMorgan Chase & Co. or its affiliates and/or subsidiaries (collectively J.P. Morgan) do not warrant its completeness or accuracy except with respect to any disclosures relative to JPMSI and/or its affiliates and the analyst’s involvement with the issuer that is the subject of the research. All pricing is as of the close of market for the securities discussed, unless otherwise stated. Opinions and estimates constitute our judgment as of the date of this material and are subject to change without notice. Past performance is not indicative of future results. This material is not intended as an offer or solicitation for the purchase or sale of any financial instrument. The opinions and recommendations herein do not take into account individual client circumstances, objectives, or needs and are not intended as recommendations of particular securities, financial instruments or strategies to particular clients. The recipient of this report must make its own independent decisions regarding any securities or financial instruments mentioned herein. JPMSI distributes in the U.S. research published by non-U.S. affiliates and accepts responsibility for its contents. Periodic updates may be provided on companies/industries based on company specific developments or announcements, market conditions or any other publicly available information. Clients should contact analysts and execute transactions through a J.P. Morgan subsidiary or affiliate in their home jurisdiction unless governing law permits otherwise.
“Other Disclosures” last revised December 7, 2009.
Copyright 2009 JPMorgan Chase & Co. All rights reserved. This report or any portion hereof may not be reprinted, sold or redistributed without the written consent of J.P. Morgan.