15. paleoenvironmental variation based on the … · 15. paleoenvironmental variation based on the...
TRANSCRIPT
Rea, D.K., Basov, LA., Scholl, D.W., and Allan, J.F. (Eds.), 1995Proceedings of the Ocean Drilling Program, Scientific Results, Vol. 145
15. PALEOENVIRONMENTAL VARIATION BASED ON THE MINERALOGYAND ROCK-MAGNETIC PROPERTIES OF SEDIMENT FROM SITES 885 AND 8861
Eve Arnold,2 Margaret Leinen,2 and John King2
ABSTRACT
Variation in the mineralogy and rock magnetic properties of Sites 885 and 886 sediment can be explained by changing environ-mental conditions in the sediment source areas and sediment column. Climatic variations produce changes in the mineralogy andmagnetics at these sites consistent with aridification of the Asian source area and cooling forced by tectonic activity. Asian aridifi-cation is noted by gradual reduction of a kaolinite-rich mineral assemblage from the late Miocene to an abrupt mineralogy changeat 3.8 Ma to a chlorite- and illite-rich mineral assemblage. At the same time, the eolian mass accumulation rate and ferrimagneticgrain size increases. This event precedes the onset of Asian loess deposition by over 1 m.y., but it is consistent with a coupled envi-ronmental mechanism that explains the rapid onset of loess sedimentation at 2.5 Ma. Both the mineralogy and rock magnetics areoverprinted with a diagenetic signal that suggests the sediments proximal to Sites 885 and 886 may have been suboxic to anoxicin the early Pliocene.
INTRODUCTION
The pelagic sediments preserved near Ocean Drilling Program(ODP) Holes 885A and 886B in the North Pacific Ocean are largelyeolian in origin (Griffin et al., 1968; Leinen, 1989; Kyte et al., 1993);thus, variations in the properties of these sediments are related to vari-ations in atmospheric transport patterns. The present upwind sourceregion for these eolian sediments is Asia, and the sediments recordboth past climatic variation and tectonic activity from this continent.In addition, the terrigenous material may have been subjected tosediment reworking and diagenetic alteration. By examining a varietyof parameters, we can attempt to deconvolve this climate-tectonic-transport-preservation signal into its individual components and learnsomething about the variation of each through time.
In this paper, we examine the downcore variation in mineralogyand rock-magnetic measurements to infer the paleoenvironmentalconditions responsible for sedimentation proximal to Sites 885 and886. The composition and concentration of terrigenous material pre-served in deep-sea sediment are related to weathering, transport, anddepositional processes as well as postdepositional alteration of con-tinental material. Mineralogical composition is related to parent-rock composition as well as regional climate. Paleoclimatologistsand atmospheric scientists have established that the mineralogy ofpresent-day aerosols is related to the source area (M. Leinen et al.,unpubl. data; J. Merrill et al, unpubl. data) and that the mineralogy ofaerosols collected over the North Pacific is the same as that of surfacesediments from eolian deposits (Blank et al, 1985). Furthermore,downcore variation in mineralogy has demonstrated a consistent re-lationship with other paleoclimate proxies and has allowed paleocli-matologists to interpret variation in past climates in the Asia-NorthPacific region (Leinen, 1985,1989; Schramm, 1989).
In an analogous manner, rock-magnetic studies have also beenused to trace atmospheric samples to their source area (Oldfield et al.,1985) and to infer changes in atmospheric input to deep-sea sedi-ments (Robinson, 1986; Doh et al., 1988). In addition to composi-tional information, rock-magnetic properties are also useful proxiesfor the concentration and grain size of terrigenous deep-sea sedi-ments. Finally, the rock-magnetic properties are very sensitive to
1 Rea, D.K., Basov, I.A., Scholl, D.W., and Allan, J.F. (Eds.), 1995. Proc. ODP, Sci.Results, 145: College Station, TX (Ocean Drilling Program).
2 University of Rhode Island, Graduate School of Oceanography, Narragansett, Rl02882, U.S.A.
reduction diagenesis, so that we can control for postdepositionalalteration of the sediment.
The rock-magnetic analyses are nondestructive, so we were ableto analyze the same samples for mineralogy. Because the mineral-ogy of atmospheric aerosols has been identified with broad regionalsource areas, we can use this information to interpret the mineralogysignal in deep-sea sediments if we can confirm that the originalmineralogy has not been modified by transport, deposition, or post-depositional modification. Bulk mineralogy can be altered by trans-port and deposition because mineralogy varies with grain size. Asmaterial travels through the atmosphere and falls through the watercolumn, large particles fall out more quickly than the fine fraction. Inaddition, winnowing of deep-sea sediments can result in size frac-tionation. The coarse fraction of terrigenous material is relativelyconcentrated in primary minerals such as quartz and Plagioclase,whereas the clay minerals dominate the fine fraction. We control forthis by examining the mineralogy in separate size classes in the deep-sea sediments. Diagenetic alteration may be discerned by comparingthe mineralogy record with the rock-magnetic properties; divergenceof these two signals may indicate either a postdepositional modifica-tion of the sediment or a change in source.
METHODS
Samples were collected at 150 cm intervals from Holes 885A and886B with an aluminum sampling tool designed to collect undis-turbed sediment; they were then extruded into 5-cm3 plastic cubes forrock-magnetic analyses. In addition, ODP paleomagnetic samples (7cm3), collected at 150 cm intervals, were also used. Sample spacingfor the rock-magnetic study is approximately 75 cm, and 150 cm forthe mineralogical analyses.
Rock Magnetics
Susceptibility (Xlf, Xhf) was measured on a Bartington Instrumentssusceptibility meter at 0.47 and 4.7 kHz. The reported value (inlO~̂ m•Vg) is the average of three replicates. The samples were demag-netized in a 100 mT alternating field. Anhysteretic remanent magneti-zation (ARM) was induced in a 0.1 mT steady field superimposed on a100 mT alternating field. The ARM was measured on a cryogenic mag-netometer, and the reported value (in lO~^AπrVg) is the average ofduplicate measurements. The Xarm was calculated by dividing ARM bythe steady field (reported in lO^mVg). The final set of magnetic mea-surements were saturated isothermal remanent magnetization (SIRM)
231

E. ARNOLD, M. LEINEN, J. KING
and isothermal remanent magnetization (IRM_o 3T). Samples were satu-rated in a 1.2 T field and measured on a cryogenic magnetometer.Samples were then placed in reverse fields of 0.3 T and the magne-tization remeasured. The values reported (in lO^Air^/g) are averagesof duplicate measurements. The frequency ratio (Xhf/Xlf), the grainsize parameter (Xarm/Xlf), and the compositional parameters (5 [5 =IRM^3TISIRM] and HIRM [HIRM = [IRM^j + SIRM ll]) werecalculated from the primary measurements. Further explanation ofthese variables and their applications may be found in the "Results"section below. Readers unfamiliar with rock-magnetic techniques arereferred to King et al. (1989).
Mineralogy
Samples were freeze-dried, weighed, and wet sieved at 63 µm; the>63 µm and <63 µm were then dried and weighed. The <63 µmfraction was treated to remove biogenic silica using a NaOH procedure(see Snoeckx et al., this volume). The NaOH procedure removes moreamorphous material than other common extraction techniques, butdoes not alter the relative proportion of the various mineral phases. Ironoxides were removed using the oxalic acid extraction technique ofLanda and Gast (1973). Sediments were saturated with MgCl2, toreduce d-spacing variability caused by cation differences; they werethen rinsed with warm deionized water, dried, and weighed. Sedimentswere wet sieved at 20 µm with the aid of a sonic dismembrator, and the<20 µm fraction was split into 2-20 µm and <2 µm size fractions bymeans of centrifugation. The 2-20 µm size fraction was spiked with a10% by weight A12O3 internal standard and the <2 µm fraction wasspiked with a 10% talc internal standard. Samples were homogenizedby grinding in a mortar and pestle under acetone, then air dried,suspended in a deionized water slurry, and drawn onto duplicate (oneair dried, one glycolated) silver filters for X-ray analysis.
The X-ray analysis was run from 2° to 30° 2θ at 45 kV and 40 mAat 2° 2θ/min using CuKα radiation. Peak areas for smectite, illite,kaolinite, chlorite, quartz, and Plagioclase were determined usingScintag DMS software. Precision of the peak areas is listed in Table1. These precisions were calculated by comparing the area under themineral curves between the glycolated and unglycolated samples.Smectite cannot be compared in this manner. Replicate scans andpeak area resolution for this mineral were performed; the error forsmectite determination is high (in excess of -30% for both sizefractions). The relative proportion of kaolinite and chlorite was deter-mined by the relative proportions of the kaolinite [002] and chlorite[004] peak areas. Mineral peak areas were normalized to the internalstandard peak areas.
Stratigraphy, Correlation, Age Model,and Mass Accumulation Rates
Sites 885 (44°41'N, 168°16'E) and 886 (44°41'N, 168°14'E) weredrilled at about 5700 m water depth in the North Pacific red-clayprovince. A total of 59 m of sediments were recovered from Hole885A and 69 m from Hole 886B. Three stratigraphic sedimentaryunits were recognized at each site: (I) Pleistocene to late Pliocenereddish brown to brown red clay; (II) late Pliocene to late Miocenediatom ooze, and (III) a lower brown clay unit, originally dated as lateMiocene (Rea, Basov, Janecek, Palmer-Julson, et al., 1993), but nowrecognized as older; late Miocene to late Cretaceous in Hole 886C(Ingram, this volume).
Table 2 lists the stratigraphic parameters for Holes 885A and886B. Correlation between and composite depth of Holes 885A and886B is detailed in Dickens et al. (this volume); all depths in thisreport are composite depths derived from that model. The depthintervals (in meters composite depth [mcd]) for Unit I are 0-23.5mcd; for Unit II, 23.5 to -52 mcd, and for Unit III, >52 mcd. The agemodels used in this report are derived from the magnetic reversalstratigraphy listed in Dickens et al. (this volume). These ages are in
agreement with the Radiolaria stratigraphy reported by Morely (thisvolume). Ages derived from ichthyolith strontium isotopic ratios(Ingram, this volume) indicate slightly younger sediments in thelower Unit II samples, but older sediment in the Unit III sedimentsthan in the magnetic age model. Hiatuses and low sedimentation ratesexplain the discrepancy between the Unit III ages. Because the radio-larian ages agree with the paleomagnetic estimates, the Sr data werenot incorporated into the age model for this study.
The sedimentation rate is estimated by linear interpolation betweeneach magnetic datum obtained from the composite depth model. It isimportant to recognize that the linear sedimentation rates (LSRs) de-rived from the composite depth section may be higher than thosederived from the original cores. This discrepancy is cause for someconcern when trying to estimate mass accumulation rates (MARs), asthe seismic records indicate that the Site 885 sediment is indeed thinnerthan Site 886 (Rea, Basov, Janecek, Palmer-Julson, et al., 1993). Mostof the difference appears to occur in the lower brown clay of Unit III.The LSRs derived from the composite depth model are comparablewith those derived from the original depths from Hole 886B for allstratigraphic units. However, the LSR for Hole 885A Unit I is lower(0.48 cm/k.y.) than the Unit I LSR estimated from the composite depthmodel (0.67 cm/k.y.). Acomparison of depth intervals between suscep-tibility datum for Holes 885 Aand 886A indicates equal LSRs in the top10 m of these cores. Thus, it appears reasonable to apply the same LSRsto both sites for the upper two units, because the difference in the LSRestimates may be explained by coring gaps or drilling disturbance.
Dry bulk density (DBD) was estimated for each sample based onthe dry weights of the constant volume magnetic cubes. The percentterrigenous is operationally defined as the <63 µm material remainingafter the biogenic silica and iron oxide removals, expressed as aweight percent of the total original sample. The 2-20 µm and <2 µmpercentages are the weight percents of the total original sample foreach size class after chemical treatment. The bulk mass accumulationrate (MAR) is the product of the LSR and DBD. The terrigenous,2-20 µm, and <2 µm MARs are the product of the bulk MAR and therespective weight percent for each sedimentary component. The ac-cumulation rates for the rock-magnetic properties are the product ofthe rock magnetic measurement and the bulk MAR. The accumula-tion of the <2 µm minerals is the product of the normalized peak areaand the <2 µm MAR.
RESULTS
Rock Magnetics
Figure 1 illustrates the rock magnetic parameters plotted vs. com-posite depth, and Table 3 lists the magnetic measurements for Holes885A and 886B. The low-frequency susceptibility (Fig. 1A) is pri-marily a measure of the concentration of magnetic iron oxides and isused as a proxy for the concentration of terrigenous material. Suscep-tibility is highest in stratigraphic Unit III, the lower brown clay unit,suggesting a large iron oxide component in these sediments, whichgrades monotonically to low values in the lower part of Unit II, thediatom ooze (-46 mcd). Susceptibility remains low throughout thediatom ooze and increases at the base of Unit I, the upper red clay unit(-24 mcd). There are large-amplitude peaks superimposed on thegeneral upcore increase in susceptibility, coincident with the ashlayers described in the Leg 145 Initial Reports (Rea, Basov, Janecek,Palmer-Julson, et al., 1993).
The frequency dependence of the susceptibility (Xhf/Xlf) is used toidentify the presence of very fine (submicrometer), viscous, super-paramagnetic grains. Should the contribution of such grains be large(low Xhf/Xlf ratios), the susceptibility concentration proxies and grain-size parameters derived from these values will no longer be related tothe concentration and grain size of terrigenous materials, as super-paramagnetic materials make a disproportionately large contributionto the susceptibility. Figure IB illustrates the frequency dependenceof the susceptibility; the frequency dependence in the lower and upper

PALEOENVIRONMENTAL VARIATION, SITES 885 AND 886
S-ratio HIRM
1.0 0 500 1000
70
Figure 1. Rock-magnetic parameters vs. composite depth for Holes 885Aand 886B.
red clay units is relatively uniform and low, indicating that the appli-cation of the magnetic proxies for terrigenous material is appropriatein these intervals. The diatom ooze unit displays a more variablefrequency dependence signal, largely because of the low concentra-tion of terrigenous material combined with a negative contribution ofthe biogenic silica to the susceptibility signal, resulting in a frequencyratio of two very small numbers. However, there does not appear to bea large viscous superparamagnetic contribution in this stratigraphicunit; again, the application of the magnetic parameters as terrigenousproxies is appropriate.
Anhysteretic remanent magnetization, expressed as Xarm (Fig. IC),is another measure of iron oxide concentration, but it is also affectedby the domain state of the magnetic minerals. The domain state ofmagnetic material is related to the iron oxide particle grain size,which, in turn, may be related to the terrigenous grain size, if finemagnetic particles are not randomly incorporated into larger terrige-nous grains. The iron oxide grain size is related to the terrigenousgrain size because magnetic particles such as magnetite and hematite,derived from continental source areas, are subject to the same trans-port processes as the alumino-silicate grains. Smaller magnetic grainsyield a larger Xarm signal. The Xarm mimics the upcore pattern ob-served for the susceptibility in the lower clay and diatom units, butreaches a broad maximum between 10 and 20 mcd in Unit I beforedecreasing toward the top of the core. This decrease at the top of thecore indicates either a decrease in concentration of magnetic material,in conflict with the susceptibility signal, or an increase in the magneticgrain size. Examination of the ratio Xarm/Xlf (Fig. ID) indicates thatthe latter explanation is more likely.
The ratio Xarm/Xlf is inversely related to the ferrimagnetic ironoxide grain size and is independent of magnetic concentration. Thexarm/xif ra<io monotonically increases from the base of stratigraphicUnit III to the base of stratigraphic Unit II, indicating a generalferrimagnetic-iron oxide grain-size decrease throughout the lowerbrown clay unit. The ratio abruptly increases and becomes more vari-able at the base of Unit IL The high variability in this unit is relatedto the low magnetic mineral concentration in the diatom ooze; how-ever, a few comments may be made about the overall grain-size pat-tern. In general, the diatom ooze contains the finest grain size of all
Table 1. Precision, expressed as percent relative error of mineral peakareas.
Size
<2 µm2-20 µm
Smectite
NDND
Illite
2.31.3
Kaolinite
11.233.3
Chlorite
2.90.4
Quartz
7.63.0
Plagioclase
2.22.5
Note: ND = not determined.
sediments from Holes 885A and 886B. There is an interval of lowXarmIXlf between 34 and 30 mcd, indicating a relatively coarse mag-netic grain size, and a sharp peak in the grain-size ratio at -28-30 mcd,indicating a very fine magnetic grain size. Above -28 mcd, the grain-size ratio decreases and becomes less variable throughout the remain-der of the diatom ooze and in all of stratigraphic Unit I. This patternof variation suggests a general increase in the ferrimagnetic grain sizetoward the top of the core.
The S-ratio (IRM_03T/SIRM 2T) is a parameter sensitive to thecomposition of magnetic minerals. Magnetic minerals such as mag-netite are easily magnetized, whereas minerals such as hematite re-quire stronger magnetic fields to saturate them. Thus, the ratio of theproportion of magnetization stripped off of the magnetically saturatedsample in a reverse field of 0.3 T is related to the proportion of "hard"to "soft" magnetic material present in a sample. Figure IE shows theS-ratio for Sites 885 and 886. The small-amplitude, high-frequencyvariability in Hole 885A sediments is a systematic laboratory error;one batch of samples was not completely saturated. The S-ratio isrelatively uniform and high in the lower brown clay unit and in thelower part of the diatom unit, indicating a constant magnetic mineralcomposition throughout this interval. Low S-ratios are observed from29 to 35 mcd; this is the same interval as the low Xarm/Xlf ratiosdescribed earlier. The remainder of the diatom ooze unit and the upperred clay unit indicates a gradual evolution toward a slightly hardercoercivity toward the top of the core.
HIRM ([IRM__03T + SIRM]/2; Fig. IF) is used to estimate theconcentration of hard magnetic material in the sediment. HIRM oc-curs at moderate concentrations in the lower brown clay unit and

E. ARNOLD, M. LEINEN, J. KING
Table 2. Stratigraphic parameters and mass accumulation rates for Holes 885A and 886B.
Core, section,interval (cm)
145-885A-lH-1,251H-1, 125lH-2,251H-2, 125lH-3,251H-3, 1252H-1.252H-1, 1252H-2, 252H-2, 1252H-3, 252H-3, 1252H-4, 1252H-5, 1252H-6, 1253H-1, 1253H-2, 1253H-3, 1253H-4, 1253H-5, 1253H-6, 1254H-1, 1254H-2, 1254H-3, 1254H-4, 1254H-5, 1254H-6, 1255H-1, 1255H-2, 1255H-3, 1255H-4, 1255H-5, 1255H-6, 1256H-1, 1256H-2, 1256H-3, 1256H-4, 1256H-5, 1256H-6, 125
145-886B-1H-1,5O1H-2, 112H-1.502H-2, 502H-3, 502H-4, 502H-5, 502H-6, 502H-7, 453H-1.503H-2, 503H-3, 503H-4, 503H-5, 503H-6, 504H-l,504H-2, 504H-3, 504H-4, 504H-5, 504H-6, 505H-l,505H-2, 505H-3, 505H-4, 505H-5, 505H-6, 505H-7, 506H-1.506H-2, 506H-3, 506H-4, 506H-5, 506H-6, 526H-7, 507H-1.477H-2, 477H-3, 477H-4, 477H-5, 477H-6, 477H-7, 478X-1.50
Depth(mbsf)
0.251.251.752.753.254.254.855.856.357.357.858.85
10.3511.8513.3515.3516.8518.3519.8521.3522.8524.8526.3527.8529.3530.8532.3534.3535.8537.3538.8540.3541.8543.8545.3546.8548.3549.8551.35
0.501.312.303.805.306.808.309.80
11.2511.8013.3014.8016.3017.8019.3021.3022.8024.3025.8027.3028.8030.8032.3033.8035.3036.8038.3039.8040.3041.8043.3044.8046.3047.8249.3049.7751.2752.7754.2755.7757.2758.7759.30
Compositedepth(m)
0.301.652.343.894.345.165.636.727.248.198.639.61
12.1214.5517.0621.3523.5525.0526.5528.0529.3130.8231.9533.2334.5335.9937.5740.1542.0644.0945.8247.4949.4851.5253.3054.5856.6864.2269.96
0.772.764.714.764.824.874.934.987.499.11
10.6012.6114.6516.1517.7120.4722.5524.5926.1727.5228.8730.6632.0133.5035.0036.5038.0039.5640.3941.9543.4544.9546.4548.1250.2850.9753.0254.5255.5557.2058.7960.2260.75
Age(Ma)
0.050.260.370.620.690.850.961.111.271.481.571.782.232.602.863.303.533.774.024.264.474.724.915.125.335.575.836.266.586.917.207.427.678.26
10.6712.4115.2625.4733.25
0.120.440.750.760.770.780.790.801.331.681.992.302.612.762.933.213.433.714.004.254.494.825.075.345.625.876.076.256.356.596.827.067.297.507.777.86
10.2912.3213.7215.9518.1120.0520.77
LSR(cm/k.y.)
0.630.630.630.630.630.410.410.460.460.460.460.460.660.660.960.960.960.610.610.610.610.610.610.610.610.610.610.610.610.610.610.790.790.070.070.070.070.070.07
0.630.630.630.630.630.630.410.410.460.460.660.660.960.960.960.960.960.610.610.610.610.610.610.610.610.610.610.610.610.610.610.610.790.790.790.790.070.070.070.070.070.070.07
Dry bulkdensity(g/cm3)
0.470.540.450.440.470.480.530.470.550.470.570.440.520.440.420.480.370.330.320.280.290.240.290.400.360.390.390.430.420.320.400.460.420.450.430.610.650.470.46
0.510.470.530.480.540.470.510.480.460.450.460.480.530.390.390.420.430.310.330.320.330.290.320.410.330.360.350.490.420.400.360.340.400.460.440.350.440.610.650.560.520.540.51
BulkMAR
(g/cm2/k.y.)
0.2950.3370.2840.2770.2910.1940.2170.2160.2520.2170.2610.2050.3420.2900.4070.4580.3540.2020.1920.1710.1770.1430.1780.2410.2170.2350.2340.2580.2540.1910.2400.3620.3320.0340.0320.0450.0480.0350.034
0.3200.2940.3310.3010.3370.2940.2090.1960.2140.2100.3010.3170.5120.3710.3750.4080.4150.1850.2000.1970.2000.1750.1930.2470.1990.2150.2140.2970.2540.2450.2200.2050.3170.3660.3500.2800.0330.0450.0480.0410.0390.0400.038
TerrigenousMAR
(g/cm2/k.y.)
0.1430.1520.1440.1270.1290.1030.1180.0990.1280.0920.0930.0830.1580.1160.0910.1320.0620.0150.0190.0120.0080.0040.0140.0540.0270.0460.0270.0630.0580.0090.0380.1130.1120.0150.0160.0220.0230.0140.012
0.1840.1790.2230.2020.2220.1900.1370.1320.1370.1220.1590.1720.2940.0780.1200.1030.1390.0210.0210.0150.0130.0080.0240.0480.0370.0290.0280.1120.0590.0500.0240.0270.0630.1690.1390.0780.0190.0280.0190.0290.0300.0310.024
>63 µmMAR
(g/cm2/k.y.)
0.0140.0100.0070.0090.0060.0020.0020.0040.0040.0080.0300.0040.0020.0020.0080.0050.0050.0050.0010.0010.0010.0010.0030.0020.0020.0020.0010.0010.0030.0030.0020.0010.0010.0000.0000.0000.0000.0000.003
0.0050.0020.0050.0030.0050.0020.0060.0030.0010.0010.0050.0020.0020.0010.0010.0010.0060.0000.000
0.0010.0000.0090.0130.0110.0140.0170.0070.0140.0120.0220.0130.0070.0020.0030.0070.0000.0000.0000.0000.0000.0000.000
20-63 µmMAR
(g/cm2/k.y.)
0.0030.0030.0040.0080.0020.0030.0040.0040.0040.0060.0170.0030.0040.0020.0110.0060.0020.0010.0010.0010.0000.0000.0000.0020.0020.0010.0010.0050.0010.0000.0010.0050.0030.0000.0000.0000.0000.0000.000
0.0040.0050.0040.0050.0060.0080.0160.0040.0020.0010.0060.0020.0050.0000.0010.0000.0090.0000.0000.0000.0000.0000.0020.0000.0030.0000.0010.0010.0010.0000.0000.0000.0010.0020.0010.0000.0000.0000.0010.0000.0000.0010.000
2-20 µmMAR
(g/cm2/k.y.)
0.0920.0970.0940.0810.0800.0660.0750.0660.0780.0570.0550.0520.0970.0720.0560.0790.0410.0100.0100.0080.0060.0020.0090.0340.0170.0300.0170.0390.0350.0060.0230.0710.0800.0110.0110.0140.0130.0070.002
0.1110.1050.1280.1110.1230.1020.0690.0730.0840.0740.0910.0990.1710.0430.0680.0580.0790.0120.0120.0090.0080.0040.0150.0270.0180.0150.0160.0620.0320.0280.0140.0150.0310.0900.0730.0410.0100.0140.0100.0100.0100.0100.015
<2 µmMAR
(g/cm2k.y.)
0.0420.0450.0430.0330.0420.0310.0360.0250.0350.0230.0140.0230.0480.0350.0170.0380.0150.0030.0040.0030.0010.0010.0030.0150.0050.0100.0060.0140.0180.0020.0110.0310.0250.0040.0050.0070.0090.0070.006
0.0620.0630.0810.0770.0820.0720.0460.0490.0450.0410.0550.0650.1060.0290.0440.0390.0460.0070.0080.0050.0040.0020.0060.0180.0120.0100.0100.0440.0230.0190.0090.0100.0250.0720.0610.0340.0080.0130.0070.0180.0160.0190.008
Note: LSR = linear sedimentation rate, MAR = mass accumulation rate. Blank = no measurement.

PALEOENVIRONMENTAL VARIATION, SITES 885 AND 886
Smectite Mite Kaolinite Chlorite Quartz Plagioclase(peak area) (peak area) (peak area) (peak area) (peak area) (peak area)
0.0 0.5 1.0 0.0 0.5 1.0 0.0 0.2 0.4 0.0 0.3 0.6 0.0 1.0 2.0 0.0 0.2 0.4
•*1
1
1 1
1 1
1
Uni
t M
l U
nit
II U
nit
1
Mio
cene
P
lioce
ne
Ple
ist.
Figure 2. Mineral peak area for the <2 µm terrigenous size fraction vs. composite depth for Holes 885A and 886B.
Smectite Illite Kaolinite Chlorite Quartz Plagioclase(peak area) (peak area) (peak area) (peak area) (peak area) (peak area)
0.0 2.5 5.0 0 12 24 0.0 1.5 3.0 0 6 12 0 15 30 0.0 3.0 6.0
F ,
Uni
t III
U
nit
II U
nit
IM
ioce
ne
Plio
cene
|
Ple
ist.
Figure 3. Mineral peak area for the 2-20 µm terrigenous size fraction vs. composite depth for Holes 885A and 886B.
decreases to uniformly low values in the diatom ooze. The concentra-tion of hard magnetic minerals (such as goethite or hematite) does notexplain the large magnetic concentrations indicated by the suscepti-bility or Xarm signal in Unit III. Thus, the magnetic carrier in thesesediments must also include a softer component, such as magnetite.The concentration of hard-coercivity material begins to increase at thebase of the uppermost red clay unit and displays a high-amplitudevariability superimposed on a general HIRM increase throughout thisunit. This increase in HIRM tracks the increase in susceptibility; thus,
the magnetic carrier in this unit is harder than the sediments in thelower brown clay unit.
Mineralogy
Figures 2 and 3 illustrate the mineralogy for the <2 µm and 2-20µm terrigenous material at Holes Sites 885A and 886B. Mineralogywas run at twice the sampling interval as the rock-magnetic measure-ments. A study to derive weighting factors for the 2-20 µm size
235

E. ARNOLD, M. LEINEN, J. KING
Table 3. Rock-magnetic measurements for Holes 885A and 886B.
Core, section, Depth Composite Age XARM Xlf Xhf SIRM IRM-OJT HIRMinterval (cm) (mbsf) depth (m) (Ma) (l(r6m3/g) (10-6m3/g) (lO^mVg) ×h/xlf XARM/X (10-6A/m2/g) (10'6A/m2/g) S-ratio (10-"A/m2/g)
145-885A-1H-1,25 0.25 0.30 0.05 8.63 21.35 20.38 0.95 0.40 19089.01 -17098.30 0.84 548.221H-1.50 0.50 0.61 0.10 10.96 10.20 9.70 0.95 1.07 19310.96 -17801.43 0.92 409.571H-1, 125 1.25 1.65 0.26 5.64 15.47 14.71 0.95 0.36 9846.23 -9007.93 0.89 364.381H-2,25 1.75 2.34 0.37 11.27 17.67 16.70 0.95 0.64 17316.93 -16355.27 0.87 255.031H-2,50 2.00 2.68 0.43 11.92 15.15 14.41 0.95 0.79 24327.92 -22350.27 0.92 591.381H-2, 125 2.75 3.89 0.62 14.90 27.68 26.30 0.95 0.54 30093.61 -27704.20 0.87 618.021H-3,25 3.25 4.34 0.69 10.04 10.57 9.98 0.94 0.95 10533.99 -9561.91 0.87 264.011H-3,50 3.50 4.49 0.72 13.62 7.22 6.79 0.94 1.89 13880.38 -12855.70 0.93 270.221H-3, 125 4.25 5.16 0.84 9.92 16.05 15.22 0.95 0.62 14526.08 -13440.03 0.88 302.442H-1.25 4.85 5.63 0.93 12.89 25.96 24.18 0.93 0.50 23418.97 -20571.62 0.85 885.462H-l,50 5.10 5.88 0.98 14.93 17.06 15.90 0.93 0.88 29727.07 -26390.47 0.89 963.872H-1, 125 5.85 6.72 1.16 9.91 13.45 12.64 0.94 0.74 11434.31 -10664.09 0.88 209.752H-2,25 6.35 7.24 1.27 9.29 14.78 14.09 0.95 0.63 11428.79 -10541.48 0.88 282.892H-2,50 6.60 7.49 1.33 14.92 8.57 8.07 0.94 1.74 15347.45 -14184.78 0.92 296.122H-2, 125 7.35 8.19 1.48 15.71 29.69 28.27 0.95 0.53 29959.48 -27774.38 0.89 598.972H-3,25 7.85 8.63 1.57 14.70 37.85 35.59 0.94 0.392H-3,50 8.10 8.85 1.62 15.09 16.37 15.55 0.95 0.92 29044.66 -26869.97 0.93 602.792H-3, 125 8.85 9.61 1.78 11.14 13.64 12.78 0.94 0.82 13073.65 -11688.32 0.85 356.232H-4,50 9.60 10.62 2.00 16.27 13.86 13.17 0.95 1.17 30615.47 -28372.14 0.93 533.102H-4, 125 10.35 12.12 2.23 10.94 12.08 11.36 0.94 0.91 9851.48 -8812.33 0.85 315.492H-5,50 11.10 13.71 2.47 18.89 7.26 6.88 0.95 2.60 12673.33 -11872.81 0.94 210.262H-5, 125 11.85 14.55 2.60 14.00 8.33 7.72 0.93 1.68 7786.71 -7165.01 0.89 160.112H-6.50 12.60 15.75 2.72 13.66 2.99 2.82 0.94 4.57 6506.05 -6093.87 0.94 95.742H-6, 125 13.35 17.06 2.86 15.14 16.91 16.02 0.95 0.90 19040.23 -17969.53 0.88 263.932H-7, 14 13.74 17.49 2.90 23.77 19.94 18.75 0.94 1.19 44978.16 -40598.85 0.90 1099.993H-1.50 14.60 19.54 3.12 12.09 1.90 1.73 0.91 6.36 4774.84 -4542.89 0.95 48.963H-1, 125 15.35 21.35 3.30 16.14 6.44 5.90 0.92 2.51 6241.31 -5919.02 0.90 89.513H-2,50 16.10 22.80 3.45 12.03 3.67 3.40 0.93 3.28 4685.27 -4432.47 0.95 95.463H-2, 125 16.85 23.55 3.53 11.74 2.62 2.31 0.88 4.48 3968.48 -3792.59 0.93 37.713H-3,50 17.60 24.30 3.65 9.06 1.15 1.06 0.92 7.88 3719.09 -3603.49 0.97 22.783H-3, 125 18.35 25.05 3.79 5.20 1.20 1.12 0.94 4.33 2288.08 -2178.35 0.91 21.393H-4,50 19.10 25.80 3.93 8.81 1.39 1.27 0.92 6.34 4065.74 -3908.50 0.96 30.813H-4, 125 19.85 26.55 4.07 8.19 1.36 1.17 0.86 6.02 2859.41 -2733.49 0.91 23.273H-5,50 20.60 27.30 4.21 9.12 0.89 0.80 0.90 10.25 3398.41 -3304.30 0.97 17.253H-5, 125 21.35 28.05 4.34 7.30 0.90 0.80 0.89 8.11 2694.87 -2652.00 0.95 7.083H-6,50 22.10 28.74 4.47 6.12 0.36 0.31 0.87 17.00 2207.82 -2154.20 0.98 11.133H-6, 125 22.85 29.31 4.57 5.29 0.31 0.31 1.00 17.06 2082.90 -2032.85 0.91 8.513H-7,50 23.60 29.87 4.68 0.60 0.40 0.37 0.93 1.50 1367.68 -1194.65 0.87 32.664H-l,50 24.10 30.25 4.75 0.11 -0.13 -0.12 0.93 -0.85 156.25 -129.25 0.83 4.884H-1, 125 24.85 30.82 4.85 0.05 -0.65 -0.42 0.65 -0.08 57.65 -43.38 0.74 1.964H-2,50 25.60 31.38 4.96 0.12 -0.08 -0.14 -1.50 183.73 -151.26 0.82 5.894H-2, 125 26.35 31.95 5.06 4.01 1.31 1.22 0.93 3.06 4552.44 -4265.61 0.91 49.204H-3,50 27.10 32.58 5.18 0.11 -0.09 -0.09 1.00 -1.22 244.51 -181.09 0.74 11.234H-3, 125 27.85 33.23 5.30 5.99 1.45 1.40 0.97 4.13 2496.23 -2312.26 0.89 42.754H-4,50 28.60 33.88 5.42 0.09 0.05 0.00 1.80 197.96 -162.10 0.82 8.384H-4, 125 29.35 34.53 5.53 0.11 0.01 -0.02 11.00 241.65 -179.36 0.72 13.034H-5,50 30.10 35.21 5.66 0.06 1.33 1.28 0.96 0.05 5004.97 -4840.52 0.97 38.204H-5, 125 30.85 35.99 5.79 8.71 2.65 2.55 0.96 3.29 4341.91 -4117.09 0.92 50.864H-6,50 31.60 36.78 5.92 8.37 0.94 0.94 0.99 8.90 3932.85 -3823.59 0.97 23.754H-6, 125 32.35 37.57 6.02 7.35 2.00 1.83 0.92 3.68 2875.38 -2760.31 0.91 25.894H-7,50 33.10 38.44 6.12 10.61 1.60 1.50 0.93 6.63 3955.20 -3799.69 0.96 37.395H-l,50 33.60 39.40 6.23 21.14 3.95 3.68 0.93 5.35 7242.45 -6948.29 0.96 80.435H-1, 125 34.35 40.15 6.32 13.16 3.50 3.36 0.96 3.76 5710.37 -5404.26 0.90 76.135H-2,50 35.10 40.99 6.44 8.21 0.85 0.70 0.83 9.66 2759.93 -2687.21 0.97 15.385H-2, 125 35.85 42.06 6.61 10.24 3.40 3.13 0.92 3.01 3959.29 -3712.31 0.90 60.355H-3,50 36.60 43.23 6.79 15.80 3.13 2.87 0.92 5.05 5803.21 -5493.51 0.95 84.185H-3, 125 37.35 44.09 6.93 2.83 0.24 0.20 0.86 11.79 1026.12 -978.45 0.91 8.785H-4,50 38.10 44.96 7.06 6.99 1.15 1.11 0.96 6.08 2935.40 -2834.67 0.97 20.925H-4, 125 38.85 45.82 7.20 7.35 2.13 1.96 0.92 3.45 2756.58 -2554.92 0.89 46.605H-5,50 39.60 46.66 7.31 14.70 2.50 2.27 0.91 5.88 5134.13 -4889.39 0.95 56.855H-5, 125 40.35 47.49 7.42 14.49 6.45 5.95 0.92 2.25 6258.31 -5818.82 0.91 116.685H-6,50 41.10 48.46 7.54 23.78 5.28 4.78 0.91 4.50 7885.38 -7486.78 0.95 103.835H-6, 125 41.85 49.48 7.67 14.86 6.06 5.60 0.92 2.45 5847.84 -5445.19 0.89 98.135H-7,50 42.60 50.32 7.77 21.01 4.94 4.54 0.92 4.25 7309.48 -6894.98 0.94 107.386H-l,50 43.10 50.84 7.84 14.93 3.36 3.07 0.91 4.44 5903.40 -5561.75 0.94 82.096H-1, 125 43.85 51.52 8.26 15.01 8.67 7.96 0.92 1.73 6564.84 -6108.52 0.89 121.046H-2,50 44.60 52.61 9.74 27.25 16.74 15.67 0.94 1.63 36453.07 -32616.16 0.89 1020.266H-2, 125 45.35 53.30 10.67 27.53 11.94 10.81 0.91 2.31 8779.16 -8680.96 0.92 24.876H-3,50 46.10 53.94 11.54 26.98 7.69 7.05 0.92 3.51 11360.63 -10914.93 0.96 95.926H-3, 125 46.85 54.58 12.41 27.13 17.88 16.24 0.91 1.52 8482.88 -8258.80 0.92 80.176H-4,50 47.60 55.22 13.28 47.08 17.42 15.70 0.90 2.70 14663.52 -14295.08 0.97 133.316H-4, 125 48.35 56.68 15.26 37.98 28.36 25.65 0.90 1.34 11938.51 -11937.87 0.92 0.246H-5,50 49.10 59.68 19.31 84.97 38.89 35.87 0.92 2.18 40982.34 -40176.91 0.98 204.726H-5, 125 49.85 64.22 25.47 54.57 41.99 38.80 0.92 1.30 23838.75 -23549.26 0.92 79.176H-6,50 50.60 69.03 31.99 52.74 27.11 24.88 0.92 1.95 19382.38 -18731.67 0.97 192.506H-6, 125 51.35 69.96 33.25 18.32 26.06 24.39 0.94 0.70 8056.40 -7749.45 0.96 81.496H-7,37 51.85 70.45 33.91 23.27 17.14 15.82 0.92 1.36 9258.05 -9114.78 0.98 33.78
145-886B-1H-1,5O 0.50 0.77 0.12 9.35 10.37 9.93 0.96 0.90 17185.43 -15996.30 0.93 365.441H-2, 11 1.31 2.76 0.44 10.16 11.26 10.72 0.95 0.90 17444.17 -16151.21 0.93 409.862H-l,50 2.30 4.71 0.75 14.10 10.73 10.14 0.95 1.31 17927.93 -16830.07 0.94 316.782H-1, 125 3.05 4.73 0.76 12.69 23.31 22.03 0.95 0.54 18983.51 -16927.93 0.89 703.912H-2,50 3.80 4.76 0.76 10.61 9.94 9.46 0.95 1.07 14056.10 -12852.04 0.91 389.632H-2, 125 4.55 4.79 0.77 9.43 12.77 12.23 0.96 0.74 9530.20 -8647.33 0.91 309.592H-3,50 5.30 4.82 0.77 12.41 9.12 8.63 0.95 1.36 14578.18 -13371.56 0.92 340.102H-3, 125 6.05 4.85 0.77 11.13 17.29 16.65 0.96 0.64 12194.59 -10986.74 0.90 427.402H-4,50 6.80 4.87 0.78 16.98 22.33 21.32 0.95 0.76
236

PALEOENVIRONMENTAL VARIATION, SITES 885 AND 886
Table 3 (continued).
Core, section,interval (cm)
2H-4, 1252H-5, 502H-5, 1252H-6, 502H-6, 1252H-7, 453H-l,503H-1, 1253H-2, 503H-2, 1253H-3, 503H-3, 1253H-4, 503H-4, 1253H-5, 503H-5, 1253H-6, 503H-6, 1254H-1.504H-1, 1254H-2, 504H-2, 1254H-3, 504H-3, 1254H-4, 504H-4, 1254H-5, 504H-5, 1254H-6, 505H-l,505H-1, 1255H-2, 505H-2, 1255H-3, 505H-3, 1255H-4, 505H-4, 1255H-5, 505H-5, 1255H-6, 505H-6, 1255H-7, 506H-1, 506H-1, 1256H-2, 506H-2, 1256H-3, 506H-3, 1256H-4, 506H-4, 1256H-5, 506H-5, 1256H-6, 526H-6, 1256H-7, 507H-1.477H-1, 1257H-2, 477H-2, 1257H-3, 477H-3, 1257H-4, 477H-4, 1257H-5, 477H-5, 1257H-6, 477H-6, 1307H-7, 478X-1.50
Depth(mbsf)
7.558.309.059.80
10.5511.2511.8012.5513.3014.0514.8015.5516.3017.0517.8018.5519.3020.0521.3022.0522.8023.5524.3025.0525.8026.5527.3028.0528.8030.8031.5532.3033.0533.8034.5535.3036.0536.8037.5538.3039.0539.8040.3041.0541.8042.5543.3044.0544.8045.5546.3047.0547.8248.5549.3049.7750.5551.2752.0552.7753.5554.2755.0555.7756.5557.2758.1058.7759.30
Compositedepth (m)
4.904.934.964.985.287.499.119.83
10.6011.5612.6113.6714.6515.4016.1516.9017.7118.7520.4721.5122.5523.6624.5925.5026.1726.8527.5228.1928.8730.6631.3432.0132.7533.5034.2535.0035.7536.5037.2538.0038.7539.5640.3941.2041.9542.7043.4544.2044.9545.7046.4547.2048.1249.1950.2850.9752.1153.0253.8054.5255.3055.5556.3357.2058.1458.7959.5560.2260.75
Age
(Ma)
0.780.790.800.800.861.331.681.831.992.142.302.462.612.692.762.842.933.033.213.323.433.543.713.874.004.124.254.374.494.824.955.075.215.345.485.625.755.875.986.076.166.256.356.476.596.716.826.947.067.187.297.387.507.637.777.869.06
10.2911.3512.3213.3813.7214.7715.9517.2318.1119.1420.0520.77
XARM(10~6m3/g)
14.2612.4411.1212.569.15
12.7517.2611.3315.6011.3217.4315.8012.8214.4517.3513.7415.8311.6416.9611.688.68
10.2811.157.707.116.960.204.040.076.580.080.150.088.320.096.655.839.616.92
10.545.44
14.6310.786.943.308.105.473.27
11.006.95
22.2414.8515.9215.7412.7029.3920.9131.5928.9247.9336.2062.4448.7871.3755.03
105.3965.6238.7211.03
Xlf
(10-6m3/g)
34.0012.8531.28
8.7914.319.24
15.9113.998.739.569.43
10.862.85
4.5913.933.195.095.622.800.892.361.183.281.240.68
-0.12•
-0.222.69
-0.290.330.003.980.030.840.952.862.433.051.562.64[.881.320.432.000.580.151.851.715.246.344.068.482.46
9.3611.8713.2421.4524.5720.9035.4136.7950.3562.7184.8035.869.74
32.6612.3330.39
8.2913.718.63
14.9713.328.168.998.87
10.342.688.144.25
13.332.944.815.322.580.802.181.153.131.100.59
-0.120.09
-0.272.57
-0.310.28
-0.033.820.070.790.942.672.242.951.532.391.721.200.391.870.530.101.721.564.845.873.728.012.298.058.60
10.8312.2119.5722.5618.9532.4233.9846.7258.3779.7032.759.22
Xh/Xlf
0.960.960.970.940.960.930.940.950.930.940.940.950.940.940.930.960.920.940.950.920.890.92
0.950.890.871.011.151.230.951.050.830.000.962.010.940.990.930.920.970.980.910.910.910.900.930.910.700.930.920.920.930.920.940.930.940.920.910.920.910.920.910.920.920.930.930.940.910.95
XARM'X
0.420.970.361.430.641.381.080.811.791.181.851.454.501.673.780.994.962.293.024.179.754.369.452.355.73
10.24-1.6750.50-0.32
2.45-0.28
0.45
2.093.007.926.143.362.853.463.495.545.735.267.674.059.43
21.805.954.064.242.343.921.865.163.432.232.662.182.231.472.991.381.941.091.680.771.081.13
SIRM(10-6A/m2/g)
35309.8618910.2921191.5216163.6213160.7116088.1029031.9716430.9313796.148953.88
14687.2310376.446286.197834.02
10103.4618838.136085.175585.70
10604.854271.973189.684384.554056.347027.444612.982623.39256.05
1498.5091.12
11340.34129.30487.65176.52
13243.68265.94
3477.033552.576917.483034.918000.023406.595134.384030.022482.491429.962946.942355.291121.574050.492528.167610.025929.676217.098553.624781.84
10269.027612.39
10230.939553.70
16079.1612257.4119881.7617306.0830391.7723183.52
15423.4017720.03
IRM.0JT
(10"6A/m2/g)
-32072.44-17644.32-19599.23-14944.65-11398.96-14904.64-26521.77-14653.08-12691.30-8229.79
-13732.89-9819.99-5977.47-7264.36-9426.28
-17645.96-5831.82-5048.87
-10294.70-4224.29-3120.39-4196.38-3926.32-6476.59-4508.74-2567.60
-224.98-1431.61
-72.59-10902.72
-94.73^01.00-125.29
-12814.12-202.86
-3304.73-3381.03-6598.62-2854.74-7544.79-3234.32-4920.78-3825.57-2368.66-1406.73-2813.81-2242.49-1147.82-3859.19-2382.24-7285.45-5548.89-5826.15-8049.89-4597.94-9895.73-7277.04-9924.38-9177.02
-15695.98-11916.47-19313.51-16839.75-29341.97-22028.97
-15155.70-16517.44
S-ratio
0.910.930.920.920.870.930.910.890.920.920.940.950.950.930.930.940.960.900.970.990.980.960.970.920.980.980.880.960.800.960.730.820.710.970.760.950.950.950.940.940.95
0.950.950.980.950.951.020.950.940.960.940.940.940.960.960.960.970.960.980.970.970.970.970.95
0.980.93
HIRM(lO^A/m^g)
957.76366.28602.74338.88551.41323.02690.77425.22320.15198.31304.93155.6471.35
160.45158.27277.7564.42
129.7480.199.79
12.6938.3125.7597.9520.329.666.16
11.333.22
83.555.25
21.229.77
84.7015.8936.7533.4567.5745.93
134.1048.4853.6949.6123.76
5.0730.2322.90-3.9445.8534.4589.77
109.11103.28138.8038.9299.2688.16
111.66100.12150.50123.74189.67168.86329.42400.63
82.57339.62
Notes: XARM = anhysteretic remanent magnetism, Xlf = low-frequency susceptibility, Xhf = high-frequency susceptibility,saturated isothermal remanent magnetization, IRM_QJT = isothermal remanent magnetization. Blank = no measurement.
) , = frequency ratio, XARMIX = grain-size ratio, SIRM =
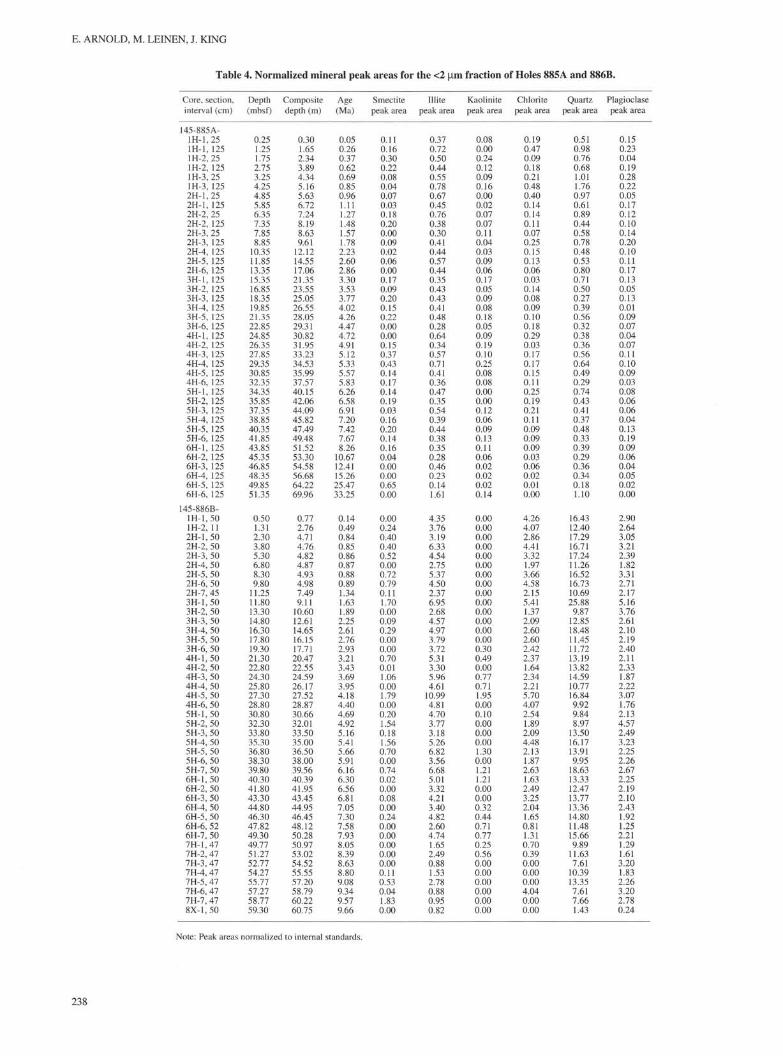
fraction has not yet been completed, so normalized peak areas arepresented instead of absolute weight percent (Tables 4, 5). The abso-lute values of the peak areas are only comparable for the individualmineral within each size fraction. Relative change is directly compa-rable among all minerals and size classes.
Smectite
Smectite is produced by continental weathering processes, weath-ering of volcanogenic material, and authigenic formation in the sedi-ment column; so the interpretation of this mineral group is complex.However, Chamley (1989) states that most of the smectite in pelagic
deep-sea sediments may be interpreted as continental weatheringproducts. The concentration of smectite is relatively uniform in the <2µm size fraction in both cores and through all units (Fig. 2A). For the2-20 µm size fraction (Fig. 3A), smectite shows about a threefoldincrease in peak area between approximately 25 and 35 mcd and isrelatively uniform and present in equal amounts in both stratigraphicclay Units I and III.
IlliteIllite is a ubiquitous terrigenous weathering product, generally
associated with cool, dry environments, that is unlikely to form authi-
237
E. ARNOLD, M. LEINEN, J. KING
Table 4. Normalized mineral peak areas for the <2 µm fraction of Holes 885A and 886B.
Core, section,interval (cm)
145-885A-1H-1.251H-1, 125lH-2,251H-2, 125lH-3,251H-3, 1252H-1.252H-1, 1252H-2, 252H-2, 1252H-3, 252H-3, 1252H-4, 1252H-5, 1252H-6, 1253H-1, 1253H-2, 1253H-3, 1253H-4, 1253H-5, 1253H-6, 1254H-1, 1254H-2, 1254H-3, 1254H-4, 1254H-5, 1254H-6, 1255H-1, 1255H-2, 1255H-3, 1255H-4, 1255H-5, 1255H-6, 1256H-1, 1256H-2, 1256H-3, 1256H-4, 1256H-5, 1256H-6, 125
145-886B-1H-1,5O1H-2, 112H-1, 502H-2, 502H-3, 502H-4, 502H-5, 502H-6, 502H-7, 453H-1.503H-2, 503H-3, 503H-4, 503H-5, 503H-6, 504H-1, 504H-2, 504H-3, 504H-4, 504H-5, 504H-6, 505H-1.505H-2, 505H-3, 505H-4, 505H-5, 505H-6, 505H-7, 506H-1.506H-2, 506H-3, 506H-4, 506H-5, 506H-6, 526H-7, 507H-1,477H-2, 477H-3, 477H-4, 477H-5, 477H-6, 477H-7, 478X-1.50
Depth(mbsf)
0.251.251.752.753.254.254.855.856.357.357.858.85
10.3511.8513.3515.3516.8518.3519.8521.3522.8524.8526.3527.8529.3530.8532.3534.3535.8537.3538.8540.3541.8543.8545.3546.8548.3549.8551.35
0.501.312.303.805.306.808.309.80
11.2511.8013.3014.8016.3017.8019.3021.3022.8024.3025.8027.3028.8030.8032.3033.8035.3036.8038.3039.8040.3041.8043.3044.8046.3047.8249.3049.7751.2752.7754.2755.7757.2758.7759.30
Compositedepth (m)
0.301.652.343.894.345.165.636.727.248.198.639.61
12.1214.5517.0621.3523.5525.0526.5528.0529.3130.8231.9533.2334.5335.9937.5740.1542.0644.0945.8247.4949.4851.5253.3054.5856.6864.2269.96
0.772.764.714.764.824.874.934.987.499.11
10.6012.6114.6516.1517.7120.4722.5524.5926.1727.5228.8730.6632.0133.5035.0036.5038.0039.5640.3941.9543.4544.9546.4548.1250.2850.9753.0254.5255.5557.2058.7960.2260.75
Age(Ma)
0.050.260.370.620.690.850.961.111.271.481.571.782.232.602.863.303.533.774.024.264.474.724.915.125.335.575.836.266.586.917.207.427.678.26
10.6712.4115.2625.4733.25
0.140.490.840.850.860.870.880.891.341.631.892.252.612.762.933.213.433.693.954.184.404.694.925.165.415.665.916.166.306.566.817.057.307.587.938.058.398.638.809.089.349.579.66
Smectitepeak area
0.110.160.300.220.080.040.070.030.180.200.000.090.020.060.000.170.090.200.150.220.00().()()0.150.370.430.140.170.140.190.030.160.200.140.160.040.000.000.650.00
0.000.240.400.400.520.000.720.790.111.700.000.090.290.000.000.700.011.060.001.790.000.201.540.181.560.700.000.740.020.000.080.000.240.000.000.000.000.000.110.530.041.830.00
Mitepeak area
0.370.720.500.440.550.780.670.450.760.380.300.410.440.570.440.350.430.430.410.480.280.640.340.570.710.410.360.470.350.540.390.440.380.350.280.460.230.141.61
4.353.763.196.334.542.755.374.502.376.952.684.574.973.793.725.313.305.964.61
10.994.814.703.773.185.266.823.566.685.013.324.213.404.822.604.741.652.490.881.532.780.880.950.82
Kaolinitepeak area
0.080.000.240.120.090.160.00
0.070.070.110.040.030.090.060.170.050.090.080.180.050.090.190.100.250.080.080.000.000.120.060.090.130.110.060.020.020.020.14
0.000.000.000.000.000.000.000.000.000.000.000.000.000.000.300.490.000.770.711.950.000.100.000.000.001.300.001.211.210.000.000.320.440.710.770.250.560.000.000.000.000.000.00
Chloritepeak area
0.190.470.090.180.210.480.400.140.140.110.070.250.150.130.060.030.140.080.090.100.180.290.030.170.170.150.110.250.190.210.110.090.090.090.030.060.020.010.00
4.264.072.864.413.321.973.664.582.155.411.372.092.602.602.422.371.642.342.215.704.072.541.892.094.482.131.872.631.632.493.252.041.650.811.310.700.390.000.000.004.040.000.00
Quartzpeak area
0.510.980.760.681.011.760.970.610.890.440.580.780.480.530.800.710.500.270.390.560.320.380.360.560.640.490.290.740.430.410.370.480.330.390.290.360.340.181.10
16.4312.4017.2916.7117.2411.2616.5216.7310.6925.889.87
12.8518.4811.4511.7213.1913.8214.5910.7716.849.929.848.97
13.5016.1713.919.95
18.6313.3312.4713.7713.3614.8011.4815.669.89
11.637.61
10.3913.357.617.661.43
Plagioclasepeak area
0.150.230.040.190.280.220.050.170.120.100.140.200.100.110.170.130.050.130.010.090.070.040.070.110.100.090.030.080.060.060.040.130.190.090.060.040.050.020.00
2.902.643.053.212.391.823.312.712.175.163.762.612.102.192.402.112.331.872.223.071.762.134.572.493.232.252.262.672.252.192.102.431.921.252.211.291.613.201.832.263.202.780.24
Note: Peak areas normalized to internal standards.
238

PALEOENVIRONMENTAL VARIATION, SITES 885 AND 886
Table 5. Normalized mineral peak areas for the 2-20 µm fraction of Holes 885A and 886B.
Core, section, Depth Composite Age Smectite Illite Kaolinite Chlorite Quartz Plagioclaseinterval (cm) (mbsf) depth (m) (Ma) peak area peak area peak area peak area peak area peak area
145-885A-1H-1.25 0.25 0.30 0.05 0.35 2.12 0.00 1.58 15.50 0.601H-1, 125 1.25 1.65 0.26 0.52 2.98 0.00 2.26 23.35 3.571H-2.25 1.75 2.34 0.37 0.54 3.21 0.00 1.34 17.03 2.951H-2, 125 2.75 3.89 0.62 0.09 1.44 0.00 0.74 7.79 1.461H-3.25 3.25 4.34 0.69 0.28 1.49 0.00 1.31 11.06 2.061H-3, 125 4.25 5.16 0.85 0.00 2.45 0.00 1.82 15.41 2.882H-1,25 4.85 5.63 0.96 0.10 3.14 0.00 1.65 16.49 2.952H-1, 125 5.85 6.72 1.11 0.00 2.27 0.00 1.38 12.01 2.732H-2,25 6.35 7.24 1.27 0.00 2.71 0.00 1.30 13.11 2.262H-2, 125 7.35 8.19 1.48 0.00 1.89 0.00 0.99 11.13 2.102H-3,25 7.85 8.63 1.57 0.32 2.00 0.00 0.00 9.63 3.012H-3, 125 8.85 9.61 1.78 0.00 2.75 0.00 1.13 13.36 2.462H-4, 125 10.35 12.12 2.23 0.26 3.04 0.00 1.39 18.31 2.562H-5, 125 11.85 14.55 2.60 0.00 2.10 0.00 0.84 13.29 2.242H-6, 125 13.35 17.06 2.86 0.00 1.46 0.00 0.00 8.54 3.593H-1, 125 15.35 21.35 3.30 1.44 2.79 0.00 1.69 12.88 2.473H-2, 125 16.85 23.55 3.53 0.46 3.13 0.00 1.54 9.98 1.693H-3, 125 18.35 25.05 3.77 1.57 9.53 0.00 4.00 15.46 5.713H-4, 125 19.85 26.55 4.02 1.96 11.59 1.04 5.45 17.12 3.453H-5, 125 21.35 28.05 4.26 1.43 6.40 1.14 3.20 14.36 2.343H-6, 125 22.85 29.31 4.47 1.69 5.65 0.00 3.61 8.97 1.864H-1, 125 24.85 30.82 4.72 4.54 22.16 2.30 11.66 14.14 2.844H-2, 125 26.35 31.95 4.91 3.13 9.26 0.00 7.14 19.03 4.164H-3, 125 27.85 33.23 5.12 1.14 3.70 0.32 2.05 20.86 2.114H-4, 125 29.35 34.53 5.33 0.68 7.23 0.45 3.46 25.46 3.254H-5, 125 30.85 35.99 5.57 0.93 2.84 0.00 1.15 11.57 1.944H-6, 125 32.35 37.57 5.83 0.74 4.14 0.26 2.00 13.18 1.885H-1, 125 34.35 40.15 6.26 0.29 2.90 0.00 1.91 12.98 1.975H-2, 125 35.85 42.06 6.58 0.03 4.05 0.00 2.26 15.30 3.045H-3, 125 37.35 44.09 6.91 1.10 6.48 1.06 3.58 12.86 1.665H-4, 125 38.85 45.82 7.20 0.00 3.32 0.51 1.43 13.77 1.855H-5, 125 40.35 47.49 7.42 0.00 3.18 0.00 1.40 15.35 2.485H-6, 125 41.85 49.48 7.67 0.08 2.80 0.00 1.36 10.17 1.516H-1, 125 43.85 51.52 8.26 0.00 2.60 0.51 0.78 11.94 2.026H-2, 125 45.35 53.30 10.67 0.52 2.61 0.28 0.50 12.65 2.066H-3, 125 46.85 54.58 12.41 0.00 2.78 0.34 0.00 10.76 2.046H-4, 125 48.35 56.68 15.26 0.64 3.13 0.00 0.00 14.13 2.716H-5, 125 49.85 64.22 25.47 1.38 2.46 0.00 0.34 13.11 0.816H-6, 125 51.35 69.96 33.25 0.00 2.49 0.38 0.00 1.35 0.25
145-886B-1H-1,5O 0.50 0.77 0.14 0.00 4.35 0.00 4.26 16.43 2.901H-2, 11 1.31 2.76 0.49 0.24 3.76 0.00 4.07 12.40 2.642H-l,50 2.30 4.71 0.84 0.40 3.19 0.00 2.86 17.29 3.052H-2,50 3.80 4.76 0.85 0.40 6.33 0.00 4.41 16.71 3.212H-3,50 5.30 4.82 0.86 0.52 4.54 0.00 3.32 17.24 2.392H-4,50 6.80 4.87 0.87 0.00 2.75 0.00 1.97 11.26 1.822H-5,50 8.30 4.93 0.88 0.72 5.37 0.00 3.66 16.52 3.312H-6,50 9.80 4.98 0.89 0.79 4.50 0.00 4.58 16.73 2.712H-7.45 11.25 7.49 1.34 0.11 2.37 0.00 2.15 10.69 2.173H-l,50 11.80 9.11 1.63 1.70 6.95 0.00 5.41 25.88 5.163H-2,50 13.30 10.60 1.89 0.00 2.68 0.00 1.37 9.87 3.763H-3,50 14.80 12.61 2.25 0.09 4.57 0.00 2.09 12.85 2.613H-4,50 16.30 14.65 2.61 0.29 4.97 0.00 2.60 18.48 2.103H-5,50 17.80 16.15 2.76 0.00 3.79 0.00 2.60 11.45 2.193H-6,50 19.30 17.71 2.93 0.00 3.72 0.30 2.42 11.72 2.404H-l,50 21.30 20.47 3.21 0.70 5.31 0.49 2.37 13.19 2.114H-2,50 22.80 22.55 3.43 0.01 3.30 0.00 1.64 13.82 2.334H-3,50 24.30 24.59 3.69 1.06 5.96 0.77 2.34 14.59 1.874H-4,50 25.80 26.17 3.95 0.00 4.61 0.71 2.21 10.77 2.224H-5,50 27.30 27.52 4.18 1.79 10.99 1.95 5.70 16.84 3.074H-6,50 28.80 28.87 4.40 0.00 4.81 0.00 4.07 9.92 1.765H-1,5O 30.80 30.66 4.69 0.20 4.70 0.10 2.54 9.84 2.135H-2,50 32.30 32.01 4.92 1.54 3.77 0.00 1.89 8.97 4.575H-3,50 33.80 33.50 5.16 0.18 3.18 0.00 2.09 13.50 2.495H-4,50 35.30 35.00 5.41 1.56 5.26 0.00 4.48 16.17 3.235H-5,50 36.80 36.50 5.66 0.70 6.82 1.30 2.13 13.91 2.255H-6,50 38.30 38.00 5.91 0.00 3.56 0.00 1.87 9.95 2.265H-7,50 39.80 39.56 6.16 0.74 6.68 1.21 2.63 18.63 2.676H-l,50 40.30 40.39 6.30 0.02 5.01 1.21 1.63 13.33 2.256H-2,50 41.80 41.95 6.56 0.00 3.32 0.00 2.49 12.47 2.196H-3,50 43.30 43.45 6.81 0.08 4.21 0.00 3.25 13.77 2.106H-4,50 44.80 44.95 7.05 0.00 3.40 0.32 2.04 13.36 2.436H-5,50 46.30 46.45 7.30 0.24 4.82 0.44 1.65 14.80 1.926H-6,52 47.82 48.12 7.58 0.00 2.60 0.71 0.81 11.48 1.256H-7,50 49.30 50.28 7.93 0.00 4.74 0.77 1.31 15.66 2.217H-1.47 49.77 50.97 8.05 0.00 1.65 0.25 0.70 9.89 1.297H-2,47 51.27 53.02 8.39 0.00 2.49 0.56 0.39 11.63 1.617H-3,47 52.77 54.52 8.63 0.00 0.88 0.00 0.00 7.61 3.207H-4,47 54.27 55.55 8.80 0.11 1.53 0.00 0.00 10.39 1.837H-5,47 55.77 57.20 9.08 0.53 2.78 0.00 0.00 13.35 2.267H-6,47 57.27 58.79 9.34 0.04 0.88 0.00 4.04 7.61 3.207H-7,47 58.77 60.22 9.57 1.83 0.95 0.00 0.00 7.66 2.788X-l,50 59.30 60.75 9.66 0.00 0.82 0.00 0.00 1.43 0.24
Note: Peak areas normalized to internal standards.
239

E. ARNOLD, M. LEINEN, J. KING
genically in the relatively thin sediments near Holes 885Aand 886B.For both size fractions, there is a relative increase in illite weightpercent centered on about 30 mcd (Figs. 2B, 3B). The magnitude ofthe increase is largest in the 2-20 µm size fraction and smallest in the<2 µm size fraction. The <2 µm size fraction demonstrates the great-est variability in illite throughout all depths, and there is some sugges-tion of an illite increase in the upper 10 m of the Unit I red clay. The2-20 µm size fraction has uniform and approximately equal illiteconcentrations in the upper and lower clay units.
Kaolinite
Kaolinite is a terrigenous weathering product usually associatedwith strong hydrolysis. The error associated with kaolinite determi-nation in this study is large due to the generally low kaolinite concen-tration in this study area, so only general comments may be madeabout variations in this mineral group. Kaolinite is present in highlyvariable amounts in all units for the <2 µm size fraction (Fig. 2C). The2-20 µm size fraction contains a significant, but highly variableamount of kaolinite in only the diatom ooze unit (Fig. 3C).
Chlorite
Chlorite is a mineral phase that is usually used to indicate mechan-ical weathering of terrigenous sediments as it is highly susceptible tohydrolysis. The <2 µm fraction (Fig. 2D) shows low variability andlow concentrations in the lower brown clay unit and high variabilityin the diatom unit and the upper red clay unit. Chlorite concentrationsincrease in sediments shallower than 10 mcd. The chlorite concentra-tion in the 2-20 µm size fraction (Fig. 3D) is low in the lower brownclay unit, and high and variable in the diatom ooze, where again a con-centration peak is observed centered at about 30 mcd. The concentra-tion of chlorite drops at the Unit I/II boundary, and the Hole 885 A and886B records diverge; the normalized peak areas are lower in Hole885A than in Hole 886B. This divergence appears to be a systematiclaboratory error.
Quartz
Quartz is a primary mineral that is not formed authigenically onthe seafloor. Both records (Figs. 2E, 3E) show a high variability, butuniform proportion, of quartz throughout all units. Quartz concentra-tions seem to increase in sediments shallower than 10 mcd in the <2µm fraction.
Plagioclase
Plagioclase is also a primary mineral not authigenically formed onthe seafloor. Figures 2F and 3F illustrate the Plagioclase distribution inthe Hole 885 A and 886B sediments. Both records are variable through-out all units. The <2 µm fraction shows a slight upcore increase, whilethe 2-20 µm fraction is relatively uniform in concentration.
Peak Height Ratios
Another way to examine the mineralogy data is to look at relativechange between mineral groups. The compositional changes betweengroups of minerals are indicative of either changing tectonics, cli-matic conditions, source area, or diagenetic processes. Figures 4 and5 illustrate peak area ratios between pairs of minerals for the <2 µmand 2-20 µm size fractions. The ratio of kaolinite to illite varies as afunction of the amount of source area hydrolysis, which is related torainfall. Kaolinite formation is favored in temperate, well-drainedsoils, whereas illite is a ubiquitous clay mineral associated with cooler,drier climates. The <2 µm fraction is highly variable throughout sedi-ments from both Holes 885A and 886B (Fig. 4A). The 2-20 µm sizefraction (Fig. 5A) suggests an abrupt compositional change at theUnit II/III boundary. Unit III contains no kaolinite in this size fraction.
There is a sharp increase to an overall maximum in the proportion ofkaolinite at the bottom of Unit II, followed by a monotonic declinethat reaches zero again at the base of Unit I.
The ratio of smectite/illite (S/I) is usually indicative of eithervolcanism or hydrolysis in deep-sea sediments. However, in this case(Figs. 4B, 5B), the large S/I ratios in Unit III is consistent with a largehydrothermal component in the lower brown clay unit (Dickens andOwen, this volume). The S/I ratio drops at the base of Unit II andremains relatively constant throughout the remainder of the sedimentcolumn in the <2 µm and 2-20 µm fraction.
Kaolinite to quartz (Figs. 4C, 5C) is the ratio of a hydrolysissensitive mineral to a primary mineral. In both size fractions, K/Q isgenerally low in Unit III, reaches a maximum at about 30 mcd, anddecreases toward the top of the core. This variation is more pro-nounced in the 2-20 µm size fraction, where K/Q goes to zero at theUnit I/II boundary.
The illite/quartz (Figs. 4D, 5D) ratios display decreasing values inthe <2 µm fraction from the bottom to the top of Unit III; I/Q is rela-tively uniform in the 2-20 µm fraction of this interval. In both size frac-tions, the lower part of Unit II displays uniform ratios; there is a peakin this ratio centered at about 30 mcd. This peak is much more pro-nounced in the 2-20 µm size fraction. The ratio decreases slightly inboth size fractions from the bottom to the top of the upper red clay unit.
In both size fractions, chlorite/quartz ratios (Figs. 4E, 5E), indica-tive of mechanical weathering, are generally very small in lower clayUnit III, show a slight increase at the Unit II/III boundary, and anothersmall step up at -45 mcd. There is a sharp peak in this ratio centeredat approximately 30 mcd, followed by uniform values throughout theremainder of the diatom unit and Unit I.
Rock Magnetics vs. Mineralogy
Finally, we compare the rock-magnetic properties to the mineral-ogy, to examine how the two covary. Figure 6 illustrates the low-frequency susceptibility and the <2 µm quartz peak area plotted vs.composite depth. The two variables covary in the upper red clay anddiatom ooze units. However, the signals decouple at the Unit II/IIIboundary. This decoupling of the signal implies that the sedimentarymaterial in Unit III is from a different source than the terrigenousmaterial in Unit I.
Figure 7 illustrates the illite/quartz ratio and the S-ratio plotted asa function of composite depth. These variables strongly correspond atabout 30 mcd. Illite/quartz increases occur at the same place that therock magnetic parameter, S, indicates a shift from low to high coer-civity iron oxide mineralogy.
Accumulation Rates
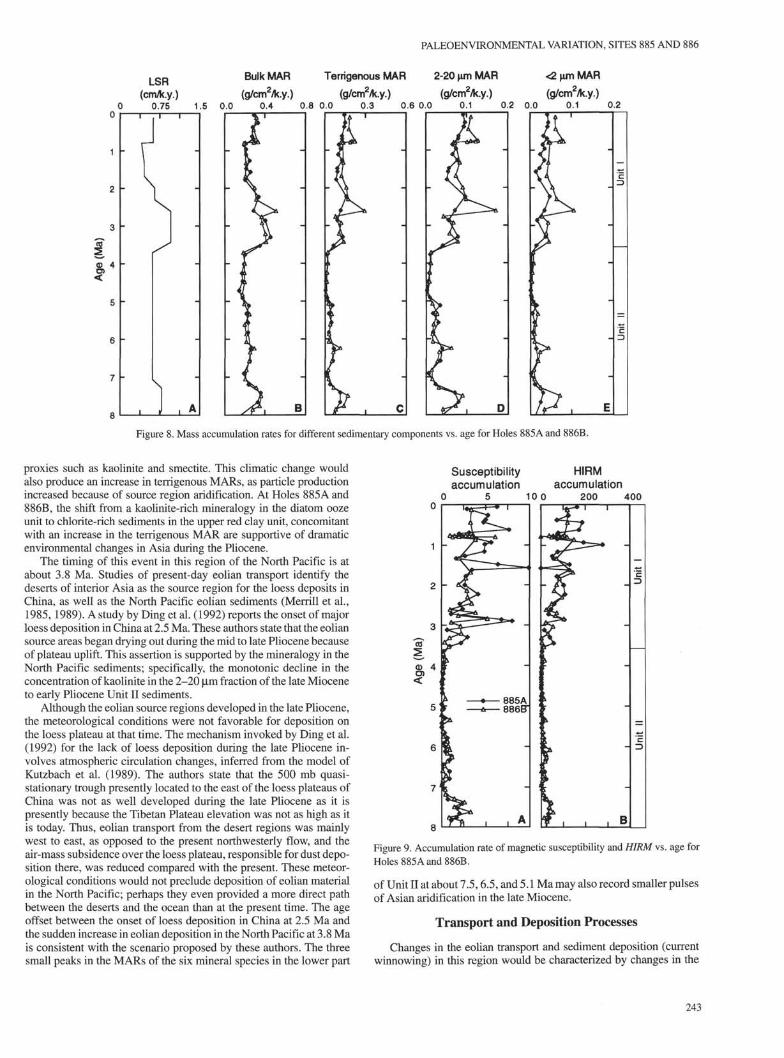
Figures illustrating the mass accumulation rates (MARs) of differ-ent parameters over time are useful here because the diatom oozerepresents a large dilutional component to the terrigenous sedimentsproximal to Sites 885 and 886. Figure 8 illustrates the MARs of thebulk sediment, terrigenous fraction, and the 2-20 µm and <2 µmfractions of the sediment used for mineralogical analysis. There isoffset in the terrigenous MARs of Holes 885 A and 886B in the upperclay unit. This could be the result of either systematic laboratory error,sediment winnowing, or focusing differences between the two sites.Because there are no systematic offsets in the primary rock magneticparameters, or in the bulk MARs, we think the former is the case.Snoeckx et al. (this volume) provide a detailed interpretation of theeolian accumulation at Sites 885 and 886. For the parameters pre-sented, we display only the upper two units for the mass accumulationdiscussion; we have few samples from the lower clay unit, and theages of these sediments are uncertain.
Figure 9 displays the magnetic concentration parameters plottedas accumulation rates vs. age. The magnetic-iron oxide concentra-tion parameters (Xlf and HIRM) track the terrigenous MARs. These

PALEOENVIRONMENTAL VARIATION, SITES 885 AND 886
Kaolinite/lllite Smectite/1 II ite Kaolinite/Quartz Illite/Quartz Chlorite/Quartz
0.0 0.4 O.θ 0.0 2.5 5.0 0.0 0.5 1.0 0 2 4 0.0 0.8 1.6
Figure 4. Peak area ratios for the <2 µm terrigenous size fraction vs. composite depth for Holes 885A and 886B.
Kaolinite/lllitθ Smectite/lllite Kaolinite/Quartz Illite/Quartz Chlorite/Quartz0.0 0.2 0.4 0 1 2 0.0 0.1 0.2 0.0 0.8 1.6 0.0 0.5 1.0
Figure 5. Peak area ratios for the 2-20 µm terrigenous size fraction vs. composite depth for Holes 885A and 886B.
records show a small, LSR-controlled peak at the base of Unit II (-7.5Ma), low accumulation and low variability through the middle partof this unit, followed by an abrupt increase in accumulation at -3.8Ma, which continues through all of Unit I.
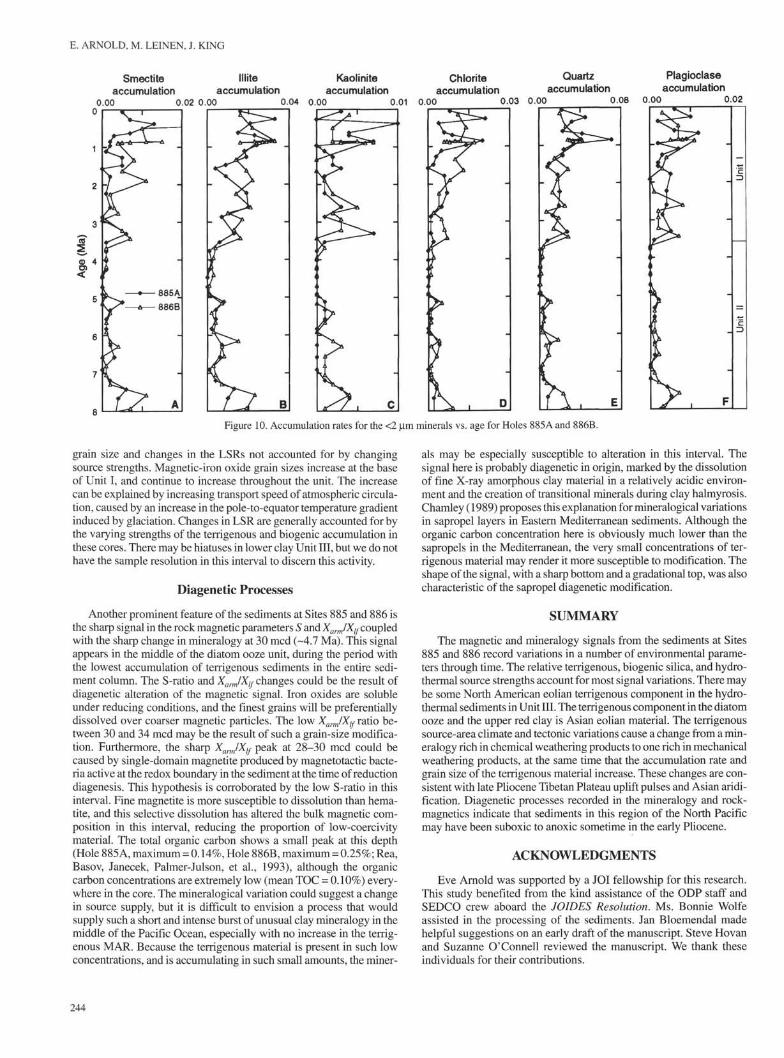
Figure 10 illustrates the accumulation rates for the mineral phasesidentified in the <2 µm size fraction. With the exception of kaolinite,which increases in the Unit II diatom ooze in the 2-20 µm sizefraction, the <2 µm patterns are identical with the larger size class,and are not illustrated. For all minerals, the accumulation rate hassmall peaks at the base of Unit II at -7.5, 6.5, and 5.1 Ma anddecreases to low values after 5 Ma. The MARs of the minerals stay
low until an abrupt increase at about 3.8 Ma, which continues toincrease throughout the late Pleistocene.
DISCUSSION
There are several changes in the mineralogy and magnetic proper-ties that imply varying environmental conditions at Sites 885 and 886.Unit III, the lower brown clay unit, is characterized by high concentra-tions of fine-grained ferrimagnetic iron oxides, that contain a softermagnetic carrier than the Unit I sediments, low bulk and terrigenousMARs, and a mineralogy characterized by a large proportion of smec-
241

E. ARNOLD, M. LEINEN, J. KING
Quartz(peak area)
Illite/Quartz0 0.4 0.8 1.2 1.6
1.0 2.0
"-20 0 20 40 60
Susceptibility
(10'6m3/g)Figure 6. Less than 2 µm quartz peak area and low frequency susceptibility vs.composite depth for Hole 885A. Open symbols = susceptibility, solid symbols= quartz peak area.
tite relative to the other units. Unit II, the diatom ooze, is marked bylow magnetic-iron oxide concentrations and fine grain sizes, moderatesedimentation rates, low bulk and terrigenous MARs, and an interval ofanomalous mineralogy and magnetic composition centered at 30 mcd.
The Unit I/II boundary is marked by a step up in the terrigenous MARand magnetic-iron oxide concentrations. These increases continue tothe top of the core and are accompanied by an increase in the iron oxidegrain size, as well as an increase in the chlorite concentrations.
Sediment Sources
The potentially important sediment sources proximal to Site 885and 886 now and in the past include eolian terrigenous and volcano-genie sediment, siliceous biogenic material, and hydrothermal pre-cipitates. The rock-magnetic and mineralogy measurements mimicthe major lithological changes, which account for most of the vari-ation observed for these parameters. There is close covariance of themineralogy and magnetics in the upper two lithologic units (Fig. 6).The decoupling of the signal at the base of Unit II, specifically a dropin quartz concentration together with a sharp increase in the ironoxide concentration, occurs at the same time as a shift toward amagnetic composition enriched (relative to the Unit I sediments) in alow-coercivity component. Large concentrations of iron oxides indeep-sea sediments are produced by hydrothermal, terrigenous sedi-mentary or volcanogenic processes. The sediment in Unit III is likelycomposed of a large hydrothermal component (Dickens and Owen,this volume). Hydrothermal sediment is characterized by a widevariety of magnetic carriers, such as magnetite, hematite or goethite,which were observed in shipboard smear-slide analyses (Rea, Basov,Janecek, Palmer-Julson, et al., 1993).
Although the magnetic composition of terrigenous material woulddepend on the source area composition, terrigenous material from avolcanogenic environment would be enriched in low-coercivity mag-netic minerals. We hypothesize that the hydrothermal sediments inUnit III may also contain a small amount of eolian, andesitic, ter-rigenous material. Kyte et al. (1993) propose andesitic volcanism inwestern Mexico as a source for the Late Cretaceous terrigenoussediments identified in the bottom of Core LL44-GPC3. Plate tec-
0.9 0.8S-ratio
Figure 7. The S-ratio and 2-20 µm illite/quartz ratio vs. composite depth forHole 885A. Open symbols = S-ratio, solid symbols = illite/quartz peak area.
tonic calculations indicate that conditions may have been favorablefor some andesitic eolian contribution in the past. The clay materialin the top two units of the sediment column is likely from an Asiansource, as indicated by the present location of the site and the covari-ance of the rock-magnetic and mineralogy measurements. The in-crease in the importance of this eolian component is considered in thecontext of the climate and tectonic forces driving the signal.
Tectonic and Climatic Variation
There are two types of tectonic variation that we need to considerto interpret the mineralogical and rock magnetic signals from Holes8 85A and 886B. The first is plate motion, which will influence thesource contribution to the sediments. Based on the paleopole recon-struction of Sager and Pringle (1988), Holes 885A and 886B werelocated only 3° south of the present location at 45°N during the lateMiocene deposition of sediments at the Unit II/III boundary (R.Larson, pers. comm., 1994), so plate motion should not complicatethe interpretation of the eolian sediments above this interval. How-ever, the basement at Sites 885 and 886 has been dated at -80 Ma(Keller et al , this volume). Paleomagnetic plate rotations indicate thatthe plate was formed at about 16°N. Thus, we need to control for platemotion when interpreting the Unit III sediments. Low latitudes areinfluenced by easterly eolian transport from the North Americancontinent. This supports our hypothesis for some supply of andesiticeolian material to the Unit III hydrothermal sediments.
Tectonic activity in the Asian source area, such as uplift of theHimalayan Mountains or Tibetan Plateau, could impact eolian sedi-mentation proximal to Sites 885 and 886 as a result of climatic forcing.Geological evidence indicates that uplift pulses are episodic (Copelandet al., 1990; Amano and Taira, 1992; Hovan and Rea, 1993), so theresponse in the sediment record would be abrupt if the uplift-inducedclimate forcing is linear. Uplift-forced climatic change (Kutzbach etal., 1989; Ruddiman et al, 1989) is hypothesized to result in coolingof northern Asia and drying of the Eurasian interior. The impact on theeolian sediments in the North Pacific would be manifested as anincrease in the mechanical weathering proxies such as in chlorite,quartz, illite, and Plagioclase at the expense of chemical weathering
PALEOENVIRONMENTAL VARIATION, SITES 885 AND 886
Bulk MAR Terrigenous MAR 2-20 µm MAR <2µmMAR
(g/cm2/k.y.) (g/cm2/k.y.) (g/cm2/k.y.) (g/cm2/k.y.)0 0.75 1.5 0.0 0.4 0.8 0.0 0.3 0.6 0.0 0.1 0.2 0.0 0.1 0.2
Figure 8. Mass accumulation rates for different sedimentary components vs. age for Holes 885A and 886B.
proxies such as kaolinite and smectite. This climatic change wouldalso produce an increase in terrigenous MARs, as particle productionincreased because of source region aridification. At Holes 885A and886B, the shift from a kaolinite-rich mineralogy in the diatom oozeunit to chlorite-rich sediments in the upper red clay unit, concomitantwith an increase in the terrigenous MAR are supportive of dramaticenvironmental changes in Asia during the Pliocene.
The timing of this event in this region of the North Pacific is atabout 3.8 Ma. Studies of present-day eolian transport identify thedeserts of interior Asia as the source region for the loess deposits inChina, as well as the North Pacific eolian sediments (Merrill et al.,1985, 1989). A study by Ding et al. (1992) reports the onset of majorloess deposition in China at 2.5 Ma. These authors state that the eoliansource areas began drying out during the mid to late Pliocene becauseof plateau uplift. This assertion is supported by the mineralogy in theNorth Pacific sediments; specifically, the monotonic decline in theconcentration of kaolinite in the 2-20 µm fraction of the late Mioceneto early Pliocene Unit II sediments.
Although the eolian source regions developed in the late Pliocene,the meteorological conditions were not favorable for deposition onthe loess plateau at that time. The mechanism invoked by Ding et al.(1992) for the lack of loess deposition during the late Pliocene in-volves atmospheric circulation changes, inferred from the model ofKutzbach et al. (1989). The authors state that the 500 mb quasi-stationary trough presently located to the east of the loess plateaus ofChina was not as well developed during the late Pliocene as it ispresently because the Tibetan Plateau elevation was not as high as itis today. Thus, eolian transport from the desert regions was mainlywest to east, as opposed to the present northwesterly flow, and theair-mass subsidence over the loess plateau, responsible for dust depo-sition there, was reduced compared with the present. These meteor-ological conditions would not preclude deposition of eolian materialin the North Pacific; perhaps they even provided a more direct pathbetween the deserts and the ocean than at the present time. The ageoffset between the onset of loess deposition in China at 2.5 Ma andthe sudden increase in eolian deposition in the North Pacific at 3.8 Mais consistent with the scenario proposed by these authors. The threesmall peaks in the MARs of the six mineral species in the lower part
Susceptibility HIRMaccumulation accumulation
0 5 10 0 200 400
Figure 9. Accumulation rate of magnetic susceptibility and HIRM vs. age forHoles 885A and 886B.
of Unit II at about 7.5,6.5, and 5.1 Ma may also record smaller pulsesof Asian aridification in the late Miocene.
Transport and Deposition Processes
Changes in the eolian transport and sediment deposition (currentwinnowing) in this region would be characterized by changes in the
E. ARNOLD, M. LEINEN, J. KING
Smectite Illite Kaolinitβ Chlorite Quartz Plagioclaseaccumulation accumulation accumulation accumulation accumulation accumulation
0.00 0.02 0.00 0.04 0.00 0.01 0.00 0.03 0.00 0.08 0.00 0.02
Figure 10. Accumulation rates for the <2 µm minerals vs. age for Holes 885A and 886B.
grain size and changes in the LSRs not accounted for by changingsource strengths. Magnetic-iron oxide grain sizes increase at the baseof Unit I, and continue to increase throughout the unit. The increasecan be explained by increasing transport speed of atmospheric circula-tion, caused by an increase in the pole-to-equator temperature gradientinduced by glaciation. Changes in LSR are generally accounted for bythe varying strengths of the terrigenous and biogenic accumulation inthese cores. There may be hiatuses in lower clay Unit III, but we do nothave the sample resolution in this interval to discern this activity.
Diagenetic Processes
Another prominent feature of the sediments at Sites 885 and 886 isthe sharp signal in the rock magnetic parameters S and Xai.m/Xtf coupledwith the sharp change in mineralogy at 30 mcd (-4.7 Ma). This signalappears in the middle of the diatom ooze unit, during the period withthe lowest accumulation of terrigenous sediments in the entire sedi-ment column. The S-ratio and XarmIX^ changes could be the result ofdiagenetic alteration of the magnetic signal. Iron oxides are solubleunder reducing conditions, and the finest grains will be preferentiallydissolved over coarser magnetic particles. The low Xarm/Xlf ratio be-tween 30 and 34 mcd may be the result of such a grain-size modifica-tion. Furthermore, the sharp XarmIXlf peak at 28-30 mcd could becaused by single-domain magnetite produced by magnetotactic bacte-ria active at the redox boundary in the sediment at the time of reductiondiagenesis. This hypothesis is corroborated by the low S-ratio in thisinterval. Fine magnetite is more susceptible to dissolution than hema-tite, and this selective dissolution has altered the bulk magnetic com-position in this interval, reducing the proportion of low-coercivitymaterial. The total organic carbon shows a small peak at this depth(Hole 885A, maximum = 0.14%, Hole 886B, maximum = 0.25%; Rea,Basov, Janecek, Palmer-Julson, et al., 1993), although the organiccarbon concentrations are extremely low (mean TOC = 0.10%) every-where in the core. The mineralogical variation could suggest a changein source supply, but it is difficult to envision a process that wouldsupply such a short and intense burst of unusual clay mineralogy in themiddle of the Pacific Ocean, especially with no increase in the terrig-enous MAR. Because the terrigenous material is present in such lowconcentrations, and is accumulating in such small amounts, the miner-
als may be especially susceptible to alteration in this interval. Thesignal here is probably diagenetic in origin, marked by the dissolutionof fine X-ray amorphous clay material in a relatively acidic environ-ment and the creation of transitional minerals during clay halmyrosis.Chamley (1989) proposes this explanation for mineralogical variationsin sapropel layers in Eastern Mediterranean sediments. Although theorganic carbon concentration here is obviously much lower than thesapropels in the Mediterranean, the very small concentrations of ter-rigenous material may render it more susceptible to modification. Theshape of the signal, with a sharp bottom and a gradational top, was alsocharacteristic of the sapropel diagenetic modification.
SUMMARY
The magnetic and mineralogy signals from the sediments at Sites885 and 886 record variations in a number of environmental parame-ters through time. The relative terrigenous, biogenic silica, and hydro-thermal source strengths account for most signal variations. There maybe some North American eolian terrigenous component in the hydro-thermal sediments in Unit III. The terrigenous component in the diatomooze and the upper red clay is Asian eolian material. The terrigenoussource-area climate and tectonic variations cause a change from a min-eralogy rich in chemical weathering products to one rich in mechanicalweathering products, at the same time that the accumulation rate andgrain size of the terrigenous material increase. These changes are con-sistent with late Pliocene Tibetan Plateau uplift pulses and Asian aridi-fication. Diagenetic processes recorded in the mineralogy and rock-magnetics indicate that sediments in this region of the North Pacificmay have been suboxic to anoxic sometime in the early Pliocene.
ACKNOWLEDGMENTS
Eve Arnold was supported by a JOI fellowship for this research.This study benefited from the kind assistance of the ODP staff andSEDCO crew aboard the JOIDES Resolution. Ms. Bonnie Wolfeassisted in the processing of the sediments. Jan Bloemendal madehelpful suggestions on an early draft of the manuscript. Steve Hovanand Suzanne O'Connell reviewed the manuscript. We thank theseindividuals for their contributions.
244

PALEOENVIRONMENTAL VARIATION, SITES 885 AND 886
REFERENCES
Amano, K., and Taira, A., 1992. Two-phase uplift of the higher Himalayassince 17 Ma. Geology, 20:391-394.
Blank, M., Leinen, M., and Prospero, J.M., 1985. Major eolian inputs indicatedby the mineralogy of aerosols and sediments in the western North Pacific.Nature, 314:84-86.
Chamley, H., 1989. Clay Sedimentology: Heidelberg (Springer-Verlag).Copeland, P., and Harrison, T.M., 1990. Episodic rapid uplift in the Himalaya
revealed by 40Ar/39Ar analysis of detrital K-feldspar and muscovite,Bengal Fan. Geology, 18:354-357.
Ding, Z., Rutter, N., Jingtai, H., and Tungsheng, L., 1992. A coupled environ-mental system formed at about 2.5 Ma in east Asia. Palaeogeogr., Palaeo-climatol., Palaeoecol., 94:223-242.
Doh, S.-J., King, J.W., and Leinen, M., 1988. A rock-magnetic study of giantpiston core LL44-GPC3 from the central North Pacific and its pale-oceanographic implications. Paleoceanography, 3:89-111.
Griffin, J.J., Windom, H., and Goldberg, E.D., 1968. The distribution of clayminerals in the World Ocean. Deep-Sea Res. Part A, 15:433-459.
Hovan, S., and Rea, D.K., 1992. The Cenozoic record of continental mineraldeposition on Broken and Ninetyeast Ridges, Indian Ocean: southernAfrican aridity and sediment delivery from the Himalayas. Paleoceanog-raphy, 7:833-860.
King, J.W., Bloemendal, J., and Gangemi, P., 1989. Paleomagnetic and rock-magnetic stratigraphy of ESOPE core 63, Southern Nares Abyssal Plain.In Schuttenhelm, R.T.E., Auffret, G.A., Buckley, D.E., Cranston, R.E.,Murray, C.N., Shepard, L.E., and Spijkstra, A.E. (Eds.), The ESOPEInternational Expedition, Geoscience Investigations of Two North Atlan-tic Abyssal Plains: Luxembourg (Office for Official Publications of theEuropean Community), 611-636.
Kutzbach, J.E., Guetter, PJ., Ruddiman, W.F., and Prell, W.L., 1989. Sensitiv-ity of climate to late Cenozoic uplift in southern Asia and the Americanwest: numerical experiments. J. Geophys. Res., 94:18393-18407.
Kyte, ET, Leinen, M., Heath, G.R., and Zhou, L., 1993. Cenozoic sedimentationhistory of the central North Pacific: inferences from the elemental geochem-istry of Core LL44-GPC3. Geochim. Cosmochim. Acta, 57:1719-1740.
Landa,E.R.,andGast, R.G., 1973. Evaluation of cry stallinity in hydrated ferricoxides. Clays Clay Miner., 21:121-130.
Leinen, M., 1985. Quartz content of Northwest Pacific Hole 576A and impli-cations for Cenozoic eolian transport. In Heath, G.R., Burckle, L.H., et al.,Init. Repts. DSDP, 86: Washington (U.S. Govt. Printing Office), 581-588.
, 1989. The late Quaternary record of atmospheric transport to theNorthwest Pacific from Asia. In Leinen, M., and Sarnthein, M. (Eds.),Paleoclimatology and Paleometeorology: Modern and Past Patterns ofGlobal Atmospheric Transport: New York (Kluwer), 693-732.
Merrill, J.T., Bleck, R., and Avila, L., 1985. Modeling transport to the MarshallIslands./. Geophys. Res., 90:12927-12936.
Merrill, J.T., Uematsu, M., and Bleck, R., 1989. Meteorological analysis oflong range transport of mineral aerosols over the North Pacific. J. Geophys.Res., 94:8584-8598.
Oldfield, E, Hunt, A., Jones, D.H., Chester, R., Dearing, J.A., Olsson, L.,and Prospero, J.M., 1985. Magnetic differentiation of atmospheric dusts.Nature, 317:516-518.
Rea, D.K., Basov, I.A., Janecek, T.R., Palmer-Julson, A., et al., 1993. Proc.ODP, Init. Repts., 145: College Station, TX (Ocean Drilling Program).
Robinson, S.G., 1986. The late Pleistocene paleoclimatic record of NorthAtlantic deep-sea sediments revealed by mineral-magnetic measurements.Phys. Earth Planet. Inter., 42:22-47.
Ruddiman, W.F., Prell, W.L., and Raymo, M.E., 1989. Late Cenozoic uplift insouthern Asia and the American West: rationale for general circulationmodeling experiments. J. Geophys. Res., 94:18379-18391.
Sager, W.W., and Pringle, M.S., 1988. Mid-Cretaceous to early Tertiaryapparent polar wander path of the Pacific Plate. J. Geophys. Res.,93:11753-11771.
Schramm, C.T., 1989. Cenozoic climatic variation recorded by quartz and clayminerals in North Pacific Sediments. In Leinen, M., and Sarnthein, M.(Eds.), Paleoclimatology and Paleometeorology: Modern and Past Pat-terns of Global Atmospheric Transport: Dordrecht (NATO ASI Series),805-839.
* Abbreviations for names of organizations and publications in ODP reference lists followthe style given in Chemical Abstracts Service Source Index (published by AmericanChemical Society).
Date of initial receipt: 4 April 1994Date of acceptance: 1 August 1994Ms 145SR-113
245