140au0402 strength of materials · r k rajput, ―strength of materials: mechanics of solids”, s....
TRANSCRIPT

140AU0402 STRENGTH OF MATERIALS
REFERENCES
Hibbeler RC, ―Mechanics of Materials‖, Prentice-Hall of India, New Delhi,
2013.
James M Gere, ― Mechanics of Materials‖, Cengage Learning, India, 2012.
R K Rajput, ―Strength Of Materials: Mechanics Of Solids”, S. Chand, 2006
R S Khurmi, ―Strength Of Materials”, S Chand, 2006.

L: 9, T: 3
• Rigid body and deformable body
• Stiffness – types of stresses and strains
• Stresses in simple and compound bars under axial load
• Factor of safety
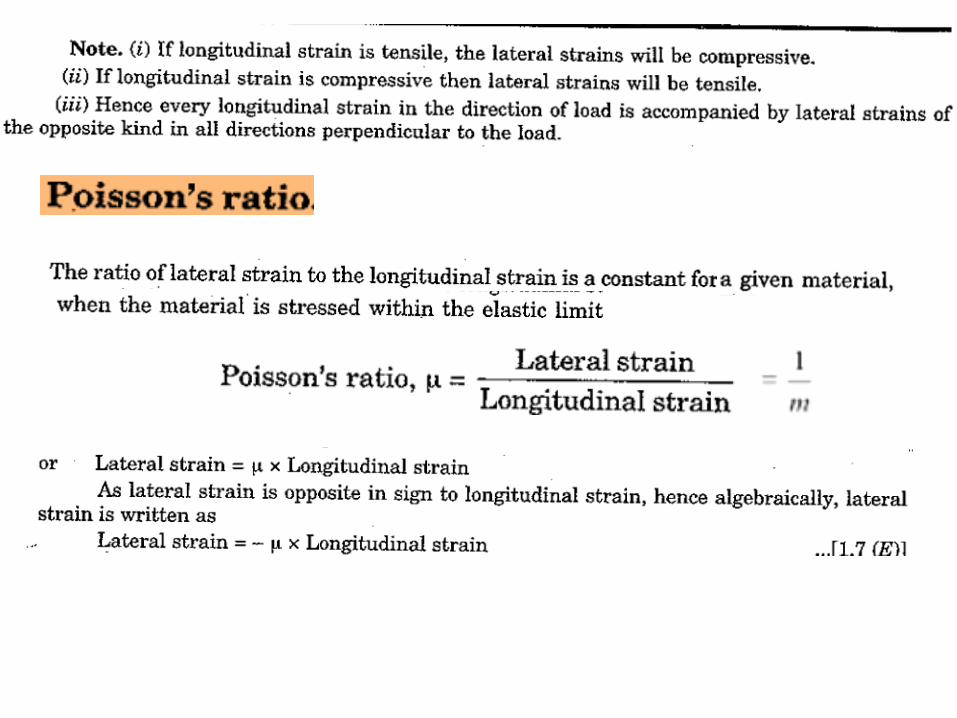
• Poisson’s ratio
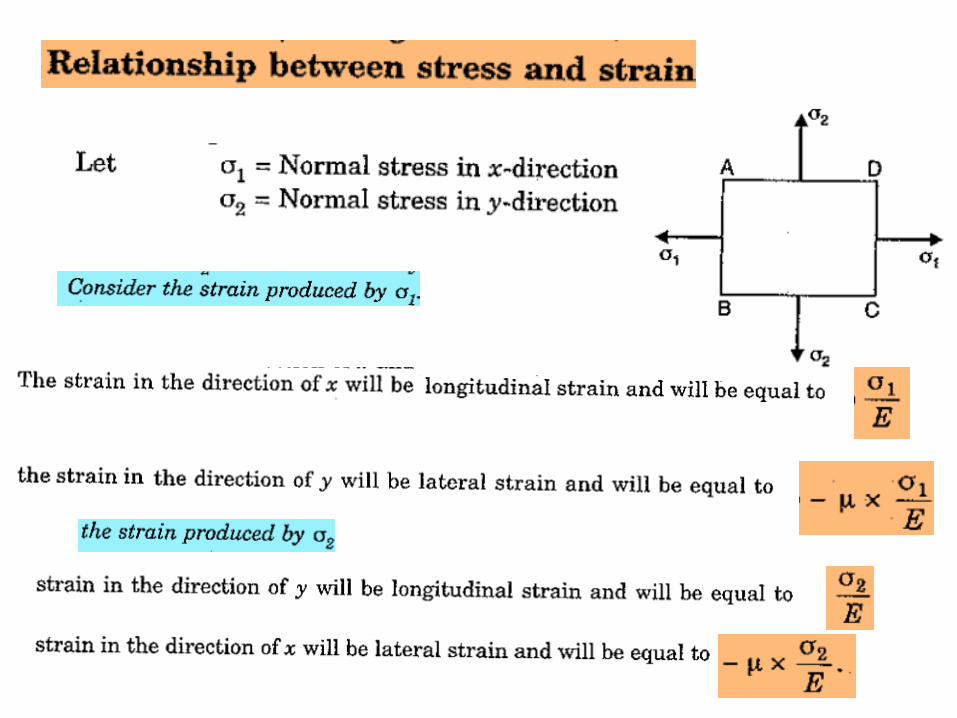
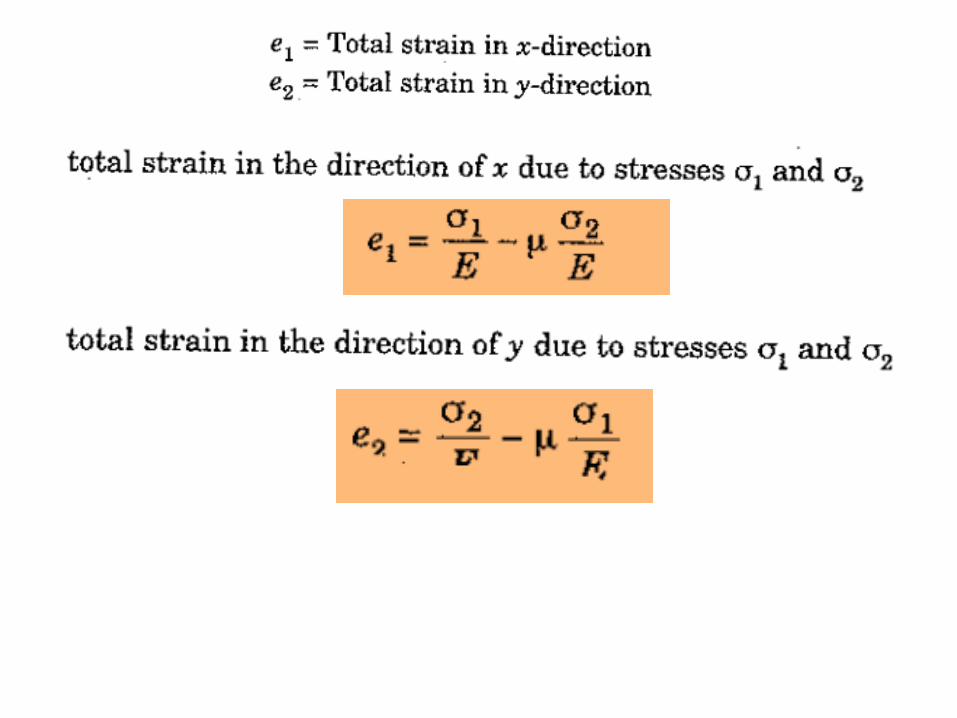
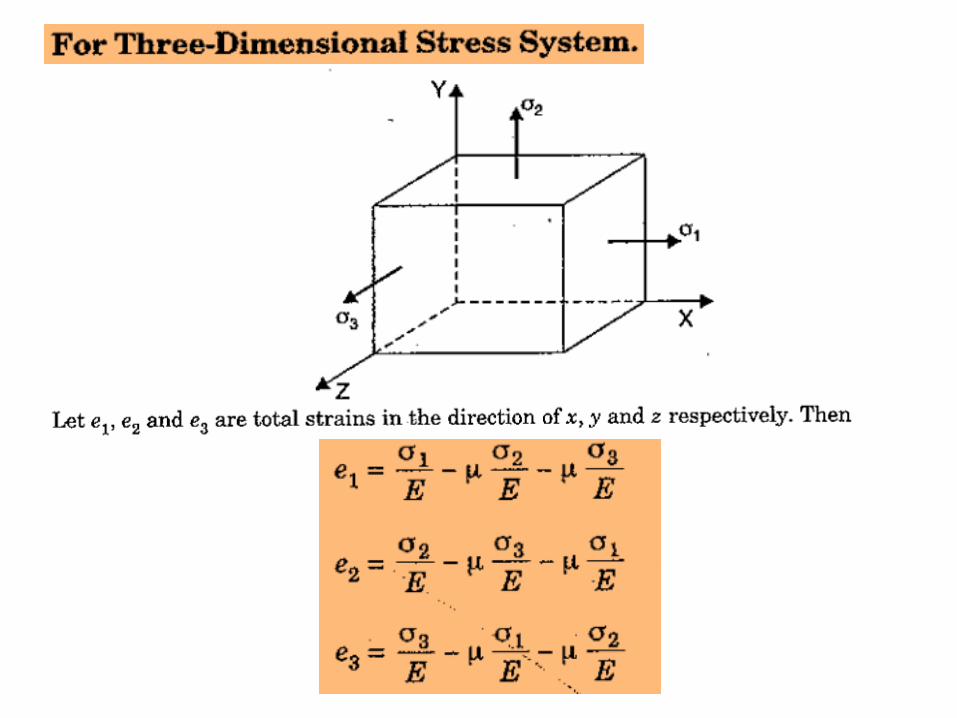
• Elastic constants
• Modulus of Elasticity- bulk Modulus- modulus of rigidity-
Relationship between elastic constants
• Temperature stress and strain- Strain energy .
UNIT I : STRESS AND STRAIN OF SOLIDS
INTRODUCTION
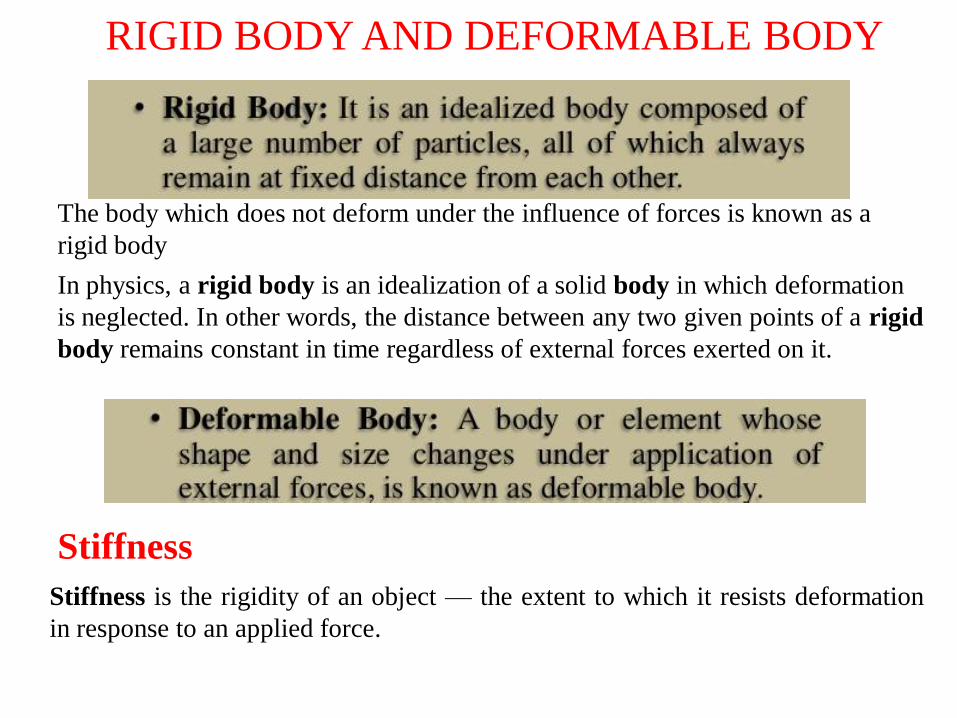
RIGID BODY AND DEFORMABLE BODY
Stiffness is the rigidity of an object — the extent to which it resists deformation
in response to an applied force.
Stiffness
The body which does not deform under the influence of forces is known as a
rigid body
In physics, a rigid body is an idealization of a solid body in which deformation
is neglected. In other words, the distance between any two given points of a rigid
body remains constant in time regardless of external forces exerted on it.
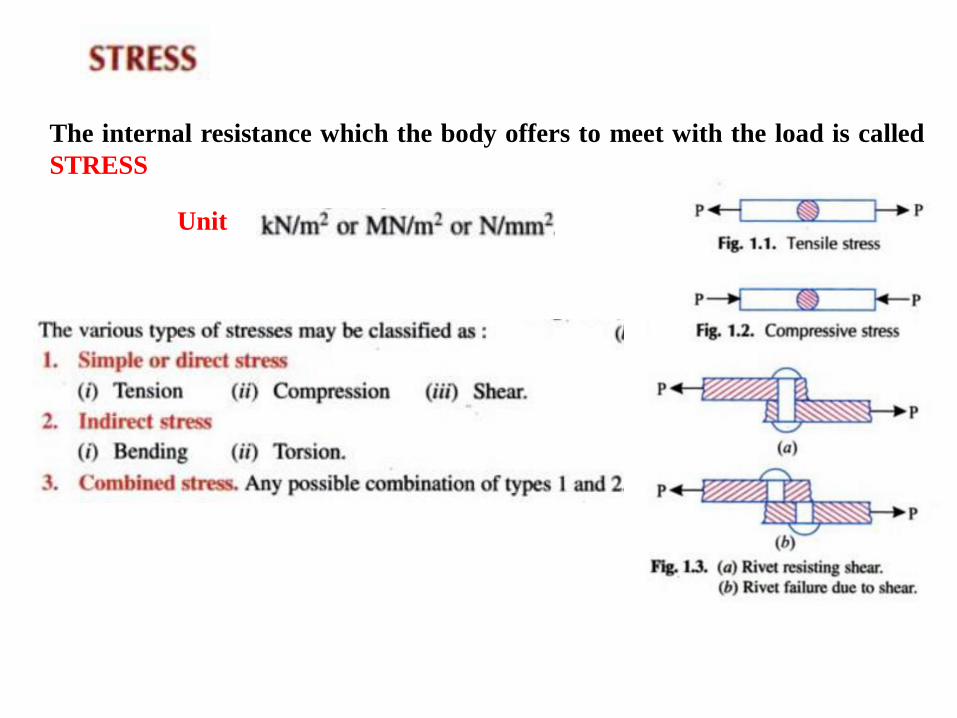
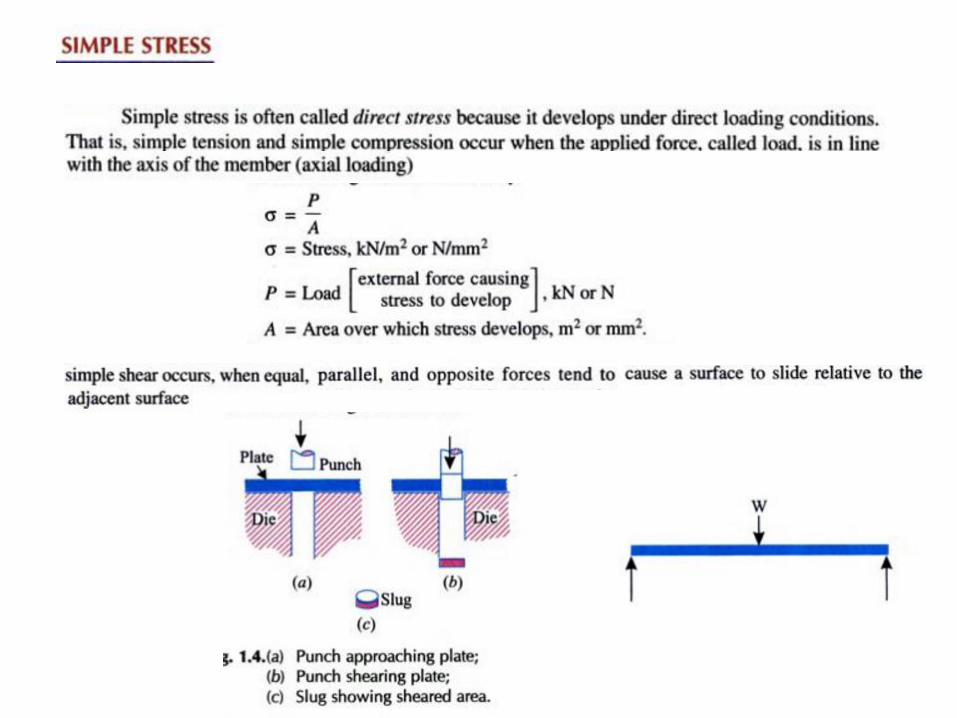
The internal resistance which the body offers to meet with the load is called
STRESS
Unit

Principle of Superposition
•The principle of superposition is often used to determine the stress ordisplacement at a point in a member when the member is subjected to acomplicated loading.
•Principle of superposition states that the resultant stress or displacement at thepoint can be determined by algebraically summing the stress or displacementcaused by each load component applied separately to the member
The following two conditions must be satisfied if the principle ofsuperposition is to be applied.1. The loading must be linearly related to the stress or displacement that
is to be determined
2. The loading must not significantly change the original geometry orconfiguration of the member.


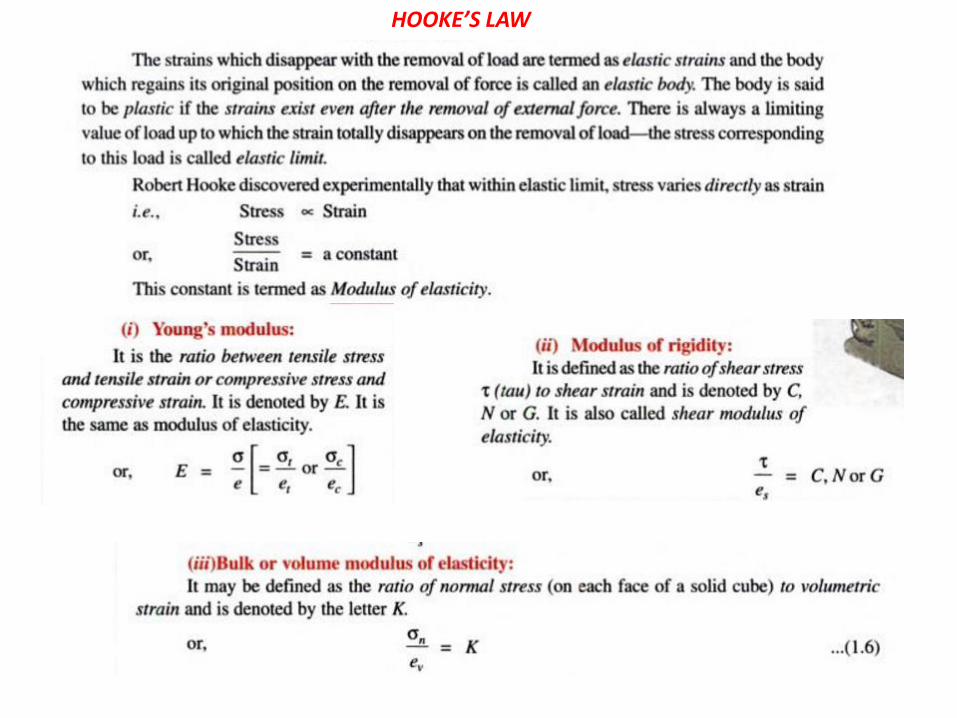
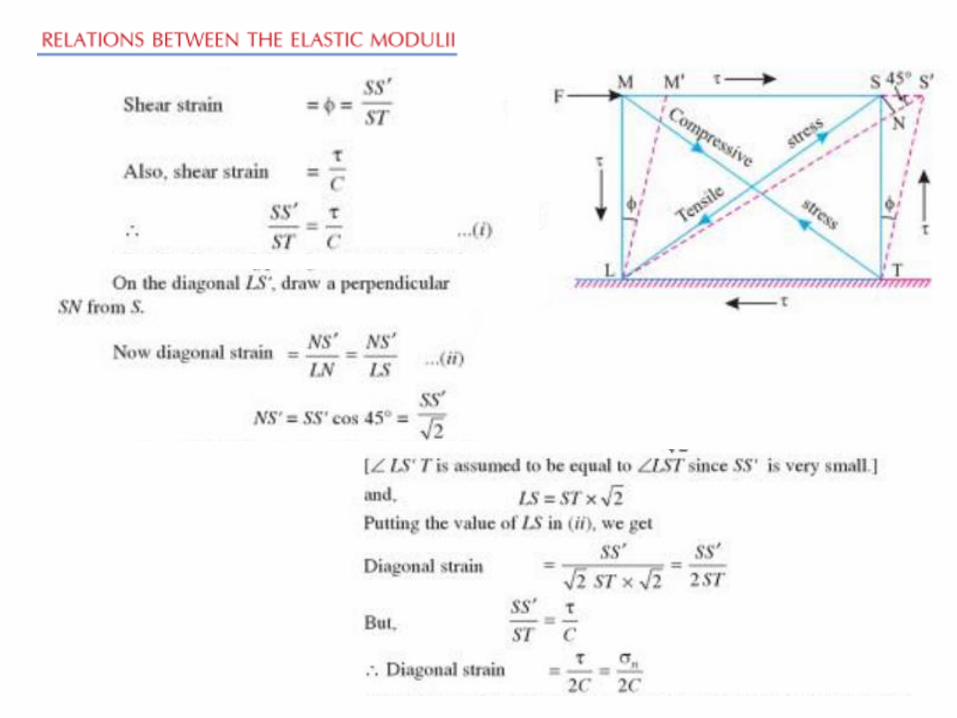
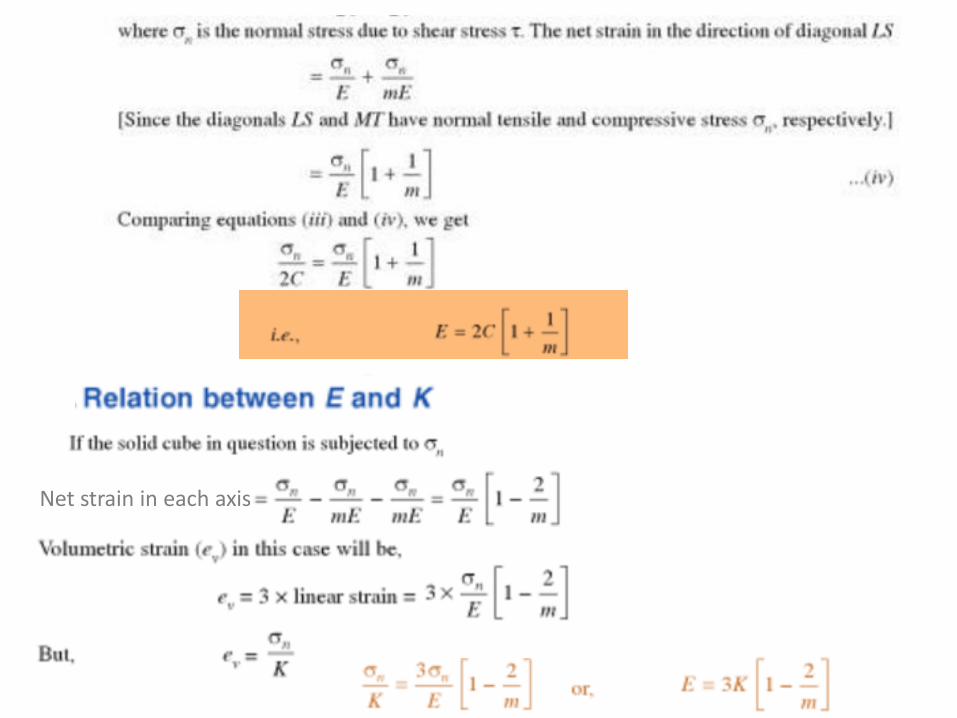
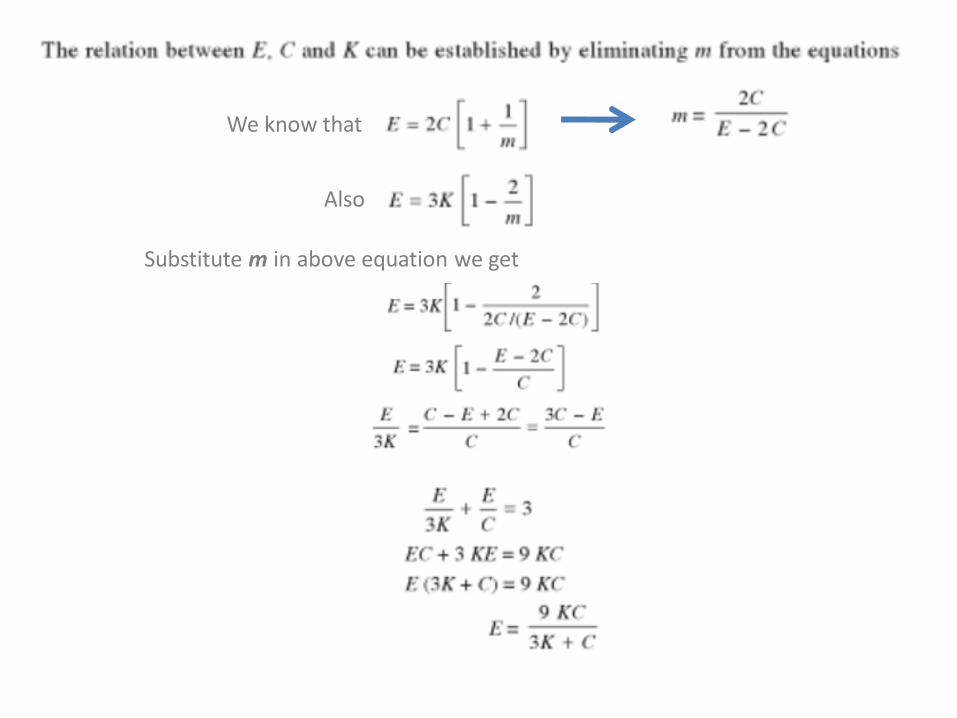
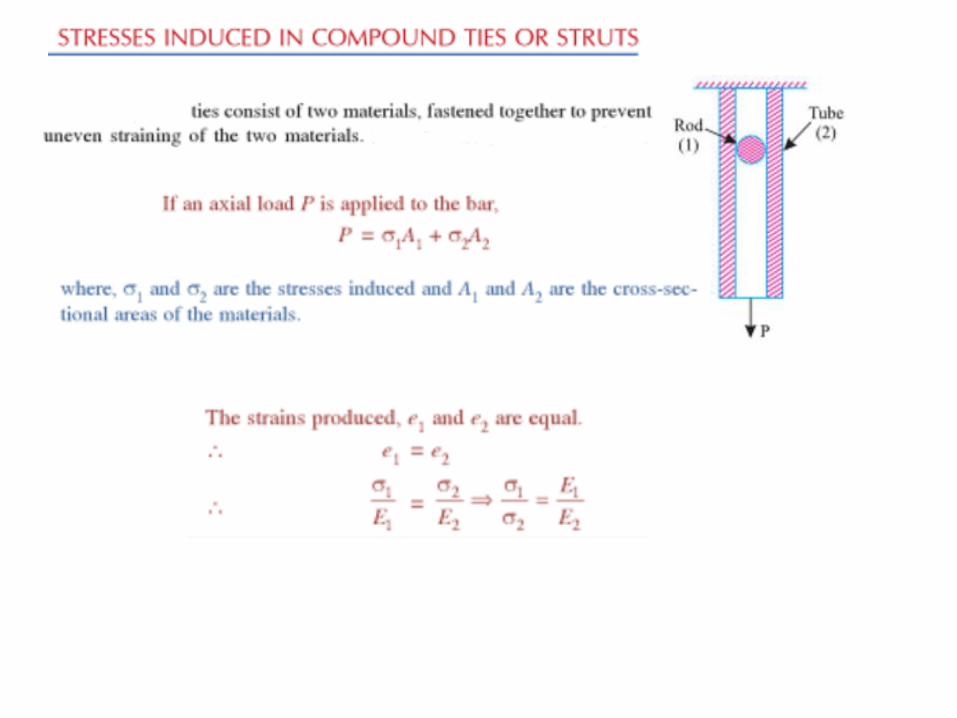
HOOKE’S LAW
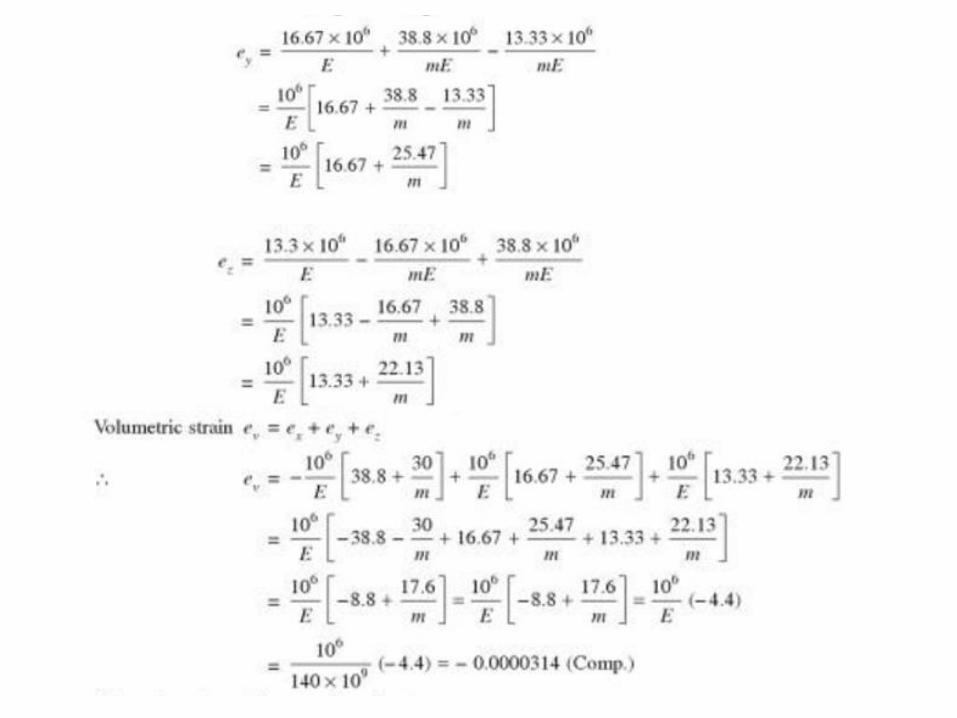
Net strain in each axis
We know that
Also
Substitute m in above equation we get
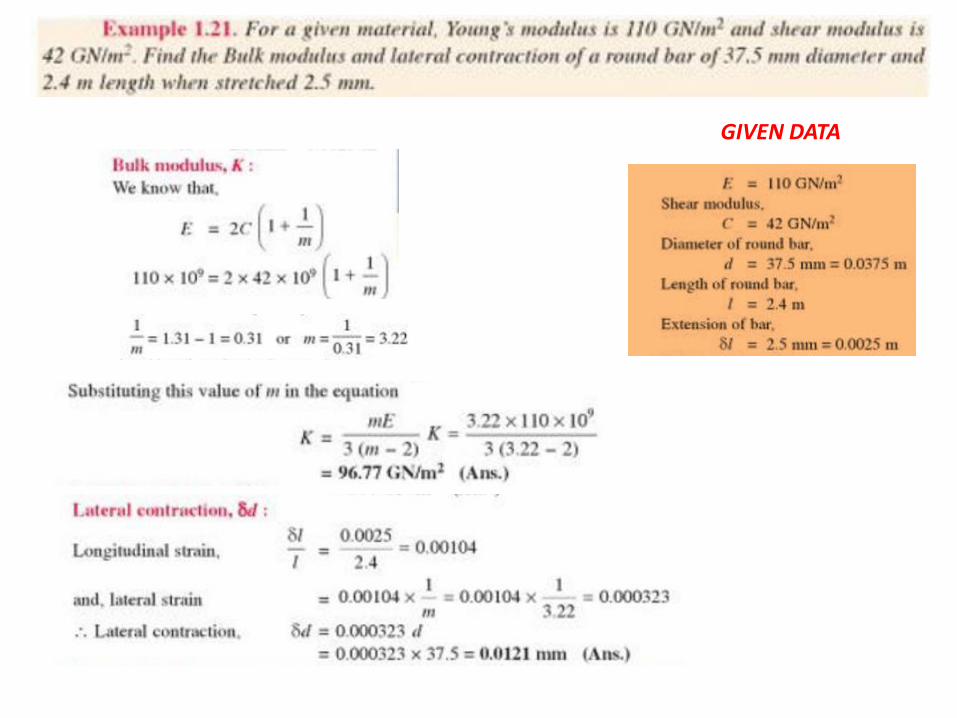
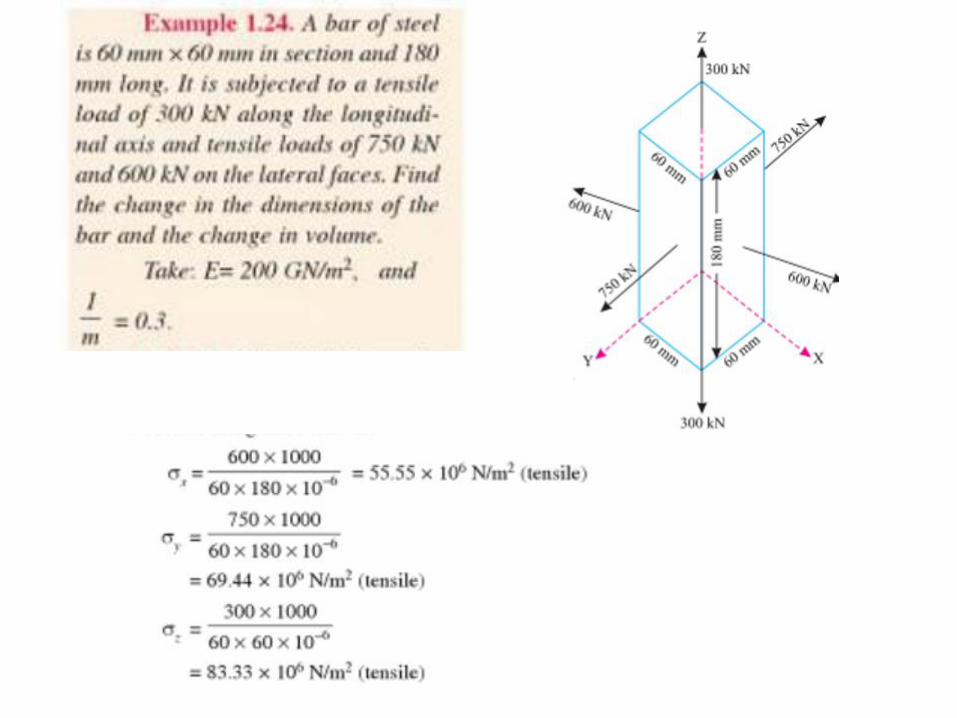
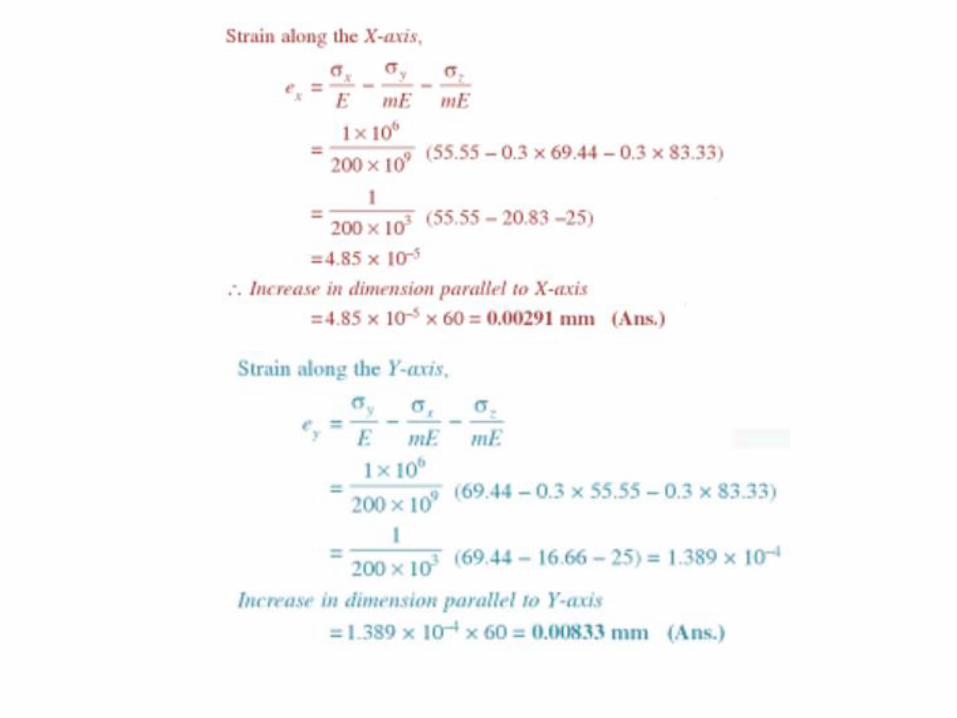
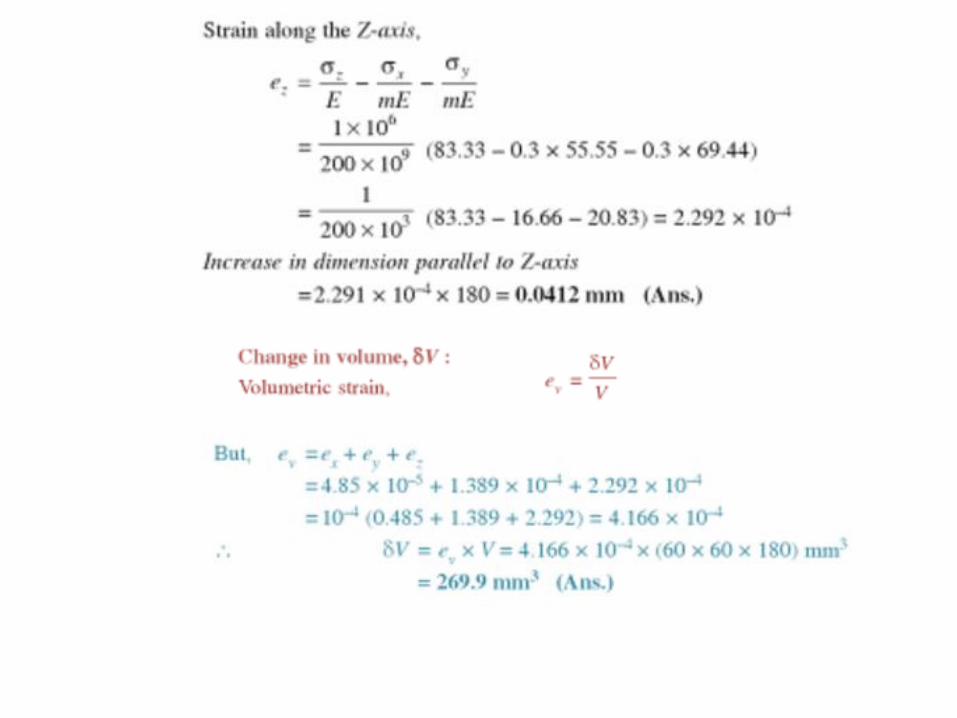
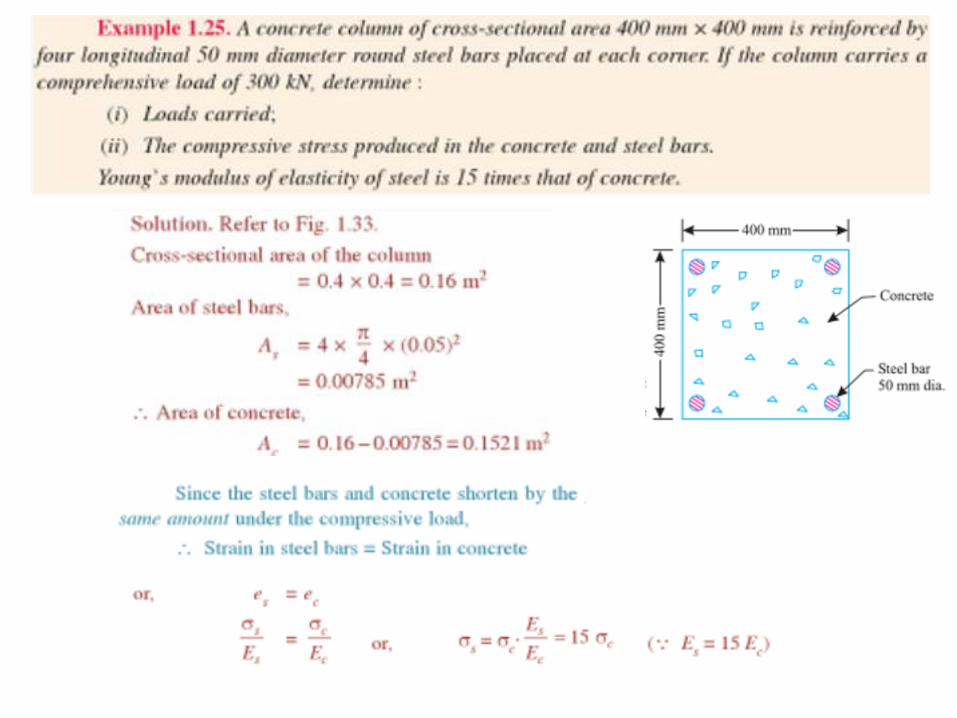
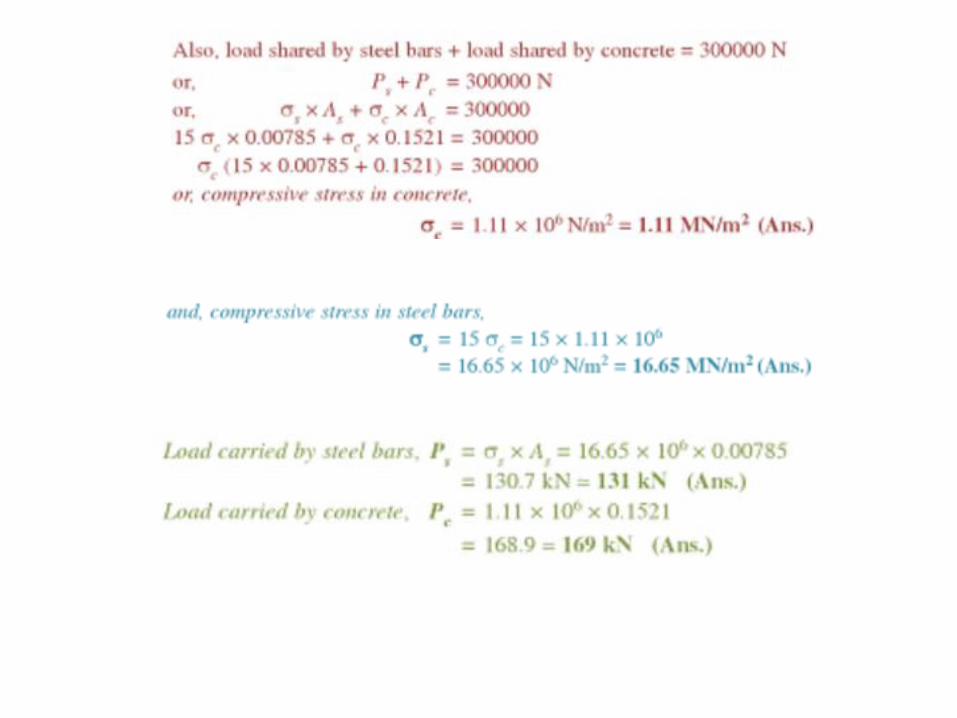
GIVEN DATA


It is not feasible to prepare a test specimen to match the size, Ao and Lo of each structuralmember. Rather, the test results must be reported so they apply to a member of any size.To achieve this, the load and corresponding deformation data are used to calculate variousvalues of the stress and corresponding strain in the specimen. A plot of the resultsproduces a curve called the stress–strain diagram.
Conventional Stress–Strain Diagram
• If the corresponding values of and are plotted so that the vertical axis is the stress σand the horizontal axis is the strain ϵ, the resulting curve is called a conventional stress–strain diagram.
• Two stress–strain diagrams for a particular material will be quite similar, but will neverbe exactly the same
• Because the results actually depend on variables such as the material’s composition,microscopic imperfections, the way it is manufactured, the rate of loading, and thetemperature during the time of the test

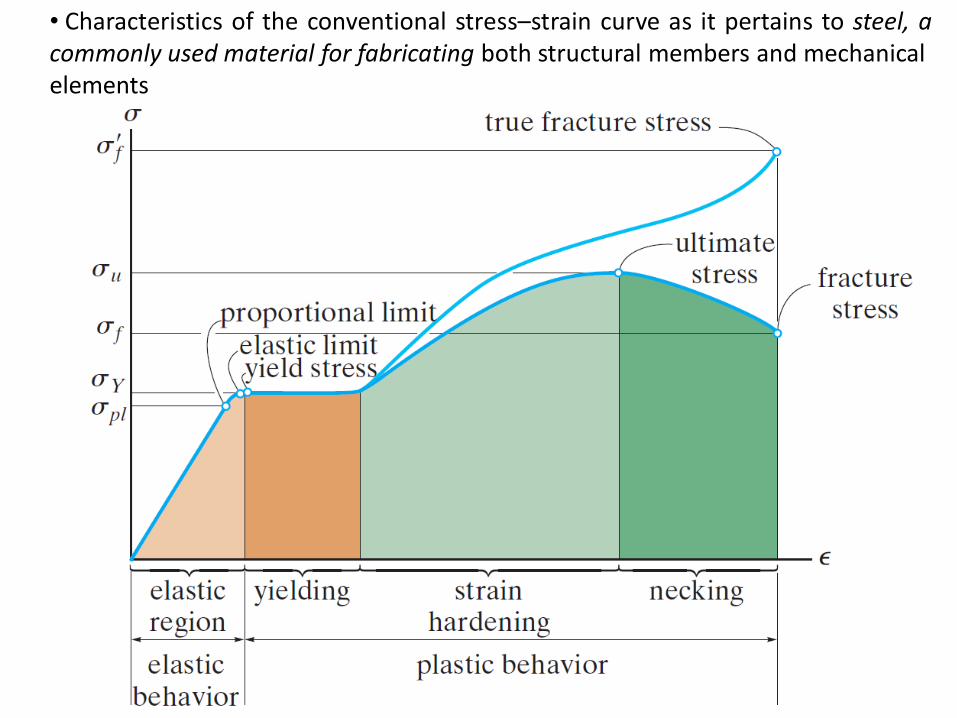
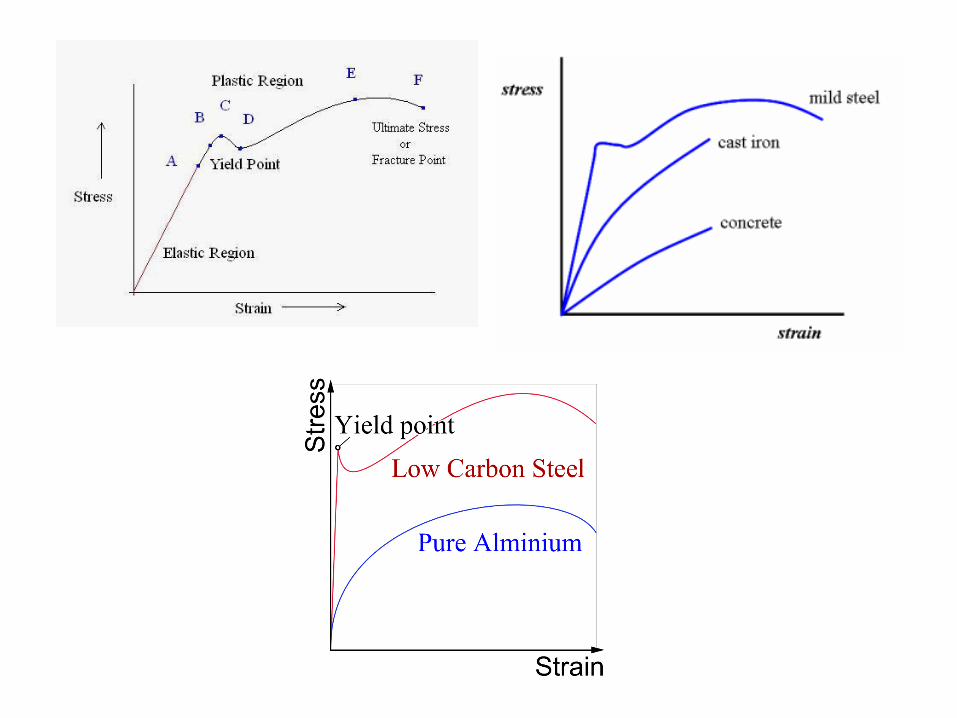
• Characteristics of the conventional stress–strain curve as it pertains to steel, acommonly used material for fabricating both structural members and mechanicalelements

Elastic Behaviour
•Elastic behavior of the material occurs when the strains in the specimen are within the lightorange region
•The curve is actually a straight line throughout most of this region, so that the stress isproportional to the strain
•The material in this region is said to be linear elastic.
•The upper stress limit to this linear relationship is called the proportional limit
•If the stress slightly exceeds the proportional limit, the curve tends to bend and flatten outas shown.
•This continues until the stress reaches the elastic limit.
•Upon reaching this point, if the load is removed the specimen will still return back to itsoriginal shape
•Normally for steel, however, the elastic limit is seldom determined, since it is very close tothe proportional limit and therefore rather difficult to detect.
Yielding
•A slight increase in stress above the elastic limit will result in a breakdown of thematerial and cause it to deform permanently.
•This behavior is called yielding, and it is indicated by the rectangular dark orangeregion of the curve.
•The stress that causes yielding is called the yield stress or yield point, and thedeformation that occurs is called plastic deformation.
•The yield point is often distinguished by two values.
•The upper yield point occurs first and lower yield point.
•Once the yield point is reached, then as shown in Fig. 3–4, the specimen willcontinue to elongate (strain) without any increase in load.
•When the material is in this state, it is often referred to as being perfectly plastic.
•When yielding has ended, an increase in load can be supported by the specimen,resulting in a curve that rises continuously but becomes flatter until it reaches amaximum stress referred to as the ultimate stress
•The rise in the curve in this manner is called strain hardening, and it is identified inFig. 3–4 as the region in light green.
Strain Hardening.
•Up to the ultimate stress, as the specimen elongates, its cross-sectional area will decrease
•This decrease is fairly uniform over the specimen’s entire gauge length; however, justafter, at the ultimate stress, the cross-sectional area will begin to decrease in a localizedregion of the specimen
•As a result, a constriction or “neck” tends to form in this region as the specimen elongatesfurther
•This region of the curve due to necking is indicated in dark green in Fig. 3–4.
•Here the stress–strain diagram tends to curve downward until the specimen breaks at thefracture stress
Necking
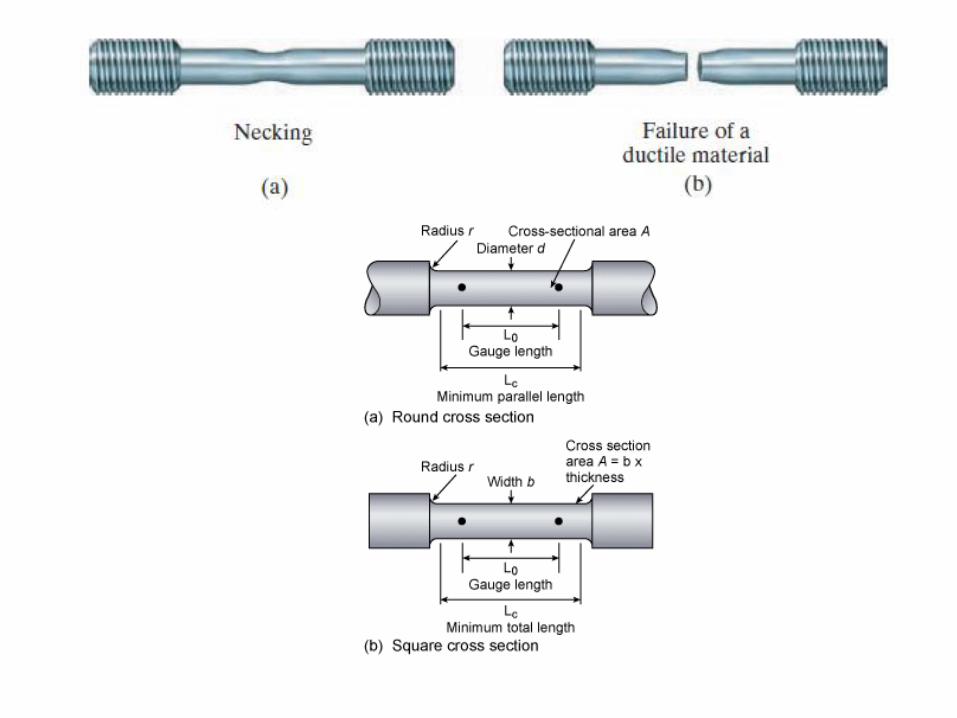

Instead of always using the original cross-sectional area and specimen length tocalculate the (engineering) stress and strain, we could have used the actualcross-sectional area and specimen length at the instant the load is measured.The values of stress and strain found from these measurements are called truestress and true strain, and a plot of their values is called the true stress–straindiagram.