14 containing the allotopic - cancer & metabolism
TRANSCRIPT

Cancer & Metabolism
Calabrese et al. Cancer & Metabolism 2013, 1:11http://www.cancerandmetabolism.com/content/1/1/11
RESEARCH Open Access
Respiratory complex I is essential to induce aWarburg profile in mitochondria-defective tumorcellsClaudia Calabrese1, Luisa Iommarini2, Ivana Kurelac1, Maria Antonietta Calvaruso2, Mariantonietta Capristo2,Pier-Luigi Lollini3, Patrizia Nanni3, Christian Bergamini2, Giordano Nicoletti4, Carla De Giovanni3, Anna Ghelli2,Valentina Giorgio5, Mariano Francesco Caratozzolo6, Flaviana Marzano6, Caterina Manzari7, Christine M Betts3,Valerio Carelli8, Claudio Ceccarelli9, Marcella Attimonelli7, Giovanni Romeo1, Romana Fato2, Michela Rugolo2,Apollonia Tullo6, Giuseppe Gasparre1* and Anna Maria Porcelli2,10*
Abstract
Background: Aerobic glycolysis, namely the Warburg effect, is the main hallmark of cancer cells. Mitochondrialrespiratory dysfunction has been proposed to be one of the major causes for such glycolytic shift. This hypothesishas been revisited as tumors appear to undergo waves of gene regulation during progression, some of which relyon functional mitochondria. In this framework, the role of mitochondrial complex I is still debated, in particular withrespect to the effect of mitochondrial DNA mutations in cancer metabolism. The aim of this work is to provide theproof of concept that functional complex I is necessary to sustain tumor progression.
Methods: Complex I-null osteosarcoma cells were complemented with allotopically expressed complex I subunit 1(MT-ND1). Complex I re-assembly and function recovery, also in terms of NADH consumption, were assessed.Clones were tested for their ability to grow in soft agar and to generate tumor masses in nude mice. Hypoxia levelswere evaluated via pimonidazole staining and hypoxia-inducible factor-1α (HIF-1α) immunoblotting andhistochemical staining. 454-pyrosequencing was implemented to obtain global transcriptomic profiling of allotopicand non-allotopic xenografts.
Results: Complementation of a truncative mutation in the gene encoding MT-ND1, showed that a functionalenzyme was required to perform the glycolytic shift during the hypoxia response and to induce a Warburg profilein vitro and in vivo, fostering cancer progression. Such trigger was mediated by HIF-1α, whose stabilization wasregulated after recovery of the balance between α-ketoglutarate and succinate due to a recuperation of NADHconsumption that followed complex I rescue.
Conclusion: Respiratory complex I is essential for the induction of Warburg effect and adaptation to hypoxia ofcancer cells, allowing them to sustain tumor growth. Differently from other mitochondrial tumor suppressor genes,therefore, a complex I severe mutation such as the one here reported may confer anti-tumorigenic properties,highlighting the prognostic values of such genetic markers in cancer.
Keywords: Complex I, mtDNA mutation, HIF-1α, Mitochondria, Cancer, Warburg effect, Allotopic expression
*Correspondence: [email protected]; [email protected]. Scienze Mediche e Chirurgiche (DIMEC), U.O. Genetica Medica, Pol.Universitario S. Orsola-Malpighi, Università di Bologna, via Massarenti 9,40138 Bologna, Italy2Dip. Farmacia e Biotecnologie (FABIT), Università di Bologna, via Belmeloro6, 40126 Bologna, ItalyFull list of author information is available at the end of the article
© 2013 Calabrese et al.; licensee BioMed CentCommons Attribution License (http://creativecreproduction in any medium, provided the or
ral Ltd. This is an Open Access article distributed under the terms of the Creativeommons.org/licenses/by/2.0), which permits unrestricted use, distribution, andiginal work is properly cited.

Calabrese et al. Cancer & Metabolism 2013, 1:11 Page 2 of 15http://www.cancerandmetabolism.com/content/1/1/11
BackgroundAerobic glycolysis is one of the main hallmarks of cancercells. The seminal observation by Otto Warburg at the be-ginning of last century [1,2] has fostered compelling effortsin elucidating the profound metabolic changes thattransformed cells undergo from initial tumor to the spreadof metastases, which to date remain largely obscure. It isstill unclear why highly proliferative and invasive cancercells settle for an energetically less efficient aerobic glycoly-sis, rather than oxidative phosphorylation (OXPHOS),which generates far more ATP from a single glucose mol-ecule. The shift toward glycolysis has been ascribed to fourpotential causes, namely (i) a mitochondrial dysfunction,which forces cells to rely on glycolysis, (ii) an upregulationof glycolytic genes driven by the activation of oncogenes,(iii) the triggering of a strong hypoxic response thatturns down oxygen-dependent respiration and (iv)the redirection of glucose catabolism towards macro-molecular biosynthesis [3,4].The classical Warburg hypothesis has recently been
revisited, as tumors with active mitochondrial metabolismhave been identified, indicating that aerobic glycolysis doesnot necessarily involve a decrease in mitochondrial function[5]. It is likely that glycolytic and oxidative metabolismsinterchange in a wave pattern during the proliferation andtransformation of cancer cells, constantly subjected toselective pressures in terms of nutrients and oxygenavailability, determined by the ever-changing tumor micro-environment [6]. In this context, mitochondria might repre-sent the main hub for the wave-like regulation of cancermetabolism [7]. In fact, they host a number of essentialmetabolic processes, such as the oxygen-dependent ATPproduction, redox regulation and biosynthetic reactions [8].Moreover, mitochondria are involved in the regulation ofhypoxic adaptation [9], a process that must be triggered inany solid neoplasia to overcome the initial steps of tumori-genesis and is controlled by hypoxia-inducible factor 1α(HIF-1α) [10].During O2 deprivation, HIF-1α stabilization and acti-
vation is needed for cells to respond to hypoxia,upregulating the expression of pivotal glycolytic genes[11]. Therefore, in this condition, HIF-1α increasesglycolysis and suppresses the tricarboxylic acids (TCA)cycle and, ultimately, mitochondrial respiration [12,13].HIF-1α stabilization is tightly controlled by prolyl-hydroxylases (PHDs), enzymes whose HIF-1α-degradingactivity is allosterically regulated by α-ketoglutarate(α-KG) and succinate (SA), two key metabolites of theTCA cycle, which feeds reducing equivalents to the re-spiratory chain for ATP production. In this frame, wehave recently shown that a dysfunction in complex I(CI), caused by the severe m.3571insC/MT-ND1 mito-chondrial DNA (mtDNA) mutation, strongly contributesto HIF-1α destabilization and lack of hypoxia adaptation,
which eventually leads to an antitumorigenic effect[14,15]. Complex I is the largest and least understoodcomponent of the respiratory chain, which catalyzes thetransfer of electrons from NADH to flavin mononucleo-tide and then to ubiquinone [16]. The holoenzymefunction is necessary for ATP production and for themaintenance of cellular redox state, such as NAD+/NADHratio and reactive oxygen species (ROS) levels [17]. Com-plex I dysfunction, specifically that induced by the occur-rence of mutations in respiratory genes encoded withinthe multicopy mtDNA, has generally been described aspro-tumorigenic [18,19]. An open debate scans the evi-dence that mtDNA mutations, according to their overalleffect on the respiratory chain and, indirectly, on otheroxidative metabolism pathways, may not behave uni-vocally as pro-tumorigenic and pro-metastatic events[15,20]. Mutations in CI genes encoded within themtDNA, in fact, have been shown both to foster and in-hibit the replication of tumors in which they occur, a two-sided effect that depends on the percentage of mutantmtDNA copies (heteroplasmy) and on the capacity of themutation to disassemble CI [21]. Therefore, it is likely thatCI may no longer be looked upon as an enzyme thatmerely contributes to mitochondrial function. Neverthe-less, although its role in determining the fate of cancercells upon deregulation of their metabolic switch duringtumor progression is considered increasingly crucial, it re-mains ambiguous. Furthermore, the molecular mecha-nisms through which CI may regulate metabolicadaptation in tumorigenesis still remain practicallyuninvestigated.In the attempt to assign a role to CI within the
Warburg effect, we have demonstrated that this mito-chondrial enzyme is required in order to perform themetabolic switch towards glycolysis during the hypoxiaresponse, a pivotal goal in the metabolic reprogrammingof cancer cells.
MethodsCell linesIn this study, 143B osteosarcoma-derived cybrids harbor-ing the homoplasmic m.3571insC mutation in MT-ND1[HGCN:7455], their counterpart OS-93ND1, allotopicallycomplemented with wild-type MT-ND1 and their wild-type mtDNA counterpart (CC) were used. Mock cellstransfected with empty vector are indicated as OS-93.Cybrids were obtained and cultured as previously de-scribed [15].
Nucleic acid extractionDNA from snap-frozen xenografts and cultured cells(7 × 10⁵) was extracted with GenElute™ MammalianGenomic DNA Miniprep Kit (Sigma-Aldrich, Milan,Italy). RNeasy Plus Mini kit (Qiagen, Milan, Italy) was

Calabrese et al. Cancer & Metabolism 2013, 1:11 Page 3 of 15http://www.cancerandmetabolism.com/content/1/1/11
used to extract RNA from snap-frozen xenografts. Celllines RNA was obtained using TRIzol reagent (Invitrogen,Milan, Italy) and following manufacturer’s instructions.
MT-ND1 allotopic constructWild-type MT-ND1 was cloned from cDNA of TPC1cells derived from a papillary thyroid carcinoma [22] andinserted into a p3XFLAG-CMV™-14 expression vector(Sigma-Aldrich, Milan, Italy). The MT-ND1 sequencewas identical to the mtDNA revised Cambridge Refer-ence Sequence (rCRS) [GenBank:NC_012920.1]. FLAGepitope was excluded from the transgene frame in ordernot to affect protein folding. COX10 [GenBank:U09466]30- and 50-UTR were cloned according to Bonnet et al.[23]. The 50-UTR from nuclear-encoded mitochondrialprotein COX10 was cloned upstream of nND1for mRNA targeting to the mitochondria outer mem-brane, along with mitochondrial targeting sequence (N-terminal MTS). The 30-UTR from COX10 was inserteddownstream of nND1 in order to ensure mRNA stability.Site-directed in vitro mutagenesis was performed withthe QuikChange Lightning Multi Site-Directed Muta-genesis Kit (Strategene, Agilent Technologies, SantaClara, CA, USA) according to the manufacturer’sinstructions. Oligonucleotides designed for this purposeare available on request.
Cell transfection, selection and assessment of allotopicMT-ND1 expressionCells were transfected with p3XFLAG-CMV™-14 emptyvector and with the nND1 allotopic construct by usingLipofectamine 2000 transfection reagent (Invitrogen,Milan, Italy) following the manufacturer’s protocol. Stableclones were obtained by selection with 400 μg/mL G418(Invitrogen, Milan, Italy) and the antibiotic resistantclones were double-selected by growing them in DMEMwithout glucose supplemented with 5 mM galactose,5 mM Na-pyruvate and 10% FBS, in order to eliminatefalse positive clones. The expression of allotopic ND1 wasassessed by quantitative real-time PCR (qRT-PCR). TotalRNA was extracted from OS-93 and OS-93ND1 clones and1 μg was used for retrotranscription with Transcriptor FirstStrand cDNA Synthesis Kit (Roche Diagnostics, Monza,Italy), by using random hexameric primers. Primer andTaqManW probes sequences were designed using Primer3software [24] and the presence of 30 intra-/inter-primersimilarity was ruled out using IDT OligoAnalyzer tool [25].Sequences are available upon request. Allotopic nND1 PCRproduct spanned the region between the COX10 MTS and50-nND1, in order to exclude any endogenous transcript,and the normalization was performed on pCMV levels,which is present in plasmid DNA but not translated, inorder to exclude plasmid DNA contamination. HumanACTB gene[GenBank:M28424] was used as reference gene.
The PCR reaction was performed with LightCyclerW 480Probes Master and run in LightCyclerW480 Real-Time PCRSystem (Roche Diagnostics, Monza, Italy), using the follow-ing conditions: 95°C, 5 minutes; 45 cycles of 95°C, 15 sec,and 60°C, 45 sec. Absolute quantification was performedusing a standard curve prepared by serial dilutions of puri-fied p3XFLAG-CMV™-14 containing the allotopic construct.
mtDNA sequencing and low heteroplasmy detectionWhole mtDNA resequencing was performed as previ-ously described [26] in order to verify that xenograftshad not accumulated mutations apart from them.3571insC. Mutant load of m.3571insC was determinedusing fluorescent PCR (F-PCR) and denaturing high per-formance liquid chromatography (DHPLC) according topreviously optimized protocols for mutations in difficultsequence contexts such as homopolymers [27]. Eachanalysis was performed in triplicate.
SDS-PAGEMitochondrial enriched fraction was obtained by thesubcellular fractionation in the presence of digitonine(50 μg/mL) [28]. Total lysates were prepared from30 mg of xenografts as previously described [15].Mitochondrial proteins (40 μg) or total xenograft andcell lysates (80 μg) were separated by 10% SDS-PAGEand transferred onto nitrocellulose membrane as previ-ously reported [15].
Western blotNitrocellulose membranes were incubated with anti-bodies against voltage-dependent anion channel (VDAC)(1:1000, BioVision, Mountain View, CA, USA), ND1(1:1000, a gift from A. Lombes, Unite de RechercheINSERM 153, Hospital de la Salpetriere, Paris, France),HIF-1α (1:1000, Bethyl Laboratories, Montgomery, TX,USA), LDHA (1:1000, Sigma-Aldrich, Milan, Italy). Sec-ondary antibodies used were peroxidase-conjugated anti-mouse or anti-rabbit (1:2000, Jackson ImmunoResearch,Suffolk, England). Chemiluminescence signals wereobtained with Kodak molecular imaging apparatus(Kodak, Rochester, NY, USA). Coomassie staining wasused as the loading control.
Complex I In-Gel-Activity (CI-IGA) assayMitochondrial enriched fractions (for sample prepar-ation see section SDS-PAGE) were solubilized withn-dodecyl-maltoside (2.5 g/g protein) as previouslyreported [29]. Proteins (100 μg) were separated by 4 to 13%Blue Native gradient gel (BN-PAGE) and CI-IGA wasdetected as previously described [30].

Calabrese et al. Cancer & Metabolism 2013, 1:11 Page 4 of 15http://www.cancerandmetabolism.com/content/1/1/11
NAD+/NADH ratio determinationAliquotes of 1.5 × 10⁶ cells were washed and resuspendedin 1 mL of ice-cold PBS and extracted for NADH andNAD+ determination. For NADH analysis, cell suspensionwas treated with 0.5 M potassium hydroxide containing50% (v/v) ethanol and 35% (w/v) cesium chloride, immedi-ately cooled on ice, centrifuged at 4°C to remove insolublematerial and the supernatant (100 μL) was injected on C18column. For NAD+ determination, cell suspension wastreated with 1 M perchloric acid, immediately cooled onice, and centrifuged at 4°C to remove insoluble material.Perchloric acid was neutralized with potassium hydroxideand centrifuged immediately before injection. The super-natant was injected (100 μL) on C18 column. The pyridinenucleotides were extracted and detected as described [31]on a Kinetex reversed phase C18 column (250 × 4.6 mm,5 μm; Phenomenex, Torrance, CA, USA), with a two-pumpWaters 510 system equipped with a variable volume in-jector. Absorbance at 260 nm for NAD+ and at 340 nm forNADH was monitored by a photodiode array detector(Waters 996). NADH and NAD+ peaks were identified bycomparison of their retention times with those of standardsand confirmed by co-elution with standards. The quan-tification was obtained from peak area measurementcompared to standard curves.
ATP synthesis measurementThe rate of mitochondrial ATP synthesis driven by CIand CII was performed in aliquots of digitonin-permeabilized cells and normalized on citrate synthase(CS) activity as previously described [32]. Briefly, ali-quots (0.1 to 0.2 mg protein) were incubated with 5 mMmalate plus 5 mM pyruvate (CI substrates) or with10 mM succinate (CII substrate) plus 2 μg/mL rotenone.The reaction was started by addition of 0.2 mM ADP inthe presence of luciferine/luciferase, and chemilumines-cence was evaluated as a function of time with aluminometer. After addition of 10 μM oligomycin, thechemiluminescence signal was calibrated with an in-ternal ATP standard.
Oxygen consumption rate (OCR)OCR in adherent cells was measured with an XF24Extracellular Flux Analyzer (Seahorse Bioscience, Biller-ica MA, USA). Cells were seeded in XF24 cell culturemicroplates at 3 × 10⁴ cells/well in 200 μL of DMEMcontaining 4.5 g/L glucose and incubated at 37°C in 5%CO2 for 24 h. Assays were performed as previouslyreported [32]. Data are expressed as pmoles of O2 perminute per 3 × 10⁴ cells.
Mitochondrial membrane potential determinationCells (3 × 10⁵) were seeded onto 24 mm-diameter roundglass coverslips and grown for 2 days. Mitochondrial
membrane potential (ΔΨm) was measured by the accumu-lation of tetramethylrhodamine methyl esther (TMRM) aspreviously reported [30]. Data were acquired and analyzedusing MetaFluor software (Universal Imaging Corp.,Downington, PA, USA). Clusters of several mitochondriawere identified as regions of interest, and fields not con-taining cells were taken as background. Sequential digitalimages and fluorescence intensity were acquired everyminute. Fluorescence values were obtained by subtractingbackground values from those of corresponding mito-chondrial areas of interest, for each time point, andexpressed as percentage of T0 (100%).
Soft agarAnchorage-independent cell growth was determined in0.33% agarose with a 0.5% agarose underlayer. Cellsuspensions (2 × 10⁴ cells) were plated in semisolid medium,in absence or presence of 1 μM dimethyloxallylglycine(DMOG). Colonies were counted after 7 days at a magnifi-cation of 10× with an inverted microscope (Nikon Diaphot,Nikon Instruments, Florence, Italy). Plate pictures andmagnifications were obtained with a Kodak molecular im-aging apparatus (Kodak, Rochester, NY, USA). Effects ofDMOG on HIF-1α stabilization were validated by westernblotting (Additional file 1: Figure S1). The index of colonyforming ability was calculated as the ratio between un-treated OS-93ND1 and OS-93 cells and then used fornormalization of DMOG-treated cells. The t-test was usedfor statistical comparison.
In vivo tumor growth analysisCells (3 × 10⁶) were suspended in 0.2 mL sterile PBSand injected subcutaneously in 4 to 7 week-old athymicCrl:CD-1-Foxn1nu/nu mice (referred to as nude mice,purchased from Charles River, Lecco, Italy). Experimentswere authorized by the institutional review board of theUniversity of Bologna and performed according toItalian and European guidelines. Individually taggedvirgin female mice (10 per experimental group) wereused. Tumor growth was assessed with a caliper; volumewas calculated as:
Π √ a � bð Þ� �3=6
where a = maximal tumor diameter, and b = tumor diam-eter perpendicular to a.
Electron microscopyXenograft biopsies were immediately collected andprocessed as previously described [15]. Samples were ob-served with a JEM-1011 Transmission Electron Micro-scope (Jeol Ltd, Milan, Italy).

Calabrese et al. Cancer & Metabolism 2013, 1:11 Page 5 of 15http://www.cancerandmetabolism.com/content/1/1/11
cDNA library preparation and mRNA sequencingUltradeep pyrosequencing was performed using 454 GSFLX Titanium platform (Roche Diagnostics, Monza,Italy). RNA quality was assessed by a 2100 Bioanalyzer(Agilent Technologies, Santa Clara, CA, USA). TotalRNA from each sample (5 to 8 μg) was used for poly(A)mRNA selection, using Oligotex mRNA kit (Qiagen,Milan, Italy). The poly(A)-enriched RNA samples werereverse-transcribed into cDNA using random-sequenceprimers. cDNA libraries preparation and subsequentpyrosequencing (applying 200-nucleotide cycles) werecarried out according to the manufacturer’s instructions.
RNA-Seq data analysisRNA-seq reads obtained (Additional file 2: Table S1) weretested for sequence quality by FastQC [33] (Additionalfile 3: Figure S2) and those ≥100 bp were mapped onto thehg18/NCBI36-annotated human genome, using the NextGeneration Sequencing. TRanscriptome profile Explorer(NGS-Trex) platform [34]. Multiple mappings were allowedto avoid too large a cutoff derived from paralogous genes(Additional file 4; Methods). Genes were consideredexpressed if at least one read was mapped. Raw digitalexpression read count per gene (considering all the mappedmRNA isoforms together) was used for the differentialexpression analysis with the edgeR [35] package ofBioconductor [36] (Additional file 4; Methods). Only geneswith at least one read in all the four samples studied wereconsidered in the statistical analysis using Fisher’s exact test.A P-value ≤0.05 was used as the threshold to consider agene as differentially expressed (DE). The Bioconductorgoseq [37] package was used to associate all DE genes toGene Ontology (GO) categories and Kyoto Encyclopedia ofGenes and Genomes (KEGG) pathways (Additional file 4;Methods), while the GeneMania server [38] was used tocarry out gene network analyses by searching amongseveral interaction databases, related bibliographic refer-ences and for GO categories enrichment within onlyoverexpressed genes found in each group. The HIF-1αpathway reconstruction was manually curated [39-44] frominteraction databases (BioGRID, HPRD, Pathway Com-mons, GEO dataset), with GeneMania and from NCBIInteraction and GeneRIF sections of the HIF-1A gene entry[45]. Representation of upregulated and downregulatedgenes in the heatmaps was prepared using the limma pack-age of R [46], applying a hierarchical clustering onto log2normalized digital gene expression values (Additional file 4;Methods). Validation of RNA-Seq data was performed withqRT-PCR as indicated in Additional file 4; Methods.
Immunohistochemical analysisImmunohistochemical (IHC) analysis with antibodiesagainst NDUFB8 subunit of CI (Invitrogen, Milan, Italy)and HIF-1α (Upstate Biotech, Billerica, MA, USA) was
performed as previously reported [47]. The semi-quantitative analysis of the stained sections was done bylight-microscopy at 100× magnification. The evaluationof cytoplasmic NDUFB8 immunostaining was performedaccording to the percentage of positive cells (range 0 to4) and to the staining intensity (range 0 to 3) using amodified immunoreactivity score (IRS) [48,49]. The finalstaining evaluation for each sample was obtained bycombining the two values (range 0 to 12). The populationof cells with a positive HIF-1α nuclear immunostaining wasquantified using a computerized, morphometric, inter-active, digital image analysis as previously described [50].The labeling index was expressed as the percentage of thelabeled nuclear area over the total nuclear area for tumorcells in the section.
Pimonidazole stainingAnimals were injected intraperitoneally with 60 mg/kgpimonidazole (Hypoxyprobe-1 Plus Kit, HPI, Burlington,MA, USA) 3 h prior to sacrifice. Xenografts were treatedand fluorescence visualized as previously reported [15].
α-KG and SA measurementsMeasurements of metabolites α-KG and SA were carriedout in ex vivo cell lines derived from OST-93 andOST-93ND1 essentially as previously described [15]. Thet-test was used for statistical comparison.
Statistical analysesAnalysis of variance (ANOVA) was used for all statisticalanalyses unless otherwise indicated.
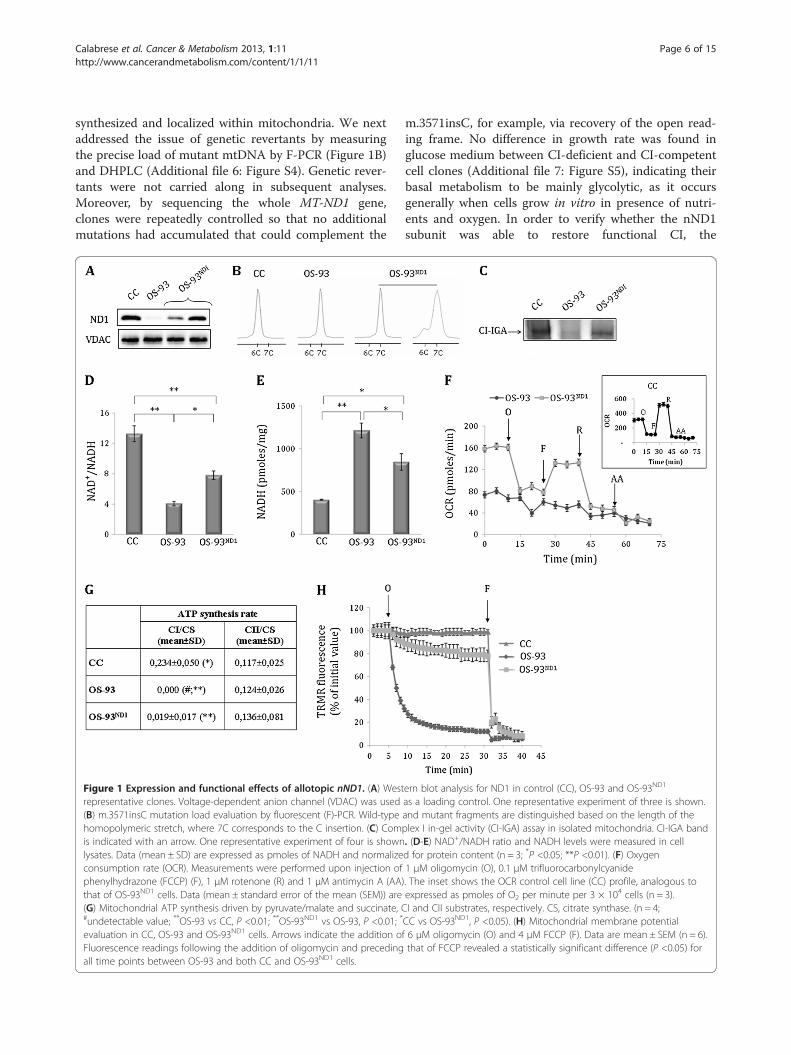
ResultsAllotopic MT-ND1 expression corrects CI-dependentmitochondrial energetic dysfunctionIn order to recover CI function, we took advantage ofthe previously characterized osteosarcoma cell models(OS-93) bearing the quasi-homoplasmic disruptivem.3571insC mutation in the MT-ND1 gene, which en-codes the NADH dehydrogenase subunit 1 (ND1) of CI[14,15] (Additional file 5: Figure S3A). The mutationwas complemented by recoding MT-ND1 for cytosolictranslation (nND1) using in vitro site-directed mutagen-esis (Additional file 5: Figure S3B). A eukaryotic expres-sion construct was designed with the aim to facilitatenND1 mRNA targeting to the outer mitochondrialmembrane [23] (Additional file 5: Figure S3C). ND1-nullOS-93 cells were then transfected with the allotopicconstruct to generate OS-93ND1 clones, in whichnND1 mRNA expression was confirmed by qRT-PCR(Additional file 5: Figure S3D). Western blot analysis onenriched mitochondrial fractions showed that ND1 waspresent exclusively in OS-93ND1 allotopic clones(Figure 1A), indicating that the protein was correctly
Calabrese et al. Cancer & Metabolism 2013, 1:11 Page 6 of 15http://www.cancerandmetabolism.com/content/1/1/11
synthesized and localized within mitochondria. We nextaddressed the issue of genetic revertants by measuringthe precise load of mutant mtDNA by F-PCR (Figure 1B)and DHPLC (Additional file 6: Figure S4). Genetic rever-tants were not carried along in subsequent analyses.Moreover, by sequencing the whole MT-ND1 gene,clones were repeatedly controlled so that no additionalmutations had accumulated that could complement the
Figure 1 Expression and functional effects of allotopic nND1. (A) Westrepresentative clones. Voltage-dependent anion channel (VDAC) was used(B) m.3571insC mutation load evaluation by fluorescent (F)-PCR. Wild-typehomopolymeric stretch, where 7C corresponds to the C insertion. (C) Comis indicated with an arrow. One representative experiment of four is shownlysates. Data (mean ± SD) are expressed as pmoles of NADH and normalizeconsumption rate (OCR). Measurements were performed upon injection ofphenylhydrazone (FCCP) (F), 1 μM rotenone (R) and 1 μM antimycin A (AA)that of OS-93ND1 cells. Data (mean ± standard error of the mean (SEM)) are(G) Mitochondrial ATP synthesis driven by pyruvate/malate and succinate, C#undetectable value; **OS-93 vs CC, P <0.01; **OS-93ND1 vs OS-93, P <0.01; *
evaluation in CC, OS-93 and OS-93ND1 cells. Arrows indicate the addition oFluorescence readings following the addition of oligomycin and precedingall time points between OS-93 and both CC and OS-93ND1 cells.
m.3571insC, for example, via recovery of the open read-ing frame. No difference in growth rate was found inglucose medium between CI-deficient and CI-competentcell clones (Additional file 7: Figure S5), indicating theirbasal metabolism to be mainly glycolytic, as it occursgenerally when cells grow in vitro in presence of nutri-ents and oxygen. In order to verify whether the nND1subunit was able to restore functional CI, the
ern blot analysis for ND1 in control (CC), OS-93 and OS-93ND1
as a loading control. One representative experiment of three is shown.and mutant fragments are distinguished based on the length of theplex I in-gel activity (CI-IGA) assay in isolated mitochondria. CI-IGA band. (D-E) NAD+/NADH ratio and NADH levels were measured in celld for protein content (n = 3; *P <0.05; **P <0.01). (F) Oxygen1 μM oligomycin (O), 0.1 μM trifluorocarbonylcyanide. The inset shows the OCR control cell line (CC) profile, analogous toexpressed as pmoles of O2 per minute per 3 × 10⁴ cells (n = 3).I and CII substrates, respectively. CS, citrate synthase. (n = 4;CC vs OS-93ND1, P <0.05). (H) Mitochondrial membrane potentialf 6 μM oligomycin (O) and 4 μM FCCP (F). Data are mean ± SEM (n = 6).that of FCCP revealed a statistically significant difference (P <0.05) for

Calabrese et al. Cancer & Metabolism 2013, 1:11 Page 7 of 15http://www.cancerandmetabolism.com/content/1/1/11
bioenergetics competence and redox state of cell cloneswere explored. CI-IGA analysis showed a band corre-sponding to fully assembled and functional CI in bothwild-type mtDNA control (CC) and in OS-93ND1 cells,but not in OS-93 (Figure 1C), indicating a recovery ofCI activity. This finding was confirmed by measuring theNAD+/NADH ratio, which was significantly recuperatedby about 50% in OS-93ND1 compared to OS-93 cells(Figure 1D), likely due to recuperated consumption ofNADH in the allotopic clone, albeit not as much as incontrol cells (Figure 1E). The basal respiration of OS-93ND1 clones was higher than in OS-93 and it was inhibitedby oligomycin, indicating at least a partial rescue ofphosphorylation capacity (Figure 1F). Furthermore, respir-ation was stimulated by addition of the uncouplertrifluorocarbonylcyanide phenylhydrazone (FCCP) andlargely inhibited by rotenone and antimycin A (AA),confirming the rescue of CI function (Figure 1F). Thisfinding was strengthened by the fact that OS-93ND1 cellspartially but significantly recuperated CI-driven ATP syn-thesis compared to OS-93, as evaluated in digitonin-permeabilized cells in the presence of specific substrates(Figure 1G). No difference in CII-driven ATP synthesis wasdetected between allotopic and ND1-null cells, suggestingno alteration of the remaining spans of oxidative phosphor-ylation (Figure 1G). Moreover, similarly to CC, mitochon-drial membrane potential (ΔΨm) was maintained inallotopic cells after the addition of the ATP-synthase inhibi-tor oligomycin, whereas OS-93 cells rapidly depolarized(Figure 1H). Taken together, these results demonstrate thatND1 allotopic expression permitted recovery of a func-tional CI and rescued cellular bioenergetics competence.
Complex I-competent allotopic clones recovertumorigenic potentialTo address the question of whether CI function is re-quired for cancer cell growth, CC, OS-93 and OS-93ND1
were tested for their capacity to grow in an anchorage-independent manner. Allotopically complemented cellsformed larger and significantly more numerous coloniesthan their mock clones (Figure 2A-B). Cells were injectedin nude mice to determine their tumorigenic potentialin vivo. Similar to controls, OS-93ND1-derived tumors(OST-93ND1) grew significantly larger than those derivedfrom OS-93 cells (OST-93) (Figure 2C), demonstrating thatthe recovery of CI function in vivo (Figure 2D) is requiredfor tumor growth. We have previously demonstrated thatin the presence of a quasi-homoplasmic m.3571insC muta-tion, mitochondrial morphology is heavily deranged [15]. Infact, electron micrographs of OST-93 tumors showed largemitochondria with clear matrix and almost total loss ofcristae (Figure 2E). On the other hand, OST-93ND1 and CCtumors presented with a population of mitochondriamostly with darker matrix and normal cristae (Figure 2E),
indicating that the recovery of CI function was strictly asso-ciated with a recuperation of a normal mitochondrialmorphology. These findings confirm the beneficial effectsof allotopic ND1 expression on mitochondria in vivo. Inorder to rule out that such recovery might be due to agenetic reversion occurring during xenograft growth, weresequenced the mtDNA derived from the tumors and noother mutations apart from the m.3571insC were detected.Occurrence of revertant genotypes was also excluded by F-PCR (Figure 2F) and DHPLC analysis (Additional file 8:Figure S6). Overall, these data clearly indicate that CIfunction is required to sustain tumor growth in vivo.We next addressed the involvement of ROS, since they
have been shown to positively contribute to tumorgrowth and metastasis [18,51]. Hydrogen peroxide andsuperoxide levels were measured in the absence and inpresence of AA (Additional file 4; Methods), an inhibitorof complex III (CIII) and the main superoxide inducer[17]. We previously reported that CI-ablated cells maybe expected to produce fewer radicals, due to lack ofone of the two ROS production sites [14,15], a trend wealso observed here between CC and both OS-93 andallotopic OS-93ND1 (Additional file 9: Figure S7A-B),albeit not significant. Further, upon AA treatment, asignificant increase in ROS levels was observed only inCC, whereas no increase was shown to occur in OS-93and OS-93ND1 cells. These findings suggest that thesevere CI mutation may not permit the normal electronflow through the complex and the rest of the respiratorychain, failing to ensure a minimal amount of electronsrequired for production of radicals, even in the presenceof inhibited CIII. In allotopic cells, we failed to detect arescue of ROS levels, indicating that the amount of fullyre-assembled CI was lower than in CC cells, finallyallowing us to rule out a major ROS contribution indetermining the different tumorigenic potential ofallotopic compared to CI-deficient cells.
Global transcriptomic profiling reveals a HIF-1α-regulated Warburg phenotype in allotopic tumorsWith the aim of dissecting the molecular pathways de-termining tumor growth or arrest in dependence of CIrecovery, we next conducted a global transcriptomicprofiling on OST-93 and OST-93ND1 xenografts. Wefound 521 DE genes, out of which 226 upregulated inOST-93 and 296 in OST-93ND1 samples (Figure 3A andAdditional file 2: Table S1), with fold changes rangingbetween 2.0 and 13.8. The most significant GO categoriesamong OST-93ND1 upregulated genes included the acti-vation of the translational apparatus (Additional file 10:Table S2).We have previously demonstrated that CI-deficient
tumors are unable to respond to hypoxia via thedestabilization of transcription factor HIF-1α [14,15]. In

Figure 2 Complex I (CI) function is required for recovery of tumorigenic potential in vitro and in vivo. (A) Representative images ofanchorage-independent colony growth in soft agar of control (CC), OS-93 and OS-93ND1 cell lines. (B) Colony count on soft agar plate after7 days; data are mean ± SD (n = 3, *P <0.05). (C) Tumor growth induced upon injection of CC, OS-93 and OS-93ND1 cell lines in nude mice. Dataare mean ± standard error of the mean (SEM) (n = 3, 5 to 10 animals inoculated in each experiment; *P <0.05; *CC and OS-93ND1 versus OS-93).(D) CI-in gel activity (IGA) assay in tumor homogenates from CC, OST-93 and OST-93ND1 tumors. One representative experiment of three isshown. (E) Representative electron micrographs of CC, OST-93 and OST-93ND1 tumors. Asterisks indicate diverse mitochondrial morphology.(F) Fluorescent-PCR analysis of the m.3571insC in OS-93 and OS-93ND1 cell lines and xenografts (OST). All xenografts maintained the samem.3571insC mutant load as their corresponding cell lines (>90%).
Calabrese et al. Cancer & Metabolism 2013, 1:11 Page 8 of 15http://www.cancerandmetabolism.com/content/1/1/11
order to assess the involvement of HIF-1α-responsivetargets, we specifically looked at such pathways withinthe set of DE genes. Interestingly, 21 out of 521 geneswere downstream targets of HIF-1α (Figure 3B), most ofwhich were known to be overexpressed during the hyp-oxia response. Remarkably, HIF-1α-responsive NDRG1,LGALS3 and IGFBP3, overexpressed in OST-93ND1 tu-mors, were among the top-ranked DE genes detectedhere, with a false discovery rate (FDR) <5% (Additionalfile 2: Table S1). In agreement with data on known HIF-1α-repressed gene targets, a significant under-expressionof MCM10, BRCA1 and TPM1 was found in OST-93ND1
tumors, suggesting an overall activation of the HIF-1α-regulated pathway occurring exclusively in allotopicxenografts (Figure 3B). Among HIF-1α-responsive genes,a cluster of four belonging to the glycolytic pathway(PFKP, GAPDH, PGK1 and LDHA) and two encodingglucose transporters (SLC2A1, SLC2A3) were significantly
overexpressed in OST-93ND1 tumors (Figure 3B-C). Noother significant differential expression was evident fromthe transcriptomic data analysis regarding genes involved incellular metabolism, indicating that glycolysis may beprevalently responsible for the higher growth ability of CI-competent cancer cells, suggesting the existence of aWarburg transcriptional profile in such tumors.Transcriptomic data were confirmed and validatedby qRT-PCR (Figure 3D), which highly correlated(R2 = 0.91) with the RNA-Seq data (Additional file 11:Figure S8).
HIF-1α stabilization occurs upon CI recovery anddecreased α-KG/SA ratioTo assess whether restoring CI via nND1 expression af-fected HIF-1α stabilization, IHC analysis was performedon OST-93 and OST-93ND1 xenografts. Positive stainingof both the NDUFB8 CI subunit and HIF-1α was found

Figure 3 Transcriptional profile of OST-93 and OST-93ND1 xenografts. (A) Heatmap displaying expression levels of the 521 differentiallyexpressed (DE) genes in the samples analyzed. Dark red = upregulated genes; cyan = downregulated genes. (B) The transcriptional profile of theWarburg phenotype. Heatmap showing gene expression profile of 21 DE genes from the hypoxia inducible factor-1α (HIF-1α) activation pathway.Genes are ordered by decreasing log2 fold change. Glucose transporters and glycolytic genes are marked in red. (C) Glucose uptake andglycolytic reactions. Genes overexpressed in OST-93ND1 xenografts are labeled in red. Red circles represent glucose molecules. (D) Quantitativereal-time PCR validation performed on biological replicates of OST-93 (n = 2) and OST-93ND1 (n = 7) for 9/21 HIF-1α-responsive genes found DE inRNA-Seq (*P <0.05).
Calabrese et al. Cancer & Metabolism 2013, 1:11 Page 9 of 15http://www.cancerandmetabolism.com/content/1/1/11

Calabrese et al. Cancer & Metabolism 2013, 1:11 Page 10 of 15http://www.cancerandmetabolism.com/content/1/1/11
only in OST-93ND1 tumors (Figure 4A panels a-d). BothOST-93 and OST-93ND1 masses positively stained withhypoxic marker pimonidazole, indicating that HIF-1αwas not stabilized in OST-93 tumors despite the low-oxygen tension microenvironment in vivo (Figure 4Apanels e-f). The strong association between CI and HIF-1αstabilization was furthermore evident from the high cor-relation (R2 = 0.898) of the NDUFB8 and HIF-1α IHC
Figure 4 (See legend on next page.)
staining (Figure 4B). Moreover, the protein expressionlevels of HIF-1α and its downstream target LDHA, wereincreased only in OST-93ND1 xenografts, demonstratingthat HIF-1α was only functional in CI-competent tumors(Figure 4C). Since HIF-1α turnover is known to be af-fected by the α-KG/SA ratio, we investigated the levels ofthese two tricarboxylic acid (TCA) cycle metabolites inOST-93- and OST-93ND1-derived cells. The α-KG/SA
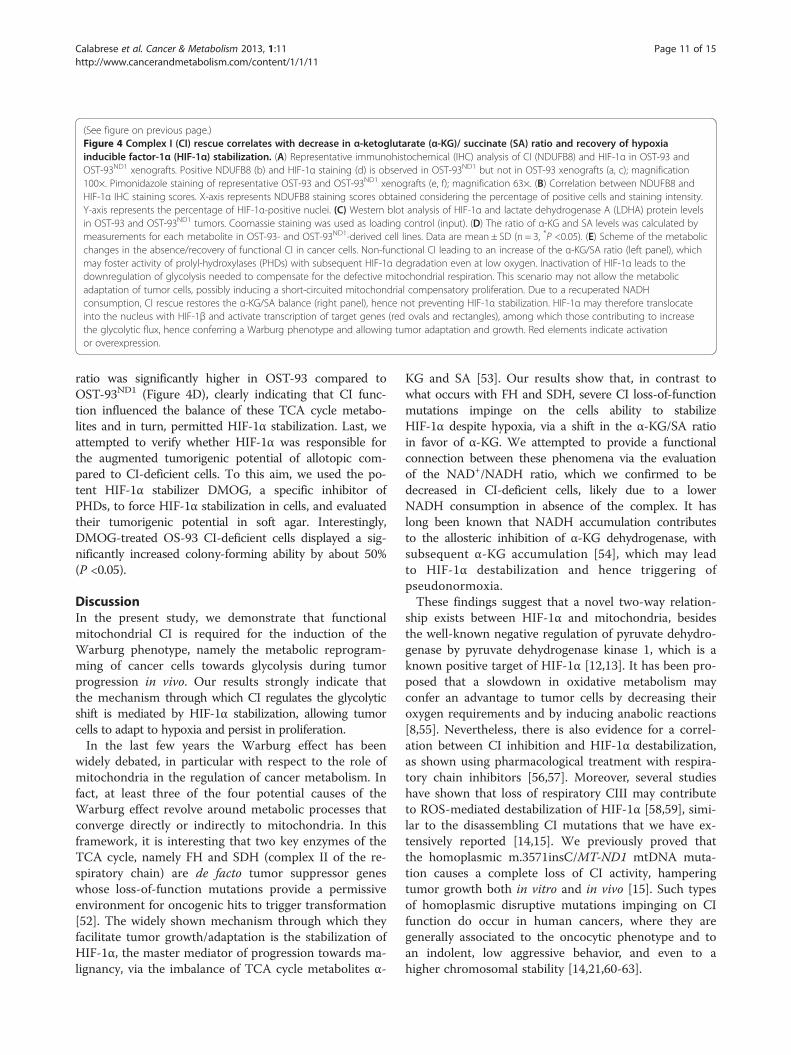
(See figure on previous page.)Figure 4 Complex I (CI) rescue correlates with decrease in α-ketoglutarate (α-KG)/ succinate (SA) ratio and recovery of hypoxiainducible factor-1α (HIF-1α) stabilization. (A) Representative immunohistochemical (IHC) analysis of CI (NDUFB8) and HIF-1α in OST-93 andOST-93ND1 xenografts. Positive NDUFB8 (b) and HIF-1α staining (d) is observed in OST-93ND1 but not in OST-93 xenografts (a, c); magnification100×. Pimonidazole staining of representative OST-93 and OST-93ND1 xenografts (e, f); magnification 63×. (B) Correlation between NDUFB8 andHIF-1α IHC staining scores. X-axis represents NDUFB8 staining scores obtained considering the percentage of positive cells and staining intensity.Y-axis represents the percentage of HIF-1α-positive nuclei. (C) Western blot analysis of HIF-1α and lactate dehydrogenase A (LDHA) protein levelsin OST-93 and OST-93ND1 tumors. Coomassie staining was used as loading control (input). (D) The ratio of α-KG and SA levels was calculated bymeasurements for each metabolite in OST-93- and OST-93ND1-derived cell lines. Data are mean ± SD (n = 3, *P <0.05). (E) Scheme of the metabolicchanges in the absence/recovery of functional CI in cancer cells. Non-functional CI leading to an increase of the α-KG/SA ratio (left panel), whichmay foster activity of prolyl-hydroxylases (PHDs) with subsequent HIF-1α degradation even at low oxygen. Inactivation of HIF-1α leads to thedownregulation of glycolysis needed to compensate for the defective mitochondrial respiration. This scenario may not allow the metabolicadaptation of tumor cells, possibly inducing a short-circuited mitochondrial compensatory proliferation. Due to a recuperated NADHconsumption, CI rescue restores the α-KG/SA balance (right panel), hence not preventing HIF-1α stabilization. HIF-1α may therefore translocateinto the nucleus with HIF-1β and activate transcription of target genes (red ovals and rectangles), among which those contributing to increasethe glycolytic flux, hence conferring a Warburg phenotype and allowing tumor adaptation and growth. Red elements indicate activationor overexpression.
Calabrese et al. Cancer & Metabolism 2013, 1:11 Page 11 of 15http://www.cancerandmetabolism.com/content/1/1/11
ratio was significantly higher in OST-93 compared toOST-93ND1 (Figure 4D), clearly indicating that CI func-tion influenced the balance of these TCA cycle metabo-lites and in turn, permitted HIF-1α stabilization. Last, weattempted to verify whether HIF-1α was responsible forthe augmented tumorigenic potential of allotopic com-pared to CI-deficient cells. To this aim, we used the po-tent HIF-1α stabilizer DMOG, a specific inhibitor ofPHDs, to force HIF-1α stabilization in cells, and evaluatedtheir tumorigenic potential in soft agar. Interestingly,DMOG-treated OS-93 CI-deficient cells displayed a sig-nificantly increased colony-forming ability by about 50%(P <0.05).
DiscussionIn the present study, we demonstrate that functionalmitochondrial CI is required for the induction of theWarburg phenotype, namely the metabolic reprogram-ming of cancer cells towards glycolysis during tumorprogression in vivo. Our results strongly indicate thatthe mechanism through which CI regulates the glycolyticshift is mediated by HIF-1α stabilization, allowing tumorcells to adapt to hypoxia and persist in proliferation.In the last few years the Warburg effect has been
widely debated, in particular with respect to the role ofmitochondria in the regulation of cancer metabolism. Infact, at least three of the four potential causes of theWarburg effect revolve around metabolic processes thatconverge directly or indirectly to mitochondria. In thisframework, it is interesting that two key enzymes of theTCA cycle, namely FH and SDH (complex II of the re-spiratory chain) are de facto tumor suppressor geneswhose loss-of-function mutations provide a permissiveenvironment for oncogenic hits to trigger transformation[52]. The widely shown mechanism through which theyfacilitate tumor growth/adaptation is the stabilization ofHIF-1α, the master mediator of progression towards ma-lignancy, via the imbalance of TCA cycle metabolites α-
KG and SA [53]. Our results show that, in contrast towhat occurs with FH and SDH, severe CI loss-of-functionmutations impinge on the cells ability to stabilizeHIF-1α despite hypoxia, via a shift in the α-KG/SA ratioin favor of α-KG. We attempted to provide a functionalconnection between these phenomena via the evaluationof the NAD+/NADH ratio, which we confirmed to bedecreased in CI-deficient cells, likely due to a lowerNADH consumption in absence of the complex. It haslong been known that NADH accumulation contributesto the allosteric inhibition of α-KG dehydrogenase, withsubsequent α-KG accumulation [54], which may leadto HIF-1α destabilization and hence triggering ofpseudonormoxia.These findings suggest that a novel two-way relation-
ship exists between HIF-1α and mitochondria, besidesthe well-known negative regulation of pyruvate dehydro-genase by pyruvate dehydrogenase kinase 1, which is aknown positive target of HIF-1α [12,13]. It has been pro-posed that a slowdown in oxidative metabolism mayconfer an advantage to tumor cells by decreasing theiroxygen requirements and by inducing anabolic reactions[8,55]. Nevertheless, there is also evidence for a correl-ation between CI inhibition and HIF-1α destabilization,as shown using pharmacological treatment with respira-tory chain inhibitors [56,57]. Moreover, several studieshave shown that loss of respiratory CIII may contributeto ROS-mediated destabilization of HIF-1α [58,59], simi-lar to the disassembling CI mutations that we have ex-tensively reported [14,15]. We previously proved thatthe homoplasmic m.3571insC/MT-ND1 mtDNA muta-tion causes a complete loss of CI activity, hamperingtumor growth both in vitro and in vivo [15]. Such typesof homoplasmic disruptive mutations impinging on CIfunction do occur in human cancers, where they aregenerally associated to the oncocytic phenotype and toan indolent, low aggressive behavior, and even to ahigher chromosomal stability [14,21,60-63].

Calabrese et al. Cancer & Metabolism 2013, 1:11 Page 12 of 15http://www.cancerandmetabolism.com/content/1/1/11
In order to provide a proof of concept that CI function isnecessary for recovery of tumor growth, we complementedthe OS-93 cell line with the wild-type MT-ND1 using anallotopic expression strategy. The xenografts subjected tothe next generation RNA-Seq technique showed significantupregulation of ribosomal biogenesis and protein transla-tion in tumors with a functional CI (Additional file 10:Table S2), a profile previously defined as a molecularmarker of cancer phenotype. In fact, an augmented synthe-sis of ribosomes, and consequently of proteins, can sustainthe high rate of proliferation required by cancer cells [64,65].Moreover, a significant upregulation of HIF-1α-responsivegenes was detected in allotopic tumors, in particular thoseinvolved in glycolytic metabolism. They were all found tobe overexpressed in cells with intact CI, defining a glyco-lytic transcriptional profile typical of fast-growing tumors[5,6,44,66]. The indication that such a HIF-1α-mediatedWarburg profile is essential to tumor progression wasprovided by the rescue of anchorage-independent cellgrowth upon forced stabilization of the transcription fac-tor by DMOG.Further studies in vivo are warranted to definitely
prove that pseudonormoxia is the main determinant ofthe decreased tumorigenic potential of CI-deficient cells.Nonetheless, our in vitro data support the hypothesisthat a strong metabolic impairment impacts on the HIF-1α-dependent adaptive ability of cancer cells, likely via aTCA imbalance. In fact, HIF-1α degradation is mediatedby the PHD enzymes, which hydroxylate the transcrip-tion factor using α-KG in a reaction that in turn pro-duces SA, an allosteric inhibitor of the PHDs [53].Recovery of CI activity was shown here to restore aphysiological α-KG/SA ratio, indicating that TCA cyclereactivation may be necessary to provide the metabolicconditions for the induction of a hypoxic response witha consequent HIF-1α stabilization (Figure 4E). Such acondition may well depend on a re-balanced ratio ofNAD+/NADH, which followed CI recovery. In fact, sucha metabolite-sensing mechanism and allosteric enzymeregulation may represent a quick route through whichcancer cells can respond to the selective pressure of theever-changing tumor microenvironment, as several stud-ies underline [67]. A similar regulation may be crucial tocarry out the switch between glycolytic and oxidativemetabolism in specific phases of tumor progression, asexplained in a recently proposed wave-like model ofregulation of tumor metabolism [6].Revitalization of mitochondrial function has been pro-
posed as one of the phases following hypoxic adaptation,when nutrients and oxygen are again available to cancercells. In this context, inactivating CI mtDNA mutations,such as m.3571insC/MT-ND1, may exhibit their effectonly at mitochondrial-dependent stages of tumor progres-sion. These effects have been shown to vary, depending on
mutant load and mutation type [21]. For instance, them.3571insC mutation investigated here has been shown toexhibit anti-tumorigenic effects when present above the83% threshold [15]. On the other hand, some missense CImtDNA mutations have been demonstrated to promotetumor growth [18,19]. Overall, it is reasonable to suggestthat although a certain degree of mitochondrial dysfunctioncan be advantageous when selective pressures operate, totalimpairment of OXPHOS may not sustain tumor progres-sion. It is therefore of paramount importance to note thatboth the degree of heteroplasmy and the type of mutation(missense vs truncating) must be carefully taken into ac-count when considering the prognostic value of suchgenetic markers, since they may determine a completelyopposite tumor fate, according to whether CI is functionalor not [15,20,21,68,69]. From our results, in fact, it hasemerged that intact CI is needed for adaptation to hypoxia,which is in agreement with previous reports showing thatHIF-1α stabilization requires functional OXPHOS in condi-tions of oxygen shortage [59,70].
ConclusionsThe role of CI in the induction of the Warburg pheno-type and hypoxia response in cancer cells suggests thatit may no longer be considered an enzyme that merelycontributes to mitochondrial function, but that it maybe pivotal in determining the fate of cancer cells afterderegulation of their metabolic switch during tumorprogression. Therefore, CI, far from being considered atumor suppressor, ought more likely to be looked uponas a lethality modifier of cancer cells when completeloss-of-function mutations occur. Such concepts, epito-mized by the definition of oncojanus mitochondrial mu-tations [15], has potential applications in establishingprognostic criteria, since genetic markers such as CI-disruptive mutations may have a strong impact on thesuccessful metabolic adaptation of the neoplasia.
Additional files
Additional file 1: Figure S1. DMOG effects validation. Western blotanalysis for hypoxia inducible factor-1α (HIF-1α) protein on cell lysatesupon treatment with 1 μM dimethyloxallylglycine (DMOG) indicatepresence of stabilized HIF-1α only in the treated cells despite normoxicculture conditions. Tubulin was used as a loading control.
Additional file 2: Table S1. Raw sequencing data together with the521 genes differentially expressed among the two groups of samples(OST-93, OST-93ND1).
Additional file 3: Figure S2. FastQC analysis of fastq sequences fromthe four data sets of samples. Panel A and B refer respectively to OST-93samples and to OST-93ND1 samples. (a-c) the distribution of the averagequality scores per sequence within the set always ranges between 30 to39 QS (quality score) values; (b-d) QS distribution per base positionacross the maximum read length observed within the data set. In all foursamples the lower quartile associated to the 300th position of the read(average read length for each sequences data set) is always above 20.

Calabrese et al. Cancer & Metabolism 2013, 1:11 Page 13 of 15http://www.cancerandmetabolism.com/content/1/1/11
Additional file 4: Additional information.
Additional file 5: Figure S3. Generation of allotopic nND1. (A)Elecropherogram showing m.3571insC in OS-93 cell line. (B) Amino acidsequence of ND1. The sites of directed mutagenesis performed tooptimize codon usage for cytosolic translation of methionine (M) andtryptophan (W) are underlined and indicated in bold. (C) Scheme of theallotopic expression vector containing the nND1 transgene with the30- and 50-UTR from the nuclear-encoded COX10 mitochondrial protein.Antibiotic resistance genes, CMV promoter, SV40 and f1 origin ofreplication are also indicated. (D) qRT-PCR showing mRNA expression ofthe cytosolically expressed nND1 construct in OS-93 cells.
Additional file 6: Figure S4. Revertans exclusion. Denaturing highperformance liquid chromatography (DHPLC) analysis of the allotopicallycomplemented OS-93 cells. OS-93ND1#1 (cyan) has maintained the samem.3571insC mutant load as the original OS-93 cell line (red), while OS-93ND1#2 is a representative example of a revertant clone in which a higherproportion of wild-type molecules is evident from the elevated elutionpeak (pink).
Additional file 7: Figure S5. Cellular growth determination. Cellulargrowth in DMEM-high glucose. Data represent mean ± standard error ofthe mean (n = 3).
Additional file 8: Figure S6. Denaturing high performance liquidchromatography (DHPLC) analysis of OS-93 and OS-93ND1 clones andcorresponding xenografts. Elution curves indicate maintenance of them.3571insC genotype (mutant loads >90%).
Additional file 9: Figure S7. Evaluation of reactive oxygen species(ROS) levels. (A) Hydrogen peroxide levels were measured using 2 μMH2DCFDA in the absence (basal) and presence of 1 uM antimycin A (AA)for 1 h, as described in Additional file 4; Methods. Data (mean ± SD, n = 3;*P <0.05) are expressed as ratio of fluorescence of H2DCFDA and calcein-AM. (B) Superoxide production was determined using 5 μM MitoSOX-Red, as described in Additional file 4; Methods. Images are representativeof three different experiments. Magnification 63×/1.4. Ten images wereacquired for each experiment.
Additional file 10: Table S2. Gene Ontology (GO) and KyotoEncyclopedia of Genes and Genomes (KEGG) categories enrichmentresults: 34 GO categories and 8 KEGG categories were found significantlyenriched among all the 521 differentially expressed genes. GOenrichments were also found by the GeneMania software among thetwo sets of only overexpressed genes per sample (226 upregulatedgenes within the OST-93 group and 296 upregulated genes within theOST-93ND1 group).
Additional file 11: Figure S8. Correlation between RNA-Seq analysisand qRT-PCR performed for 15/521 DE genes. Pearsons correlationcoefficient was calculated using log2fold values.
AbbreviationsAA: Antimycin A; AC: Aconitase; α-KG: α-ketoglutarate; ANOVA: Analysis ofvariance; BN-PAGE: Blue native polyacrlylammide gel electrophoresis;bp: Base pair; CC: Control cell line; CI: Complex I; CS: Citrate synthase;DE: Differentially expressed; DHPLC: Denaturing high performance liquidchromatography; DMEM: Dulbecco’s modified Eagle’s medium;DMOG: Dimethyloxallylglycine; FBS: Fetal bovine serum;FCCP: Trifluorocarbonylcyanide phenylhydrazone; FDR: False discovery rate;FH: Fumarate hydratase; F-PCR: Fluorescent polymerase chain reaction;GO: Gene ontology; HIF-1α: Hypoxia inducible factor-1α; IDH: Isocitratedehydrogenase; IGA: In gel activity; IHC: Immunohistochemical;IRS: Immunoreactivity score; KEGG: Kyoto encyclopedia of genes andgenomes; KG-D: α-ketoglutarate dehydrogenase; LDHA,: Lactatedehydrogenase A; MDH: Malate dehydrogenase; mtDNA: Mitochondrial DNA;NGS-Trex: Next generation sequencing-TRanscriptome profile explorer;OCR: Oxygen consumption rate; OXPHOS: Oxidative phosphorylation;PBS: Phosphate-buffered saline; PHD: Prolyl-hydroxylase; qRT-PCR: Quantitative real-time PCR; rCRS: Revised Cambridge ReferenceSequence; ROS: Reactive oxygen species; SA: Succinate; S-CoA-s: Succinyl-CoA synthase; SDH: Succinate dehydrogenase; TCA: Tricarboxylic acid;TMRM: Tetramethylrhodamine methyl esther; UTR: Untranslated region;VDAC: Voltage-dependent anion channel.
Competing interestsThe authors declare that they have no competing interests.
Authors’ contributionsCC1 and IK performed transcriptomic data analyses and validation and wrotethe paper; LI performed allotopic complementation and biochemicalmeasurements and wrote the paper; MAC performed respiratory complexesassembly assays; CB, RF performed NAD+ and NADH measurements; MC2
performed soft-agar assays; PLL, PN, GN, CDG performed in vivo experiments;AG, MR and VC provided counseling for biochemical studies; VG performedand analyzed SeaHorse experiments; MC6, FM, CM, AT performed RNA-Seqexperiments; CMB performed electron microscopy and corrected the paper;CC9 performed immunohistochemical experiments; MA supervisedbioinformatics analyses; GR provided counseling and funding for moleculargenetics experiments; GG and AMP designed and supervised research,analyzed data and wrote the paper. All authors read and approved the finalmanuscript.
Authors’ informationCo-first authors: Claudia Calabrese, Luisa Iommarini and Ivana Kurelac; co-lastauthors: Giuseppe Gasparre and Anna Maria Porcelli.
AcknowledgmentsWe are grateful to Dr A Martinuzzi (IRCCS E. Medea, Conegliano Veneto, Italy)for cybrid generation and to Prof. P Bernardi (University of Padua, Italy) forallowing use of the SeaHorse technology. This work was supported by theItalian Ministry of University and Research (MIUR) grants FIRB Futuro inRicerca “TRANSMIT” 2008 to GG, and PRIN 2008 to AMP. This work was alsosupported by the Associazione Italiana Ricerca sul Cancro (AIRC IG8810) toGR, by Fondazione Cassa di Risparmio di Puglia to MA and by grant DISCOTRIP from the Fondazione Umberto Veronesi to GG. IK is supported by atriennial Borromeo AIRC fellowship. LI is supported by an annual fellowshipfrom the Fondazione Umberto Veronesi.
Author details1Dip. Scienze Mediche e Chirurgiche (DIMEC), U.O. Genetica Medica, Pol.Universitario S. Orsola-Malpighi, Università di Bologna, via Massarenti 9,40138 Bologna, Italy. 2Dip. Farmacia e Biotecnologie (FABIT), Università diBologna, via Belmeloro 6, 40126 Bologna, Italy. 3Dip. Medicina Specialistica,Diagnostica e Sperimentale, Università di Bologna, Viale Filopanti 22, 40126and via Massarenti 9, 40138 Bologna, Italy. 4Laboratorio di OncologiaSperimentale, Istituti Ortopedici Rizzoli, 40136 Bologna, Italy. 5Dip. ScienzeBiomediche, Università di Padova, Padova, Italy. 6Istituto di TecnologieBiomediche - ITB, Consiglio Nazionale delle Ricerche (CNR), Bari, Italy. 7Dip.Bioscienze, Biotecnologie e Scienze Farmacologiche, Università di Bari, via E.Orabona 4, 70126 Bari, Italy. 8IRCCS Istituto delle Scienze Neurologiche, 40100Bologna, Italy. 9Dip. Sc. Radiologiche ed Istopatologiche, Pol. Universitario S.Orsola-Malpighi, Università di Bologna, via Massarenti 9, 40138 Bologna, Italy.10Centro Interdipartimentale di Ricerca Industriale Scienze della Vita eTecnologie per la Salute, Università di Bologna, 40100 Bologna, Italy.
Received: 5 November 2012 Accepted: 27 February 2013Published: 18 March 2013
References1. Koppenol WH, Bounds PL, Dang CV: Otto Warburg’s contributions to
current concepts of cancer metabolism. Nat Rev Cancer 2010, 11:325–337.2. Warburg O, Posener K, Negelein E: Uber den Stoffwechsel der
Carcinomzelle. Biochem Zeitschr 1924, 152:309–344.3. Ward PS, Thompson CB: Metabolic reprogramming: a cancer hallmark
even Warburg did not anticipate. Cancer Cell 2012, 21:297–308.4. DeBerardinis RJ, Lum JJ, Hatzivassiliou G, Thompson CB: The biology of
cancer: metabolic reprogramming fuels cell growth and proliferation.Cell Metab 2008, 7:11–20.
5. Moreno-Sanchez R, Rodriguez-Enriquez S, Marin-Hernandez A, Saavedra E:Energy metabolism in tumor cells. Febs J 2007, 274:1393–1418.
6. Smolkova K, Plecita-Hlavata L, Bellance N, Benard G, Rossignol R, Jezek P:Waves of gene regulation suppress and then restore oxidativephosphorylation in cancer cells. Int J Biochem Cell Biol 2010, 43:950–968.
7. Chandra D, Singh KK: Genetic insights into OXPHOS defect and its role incancer. Biochim Biophys Acta 1807, 2011:620–625.

Calabrese et al. Cancer & Metabolism 2013, 1:11 Page 14 of 15http://www.cancerandmetabolism.com/content/1/1/11
8. Galluzzi L, Morselli E, Kepp O, Vitale I, Rigoni A, Vacchelli E, Michaud M, Zischka H,Castedo M, Kroemer G: Mitochondrial gateways to cancer. Mol Aspects Med2010, 31:1–20.
9. Chavez A, Miranda LF, Pichiule P, Chavez JC: Mitochondria and hypoxia-induced gene expression mediated by hypoxia-inducible factors. Ann NYAcad Sci 2008, 1147:312–320.
10. Semenza GL: Hypoxia-inducible factor 1 (HIF-1) pathway. Sci STKE 2007,2007:cm8.
11. Semenza GL, Roth PH, Fang HM, Wang GL: Transcriptional regulation ofgenes encoding glycolytic enzymes by hypoxia-inducible factor 1. J BiolChem 1994, 269:23757–23763.
12. Kim JW, Tchernyshyov I, Semenza GL, Dang CV: HIF-1-mediated expressionof pyruvate dehydrogenase kinase: a metabolic switch required forcellular adaptation to hypoxia. Cell Metab 2006, 3:177–185.
13. Papandreou I, Cairns RA, Fontana L, Lim AL, Denko NC: HIF-1 mediatesadaptation to hypoxia by actively downregulating mitochondrial oxygenconsumption. Cell Metab 2006, 3:187–197.
14. Porcelli AM, Ghelli A, Ceccarelli C, Lang M, Cenacchi G, Capristo M,Pennisi LF, Morra I, Ciccarelli E, Melcarne A, Bartoletti-Stella A, SalfiN, Tallini G, Martinuzzi A, Carelli V, Attimonelli M, Rugolo M, RomeoG, Gasparre G: The genetic and metabolic signature of oncocytictransformation implicates HIF1alpha destabilization. Hum MolGenet 2010, 19:1019–1032.
15. Gasparre G, Kurelac I, Capristo M, Iommarini L, Ghelli A, Ceccarelli C,Nicoletti G, Nanni P, De Giovanni C, Scotlandi K, Betts CM, Carelli V,Lollini PL, Romeo G, Rugolo M, Porcelli AM: A mutation thresholddistinguishes the antitumorigenic effects of the mitochondrialgene MTND1, an oncojanus function. Cancer Res 2011,71:6220–6229.
16. Brandt U: Energy converting NADH:quinone oxidoreductase (complex I).Annu Rev Biochem 2006, 75:69–92.
17. Koopman WJ, Nijtmans LG, Dieteren CE, Roestenberg P, Valsecchi F,Smeitink JA, Willems PH: Mammalian mitochondrial complex I:biogenesis, regulation, and reactive oxygen species generation.Antioxid Redox Signal 2010, 12:1431–1470.
18. Ishikawa K, Takenaga K, Akimoto M, Koshikawa N, Yamaguchi A, Imanishi H,Nakada K, Honma Y, Hayashi J: ROS-generating mitochondrial DNAmutations can regulate tumor cell metastasis. Science 2008, 320:661–664.
19. Sharma LK, Fang H, Liu J, Vartak R, Deng J, Bai Y: Mitochondrial respiratorycomplex I dysfunction promotes tumorigenesis through ROS alterationand AKT activation. Hum Mol Genet 2011, 20:4605–4616.
20. Park JS, Sharma LK, Li H, Xiang R, Holstein D, Wu J, Lechleiter J, Naylor SL,Deng JJ, Lu J, Bai Y: A heteroplasmic, not homoplasmic, mitochondrialDNA mutation promotes tumorigenesis via alteration in reactive oxygenspecies generation and apoptosis. Hum Mol Genet 2009, 18:1578–1589.
21. Iommarini L, Calvaruso MA, Kurelac I, Gasparre G, Porcelli AM: Complex Iimpairment in mitochondrial diseases and cancer: Parallel roads leadingto different outcomes. Int J Biochem Cell Biol 2013, 45(1):47–63.
22. Zielke A, Tezelman S, Jossart GH, Wong M, Siperstein AE, Duh QY, Clark OH:Establishment of a highly differentiated thyroid cancer cell line ofHurthle cell origin. Thyroid 1998, 8:475–483.
23. Bonnet C, Kaltimbacher V, Ellouze S, Augustin S, Benit P, Forster V, Rustin P,Sahel JA, Corral-Debrinski M: Allotopic mRNA localization to themitochondrial surface rescues respiratory chain defects in fibroblastsharboring mitochondrial DNA mutations affecting complex I or vsubunits. Rejuvenation Res 2007, 10:127–144.
24. Rozen S, Skaletsky H: Primer3 on the WWW for general users and forbiologist programmers. Methods Mol Biol 2000, 132:365–386.
25. OligoAnalyzer. [http://eu.idtdna.com/analyzer/Applications/OligoAnalyzer/]26. Guerra F, Kurelac I, Cormio A, Zuntini R, Amato LB, Ceccarelli C, Santini D, Cormio
G, Fracasso F, Selvaggi L, Resta L, Attimonelli M, Gadaleta MN, Gasparre G:Placing mitochondrial DNA mutations within the progression model of type Iendometrial carcinoma. Hum Mol Genet 2011, 20:2394–2405.
27. Kurelac I, Lang M, Zuntini R, Calabrese C, Simone D, Vicario S,Santamaria M, Attimonelli M, Romeo G, Gasparre G: Searching for aneedle in the haystack: comparing six methods to evaluateheteroplasmy in difficult sequence context. Biotechnol Adv 2011,30:363–371.
28. Calvaruso MA, Smeitink J, Nijtmans L: Electrophoresis techniques toinvestigate defects in oxidative phosphorylation. Methods 2008,46:281–287.
29. Wittig I, Karas M, Schagger H: High resolution clear native electrophoresisfor in-gel functional assays and fluorescence studies of membraneprotein complexes. Mol Cell Proteomics 2007, 6:1215–1225.
30. Porcelli AM, Angelin A, Ghelli A, Mariani E, Martinuzzi A, Carelli V, Petronilli V,Bernardi P, Rugolo M: Respiratory complex I dysfunction due tomitochondrial DNA mutations shifts the voltage threshold for openingof the permeability transition pore toward resting levels. J Biol Chem2009, 284:2045–2052.
31. Jones DP: Determination of pyridine dinucleotides in cell extracts by high-performance liquid chromatography. J Chromatogr 1981, 225:446–449.
32. Giorgio V, Petronilli V, Ghelli A, Carelli V, Rugolo M, Lenaz G, Bernardi P: Theeffects of idebenone on mitochondrial bioenergetics. Biochim BiophysActa 1817, 2011:363–369.
33. FastQC. http://www.bioinformatics.babraham.ac.uk/projects/fastqc.34. NGS-Trex. www.ngs-trex.org.35. Robinson MD, McCarthy DJ, Smyth GK: edgeR: a Bioconductor package for
differential expression analysis of digital gene expression data.Bioinformatics 2010, 26:139–140.
36. Bioconductor. http://www.bioconductor.org.37. Young MD, Wakefield MJ, Smyth GK, Oshlack A: Gene ontology analysis for
RNA-seq: accounting for selection bias. Genome Biol 2010, 11:R14.38. Warde-Farley D, Donaldson SL, Comes O, Zuberi K, Badrawi R, Chao P, Franz
M, Grouios C, Kazi F, Lopes CT, Maitland A, Mostafavi S, Montojo J, Shao Q,Wright G, Bader GD, Morris Q: The GeneMANIA prediction server:biological network integration for gene prioritization and predictinggene function. Nucleic Acids Res 2010, 38(Web Server issue):W214–220.
39. Manalo DJ, Rowan A, Lavoie T, Natarajan L, Kelly BD, Ye SQ, Garcia JG,Semenza GL: Transcriptional regulation of vascular endothelial cellresponses to hypoxia by HIF-1. Blood 2005, 105:659–669.
40. Greijer AE, van der Groep P, Kemming D, Shvarts A, Semenza GL, Meijer GA,van de Wiel MA, Belien JA, van Diest PJ, van der Wall E: Up-regulation ofgene expression by hypoxia is mediated predominantly by hypoxia-inducible factor 1 (HIF-1). J Pathol 2005, 206:291–304.
41. Nickols NG, Jacobs CS, Farkas ME, Dervan PB: Modulating hypoxia-inducible transcription by disrupting the HIF-1-DNA interface. ACS ChemBiol 2007, 2:561–571.
42. Benita Y, Kikuchi H, Smith AD, Zhang MQ, Chung DC, Xavier RJ: An integrativegenomics approach identifies Hypoxia Inducible Factor-1 (HIF-1)-target genesthat form the core response to hypoxia. Nucleic Acids Res 2009, 37:4587–4602.
43. Wang M, Li W, Chang GQ, Ye CS, Ou JS, Li XX, Liu Y, Cheang TY, Huang XL,Wang SM: MicroRNA-21 regulates vascular smooth muscle cell functionvia targeting tropomyosin 1 in arteriosclerosis obliterans of lowerextremities. Arterioscler Thromb Vasc Biol 2011, 31:2044–2053.
44. Semenza GL: Targeting HIF-1 for cancer therapy. Nat Rev Cancer 2003,3:721–732.
45. entry H-Ag. [http://www.ncbi.nlm.nih.gov/gene/3091]46. R-project. www.r-project.org.47. Bartoletti-Stella A, Salfi NC, Ceccarelli C, Attimonelli M, Romeo G, Gasparre G:
Mitochondrial DNA mutations in oncocytic adnexal lacrimal glands ofthe conjunctiva. Arch Ophthalmol 2011, 129:664–666.
48. Remmele W: Stegner HE: [Recommendation for uniform definition of animmunoreactive score (IRS) for immunohistochemical estrogen receptordetection (ER-ICA) in breast cancer tissue]. Pathologe 1987, 8:138–140.
49. Ricciardiello L, Ceccarelli C, Angiolini G, Pariali M, Chieco P, Paterini P, BiascoG, Martinelli GN, Roda E, Bazzoli F: High thymidylate synthase expressionin colorectal cancer with microsatellite instability: implications forchemotherapeutic strategies. Clin Cancer Res 2005, 11:4234–4240.
50. Ceccarelli C, Santini D, Chieco P, Lanciotti C, Taffurelli M, Paladini G, MarranoD: Quantitative p21(waf-1)/p53 immunohistochemical analysis definesgroups of primary invasive breast carcinomas with different prognosticindicators. Int J Cancer 2001, 95:128–134.
51. Petros JA, Baumann AK, Ruiz-Pesini E, Amin MB, Sun CQ, Hall J, Lim S, Issa MM,Flanders WD, Hosseini SH, Marshall FF, Wallace DC:mtDNA mutations increasetumorigenicity in prostate cancer. Proc Natl Acad Sci USA 2005, 102:719–724.
52. King A, Selak MA, Gottlieb E: Succinate dehydrogenase and fumaratehydratase: linking mitochondrial dysfunction and cancer. Oncogene 2006,25:4675–4682.
53. Selak MA, Armour SM, MacKenzie ED, Boulahbel H, Watson DG, MansfieldKD, Pan Y, Simon MC, Thompson CB, Gottlieb E: Succinate links TCA cycledysfunction to oncogenesis by inhibiting HIF-alpha prolyl hydroxylase.Cancer Cell 2005, 7:77–85.

Calabrese et al. Cancer & Metabolism 2013, 1:11 Page 15 of 15http://www.cancerandmetabolism.com/content/1/1/11
54. Bunik VI, Buneeva OA, Gomazkova VS: Change in alpha-ketoglutaratedehydrogenase cooperative properties due to dihydrolipoate and NADH.FEBS Lett 1990, 269:252–254.
55. Jones RG, Thompson CB: Tumor suppressors and cell metabolism: arecipe for cancer growth. Genes Dev 2009, 23:537–548.
56. Agani FH, Pichiule P, Carlos Chavez J, LaManna JC: Inhibitors ofmitochondrial complex I attenuate the accumulation of hypoxia-inducible factor-1 during hypoxia in Hep3B cells. Comp Biochem Physiol AMol Integr Physiol 2002, 132:107–109.
57. Liu Y, Morgan JB, Coothankandaswamy V, Liu R, Jekabsons MB, Mahdi F,Nagle DG, Zhou YD: The Caulerpa pigment caulerpin inhibits HIF-1activation and mitochondrial respiration. J Nat Prod 2009, 72:2104–2109.
58. Guzy RD, Hoyos B, Robin E, Chen H, Liu L, Mansfield KD, Simon MC,Hammerling U, Schumacker PT: Mitochondrial complex III is required forhypoxia-induced ROS production and cellular oxygen sensing. Cell Metab2005, 1:401–408.
59. Mansfield KD, Guzy RD, Pan Y, Young RM, Cash TP, Schumacker PT, SimonMC: Mitochondrial dysfunction resulting from loss of cytochrome cimpairs cellular oxygen sensing and hypoxic HIF-alpha activation. CellMetab 2005, 1:393–399.
60. Gasparre G, Hervouet E, de Laplanche E, Demont J, Pennisi LF, Colombel M,Mege-Lechevallier F, Scoazec JY, Bonora E, Smeets R, Smeitink J, Lazar V,Lespinasse J, Giraud S, Godinot C, Romeo G, Simonnet H: Clonal expansionof mutated mitochondrial DNA is associated with tumor formation andcomplex I deficiency in the benign renal oncocytoma. Hum Mol Genet2008, 17:986–995.
61. Gasparre G, Porcelli AM, Bonora E, Pennisi LF, Toller M, Iommarini L, Ghelli A,Moretti M, Betts CM, Martinelli GN, Ceroni AR, Curcio F, Carelli V, Rugolo M,Tallini G, Romeo G: Disruptive mitochondrial DNA mutations in complex Isubunits are markers of oncocytic phenotype in thyroid tumors. ProcNatl Acad Sci USA 2007, 104:9001–9006.
62. Gasparre G, Romeo G, Rugolo M, Porcelli AM: Learning from oncocytictumors: Why choose inefficient mitochondria? Biochim Biophys Acta 1807,2010:633–642.
63. Kurelac I, MacKay A, Lambros MB, Di Cesare E, Cenacchi G, Ceccarelli C, Morra I,Melcarne A, Morandi L, Calabrese FM, Attimonelli M, Tallini G, Reis-Filho JS,Gasparre G: Somatic complex I disruptive mitochondrial DNA mutations aremodifiers of tumorigenesis that correlate with low genomic instability inpituitary adenomas. Hum Mol Genet 2013, 22:226–238.
64. Drygin D, Rice WG, Grummt I: The RNA polymerase I transcriptionmachinery: an emerging target for the treatment of cancer. Annu RevPharmacol Toxicol 2010, 50:131–156.
65. Montanaro L, Trere D, Derenzini M: Nucleolus, ribosomes, and cancer. AmJ Pathol 2008, 173:301–310.
66. Chaika NV, Yu F, Purohit V, Mehla K, Lazenby AJ, DiMaio D, Anderson JM,Yeh JJ, Johnson KR, Hollingsworth MA, Singh PK: Differential expression ofmetabolic genes in tumor and stromal components of primary andmetastatic loci in pancreatic adenocarcinoma. PLoS One 2012, 7:e32996.
67. Briston T, Yang J, Ashcroft M: HIF-1alpha localization with mitochondria: anew role for an old favorite? Cell Cycle 2011, 10:4170–4171.
68. Guerra F, Perrone AM, Kurelac I, Santini D, Ceccarelli C, Cricca M, Zamagni C,De Iaco P, Gasparre G: Mitochondrial DNA mutation in serous ovariancancer: implications for mitochondria-coded genes in chemoresistance.J Clin Oncol 2012, 30:e373–378.
69. Gasparre G, Porcelli AM, Lenaz G, Romeo G: Relevance of mitochondrialgenetics and metabolism in cancer development. Cold Spring HarbPerspect Biol 2013, 5(2).
70. Schroedl C, McClintock DS, Budinger GR, Chandel NS: Hypoxic but notanoxic stabilization of HIF-1alpha requires mitochondrial reactive oxygenspecies. Am J Physiol Lung Cell Mol Physiol 2002, 283:L922–931.
doi:10.1186/2049-3002-1-11Cite this article as: Calabrese et al.: Respiratory complex I is essential toinduce a Warburg profile in mitochondria-defective tumor cells. Cancer& Metabolism 2013 1:11.
Submit your next manuscript to BioMed Centraland take full advantage of:
• Convenient online submission
• Thorough peer review
• No space constraints or color figure charges
• Immediate publication on acceptance
• Inclusion in PubMed, CAS, Scopus and Google Scholar
• Research which is freely available for redistribution
Submit your manuscript at www.biomedcentral.com/submit