14 - anu press
TRANSCRIPT
terra australis 34
14Late-Quaternary vegetation history of Tasmania from pollen records
Eric A. Colhoun School of Environmental and Life Sciences, University of Newcastle, Newcastle, NSW [email protected]
Peter W. Shimeld University of Tasmania, Hobart, Tasmania
Introduction
Vegetation forms the major living characteristic of a landscape that solicits inquiry into the history of its changes during the late Quaternary and the major factors that have influenced the changes. Early studies considered ecological factors would cause vegetation to develop until a stable climatic climax formation was attained (Clements 1936). The concept of an area developing a potential natural vegetation in the absence of humans was similar (Tüxen 1956). Both ideas held that the vegetation of an area would develop to a stable condition that would change little. However, the vegetation of a region never remains in stasis, but develops dynamically through time, influenced by changing dominant factors (Chiarucci et al. 2010).
The structure of a major vegetation formation is usually dominated by a limited number of taxa of similar physiognomy. Although many taxa are identified at most sites studied for pollen in Tasmania, the major percentages in the records are represented by fewer than 10 pollen taxa. These are widely dispersed taxa, local taxa usually being under-represented in the records (Macphail 1975). The structures of fossil pollen-vegetation formations are interpreted with regard to modern vegetation even though abiotic and biotic conditions rarely remain the same through time, and identical replication is not expected. During the late Quaternary in Tasmania, the most important abiotic changes affecting vegetation were temperature and precipitation, and the most important biotic change was the impact of Aboriginals using their major cultural tool, fire. The advent of people to a region adds another dimension to palaeoecological reconstructions and frequently reveals inconsistencies between the expected vegetation before and the extant vegetation after human occupation (Willis and Birks 2006).
terra australis 34
Eric A. Colhoun and Peter Shimeld298
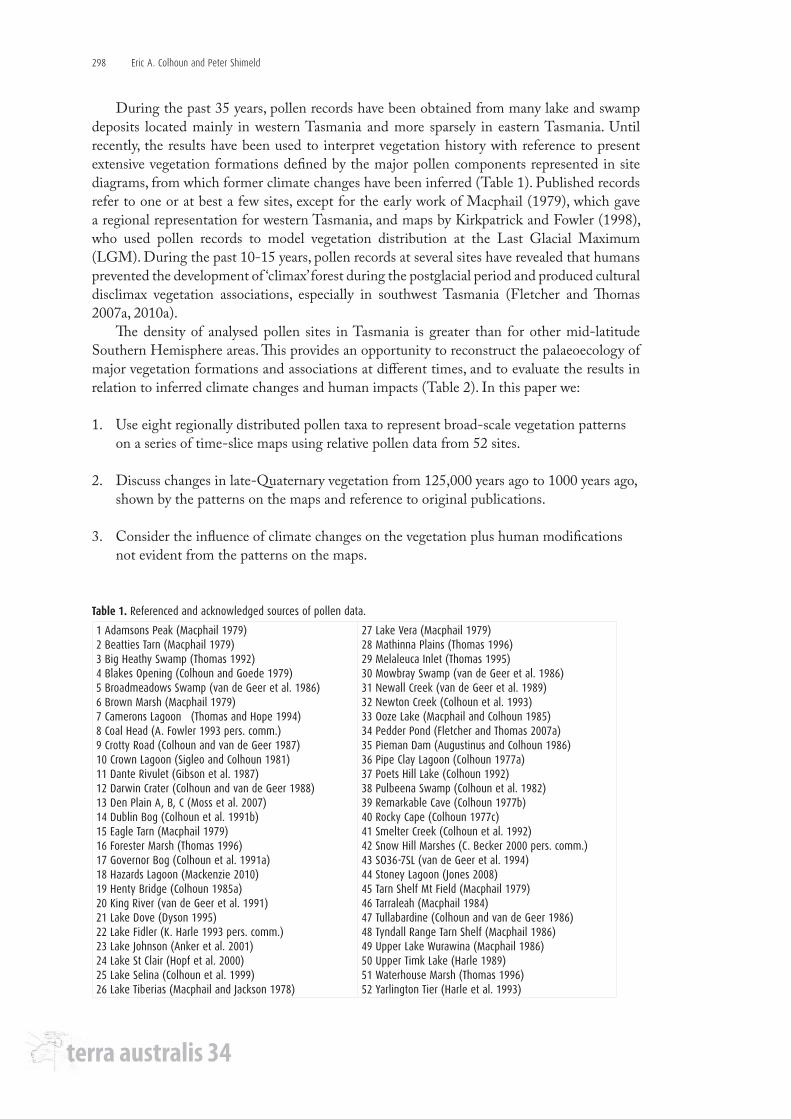
During the past 35 years, pollen records have been obtained from many lake and swamp deposits located mainly in western Tasmania and more sparsely in eastern Tasmania. Until recently, the results have been used to interpret vegetation history with reference to present extensive vegetation formations defined by the major pollen components represented in site diagrams, from which former climate changes have been inferred (Table 1). Published records refer to one or at best a few sites, except for the early work of Macphail (1979), which gave a regional representation for western Tasmania, and maps by Kirkpatrick and Fowler (1998), who used pollen records to model vegetation distribution at the Last Glacial Maximum (LGM). During the past 10-15 years, pollen records at several sites have revealed that humans prevented the development of ‘climax’ forest during the postglacial period and produced cultural disclimax vegetation associations, especially in southwest Tasmania (Fletcher and Thomas 2007a, 2010a).
The density of analysed pollen sites in Tasmania is greater than for other mid-latitude Southern Hemisphere areas. This provides an opportunity to reconstruct the palaeoecology of major vegetation formations and associations at different times, and to evaluate the results in relation to inferred climate changes and human impacts (Table 2). In this paper we:
1. Use eight regionally distributed pollen taxa to represent broad-scale vegetation patterns on a series of time-slice maps using relative pollen data from 52 sites.
2. Discuss changes in late-Quaternary vegetation from 125,000 years ago to 1000 years ago, shown by the patterns on the maps and reference to original publications.
3. Consider the influence of climate changes on the vegetation plus human modifications not evident from the patterns on the maps.
1 Adamsons Peak (Macphail 1979)2 Beatties Tarn (Macphail 1979)3 Big Heathy Swamp (Thomas 1992)4 Blakes Opening (Colhoun and Goede 1979)5 Broadmeadows Swamp (van de Geer et al. 1986)6 Brown Marsh (Macphail 1979)7 Camerons Lagoon (Thomas and Hope 1994)8 Coal Head (A. Fowler 1993 pers. comm.)9 Crotty Road (Colhoun and van de Geer 1987)10 Crown Lagoon (Sigleo and Colhoun 1981)11 Dante Rivulet (Gibson et al. 1987)12 Darwin Crater (Colhoun and van de Geer 1988)13 Den Plain A, B, C (Moss et al. 2007)14 Dublin Bog (Colhoun et al. 1991b)15 Eagle Tarn (Macphail 1979)16 Forester Marsh (Thomas 1996)17 Governor Bog (Colhoun et al. 1991a)18 Hazards Lagoon (Mackenzie 2010)19 Henty Bridge (Colhoun 1985a)20 King River (van de Geer et al. 1991)21 Lake Dove (Dyson 1995)22 Lake Fidler (K. Harle 1993 pers. comm.)23 Lake Johnson (Anker et al. 2001)24 Lake St Clair (Hopf et al. 2000)25 Lake Selina (Colhoun et al. 1999)26 Lake Tiberias (Macphail and Jackson 1978)
27 Lake Vera (Macphail 1979)28 Mathinna Plains (Thomas 1996)29 Melaleuca Inlet (Thomas 1995)30 Mowbray Swamp (van de Geer et al. 1986)31 Newall Creek (van de Geer et al. 1989)32 Newton Creek (Colhoun et al. 1993)33 Ooze Lake (Macphail and Colhoun 1985)34 Pedder Pond (Fletcher and Thomas 2007a)35 Pieman Dam (Augustinus and Colhoun 1986)36 Pipe Clay Lagoon (Colhoun 1977a)37 Poets Hill Lake (Colhoun 1992)38 Pulbeena Swamp (Colhoun et al. 1982)39 Remarkable Cave (Colhoun 1977b)40 Rocky Cape (Colhoun 1977c)41 Smelter Creek (Colhoun et al. 1992)42 Snow Hill Marshes (C. Becker 2000 pers. comm.)43 SO36-7SL (van de Geer et al. 1994)44 Stoney Lagoon (Jones 2008)45 Tarn Shelf Mt Field (Macphail 1979)46 Tarraleah (Macphail 1984)47 Tullabardine (Colhoun and van de Geer 1986)48 Tyndall Range Tarn Shelf (Macphail 1986)49 Upper Lake Wurawina (Macphail 1986)50 Upper Timk Lake (Harle 1989)51 Waterhouse Marsh (Thomas 1996)52 Yarlington Tier (Harle et al. 1993)
Table 1. Referenced and acknowledged sources of pollen data.
terra australis 34
Late-Quaternary vegetation history of Tasmania from pollen records 299
Tasmanian environment and vegetation
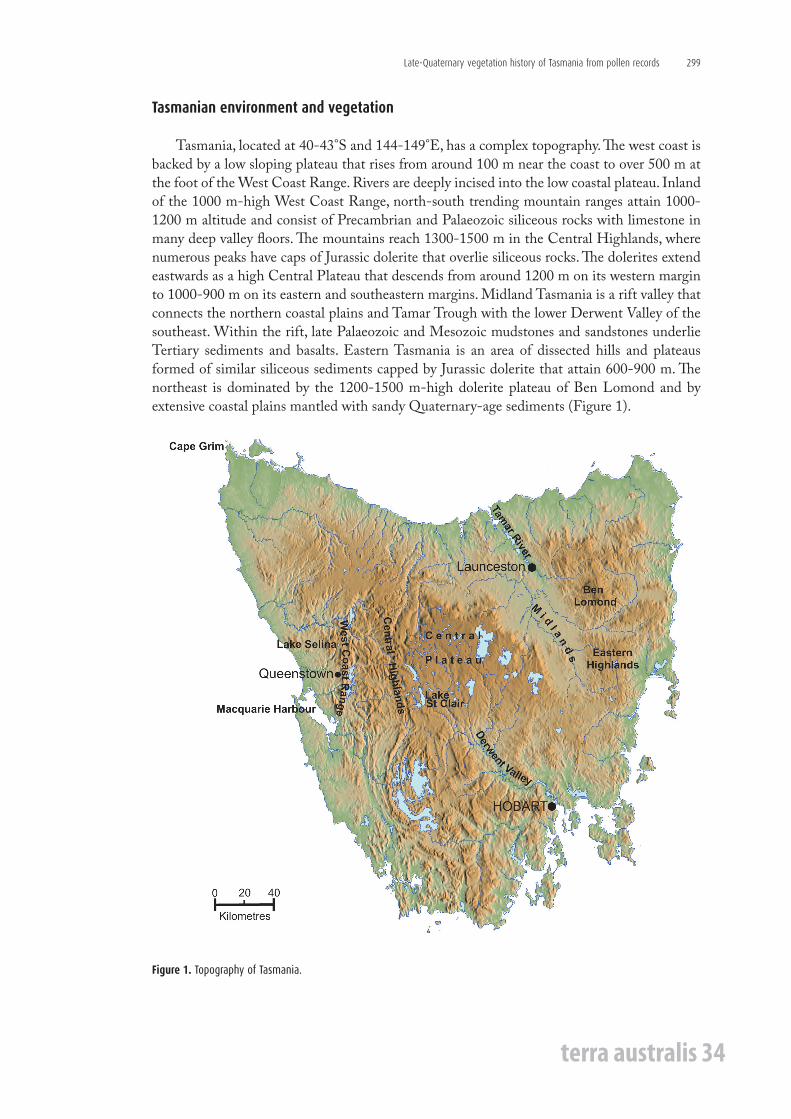
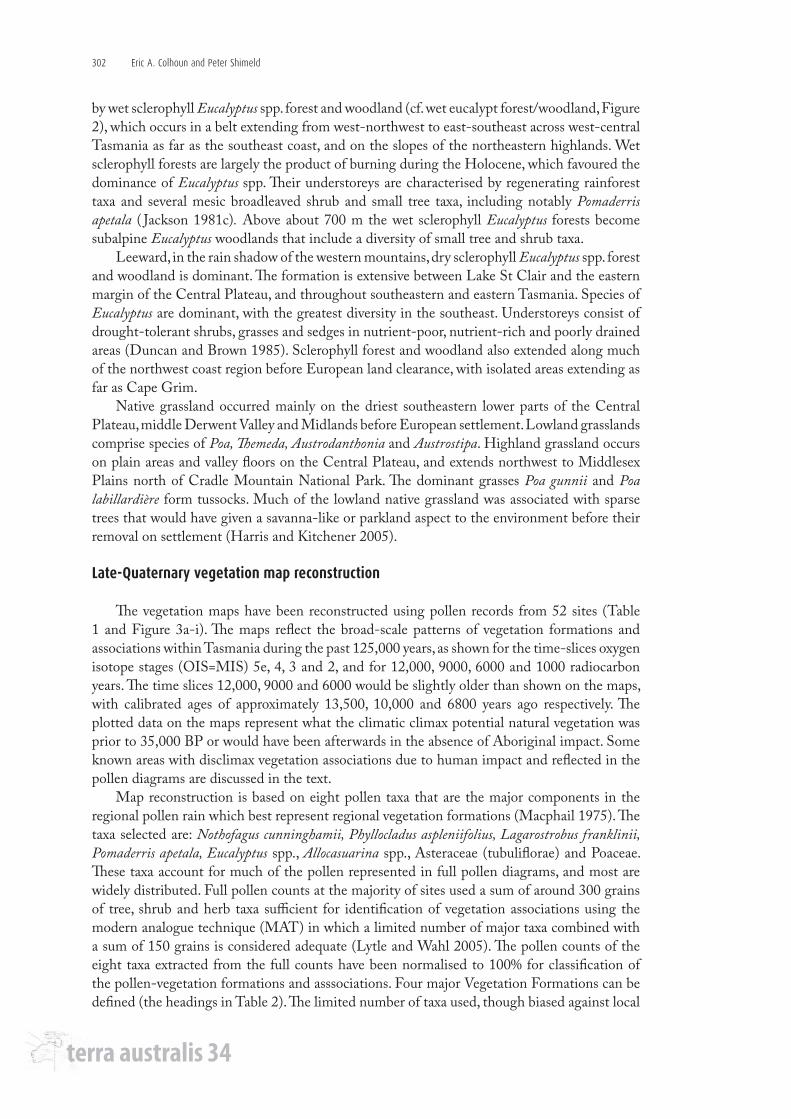
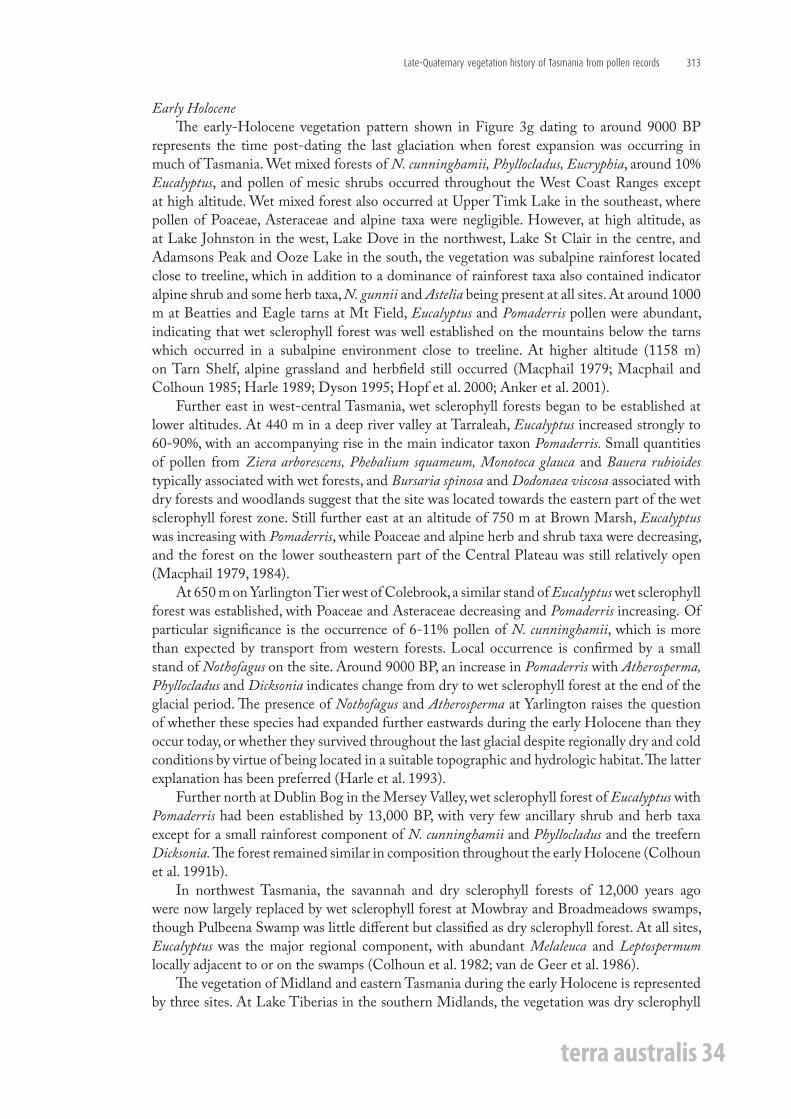
Tasmania, located at 40-43°S and 144-149°E, has a complex topography. The west coast is backed by a low sloping plateau that rises from around 100 m near the coast to over 500 m at the foot of the West Coast Range. Rivers are deeply incised into the low coastal plateau. Inland of the 1000 m-high West Coast Range, north-south trending mountain ranges attain 1000-1200 m altitude and consist of Precambrian and Palaeozoic siliceous rocks with limestone in many deep valley floors. The mountains reach 1300-1500 m in the Central Highlands, where numerous peaks have caps of Jurassic dolerite that overlie siliceous rocks. The dolerites extend eastwards as a high Central Plateau that descends from around 1200 m on its western margin to 1000-900 m on its eastern and southeastern margins. Midland Tasmania is a rift valley that connects the northern coastal plains and Tamar Trough with the lower Derwent Valley of the southeast. Within the rift, late Palaeozoic and Mesozoic mudstones and sandstones underlie Tertiary sediments and basalts. Eastern Tasmania is an area of dissected hills and plateaus formed of similar siliceous sediments capped by Jurassic dolerite that attain 600-900 m. The northeast is dominated by the 1200-1500 m-high dolerite plateau of Ben Lomond and by extensive coastal plains mantled with sandy Quaternary-age sediments (Figure 1).
Figure 1. Topography of Tasmania.
terra australis 34
Eric A. Colhoun and Peter Shimeld300
Situated between the Australian continental high-pressure system and the Southern Polar Front, Tasmania experiences much changeability between sub-tropical continental and cool temperate oceanic weather systems. Strong continental effects occur during summer, while oceanic effects can occur in all seasons. The maritime airflows provide 3600-1200 mm precipitation annually to the western mountains. Precipitation decreases eastwards and northeastwards across the Central Plateau, which receives 1800-900 mm. The Midland Valley lies in a rain shadow and receives only 700-550 mm, while the Eastern Uplands receive 800 to more than 1200 mm, with a significant proportion coming from the east.
In winter, frost and snow are frequent above 500 m, particularly in the centre and west. Snow only blankets the terrain for short periods. Coastal areas are mild and generally snow-free, with mean temperatures of 11°C at Queenstown in the west and 12.4°C at Hobart in the southeast. Central highland Tasmania is relatively cold, with a mean temperature of 8°C at Lake St Clair. Most of central and northeastern alpine Tasmania has July mean minimum temperatures below 0°C. Nocturnal temperatures as low as –20°C may occur on high peaks and severe glazing storms occur frequently in winter. In summer, adiabatically warmed airflows descend from the plateau, bringing warm dry winds and extreme temperatures of 35-40°C, particularly to the Midlands and southeast.
During glacial times when sea level was 60-120 m lower, Tasmania was connected to Victoria, and at maximum lowering the exposed land area was double its present size. The increase in continentality reduced precipitation in the central, eastern and northern areas leeward of the mountains, and mean temperatures throughout Tasmania were also reduced (Colhoun 1991).
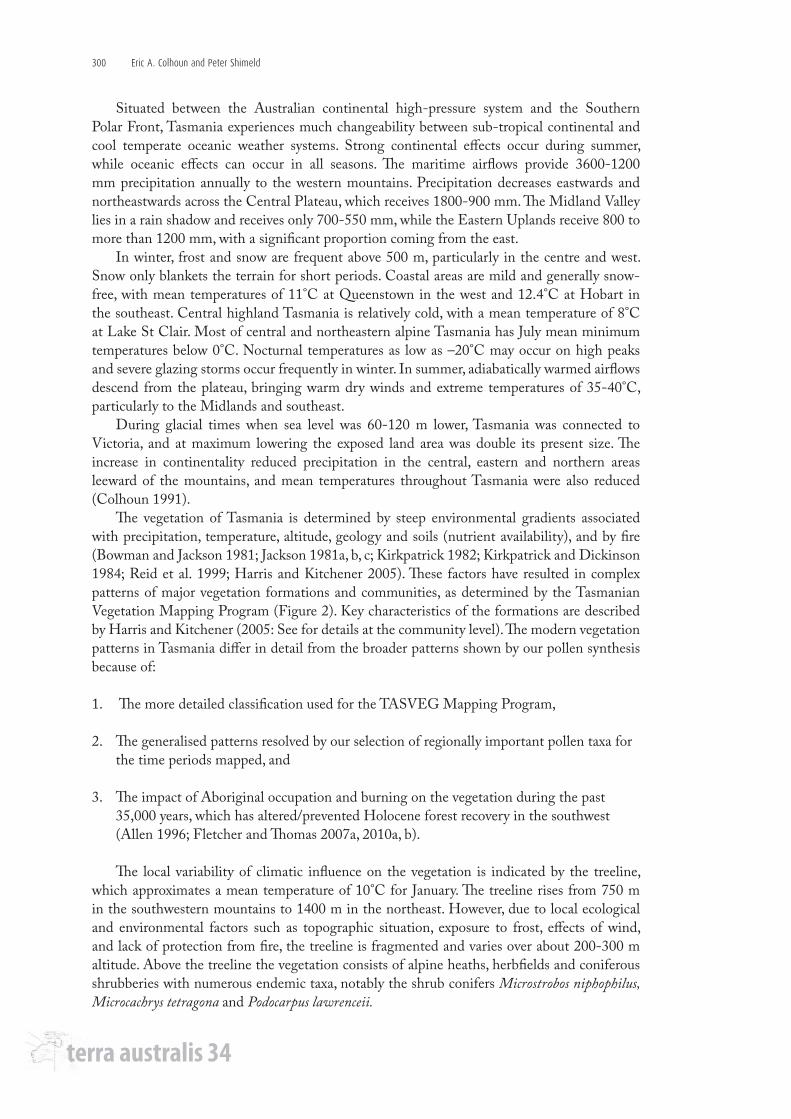
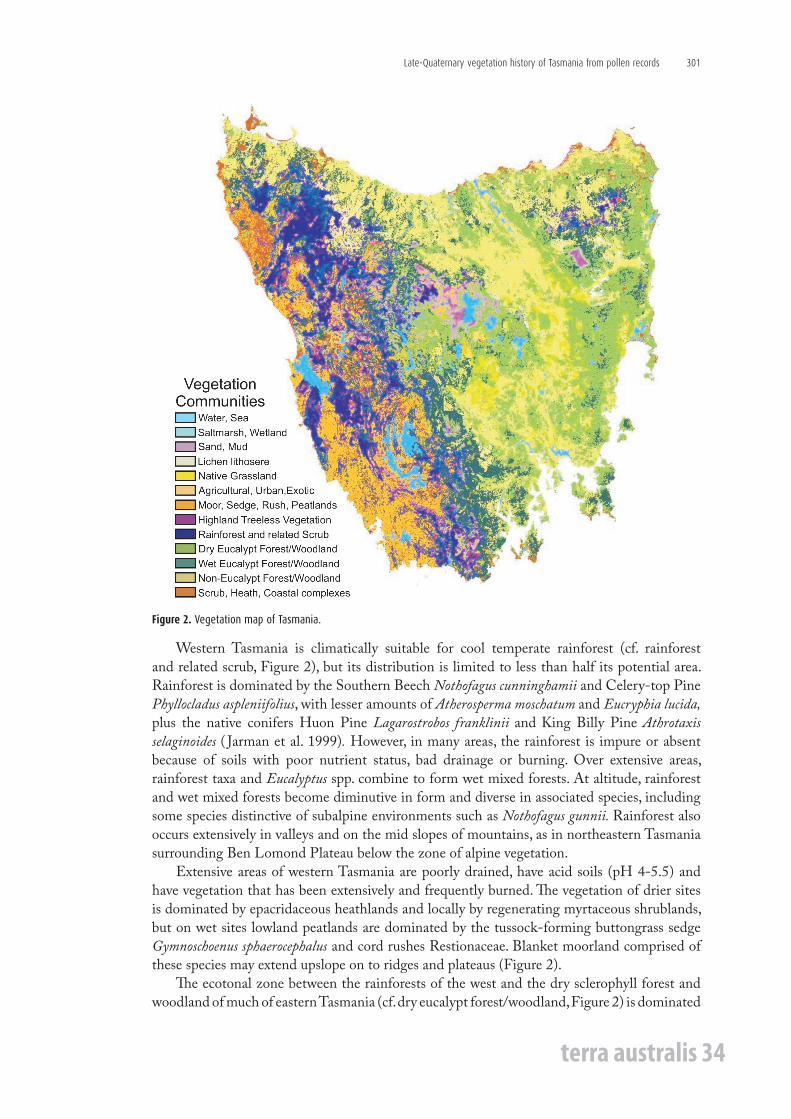
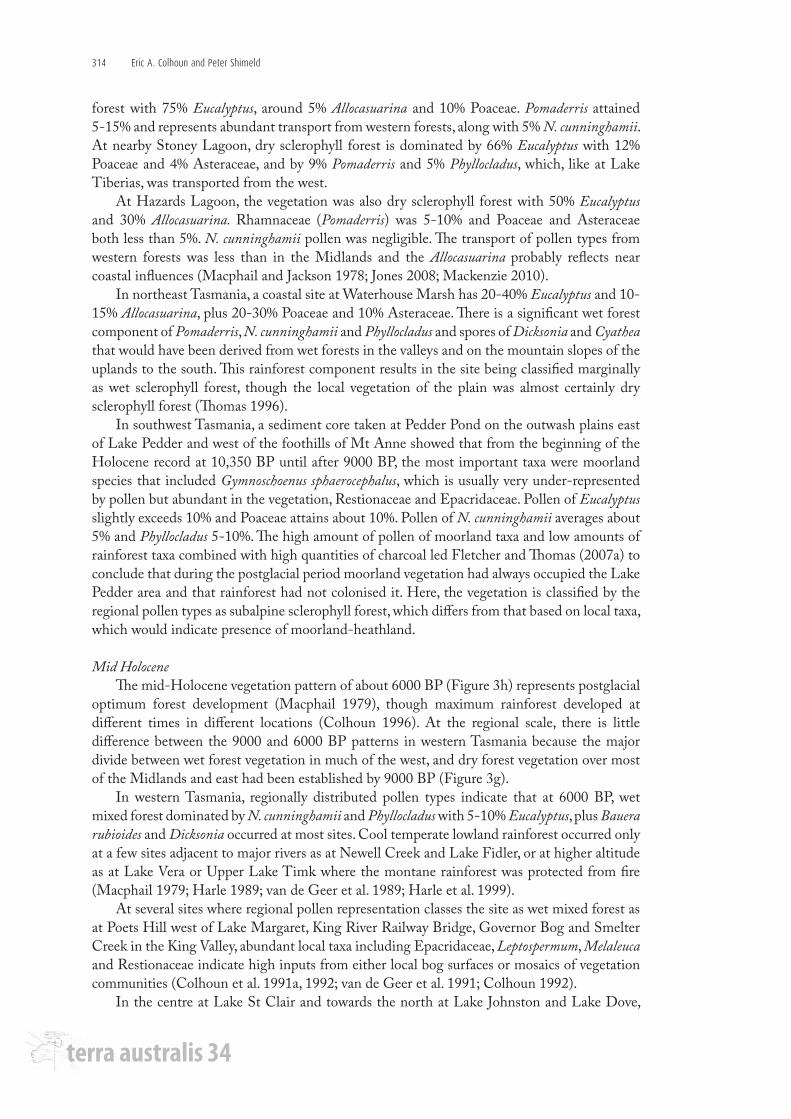
The vegetation of Tasmania is determined by steep environmental gradients associated with precipitation, temperature, altitude, geology and soils (nutrient availability), and by fire (Bowman and Jackson 1981; Jackson 1981a, b, c; Kirkpatrick 1982; Kirkpatrick and Dickinson 1984; Reid et al. 1999; Harris and Kitchener 2005). These factors have resulted in complex patterns of major vegetation formations and communities, as determined by the Tasmanian Vegetation Mapping Program (Figure 2). Key characteristics of the formations are described by Harris and Kitchener (2005: See for details at the community level). The modern vegetation patterns in Tasmania differ in detail from the broader patterns shown by our pollen synthesis because of:
1. The more detailed classification used for the TASVEG Mapping Program,
2. The generalised patterns resolved by our selection of regionally important pollen taxa for the time periods mapped, and
3. The impact of Aboriginal occupation and burning on the vegetation during the past 35,000 years, which has altered/prevented Holocene forest recovery in the southwest (Allen 1996; Fletcher and Thomas 2007a, 2010a, b).
The local variability of climatic influence on the vegetation is indicated by the treeline, which approximates a mean temperature of 10°C for January. The treeline rises from 750 m in the southwestern mountains to 1400 m in the northeast. However, due to local ecological and environmental factors such as topographic situation, exposure to frost, effects of wind, and lack of protection from fire, the treeline is fragmented and varies over about 200-300 m altitude. Above the treeline the vegetation consists of alpine heaths, herbfields and coniferous shrubberies with numerous endemic taxa, notably the shrub conifers Microstrobos niphophilus, Microcachrys tetragona and Podocarpus lawrenceii.
terra australis 34
Late-Quaternary vegetation history of Tasmania from pollen records 301
Western Tasmania is climatically suitable for cool temperate rainforest (cf. rainforest and related scrub, Figure 2), but its distribution is limited to less than half its potential area. Rainforest is dominated by the Southern Beech Nothofagus cunninghamii and Celery-top Pine Phyllocladus aspleniifolius, with lesser amounts of Atherosperma moschatum and Eucryphia lucida, plus the native conifers Huon Pine Lagarostrobos franklinii and King Billy Pine Athrotaxis selaginoides ( Jarman et al. 1999). However, in many areas, the rainforest is impure or absent because of soils with poor nutrient status, bad drainage or burning. Over extensive areas, rainforest taxa and Eucalyptus spp. combine to form wet mixed forests. At altitude, rainforest and wet mixed forests become diminutive in form and diverse in associated species, including some species distinctive of subalpine environments such as Nothofagus gunnii. Rainforest also occurs extensively in valleys and on the mid slopes of mountains, as in northeastern Tasmania surrounding Ben Lomond Plateau below the zone of alpine vegetation.
Extensive areas of western Tasmania are poorly drained, have acid soils (pH 4-5.5) and have vegetation that has been extensively and frequently burned. The vegetation of drier sites is dominated by epacridaceous heathlands and locally by regenerating myrtaceous shrublands, but on wet sites lowland peatlands are dominated by the tussock-forming buttongrass sedge Gymnoschoenus sphaerocephalus and cord rushes Restionaceae. Blanket moorland comprised of these species may extend upslope on to ridges and plateaus (Figure 2).
The ecotonal zone between the rainforests of the west and the dry sclerophyll forest and woodland of much of eastern Tasmania (cf. dry eucalypt forest/woodland, Figure 2) is dominated
Figure 2. Vegetation map of Tasmania.
terra australis 34
Eric A. Colhoun and Peter Shimeld302
by wet sclerophyll Eucalyptus spp. forest and woodland (cf. wet eucalypt forest/woodland, Figure 2), which occurs in a belt extending from west-northwest to east-southeast across west-central Tasmania as far as the southeast coast, and on the slopes of the northeastern highlands. Wet sclerophyll forests are largely the product of burning during the Holocene, which favoured the dominance of Eucalyptus spp. Their understoreys are characterised by regenerating rainforest taxa and several mesic broadleaved shrub and small tree taxa, including notably Pomaderris apetala ( Jackson 1981c). Above about 700 m the wet sclerophyll Eucalyptus forests become subalpine Eucalyptus woodlands that include a diversity of small tree and shrub taxa.
Leeward, in the rain shadow of the western mountains, dry sclerophyll Eucalyptus spp. forest and woodland is dominant. The formation is extensive between Lake St Clair and the eastern margin of the Central Plateau, and throughout southeastern and eastern Tasmania. Species of Eucalyptus are dominant, with the greatest diversity in the southeast. Understoreys consist of drought-tolerant shrubs, grasses and sedges in nutrient-poor, nutrient-rich and poorly drained areas (Duncan and Brown 1985). Sclerophyll forest and woodland also extended along much of the northwest coast region before European land clearance, with isolated areas extending as far as Cape Grim.
Native grassland occurred mainly on the driest southeastern lower parts of the Central Plateau, middle Derwent Valley and Midlands before European settlement. Lowland grasslands comprise species of Poa, Themeda, Austrodanthonia and Austrostipa. Highland grassland occurs on plain areas and valley floors on the Central Plateau, and extends northwest to Middlesex Plains north of Cradle Mountain National Park. The dominant grasses Poa gunnii and Poa labillardière form tussocks. Much of the lowland native grassland was associated with sparse trees that would have given a savanna-like or parkland aspect to the environment before their removal on settlement (Harris and Kitchener 2005).
Late-Quaternary vegetation map reconstruction
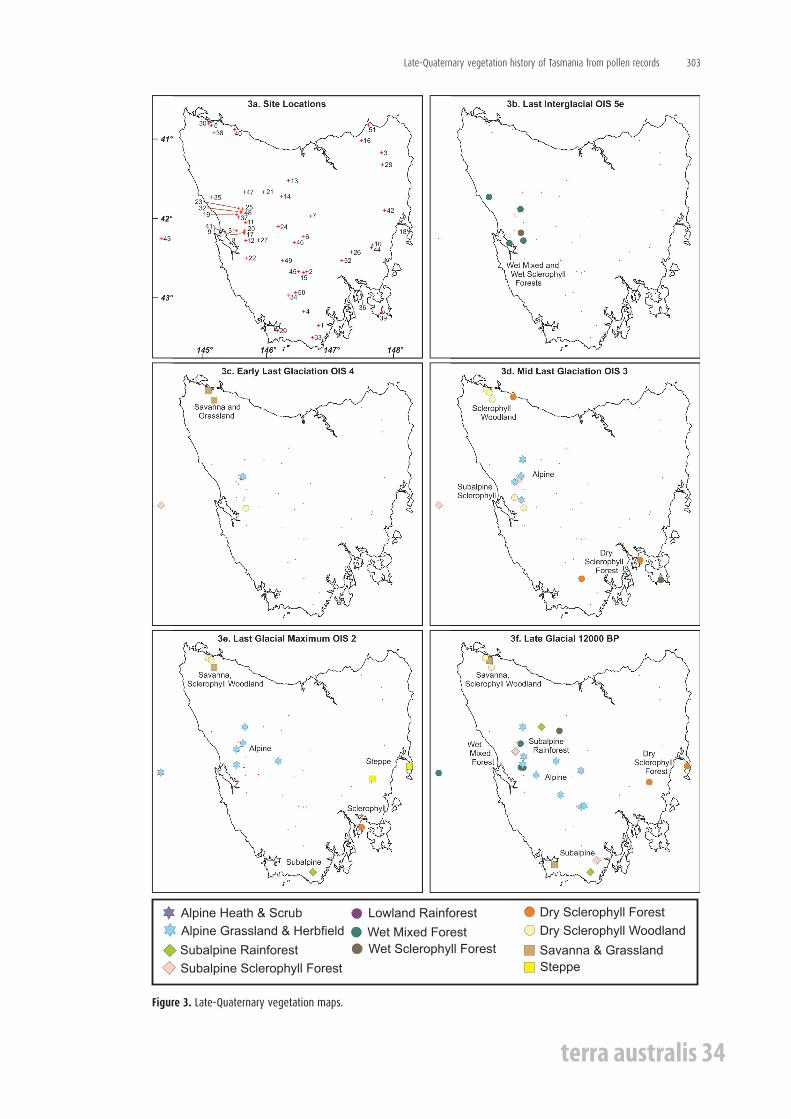
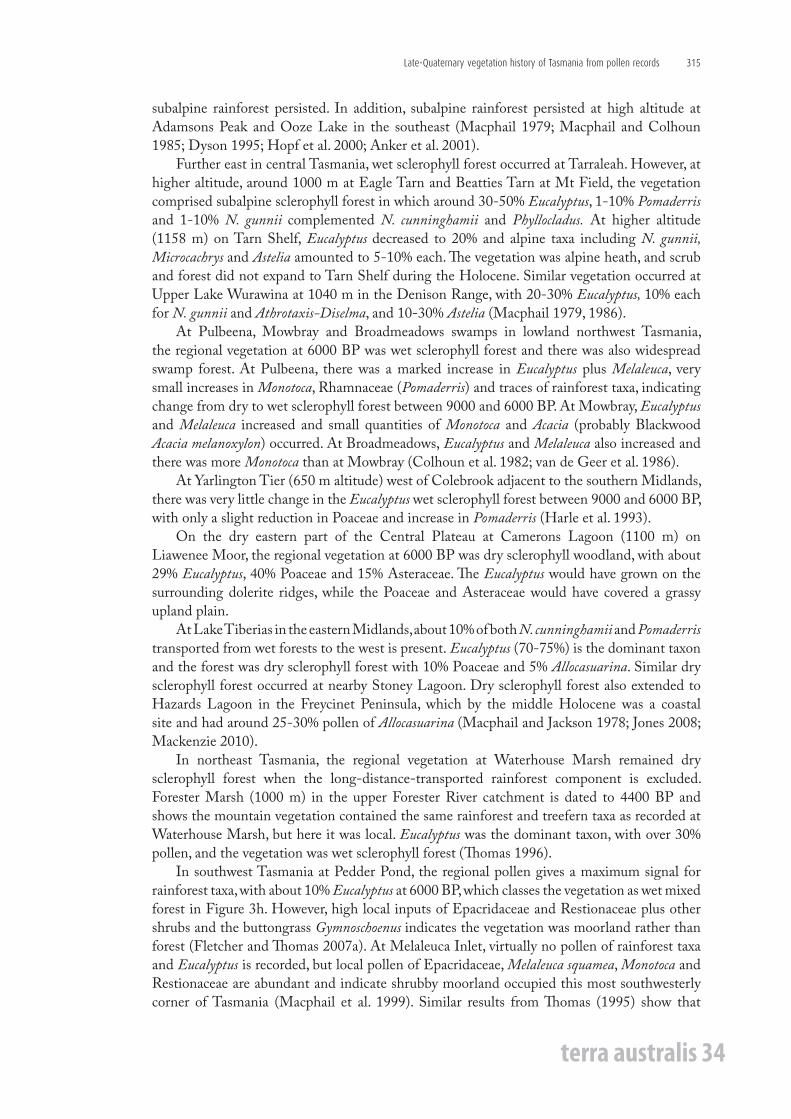
The vegetation maps have been reconstructed using pollen records from 52 sites (Table 1 and Figure 3a-i). The maps reflect the broad-scale patterns of vegetation formations and associations within Tasmania during the past 125,000 years, as shown for the time-slices oxygen isotope stages (OIS=MIS) 5e, 4, 3 and 2, and for 12,000, 9000, 6000 and 1000 radiocarbon years. The time slices 12,000, 9000 and 6000 would be slightly older than shown on the maps, with calibrated ages of approximately 13,500, 10,000 and 6800 years ago respectively. The plotted data on the maps represent what the climatic climax potential natural vegetation was prior to 35,000 BP or would have been afterwards in the absence of Aboriginal impact. Some known areas with disclimax vegetation associations due to human impact and reflected in the pollen diagrams are discussed in the text.
Map reconstruction is based on eight pollen taxa that are the major components in the regional pollen rain which best represent regional vegetation formations (Macphail 1975). The taxa selected are: Nothofagus cunninghamii, Phyllocladus aspleniifolius, Lagarostrobus franklinii, Pomaderris apetala, Eucalyptus spp., Allocasuarina spp., Asteraceae (tubuliflorae) and Poaceae. These taxa account for much of the pollen represented in full pollen diagrams, and most are widely distributed. Full pollen counts at the majority of sites used a sum of around 300 grains of tree, shrub and herb taxa sufficient for identification of vegetation associations using the modern analogue technique (MAT) in which a limited number of major taxa combined with a sum of 150 grains is considered adequate (Lytle and Wahl 2005). The pollen counts of the eight taxa extracted from the full counts have been normalised to 100% for classification of the pollen-vegetation formations and asssociations. Four major Vegetation Formations can be defined (the headings in Table 2). The limited number of taxa used, though biased against local
terra australis 34
Late-Quaternary vegetation history of Tasmania from pollen records 303
Wet Sclerophyll Forest
Lowland Rainforest
Savanna & Grassland
Steppe
Wet Mixed Forest
Subalpine Rainforest
Dry Sclerophyll ForestAlpine Heath & Scrub
Dry Sclerophyll WoodlandAlpine Grassland & Herbfield
Subalpine Sclerophyll Forest
Figure 3. Late-Quaternary vegetation maps.
terra australis 34
Eric A. Colhoun and Peter Shimeld304
Wet Sclerophyll Forest
Lowland Rainforest
Savanna & Grassland
Steppe
Wet Mixed Forest
Subalpine Rainforest
Dry Sclerophyll ForestAlpine Heath & Scrub
Dry Sclerophyll WoodlandAlpine Grassland & Herbfield
Subalpine Sclerophyll Forest
Figure 3. Continued
taxa of limited distribution, is suitable for highlighting the major composition of much of the regional vegetation.
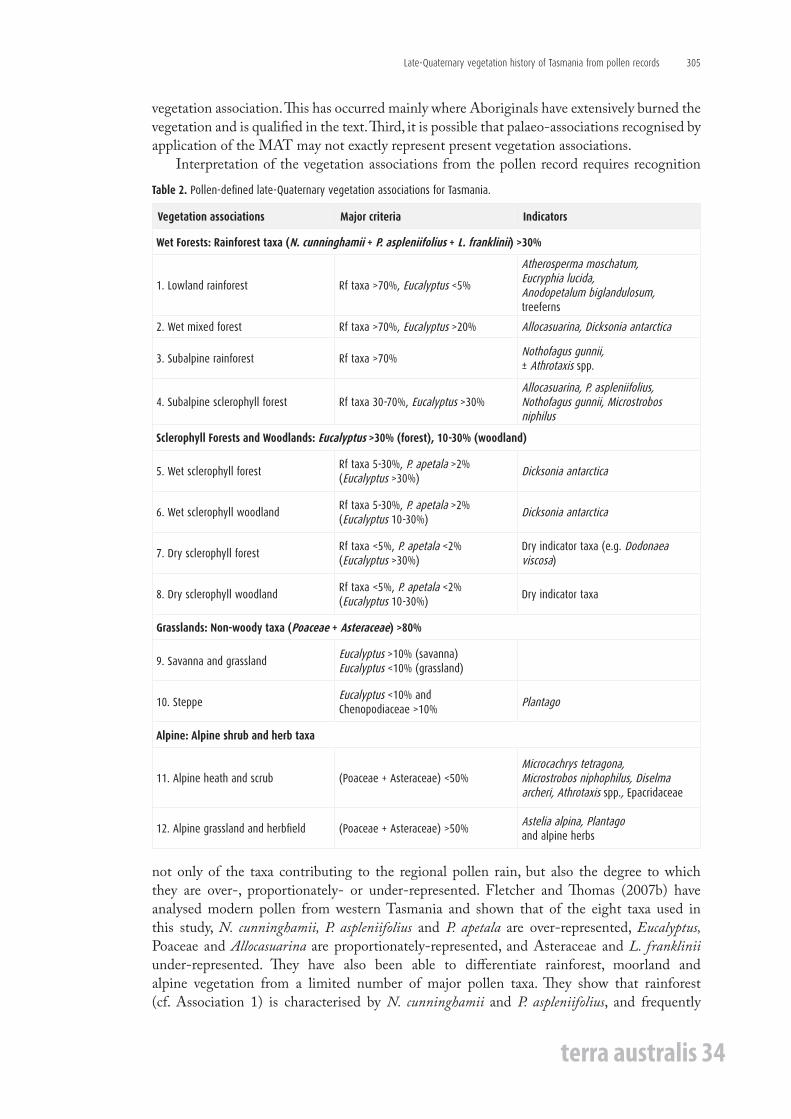
The formations are subdivided into 12 associations using a combination of the normalised percentage representation of the regionally important taxa, indicator species for the associations, reference to full spectra of dated and relevant age-interpolated horizons on pollen diagrams, and ecological knowledge. The mapped pollen-defined vegetation associations are thus a broad-scale interpretive model of late-Quaternary vegetation that can be compared with modern vegetation (Table 2). However, a few caveats are necessary. First, pollen transport is generally from west to east across Tasmania, and wet forest taxa, especially N. cunninghamii and P. apetala, appear consistently in small quantities in records from Midland and northeastern Tasmania and may cause the association to be classified as wet sclerophyll forest or woodland when other evidence clearly indicates a dry sclerophyll association. In such cases, the long-distance transport component has been deleted before classification. Second, at locations where the major pollen input is from locally dispersed taxa, the classification will be biased against revealing the local
terra australis 34
Late-Quaternary vegetation history of Tasmania from pollen records 305
vegetation association. This has occurred mainly where Aboriginals have extensively burned the vegetation and is qualified in the text. Third, it is possible that palaeo-associations recognised by application of the MAT may not exactly represent present vegetation associations.
Interpretation of the vegetation associations from the pollen record requires recognition
Table 2. Pollen-defined late-Quaternary vegetation associations for Tasmania.
not only of the taxa contributing to the regional pollen rain, but also the degree to which they are over-, proportionately- or under-represented. Fletcher and Thomas (2007b) have analysed modern pollen from western Tasmania and shown that of the eight taxa used in this study, N. cunninghamii, P. aspleniifolius and P. apetala are over-represented, Eucalyptus, Poaceae and Allocasuarina are proportionately-represented, and Asteraceae and L. franklinii under-represented. They have also been able to differentiate rainforest, moorland and alpine vegetation from a limited number of major pollen taxa. They show that rainforest (cf. Association 1) is characterised by N. cunninghamii and P. aspleniifolius, and frequently
Vegetation associations Major criteria Indicators
Wet Forests: Rainforest taxa (N. cunninghamii + P. aspleniifolius + L. franklinii) >30%
1. Lowland rainforest Rf taxa >70%, Eucalyptus <5%
Atherosperma moschatum, Eucryphia lucida, Anodopetalum biglandulosum, treeferns
2. Wet mixed forest Rf taxa >70%, Eucalyptus >20% Allocasuarina, Dicksonia antarctica
3. Subalpine rainforest Rf taxa >70%Nothofagus gunnii, ± Athrotaxis spp.
4. Subalpine sclerophyll forest Rf taxa 30-70%, Eucalyptus >30%Allocasuarina, P. aspleniifolius, Nothofagus gunnii, Microstrobos niphilus
Sclerophyll Forests and Woodlands: Eucalyptus >30% (forest), 10-30% (woodland)
5. Wet sclerophyll forestRf taxa 5-30%, P. apetala >2% (Eucalyptus >30%)
Dicksonia antarctica
6. Wet sclerophyll woodlandRf taxa 5-30%, P. apetala >2%(Eucalyptus 10-30%)
Dicksonia antarctica
7. Dry sclerophyll forestRf taxa <5%, P. apetala <2%(Eucalyptus >30%)
Dry indicator taxa (e.g. Dodonaea viscosa)
8. Dry sclerophyll woodlandRf taxa <5%, P. apetala <2%(Eucalyptus 10-30%)
Dry indicator taxa
Grasslands: Non-woody taxa (Poaceae + Asteraceae) >80%
9. Savanna and grasslandEucalyptus >10% (savanna)Eucalyptus <10% (grassland)
10. SteppeEucalyptus <10% and Chenopodiaceae >10%
Plantago
Alpine: Alpine shrub and herb taxa
11. Alpine heath and scrub (Poaceae + Asteraceae) <50%Microcachrys tetragona,Microstrobos niphophilus, Diselma archeri, Athrotaxis spp., Epacridaceae
12. Alpine grassland and herbfield (Poaceae + Asteraceae) >50%Astelia alpina, Plantago and alpine herbs
terra australis 34
Eric A. Colhoun and Peter Shimeld306
contains L. franklinii and Eucryphia spp. They also show that most species in the alpine zone (cf. Associations 1 and 2), except for Poaceae, are under-represented. These include the herb Astelia alpina and the coniferous shrubs Microcachrys tetragona, Microstrobos niphophilus, the deciduous beech Nothofagus. gunnii and Epacridaceae. Thirdly, they have identified moorland, which is and was widespread in southwest Tasmania at least during the Holocene (vide infra), but is not represented in our broad-scale classification of associations. The moorland is shown to be identifiable from a combination of the under-represented taxa Ericaceae, buttongrass Gymnoschoenus sphaeocephalus, Melaleuca and Leptospermum, but it also includes some pollen of well-represented Poaceae, Eucalyptus and over-represented N. cunninghamii and Phyllocladus.
Some of Tasmania’s pollen sites occur in alpine sites above the modern treeline in southwestern Tasmania. The records contain significant quantities of N. cunninghamii and P. aspleniifolius, which have wide dispersal ability (Fletcher and Thomas 2007b). Other species are much less widely dispersed. A study of modern Eucalyptus pollen transport from a sharp woodland-edge eastwards across Liawenee Moor on the Central Plateau shows that Eucalyptus accounted for 50-70% of total pollen beneath the woodland canopy and concentrations of only 5% outside the woodland on the treeless Moor (Shimeld and Colhoun 2001).
Before interpreting the mapped data, it is necessary to comment on the major taxa represented in the modern vegetation and how the pollen is likely to be represented in the analogue associations outlined in Table 2. Of particular importance is the dispersal of the pollen quantitatively assessed by Fletcher and Thomas (2007b), but also qualitatively apparent from the representation of pollen in many pollen diagrams obtained from diverse geographic locations. The time slices represented on the maps are also of limited precision and the time periods they represent need qualification.
Southern Beech N. cunninghamii is the dominant species of lowland rainforest. Celery-top Pine P. aspleniifolius is also widespread, while Huon Pine L. franklinii occurs locally in river valleys and as subalpine mountain stands. Each taxon is an abundant pollen producer. In mountainous western Tasmania, N.cunninghamii and Phyllocladus can be transported in quantity upslope into adjacent alpine areas (Macphail 1975, 1979). In addition, given the prevalent westerly winds, the pollen can be transported in small quantities (2-3%) eastwards across the entire island. Lagarostrobos is much less widely dispersed, though occasional grains do travel far. Spores of the main treefern Dicksonia antarctica can be widely distributed, especially by water, and may occur in abundance at riparian sites.
In contrast, Leatherwood Eucryphia lucida, Sassafras Atherosperma moschatum and Horizontal Scrub Anodopetalum biglandulosum are generally sub-canopy trees of wet forests that are insect pollinated. Atherosperma and Anodopetalum do not flower abundantly and the pollen is deposited within the forest. Eucryphia may occur extensively in riparian situations, where it flowers abundantly, but the pollen is also deposited locally. Hence, these indicators demonstrate presence of wet forest, and with a predominance of N. cunninghamii and Phyllocladus and <5% Eucalyptus, indicate lowland rainforest. Pure rainforest without Eucalyptus is of limited occurrence in Tasmania. The Forestry Commission recognises that rainforest can contain a Eucalyptus component of up to 5% (Hickey pers. comm. 2003). Allowing for other trace pollen of regional origin, we define the lowland rainforest as having >70% Nothofagus + Phyllocladus + Lagarostrobos pollen. With more pollen of Eucalyptus and less of rainforest taxa, the forest is defined as wet mixed forest. Pomaderris apetala forms an understorey tree in wet forests and is especially evident where the forest has been periodically burnt. The pollen can be widely dispersed in small amounts (ca. 1%) but where it occurs in larger amounts, usually considerably exceeding 2%, it indicates wet sclerophyll Eucalyptus forest. At altitudes above 500-700 m, subalpine rainforest may contain significant quantities of Native Pines, Athrotaxis spp. and the dwarf Deciduous Beech, N. gunnii. Both species can produce relatively abundant pollen, with
terra australis 34
Late-Quaternary vegetation history of Tasmania from pollen records 307
that of the pines being more widely dispersed than the beech, which is deposited locally. Eucalyptus is insect pollinated and there appears to be a close relationship between tree
cover and quantity of pollen produced. A division has been made between the subalpine, wet and dry sclerophyll forests and woodlands where normalised Eucalyptus pollen values between 10% and 30% infer regional woodlands and greater than 30% infer regional forests. This approximates Specht’s (1970) woodland and forest structural forms. Unlike Eucalyptus, the pollen of Allocasuarina spp. is wind dispersed. It can vary considerably in abundance, be transported widely and occur in small quantities at sites far beyond its source area. It can also occur abundantly in association with coastal communities.
The vegetation of non-wooded environments is dominated by pollen of Poaceae and Asteraceae. Pollen from isolated Eucalyptus trees, which can be locally abundant, plus up to 5% of other long-distance transported pollen, make separation of the dry savanna-like vegetation and grassland difficult, which at the broad scale would probably form a mosaic. Here we use >10% Eucalyptus pollen as indicating savanna-like vegetation.
Chenopodiaceae are recorded by a few pollen grains in many spectra at Tasmanian sites. Macphail (1979) suggested the Chenopodiaceae pollen may have been transported from southern mainland Australia, but high values associated with native Plantago spp. suggest they are likely to indicate local steppe vegetation, especially during drier conditions in the last glaciation.
The vegetation of alpine areas consists either of alpine heath and scrub or alpine grassland and herbfield often in a complex mosaic pattern. In addition to Poaceae and Asteraceae, the heath may contain one or more species of coniferous shrub taxa and numerous species of Epacridaceae. In areas of alpine grassland and herbland, pollen of grass genera (not differentiated) is abundant and is probably over-represented in the pollen assemblage relative to its source plants occurrence in the field. Pollen of Asteraceae is also abundant, and although in Tasmania there is an abundance of alpine Asteraceae shrub spp., it is not possible to separate the pollen of herbs and shrubs. The Pineapple Grass Astelia alpina is a consistent indicator of wet alpine vegetation, while pollen of native Plantago spp. is consistently represented in alpine herbaceous vegetation.
The time slices on the maps represent broad but not overlapping periods that have been selected to detect major temporal changes in the vegetation. The radiocarbon dating of pollen-sediment sequences in Tasmania has been undertaken over several decades. Assays have been made by various laboratories and until recently reported only in radiocarbon years. Many of the sequences have been taken from alpine and subalpine lakes where sediments particularly of pre-Holocene age are low in organic carbon. In order to obtain dates, some of the core samples from which carbon has been extracted are 5-10 cm long. Other dates mainly of Holocene age have been obtained from individual wood and charcoal fragments, and from small samples of organic lake mud and peat. Much of the dating is not precise and standard error values can be large. In addition, residual traces of humic acid have affected some of the older pre-Holocene samples, making their ages appear younger than they really are. Due to constraints on the precision of the dates, original determinations have been used rather than calibrated ages, except where the latter are specified. It is estimated that errors may be up to around ± 1000 years for Holocene dates, but may be greater for older dates that are here allocated broadly to isotope stages as reflected by the pollen curves.
Unfortunately, limited financial resources have resulted in most Tasmanian pollen diagrams not being closely dated, and the chronologies of many depend on only a few dates. Thus, in this reconstruction, the ages of many pollen spectra are linearly interpolated between dated samples assuming uniform sedimentation rates, which is rarely the case. In addition, two to three pollen spectra may be combined to represent the interpreted vegetation assemblage of designated
terra australis 34
Eric A. Colhoun and Peter Shimeld308
time slices. The time slices 1000, 6000, 9000 and 12,000 BP were selected to represent pre-European, mid-Holocene, early-Holocene and late-glacial-Holocene transition vegetation, which they reasonably do. Radiocarbon calibration indicates the 6000 and 9000 BP time slices are approximately 1000 years older (6800 and 10,000 cal BP) and the 12,000 BP slice 1500 older (13,500 cal BP), but given the overall limitations of the dating, the difference is of little significance.
The vegetation associations represented in Figure 3e for OIS 2 are derived from pollen spectra dated to or interpolated to have occurred around the LGM between ca. 18,000 and 25,000 BP. Those on Figure 3d for OIS 3 are derived from average pollen values from spectra over the period interpolated as 30,000-55,000 BP, neglecting the fact that OIS 3 has had short warmer and colder phases of climate. Several marked fluctuations of vegetation that may reflect these climate changes have been averaged out for the map. The vegetation maps Figures 3c and 3b for OIS 4 and OIS 5e have no absolute dating but are derived from pollen spectra obtained from sediment sequences attributed stratigraphically to these isotope stages.
The late-Quaternary vegetation maps
Only a limited number of pollen-vegetation records exist before the Holocene (Figures 3b-3f ), whereas many records have been obtained for the Holocene (Figures 3g-3i).
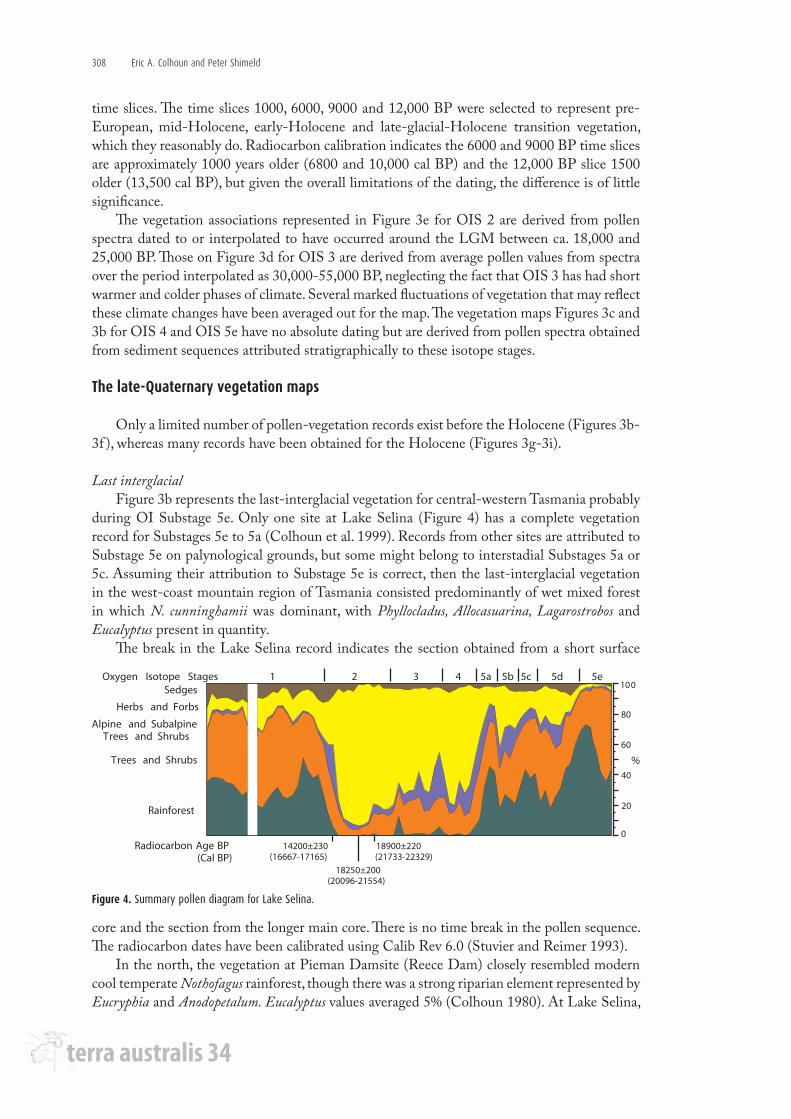
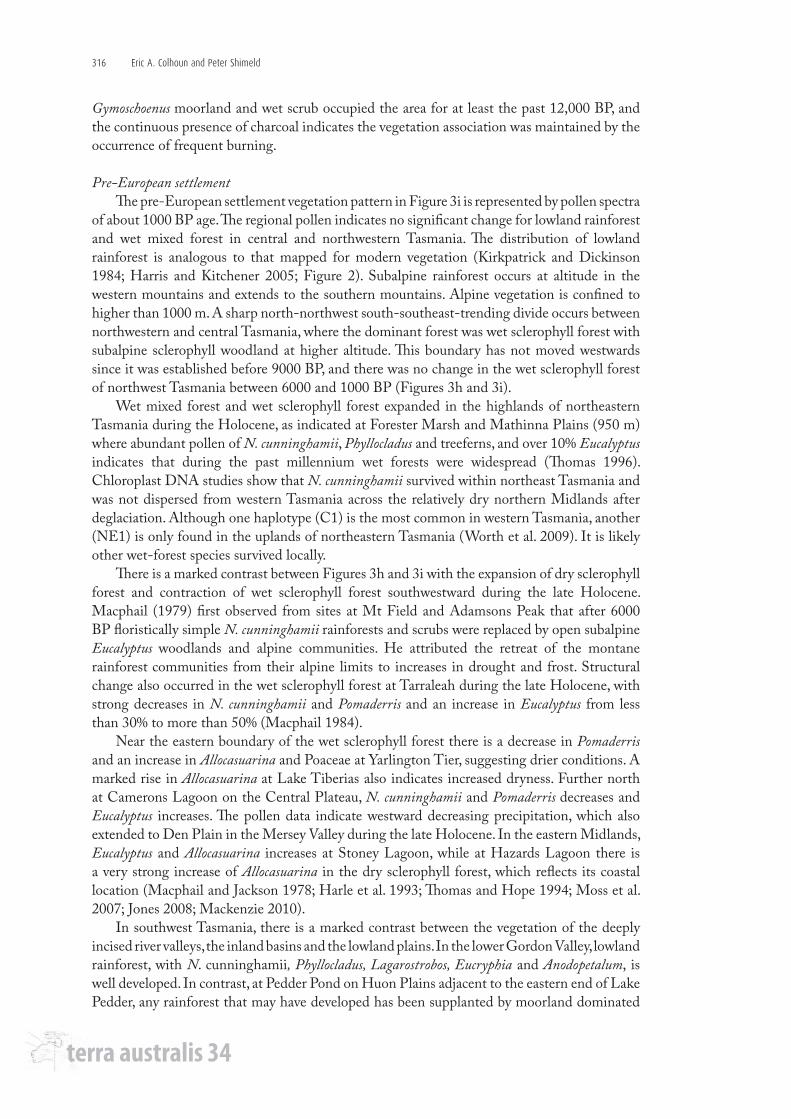
Last interglacial Figure 3b represents the last-interglacial vegetation for central-western Tasmania probably
during OI Substage 5e. Only one site at Lake Selina (Figure 4) has a complete vegetation record for Substages 5e to 5a (Colhoun et al. 1999). Records from other sites are attributed to Substage 5e on palynological grounds, but some might belong to interstadial Substages 5a or 5c. Assuming their attribution to Substage 5e is correct, then the last-interglacial vegetation in the west-coast mountain region of Tasmania consisted predominantly of wet mixed forest in which N. cunninghamii was dominant, with Phyllocladus, Allocasuarina, Lagarostrobos and Eucalyptus present in quantity.
The break in the Lake Selina record indicates the section obtained from a short surface
Sedges
Herbs and Forbs
Alpine and SubalpineTrees and Shrubs
Trees and Shrubs
Rainforest
0
20
40
60
80
100Oxygen Isotope Stages 1 2 3 4 5a 5b 5c 5d 5e
14200±230 18900±220(16667-17165) (21733-22329)
18250±200(20096-21554)
%
Radiocarbon Age BP(Cal BP)
Figure 4. Summary pollen diagram for Lake Selina.
core and the section from the longer main core. There is no time break in the pollen sequence. The radiocarbon dates have been calibrated using Calib Rev 6.0 (Stuvier and Reimer 1993).
In the north, the vegetation at Pieman Damsite (Reece Dam) closely resembled modern cool temperate Nothofagus rainforest, though there was a strong riparian element represented by Eucryphia and Anodopetalum. Eucalyptus values averaged 5% (Colhoun 1980). At Lake Selina,
terra australis 34
Late-Quaternary vegetation history of Tasmania from pollen records 309
rainforest taxa peaked during OI Substages 5e, c and a, but were reduced by around two-thirds during OI Substages 5b and d (Figure 4). Eucalyptus was scarcely represented, though Allocasuarina varied from 10% to 15%, which may reflect local presence around the lake. Lake Selina is the only site in Tasmania with pollen records for OI Substages 5d and 5b. Both are characterised by greater amounts of Epacridaceae, Poaceae, Asteraceae and Microstrobos than 5e, 5c and 5a, which points to the occurrence of heath and herbaceous vegetation, and colder conditions.
Further south in the King Valley, the wet sclerophyll forest of the interglacial deposits at Smelter Creek had 58% Allocasuarina, which probably reflects a riparian rather than regional aspect of the vegetation (Colhoun et al. 1992). In the adjacent Andrew Valley, the last-interglacial vegetation at Darwin Crater had abundant N. cunninghamii and Phyllocladus, with Lagarostrobos, which is still abundant adjacent to the crater (Colhoun and van de Geer 1998).
North of Tasmania, a site at Yarra Creek on southeast King Island contains lagoonal peat and organic sand beds within 1.6 m of the modern cobble beach. The sandy peat 30-50 cm above the beach was dated by thermoluminescence to younger than 120,000 ± 7000 BP, and the organic deposit which extended to 1.7 m above the beach has been suggested to be of Substage 5e age. The vegetation was dominated by cool temperate rainforest and wet sclerophyll forest taxa, with 57-67% Phyllocladus and 12-19% Eucalyptus. N. cunninghamii, Cyathea and Dicksonia are well represented. The data are consistent with wet forest vegetation extending northwards to King Island during the last interglacial (Porch et al. 2009), but the deposit occurs well below the level attained by the last interglacial marine transgression on King Island of 20-21 m ( Jennings 1959), and must have been formed after sea level began to retreat. It thus must be of late 5e age or belong to Substage 5c or 5a.
Of particular biological, temporal and probable stratigraphic significance is that at Pieman Damsite and Darwin Crater, the spores of Cyathea australis were more abundant during the last interglacial than those of Dicksonia Antarctica. Throughout the Holocene, D. Antarctica is the more dominant in wet forests.
Early last glaciationFigure 3c represents the early last glaciation vegetation of OIS 4, which is recorded at five
sites. At Lake Selina, abundant pollen of Poaceae, Asteraceae, Apiaceae, Chenopodiaceae and Microstrobos indicates alpine grassland and herbfield with alpine shrubs occurred around 516 m altitude on the northwestern mountains (Colhoun et al. 1999). Further south, at an altitude of 180-200 m at Darwin Crater, the vegetation is marginally classified as dry sclerophyll (subalpine) woodland. However, the abundance of pollen of Epacridaceae, Gramineae, Asteraceae, Astelia, Plantago, Ranunculaceae, Scrophulariaceae and Apiaceae in the full spectra showed that the sparse subalpine woodland of Eucalyptus and Allocasuarina species probably occurred locally within or adjacent to alpine grassland and herbfield vegetation, the latter of which was extensive in mountainous western Tasmania (Colhoun and van de Geer 1998).
The pollen in marine core SO36-7SL west of Macquarie Harbour indicates the extensive occurrence of subalpine sclerophyll forest in central-western Tasmania during OIS 4. This site would have received pollen from many vegetation communities in the catchment of the Gordon River and on the mountains of the southern West Coast Range. Apart from 6-7% pollen of Eucalyptus and of Allocasuarina, most pollen is Asteraceae, Poaceae and Chenopodiaceae, indicating widespread herbaceous vegetation, but there are also alpine shrub and herb species (van de Geer et al. 1994).
Pollen diagrams from Pulbeena and Mowbray swamps in northwest Tasmania are dominated by Poaceae with Asteraceae and Cyperaceae, and contain only 5% Eucalyptus pollen. The regional vegetation had the structure of a savanna or grassland, with sparse trees, while the
terra australis 34
Eric A. Colhoun and Peter Shimeld310
swamps were covered with sedges (Colhoun et al. 1982; van de Geer et al. 1986).
Mid last glaciationThe mid last glaciation of OIS 3 extended from approximately 59,000 to 24,000 BP
(Martinson et al. 1987). During this period, there was some variation in the vegetation at several sites. The vegetation associations represented in Figure 3d are based on average values for spectra in the age range 30,000-55,000 BP.
The most complete sequence for western Tasmania is from Lake Selina, where alpine grassland and herbfield occurred during most of OIS 3. The vegetation consisted predominantly of Asteraceae, Poaceae and Apiaceae, with 10% Microstrobos. The vegetation for most of the period was closer in composition to the glacial-age vegetation of OIS 4 and OIS 2 than to interglacial wet forests. Of particular interest are three fluctuations, with the largest peak at the beginning of OIS 3 when significant amounts of Microstrobos and N. gunnii indicate an alpine heath component, and seem to indicate that vegetation and climatic conditions varied between alpine and subalpine.
Subalpine sclerophyll woodland was probably widely distributed. At Newton Creek in the West Coast Range at 550 m altitude, a sequence is dated basally to 34,000 BP. The pollen record for the lower part comprised high quantities of Athrotaxis-Diselma (similar pollen forms) and some Astelia, indicating subalpine-alpine vegetation, but the upper part was dominated by the sclerophyll taxa Allocasuarina and Eucalyptus, and the rainforest taxon Phyllocladus (Colhoun et al. 1993). Offshore in Marine Core SO36-7SL, Allocasuarina with Eucalyptus and Phyllocladus are the most important taxa, but Athrotaxis, Microstrobos and Astelia confirm extensive subalpine-alpine vegetation in west-central Tasmania (van de Geer et al. 1986).
Further south in western Tasmania, the vegetation at Newall Creek and at Darwin Crater is classified as dry sclerophyll woodland, although the climate was probably wet. In both cases, the vegetation was likely to have been subalpine in composition. At Newall Creek, in addition to dominant Poaceae and Asteraceae, Eucalyptus averaged 30% and pollen of rainforest species was negligible. Several alpine indicator taxa were present, the most important being Astelia and the bolster plant Donatia novae-zelandiae. At Darwin Crater, the record is difficult to interpret due to a bed of gravel causing a break in pollen sedimentation. The record indicates a co-dominance of Poaceae and Asteraceae, with around 10% Eucalyptus, little pollen of rainforest taxa, and significant quantities of Astelia, Plantago and Apiaceae, probably indicating alpine conditions (van de Geer et al. 1994; Colhoun and van de Geer 1998).
During OIS 3, the vegetation of the northwestern plains was dry sclerophyll woodland and forest. Eucalyptus with abundant Leptospermum (probably on the surface or adjacent to the swamps) and lesser amounts of Melaleuca and Poaceae were the most important taxa. Alpine herb and shrub taxa were notably absent at Pulbeena and Mowbray swamps (Colhoun et al. 1982; van de Geer et al. 1986). At Rocky Cape, further east on the northwest coast, organic horizons within alluvial fan gravels mainly contained pollen of Eucalyptus and Allocasuarina with Poaceae and Asteraceae, suggesting open dry sclerophyll forest (Colhoun 1977a). These northwestern sclerophyll woodlands and forests reflected their more continental location, the result of glacial lowering of sea level and draining of Bass Strait.
In southeastern Tasmania, the vegetation consisted of dry sclerophyll forest at Blakes Opening in the middle Huon Valley, where Eucalyptus was the most important taxon for most of the period (Colhoun and Goede 1979). Similarly, Eucalyptus forest occurred at Pipe Clay Lagoon in the 5000-year period that preceded the LGM (Colhoun 1977c). Wet sclerophyll forest occurred on the southern part of Tasman Peninsula, where in a gully at Remarkable Cave the dominant Eucalyptus pollen is accompanied by 1.4-13.2% Pomaderris and by up to 5% N. cunninghamii and 4% Phyllocladus (Colhoun 1977b).
terra australis 34
Late-Quaternary vegetation history of Tasmania from pollen records 311
Last Glacial MaximumThe Last Glacial Maximum vegetation of Figure 3e has been reconstructed for the period
18,000-24,000 BP during OIS 2. Alpine grassland and herbfields dominated all valley and mountain sites from Tullabardine Creek to Newall Creek in the west and extended as far as Lake St Clair in the interior. Poaceae and Asteraceae pollen are dominant. There is usually less than 10% Eucalyptus and negligible amounts of rainforest taxa, but traces of alpine taxa occur widely. Offshore, Marine Core SO 36-7SL indicates the widespread presence of alpine grassland and herbfields, with very high quantities of Poaceae, Asteraceae and Chenopodiaceae pollen. Eucalyptus and Allocasuarina are about 10% each, while Astelia, Athrotaxis and Microstrobos are well represented (Colhoun 1985a; Colhoun and van de Geer 1986; van de Geer et al. 1989, 1994; Colhoun et al. 1999; Hopf pers. comm. 2011).
At Dante Rivulet in the upper King Valley, bolsters of Donatia novae-zelandiae occur on the surface of a fossil alpine soil at 230 m altitude some 750 m below the modern treeline. The bolster is dated to 18,800 BP (22,300 cal BP) and is buried by outwash sediments deposited by the LGM ice advance. Asteraceae and Poaceae are the most important pollen types, but the bolster also contains numerous local Cyperaceae and Epacridaceae, spores of Gleichenia, plus small amounts of a wide range of alpine herbs and subalpine shrubs (Gibson et al. 1987; Colhoun et al. 2010).
At Ooze Lake cirque in the highly oceanic mountains of southern Tasmania, the vegetation comprised subalpine rainforest of Lagarostrobos, N. cunninghamii and Phyllocladus that extended to 880 m around 18,000 BP immediately after the cirque glacier had melted. Most of the Lagarostrobos pollen is immature, indicating severe environmental stress (Macphail and Colhoun 1985).
In the lowlands of northwestern Tasmania, the vegetation was savanna and dry sclerophyll woodland. At Mowbray Swamp, the vegetation was almost exclusively Poaceae, with small amounts of Eucalyptus and Leptospermum. Pollen of rainforest taxa is negligible and none is present for alpine-subalpine taxa. The vegetation was similar at Broadmeadows Swamp, except that Melaleuca as well as Leptospermum was well represented adjacent to or on the swamps (van de Geer et al. 1986). The vegetation at Pulbeena Swamp was a savanna, with Poaceae and Asteraceae very abundant, and less than 5% Eucalyptus. No rainforest, subalpine or alpine pollen are present (Colhoun et al. 1982). On Hunter Island adjacent to northwest Tasmania, pollen from the archaeological site at Cave Bay Cave for the period dating 23,000-14,750 BP contains abundant Poaceae and Asteraceae, with Eucalyptus being the only significant tree species represented. Such a cave site preferentially represents regional over local pollen, and the assemblage is compatible with that at Pulbeena, indicating the vegetation of northwest Tasmania at and following the LGM was savannah-like grassland, which probably extended from the Adelaide region to Bass Strait and represented colder, drier conditions than present (Hope 1978).
The vegetation history of Midland and coastal eastern Tasmania during OIS 2 is restricted to records from three sites.
At Crown Lagoon in the dry eastern Midlands, a 2 m sediment core, though undated, is thought to extend from earlier than 25,000 BP until it was drained during European settlement. The pollen record suggests the vegetation varied from savanna or open woodland with Eucalyptus and Allocasuarina before OIS 2, to grassland or steppe at the peak of glacial dryness, with Poaceae, Asteraceae, abundant Chenopodiaceae and less than 5% Eucalyptus (Sigleo and Colhoun 1981).
On the east coast at Freycinet Peninsula, an old glacial-age deflation hollow that now forms the coastal Hazards Lagoon provided a 157 cm sediment record. The record extends to earlier than 18,000 BP (21,000 cal BP), and includes the peak of the LGM. At that time, the
terra australis 34
Eric A. Colhoun and Peter Shimeld312
vegetation comprised a steppe to grassland vegetation, with Poaceae and Asteraceae dominant. Chenopodiaceae and Epacridaceae pollen were also abundant (Mackenzie 2010).
In coastal southeast Tasmania, peaty sediments formed in a pond on the floor of a deflation hollow at Pipe Clay Lagoon are dated to 20,000-22,000 BP. The pollen record indicates the occurrence of dry sclerophyll forest of Eucalyptus, with Poaceae and Asteraceae (Colhoun 1977c).
At the three Midland and east-coast sites, pollen of rainforest taxa is negligible and none is present for alpine-subalpine taxa. There was a sharp north-northwest to south-southeast-trending boundary between the wet alpine and subalpine associations of the west and the dry sclerophyll woodland/forest-grassland-steppe associations of the east during the LGM. Similarly, the vegetation of northwestern Tasmania, then connected to Victoria by a reduction in sea level and exposure of Bass Strait, consisted of dry sclerophyll woodland, savanna and grassland.
Late last glaciationThe vegetation shown in Figure 3f represents the later part of Termination 1 when glaciers
finally melted from the highlands of western Tasmania around 15,000-14,000 BP and early changes in the vegetation from glacial to interglacial conditions occurred (Colhoun et al. 2010). The vegetation can be regarded as of late-glacial age up to 12,000 BP but age calibration would indicate that the changes at some sites commenced a few millennia earlier. During this late-glacial period, alpine vegetation was still very extensive in upland western Tasmania and wet forests were restricted to lower altitudes.
Marine Core SO 36-7SL and sites at 180 m at Governor Bog and 200 m at Smelter Creek in the King Valley show that a transition from non-forest to wet mixed forest occurred in the valleys and on the lowlands, and extended to over 516 m at Lake Selina during the period 14,000-10,000 BP (earliest at Lake Selina cal age 16,700-17,100 BP, Figure 4) (Colhoun et al. 1991a, 1992, 1999; van de Geer et al. 1994). However, wet mixed forest was not widely distributed in the mountains, as alpine grassland and herbfield still remained at higher altitudes, together with alpine shrubs, as at Poets Hill in the West Coast Range, Lake Vera, Lake Wurawina and Mt Field before post-glacial expansion of forest vegetation. At Lake St Clair in the centre and Dove Lake at Cradle Mountain further north, subalpine rainforest occurred, while further east at Brown Marsh the vegetation was mainly tussock grassland with alpine herbs. At Dublin Bog in the Mersey Valley, Eucalyptus wet sclerophyll forest replaced grassland by 13,000 BP (Macphail 1979, 1986; Colhoun et al. 1991b; Colhoun 1992).
In mountainous southeastern Tasmania, subalpine rainforest had already expanded to 880 m at Ooze Lake. However, at 960 m at nearby Adamsons Peak the vegetation was subalpine sclerophyll forest with slightly over 30% Eucalyptus pollen, and significant quantities of pollen of alpine herbs and shrubs, notably Astelia and N. gunnii (Macphail and Colhoun 1985; Macphail 1986).
On the northwestern plains, as far as dating and pollen zone correlation allow, the vegetation was savanna at Broadmeadows Swamp and dry sclerophyll woodland at Mowbray and Pulbeena swamps (Colhoun et al. 1982; van de Geer et al. 1986).
In eastern Tasmania, steppe-grassland vegetation was still present in the dry Midlands at Crown Lagoon, with high values for Poaceae, Asteraceae and Chenopodiaceae, and under 10% Eucalyptus (Sigleo and Colhoun 1981). At nearby Stoney Lagoon, dry sclerophyll forest with 81% Eucalyptus pollen plus mainly Poaceae and Asteraceae is recorded first around 12,000 BP. At Hazards Lagoon on the east coast, Eucalyptus pollen had increased from the LGM to around 40-50%, and Poaceae and Asteraceae had decreased to below 15%. The vegetation was dry sclerophyll forest with a grassy understorey ( Jones 2008; Mackenzie 2010).
terra australis 34
Late-Quaternary vegetation history of Tasmania from pollen records 313
Early HoloceneThe early-Holocene vegetation pattern shown in Figure 3g dating to around 9000 BP
represents the time post-dating the last glaciation when forest expansion was occurring in much of Tasmania. Wet mixed forests of N. cunninghamii, Phyllocladus, Eucryphia, around 10% Eucalyptus, and pollen of mesic shrubs occurred throughout the West Coast Ranges except at high altitude. Wet mixed forest also occurred at Upper Timk Lake in the southeast, where pollen of Poaceae, Asteraceae and alpine taxa were negligible. However, at high altitude, as at Lake Johnston in the west, Lake Dove in the northwest, Lake St Clair in the centre, and Adamsons Peak and Ooze Lake in the south, the vegetation was subalpine rainforest located close to treeline, which in addition to a dominance of rainforest taxa also contained indicator alpine shrub and some herb taxa, N. gunnii and Astelia being present at all sites. At around 1000 m at Beatties and Eagle tarns at Mt Field, Eucalyptus and Pomaderris pollen were abundant, indicating that wet sclerophyll forest was well established on the mountains below the tarns which occurred in a subalpine environment close to treeline. At higher altitude (1158 m) on Tarn Shelf, alpine grassland and herbfield still occurred (Macphail 1979; Macphail and Colhoun 1985; Harle 1989; Dyson 1995; Hopf et al. 2000; Anker et al. 2001).
Further east in west-central Tasmania, wet sclerophyll forests began to be established at lower altitudes. At 440 m in a deep river valley at Tarraleah, Eucalyptus increased strongly to 60-90%, with an accompanying rise in the main indicator taxon Pomaderris. Small quantities of pollen from Ziera arborescens, Phebalium squameum, Monotoca glauca and Bauera rubioides typically associated with wet forests, and Bursaria spinosa and Dodonaea viscosa associated with dry forests and woodlands suggest that the site was located towards the eastern part of the wet sclerophyll forest zone. Still further east at an altitude of 750 m at Brown Marsh, Eucalyptus was increasing with Pomaderris, while Poaceae and alpine herb and shrub taxa were decreasing, and the forest on the lower southeastern part of the Central Plateau was still relatively open (Macphail 1979, 1984).
At 650 m on Yarlington Tier west of Colebrook, a similar stand of Eucalyptus wet sclerophyll forest was established, with Poaceae and Asteraceae decreasing and Pomaderris increasing. Of particular significance is the occurrence of 6-11% pollen of N. cunninghamii, which is more than expected by transport from western forests. Local occurrence is confirmed by a small stand of Nothofagus on the site. Around 9000 BP, an increase in Pomaderris with Atherosperma, Phyllocladus and Dicksonia indicates change from dry to wet sclerophyll forest at the end of the glacial period. The presence of Nothofagus and Atherosperma at Yarlington raises the question of whether these species had expanded further eastwards during the early Holocene than they occur today, or whether they survived throughout the last glacial despite regionally dry and cold conditions by virtue of being located in a suitable topographic and hydrologic habitat. The latter explanation has been preferred (Harle et al. 1993).
Further north at Dublin Bog in the Mersey Valley, wet sclerophyll forest of Eucalyptus with Pomaderris had been established by 13,000 BP, with very few ancillary shrub and herb taxa except for a small rainforest component of N. cunninghamii and Phyllocladus and the treefern Dicksonia. The forest remained similar in composition throughout the early Holocene (Colhoun et al. 1991b).
In northwest Tasmania, the savannah and dry sclerophyll forests of 12,000 years ago were now largely replaced by wet sclerophyll forest at Mowbray and Broadmeadows swamps, though Pulbeena Swamp was little different but classified as dry sclerophyll forest. At all sites, Eucalyptus was the major regional component, with abundant Melaleuca and Leptospermum locally adjacent to or on the swamps (Colhoun et al. 1982; van de Geer et al. 1986).
The vegetation of Midland and eastern Tasmania during the early Holocene is represented by three sites. At Lake Tiberias in the southern Midlands, the vegetation was dry sclerophyll
terra australis 34
Eric A. Colhoun and Peter Shimeld314
forest with 75% Eucalyptus, around 5% Allocasuarina and 10% Poaceae. Pomaderris attained 5-15% and represents abundant transport from western forests, along with 5% N. cunninghamii. At nearby Stoney Lagoon, dry sclerophyll forest is dominated by 66% Eucalyptus with 12% Poaceae and 4% Asteraceae, and by 9% Pomaderris and 5% Phyllocladus, which, like at Lake Tiberias, was transported from the west.
At Hazards Lagoon, the vegetation was also dry sclerophyll forest with 50% Eucalyptus and 30% Allocasuarina. Rhamnaceae (Pomaderris) was 5-10% and Poaceae and Asteraceae both less than 5%. N. cunninghamii pollen was negligible. The transport of pollen types from western forests was less than in the Midlands and the Allocasuarina probably reflects near coastal influences (Macphail and Jackson 1978; Jones 2008; Mackenzie 2010).
In northeast Tasmania, a coastal site at Waterhouse Marsh has 20-40% Eucalyptus and 10-15% Allocasuarina, plus 20-30% Poaceae and 10% Asteraceae. There is a significant wet forest component of Pomaderris, N. cunninghamii and Phyllocladus and spores of Dicksonia and Cyathea that would have been derived from wet forests in the valleys and on the mountain slopes of the uplands to the south. This rainforest component results in the site being classified marginally as wet sclerophyll forest, though the local vegetation of the plain was almost certainly dry sclerophyll forest (Thomas 1996).
In southwest Tasmania, a sediment core taken at Pedder Pond on the outwash plains east of Lake Pedder and west of the foothills of Mt Anne showed that from the beginning of the Holocene record at 10,350 BP until after 9000 BP, the most important taxa were moorland species that included Gymnoschoenus sphaerocephalus, which is usually very under-represented by pollen but abundant in the vegetation, Restionaceae and Epacridaceae. Pollen of Eucalyptus slightly exceeds 10% and Poaceae attains about 10%. Pollen of N. cunninghamii averages about 5% and Phyllocladus 5-10%. The high amount of pollen of moorland taxa and low amounts of rainforest taxa combined with high quantities of charcoal led Fletcher and Thomas (2007a) to conclude that during the postglacial period moorland vegetation had always occupied the Lake Pedder area and that rainforest had not colonised it. Here, the vegetation is classified by the regional pollen types as subalpine sclerophyll forest, which differs from that based on local taxa, which would indicate presence of moorland-heathland.
Mid HoloceneThe mid-Holocene vegetation pattern of about 6000 BP (Figure 3h) represents postglacial
optimum forest development (Macphail 1979), though maximum rainforest developed at different times in different locations (Colhoun 1996). At the regional scale, there is little difference between the 9000 and 6000 BP patterns in western Tasmania because the major divide between wet forest vegetation in much of the west, and dry forest vegetation over most of the Midlands and east had been established by 9000 BP (Figure 3g).
In western Tasmania, regionally distributed pollen types indicate that at 6000 BP, wet mixed forest dominated by N. cunninghamii and Phyllocladus with 5-10% Eucalyptus, plus Bauera rubioides and Dicksonia occurred at most sites. Cool temperate lowland rainforest occurred only at a few sites adjacent to major rivers as at Newell Creek and Lake Fidler, or at higher altitude as at Lake Vera or Upper Lake Timk where the montane rainforest was protected from fire (Macphail 1979; Harle 1989; van de Geer et al. 1989; Harle et al. 1999).
At several sites where regional pollen representation classes the site as wet mixed forest as at Poets Hill west of Lake Margaret, King River Railway Bridge, Governor Bog and Smelter Creek in the King Valley, abundant local taxa including Epacridaceae, Leptospermum, Melaleuca and Restionaceae indicate high inputs from either local bog surfaces or mosaics of vegetation communities (Colhoun et al. 1991a, 1992; van de Geer et al. 1991; Colhoun 1992).
In the centre at Lake St Clair and towards the north at Lake Johnston and Lake Dove,
terra australis 34
Late-Quaternary vegetation history of Tasmania from pollen records 315
subalpine rainforest persisted. In addition, subalpine rainforest persisted at high altitude at Adamsons Peak and Ooze Lake in the southeast (Macphail 1979; Macphail and Colhoun 1985; Dyson 1995; Hopf et al. 2000; Anker et al. 2001).
Further east in central Tasmania, wet sclerophyll forest occurred at Tarraleah. However, at higher altitude, around 1000 m at Eagle Tarn and Beatties Tarn at Mt Field, the vegetation comprised subalpine sclerophyll forest in which around 30-50% Eucalyptus, 1-10% Pomaderris and 1-10% N. gunnii complemented N. cunninghamii and Phyllocladus. At higher altitude (1158 m) on Tarn Shelf, Eucalyptus decreased to 20% and alpine taxa including N. gunnii, Microcachrys and Astelia amounted to 5-10% each. The vegetation was alpine heath, and scrub and forest did not expand to Tarn Shelf during the Holocene. Similar vegetation occurred at Upper Lake Wurawina at 1040 m in the Denison Range, with 20-30% Eucalyptus, 10% each for N. gunnii and Athrotaxis-Diselma, and 10-30% Astelia (Macphail 1979, 1986).
At Pulbeena, Mowbray and Broadmeadows swamps in lowland northwest Tasmania, the regional vegetation at 6000 BP was wet sclerophyll forest and there was also widespread swamp forest. At Pulbeena, there was a marked increase in Eucalyptus plus Melaleuca, very small increases in Monotoca, Rhamnaceae (Pomaderris) and traces of rainforest taxa, indicating change from dry to wet sclerophyll forest between 9000 and 6000 BP. At Mowbray, Eucalyptus and Melaleuca increased and small quantities of Monotoca and Acacia (probably Blackwood Acacia melanoxylon) occurred. At Broadmeadows, Eucalyptus and Melaleuca also increased and there was more Monotoca than at Mowbray (Colhoun et al. 1982; van de Geer et al. 1986).
At Yarlington Tier (650 m altitude) west of Colebrook adjacent to the southern Midlands, there was very little change in the Eucalyptus wet sclerophyll forest between 9000 and 6000 BP, with only a slight reduction in Poaceae and increase in Pomaderris (Harle et al. 1993).
On the dry eastern part of the Central Plateau at Camerons Lagoon (1100 m) on Liawenee Moor, the regional vegetation at 6000 BP was dry sclerophyll woodland, with about 29% Eucalyptus, 40% Poaceae and 15% Asteraceae. The Eucalyptus would have grown on the surrounding dolerite ridges, while the Poaceae and Asteraceae would have covered a grassy upland plain.
At Lake Tiberias in the eastern Midlands, about 10% of both N. cunninghamii and Pomaderris transported from wet forests to the west is present. Eucalyptus (70-75%) is the dominant taxon and the forest was dry sclerophyll forest with 10% Poaceae and 5% Allocasuarina. Similar dry sclerophyll forest occurred at nearby Stoney Lagoon. Dry sclerophyll forest also extended to Hazards Lagoon in the Freycinet Peninsula, which by the middle Holocene was a coastal site and had around 25-30% pollen of Allocasuarina (Macphail and Jackson 1978; Jones 2008; Mackenzie 2010).
In northeast Tasmania, the regional vegetation at Waterhouse Marsh remained dry sclerophyll forest when the long-distance-transported rainforest component is excluded. Forester Marsh (1000 m) in the upper Forester River catchment is dated to 4400 BP and shows the mountain vegetation contained the same rainforest and treefern taxa as recorded at Waterhouse Marsh, but here it was local. Eucalyptus was the dominant taxon, with over 30% pollen, and the vegetation was wet sclerophyll forest (Thomas 1996).
In southwest Tasmania at Pedder Pond, the regional pollen gives a maximum signal for rainforest taxa, with about 10% Eucalyptus at 6000 BP, which classes the vegetation as wet mixed forest in Figure 3h. However, high local inputs of Epacridaceae and Restionaceae plus other shrubs and the buttongrass Gymnoschoenus indicates the vegetation was moorland rather than forest (Fletcher and Thomas 2007a). At Melaleuca Inlet, virtually no pollen of rainforest taxa and Eucalyptus is recorded, but local pollen of Epacridaceae, Melaleuca squamea, Monotoca and Restionaceae are abundant and indicate shrubby moorland occupied this most southwesterly corner of Tasmania (Macphail et al. 1999). Similar results from Thomas (1995) show that
terra australis 34
Eric A. Colhoun and Peter Shimeld316
Gymoschoenus moorland and wet scrub occupied the area for at least the past 12,000 BP, and the continuous presence of charcoal indicates the vegetation association was maintained by the occurrence of frequent burning.
Pre-European settlementThe pre-European settlement vegetation pattern in Figure 3i is represented by pollen spectra
of about 1000 BP age. The regional pollen indicates no significant change for lowland rainforest and wet mixed forest in central and northwestern Tasmania. The distribution of lowland rainforest is analogous to that mapped for modern vegetation (Kirkpatrick and Dickinson 1984; Harris and Kitchener 2005; Figure 2). Subalpine rainforest occurs at altitude in the western mountains and extends to the southern mountains. Alpine vegetation is confined to higher than 1000 m. A sharp north-northwest south-southeast-trending divide occurs between northwestern and central Tasmania, where the dominant forest was wet sclerophyll forest with subalpine sclerophyll woodland at higher altitude. This boundary has not moved westwards since it was established before 9000 BP, and there was no change in the wet sclerophyll forest of northwest Tasmania between 6000 and 1000 BP (Figures 3h and 3i).
Wet mixed forest and wet sclerophyll forest expanded in the highlands of northeastern Tasmania during the Holocene, as indicated at Forester Marsh and Mathinna Plains (950 m) where abundant pollen of N. cunninghamii, Phyllocladus and treeferns, and over 10% Eucalyptus indicates that during the past millennium wet forests were widespread (Thomas 1996). Chloroplast DNA studies show that N. cunninghamii survived within northeast Tasmania and was not dispersed from western Tasmania across the relatively dry northern Midlands after deglaciation. Although one haplotype (C1) is the most common in western Tasmania, another (NE1) is only found in the uplands of northeastern Tasmania (Worth et al. 2009). It is likely other wet-forest species survived locally.
There is a marked contrast between Figures 3h and 3i with the expansion of dry sclerophyll forest and contraction of wet sclerophyll forest southwestward during the late Holocene. Macphail (1979) first observed from sites at Mt Field and Adamsons Peak that after 6000 BP floristically simple N. cunninghamii rainforests and scrubs were replaced by open subalpine Eucalyptus woodlands and alpine communities. He attributed the retreat of the montane rainforest communities from their alpine limits to increases in drought and frost. Structural change also occurred in the wet sclerophyll forest at Tarraleah during the late Holocene, with strong decreases in N. cunninghamii and Pomaderris and an increase in Eucalyptus from less than 30% to more than 50% (Macphail 1984).
Near the eastern boundary of the wet sclerophyll forest there is a decrease in Pomaderris and an increase in Allocasuarina and Poaceae at Yarlington Tier, suggesting drier conditions. A marked rise in Allocasuarina at Lake Tiberias also indicates increased dryness. Further north at Camerons Lagoon on the Central Plateau, N. cunninghamii and Pomaderris decreases and Eucalyptus increases. The pollen data indicate westward decreasing precipitation, which also extended to Den Plain in the Mersey Valley during the late Holocene. In the eastern Midlands, Eucalyptus and Allocasuarina increases at Stoney Lagoon, while at Hazards Lagoon there is a very strong increase of Allocasuarina in the dry sclerophyll forest, which reflects its coastal location (Macphail and Jackson 1978; Harle et al. 1993; Thomas and Hope 1994; Moss et al. 2007; Jones 2008; Mackenzie 2010).
In southwest Tasmania, there is a marked contrast between the vegetation of the deeply incised river valleys, the inland basins and the lowland plains. In the lower Gordon Valley, lowland rainforest, with N. cunninghamii, Phyllocladus, Lagarostrobos, Eucryphia and Anodopetalum, is well developed. In contrast, at Pedder Pond on Huon Plains adjacent to the eastern end of Lake Pedder, any rainforest that may have developed has been supplanted by moorland dominated
terra australis 34
Late-Quaternary vegetation history of Tasmania from pollen records 317
by Restionaceae, Epacridaceae and Gymnoschoenus, with shrubs of Leptospermum and Melaleuca. Similar shrubby-sedge moorland occurs around Melaleuca Inlet in the far southwest (Thomas 1995; Harle et al. 1999; Macphail et al. 1999; Fletcher and Thomas 2007a).
The influences of climate and people on the vegetation changes
The major driving influence on late-Quaternary vegetation changes was climate with its two main components, temperature and precipitation ( Jackson 1968; Macphail 1980; Colhoun 2000). When the Tasmanians crossed Bass Strait 34,000-35,000 BP (38,000-39,000 cal BP), new pressures were exerted on the vegetation by the hunting of Red-necked wallaby Macropus rufogriseus and extensive use of fire, which caused the development of disclimax associations detectable in numerous pollen records (Cosgrove et al. 1990; Allen 1996; Cosgrove 1999; Fletcher and Thomas 2010a).
Western Tasmania receives 3500 to 1800 mm precipitation per annum and sustains rainforest where there is more than 1200 mm per annum and more than 50 mm in all months. Wet sclerophyll forests occur where there is more than 1000 mm per annum, with more than 25 mm in the driest month ( Jackson 1983). During the late Quaternary, only temperature reduction and altitude would have limited the wet forest associations unless summers were much drier. This is unlikely because the southward expansion of the Australian continental high-pressure system and northern extension of Antarctic sea ice would have compressed and strengthened onshore westerly winds, bringing more moisture to western Tasmania than at present. Thus, western Tasmanian late-Quaternary vegetation changes were primarily controlled by temperature.
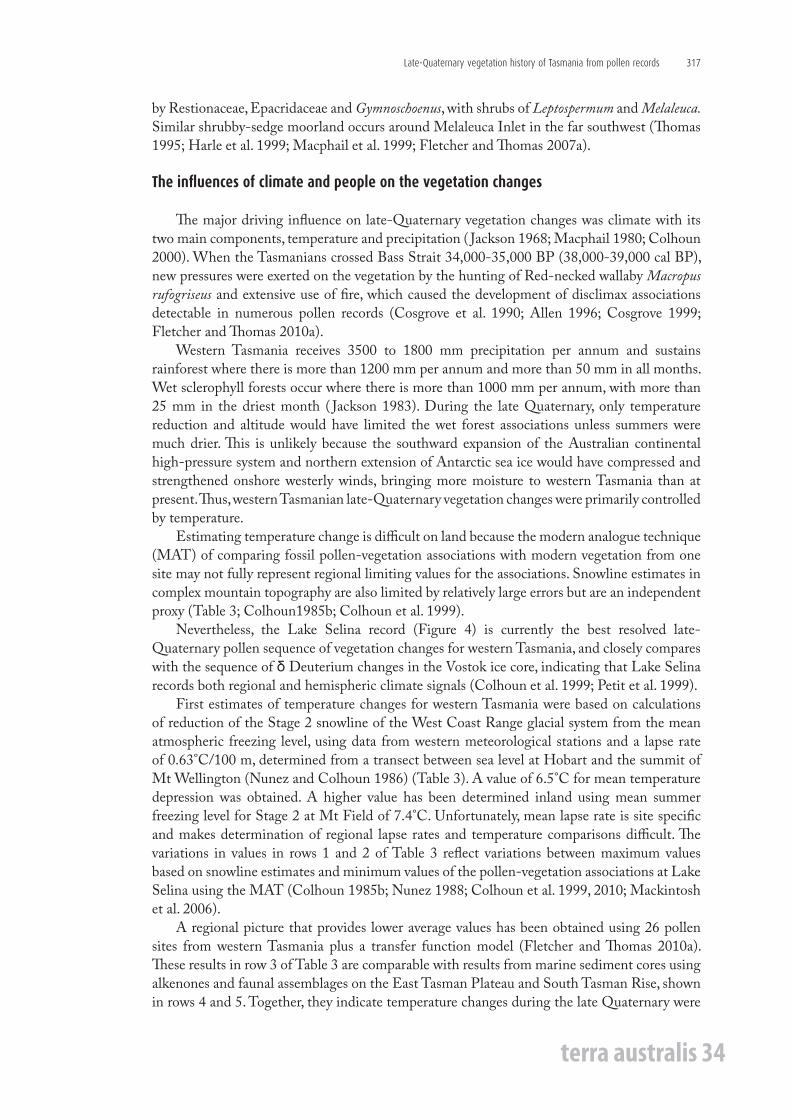
Estimating temperature change is difficult on land because the modern analogue technique (MAT) of comparing fossil pollen-vegetation associations with modern vegetation from one site may not fully represent regional limiting values for the associations. Snowline estimates in complex mountain topography are also limited by relatively large errors but are an independent proxy (Table 3; Colhoun1985b; Colhoun et al. 1999).
Nevertheless, the Lake Selina record (Figure 4) is currently the best resolved late-Quaternary pollen sequence of vegetation changes for western Tasmania, and closely compares with the sequence of δ Deuterium changes in the Vostok ice core, indicating that Lake Selina records both regional and hemispheric climate signals (Colhoun et al. 1999; Petit et al. 1999).
First estimates of temperature changes for western Tasmania were based on calculations of reduction of the Stage 2 snowline of the West Coast Range glacial system from the mean atmospheric freezing level, using data from western meteorological stations and a lapse rate of 0.63°C/100 m, determined from a transect between sea level at Hobart and the summit of Mt Wellington (Nunez and Colhoun 1986) (Table 3). A value of 6.5°C for mean temperature depression was obtained. A higher value has been determined inland using mean summer freezing level for Stage 2 at Mt Field of 7.4°C. Unfortunately, mean lapse rate is site specific and makes determination of regional lapse rates and temperature comparisons difficult. The variations in values in rows 1 and 2 of Table 3 reflect variations between maximum values based on snowline estimates and minimum values of the pollen-vegetation associations at Lake Selina using the MAT (Colhoun 1985b; Nunez 1988; Colhoun et al. 1999, 2010; Mackintosh et al. 2006).
A regional picture that provides lower average values has been obtained using 26 pollen sites from western Tasmania plus a transfer function model (Fletcher and Thomas 2010a). These results in row 3 of Table 3 are comparable with results from marine sediment cores using alkenones and faunal assemblages on the East Tasman Plateau and South Tasman Rise, shown in rows 4 and 5. Together, they indicate temperature changes during the late Quaternary were
terra australis 34
Eric A. Colhoun and Peter Shimeld318
Temperature depression based on
5e 5d 5c 5b 5a 4 3 2 1 Sources
Estimated from present by variation in amplitude of inferred treeline curve in Lake Selina summary pollen diagram calibrated to 6.5oC temperature depression at LGM based on glacial snowline estimates
+1-2 4 2-3 4 2-3 >5 3-5a 6.5+1-2 early0 late
Colhoun 1985b;Colhoun et al. 2010
Minimum temperature depression from present inferred from the pollen-vegetation zones in the Lake Selina summary curve
02.2->3.5
0.6-2.2
2.2->3.5
0.6-2.2
>3.52.8->3.5
>3.5
<0.6> 0 (?)0 late
Colhoun et al. 1999;Table 3
Modern pollen data from 26 sites in western Tasmania calibrated by transfer function model for mean annual temperature reductions
+1 2 1 2 1 40-91-3.9
3.7-4.2
+0.4-0.84 at7200-8300 BP0 late
Fletcher and Thomas 2010a
Alkenone palaeothermometry of Core FRI/94-GC3 (44o 15’S, 149o 59’E) East Tasman Plateau
+2.6 1.1 +1 1.1 +1 3.1 1.5 3.1+0.9 early0 late
Pelejero et al. 2006
Alkenone palaeothermometry for Core GCO7(45o 09’S, 146o 17’E) on South Tasman Rise
+2-33.9-5.2
0.4-2.4
4.6-5.4
+4 at 11,000 BPb
0 late
Sikes et al. 2009
Table 3. Temperature estimates for Tasmania. a: Mean 4 fluctuations b: STF was south of Core GCO7 in early Holocene.
equivalent on land and sea (Pelejero et al. 2006; Sikes et al. 2009).Some features of the temperature records in Table 3 should be highlighted. The mean
temperature for Substage 5e when both rainforest and wet mixed forest developed in western Tasmania was 1-3°C warmer than during the late Holocene and slightly greater than values representing the early-Holocene thermal maximum. The mean temperature of 1.9°C below present and greater seasonal range recorded for Yarra Creek on King Island (Porch et al. 2009) seems not to support a Substage 5e age for the site, and a 5c or 5a age is more likely.
The sequence of Substages 5a to 5d is only recorded by pollen at Lake Selina. The estimates of temperature change are slightly greater than those derived by the Fletcher and Thomas model, while the values in the marine record of Pelejero et al. (2006) for Substages 5a and 5c are less, and are as warm as the Holocene. At Lake Selina, Substages 5a and 5c were cooler than 5e, as indicated by montane rainforest with Phyllocladus more important than Nothofagus. Substages 5b and 5d were significantly colder than 5a and 5c, as indicated by the mosaic of subalpine rainforest, shrubland and heathland.
All temperature estimates suggest Stage 4 was almost as cold as Stage 2 and the values compare with sea surface temperatures (SSTs) obtained for the southern Tasman Sea, the South Tasman Rise and west of Tasmania of a decrease of between 2°C and 5°C for the LGM (Barrows et al. 2000, 2007; Pelejero et al. 2006; Sikes et al. 2009). The vegetation at Lake Selina was alpine grassland and herbfield during both stages. That a temperature depression of at least 4.5-4.7°C (based on lapse rates of 0.6 and 0.63°C/100 m altitude) occurred immediately preceding the peak of the LGM is supported by the fossil Donatia bolster at 230 m at Dante Rivulet, which today occurs at over 1000 m (Gibson et al. 1987; Colhoun et al. 1999).
During Stage 3, temperature depression was more variable due to the occurrence of three
terra australis 34
Late-Quaternary vegetation history of Tasmania from pollen records 319
marked fluctuations in Stage 3 and a fourth at the beginning of Stage 2, as the overall trend was downward towards the LGM (Table 3). Some fluctuations were sufficiently cold for the formation of glaciers in Stage 3 as well as Stage 2. The climate fluctuations were also not local, as similar changes occur in marine records as far apart as Core SO 136-GC3 taken off the west coast of South Island, New Zealand, and others in the South Atlantic (Kanfoush et al. 2000; Mackintosh et al. 2006; Pelejero et al. 2006; Colhoun et al. 2010).
At Lake Selina, the vegetation of Stage 3 was predominantly herbaceous including some alpine herb taxa, but there were also considerable shrub taxa including abundant Microstrobos. Pollen of rainforest was negligible. The pollen-vegetation assemblage suggests climate during most of the stage was closer to glacial than interglacial.
During Stage 2, the massive reduction of rainforest pollen over western Tasmania indicates little rainforest or wet mixed forest was present. As modern treeline in the West Coast Range occurs at 1100 m and snowline was reduced by 1000 m, there would have been little continuous forest higher than 100 m above sea level at the LGM. Such an inferred lowering of treeline reflects a 6°C reduction in mean temperature compared with today during Stage 2, even though greater than values in the broader regional and marine records. Areas of wet forest and woodland would have survived in scattered local refugia in protected sites from which they expanded during the deglaciation period. The process is represented in the West Coast Range, where Huon Pine Lagarostrobos is thought to have survived Stage 2 near Lake Johnston and expanded to an altitude of 1040 m immediately succeeding melting of the cirque glacier (Anker et al. 2001).
The most notable factor that drove re-expansion of wet forests throughout much of western Tasmania during the late glacial and early Holocene was a marked rise in temperature. Radiocarbon dates from marine Core GC07 which occurs on the South Tasman Rise close to southern Tasmania indicate the LGM ended at 18,700 cal BP. Alkenone data show SST rose gradually from 19,000 cal BP until 16,000 cal BP, when it exceeded late-Holocene values by about 1°C, after which it fell by 1°C between 16,000 cal BP and 14,000 cal BP during the Antarctic Cold Reversal. Temperature then rose to a maximum between 13,400 cal BP and 11,000 cal BP, when it increased by 1-2.8°C, before it rapidly declined by 4°C as the Sub Tropical Front (STF) moved north across the South Tasman Rise (4°C is the difference between the SST of subantarctic water south of and subtropical water north of the STF). GC07 occurs north of the STF in summer and the present alkenone SST is 16-17°C (Sikes et al. 2009).
A study of chironomids at Platypus and Eagle tarns at Mt Field also indicates deglaciation by 15,700-15,200 cal BP and rise in temperature of the summer quarter to 0.7°C above modern between 15,000 cal BP and 13,000 cal BP, followed by a decline of 1.8-2.5°C to a minimum between 11,100 cal BP and 10,000 cal BP. The earliest forest expansion in western Tasmanian pollen diagrams generally commences around 13,000 BP (14,700 cal BP), but becomes widespread after 11,000 BP. The forest expansion has been suggested to relate to increases in winter temperature and precipitation rather than summer temperature (Markgraf et al. 1986; Rees and Cwynar 2010).
Maximum climatic warmth in the early Holocene occurred between around 11,000 and 7500 BP and was followed by a late-Holocene cooling. This is consistent with widespread survival of alpine and subalpine vegetation associations in central and northernwestern Tasmania until 12,000 BP (13,500 cal BP), as shown on Figure 3f and regional development of wet mixed forest, as shown on Figure 3g by 9000 BP (10,000 cal BP). Although the alkenone data indicate a marked SST downturn of 4°C after 11,000 cal BP as the STF moved northwards, it did not inhibit expansion of lowland rainforest of Nothofagus over central-western Tasmania during the early to middle Holocene (Figure 3g). The chironomid data from Mt Field indicate
terra australis 34
Eric A. Colhoun and Peter Shimeld320
there was a sharp increase in temperature to a maximum of 10°C by 9300 cal BP at Eagle Tarn and 9.4°C by 9800 cal BP at Platypus Tarn (modern temperature of warmest quarter 9.5°C). Macphail (1979) recognised a mid-Holocene thermal maximum from 8000 BP to 5000 BP (8900-5700 cal BP), after which a retreat of rainforest and expansion of sclerophyll vegetation occurred at high altitude, probably due to the combined effects of cooling, drying and burning. Chironomid-inferred temperatures at Mt Field also generally decrease during the late Holocene (Rees and Cwynar 2010).
During the late Quaternary, only valley heads and high slopes of the mountains of northeast Tasmania preserved extensive areas of Nothofagus temperate rainforest. Elsewhere, wet-forest vegetation was confined to gullies and sites where water was concentrated to provide local wet habitats. East of the western mountains, the lower eastern Central Plateau was relatively dry, the Midlands were heavily rain-shadowed and very dry, and the Eastern Highlands were also drier than western Tasmania. The vegetation of this area was dominated initially by grassland and steppe during the termination of Stage 2, after which sclerophyll woodland and forest expanded over most of the area, as represented on Figures 3e-3i and already discussed.
While variations in the vegetation associations were partly (vide infra) a response to drought under the cold glacial conditions, there is little evidence that permits quantification of how dry it was. Most evidence is based on geomorphology rather than palaeoecology. At Newdegate Cave in southeast Tasmania on the margin of the wet climate of southwest Tasmania, stalagmite growth was reduced from 16.1 mm/1000 years to 0.3 mm/1000 years at 116,700 BP, signalling a very rapid change to aridity between Substages 5e and 5d (Zhao et al. 2001). Though there is no record of vegetation in eastern Tasmania at this time, the rapidity and apparent strength of this change may be reflected in the rapidity of change from wet mixed forest to subalpine forest at Lake Selina (Figure 3b).
Eastern Tasmania was very much drier during the LGM than present, as indicated by extensive linear dunes dated by OSL to 23,800-16,800 BP on the northeastern coastal plain. In addition, a crescentic dune, the Dunlin Dune, was formed by two phases of aeolian activity that occurred from before 29,000 cal BP until after 14,500 cal BP, with an interval between 21,000 cal BP and 16,000 cal BP when a podzolised palaeosol was formed. Aeolian activity during and immediately after the LGM extended to southern Tasmania, where at Southwood Road a 1.9 m-thick dune was deposited around 19,100-18,700 cal BP. Extensive lagoon and lunette systems also occur in the northeast, Midlands and southeast, and one lunette at Rushy Lagoon in the northeast was formed after 9600-9300 cal BP. There are also extensive source-bordering river dunes along the Derwent River in which the sediment was derived from streams loaded with glacial outwash (Nicolls 1958; Cosgrove 1985; Duller and Augustinus 2006; McIntosh et al. 2009). In addition to this widespread evidence for aeolian activity during and succeeding the LGM, McIntosh et al. (2009) have presented extensive geomorphological evidence of landscape instability and erosion below 600 m, which they convincingly demonstrate largely resulted from Aboriginal burning of vegetation after 35,000 BP. Thus, the development of vegetation throughout eastern Tasmania during at least the period of occupation in the middle to late Holocene after postglacial sea level rise (Brown 1986, 1991; Kee 1990, 1991) must have been strongly influenced by aboriginal burning as well as climate change.
When the first Tasmanians crossed the Bass Plain around 40,000 years ago, they moved southwards into the northern valleys, into the central Florentine Valley, throughout the southwestern valleys from the Weld River in the southeast to the Franklin and Mackintosh rivers in the west, and into the southeastern Central Plateau and Derwent Valley. Their major pursuit was hunting the Red-necked wallaby using their main cultural tool, fire, which would have had a major impact on the vegetation (Murray et al. 1980; Kiernan et al. 1983; Stern and Marshall 1993; Cosgrove 1995, 1996; Allen 1996; Allen and Porch 1996; Stone and Everett
terra australis 34
Late-Quaternary vegetation history of Tasmania from pollen records 321
2010). Numerous pollen diagrams dating to the period after about 35,000 BP reveal the impact of
aboriginal burning on the vegetation.In northern Tasmania, the Forth Valley was occupied from 34,000 BP, as indicated by
the archaeological site at Parmeener Meethaner and the adjacent Mersey Valley to the east from before 10,900 BP at Warragarra Rockshelter (Cosgrove 1995; Allen and Porch 1996). The pollen record at Dublin Bog in the Mersey Valley reveals that during the past 13,100 BP, charcoal was abundant and the vegetation was Eucalyptus forest. Climatically, the valley should have had rainforest during the Holocene, yet rainforest pollen occurs only in small amounts that can be regarded as background values. It seems highly probable that burning of the vegetation by Aboriginals favoured establishment of sclerophyll forest and prevented the postglacial expansion of rainforest. Further north at Den Plain, Eucalyptus forest was dominant throughout the past 3000 years until European settlement 200 years ago when grass and herbs became more abundant (Colhoun et al. 1991b; Moss et al. 2007).
No pollen sites have been recorded from the Florentine Valley by which to judge aboriginal impact on the vegetation. However, at Mt Field to the east, Macphail (1979) attributed the decrease of rainforest and expansion of sclerophyll woodland at high altitude partly to the effects of aboriginal burning. Further south at Ooze Lake, a high-altitude community of grassland and sedgeland-heath probably resulted from aboriginal burning between 16,500 and 13,500 BP, before the expansion of rainforest and wet forest vegetation (Macphail and Colhoun 1985).
In western Tasmania, the core region of lowland cool temperate rainforest and wet mixed forest as discussed, it is notable that at some sites wet forests expanded much less than would have been expected during the Holocene. At Governor Bog in the King Valley, a sequence shows that after 13,000 BP, small trees and shrubs comprised ca. 60% of the total pollen sum and included Epacridaceae, Melaleuca, Leptospermum, Monotoca and Bauera and only 30% of rainforest species. Charcoal is abundant throughout the sequence. A mosaic vegetation of heath, shrub and forest was suggested. Similar sequences with abundant charcoal occurred at Smelter Creek and King River Railway Bridge (Colhoun et al. 1991a, 1992; van de Geer et al. 1991). It is suggested that the occurrence of heath-scrub vegetation in the King Valley rather than Nothofagus rainforest is a result of aboriginal occupation and burning (Thomas 1995).
Figure 2 shows the vegetation of large areas of far southwestern and parts of northwestern Tasmania are moorland that consist mainly of sedges including the buttongrass Gymnoschoenus and heath with many small Epacridaceae and Myrtaceae shrubs. The pollen records from Pedder Pond and Melaleuca Inlet indicate that much of this region has been moorland throughout the Holocene and the area was not extensively invaded by the postglacial expansion of rainforest. The modern vegetation is regarded as a cultural artefact resulting from aboriginal burning of the landscape that maintained moorland vegetation established in this superhumid lowland landscape during glacial times (Fletcher and Thomas 2007a, 2010a, b). The moorland vegetation in this region may have been particularly shaped by the cold wet climate as well as human impact, as suggested by both macrofossil and microfossil evidence from Melaleuca Inlet for predominantly wet scrub and sedgeland-heath vegetation of at least 38,800 years’ age ( Jordan et al. 1991).
While the evidence for modification of vegetation by aboriginal burning during the Holocene in southwestern Tasmania is clear, the question of to what extent they may have modified late-Pleistocene vegetation is more difficult to assess due to few available sites and more rigorous temperature conditions acting on the vegetation. It has been indicated here that Stage 4 was almost as cold as Stage 2 and that during both, the vegetation of the mountains of western Tasmania was mainly alpine grassland and herbfield. The archaeological evidence indicates that the region could not have been occupied until the final part of Stage 3 and Stage
terra australis 34
Eric A. Colhoun and Peter Shimeld322
2, so the alpine grassland and herbfields of Stage 4 and most of Stage 3 would have reflected climatic influences alone.
Four sites at Tullabardine Creek, Henty Bridge, Newell Creek and Lake Selina all show strong Poaceae peaks during and succeeding the peak of the LGM, with associated alpine herbs and shrubs plus heathland shrubs and sedges. Charcoal was only counted at Lake Selina. It is equally abundant in Stage 2 as in Stage 4, is greater than during Stage 3, but is much less abundant than during the Holocene. It is not possible to determine whether any of the herbaceous peaks during Stage 2 at these sites were produced by aboriginal burning rather than representing the vegetation of the cold glacial climate, but it is a possibility.
At Lake Selina, a whole-core NRM analysis showed that for all colder periods (5d, 5b, 4, late 3 and 2), the NRM values were higher than at other times, especially during Stages 5e and 1 (see Colhoun et al. 1999: Figure 5). The NRM values reflect the amount of minerogenic sediment in the core vis a vis the organic sediment, and represent the amount of catchment erosion. As Stage 2 had three times the NRM values of Stage 4 and climatic conditions were similar, there appears to have been much more erosion during the LGM than during Stage 4. If Aboriginals had inhabited the region during this period, it is possible they contributed to the erosion by burning of the catchment, but there is no independent evidence.
Conclusion
During the late Quaternary, there were major changes to the vegetation of Tasmania that were primarily climatically driven. The changes occurred mainly in response to variations in temperature in the west and to temperature and precipitation in the east. After the arrival of the Tasmanians around 35,000 BP, their hunter-gatherer mode of life utilising fire impacted strongly on the vegetation to produce disclimax communities which can be detected in numerous pollen diagrams. Cultural modification of the vegetation is most noticeable in southwest Tasmania, where maintenance of moorland from glacial times prevented Holocene expansion of Nothofagus cool temperate rainforest.
Acknowledgements
The authors thank colleagues indicated in Table 1 who have willingly contributed pollen data for the mapping. They thank Stephen Harris and Anne Kitchener, and the Department of Primary Industries Parks Water and Environment of Tasmania for permission to publish Figure 2. They thank Penny Jones and Lydia Mackenzie for supplying unpublished pollen data. They acknowledge the University of Newcastle, the University of Tasmania, the Australian Research Council, and the Australian Nuclear Science and Technology Organisation for supporting the work. They also thank Ian Thomas and Michael Shawn-Fletcher for reviewing the paper and providing many constructive comments and help.
References
Allen, J. (ed) 1996. Report of the Southern Forests Archaeological Project. Volume 1. School of Archaeology La Trobe University. Bundoora, Victoria 3083, Australia.
Allen, J. and Porch, N. 1996. Warragarra Rockshelter. Chapter 10. In: Allen, J. (ed), Report of the Southern Forests Archaeological Project Volume 1. pp. 195-217. School of Archaeology,
terra australis 34
Late-Quaternary vegetation history of Tasmania from pollen records 323
La Trobe University, Bundoora, Victoria 3083, Australia.Anker, S.A., Colhoun, E.A., Barton, C.E., Petersen, M. and Barbetti, M. 2001. Holocene
vegetation and palaeoclimatic and palaeomagnetic history from Lake Johnston, Tasmania. Quaternary Research 56:264-274.
Augustinus, P.C. and Colhoun, E.A. 1986. Glacial history of the upper Pieman and Boco valleys, western Tasmania. Australian Journal of Earth Sciences 33:181–191.
Barrows, T.T., Juggins, S., De Deckker, P., Thiede, J. and Martinez, J.I. 2000. Sea-surface temperatures of the southwest Pacific Ocean during the Last Glacial Maximum. Paleoceanography 15:95-109.
Barrows, T.T., Juggins, S., De Deckker, P. and Calvo, E. 2007. Long-term sea surface temperature and climate change in the Australian-New Zealand region. Paleoceanography 22:1-17.
Bowman, D.J.M.S. and Jackson, W.D. 1981. Vegetation succession in south-west Tasmania. Search 12:358-362.
Brown, S.H. 1986. Aboriginal Archaeological Resources in South East Tasmania. Occasional Paper No. 12. National Parks and Wildlife Service Tasmania.
Brown, S.H. 1991. Aboriginal Archaeological Sites in Eastern Tasmania. Occasional Paper No. 31, National Parks and Wildlife Service Tasmania.
Chiarucci, A., Araújo, M.B., Decorq, G., Beierkuhnlein, C. and Fernández-Palacios, J.M. 2010. The concept of potential natural vegetation: An epitaph? Journal of Vegetation Science 21:1172-1178.
Clements, F.E. 1936. Nature and Structure of the Climax. Journal of Ecology 24:252-284.Colhoun, E.A. 1977a. Late Quaternary fan gravels and slope deposits at Rocky Cape,
northwestern Tasmania: Their palaeoenvironmental significance. Papers and Proceedings of the Royal Society of Tasmania 111:13-27.
Colhoun, E.A. 1977b. The Remarkable Cave, southeastern Tasmania: Its geomorphological development and environmental history. Papers and Proceedings of the Royal Society of Tasmania 111:29-39.
Colhoun, E.A. 1977c. A sequence of Late Quaternary deposits at Pipe Clay Lagoon, southeastern Tasmania. Papers and Proceedings of the Royal Society of Tasmania 111:1-12.
Colhoun, E.A. 1980. Quaternary fluviatile deposits from the Pieman Dam site, western Tasmania. Proceedings of the Royal Society of London B207:355-384.
Colhoun, E.A. 1985a. Pre-Last Glaciation Maximum vegetation history at Henty Bridge, western Tasmania. New Phytologist 100:681-690.
Colhoun, E.A. 1985b. Glaciations of the West Coast Range, Tasmania. Quaternary Research 24:39-59.
Colhoun, E.A. 1991. Climate during the Last Glacial Maximum in Australia and New Guinea. Evidence inferred from biogeographical and geomorphological data. Australian and New Zealand Geomorphology Group Special Publication No. 2. pp. 1-71.
Colhoun, E.A. 1992. Late Glacial and Holocene vegetation history at Poets Hill Lake, western Tasmania. Australian Geographer 23(1):11-23.
Colhoun, E.A. 1996. Application of Iversen’s Glacial-Interglacial Cycle to interpretation of the late Last Glacial and Holocene vegetation history of western Tasmania. Quaternary Science Reviews 15:557-580.
Colhoun, E.A. 2000. Vegetation and climate change during the Last Interglacial-Glacial cycle in western Tasmania, Australia. Palaeogeography, Palaeoclimatology, Palaeoecology 55(1-2):195-209.
Colhoun, E.A. and Goede, A. 1979. The Late Quaternary deposits of Blakes Opening and the Middle Huon Valley, Tasmania. Philosophical Transactions of the Royal Society of London 286B:371-395.
terra australis 34
Eric A. Colhoun and Peter Shimeld324
Colhoun, E.A. and van de Geer, G. 1986. Holocene to Middle Last Glaciation vegetation history at Tullabardine Dam, western Tasmania. Proceedings of the Royal Society of London 229B:177-207.
Colhoun, E.A. and van de Geer, G. 1987. Vegetation history and climate before the maximum of the Last Glaciation at Crotty, western Tasmania. Papers and Proceedings of the Royal Society of Tasmania 121:69–74.
Colhoun, E.A. and van de Geer, G. 1998. Pollen analysis of 0-20m at Darwin Crater, western Tasmania, Australia. International Project on Paleolimnology and Late Cenozoic Climate, Newsletter 11:68-89.
Colhoun, E.A., Benger, S.N., Fitzsimons, S.J., van de Geer, G. and Hill, R.S. 1993. Quaternary organic deposit from Newton Creek Valley, western Tasmania. Australian Geographical Studies 31(1):26-38.
Colhoun, E.A., Kiernan, K., Barrows, T. and Goede, A. 2010. Advances in Quaternary studies in Tasmania. In: Bishop, P. and Pillans, B. (eds), Australian Landscapes. Geological Society, London, Special Publications 2010, v.346. pp. 165-183.
Colhoun, E.A., Pola, J.S., Barton, C.E. and Heijnis, H. 1999. Late Pleistocene vegetation and climate history of Lake Selina, western Tasmania. Quaternary International 57/58:5-23.
Colhoun, E.A., van de Geer, G. and Fitzsimons, S.J. 1991a. Late glacial and Holocene vegetation history at Governor Bog, King Valley, western Tasmania, Australia. Journal of Quaternary Science 6(1):55-66.
Colhoun, E.A., van de Geer, G. and Fitzsimons, S.J. 1992. Late Quaternary organic deposits at Smelter Creek and vegetation history of the Middle King Valley, Western Tasmania Journal of Biogeography 19:217-227.
Colhoun, E.A., van de Geer, G. and Hannan, D. 1991b. Late Glacial and Holocene Vegetation History at Dublin Bog, north-central Tasmania. Australian Geographical Studies 29(2):337-354.
Colhoun, E.A., van de Geer, G. and Mook, W. 1982. Stratigraphy, pollen analysis and palaeoclimatic interpretation of Pulbeena Swamp, northwestern Tasmania. Quaternary Research 19(1):108-126.
Cosgrove, R. 1985. New evidence for Early Holocene Aboriginal occupation in northeast Tasmania, Australian Archaeology 21:19-36.
Cosgrove, R. 1995. Late Pleistocene behavioural variation and time trends: the case from Tasmania. Archaeology in Oceania, 30:83-104.
Cosgrove, R. 1996. ORS 7 Rockshelter. Chapter 5. In: Allen, J. (ed), Report of the Southern Forests Archaeological Project Volume 1. pp. 69-89. School of Archaeology, La Trobe University, Bundoora, Victoria 3083, Australia.
Cosgrove, R. 1999. Forty-two degrees South: The archaeology of Late Pleistocene Tasmania. Journal of World Prehistory 13(4):357-402.
Cosgrove, R., Allen, J. and Marshall, B. 1990. Palaeoecology and Pleistocene human occupation in south central Tasmania. Antiquity 64:59-78.
Duller, G.A.T. and Augustinus, P.C. 2006. Reassessment of the record of linear dune activity in Tasmania using optical dating. Quaternary Science Reviews 25:2608-2618.
Duncan, F. and Brown, M.J. 1985. Dry sclerophyll vegetation in Tasmania. Wildlife Division Technical Report 85/1 National Parks and Wildlife Service, Tasmania.
Dyson, W.D. 1995. A pollen and vegetation history from Lake Dove, Western Tasmania. B. Honours thesis, Department of Geography, University of Newcastle, Australia.
Fletcher, M-S. and Thomas, I. 2007a. Holocene vegetation and climate change from near Lake Pedder, south-west Tasmania, Australia. Journal of Biogeography 34:665-677.
Fletcher, M-S. and Thomas, I. 2007b. Modern pollen-vegetation relationships in western
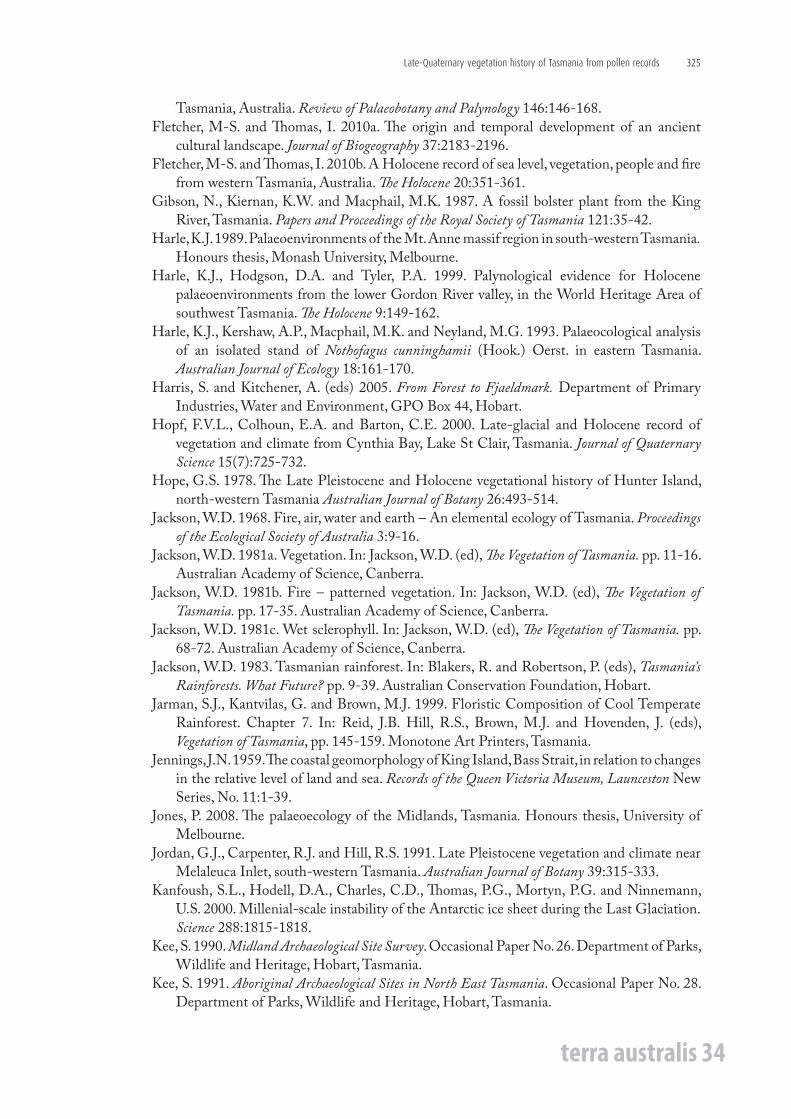
terra australis 34
Late-Quaternary vegetation history of Tasmania from pollen records 325
Tasmania, Australia. Review of Palaeobotany and Palynology 146:146-168.Fletcher, M-S. and Thomas, I. 2010a. The origin and temporal development of an ancient
cultural landscape. Journal of Biogeography 37:2183-2196.Fletcher, M-S. and Thomas, I. 2010b. A Holocene record of sea level, vegetation, people and fire
from western Tasmania, Australia. The Holocene 20:351-361. Gibson, N., Kiernan, K.W. and Macphail, M.K. 1987. A fossil bolster plant from the King
River, Tasmania. Papers and Proceedings of the Royal Society of Tasmania 121:35-42.Harle, K.J. 1989. Palaeoenvironments of the Mt. Anne massif region in south-western Tasmania.
Honours thesis, Monash University, Melbourne. Harle, K.J., Hodgson, D.A. and Tyler, P.A. 1999. Palynological evidence for Holocene
palaeoenvironments from the lower Gordon River valley, in the World Heritage Area of southwest Tasmania. The Holocene 9:149-162.
Harle, K.J., Kershaw, A.P., Macphail, M.K. and Neyland, M.G. 1993. Palaeocological analysis of an isolated stand of Nothofagus cunninghamii (Hook.) Oerst. in eastern Tasmania. Australian Journal of Ecology 18:161-170.
Harris, S. and Kitchener, A. (eds) 2005. From Forest to Fjaeldmark. Department of Primary Industries, Water and Environment, GPO Box 44, Hobart.
Hopf, F.V.L., Colhoun, E.A. and Barton, C.E. 2000. Late-glacial and Holocene record of vegetation and climate from Cynthia Bay, Lake St Clair, Tasmania. Journal of Quaternary Science 15(7):725-732.
Hope, G.S. 1978. The Late Pleistocene and Holocene vegetational history of Hunter Island, north-western Tasmania Australian Journal of Botany 26:493-514.
Jackson, W.D. 1968. Fire, air, water and earth – An elemental ecology of Tasmania. Proceedings of the Ecological Society of Australia 3:9-16.
Jackson, W.D. 1981a. Vegetation. In: Jackson, W.D. (ed), The Vegetation of Tasmania. pp. 11-16. Australian Academy of Science, Canberra.
Jackson, W.D. 1981b. Fire – patterned vegetation. In: Jackson, W.D. (ed), The Vegetation of Tasmania. pp. 17-35. Australian Academy of Science, Canberra.
Jackson, W.D. 1981c. Wet sclerophyll. In: Jackson, W.D. (ed), The Vegetation of Tasmania. pp. 68-72. Australian Academy of Science, Canberra.
Jackson, W.D. 1983. Tasmanian rainforest. In: Blakers, R. and Robertson, P. (eds), Tasmania’s Rainforests. What Future? pp. 9-39. Australian Conservation Foundation, Hobart.
Jarman, S.J., Kantvilas, G. and Brown, M.J. 1999. Floristic Composition of Cool Temperate Rainforest. Chapter 7. In: Reid, J.B. Hill, R.S., Brown, M.J. and Hovenden, J. (eds), Vegetation of Tasmania, pp. 145-159. Monotone Art Printers, Tasmania.
Jennings, J.N. 1959. The coastal geomorphology of King Island, Bass Strait, in relation to changes in the relative level of land and sea. Records of the Queen Victoria Museum, Launceston New Series, No. 11:1-39.
Jones, P. 2008. The palaeoecology of the Midlands, Tasmania. Honours thesis, University of Melbourne.
Jordan, G.J., Carpenter, R.J. and Hill, R.S. 1991. Late Pleistocene vegetation and climate near Melaleuca Inlet, south-western Tasmania. Australian Journal of Botany 39:315-333.
Kanfoush, S.L., Hodell, D.A., Charles, C.D., Thomas, P.G., Mortyn, P.G. and Ninnemann, U.S. 2000. Millenial-scale instability of the Antarctic ice sheet during the Last Glaciation. Science 288:1815-1818.
Kee, S. 1990. Midland Archaeological Site Survey. Occasional Paper No. 26. Department of Parks, Wildlife and Heritage, Hobart, Tasmania.
Kee, S. 1991. Aboriginal Archaeological Sites in North East Tasmania. Occasional Paper No. 28. Department of Parks, Wildlife and Heritage, Hobart, Tasmania.
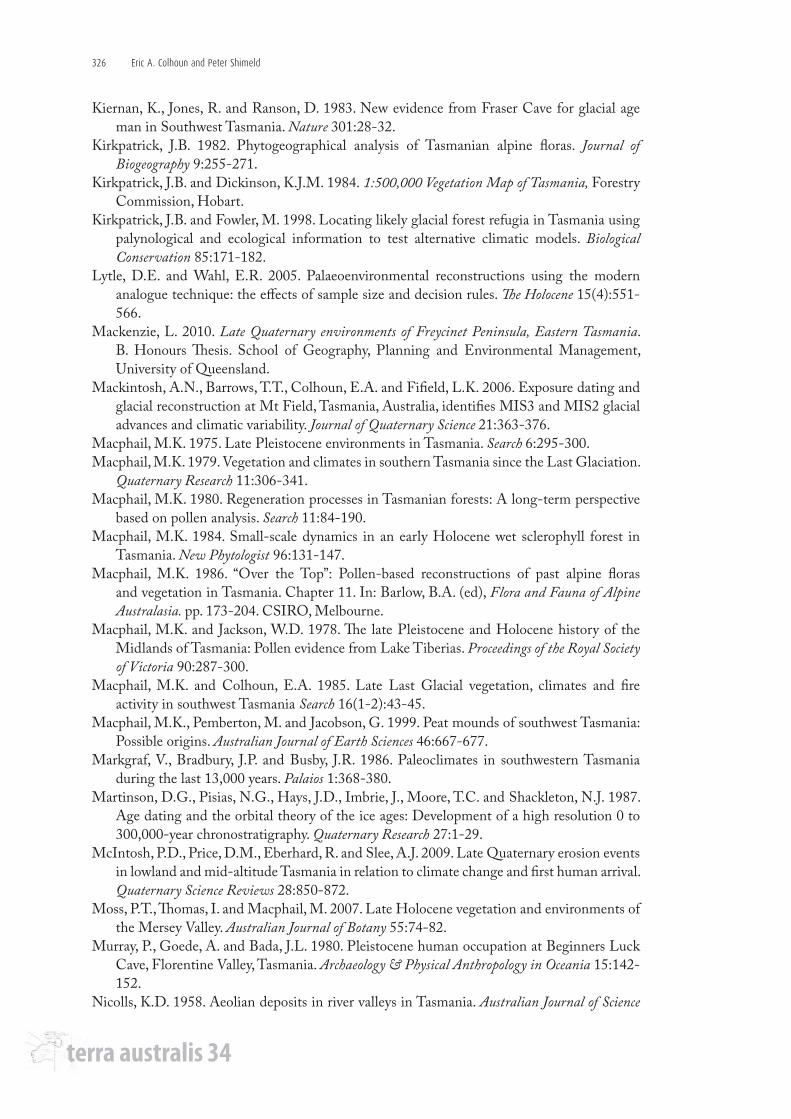
terra australis 34
Eric A. Colhoun and Peter Shimeld326
Kiernan, K., Jones, R. and Ranson, D. 1983. New evidence from Fraser Cave for glacial age man in Southwest Tasmania. Nature 301:28-32.
Kirkpatrick, J.B. 1982. Phytogeographical analysis of Tasmanian alpine floras. Journal of Biogeography 9:255-271.
Kirkpatrick, J.B. and Dickinson, K.J.M. 1984. 1:500,000 Vegetation Map of Tasmania, Forestry Commission, Hobart.
Kirkpatrick, J.B. and Fowler, M. 1998. Locating likely glacial forest refugia in Tasmania using palynological and ecological information to test alternative climatic models. Biological Conservation 85:171-182.
Lytle, D.E. and Wahl, E.R. 2005. Palaeoenvironmental reconstructions using the modern analogue technique: the effects of sample size and decision rules. The Holocene 15(4):551-566.
Mackenzie, L. 2010. Late Quaternary environments of Freycinet Peninsula, Eastern Tasmania. B. Honours Thesis. School of Geography, Planning and Environmental Management, University of Queensland.
Mackintosh, A.N., Barrows, T.T., Colhoun, E.A. and Fifield, L.K. 2006. Exposure dating and glacial reconstruction at Mt Field, Tasmania, Australia, identifies MIS3 and MIS2 glacial advances and climatic variability. Journal of Quaternary Science 21:363-376.
Macphail, M.K. 1975. Late Pleistocene environments in Tasmania. Search 6:295-300. Macphail, M.K. 1979. Vegetation and climates in southern Tasmania since the Last Glaciation.
Quaternary Research 11:306-341.Macphail, M.K. 1980. Regeneration processes in Tasmanian forests: A long-term perspective
based on pollen analysis. Search 11:84-190.Macphail, M.K. 1984. Small-scale dynamics in an early Holocene wet sclerophyll forest in
Tasmania. New Phytologist 96:131-147.Macphail, M.K. 1986. “Over the Top”: Pollen-based reconstructions of past alpine floras
and vegetation in Tasmania. Chapter 11. In: Barlow, B.A. (ed), Flora and Fauna of Alpine Australasia. pp. 173-204. CSIRO, Melbourne.
Macphail, M.K. and Jackson, W.D. 1978. The late Pleistocene and Holocene history of the Midlands of Tasmania: Pollen evidence from Lake Tiberias. Proceedings of the Royal Society of Victoria 90:287-300.
Macphail, M.K. and Colhoun, E.A. 1985. Late Last Glacial vegetation, climates and fire activity in southwest Tasmania Search 16(1-2):43-45.
Macphail, M.K., Pemberton, M. and Jacobson, G. 1999. Peat mounds of southwest Tasmania: Possible origins. Australian Journal of Earth Sciences 46:667-677.
Markgraf, V., Bradbury, J.P. and Busby, J.R. 1986. Paleoclimates in southwestern Tasmania during the last 13,000 years. Palaios 1:368-380.
Martinson, D.G., Pisias, N.G., Hays, J.D., Imbrie, J., Moore, T.C. and Shackleton, N.J. 1987. Age dating and the orbital theory of the ice ages: Development of a high resolution 0 to 300,000-year chronostratigraphy. Quaternary Research 27:1-29.
McIntosh, P.D., Price, D.M., Eberhard, R. and Slee, A.J. 2009. Late Quaternary erosion events in lowland and mid-altitude Tasmania in relation to climate change and first human arrival. Quaternary Science Reviews 28:850-872.
Moss, P.T., Thomas, I. and Macphail, M. 2007. Late Holocene vegetation and environments of the Mersey Valley. Australian Journal of Botany 55:74-82.
Murray, P., Goede, A. and Bada, J.L. 1980. Pleistocene human occupation at Beginners Luck Cave, Florentine Valley, Tasmania. Archaeology & Physical Anthropology in Oceania 15:142-152.
Nicolls, K.D. 1958. Aeolian deposits in river valleys in Tasmania. Australian Journal of Science
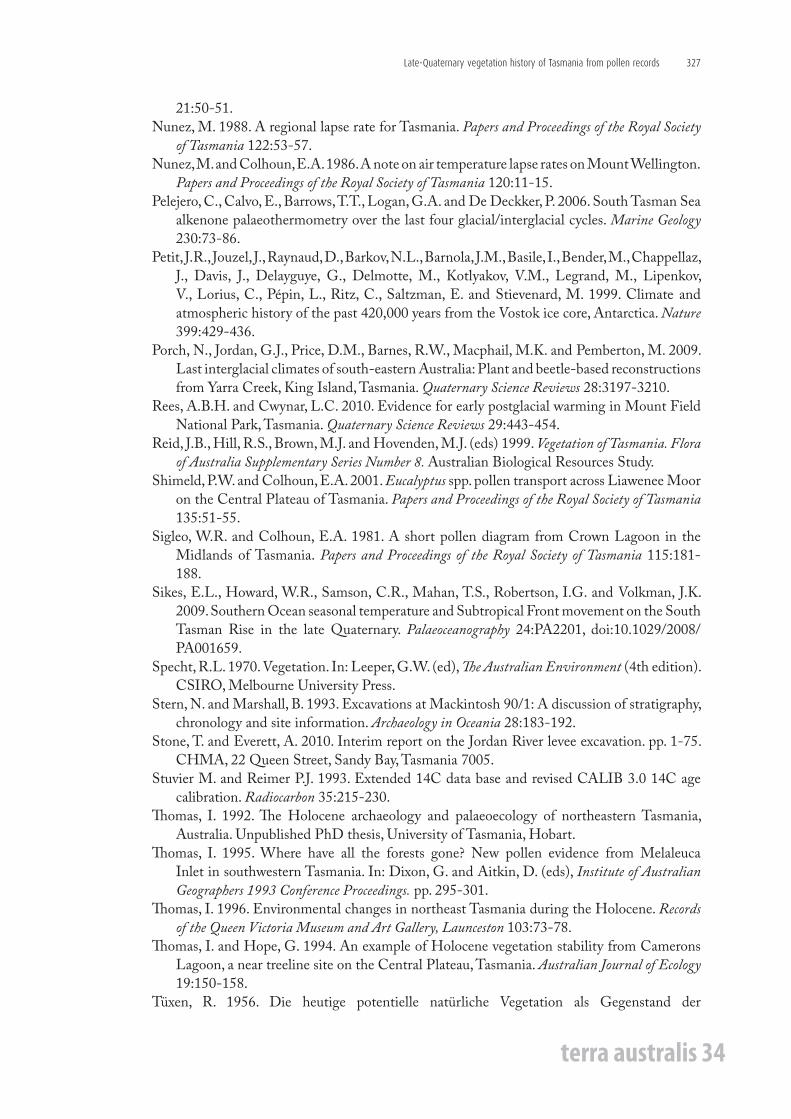
terra australis 34
Late-Quaternary vegetation history of Tasmania from pollen records 327
21:50-51. Nunez, M. 1988. A regional lapse rate for Tasmania. Papers and Proceedings of the Royal Society
of Tasmania 122:53-57.Nunez, M. and Colhoun, E.A. 1986. A note on air temperature lapse rates on Mount Wellington.
Papers and Proceedings of the Royal Society of Tasmania 120:11-15.Pelejero, C., Calvo, E., Barrows, T.T., Logan, G.A. and De Deckker, P. 2006. South Tasman Sea
alkenone palaeothermometry over the last four glacial/interglacial cycles. Marine Geology 230:73-86.
Petit, J.R., Jouzel, J., Raynaud, D., Barkov, N.L., Barnola, J.M., Basile, I., Bender, M., Chappellaz, J., Davis, J., Delayguye, G., Delmotte, M., Kotlyakov, V.M., Legrand, M., Lipenkov, V., Lorius, C., Pépin, L., Ritz, C., Saltzman, E. and Stievenard, M. 1999. Climate and atmospheric history of the past 420,000 years from the Vostok ice core, Antarctica. Nature 399:429-436.
Porch, N., Jordan, G.J., Price, D.M., Barnes, R.W., Macphail, M.K. and Pemberton, M. 2009. Last interglacial climates of south-eastern Australia: Plant and beetle-based reconstructions from Yarra Creek, King Island, Tasmania. Quaternary Science Reviews 28:3197-3210.
Rees, A.B.H. and Cwynar, L.C. 2010. Evidence for early postglacial warming in Mount Field National Park, Tasmania. Quaternary Science Reviews 29:443-454.
Reid, J.B., Hill, R.S., Brown, M.J. and Hovenden, M.J. (eds) 1999. Vegetation of Tasmania. Flora of Australia Supplementary Series Number 8. Australian Biological Resources Study.
Shimeld, P.W. and Colhoun, E.A. 2001. Eucalyptus spp. pollen transport across Liawenee Moor on the Central Plateau of Tasmania. Papers and Proceedings of the Royal Society of Tasmania 135:51-55.
Sigleo, W.R. and Colhoun, E.A. 1981. A short pollen diagram from Crown Lagoon in the Midlands of Tasmania. Papers and Proceedings of the Royal Society of Tasmania 115:181-188.
Sikes, E.L., Howard, W.R., Samson, C.R., Mahan, T.S., Robertson, I.G. and Volkman, J.K. 2009. Southern Ocean seasonal temperature and Subtropical Front movement on the South Tasman Rise in the late Quaternary. Palaeoceanography 24:PA2201, doi:10.1029/2008/PA001659.
Specht, R.L. 1970. Vegetation. In: Leeper, G.W. (ed), The Australian Environment (4th edition). CSIRO, Melbourne University Press.
Stern, N. and Marshall, B. 1993. Excavations at Mackintosh 90/1: A discussion of stratigraphy, chronology and site information. Archaeology in Oceania 28:183-192.
Stone, T. and Everett, A. 2010. Interim report on the Jordan River levee excavation. pp. 1-75. CHMA, 22 Queen Street, Sandy Bay, Tasmania 7005.
Stuvier M. and Reimer P.J. 1993. Extended 14C data base and revised CALIB 3.0 14C age calibration. Radiocarbon 35:215-230.
Thomas, I. 1992. The Holocene archaeology and palaeoecology of northeastern Tasmania, Australia. Unpublished PhD thesis, University of Tasmania, Hobart.
Thomas, I. 1995. Where have all the forests gone? New pollen evidence from Melaleuca Inlet in southwestern Tasmania. In: Dixon, G. and Aitkin, D. (eds), Institute of Australian Geographers 1993 Conference Proceedings. pp. 295-301.
Thomas, I. 1996. Environmental changes in northeast Tasmania during the Holocene. Records of the Queen Victoria Museum and Art Gallery, Launceston 103:73-78.
Thomas, I. and Hope, G. 1994. An example of Holocene vegetation stability from Camerons Lagoon, a near treeline site on the Central Plateau, Tasmania. Australian Journal of Ecology 19:150-158.
Tüxen, R. 1956. Die heutige potentielle natürliche Vegetation als Gegenstand der
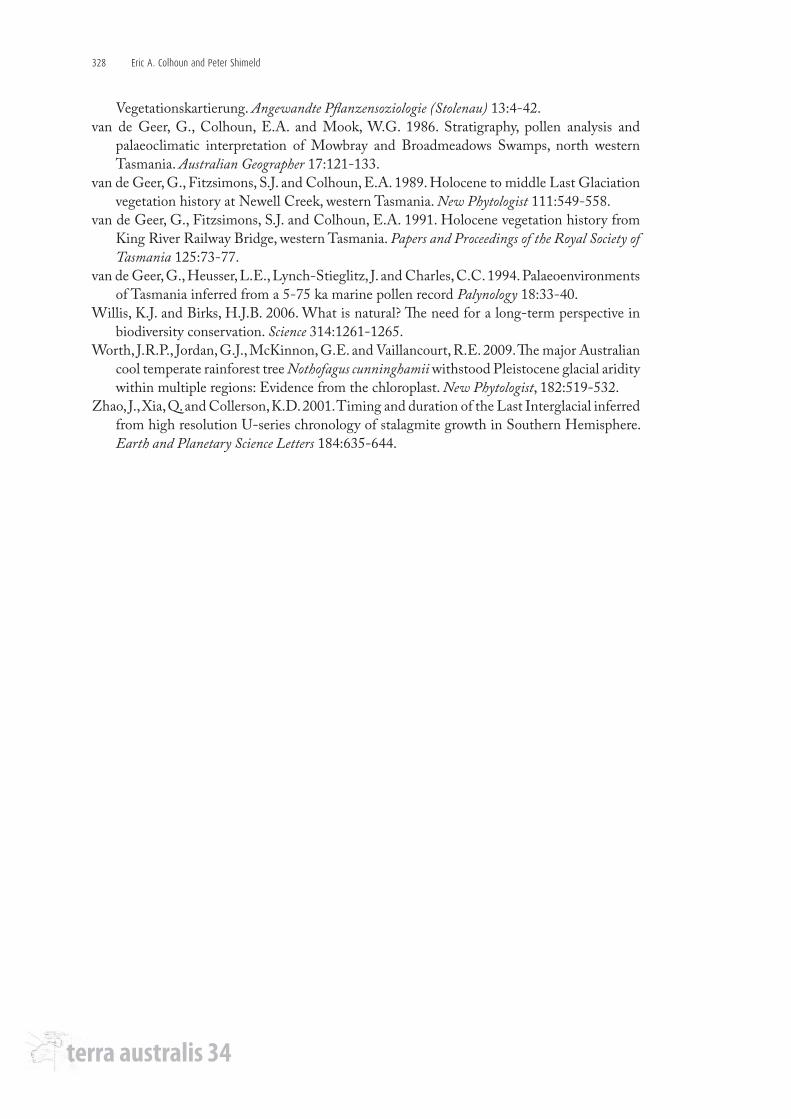
terra australis 34
Eric A. Colhoun and Peter Shimeld328
Vegetationskartierung. Angewandte Pflanzensoziologie (Stolenau) 13:4-42.van de Geer, G., Colhoun, E.A. and Mook, W.G. 1986. Stratigraphy, pollen analysis and
palaeoclimatic interpretation of Mowbray and Broadmeadows Swamps, north western Tasmania. Australian Geographer 17:121-133.
van de Geer, G., Fitzsimons, S.J. and Colhoun, E.A. 1989. Holocene to middle Last Glaciation vegetation history at Newell Creek, western Tasmania. New Phytologist 111:549-558.
van de Geer, G., Fitzsimons, S.J. and Colhoun, E.A. 1991. Holocene vegetation history from King River Railway Bridge, western Tasmania. Papers and Proceedings of the Royal Society of Tasmania 125:73-77.
van de Geer, G., Heusser, L.E., Lynch-Stieglitz, J. and Charles, C.C. 1994. Palaeoenvironments of Tasmania inferred from a 5-75 ka marine pollen record Palynology 18:33-40.
Willis, K.J. and Birks, H.J.B. 2006. What is natural? The need for a long-term perspective in biodiversity conservation. Science 314:1261-1265.
Worth, J.R.P., Jordan, G.J., McKinnon, G.E. and Vaillancourt, R.E. 2009. The major Australian cool temperate rainforest tree Nothofagus cunninghamii withstood Pleistocene glacial aridity within multiple regions: Evidence from the chloroplast. New Phytologist, 182:519-532.
Zhao, J., Xia, Q. and Collerson, K.D. 2001. Timing and duration of the Last Interglacial inferred from high resolution U-series chronology of stalagmite growth in Southern Hemisphere. Earth and Planetary Science Letters 184:635-644.