1390 identification of prognostic factors using quantitative image analysis of her2 expression.pdf...
DESCRIPTION
Schmidt G, Binnig G, Feuchtinger A, Walch A : Identification of Prognostic Factors using Quantitative Image Analysis of HER2 Expression by Immunohistochemistry (IHC) in Adenocarcinoma of the Esophagogastric Junction Background: Since adenocarcinoma of the oesophagogastric junction is known to show human epidermal growth factor receptor 2 (HER2) overexpression we investigated the potential of IHC stained cancer tissue to provide information about disease free (DFS) and overall survival (OS) times. We compare the prognostic value of a visually assessed scoring algorithm derived from Dako HercepTestTM with results provided by data mining information from quantitative image analysis. Methods: Three tissue microarrays (TMAs) comprising 391 cores from tissue samples of 150 patients were analysed. After IHC staining with HER2 antibody the TMAs were scanned with Zeiss MIRAX slide scanner (20x objective). Fully automated image analysis using the Definiens Cognition Network Technology® segmented and classified cells, nuclei, cytoplasm and membrane objects, and determined on a per cell basis shape, texture and color properties. Those were correlated with known DFS/OS times using a multivariate regression analysis within the R statistical software. Based on this predictive model, the patient population was divided in one group with good and one with poor prognosis by imposing a threshold on the predicted survival times. The corresponding groups obtained by the pathologist scoring were HER2 score 0, 1+, 2+ versus HER2 score 3+. Result: Kaplan-Meier Analysis revealed a significant (DFS: p < 2.4x10⁻⁶; OS: p < 2.5x10⁻⁷) prognostic value for the two groups generated by data mining image analysis results, whereas the visually assessed score was not significant (p>0.1). Conclusion: Data mining quantitative image analysis may provide a more accurate evaluation of HER2 evaluation than a visual assessment of tissue samples. The quantification of HER2 overexpression by image analysis may be also highly valuable for the prediction of anti-HER2 therapy in combating this cancer type. (Presentation given at the 52nd Symposium of the Society for Histochemistry, Prague, Sept 1 - 4)TRANSCRIPT

Identification of Prognostic Factors using Quantitative Image Analysis of HER2 Expression by Immunohistochemistry (IHC) in Adenocarcinoma of the Esophagogastric Junction
Günter Schmidt, Gerd Binnig
Definiens AG München
Annette Feuchtinger, Axel Walch
Pathology, HelmholtzZentrum München
52nd Symposium of the Society for Histochemistry
Prague, 1 - 4 September 2010

Study Overview
Surgical Resection Prognostic factor performance Klinikum Rechts der Isar, TU Munich Definiens AG; Biomathematics and
Biometry, Helmholtz Zentrum
Visual HER2 scoring by pathologist Pathology, Helmholtz Zentrum
Illustration
Image: University of California, 1919
Tissue IHC staining and
image acquisition Pathology, Helmholtz Zentrum
Definiens Developer XD, 2010
Quantitative image analysis Definiens AG
Slide - 2

Slide 3
Data: Tissue Micro Arrays of Biopsy Tissue Sections
132 cancer patients �
390 tissue cores on 3 TMAs �
HER2 (human epidermal �growth factor receptor 2)
� Membrane protein
� Known to indicate
aggressive cancer subtypes
-

Pathologist Score 3+ Score depends an membrane staining intensity, staining completeness,
and percentage of stained tumor cells
5x
20x
Slide - 4

Slide - 5
Pathologist Score 2+

Slide - 6
Pathologist Score 1+

Slide - 7
Pathologist Score 0

Pathologist Score As Prognostic Factor Score 0, 1+, 2+ versus 3+
Disease Free Survival Overall Survival
Slide - 8
Slide 9
-
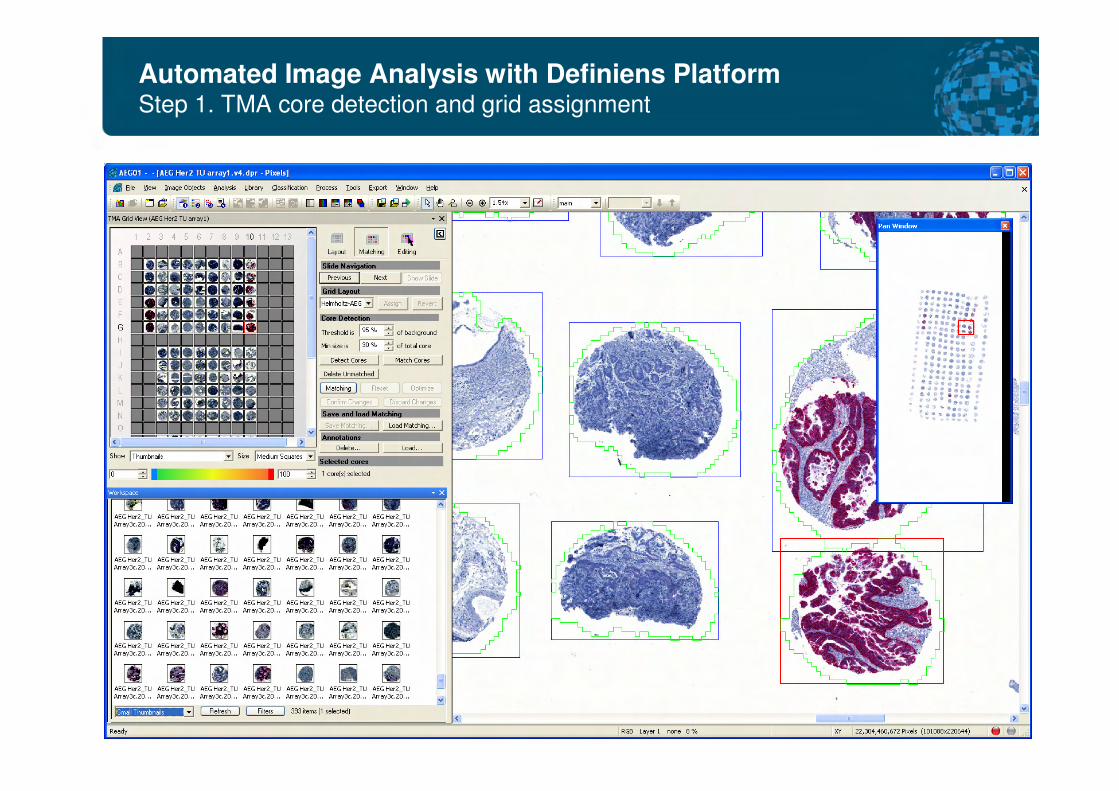
Automated Image Analysis with Definiens Platform Step 1. TMA core detection and grid assignment

Slide 10
-
Automated Image Analysis with Definiens Platform Step 2. Cell and cell compartment segmentation and classification

Slide 11
-
Multi-hierarchical Segmentation: Cells

Slide 12
-
Multi-hierarchical Segmentation: Nucleus, Cytoplasm and Membrane

Slide 13
-
Multi-hierarchical Segmentation: Nucleus and Membrane Substructure

Sample Image Analysis Results I
Slide - 14

Sample Image Analysis Results II
Slide - 15

Sample Image Analysis Results III
Slide - 16

Slide 17
-
Quantitative Image Analysis Results
(54) image features Regression Learner Goals
Slide 18
-
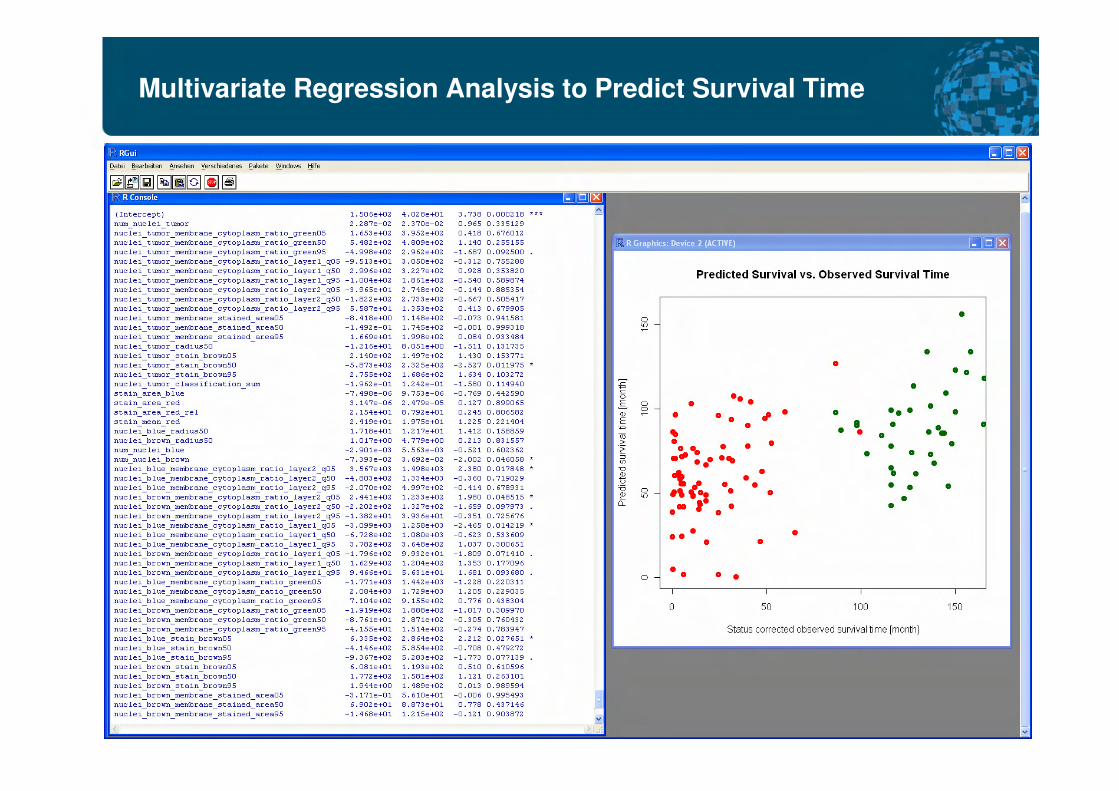
Multivariate Regression Analysis to Predict Survival Time

Use Predicted Disease Free Survival Time as Prognostic Factor Kaplan Meier analysis of disease free survival time
Slide - 19

Use Predicted Overall Survival Time as Prognostic Factor Kaplan Meier analysis of overall survival time
Slide - 20

Disease Free Survival Time Prediction after Feature Space Reduction Kaplan Meier analysis indicates significant prognostic value (2 fold cross validated)
Single object properties �
� cell_brown(q05)*
� cell_brown(q50)
� cell_brown(q95)
Properties of object relations �
� membrane_cytoplasm_ratio_red(q05)
� membrane_cytoplasm_ratio_red(q50)
� membrane_cytoplasm_ratio_red(q95)
� membrane_cytoplasm_ratio_green(q05)
� membrane_cytoplasm_ratio_green(q50)
� membrane_cytoplasm_ratio_green(q95)
(*) q05/50/95 are 5%/50%/95% quantiles of object feature values per core
Slide - 21

Summary
Automated quantitative image analysis �
� Extracts rich set of image object measurements previously not accessible to
biologist / pathologist
� Provides statistically significant prognostics factors
Definiens Cognition Network Technology comprises �
� Context driven segmentation and classification generates multi-hierarchical
network of image objects
� Comprehensible image analysis process
Definiens image analysis platform is �
� Open for integration: image acquisition, algorithms, data bases
� Scalable using distributed, load balanced, computer grid
� See more at www.definiens.com
Slide - 22