137 notes to the financial statements -...
TRANSCRIPT
Notes to the Financial StatementsFor the financial year ended 31 March 2016
These notes form an integral part of and should be read in conjunction with the accompanying financial statements.
1. GENERAL
Singtel is domiciled and incorporated in Singapore and is publicly traded on the Singapore Exchange. The address of
its registered office is 31 Exeter Road, Comcentre, Singapore 239732.
The principal activities of the Company consist of the operation and provision of telecommunications systems and
services, and investment holding. The principal activities of the subsidiaries are disclosed in Note 43.
Under a licence granted by the Infocomm Development Authority of Singapore (“IDA”), the Group had the exclusive
rights to provide fixed national and international telecommunications services through 31 March 2000 (with limited
exceptions) and public cellular mobile telephone services through 31 March 1997. From the expiry of the exclusive rights,
the Group’s licences for these telecommunications services continue on a non-exclusive basis to 31 March 2017.
In addition, the Group is licensed to offer Internet services and has also obtained frequency spectrum and licence rights
from IDA to install, operate and maintain mobile communication systems and services including wireless broadband
systems and services. The Group also holds the requisite licence from the Media Development Authority of Singapore
for the purpose of providing subscription nationwide television services.
In Australia, Optus was granted telecommunication licences under the Telecommunications Act 1991. Pursuant to the
Telecommunications (Transitional Provisions and Consequential Amendments) Act 1997, the licences continued to have
effect after the deregulation of telecommunications in Australia in 1997. The licences do not have a finite term, but are
of continuing operation until cancelled under the Telecommunications Act 1997.
These financial statements were authorised and approved for issue in accordance with a Directors’ resolution dated
11 May 2016.
2. SIGNIFICANT ACCOUNTING POLICIES
2.1 Basis of Accounting
The financial statements are prepared in accordance with Singapore Financial Reporting Standards (“FRS”) including
related interpretations, and the provisions of the Singapore Companies Act. They have been prepared under the
historical cost convention, except as disclosed in the accounting policies below.
Historical cost is generally based on the fair value of the consideration given in exchange for goods and services.
The preparation of financial statements in conformity with FRS requires management to exercise its judgement in the
process of applying the Group’s accounting policies. It also requires the use of accounting estimates and assumptions
that affect the reported amounts of assets and liabilities and disclosure of contingent assets and liabilities at the date
of the financial statements, and the reported amounts of revenues and expenses during the financial year. Although
these estimates are based on management’s best knowledge of current events and actions, actual results may
ultimately differ from those estimates. Critical accounting estimates and assumptions used that are significant to the
financial statements, and areas involving a higher degree of judgement are disclosed in Note 3.
The accounting policies have been consistently applied by the Group, and are consistent with those used in the
previous financial year. The adoption of the new or revised FRS and Interpretations to FRS (“INT FRS”) which were
mandatory from 1 April 2015 had no significant impact on the financial statements of the Group or the Company in
the current financial year.
SINGAPORE TELECOMMUNICATIONS LIMITED 137
Notes to the Financial StatementsFor the financial year ended 31 March 2016
2.2 Group Accounting
The accounting policy for investments in subsidiaries, associates and joint ventures in the Company’s financial
statements is stated in Note 2.4. The Group’s accounting policy on goodwill is stated in Note 2.15.1.
2.2.1 Subsidiaries Subsidiaries are entities (including structured entities) controlled by the Group. Control exists when the Group has
power over the entity, is exposed, or has rights, to variable returns from its involvement with the entity and has
the ability to affect those returns by using its power over the entity. Power is demonstrated through existing rights
that give the Group the ability to direct activities that significantly affect the entity’s returns. The Group reassesses
whether or not it controls an investee if facts and circumstances indicate that there are changes to one or more of
the elements of control listed above. Subsidiaries are consolidated from the date that control commences until the
date that control ceases. All significant inter-company balances and transactions are eliminated on consolidation.
2.2.2 Associates Associates are entities over which the Group has significant influence. Significant influence is the power to participate
in the financial and operating policy decisions of the investee but is not control or joint control over those policies.
Investments in associates are accounted for in the consolidated financial statements using the equity method of
accounting. Equity accounting involves recording the investment in associates initially at cost, and recognising the
Group’s share of the post-acquisition results of associates in the consolidated income statement, and the Group’s
share of post-acquisition reserve movements in reserves. The cumulative post-acquisition movements are adjusted
against the carrying amount of the investments in the consolidated statement of financial position.
In the consolidated statement of financial position, investments in associates include goodwill on acquisition
identified on acquisitions completed on or after 1 April 2001, net of accumulated impairment losses. Goodwill is
assessed for impairment as part of the investment in associates.
When the Group’s share of losses in an associate equals or exceeds its interest in the associate, including loans that
are in fact extensions of the Group’s investment, the Group does not recognise further losses, unless it has incurred
or guaranteed obligations in respect of the associate.
Unrealised gains resulting from transactions with associates are eliminated to the extent of the Group’s interest in
the associate. Unrealised losses are eliminated in the same way as unrealised gains, but only to the extent that there
is no evidence of impairment.
2.2.3 Joint ventures Joint ventures are joint arrangements whereby the parties that have joint control of the arrangement have rights
to the net assets of the joint arrangements. Joint control is the contractually agreed sharing of control of an
arrangement, which exists only when decisions about the relevant activities require unanimous consent of the
parties sharing the control.
The Group’s interest in joint ventures is accounted for in the consolidated financial statements using the equity
method of accounting.
In the consolidated statement of financial position, investments in joint ventures include goodwill on acquisition
identified on acquisitions completed on or after 1 April 2001, net of accumulated impairment losses. Goodwill is
assessed for impairment as part of the investment in joint ventures.
The Group’s interest in its unincorporated joint operations is accounted for by recognising the Group’s assets and
liabilities from the joint operations, as well as expenses incurred by the Group and the Group’s share of income
earned from the joint operations, in the consolidated financial statements.
Unrealised gains resulting from transactions with joint ventures are eliminated to the extent of the Group’s interest
in the joint venture. Unrealised losses are eliminated in the same way as unrealised gains, but only to the extent that
there is no evidence of impairment.
ANNUAL REPORT 2016 138
2.2.4 Dividends from associates and joint ventures Dividends received from an associate or joint venture in excess of the Group’s carrying value of the equity accounted
investee are recognised as dividend income in the income statement where there is no legal or constructive obligation
to refund the dividend nor is there any commitment to provide financial support to the investee. Equity accounting
is then suspended until the investee has made sufficient profits to cover the income previously recognised for the
excess cash distributions.
2.2.5 Structured entity The Trust has been consolidated in the consolidated financial statements under FRS 110, Consolidated Financial
Statements.
2.2.6 Business combinations Business combinations are accounted for using the acquisition method on and after 1 April 2010. The consideration
for each acquisition is measured at the aggregate of the fair values of assets given, liabilities incurred and equity
interests issued by the Group and any contingent consideration arrangement at acquisition date. Acquisition-related
costs, other than those associated with the issue of debt or equity, are expensed as incurred.
Any contingent consideration payable is recognised at fair value at the acquisition date. If the contingent consideration
is classified as equity, it is not re-measured and settlement is accounted for within equity. Otherwise, subsequent
changes to the fair value of the contingent consideration are recognised in the income statement.
For business combinations that are achieved in stages, any existing equity interests in the acquiree entity are re-
measured to their fair values at acquisition date and any changes are taken to the income statement.
Non-controlling interests in subsidiaries represent the equity in subsidiaries which are not attributable, directly
or indirectly, to the shareholders of the Company, and are presented separately in the consolidated statement of
comprehensive income, statement of changes in equity and within equity in the consolidated statement of financial
position. The Group elects for each individual business combination whether non-controlling interests in the
acquiree entity are recognised at fair value, or at the non-controlling interests’ proportionate share of the fair value
of the acquiree entity’s identifiable net assets, at the acquisition date. Total comprehensive income is attributed to
non-controlling interests based on their respective interests in a subsidiary, even if this results in the non-controlling
interests having a debit balance.
Changes in the Group’s interest in subsidiaries that do not result in loss of control are accounted for as equity
transactions.
When the Group loses control of a subsidiary, any interest retained in the former subsidiary is recorded at fair value
with the re-measurement gain or loss recognised in the income statement.
2.3 Share Capital
Ordinary shares are classified as equity. Incremental costs directly attributable to the issuance of new equity shares
are taken to equity as a deduction, net of tax, from the proceeds.
When the Company purchases its own equity share capital, the consideration paid, including any directly attributable
costs, is recognised as ‘Treasury Shares’ within equity. When the shares are subsequently disposed, the realised gains
or losses on disposal of the treasury shares are included in ‘Other Reserves’ of the Company.
The Trust acquires shares in the Company from the open market for delivery to employees upon vesting of
performance shares awarded under Singtel performance share plans. Such shares are designated as ‘Treasury
Shares’. In the consolidated financial statements, the cost of unvested shares, including directly attributable costs, is
recognised as ‘Treasury Shares’ within equity.
Upon vesting of the performance shares, the weighted average costs of the shares delivered to employees,
whether held by the Company or the Trust, are transferred to ‘Capital Reserve’ within equity in the consolidated
financial statements.
Notes to the Financial StatementsFor the financial year ended 31 March 2016
SINGAPORE TELECOMMUNICATIONS LIMITED 139
2.4 Investments in Subsidiaries, Associates and Joint Ventures
In the Company’s statement of financial position, investments in subsidiaries, associates and joint ventures, including
loans that meet the definition of equity instruments, are stated at cost less accumulated impairment losses. Where
an indication of impairment exists, the carrying amount of the investment is assessed and written down immediately
to its recoverable value. On disposal of investments in subsidiaries, associates and joint ventures, the difference
between the net disposal proceeds and the carrying amount of the investment is recognised in the income statement
of the Company.
2.5 Investments
Purchases and sales of investments are recognised on trade date, which is the date that the Group commits to
purchase or sell the investment.
2.5.1 Available-for-sale (“AFS”) investments AFS investments are initially recognised at fair value plus directly attributable transaction costs.
They are subsequently stated at fair value at the end of the reporting period, with all resulting gains and losses,
including currency translation differences, taken to the ‘Fair Value Reserve’ within equity. AFS investments for which
fair values cannot be reliably determined are stated at cost less accumulated impairment losses.
When AFS investments are sold or impaired, the accumulated fair value adjustments in the ‘Fair Value Reserve’ are
included in the income statement.
A significant or prolonged decline in fair value below the cost is objective evidence of impairment. Impairment loss
is computed as the difference between the acquisition cost and current fair value, less any impairment loss
previously recognised in the income statement. Impairment losses recognised in the income statement on equity
investments are not reversed through the income statement until the equity investments are disposed.
2.6 Derivative Financial Instruments and Hedging Activities
Derivative financial instruments are initially recognised at fair value on the date the derivative contract is entered into
and are subsequently re-measured at their fair values at the end of each reporting period.
A derivative financial instrument is carried as an asset when the fair value is positive and as a liability when the fair
value is negative.
Any gains or losses arising from changes in fair value are recognised immediately in the income statement, unless
they qualify for hedge accounting.
2.6.1 Hedge accounting At the inception of a hedge relationship, the Group formally designates and documents the hedge relationship
to which the Group wishes to apply hedge accounting, as well as its risk management objectives and strategy
for undertaking the hedge transactions. The documentation includes identification of the hedging instrument,
the hedged item or transaction, the nature of the risk being hedged and how the entity will assess the hedging
instrument’s effectiveness in offsetting the exposure to changes in the hedged item’s fair value or cash flows
attributable to the hedged risk. Such hedges are expected to be highly effective in achieving offsetting changes
in fair value or cash flows and are assessed on an ongoing basis to determine that they actually have been highly
effective throughout the financial reporting periods for which they are designated.
Notes to the Financial StatementsFor the financial year ended 31 March 2016
ANNUAL REPORT 2016 140

2.6.1 Hedge accounting (Cont’d)
Fair value hedge Designated derivative financial instruments that qualify for fair value hedge accounting are initially recognised at fair
value on the date that the contract is entered into. Changes in fair value of derivatives are recorded in the income
statement together with any changes in the fair value of the hedged items that are attributable to the hedged risks.
Hedge accounting is discontinued when the Group revokes the hedging relationship, the hedging instrument expires
or is sold, terminated, or exercised, or no longer qualifies for hedge accounting. The adjustment to the carrying
amount of the hedged item arising from the hedged risk is amortised to the income statement from that date.
Cash flow hedge The effective portion of changes in the fair value of the designated derivative financial instruments that qualify
as cash flow hedges are recognised in ‘Other Comprehensive Income’. The gain or loss relating to the ineffective
portion is recognised immediately in the income statement. Amounts accumulated in the ‘Hedging Reserve’ are
transferred to the income statement in the periods when the hedged items affect the income statement.
Hedge accounting is discontinued when the Group revokes the hedging relationship, the hedging instrument expires
or is sold, terminated, or exercised, or no longer qualifies for hedge accounting. Any cumulative gain or loss deferred
in equity at that time remains in equity and is recognised when the forecast transaction is ultimately recognised in
the income statement. When a forecast transaction is no longer expected to occur, the cumulative gain or loss that
was deferred in equity is recognised immediately in the income statement.
Net investment hedge Changes in the fair value of designated derivatives that qualify as net investment hedges, and which are highly
effective, are recognised in ‘Other Comprehensive Income’ in the consolidated financial statements and the amounts
accumulated in ‘Currency Translation Reserve’ are transferred to the consolidated income statement in the period
when the foreign operation is disposed.
In the Company’s financial statements, the gain or loss on the financial instrument used to hedge a net investment
in a foreign operation of the Group is recognised in the income statement.
The Group has entered into the following derivative financial instruments to hedge its risks, namely -
Cross currency swaps and interest rate swaps are fair value hedges for the interest rate risk and cash flow hedges for
the currency risk arising from the Group’s issued bonds. The swaps involve the exchange of principal and floating or
fixed interest receipts in the foreign currency in which the issued bonds are denominated, for principal and floating
or fixed interest payments in the Group’s functional currency.
Certain cross currency swaps relate to net investment hedges for the foreign currency exchange risk on the Group’s
Australia operations.
Forward foreign exchange contracts are cash flow hedges for the Group’s exposure to foreign currency exchange
risks arising from forecasted or committed expenditure.
Notes to the Financial StatementsFor the financial year ended 31 March 2016
SINGAPORE TELECOMMUNICATIONS LIMITED 141
2.7 Fair Value Estimation of Financial Instruments
Fair value is the price that would be received to sell an asset or paid to transfer a liability in an orderly transaction
between market participants at the measurement date, regardless of whether that price is directly observable or
estimated using another valuation technique. In estimating the fair value of an asset or a liability, the Group takes
into account the characteristics of the asset or liability which market participants would take into account when
pricing the asset or liability at the measurement date.
The following methods and assumptions are used to estimate the fair value of each class of financial instrument –
Bank balances, receivables and payables, current borrowings The carrying amounts approximate fair values due to the relatively short term maturity of these instruments.
Quoted and unquoted investments The fair value of investments traded in active markets is based on the market quoted mid-price (average of offer and
bid price) or the mid-price quoted by the market maker at the close of business at the end of the reporting period.
The fair values of unquoted investments are determined by using valuation techniques. These include the use of
recent arm’s length transactions, reference to the net asset values of the investee companies or discounted cash
flow analysis.
Cross currency and interest rate swaps The fair value of a cross currency or an interest rate swap is the estimated amount that the swap contract can be
exchanged for or settled with under normal market conditions. This fair value can be estimated using the discounted
cash flow method where the future cash flows of the swap contract are discounted at the prevailing market foreign
exchange rates and interest rates. Market interest rates are actively quoted interest rates or interest rates computed
by applying techniques to these actively quoted interest rates.
Forward foreign currency contracts The fair value of forward foreign exchange contracts is determined using forward exchange market rates for
contracts with similar maturity profiles at the end of the reporting period.
Non-current borrowings For disclosure purposes, the fair values of non-current borrowings which are traded in active markets are based on
the market quoted ask price. For other non-current borrowings, the fair values are based on valuations provided by
service providers or estimated by discounting the future contractual cash flows using discount rates based on the
borrowing rates which the Group expects would be available at the end of the reporting period.
2.8 Financial Guarantee Contracts
Financial guarantees issued by the Company prior to 1 April 2010 are recorded initially at fair values plus transactions
costs and amortised in the income statement over the period of the guarantee. Financial guarantees issued by the
Company on or after 1 April 2010 are directly charged to the subsidiary as guarantee fees based on fair values.
2.9 Trade and Other Receivables
Trade and other receivables, including loans given by the Company to subsidiaries, associates and joint ventures,
are recognised initially at fair values and, other than those that meet the definition of equity instruments, are
subsequently measured at amortised cost using the effective interest method, less allowance for impairment.
An allowance for impairment of trade and other receivables is established when there is objective evidence that
the Group will not be able to collect all amounts due according to the original terms of the debts. Loss events
include financial difficulty or bankruptcy of the debtor, significant delay in payments and breaches of contracts. The
impairment loss, measured as the difference between the debt’s carrying amount and the present value of estimated
future cash flows discounted at the original effective interest rate, is recognised in the income statement. When
the debt becomes uncollectible, it is written off against the allowance account. Subsequent recoveries of amounts
previously written off are recognised in the income statement.
Notes to the Financial StatementsFor the financial year ended 31 March 2016
ANNUAL REPORT 2016 142
2.10 Trade and Other Payables
Trade and other payables are initially recognised at fair value and subsequently measured at amortised cost using the
effective interest method.
2.11 Borrowings
Borrowings are initially recognised at fair value of the consideration received less directly attributable transaction
costs. After initial recognition, unhedged borrowings are subsequently stated at amortised cost using the effective
interest method. Hedged borrowings are accounted for in accordance with the accounting policies set out in
Note 2.6.1.
2.12 Cash and Cash Equivalents
For the purpose of the consolidated statement of cash flows, cash and cash equivalents comprise cash on hand,
balances with banks and fixed deposits with original maturity of mainly three months or less, net of bank overdrafts
which are repayable on demand and which form an integral part of the Group’s cash management.
Bank overdrafts are included under borrowings in the statement of financial position.
2.13 Foreign Currencies
2.13.1 Functional and presentation currency Items included in the financial statements of each entity in the Group are measured using the currency of the
primary economic environment in which the entity operates (the “functional currency”). The statement of financial
position and statement of changes in equity of the Company and consolidated financial statements of the Group
are presented in Singapore Dollar, which is the functional and presentation currency of the Company and the
presentation currency of the Group.
2.13.2 Transactions and balances Transactions in a currency other than the functional currency (“foreign currency”) are translated into the functional
currency at the exchange rates prevailing at the date of the transactions. Monetary assets and liabilities denominated
in foreign currencies at the end of the reporting period are translated at exchange rates ruling at that date. Foreign
exchange differences arising from translation are recognised in the income statement.
2.13.3 Translation of foreign operations’ financial statements In the preparation of the consolidated financial statements, the assets and liabilities of foreign operations are
translated to Singapore Dollar at exchange rates ruling at the end of the reporting period except for share capital
and reserves which are translated at historical rates of exchange (see Note 2.13.4 for translation of goodwill and fair
value adjustments).
Income and expenses in the income statement are translated using either the average exchange rates for the month
or year, which approximate the exchange rates at the dates of the transactions. All resulting translation differences
are taken directly to ‘Other Comprehensive Income’.
On loss of control of a subsidiary, loss of significant influence of an associate or loss of joint control of a joint
venture, the accumulated translation differences relating to that foreign operation are reclassified from equity to the
consolidated income statement as part of gain or loss on disposal.
On partial disposal where there is no loss of control of a subsidiary, the accumulated translation differences relating
to the disposal are reclassified to non-controlling interests. For partial disposals of associates or joint ventures, the
accumulated translation differences relating to the disposal are taken to the consolidated income statement.
Notes to the Financial StatementsFor the financial year ended 31 March 2016
SINGAPORE TELECOMMUNICATIONS LIMITED 143
2.13.4 Translation of goodwill and fair value adjustments Goodwill and fair value adjustments arising on the acquisition of foreign entities completed on or after 1 April 2005
are treated as assets and liabilities of the foreign entities and are recorded in the functional currencies of the foreign
entities and translated at the exchange rates prevailing at the end of the reporting period. However, for acquisitions
of foreign entities completed prior to 1 April 2005, goodwill and fair value adjustments continue to be recorded at
the exchange rates at the respective dates of the acquisitions.
2.13.5 Net investment in a foreign entity The exchange differences on loans from the Company to its subsidiaries, associates or joint ventures which form
part of the Company’s net investment in the subsidiaries, associates or joint ventures are included in ‘Currency
Translation Reserve’. On disposal of the foreign entity, the accumulated exchange differences deferred in the
‘Currency Translation Reserve’ are reclassified to the consolidated income statement in a similar manner as described
in Note 2.13.3.
2.14 Provisions
A provision is recognised when there is a present legal or constructive obligation as a result of past events, it is
probable that an outflow of resources embodying economic benefits will be required to settle the obligation, and a
reliable estimate can be made of the amount of the obligation. No provision is recognised for future operating losses.
The provision for liquidated damages in respect of information technology contracts is made based on management’s
best estimate of the anticipated liability.
Provisions are reviewed at the end of each reporting period and adjusted to reflect the current best estimate.
2.15 Intangible Assets
2.15.1 Goodwill Goodwill on acquisition of subsidiaries on and after 1 April 2010 represents the excess of the consideration
transferred, the recognised amount of any non-controlling interest in the acquiree entity and the fair value of any
previous equity interest in the acquiree entity over the fair value of the net identifiable assets acquired, including
contingent liabilities, at the acquisition date. Such goodwill is recognised separately as intangible asset and stated at
cost less accumulated impairment losses.
Acquisitions completed prior to 1 April 2001 Goodwill on acquisitions of subsidiaries, associates and joint ventures completed prior to 1 April 2001 had been
adjusted in full against ‘Other Reserves’ within equity. Such goodwill has not been retrospectively capitalised
and amortised.
The Group also had acquisitions where the costs of acquisition were less than the fair value of identifiable net assets
acquired. Such differences (negative goodwill) were adjusted against ‘Other Reserves’ in the year of acquisition.
Goodwill which has been previously taken to ‘Other Reserves’, is not taken to income statement when the entity is
disposed of or when the goodwill is impaired.
Notes to the Financial StatementsFor the financial year ended 31 March 2016
ANNUAL REPORT 2016 144
2.15.1 Goodwill (Cont’d)
Acquisitions completed on or after 1 April 2001 Prior to 1 April 2004, goodwill on acquisitions of subsidiaries, associates and joint ventures completed on or after
1 April 2001 was capitalised and amortised on a straight-line basis in the consolidated income statement over its
estimated useful life of up to 20 years. In addition, goodwill was assessed for indications of impairment at the end of
each reporting period.
Since 1 April 2004, goodwill is no longer amortised but is tested annually for impairment or whenever there is an
indication of impairment (see Note 2.16). The accumulated amortisation for goodwill as at 1 April 2004 had been
eliminated with a corresponding decrease in the capitalised goodwill.
A bargain purchase gain is recognised directly in the consolidated income statement.
Gains or losses on disposal of subsidiaries, associates and joint ventures include the carrying amount of capitalised
goodwill relating to the entity sold.
2.15.2 Other intangible assets Expenditure on telecommunication and spectrum licences is capitalised and amortised using the straight-line
method over their estimated useful lives of 4 to 25 years.
Other intangible assets which are acquired in business combinations are carried at fair values at the date of
acquisition, and amortised on a straight-line basis over the period of the expected benefits. Customer relationships
or customer contracts, brand, and technology have estimated useful lives of 4 to 10 years. Other intangible assets
are stated at cost less accumulated amortisation and accumulated impairment losses.
2.16 Impairment of Non-Financial Assets
Goodwill on acquisition of subsidiaries is subject to annual impairment test or is more frequently tested for
impairment if events or changes in circumstances indicate that it might be impaired. Goodwill is not amortised
(see Note 2.15.1).
Other intangible assets of the Group, which have finite useful lives and are subject to amortisation, as well as
property, plant and equipment and investments in subsidiaries, associates and joint ventures, are reviewed at the
end of each reporting period to determine whether there is any indicator for impairment, or whenever events or
changes in circumstances indicate that the carrying amount may not be recoverable. If any such indication exists,
the assets’ recoverable amounts are estimated.
For the purposes of assessing impairment, assets are grouped at the lowest levels for which there are separately
identifiable cash flows (cash-generating units).
An impairment loss is recognised for the amount by which the asset’s carrying amount exceeds its recoverable
amount. The recoverable amount is the higher of the asset’s fair value less costs to sell and value-in-use.
An impairment loss for an asset, other than goodwill on acquisition of subsidiaries, is reversed if, and only if, there
has been a change in the estimates used to determine the asset’s recoverable amount since the last impairment loss
was recognised. Impairment loss on goodwill on acquisition of subsidiaries is not reversed in the subsequent period.
Notes to the Financial StatementsFor the financial year ended 31 March 2016
SINGAPORE TELECOMMUNICATIONS LIMITED 145

2.17 Inventories
Inventories are stated at the lower of cost and net realisable value. Cost is determined on the weighted average
basis. Net realisable value is the estimated selling price in the ordinary course of business, less the estimated cost of
completion and selling expenses.
Work-in-progress is stated at costs less progress payments received and receivable on uncompleted information
technology projects, and fibre rollout. Costs include third party hardware and software costs, direct labour and other
direct expenses attributable to the project activity and associated profits recognised on projects-in-progress.
When it is probable that total contract costs will exceed total contract revenue, the expected loss is recognised as
an expense immediately.
In the consolidated statement of financial position, work-in-progress is included in “Trade and other receivables”,
and the excess of progress billings over work-in-progress is included in “Trade and other payables” as applicable.
2.18 Property, Plant and Equipment
Property, plant and equipment is stated at cost less accumulated depreciation and accumulated impairment
losses, where applicable. The cost of self-constructed assets includes the cost of material, direct labour, capitalised
borrowing costs and an appropriate proportion of production overheads.
Depreciation is calculated on a straight-line basis to write off the cost of the property, plant and equipment over its
expected useful life. Property, plant and equipment under finance lease is depreciated over the shorter of the lease
term or useful life. The estimated useful lives are as follows –
No. of years
Buildings 5 - 40
Transmission plant and equipment 5 - 25
Switching equipment 3 - 10
Other plant and equipment 3 - 20
Other plant and equipment consist mainly of motor vehicles, office equipment, and furniture and fittings.
No depreciation is provided on freehold land, long-term leasehold land with a remaining lease period of more
than 100 years and capital work-in-progress. Leasehold land with a remaining lease period of 100 years or less is
depreciated in equal instalments over its remaining lease period.
In respect of capital work-in-progress, assets are depreciated from the month the asset is completed and ready
for use.
Costs to acquire computer software which are an integral part of the related hardware are capitalised and recognised
as assets and included in property, plant and equipment when it is probable that the costs will generate economic
benefits beyond one year and the costs are associated with identifiable software products which can be reliably
measured by the Group.
Notes to the Financial StatementsFor the financial year ended 31 March 2016
ANNUAL REPORT 2016 146

2.18 Property, Plant and Equipment (Cont’d)
The cost of property, plant and equipment includes expenditure that is directly attributable to the acquisition
of the items. Dismantlement, removal or restoration costs are included as part of the cost if the obligation for
dismantlement, removal or restoration is incurred as a consequence of acquiring or using the asset. Costs may also
include transfers from equity of any gains or losses on qualifying cash flow hedges of foreign currency purchases
of property, plant and equipment. Subsequent expenditure is included in the carrying amount of an asset when it is
probable that future economic benefits, in excess of the originally assessed standard of performance of the existing
asset, will flow to the Group.
The residual values and useful lives of property, plant and equipment are reviewed, and adjusted as appropriate, at
the end of each reporting period.
On disposal of property, plant and equipment, the difference between the disposal proceeds and its carrying value
is taken to the income statement.
2.19 Leases
2.19.1 Finance leases Finance leases are those leasing agreements which effectively transfer to the Group substantially all the risks and
benefits incidental to ownership of the leased items. Assets financed under such leases are treated as if they had
been purchased outright at the lower of fair value and present value of the minimum lease payments and the
corresponding leasing commitments are shown as obligations to the lessors.
Lease payments are treated as consisting of capital repayments and interest elements. Interest is charged to the
income statement over the period of the lease to produce a constant rate of charge on the balance of capital
repayments outstanding.
2.19.2 Operating leases Leases of assets in which a significant portion of the risks and rewards of ownership are retained by the lessor are
classified as operating leases. Operating lease payments are recognised as expenses in the income statement on a
straight-line basis over the period of the lease.
2.19.3 Sales of network capacity Sales of network capacity are accounted as finance leases where –
(i) the purchaser’s right of use is exclusive and irrevocable;
(ii) the asset is specific and separable;
(iii) the terms of the contract are for the major part of the asset’s economic useful life;
(iv) the attributable costs or carrying value can be measured reliably; and
(v) no significant risks are retained by the Group.
Sales of network capacity that do not meet the above criteria are accounted for as operating leases.
2.19.4 Gains or losses from sale and leaseback Gains on sale and leaseback transactions resulting in finance leases are deferred and amortised over the lease term
on a straight-line basis, while losses are recognised immediately in the income statement.
Gains and losses on sale and leaseback transactions established at fair value which resulted in operating leases are
recognised immediately in the income statement.
Notes to the Financial StatementsFor the financial year ended 31 March 2016
SINGAPORE TELECOMMUNICATIONS LIMITED 147
2.19.5 Capacity swaps The Group may exchange network capacity with other capacity or service providers. The exchange is regarded as a
transaction which generates revenue unless the transaction lacks commercial substance or the fair value of neither
the capacity received nor the capacity given up is reliably measurable.
2.20 Revenue Recognition
Revenue for the Group is recognised based on fair value for sale of goods and services rendered, net of goods and
services tax, rebates and discounts, and after eliminating sales within the Group.
Revenue includes the gross income received and receivable from revenue sharing arrangements entered into with
overseas telecommunication companies in respect of traffic exchanged.
Revenue from subscription contract is recognised ratably over the service, maintenance or subscription period.
For mobile device repayment plans, the consideration is allocated to its separate revenue-generating activities based
on the best estimate of the price of each activity in the arrangement. Handset sales are accounted for in accordance
with the sale of equipment accounting policy (see below) of the Group. As the service credits under the device
repayment plans are provided over time for services, they are recorded as a reduction of subscription revenue.
For prepaid cards which have been sold, provisions for unearned revenue are made for services which have not been
rendered as at the end of the reporting period. Expenses directly attributable to the unearned revenue are deferred
until the revenue is recognised.
Revenue from the sale of equipment is recognised upon the transfer of significant risks and rewards of ownership of
the goods to the customer which generally coincides with delivery and acceptance of the goods sold.
Revenues for system and network installation and integration projects are recognised based on the percentage of
completion of the projects using cost-to-cost basis. Revenues from the rendering of services which involve the
procurement of computer equipment, third party software for installation and information technology professional
service are recognised upon full completion of the projects.
Revenue from sale of perpetual software licenses and the related hardware are recognised when title passes to the
customer, generally upon delivery.
Revenue from digital advertising services and solutions is recognised when advertising services are delivered, and
when digital advertising impressions are delivered or click-throughs occur. Revenue from selling advertising space
is recognised when the advertising space is filled and sold to customers.
Dividend income is recorded gross in the income statement when the right to receive payment is established.
Interest income is recognised on a time proportion basis using the effective interest method.
Rental income from operating leases is recognised on a straight-line basis over the term of the lease.
2.21 Employees’ Benefits
2.21.1 Defined contribution plans Defined contribution plans are post-employment benefit plans under which the Group pays fixed contributions
into separate entities such as the Central Provident Fund. The Group has no legal or constructive obligation to
pay further contributions if any of the funds do not hold sufficient assets to pay all employee benefits relating to
employee services in the current and preceding financial years.
The Group’s contributions to the defined contribution plans are recognised in the income statement as expenses in
the financial year to which they relate.
Notes to the Financial StatementsFor the financial year ended 31 March 2016
ANNUAL REPORT 2016 148

2.21.2 Employees’ leave entitlements Employees’ entitlements to annual leave and long service leave are recognised when they accrue to employees. A
provision is made for the estimated liability of annual leave and long service leave as a result of services rendered by
employees up to the end of the reporting period.
2.21.3 Share-based compensation Performance shares and share options The performance share plans of the Group are accounted for either as equity-settled share-based payments
or cash-settled share-based payments. The share option plans of the subsidiaries are accounted as equity-settled
share-based payments. Equity-settled share-based payments are measured at fair value at the date of grant, whereas
cash-settled share-based payments are measured at current fair value at the end of each reporting period. The
share-based payment expense is amortised and recognised in the income statement on a straight-line basis over
the vesting period.
At the end of each reporting period, the Group revises its estimates of the number of equity instruments that the
participants are expected to receive based on non-market vesting conditions. The difference is charged or credited
to the income statement, with a corresponding adjustment to equity or liability for equity-settled and cash-settled
share-based payments respectively.
The dilutive effects of the Singtel performance share plans are reflected as additional share dilution in the
computation of diluted earnings per share.
2.22 Borrowing Costs
Borrowing costs include interest, amortisation of discounts or premiums relating to borrowings, amortisation
of ancillary costs incurred in arranging borrowings, and finance lease charges. Borrowing costs are generally
expensed as incurred, except to the extent that they are capitalised if they are directly attributable to the acquisition,
construction, or production of a qualifying asset.
2.23 Customer Acquisition and Retention Costs
Customer acquisition and retention costs, including related sales and promotion expenses and activation
commissions, are expensed as incurred.
2.24 Pre-incorporation Expenses
Pre-incorporation expenses are expensed as incurred.
2.25 Government Grants
Grants in recognition of specific expenses are recognised in the income statement over the periods necessary to
match them with the relevant expenses they are intended to compensate. Grants related to depreciable assets are
deferred and recognised in the income statement over the period in which such assets are depreciated and used in
the projects subsidised by the grants.
2.26 Exceptional Items
Exceptional items refer to items of income or expense within the income statement from ordinary activities that are
of such size, nature or incidence that their separate disclosure is considered necessary to explain the performance
for the financial year.
Notes to the Financial StatementsFor the financial year ended 31 March 2016
SINGAPORE TELECOMMUNICATIONS LIMITED 149
2.27 Income Tax
Income tax expense comprises current and deferred tax.
The current tax is based on taxable profit for the year. Taxable profit differs from profit as reported in the income
statement as it excludes items of income or expense that are taxable or deductible in other years and it further
excludes items that are not taxable or tax deductible. The Group’s liability for current tax is calculated using tax rates
(and tax laws) that have been enacted or substantively enacted in countries where the Company and its subsidiaries
operate by, at the end of the reporting period.
Deferred taxation is provided in full, using the liability method, on all temporary differences at the end of the
reporting period between the tax bases of assets and liabilities and their carrying amounts in the financial statements.
However, if the deferred income tax arises from initial recognition of an asset or liability in a transaction other than
a business combination that at the time of the transaction affects neither accounting nor taxable profit or loss, it is
not accounted for. Deferred income tax is also not recognised for goodwill which is not deductible for tax purposes.
The amount of deferred tax provided is based on the expected manner of realisation or settlement of the carrying
amount of assets and liabilities, using tax rates (and laws) enacted or substantively enacted in countries where the
Company and its subsidiaries operate by, at the end of the reporting period.
Deferred tax liabilities are provided on all taxable temporary differences arising on investments in subsidiaries,
associates and joint ventures, except where the timing of the reversal of the temporary difference can be controlled
and it is probable that the temporary difference will not reverse in the foreseeable future.
Deferred tax assets are recognised for all deductible temporary differences and carry forward of unutilised tax losses,
to the extent that it is probable that future taxable profit will be available against which the deductible temporary
differences and carry forward of unused losses can be utilised.
At the end of each reporting period, the Group re-assesses unrecognised deferred tax assets and the carrying
amount of deferred tax assets. The Group recognises a previously unrecognised deferred tax asset to the extent
that it is probable that future taxable profit will allow the deferred tax asset to be recovered. The Group conversely
reduces the carrying amount of a deferred tax asset to the extent that it is no longer probable that sufficient future
taxable profit will be available to allow the benefit of all or part of the deferred tax asset to be utilised.
Current and deferred tax are charged or credited directly to equity if the tax relates to items that are credited or
charged, in the same or different period, directly to equity.
2.28 Dividends
Interim dividends are recorded in the financial year in which they are declared payable. Final dividends are recorded
in the financial year in which the dividends are approved by the shareholders.
2.29 Segment Reporting
An operating segment is identified as the component of the Group that is regularly reviewed by the chief operating
decision maker in order to allocate resources to the segment and to assess its performance.
2.30 Non-current Assets (or Disposal Groups) Held for Sale
Non-current assets (or disposal groups) are classified as assets held for sale and stated at the lower of carrying
amount and fair value less costs to sell if their carrying amounts are recovered principally through sale transactions
rather than through continuing use.
Notes to the Financial StatementsFor the financial year ended 31 March 2016
ANNUAL REPORT 2016 150
3. CRITICAL ACCOUNTING ESTIMATES AND JUDGEMENTS
FRS 1, Presentation Of Financial Statements, requires disclosure of the judgements management has made in the
process of applying the accounting policies that have the most impact on the amounts recognised in the financial
statements. It also requires disclosure about the key assumptions concerning the future, and other key sources
of estimation uncertainty at the end of the reporting period, that have a significant risk of causing a material
adjustment to the carrying amounts of assets and liabilities within the next financial year. The estimates and
assumptions are based on historical experience and other factors that are considered relevant. Actual results may
differ from these estimates
The following presents a summary of the critical accounting estimates and judgements –
3.1 Impairment Reviews
The accounting policies for impairment of non-financial assets are stated in Note 2.16.
During an impairment review, the Group assesses whether the carrying amount of an asset or cash-generating
unit exceeds its recoverable amount. Recoverable amount is defined as the higher of an asset’s or cash generating
unit’s fair value less costs to sell and its value-in-use. In making this judgement, the Group evaluates the value-
in-use which is supported by the net present value of future cash flows derived from such assets using cash flow
projections which have been discounted at an appropriate rate. Forecasts of future cash flows are based on the
Group’s estimates using historical, sector and industry trends, general market and economic conditions, changes in
technology and other available information.
Goodwill recorded by associates and joint ventures is required to be tested for impairment at least annually. The
impairment assessment requires the exercise of significant judgement about future market conditions, including
growth rates and discount rates applicable in a number of markets where the associates and joint ventures operate.
The assumptions used by management to determine the value-in-use calculations of goodwill on acquisition
of subsidiaries are disclosed in Note 23. The carrying values of associates and joint ventures including goodwill
capitalised are stated in Note 21 and Note 22 respectively.
3.2 Impairment of Trade Receivables
The Group assesses at the end of each reporting period whether there is objective evidence that trade receivables
have been impaired. Impairment loss is calculated based on a review of the current status of existing receivables
and historical collections experience. Such provisions are adjusted periodically to reflect the actual and anticipated
experience.
3.3 Estimated Useful Lives of Property, Plant and Equipment
The Group reviews annually the estimated useful lives of property, plant and equipment based on factors such as
business plans and strategies, expected level of usage and future technological developments. It is possible that
future results of operations could be materially affected by changes in these estimates brought about by changes
in the factors mentioned above. A reduction in the estimated useful lives of property, plant and equipment would
increase the recorded depreciation and decrease the carrying value of property, plant and equipment.
3.4 Investment in NetLink Trust
Based on facts and circumstances as disclosed in Note 26, although the Company holds 100% of the units in NetLink
Trust, the Company does not control but has significant influence in the trust in accordance with FRS 28, Investments
in Associates and Joint Ventures. Therefore, NetLink Trust has been accounted for as an associate of the Group.
Notes to the Financial StatementsFor the financial year ended 31 March 2016
SINGAPORE TELECOMMUNICATIONS LIMITED 151
3.5 Taxation
3.5.1 Deferred tax asset The Group reviews the carrying amount of deferred tax asset at the end of each reporting period. Deferred tax asset
is recognised to the extent that it is probable that future taxable profit will be available against which the temporary
differences can be utilised. This involves judgement regarding the future financial performance of the particular
legal entity or tax group in which the deferred tax asset has been recognised.
3.5.2 Income taxes The Group is subject to income taxes in numerous jurisdictions. Judgement is involved in determining the group-
wide provision for income taxes. There are certain transactions and computations for which the ultimate tax
determination is uncertain during the ordinary course of business. The Group recognises liabilities for expected
tax issues based on estimates of whether additional taxes will be due. Where the final outcome of these matters is
different from the amounts that were initially recognised, such differences will impact the income tax and deferred
tax provisions in the period in which such determination is made.
3.6 Fair values of derivative financial instruments
The Group uses valuation techniques to determine the fair values of financial instruments. The valuation techniques
used for different financial instruments are selected to reflect how the market would be expected to price the
instruments, using inputs that reasonably reflect the risk-return factors inherent in the instruments. Depending upon
the characteristics of the financial instruments, observable market factors are available for use in most valuations,
while others involve a greater degree of judgment and estimation.
3.7 Share-based Payments
Equity-settled share-based payments are measured at fair value at the date of grant, whereas cash-settled share-
based payments are measured at current fair value at the end of each reporting period. In addition, the Group revises
the estimated number of equity instruments that participants are expected to receive based on non-market vesting
conditions at the end of each reporting period.
The assumptions of the valuation model used to determine fair values are set out in Note 5.3.
3.8 Contingent Liabilities
The Group consults with its legal counsel on matters related to litigation, and other experts both within and outside
the Group with respect to matters in the ordinary course of business. As at 31 March 2016, the Group was involved
in various legal proceedings where it has been vigorously defending its claims as disclosed in Note 40.
The Group also reported contingent liabilities of its joint ventures. Assessment on whether the risk of loss is remote,
possible or probable requires significant judgement given the complexities involved. The Group’s share of joint
ventures’ contingent liabilities have been disclosed in Note 41.
3.9 Purchase Price Allocation
The Group completed the acquisition of Trustwave in September 2015. Purchase price allocation exercise requires
a significant amount of management estimation, particularly in relation to the identification and valuation of
intangible assets and assignment of their useful lives. The Group’s disclosure on the above is set out in Note 1(a) to
the Consolidated Statement of Cash Flows.
Notes to the Financial StatementsFor the financial year ended 31 March 2016
ANNUAL REPORT 2016 152

4. OPERATING REVENUE
Group
2016S$ Mil
2015S$ Mil
Mobile communications 6,713.5 7,242.3
Data and Internet (1) 3,138.1 3,176.9
Managed services 2,013.6 1,801.0
Business solutions 636.9 603.4
Infocomm Technology 2,650.5 2,404.4
Sale of equipment 1,801.9 1,554.6
National telephone (1) 1,128.1 1,279.5
International telephone 541.9 627.6
Digital businesses 476.2 333.2
Pay television 284.9 301.8
Others 226.1 302.6
Operating revenue 16,961.2 17,222.9
Operating revenue 16,961.2 17,222.9
Other income (see Note 6) 148.3 151.4
Interest and investment income (see Note 10) 95.7 92.4
Total revenue 17,205.2 17,466.7
Note:(1) Comparatives have been reclassified to be consistent with the current year.
5. OPERATING EXPENSES
Group
2016S$ Mil
2015S$ Mil
Selling and administrative costs (1) (2) 3,388.2 3,759.0
Staff costs (2) 2,457.4 2,467.3
Cost of equipment sold 2,224.5 2,147.3
Traffic expenses 2,211.8 2,548.5
Other cost of sales (2) 1,456.1 1,022.2
Repairs and maintenance 358.8 339.3
12,096.8 12,283.6
Notes:(1) Includes mobile and broadband subscriber acquisition and retention costs, supplies and services, as well as rentals of properties and mobile
base stations.(2) Comparatives have been reclassified to be consistent with the current year.
Notes to the Financial StatementsFor the financial year ended 31 March 2016
SINGAPORE TELECOMMUNICATIONS LIMITED 153

5.1 Staff Costs
Group
2016S$ Mil
2015S$ Mil
Staff costs included the following -
Contributions to defined contribution plans 240.9 223.6
Performance share and share option expenses (net)
- equity-settled arrangements 33.2 24.4
- cash-settled arrangements (5.1) 28.3
5.2 Key Management Personnel Compensation
Group
2016S$ Mil
2015S$ Mil
Key management personnel compensation (1)
Executive director (2) 6.4 5.6
Other key management personnel (3) 11.3 10.4
17.7 16.0
Directors’ remuneration (4) 2.6 2.5
20.3 18.5
Notes:(1) Comprise base salary, annual wage supplement, bonus, contributions to defined contribution plans and other benefits, but exclude performance
share and share option expenses disclosed below. (2) The Group Chief Executive Officer, an executive director of Singtel, was awarded up to 1,743,040 (2015: 1,524,760) ordinary shares of Singtel
pursuant to Singtel performance share plans during the year, subject to certain performance criteria including other terms and conditions being met. The performance share expense computed in accordance with FRS 102, Share-based Payment, was S$1.7 million (2015: S$6.0 million).
(3) The other key management personnel of the Group comprise the Group Chief Corporate Officer, the Chief Executive Officer of Consumer Australia and the Chief Executive Officer of Group Enterprise.
The other key management personnel were awarded up to 2,216,951 (2015: 1,939,323) ordinary shares of Singtel pursuant to Singtel performance share plans during the year, subject to certain performance criteria including other terms and conditions being met. The performance share expense computed in accordance with FRS 102, Share-based Payment, was S$2.1 million (2015: S$7.5 million).
(4) Directors’ remuneration comprised the following:
(i) Directors’ fees of S$2.6 million (2015: S$2.5 million), including fees paid to certain directors in their capacities as members of Optus Advisory Committee and Technology Advisory Panel, and director of Singtel Innov8 Pte. Ltd.
(ii) Car-related benefits of Chairman of S$21,879 (2015: S$18,089).
In addition to the directors’ remuneration, Venkataraman Vishnampet Ganesan, a non-executive director of Singtel, was awarded 750,718 (2015: Nil) of share options pursuant to the Amobee LTI Plan during the year, subject to certain terms and conditions being met. The share option expense computed in accordance with FRS 102, Share-based Payment, was S$0.1 million (2015: Nil).
Notes to the Financial StatementsFor the financial year ended 31 March 2016
ANNUAL REPORT 2016 154

5.3 Share-based Payments
5.3.1 Performance share plans
With effect from 1 April 2012, Restricted Share Awards and Performance Share Awards are given to selected
employees of Singtel and its subsidiaries. The awards are conditional upon the achievement of predetermined
performance targets over the performance period, which is two years for the Restricted Share Awards and three
years for the Performance Share Awards. Both awards are generally settled by delivery of Singtel shares, with the
awards for certain senior employees to be settled by Singtel shares or cash, at the option of the recipient.
Additionally, early vesting of the performance shares can also occur under special circumstances approved by
the Executive Resource and Compensation Committee such as retirement, redundancy, illness and death while in
employment.
Though the performance shares are awarded by Singtel, the respective subsidiaries bear all costs and expenses in
any way arising out of, or connected with, the grant and vesting of the awards to their employees.
The fair values of the performance shares are estimated using a Monte-Carlo simulation methodology at the
measurement dates, which are the grant value dates for equity-settled awards, and at the end of the reporting
period for cash-settled awards.
Restricted Share Awards The movements of the number of performance shares for the Restricted Share Awards during the financial year were
as follows –
Group and Company 2016
Outstanding as at
1 April 2015 ‘000
Granted ‘000
Awarded from targets
exceeded ‘000
Vested ‘000
Cancelled ‘000
Outstanding as at
31 March 2016 ‘000
Date of grant
FY 2013 (1)
26 June 2012 4,164 – – (4,068) (96) – October 2012 to March 2013 67 – – (67) – –
FY 2014 21 June 2013 4,239 – 1,227 (2,707) (277) 2,482 September 2013 to March 2014 12 – 4 (8) – 8
FY 2015 23 June 2014 5,073 – 1 (72) (488) 4,514 September 2014 to March 2015 45 – – – (31) 14
FY 2016 17 June 2015 – 4,338 – (7) (338) 3,993 September 2015 to March 2016 – 30 – – – 30
13,600 4,368 1,232 (6,929) (1,230) 11,041
Note: (1) “FY2013” denotes financial year ended 31 March 2013.
Notes to the Financial StatementsFor the financial year ended 31 March 2016
SINGAPORE TELECOMMUNICATIONS LIMITED 155
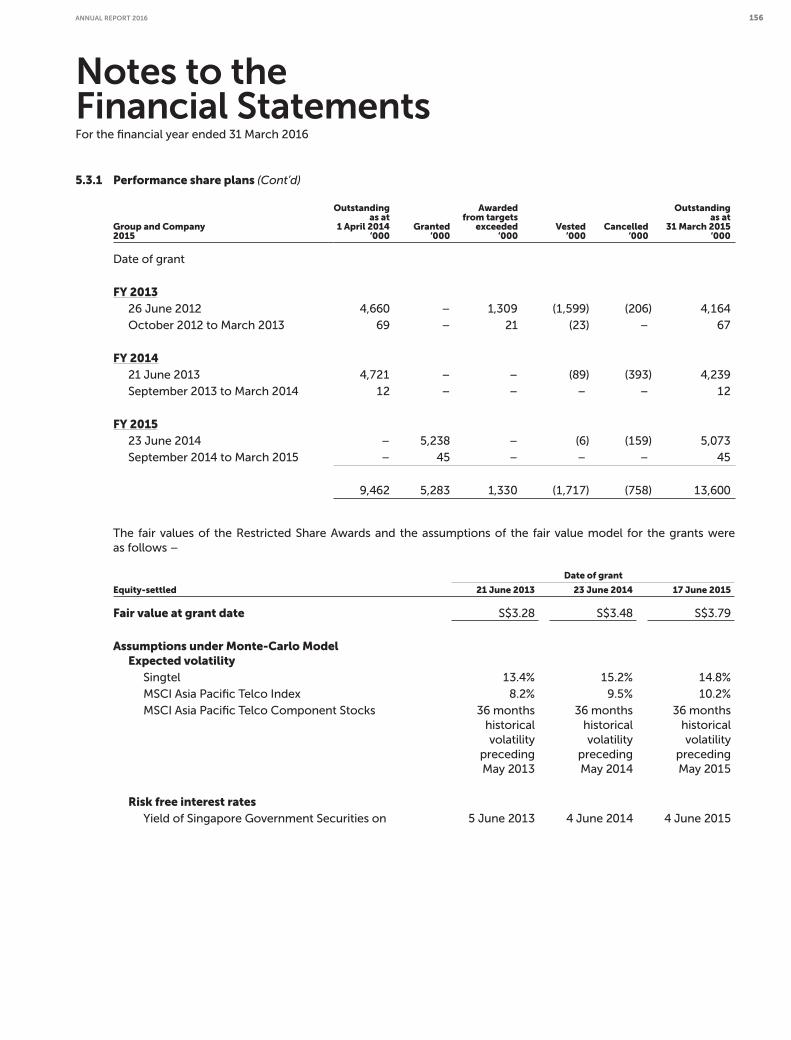
5.3.1 Performance share plans (Cont’d)
Group and Company 2015
Outstanding as at
1 April 2014 ‘000
Granted ‘000
Awarded from targets
exceeded ‘000
Vested ‘000
Cancelled ‘000
Outstanding as at
31 March 2015 ‘000
Date of grant
FY 2013 26 June 2012 4,660 – 1,309 (1,599) (206) 4,164
October 2012 to March 2013 69 – 21 (23) – 67
FY 2014 21 June 2013 4,721 – – (89) (393) 4,239
September 2013 to March 2014 12 – – – – 12
FY 2015 23 June 2014 – 5,238 – (6) (159) 5,073
September 2014 to March 2015 – 45 – – – 45
9,462 5,283 1,330 (1,717) (758) 13,600
The fair values of the Restricted Share Awards and the assumptions of the fair value model for the grants were
as follows –
Date of grant
Equity-settled 21 June 2013 23 June 2014 17 June 2015
Fair value at grant date S$3.28 S$3.48 S$3.79
Assumptions under Monte-Carlo Model Expected volatility Singtel 13.4% 15.2% 14.8%
MSCI Asia Pacific Telco Index 8.2% 9.5% 10.2%
MSCI Asia Pacific Telco Component Stocks 36 months
historical
volatility
preceding
May 2013
36 months
historical
volatility
preceding
May 2014
36 months
historical
volatility
preceding
May 2015
Risk free interest rates Yield of Singapore Government Securities on 5 June 2013 4 June 2014 4 June 2015
Notes to the Financial StatementsFor the financial year ended 31 March 2016
ANNUAL REPORT 2016 156

5.3.1 Performance share plans (Cont’d)
Cash-settled 2016
Date of grant
21 June 2013 23 June 2014 17 June 2015
Fair value at 31 March 2016 S$3.82 S$3.73 S$3.55
Assumptions under Monte-Carlo Model Expected volatility Singtel 16.0% 16.0% 16.0%
MSCI Asia Pacific Telco Index 11.4% 11.4% 11.4%
MSCI Asia Pacific Telco Component Stocks 36 months historical volatility
preceding March 2016
Risk free interest rates Yield of Singapore Government Securities on 31 March 2016 31 March 2016 31 March 2016
Cash-settled 2015
Date of grant
26 June 2012 21 June 2013 23 June 2014
Fair value at 31 March 2015 S$4.38 S$4.29 S$4.11
Assumptions under Monte-Carlo Model Expected volatility Singtel 15.2% 15.2% 15.2%
MSCI Asia Pacific Telco Index 10.6% 10.6% 10.6%
MSCI Asia Pacific Telco Component Stocks 36 months historical volatility
preceding March 2015
Risk free interest rates Yield of Singapore Government Securities on 31 March 2015 31 March 2015 31 March 2015
Notes to the Financial StatementsFor the financial year ended 31 March 2016
SINGAPORE TELECOMMUNICATIONS LIMITED 157

5.3.1 Performance share plans (Cont’d)
Performance Share Awards The movements of the number of performance shares for the Performance Share Awards during the financial year
were as follows –
Group and Company 2016
Outstanding as at
1 April 2015 ‘000
Granted ‘000
Vested ‘000
Cancelled ‘000
Outstanding as at
31 March 2016 ‘000
Date of grant
FY 2013 26 June 2012 6,814 – (6,795) (19) – October 2012 to March 2013 157 – (157) – –
FY 2014 21 June 2013 8,410 – – (97) 8,313 September 2013 to March 2014 15 – – – 15
FY 2015 23 June 2014 8,314 – – (145) 8,169 September 2014 to March 2015 235 – – (214) 21
FY 2016 17 June 2015 – 9,311 – (90) 9,221 September 2015 to March 2016 – 157 – – 157
23,945 9,468 (6,952) (565) 25,896
Group and Company 2015
Outstanding as at
1 April 2014 ‘000
Granted ‘000
Vested ‘000
Cancelled ‘000
Outstanding as at
31 March 2015 ‘000
Date of grant
FY 2013 26 June 2012 7,058 – (40) (204) 6,814
October 2012 to March 2013 157 – – – 157
FY 2014 21 June 2013 9,186 – (8) (768) 8,410
September 2013 to March 2014 15 – – – 15
FY 2015 23 June 2014 – 8,528 – (214) 8,314
September 2014 to March 2015 – 235 – – 235
16,416 8,763 (48) (1,186) 23,945
Notes to the Financial StatementsFor the financial year ended 31 March 2016
ANNUAL REPORT 2016 158
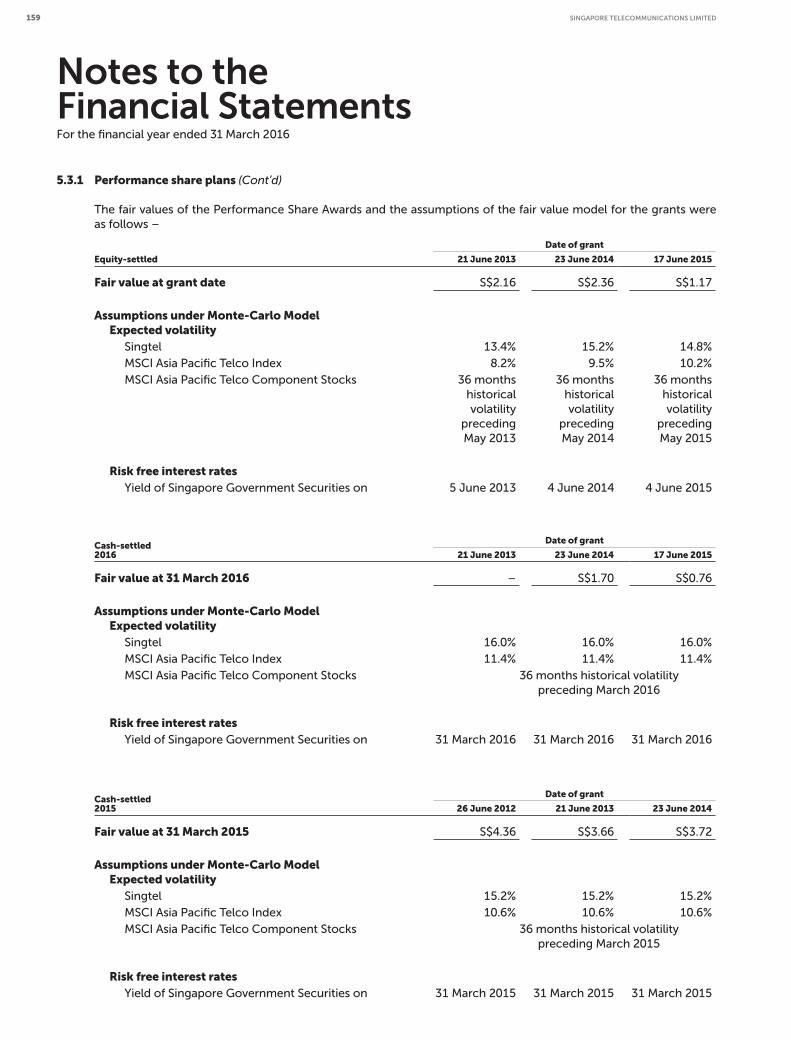
5.3.1 Performance share plans (Cont’d)
The fair values of the Performance Share Awards and the assumptions of the fair value model for the grants were
as follows –
Date of grant
Equity-settled 21 June 2013 23 June 2014 17 June 2015
Fair value at grant date S$2.16 S$2.36 S$1.17
Assumptions under Monte-Carlo Model Expected volatility Singtel 13.4% 15.2% 14.8%
MSCI Asia Pacific Telco Index 8.2% 9.5% 10.2%
MSCI Asia Pacific Telco Component Stocks 36 months
historical
volatility
preceding
May 2013
36 months
historical
volatility
preceding
May 2014
36 months
historical
volatility
preceding
May 2015
Risk free interest rates Yield of Singapore Government Securities on 5 June 2013 4 June 2014 4 June 2015
Cash-settled 2016
Date of grant
21 June 2013 23 June 2014 17 June 2015
Fair value at 31 March 2016 – S$1.70 S$0.76
Assumptions under Monte-Carlo Model Expected volatility Singtel 16.0% 16.0% 16.0%
MSCI Asia Pacific Telco Index 11.4% 11.4% 11.4%
MSCI Asia Pacific Telco Component Stocks 36 months historical volatility
preceding March 2016
Risk free interest rates Yield of Singapore Government Securities on 31 March 2016 31 March 2016 31 March 2016
Cash-settled 2015
Date of grant
26 June 2012 21 June 2013 23 June 2014
Fair value at 31 March 2015 S$4.36 S$3.66 S$3.72
Assumptions under Monte-Carlo Model Expected volatility Singtel 15.2% 15.2% 15.2%
MSCI Asia Pacific Telco Index 10.6% 10.6% 10.6%
MSCI Asia Pacific Telco Component Stocks 36 months historical volatility
preceding March 2015
Risk free interest rates Yield of Singapore Government Securities on 31 March 2015 31 March 2015 31 March 2015
Notes to the Financial StatementsFor the financial year ended 31 March 2016
SINGAPORE TELECOMMUNICATIONS LIMITED 159
5.3.2 Amobee’s share options – equity-settled arrangement
In April 2015, Amobee Group Pte. Ltd. (“Amobee”), a wholly-owned subsidiary of the Company, implemented the
2015 Long-Term Incentive Plan (“Amobee LTI Plan”). Selected employees (including executive directors) and non-
executive directors of Amobee group are granted options to purchase ordinary shares of Amobee.
Options are exercisable at a price no less than 100% of the fair value of the ordinary shares of Amobee on the date of
grant. Options for employees are scheduled to be fully vested 3.5 years from the earlier of grant date or the vesting
commencement date.
Options have been granted on 10 April 2015 with an exercise price of US$0.79 per share and on 14 October 2015
with an exercise price of US$0.79 per share or US$0.54 per share. The fair values of the options granted on those
dates were US$0.224 and US$0.217/ US$0.203 respectively. The terms of the options granted to employees and
non-executive directors are 10 years and 5 years from the date of grant respectively.
The fair values for the share options granted were estimated using the Black-Scholes pricing model.
From April 2015 to 31 March 2016, options in respect of an aggregate of 55.0 million of ordinary shares in Amobee
have been granted to the employees and non-executive directors of Amobee group. As at 31 March 2016, options in
respect of an aggregate of 43.3 million ordinary shares in Amobee are outstanding.
5.3.3 Trustwave’s share options – equity-settled arrangement
In December 2015, Trustwave Holdings, Inc. (“Trustwave”), a 98%-owned subsidiary of the Company, implemented
the Stock Option Incentive Plan (“Trustwave ESOP’’). Selected employees (including executive directors) and non-
executive directors of Trustwave group are granted options to purchase common stock of Trustwave.
Options are exercisable at a price no less than 100% of the fair value of the common stock of Trustwave on the date
of grant, and are scheduled to be fully vested 4 years from the grant date.
Options have been granted on 1 December 2015 and 22 January 2016 with an exercise price of US$16.79 per share.
The fair value of the options granted on those dates was US$6.56. The term of each option granted is 10 years from
the date of grant.
The fair value for the share options granted was estimated using the Black-Scholes pricing model.
From December 2015 to 31 March 2016, options in respect of an aggregate of 1.5 million of common stock in
Trustwave have been granted. As at 31 March 2016, options in respect of an aggregate of 1.4 million of common
stock in Trustwave are outstanding.
Notes to the Financial StatementsFor the financial year ended 31 March 2016
ANNUAL REPORT 2016 160

5.4 Structured Entity
The Trust’s purpose is to purchase the Company’s shares from the open market for delivery to the recipients upon
vesting of the share-based payments awards.
As at the end of the reporting period, the Trust held the following assets –
Group Company
2016S$ Mil
2015S$ Mil
2016S$ Mil
2015S$ Mil
Cost of Singtel shares, net of vesting 26.8 32.7 24.8 29.7
Cash at bank 0.4 0.4 0.4 0.4
27.2 33.1 25.2 30.1
The details of Singtel shares held by the Trust were as follows –
Number of shares Amount
Group2016‘000
2015‘000
2016S$ Mil
2015S$ Mil
Balance as at 1 April 8,629 10,127 32.7 34.6
Purchase of Singtel shares 5,762 8,561 23.5 32.8
Vesting of shares (7,467) (10,059) (29.4) (34.7)
Balance as at 31 March 6,924 8,629 26.8 32.7
Upon consolidation of the Trust in the consolidated financial statements, the weighted average cost of vested Singtel
shares is taken to ‘Capital Reserve’ whereas the weighted average cost of unvested shares is taken to ‘Treasury
Shares’ within equity. See Note 2.3.
Notes to the Financial StatementsFor the financial year ended 31 March 2016
SINGAPORE TELECOMMUNICATIONS LIMITED 161
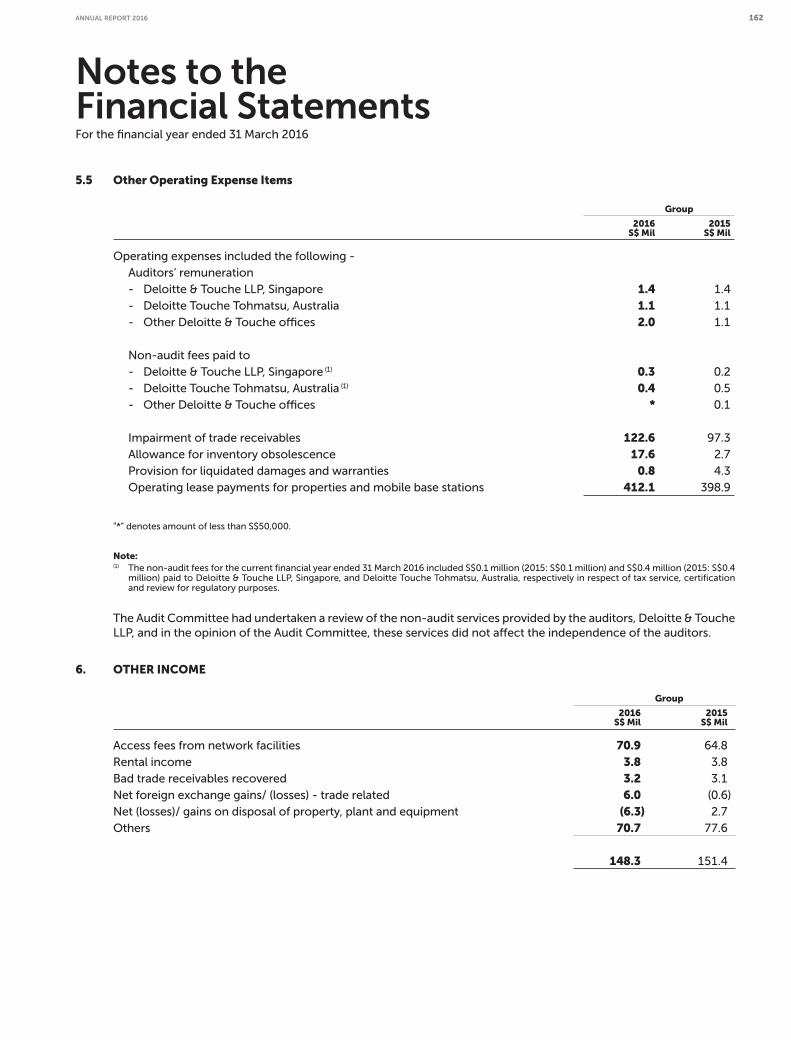
5.5 Other Operating Expense Items
Group
2016S$ Mil
2015S$ Mil
Operating expenses included the following -
Auditors’ remuneration
- Deloitte & Touche LLP, Singapore 1.4 1.4
- Deloitte Touche Tohmatsu, Australia 1.1 1.1
- Other Deloitte & Touche offices 2.0 1.1
Non-audit fees paid to
- Deloitte & Touche LLP, Singapore (1) 0.3 0.2
- Deloitte Touche Tohmatsu, Australia (1) 0.4 0.5
- Other Deloitte & Touche offices * 0.1
Impairment of trade receivables 122.6 97.3
Allowance for inventory obsolescence 17.6 2.7
Provision for liquidated damages and warranties 0.8 4.3
Operating lease payments for properties and mobile base stations 412.1 398.9
”*” denotes amount of less than S$50,000.
Note:(1) The non-audit fees for the current financial year ended 31 March 2016 included S$0.1 million (2015: S$0.1 million) and S$0.4 million (2015: S$0.4
million) paid to Deloitte & Touche LLP, Singapore, and Deloitte Touche Tohmatsu, Australia, respectively in respect of tax service, certification and review for regulatory purposes.
The Audit Committee had undertaken a review of the non-audit services provided by the auditors, Deloitte & Touche
LLP, and in the opinion of the Audit Committee, these services did not affect the independence of the auditors.
6. OTHER INCOME
Group
2016S$ Mil
2015S$ Mil
Access fees from network facilities 70.9 64.8
Rental income 3.8 3.8
Bad trade receivables recovered 3.2 3.1
Net foreign exchange gains/ (losses) - trade related 6.0 (0.6)
Net (losses)/ gains on disposal of property, plant and equipment (6.3) 2.7
Others 70.7 77.6
148.3 151.4
Notes to the Financial StatementsFor the financial year ended 31 March 2016
ANNUAL REPORT 2016 162
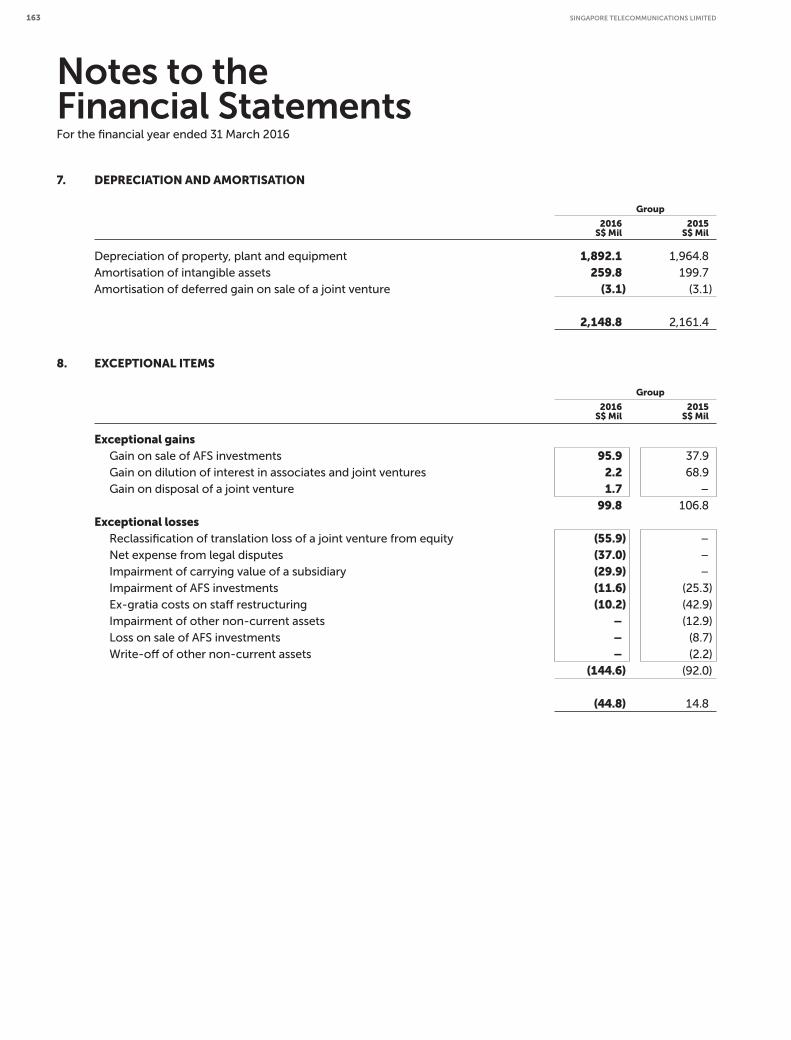
7. DEPRECIATION AND AMORTISATION
Group
2016S$ Mil
2015S$ Mil
Depreciation of property, plant and equipment 1,892.1 1,964.8
Amortisation of intangible assets 259.8 199.7
Amortisation of deferred gain on sale of a joint venture (3.1) (3.1)
2,148.8 2,161.4
8. EXCEPTIONAL ITEMS
Group
2016S$ Mil
2015S$ Mil
Exceptional gains Gain on sale of AFS investments 95.9 37.9
Gain on dilution of interest in associates and joint ventures 2.2 68.9
Gain on disposal of a joint venture 1.7 –
99.8 106.8
Exceptional lossesReclassification of translation loss of a joint venture from equity (55.9) –
Net expense from legal disputes (37.0) –
Impairment of carrying value of a subsidiary (29.9) –
Impairment of AFS investments (11.6) (25.3)
Ex-gratia costs on staff restructuring (10.2) (42.9)
Impairment of other non-current assets – (12.9)
Loss on sale of AFS investments – (8.7)
Write-off of other non-current assets – (2.2)
(144.6) (92.0)
(44.8) 14.8
Notes to the Financial StatementsFor the financial year ended 31 March 2016
SINGAPORE TELECOMMUNICATIONS LIMITED 163

9. SHARE OF RESULTS OF ASSOCIATES AND JOINT VENTURES
Group
2016
S$ Mil2015
S$ Mil
Share of ordinary results
– joint ventures 2,616.7 2,504.4
– associates 171.3 111.8
2,788.0 2,616.2
Share of net exceptional gains/ (losses) of associates and joint ventures (post-tax) (1) 70.0 (69.1)
Write-back of impairment provision on an associate 31.7 –
Share of tax of ordinary results
– joint ventures (834.7) (790.1)
– associates (28.4) (21.7)
(863.1) (811.8)
2,026.6 1,735.3
Note:(1) Share of net exceptional gains/ (losses) comprised –
Divestment gains on investments 25.3 –
Handset subsidy costs (24.9) –
Accelerated depreciation – (10.5)
Divestment gains on telecom tower assets and other items 69.6 (58.6)
70.0 (69.1)
10. INTEREST AND INVESTMENT INCOME (NET)
Group2016
S$ Mil2015
S$ Mil
Interest income from
– bank deposits 6.3 8.8
– others 44.3 37.4
50.6 46.2
Dividends from joint venture 42.9 41.5
Gross dividends from AFS investments 2.2 4.7
95.7 92.4
Net foreign exchange gains – non-trade related 2.1 8.2
Other fair value (losses)/ gains (1.8) 3.5
Fair value gains/ (losses) on fair value hedges
– hedged items 177.7 (132.9)
– hedging instruments (179.0) 121.6
(1.3) (11.3)
Fair value gains/ (losses) on cash flow hedges
– hedged items 21.1 (363.8)
– hedging instruments (21.1) 363.8 – *
94.7 92.8
“*” denotes loss of less than S$50,000.
Notes to the Financial StatementsFor the financial year ended 31 March 2016
ANNUAL REPORT 2016 164

11. FINANCE COSTS
Group2016
S$ Mil2015
S$ Mil
Interest expense on
– bonds 283.3 255.1
– bank loans 45.4 28.8
– others 31.7 27.3
360.4 311.2
Less: Amounts capitalised (0.8) (6.7)
359.6 304.5
Effects of hedging using interest rate swaps (4.2) 0.5
Unwinding of discounts (including adjustments) 4.2 4.2
359.6 309.2
The interest rate applicable to the capitalised borrowings was 5.4 per cent as at 31 March 2016 (31 March 2015:
6.1 per cent).
12. TAXATION
12.1 Tax Expense
Group2016
S$ Mil2015
S$ Mil
Current income tax
– Singapore 239.6 237.7
– Overseas 356.8 354.1
596.4 591.8
Deferred tax (credit)/ expense (5.7) 3.4
Tax expense attributable to current year’s profit 590.7 595.2
Recognition of deferred tax credit (1) – (47.6)
Adjustments in respect of prior year (2) –
Current income tax
– over provision (18.7) (13.6)
Deferred income tax
– under provision 6.0 11.3
Withholding and dividend distribution taxes on dividend
income from joint ventures 144.5 133.2 722.5 678.5
Notes:(1) This related to deferred tax credit recognised on certain property, plant and equipment transferred to an associate. (2) This included certain tax credits upon finalisation of earlier years’ tax assessments.
Notes to the Financial StatementsFor the financial year ended 31 March 2016
SINGAPORE TELECOMMUNICATIONS LIMITED 165
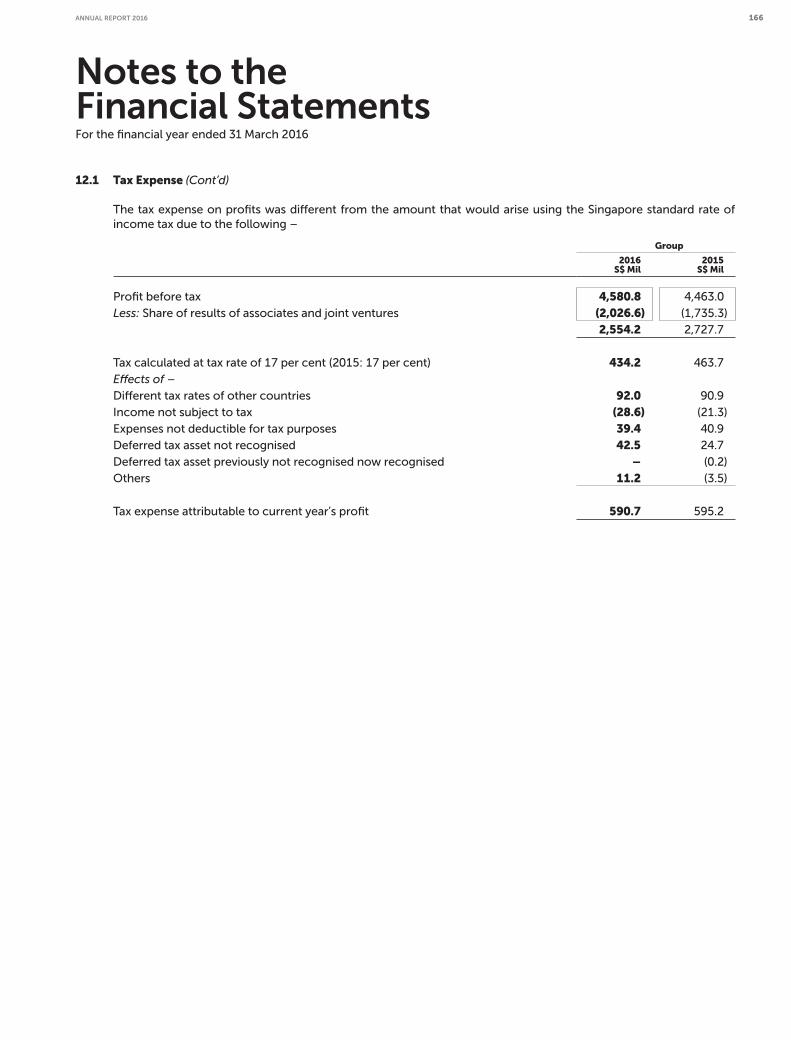
Notes to the Financial StatementsFor the financial year ended 31 March 2016
12.1 Tax Expense (Cont’d)
The tax expense on profits was different from the amount that would arise using the Singapore standard rate of
income tax due to the following –
Group
2016S$ Mil
2015S$ Mil
Profit before tax 4,580.8 4,463.0
Less: Share of results of associates and joint ventures (2,026.6) (1,735.3)
2,554.2 2,727.7
Tax calculated at tax rate of 17 per cent (2015: 17 per cent) 434.2 463.7
Effects of –
Different tax rates of other countries 92.0 90.9
Income not subject to tax (28.6) (21.3)
Expenses not deductible for tax purposes 39.4 40.9
Deferred tax asset not recognised 42.5 24.7
Deferred tax asset previously not recognised now recognised – (0.2)
Others 11.2 (3.5)
Tax expense attributable to current year’s profit 590.7 595.2
ANNUAL REPORT 2016 166
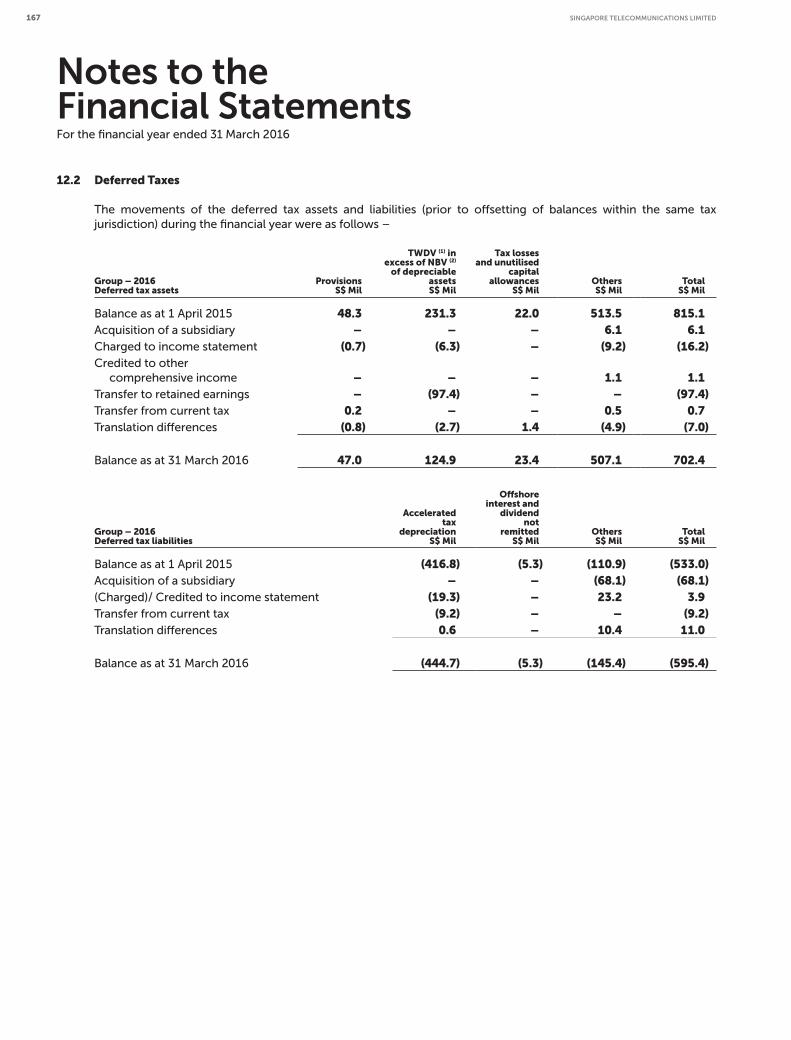
Notes to the Financial StatementsFor the financial year ended 31 March 2016
12.2 Deferred Taxes
The movements of the deferred tax assets and liabilities (prior to offsetting of balances within the same tax
jurisdiction) during the financial year were as follows –
Group – 2016Deferred tax assets
ProvisionsS$ Mil
TWDV (1) inexcess of NBV (2)
of depreciableassetsS$ Mil
Tax lossesand unutilised
capitalallowances
S$ MilOthersS$ Mil
TotalS$ Mil
Balance as at 1 April 2015 48.3 231.3 22.0 513.5 815.1 Acquisition of a subsidiary – – – 6.1 6.1 Charged to income statement (0.7) (6.3) – (9.2) (16.2)Credited to other
comprehensive income – – – 1.1 1.1 Transfer to retained earnings – (97.4) – – (97.4)Transfer from current tax 0.2 – – 0.5 0.7 Translation differences (0.8) (2.7) 1.4 (4.9) (7.0)
Balance as at 31 March 2016 47.0 124.9 23.4 507.1 702.4
Group – 2016Deferred tax liabilities
Acceleratedtax
depreciationS$ Mil
Offshoreinterest and
dividendnot
remittedS$ Mil
OthersS$ Mil
TotalS$ Mil
Balance as at 1 April 2015 (416.8) (5.3) (110.9) (533.0)Acquisition of a subsidiary – – (68.1) (68.1)(Charged)/ Credited to income statement (19.3) – 23.2 3.9 Transfer from current tax (9.2) – – (9.2)Translation differences 0.6 – 10.4 11.0
Balance as at 31 March 2016 (444.7) (5.3) (145.4) (595.4)
SINGAPORE TELECOMMUNICATIONS LIMITED 167
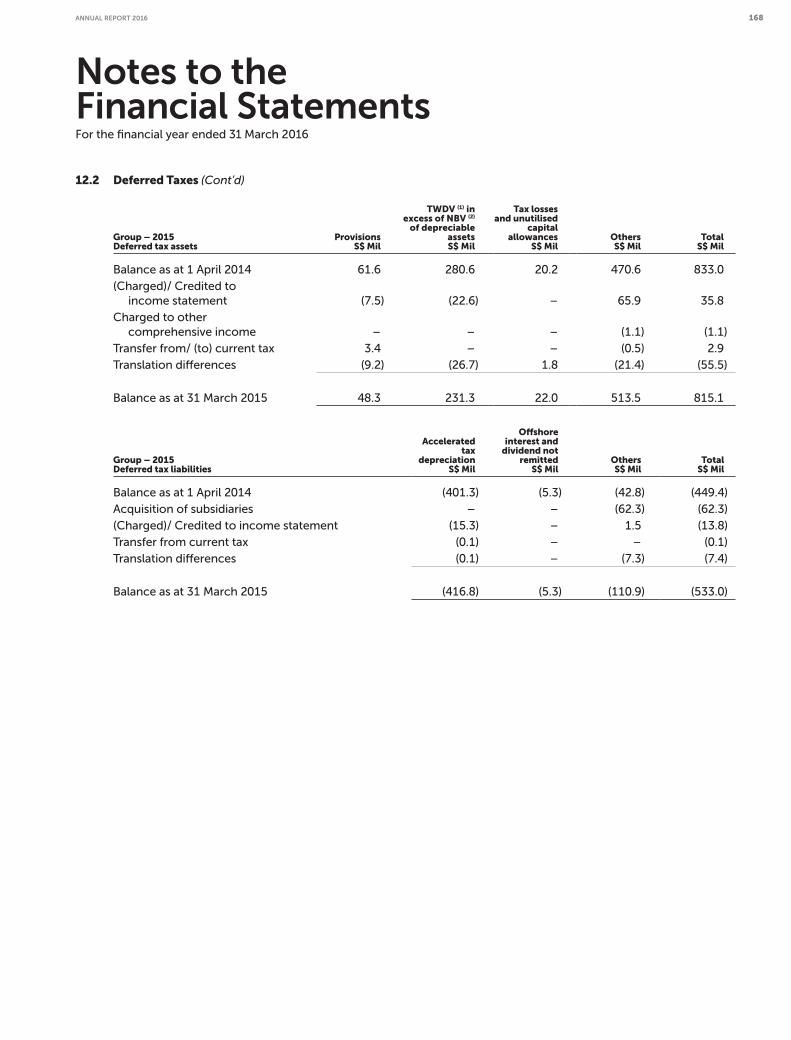
Notes to the Financial StatementsFor the financial year ended 31 March 2016
12.2 Deferred Taxes (Cont’d)
Group – 2015Deferred tax assets
ProvisionsS$ Mil
TWDV (1) inexcess of NBV (2)
of depreciableassetsS$ Mil
Tax lossesand unutilised
capitalallowances
S$ MilOthersS$ Mil
TotalS$ Mil
Balance as at 1 April 2014 61.6 280.6 20.2 470.6 833.0
(Charged)/ Credited to
income statement (7.5) (22.6) – 65.9 35.8
Charged to other
comprehensive income – – – (1.1) (1.1)
Transfer from/ (to) current tax 3.4 – – (0.5) 2.9
Translation differences (9.2) (26.7) 1.8 (21.4) (55.5)
Balance as at 31 March 2015 48.3 231.3 22.0 513.5 815.1
Group – 2015Deferred tax liabilities
Acceleratedtax
depreciationS$ Mil
Offshoreinterest and
dividend notremitted
S$ Mil OthersS$ Mil
TotalS$ Mil
Balance as at 1 April 2014 (401.3) (5.3) (42.8) (449.4)
Acquisition of subsidiaries – – (62.3) (62.3)
(Charged)/ Credited to income statement (15.3) – 1.5 (13.8)
Transfer from current tax (0.1) – – (0.1)
Translation differences (0.1) – (7.3) (7.4)
Balance as at 31 March 2015 (416.8) (5.3) (110.9) (533.0)
ANNUAL REPORT 2016 168

Notes to the Financial StatementsFor the financial year ended 31 March 2016
12.2 Deferred Taxes (Cont’d)
Company – 2016Deferred tax assets
ProvisionsS$ Mil
OthersS$ Mil
TotalS$ Mil
Balance as at 1 April 2015 0.5 6.8 7.3 Charged to income statement (0.1) (3.5) (3.6) Balance as at 31 March 2016 0.4 3.3 3.7
Company – 2016Deferred tax liabilities
Accelerated taxdepreciation
S$ Mil TotalS$ Mil
Balance as at 1 April 2015 (256.2) (256.2)Charged to income statement (18.0) (18.0) Balance as at 31 March 2016 (274.2) (274.2)
Company – 2015Deferred tax assets
ProvisionsS$ Mil
OthersS$ Mil
TotalS$ Mil
Balance as at 1 April 2014 0.5 1.4 1.9
Credited to income statement – 5.4 5.4
Balance as at 31 March 2015 0.5 6.8 7.3
Company – 2015Deferred tax liabilities
Accelerated taxdepreciation
S$ Mil TotalS$ Mil
Balance as at 1 April 2014 (244.4) (244.4)
Charged to income statement (11.8) (11.8)
Balance as at 31 March 2015 (256.2) (256.2)
Notes:(1) TWDV – Tax written down value(2) NBV – Net book value
Deferred tax assets and liabilities are offset when there is a legally enforceable right to set-off current tax assets
against current tax liabilities, and when deferred income taxes relate to the same fiscal authority.
SINGAPORE TELECOMMUNICATIONS LIMITED 169
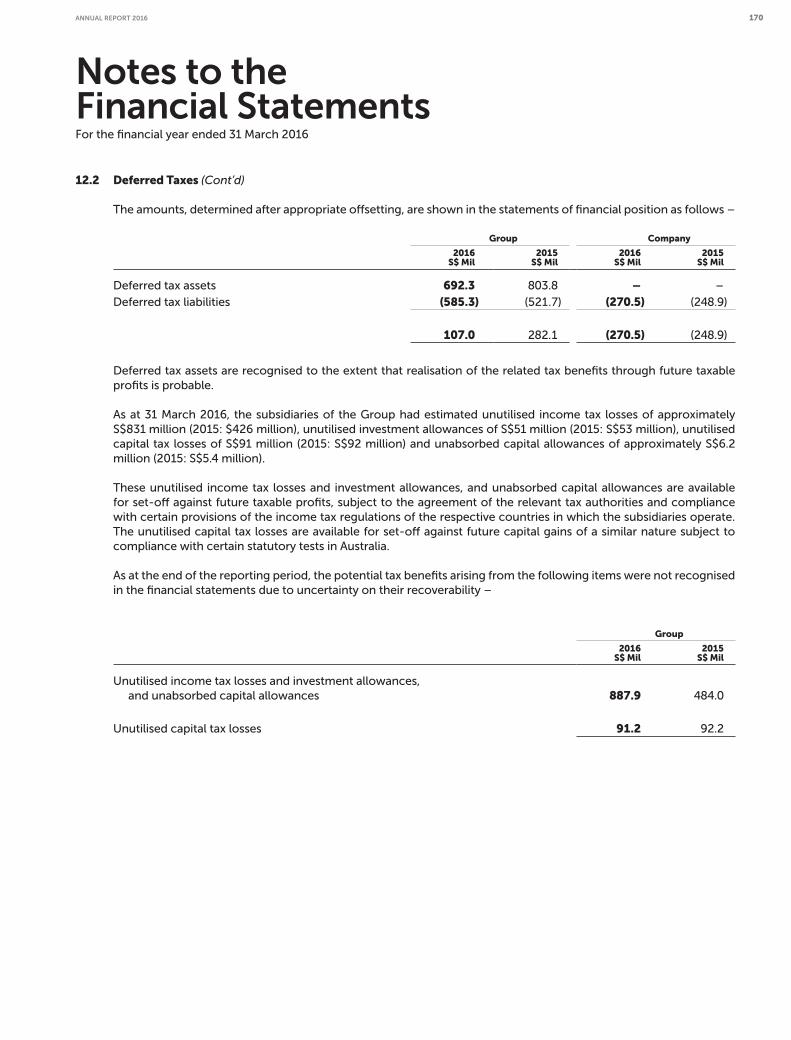
Notes to the Financial StatementsFor the financial year ended 31 March 2016
12.2 Deferred Taxes (Cont’d)
The amounts, determined after appropriate offsetting, are shown in the statements of financial position as follows –
Group Company
2016S$ Mil
2015S$ Mil
2016S$ Mil
2015S$ Mil
Deferred tax assets 692.3 803.8 – –
Deferred tax liabilities (585.3) (521.7) (270.5) (248.9)
107.0 282.1 (270.5) (248.9)
Deferred tax assets are recognised to the extent that realisation of the related tax benefits through future taxable
profits is probable.
As at 31 March 2016, the subsidiaries of the Group had estimated unutilised income tax losses of approximately
S$831 million (2015: $426 million), unutilised investment allowances of S$51 million (2015: S$53 million), unutilised
capital tax losses of S$91 million (2015: S$92 million) and unabsorbed capital allowances of approximately S$6.2
million (2015: S$5.4 million).
These unutilised income tax losses and investment allowances, and unabsorbed capital allowances are available
for set-off against future taxable profits, subject to the agreement of the relevant tax authorities and compliance
with certain provisions of the income tax regulations of the respective countries in which the subsidiaries operate.
The unutilised capital tax losses are available for set-off against future capital gains of a similar nature subject to
compliance with certain statutory tests in Australia.
As at the end of the reporting period, the potential tax benefits arising from the following items were not recognised
in the financial statements due to uncertainty on their recoverability –
Group
2016S$ Mil
2015S$ Mil
Unutilised income tax losses and investment allowances,
and unabsorbed capital allowances 887.9 484.0
Unutilised capital tax losses 91.2 92.2
ANNUAL REPORT 2016 170
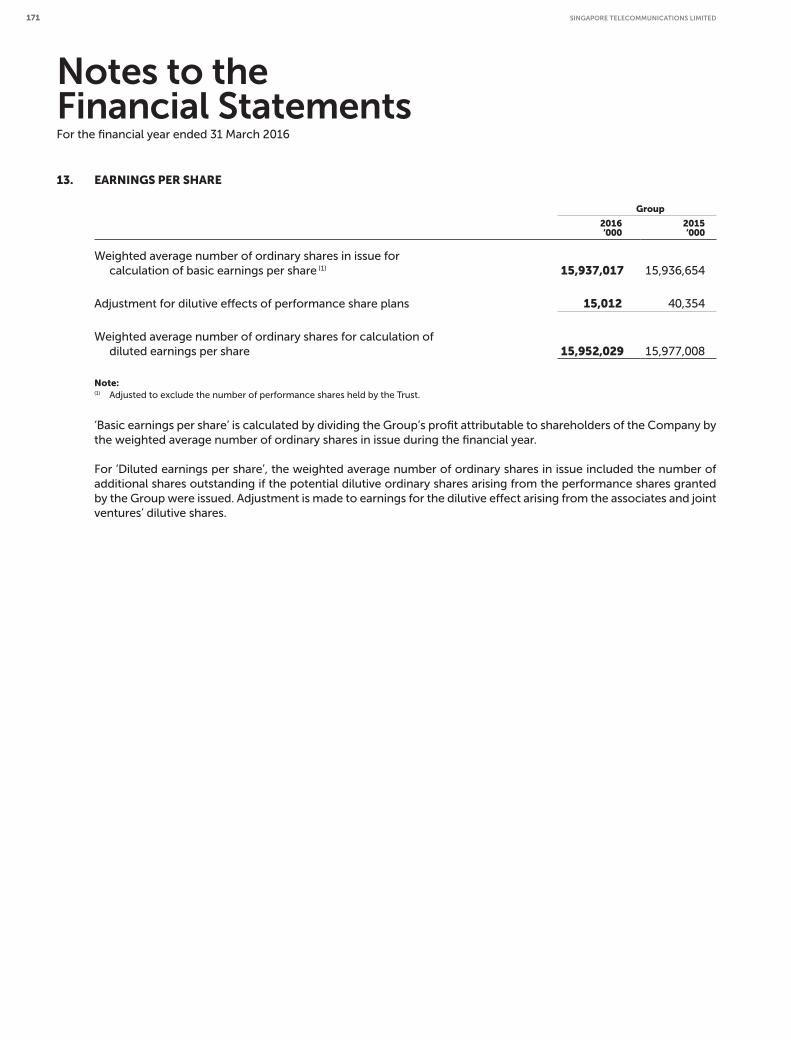
Notes to the Financial StatementsFor the financial year ended 31 March 2016
13. EARNINGS PER SHARE
Group
2016‘000
2015‘000
Weighted average number of ordinary shares in issue for
calculation of basic earnings per share (1) 15,937,017 15,936,654
Adjustment for dilutive effects of performance share plans 15,012 40,354
Weighted average number of ordinary shares for calculation of
diluted earnings per share 15,952,029 15,977,008
Note:(1) Adjusted to exclude the number of performance shares held by the Trust.
‘Basic earnings per share’ is calculated by dividing the Group’s profit attributable to shareholders of the Company by
the weighted average number of ordinary shares in issue during the financial year.
For ‘Diluted earnings per share’, the weighted average number of ordinary shares in issue included the number of
additional shares outstanding if the potential dilutive ordinary shares arising from the performance shares granted
by the Group were issued. Adjustment is made to earnings for the dilutive effect arising from the associates and joint
ventures’ dilutive shares.
SINGAPORE TELECOMMUNICATIONS LIMITED 171
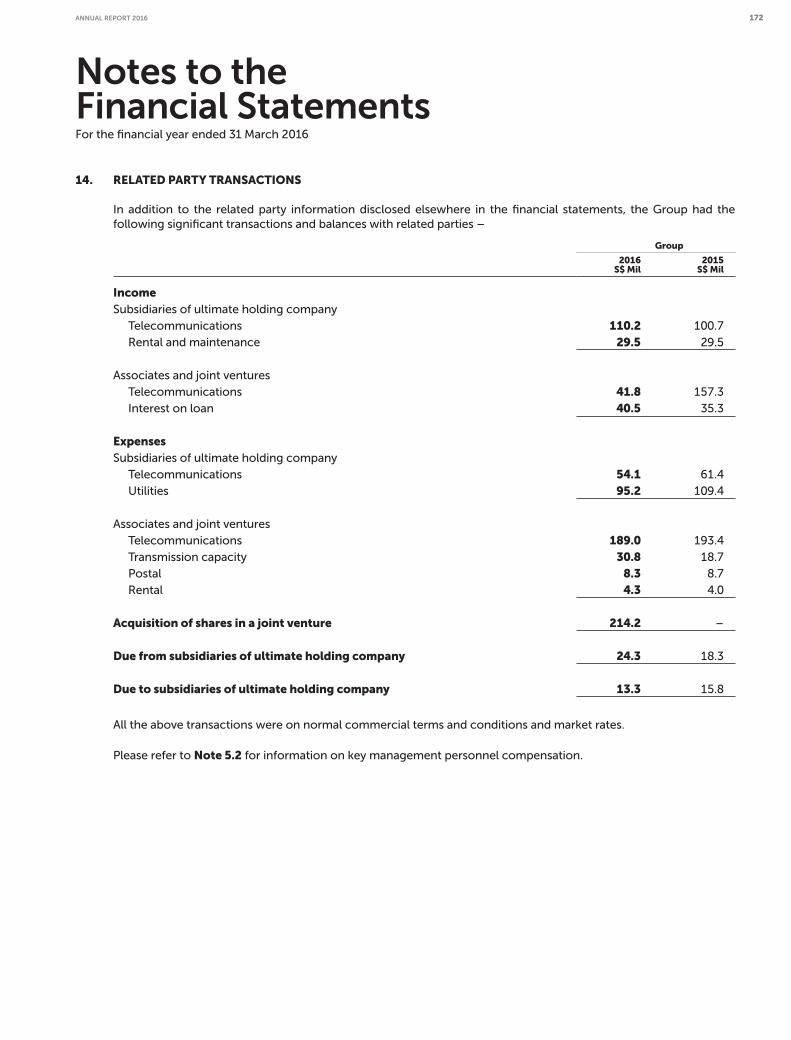
Notes to the Financial StatementsFor the financial year ended 31 March 2016
14. RELATED PARTY TRANSACTIONS
In addition to the related party information disclosed elsewhere in the financial statements, the Group had the
following significant transactions and balances with related parties –
Group
2016S$ Mil
2015S$ Mil
Income
Subsidiaries of ultimate holding company
Telecommunications 110.2 100.7
Rental and maintenance 29.5 29.5
Associates and joint ventures
Telecommunications 41.8 157.3
Interest on loan 40.5 35.3
Expenses
Subsidiaries of ultimate holding company
Telecommunications 54.1 61.4
Utilities 95.2 109.4
Associates and joint ventures
Telecommunications 189.0 193.4
Transmission capacity 30.8 18.7
Postal 8.3 8.7
Rental 4.3 4.0
Acquisition of shares in a joint venture 214.2 –
Due from subsidiaries of ultimate holding company 24.3 18.3
Due to subsidiaries of ultimate holding company 13.3 15.8
All the above transactions were on normal commercial terms and conditions and market rates.
Please refer to Note 5.2 for information on key management personnel compensation.
ANNUAL REPORT 2016 172
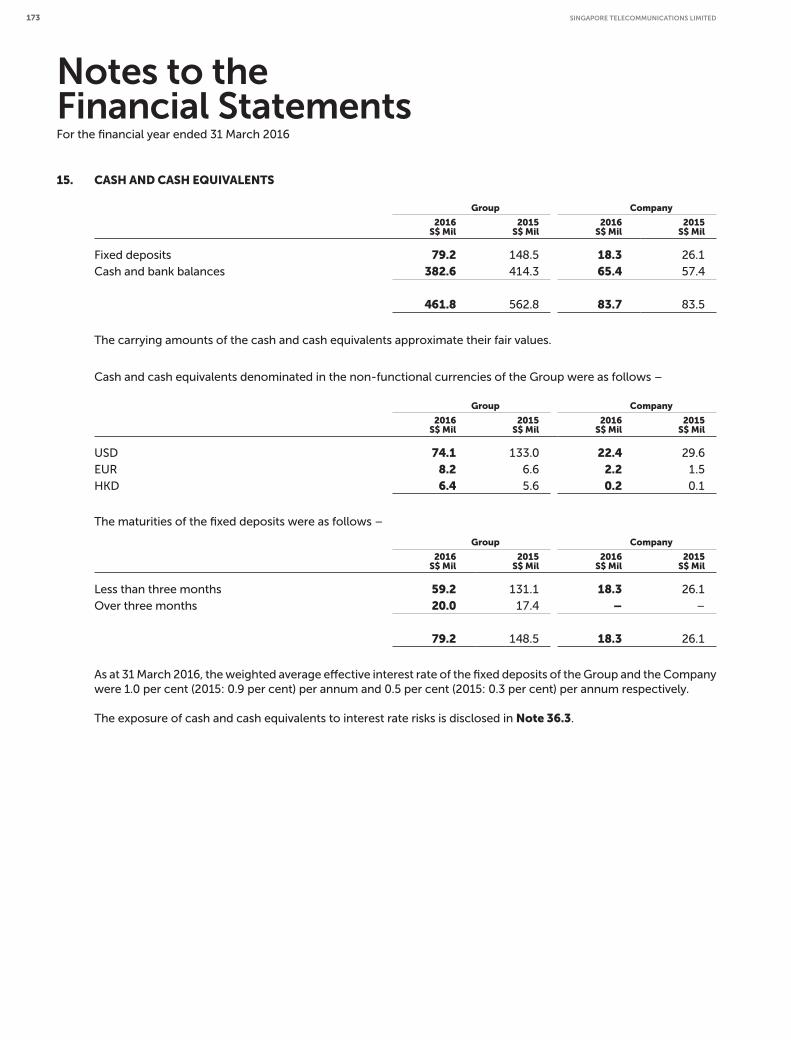
Notes to the Financial StatementsFor the financial year ended 31 March 2016
15. CASH AND CASH EQUIVALENTS
Group Company
2016S$ Mil
2015S$ Mil
2016S$ Mil
2015S$ Mil
Fixed deposits 79.2 148.5 18.3 26.1
Cash and bank balances 382.6 414.3 65.4 57.4
461.8 562.8 83.7 83.5
The carrying amounts of the cash and cash equivalents approximate their fair values.
Cash and cash equivalents denominated in the non-functional currencies of the Group were as follows –
Group Company
2016S$ Mil
2015S$ Mil
2016S$ Mil
2015S$ Mil
USD 74.1 133.0 22.4 29.6
EUR 8.2 6.6 2.2 1.5
HKD 6.4 5.6 0.2 0.1
The maturities of the fixed deposits were as follows –
Group Company
2016S$ Mil
2015S$ Mil
2016S$ Mil
2015S$ Mil
Less than three months 59.2 131.1 18.3 26.1
Over three months 20.0 17.4 – –
79.2 148.5 18.3 26.1
As at 31 March 2016, the weighted average effective interest rate of the fixed deposits of the Group and the Company
were 1.0 per cent (2015: 0.9 per cent) per annum and 0.5 per cent (2015: 0.3 per cent) per annum respectively.
The exposure of cash and cash equivalents to interest rate risks is disclosed in Note 36.3.
SINGAPORE TELECOMMUNICATIONS LIMITED 173

Notes to the Financial StatementsFor the financial year ended 31 March 2016
16. TRADE AND OTHER RECEIVABLES
Group Company
2016S$ Mil
2015S$ Mil
2016S$ Mil
2015S$ Mil
Trade receivables 2,277.2 2,299.1 504.0 490.2
Accrued receivables (1) 1,130.8 673.6 – –
3,408.0 2,972.7 504.0 490.2
Less: Allowance for impairment of
trade receivables (245.9) (236.9) (84.0) (79.7)
3,162.1 2,735.8 420.0 410.5
Other receivables 471.5 458.6 13.1 14.7
Loans to subsidiaries – – 890.3 126.7
Less: Allowance for impairment of loans due – – (12.7) (12.7)
– – 877.6 114.0
Amount due from subsidiaries
– trade – – 634.6 567.5
– non-trade – – 1,058.4 1,272.2
Less: Allowance for impairment of amount due – – (45.4) (45.4)
– – 1,647.6 1,794.3
Amount due from associates and joint ventures
– trade 16.3 40.5 7.6 26.9
– non-trade 159.0 158.8 – –
175.3 199.3 7.6 26.9
Prepayments 477.2 393.3 37.8 36.7
Interest receivable 68.8 86.1 25.7 45.3
Others 11.5 12.1 – –
4,366.4 3,885.2 3,029.4 2,442.4
Note:(1) This comprises accrued revenue under device repayment plans and other handset repayment plans which are generally on 14-day to 30-day
terms when billed.
As at 31 March 2016, the effective interest rate of an amount due from a subsidiary of S$865.4 million (2015: S$1,080.5 million) was 0.01 per cent (2015: 0.01 per cent) per annum. The loans to subsidiaries and amounts due from other subsidiaries, associates and joint ventures were unsecured, interest-free and repayable on demand.
Trade receivables are non-interest bearing and are generally on 14-day to 30-day terms, while balances due from carriers are on 60-day terms.
An amount of S$30.4 million (2015: S$51.6 million) under ‘Other receivables’ and an amount of S$62.3 million (2015: S$51.3 million) under ‘Other non-current receivables’ (see Note 27) of the Group are guaranteed by a third party and are repayable in several tranches up to financial year ending 31 March 2018. The weighted average effective interest rate was 3.5% (2015: 2.0%).
ANNUAL REPORT 2016 174
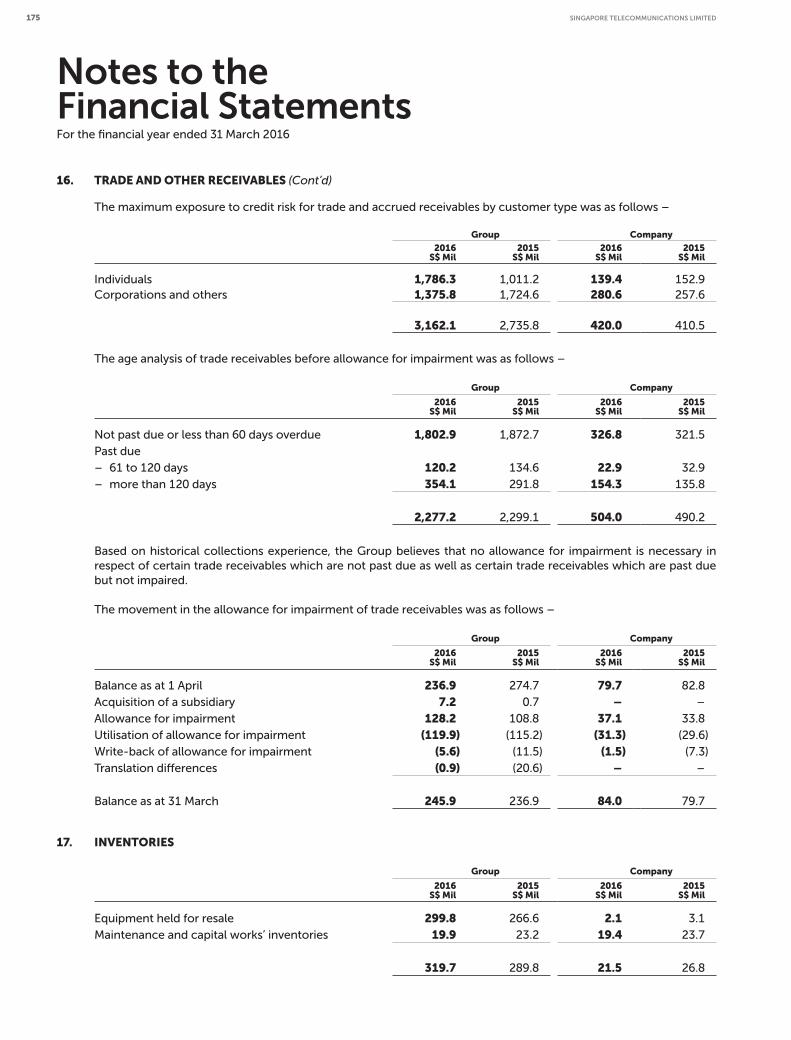
Notes to the Financial StatementsFor the financial year ended 31 March 2016
16. TRADE AND OTHER RECEIVABLES (Cont’d)
The maximum exposure to credit risk for trade and accrued receivables by customer type was as follows –
Group Company
2016S$ Mil
2015S$ Mil
2016S$ Mil
2015S$ Mil
Individuals 1,786.3 1,011.2 139.4 152.9
Corporations and others 1,375.8 1,724.6 280.6 257.6
3,162.1 2,735.8 420.0 410.5
The age analysis of trade receivables before allowance for impairment was as follows –
Group Company
2016S$ Mil
2015S$ Mil
2016S$ Mil
2015S$ Mil
Not past due or less than 60 days overdue 1,802.9 1,872.7 326.8 321.5
Past due
– 61 to 120 days 120.2 134.6 22.9 32.9
– more than 120 days 354.1 291.8 154.3 135.8
2,277.2 2,299.1 504.0 490.2
Based on historical collections experience, the Group believes that no allowance for impairment is necessary in
respect of certain trade receivables which are not past due as well as certain trade receivables which are past due
but not impaired.
The movement in the allowance for impairment of trade receivables was as follows –
Group Company
2016S$ Mil
2015S$ Mil
2016S$ Mil
2015S$ Mil
Balance as at 1 April 236.9 274.7 79.7 82.8
Acquisition of a subsidiary 7.2 0.7 – –
Allowance for impairment 128.2 108.8 37.1 33.8
Utilisation of allowance for impairment (119.9) (115.2) (31.3) (29.6)
Write-back of allowance for impairment (5.6) (11.5) (1.5) (7.3)
Translation differences (0.9) (20.6) – –
Balance as at 31 March 245.9 236.9 84.0 79.7
17. INVENTORIES
Group Company
2016S$ Mil
2015S$ Mil
2016S$ Mil
2015S$ Mil
Equipment held for resale 299.8 266.6 2.1 3.1
Maintenance and capital works’ inventories 19.9 23.2 19.4 23.7
319.7 289.8 21.5 26.8
SINGAPORE TELECOMMUNICATIONS LIMITED 175
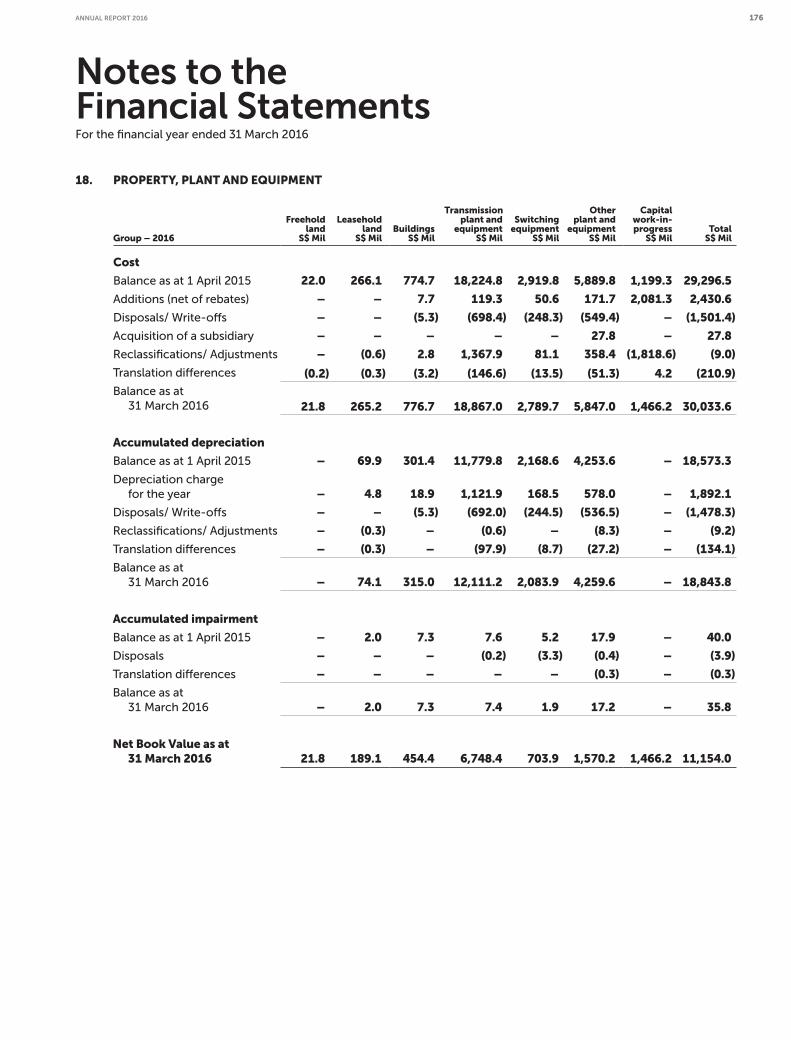
Notes to the Financial StatementsFor the financial year ended 31 March 2016
18. PROPERTY, PLANT AND EQUIPMENT
Group – 2016
Freeholdland
S$ Mil
Leaseholdland
S$ MilBuildings
S$ Mil
Transmissionplant and
equipmentS$ Mil
Switchingequipment
S$ Mil
Otherplant and
equipmentS$ Mil
Capitalwork-in-progress
S$ Mil TotalS$ Mil
Cost
Balance as at 1 April 2015 22.0 266.1 774.7 18,224.8 2,919.8 5,889.8 1,199.3 29,296.5
Additions (net of rebates) – – 7.7 119.3 50.6 171.7 2,081.3 2,430.6
Disposals/ Write-offs – – (5.3) (698.4) (248.3) (549.4) – (1,501.4)
Acquisition of a subsidiary – – – – – 27.8 – 27.8
Reclassifications/ Adjustments – (0.6) 2.8 1,367.9 81.1 358.4 (1,818.6) (9.0)
Translation differences (0.2) (0.3) (3.2) (146.6) (13.5) (51.3) 4.2 (210.9)
Balance as at
31 March 2016 21.8 265.2 776.7 18,867.0 2,789.7 5,847.0 1,466.2 30,033.6
Accumulated depreciation
Balance as at 1 April 2015 – 69.9 301.4 11,779.8 2,168.6 4,253.6 – 18,573.3
Depreciation charge
for the year – 4.8 18.9 1,121.9 168.5 578.0 – 1,892.1
Disposals/ Write-offs – – (5.3) (692.0) (244.5) (536.5) – (1,478.3)
Reclassifications/ Adjustments – (0.3) – (0.6) – (8.3) – (9.2)
Translation differences – (0.3) – (97.9) (8.7) (27.2) – (134.1)
Balance as at
31 March 2016 – 74.1 315.0 12,111.2 2,083.9 4,259.6 – 18,843.8
Accumulated impairment
Balance as at 1 April 2015 – 2.0 7.3 7.6 5.2 17.9 – 40.0
Disposals – – – (0.2) (3.3) (0.4) – (3.9)
Translation differences – – – – – (0.3) – (0.3)
Balance as at
31 March 2016 – 2.0 7.3 7.4 1.9 17.2 – 35.8
Net Book Value as at 31 March 2016 21.8 189.1 454.4 6,748.4 703.9 1,570.2 1,466.2 11,154.0
ANNUAL REPORT 2016 176
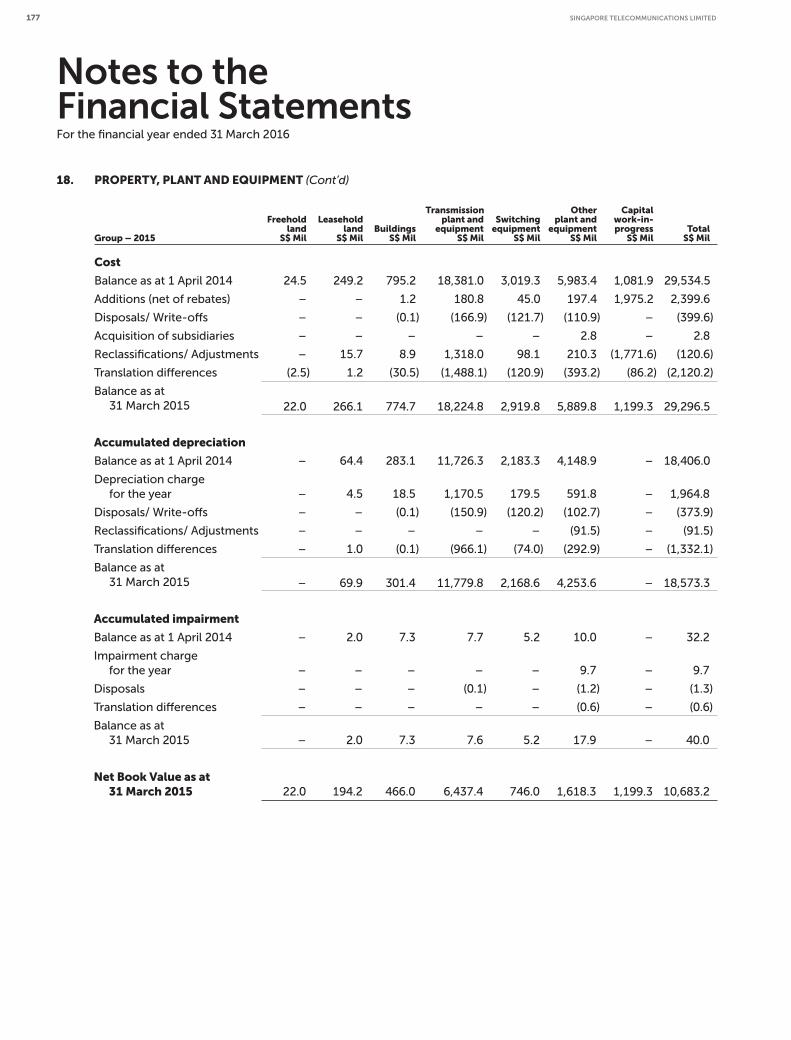
Notes to the Financial StatementsFor the financial year ended 31 March 2016
18. PROPERTY, PLANT AND EQUIPMENT (Cont’d)
Group – 2015
Freeholdland
S$ Mil
Leaseholdland
S$ MilBuildings
S$ Mil
Transmissionplant and
equipmentS$ Mil
Switchingequipment
S$ Mil
Otherplant and
equipmentS$ Mil
Capitalwork-in-progress
S$ Mil TotalS$ Mil
Cost
Balance as at 1 April 2014 24.5 249.2 795.2 18,381.0 3,019.3 5,983.4 1,081.9 29,534.5
Additions (net of rebates) – – 1.2 180.8 45.0 197.4 1,975.2 2,399.6
Disposals/ Write-offs – – (0.1) (166.9) (121.7) (110.9) – (399.6)
Acquisition of subsidiaries – – – – – 2.8 – 2.8
Reclassifications/ Adjustments – 15.7 8.9 1,318.0 98.1 210.3 (1,771.6) (120.6)
Translation differences (2.5) 1.2 (30.5) (1,488.1) (120.9) (393.2) (86.2) (2,120.2)
Balance as at
31 March 2015 22.0 266.1 774.7 18,224.8 2,919.8 5,889.8 1,199.3 29,296.5
Accumulated depreciation
Balance as at 1 April 2014 – 64.4 283.1 11,726.3 2,183.3 4,148.9 – 18,406.0
Depreciation charge
for the year – 4.5 18.5 1,170.5 179.5 591.8 – 1,964.8
Disposals/ Write-offs – – (0.1) (150.9) (120.2) (102.7) – (373.9)
Reclassifications/ Adjustments – – – – – (91.5) – (91.5)
Translation differences – 1.0 (0.1) (966.1) (74.0) (292.9) – (1,332.1)
Balance as at
31 March 2015 – 69.9 301.4 11,779.8 2,168.6 4,253.6 – 18,573.3
Accumulated impairment
Balance as at 1 April 2014 – 2.0 7.3 7.7 5.2 10.0 – 32.2
Impairment charge
for the year – – – – – 9.7 – 9.7
Disposals – – – (0.1) – (1.2) – (1.3)
Translation differences – – – – – (0.6) – (0.6)
Balance as at
31 March 2015 – 2.0 7.3 7.6 5.2 17.9 – 40.0
Net Book Value as at 31 March 2015 22.0 194.2 466.0 6,437.4 746.0 1,618.3 1,199.3 10,683.2
SINGAPORE TELECOMMUNICATIONS LIMITED 177

Notes to the Financial StatementsFor the financial year ended 31 March 2016
18. PROPERTY, PLANT AND EQUIPMENT (Cont’d)
Company – 2016
Freeholdland
S$ Mil
Leaseholdland
S$ MilBuildings
S$ Mil
Transmissionplant and
equipmentS$ Mil
Switchingequipment
S$ Mil
Otherplant and
equipmentS$ Mil
Capitalwork-in-progress
S$ Mil TotalS$ Mil
Cost
Balance as at 1 April 2015 0.4 228.2 431.5 3,143.5 998.1 1,486.0 310.0 6,597.7
Additions (net of rebates) – – – 47.6 12.1 55.0 361.5 476.2
Disposals/ Write-offs – – – (56.9) (105.2) (47.4) – (209.5)
Reclassifications – – 1.4 54.5 20.2 70.3 (146.4) –
Balance as at
31 March 2016 0.4 228.2 432.9 3,188.7 925.2 1,563.9 525.1 6,864.4
Accumulated depreciation
Balance as at 1 April 2015 – 51.1 256.8 2,277.6 895.3 1,052.4 – 4,533.2
Depreciation charge
for the year – 2.7 11.4 156.9 48.7 125.9 – 345.6
Disposals/ Write-offs – – – (51.4) (105.2) (45.9) – (202.5)
Balance as at
31 March 2016 – 53.8 268.2 2,383.1 838.8 1,132.4 – 4,676.3
Accumulated impairment
Balance as at 1 April 2015 – 2.0 7.2 6.1 1.2 0.8 – 17.3
Disposals/ Write-offs – – – (0.2) – (0.4) – (0.6)
Balance as at
31 March 2016 – 2.0 7.2 5.9 1.2 0.4 – 16.7
Net Book Value as at 31 March 2016 0.4 172.4 157.5 799.7 85.2 431.1 525.1 2,171.4
ANNUAL REPORT 2016 178
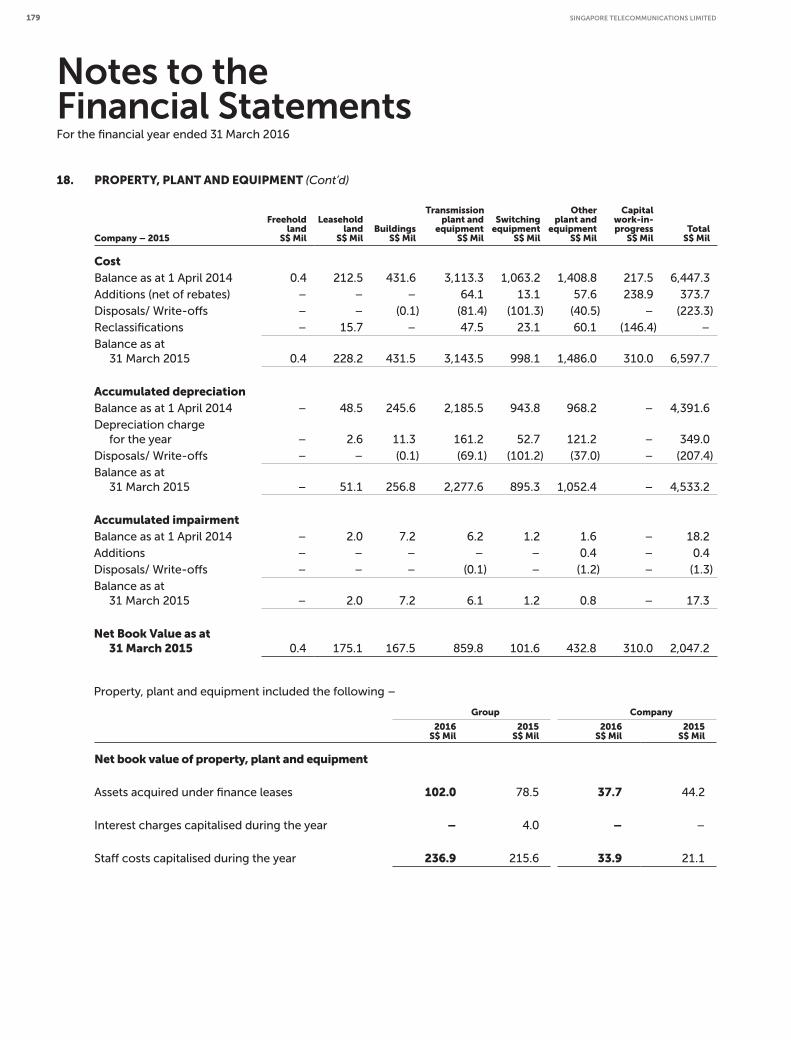
Notes to the Financial StatementsFor the financial year ended 31 March 2016
18. PROPERTY, PLANT AND EQUIPMENT (Cont’d)
Company – 2015
Freeholdland
S$ Mil
Leaseholdland
S$ MilBuildings
S$ Mil
Transmissionplant and
equipmentS$ Mil
Switchingequipment
S$ Mil
Otherplant and
equipmentS$ Mil
Capitalwork-in-progress
S$ Mil TotalS$ Mil
CostBalance as at 1 April 2014 0.4 212.5 431.6 3,113.3 1,063.2 1,408.8 217.5 6,447.3
Additions (net of rebates) – – – 64.1 13.1 57.6 238.9 373.7
Disposals/ Write-offs – – (0.1) (81.4) (101.3) (40.5) – (223.3)
Reclassifications – 15.7 – 47.5 23.1 60.1 (146.4) –
Balance as at
31 March 2015 0.4 228.2 431.5 3,143.5 998.1 1,486.0 310.0 6,597.7
Accumulated depreciation
Balance as at 1 April 2014 – 48.5 245.6 2,185.5 943.8 968.2 – 4,391.6
Depreciation charge
for the year – 2.6 11.3 161.2 52.7 121.2 – 349.0
Disposals/ Write-offs – – (0.1) (69.1) (101.2) (37.0) – (207.4)
Balance as at
31 March 2015 – 51.1 256.8 2,277.6 895.3 1,052.4 – 4,533.2
Accumulated impairment
Balance as at 1 April 2014 – 2.0 7.2 6.2 1.2 1.6 – 18.2
Additions – – – – – 0.4 – 0.4
Disposals/ Write-offs – – – (0.1) – (1.2) – (1.3)
Balance as at
31 March 2015 – 2.0 7.2 6.1 1.2 0.8 – 17.3
Net Book Value as at 31 March 2015 0.4 175.1 167.5 859.8 101.6 432.8 310.0 2,047.2
Property, plant and equipment included the following –
Group Company
2016S$ Mil
2015S$ Mil
2016S$ Mil
2015S$ Mil
Net book value of property, plant and equipment
Assets acquired under finance leases 102.0 78.5 37.7 44.2
Interest charges capitalised during the year – 4.0 – –
Staff costs capitalised during the year 236.9 215.6 33.9 21.1
SINGAPORE TELECOMMUNICATIONS LIMITED 179
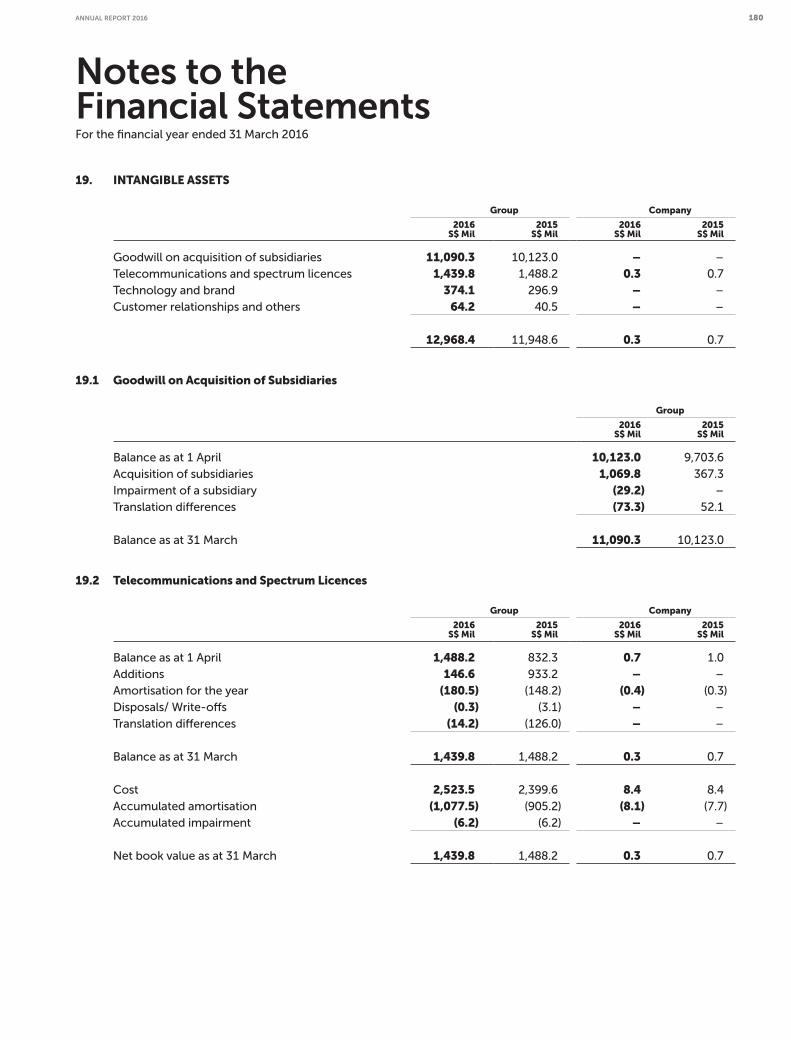
Notes to the Financial StatementsFor the financial year ended 31 March 2016
19. INTANGIBLE ASSETS
Group Company
2016S$ Mil
2015S$ Mil
2016S$ Mil
2015S$ Mil
Goodwill on acquisition of subsidiaries 11,090.3 10,123.0 – –
Telecommunications and spectrum licences 1,439.8 1,488.2 0.3 0.7
Technology and brand 374.1 296.9 – –
Customer relationships and others 64.2 40.5 – –
12,968.4 11,948.6 0.3 0.7
19.1 Goodwill on Acquisition of Subsidiaries
Group
2016S$ Mil
2015S$ Mil
Balance as at 1 April 10,123.0 9,703.6
Acquisition of subsidiaries 1,069.8 367.3
Impairment of a subsidiary (29.2) –
Translation differences (73.3) 52.1
Balance as at 31 March 11,090.3 10,123.0
19.2 Telecommunications and Spectrum Licences
Group Company
2016S$ Mil
2015S$ Mil
2016S$ Mil
2015S$ Mil
Balance as at 1 April 1,488.2 832.3 0.7 1.0
Additions 146.6 933.2 – –
Amortisation for the year (180.5) (148.2) (0.4) (0.3)
Disposals/ Write-offs (0.3) (3.1) – –
Translation differences (14.2) (126.0) – –
Balance as at 31 March 1,439.8 1,488.2 0.3 0.7
Cost 2,523.5 2,399.6 8.4 8.4
Accumulated amortisation (1,077.5) (905.2) (8.1) (7.7)
Accumulated impairment (6.2) (6.2) – –
Net book value as at 31 March 1,439.8 1,488.2 0.3 0.7
ANNUAL REPORT 2016 180
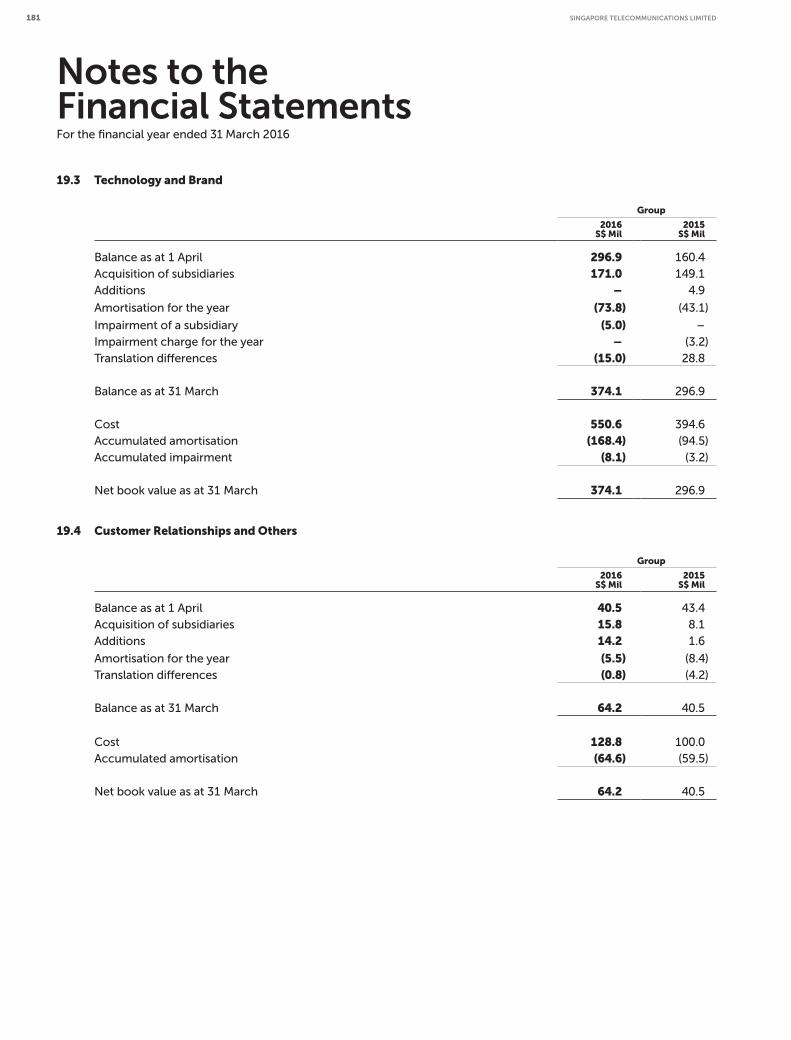
Notes to the Financial StatementsFor the financial year ended 31 March 2016
19.3 Technology and Brand
Group
2016S$ Mil
2015S$ Mil
Balance as at 1 April 296.9 160.4
Acquisition of subsidiaries 171.0 149.1
Additions – 4.9
Amortisation for the year (73.8) (43.1)
Impairment of a subsidiary (5.0) –
Impairment charge for the year – (3.2)
Translation differences (15.0) 28.8
Balance as at 31 March 374.1 296.9
Cost 550.6 394.6
Accumulated amortisation (168.4) (94.5)
Accumulated impairment (8.1) (3.2)
Net book value as at 31 March 374.1 296.9
19.4 Customer Relationships and Others
Group
2016S$ Mil
2015S$ Mil
Balance as at 1 April 40.5 43.4
Acquisition of subsidiaries 15.8 8.1
Additions 14.2 1.6
Amortisation for the year (5.5) (8.4)
Translation differences (0.8) (4.2)
Balance as at 31 March 64.2 40.5
Cost 128.8 100.0
Accumulated amortisation (64.6) (59.5)
Net book value as at 31 March 64.2 40.5
SINGAPORE TELECOMMUNICATIONS LIMITED 181

20. SUBSIDIARIES
Company
2016S$ Mil
2015S$ Mil
Unquoted equity shares, at cost 7,742.5 7,109.6
Shareholders’ advances 6,423.3 6,423.3
Deemed investment in a subsidiary 32.5 32.5
14,198.3 13,565.4
Less: Allowance for impairment losses (16.0) (50.4)
14,182.3 13,515.0
The advances given to subsidiaries were interest-free except for an amount of S$678.3 million (2015: S$678.3 million)
where the effective interest rate as at 31 March 2016 was 1.6 per cent (2015: 0.8 per cent) per annum. The advances
were unsecured with settlement neither planned nor likely to occur in the foreseeable future.
The deemed investment in a subsidiary, Singtel Group Treasury Pte. Ltd. (“SGT”), arose from financial guarantees
provided by the Company for loans drawn down by SGT prior to 1 April 2010.
The significant subsidiaries of the Group are set out in Note 43.1 to Note 43.3.
21. ASSOCIATES
Group Company
2016S$ Mil
2015S$ Mil
2016S$ Mil
2015S$ Mil
Quoted equity shares, at cost 74.3 74.3 24.7 24.7
Unquoted equity shares, at cost 164.4 143.2 578.8 578.8
Shareholder’s loan (unsecured) 1.7 1.7 – –
240.4 219.2 603.5 603.5
Goodwill on consolidation adjusted against
shareholders’ equity (28.3) (28.3) – –
Share of post-acquisition reserves (net of dividends,
and accumulated amortisation of goodwill) 162.0 130.2 – –
Translation differences (17.8) (14.2) – –
115.9 87.7 – –
Less: Allowance for impairment losses – (31.7) – –
356.3 275.2 603.5 603.5
As at 31 March 2016,
(i) The market values of the quoted equity shares in associates held by the Group and the Company were
S$862.4 million (2015: S$1.02 billion) and S$807.7 million (2015: S$968.2 million) respectively.
(ii) The Group’s proportionate interest in the capital commitments of the associates was S$154.3 million (2015:
S$76.8 million).
The Group does not have any individually significant associates. The details of associates are set out in Note 43.4.
Notes to the Financial StatementsFor the financial year ended 31 March 2016
ANNUAL REPORT 2016 182
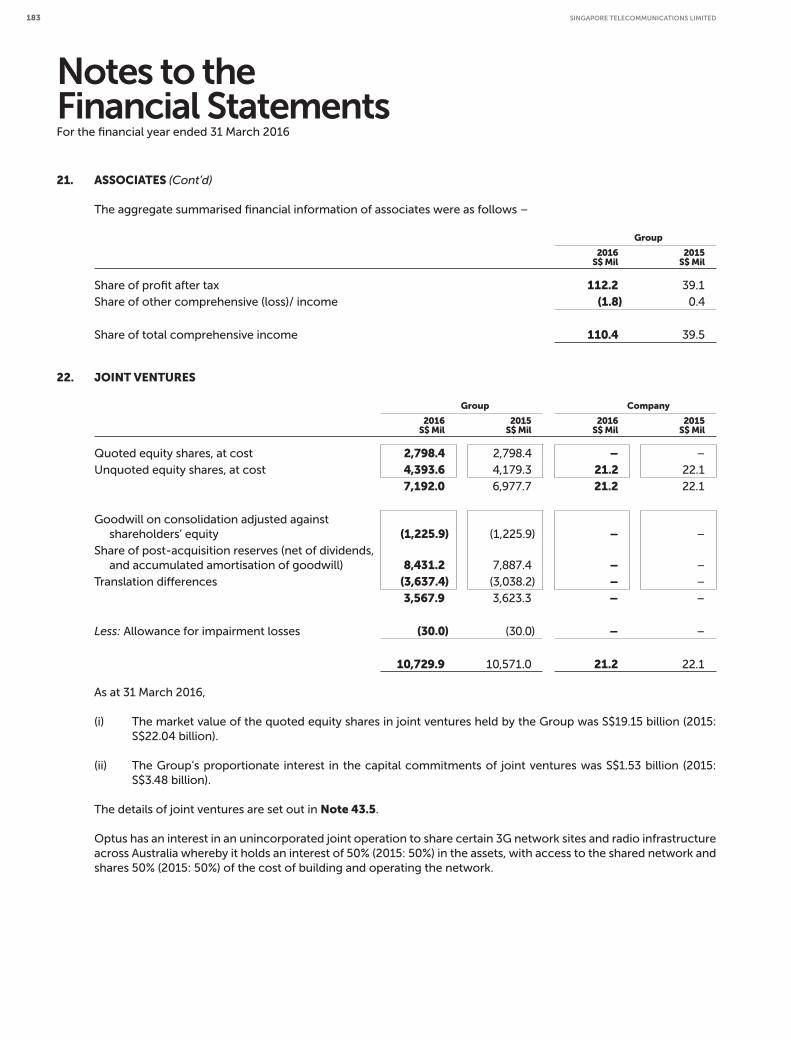
Notes to the Financial StatementsFor the financial year ended 31 March 2016
21. ASSOCIATES (Cont’d)
The aggregate summarised financial information of associates were as follows –
Group
2016S$ Mil
2015S$ Mil
Share of profit after tax 112.2 39.1
Share of other comprehensive (loss)/ income (1.8) 0.4
Share of total comprehensive income 110.4 39.5
22. JOINT VENTURES
Group Company
2016S$ Mil
2015S$ Mil
2016S$ Mil
2015S$ Mil
Quoted equity shares, at cost 2,798.4 2,798.4 – –
Unquoted equity shares, at cost 4,393.6 4,179.3 21.2 22.1
7,192.0 6,977.7 21.2 22.1
Goodwill on consolidation adjusted against
shareholders’ equity (1,225.9) (1,225.9) – –
Share of post-acquisition reserves (net of dividends,
and accumulated amortisation of goodwill) 8,431.2 7,887.4 – –
Translation differences (3,637.4) (3,038.2) – –
3,567.9 3,623.3 – –
Less: Allowance for impairment losses (30.0) (30.0) – –
10,729.9 10,571.0 21.2 22.1
As at 31 March 2016,
(i) The market value of the quoted equity shares in joint ventures held by the Group was S$19.15 billion (2015:
S$22.04 billion).
(ii) The Group’s proportionate interest in the capital commitments of joint ventures was S$1.53 billion (2015:
S$3.48 billion).
The details of joint ventures are set out in Note 43.5.
Optus has an interest in an unincorporated joint operation to share certain 3G network sites and radio infrastructure
across Australia whereby it holds an interest of 50% (2015: 50%) in the assets, with access to the shared network and
shares 50% (2015: 50%) of the cost of building and operating the network.
SINGAPORE TELECOMMUNICATIONS LIMITED 183
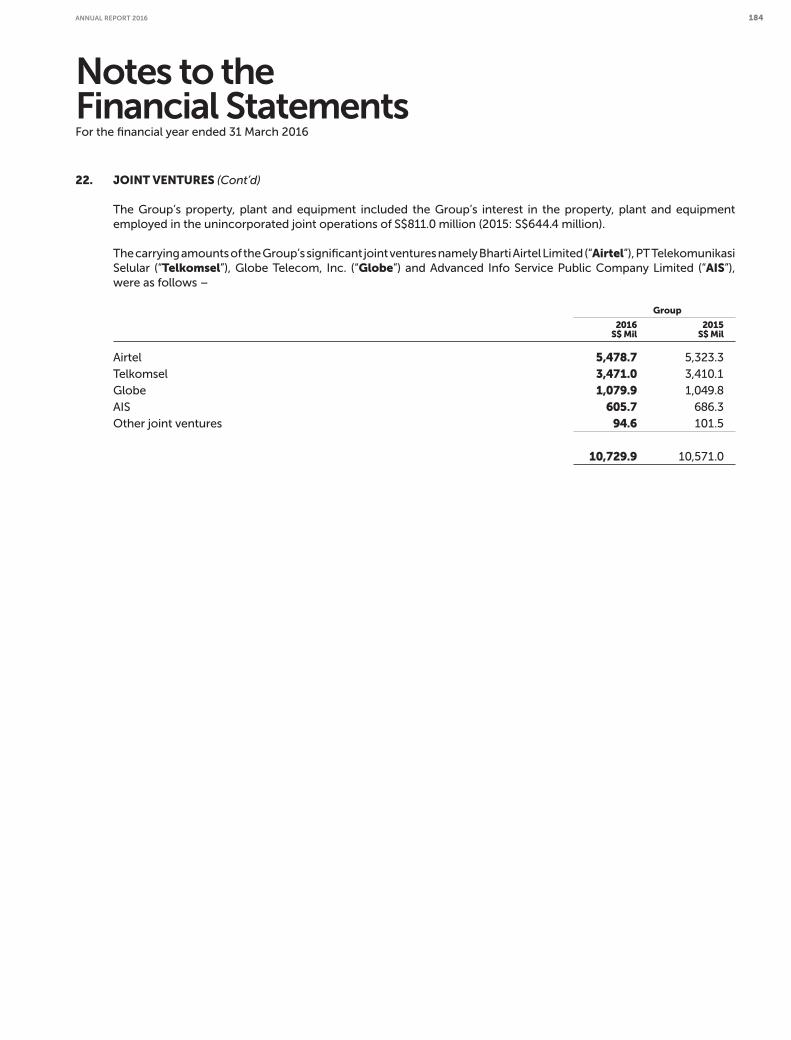
Notes to the Financial StatementsFor the financial year ended 31 March 2016
22. JOINT VENTURES (Cont’d)
The Group’s property, plant and equipment included the Group’s interest in the property, plant and equipment
employed in the unincorporated joint operations of S$811.0 million (2015: S$644.4 million).
The carrying amounts of the Group’s significant joint ventures namely Bharti Airtel Limited (“Airtel”), PT Telekomunikasi
Selular (“Telkomsel”), Globe Telecom, Inc. (“Globe”) and Advanced Info Service Public Company Limited (“AIS”),
were as follows –
Group
2016S$ Mil
2015S$ Mil
Airtel 5,478.7 5,323.3
Telkomsel 3,471.0 3,410.1
Globe 1,079.9 1,049.8
AIS 605.7 686.3
Other joint ventures 94.6 101.5
10,729.9 10,571.0
ANNUAL REPORT 2016 184

Notes to the Financial StatementsFor the financial year ended 31 March 2016
22. JOINT VENTURES (Cont’d)
The summarised financial information of the significant joint ventures based on their financial statements and a
reconciliation with the carrying amounts of the investments in the consolidated financial statements were as follows –
Group – 2016Airtel
S$ MilTelkomsel
S$ MilGlobe S$ Mil
AISS$ Mil
Statement of comprehensive income Revenue 20,460.8 8,069.1 3,704.1 6,020.9 Depreciation and amortisation (3,697.3) (1,352.6) (687.3) (758.3)Interest income 677.1 99.1 11.2 7.9 Interest expense (2,136.7) (90.3) (102.4) (89.2)Income tax expense (1,259.7) (806.4) (212.4) (331.5)
Profit after tax 1,162.8 2,449.6 498.5 1,479.6 Other comprehensive loss (175.7) – (11.0) (20.4)
Total comprehensive income 987.1 2,449.6 487.5 1,459.2
Statement of financial position Current assets 4,651.5 3,823.9 1,381.8 1,540.1 Non-current assets 41,075.9 5,708.6 4,353.6 5,864.0 Current liabilities (11,841.7) (2,370.6) (1,976.4) (3,102.0)Non-current liabilities (19,482.6) (1,255.1) (1,975.4) (2,876.2)Net assets 14,403.1 5,906.8 1,783.6 1,425.9
Less: Non-controlling interests (1,057.1) – 0.1 (4.5)
Net assets attributable to equity holders 13,346.0 5,906.8 1,783.7 1,421.4
Proportion of the Group’s ownership 32.9% 35.0% 47.2% 23.3%Group’s share of net assets 4,390.8 2,067.4 841.9 331.2 Goodwill capitalised 805.0 1,403.6 386.5 276.4 Other adjustments 282.9 – (148.5) (1.9)
Carrying amount of the investment 5,478.7 3,471.0 1,079.9 605.7 Other itemsCash and cash equivalents 754.2 2,442.0 302.6 609.4 Non-current financial liabilities excluding trade
and other payables and provisions (18,648.4) (1,010.5) (1,779.0) (1,978.6)Current financial liabilities excluding trade and
other payables and provisions (1,699.9) (66.8) (281.7) (163.2)
Group’s share of market value 10,244.3 NA 4,073.9 4,827.5
Dividends received during the year 28.0 721.6 156.6 346.2
SINGAPORE TELECOMMUNICATIONS LIMITED 185

Notes to the Financial StatementsFor the financial year ended 31 March 2016
22. JOINT VENTURES (Cont’d)
Group – 2015Airtel
S$ MilTelkomsel
S$ MilGlobe S$ Mil
AISS$ Mil
Statement of comprehensive income Revenue 19,397.7 7,251.2 3,111.4 6,090.3
Depreciation and amortisation (3,272.9) (1,246.9) (560.6) (799.0)
Interest income 523.8 73.8 20.8 15.6
Interest expense (1,552.3) (66.8) (78.0) (68.6)
Income tax expense (1,136.4) (690.6) (189.1) (398.6)
Profit after tax 1,091.9 2,115.9 425.6 1,449.3
Other comprehensive (loss)/ income (837.9) (9.4) (8.3) 0.1
Total comprehensive income 254.0 2,106.5 417.3 1,449.4
Statement of financial position Current assets 5,884.3 2,771.7 1,435.1 2,044.6
Non-current assets 37,157.4 5,945.8 4,080.1 3,820.4
Current liabilities (13,947.7) (2,121.3) (1,803.0) (2,698.0)
Non-current liabilities (14,406.3) (863.3) (1,989.2) (1,516.8)
Net assets 14,687.7 5,732.9 1,723.0 1,650.2
Less: Non-controlling interests (1,066.8) – (0.2) (4.8)
Net assets attributable to equity holders 13,620.9 5,732.9 1,722.8 1,645.4
Proportion of the Group’s ownership 32.4% 35.0% 47.2% 23.3%
Group’s share of net assets 4,413.2 2,006.5 813.2 383.7
Goodwill capitalised 866.7 1,403.6 391.0 305.0
Other adjustments 43.4 – (154.4) (2.4)
Carrying amount of the investment 5,323.3 3,410.1 1,049.8 686.3
Other itemsCash and cash equivalents 257.6 1,402.1 513.3 989.5
Non-current financial liabilities excluding trade
and other payables and provisions (13,490.0) (542.0) (1,815.9) (1,423.9)
Current financial liabilities excluding trade and
other payables and provisions (4,661.1) (254.2) (172.2) (136.1)
Group’s share of market value 11,214.8 NA 3,882.2 6,942.4
Dividends received during the year 42.5 665.7 105.6 313.7
“NA” denotes Not Applicable.
ANNUAL REPORT 2016 186
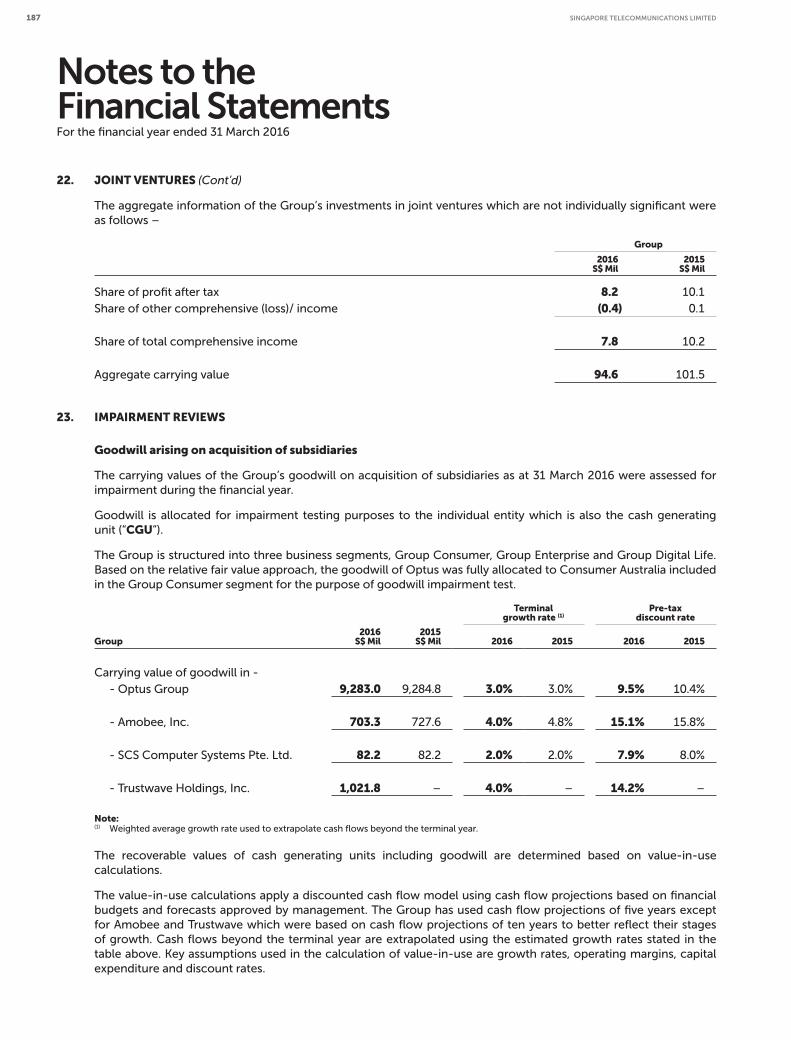
Notes to the Financial StatementsFor the financial year ended 31 March 2016
22. JOINT VENTURES (Cont’d)
The aggregate information of the Group’s investments in joint ventures which are not individually significant were
as follows –
Group
2016S$ Mil
2015S$ Mil
Share of profit after tax 8.2 10.1
Share of other comprehensive (loss)/ income (0.4) 0.1
Share of total comprehensive income 7.8 10.2
Aggregate carrying value 94.6 101.5
23. IMPAIRMENT REVIEWS
Goodwill arising on acquisition of subsidiaries
The carrying values of the Group’s goodwill on acquisition of subsidiaries as at 31 March 2016 were assessed for
impairment during the financial year.
Goodwill is allocated for impairment testing purposes to the individual entity which is also the cash generating
unit (“CGU”).
The Group is structured into three business segments, Group Consumer, Group Enterprise and Group Digital Life.
Based on the relative fair value approach, the goodwill of Optus was fully allocated to Consumer Australia included
in the Group Consumer segment for the purpose of goodwill impairment test.
Terminal
growth rate (1) Pre-tax
discount rate
Group2016
S$ Mil2015
S$ Mil 2016 2015 2016 2015
Carrying value of goodwill in -
- Optus Group 9,283.0 9,284.8 3.0% 3.0% 9.5% 10.4%
- Amobee, Inc. 703.3 727.6 4.0% 4.8% 15.1% 15.8%
- SCS Computer Systems Pte. Ltd. 82.2 82.2 2.0% 2.0% 7.9% 8.0%
- Trustwave Holdings, Inc. 1,021.8 – 4.0% – 14.2% –
Note:(1) Weighted average growth rate used to extrapolate cash flows beyond the terminal year.
The recoverable values of cash generating units including goodwill are determined based on value-in-use
calculations.
The value-in-use calculations apply a discounted cash flow model using cash flow projections based on financial
budgets and forecasts approved by management. The Group has used cash flow projections of five years except
for Amobee and Trustwave which were based on cash flow projections of ten years to better reflect their stages
of growth. Cash flows beyond the terminal year are extrapolated using the estimated growth rates stated in the
table above. Key assumptions used in the calculation of value-in-use are growth rates, operating margins, capital
expenditure and discount rates.
SINGAPORE TELECOMMUNICATIONS LIMITED 187
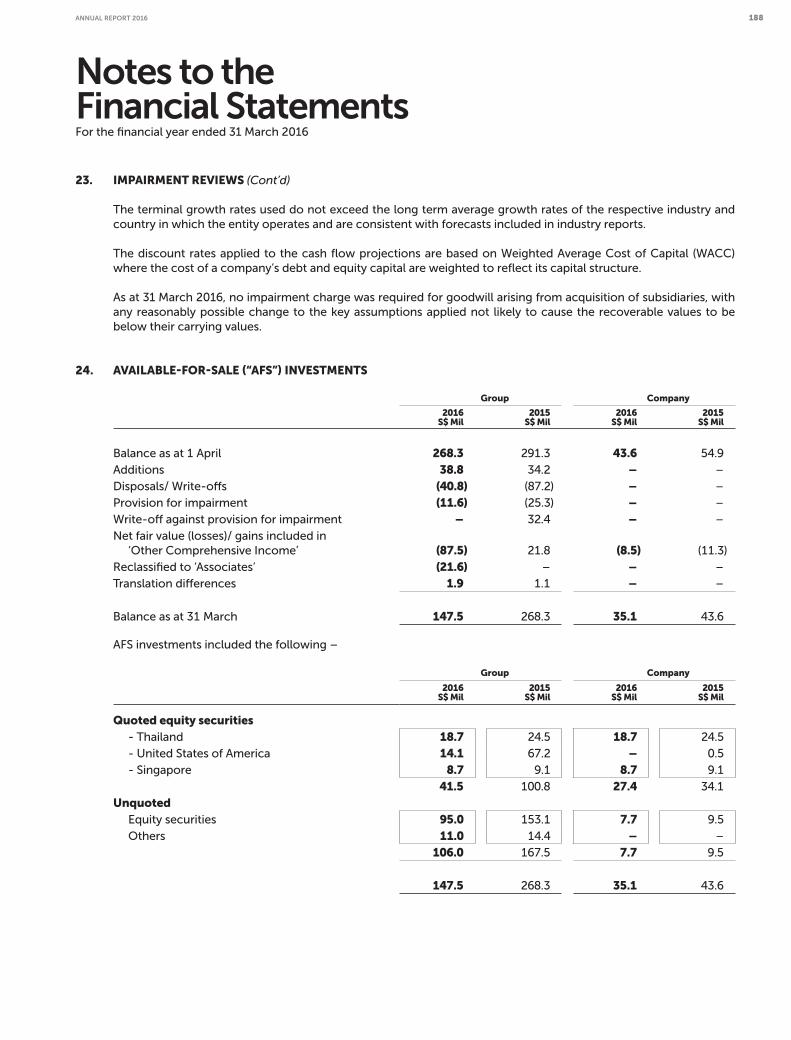
Notes to the Financial StatementsFor the financial year ended 31 March 2016
23. IMPAIRMENT REVIEWS (Cont’d)
The terminal growth rates used do not exceed the long term average growth rates of the respective industry and
country in which the entity operates and are consistent with forecasts included in industry reports.
The discount rates applied to the cash flow projections are based on Weighted Average Cost of Capital (WACC)
where the cost of a company’s debt and equity capital are weighted to reflect its capital structure.
As at 31 March 2016, no impairment charge was required for goodwill arising from acquisition of subsidiaries, with
any reasonably possible change to the key assumptions applied not likely to cause the recoverable values to be
below their carrying values.
24. AVAILABLE-FOR-SALE (“AFS”) INVESTMENTS
Group Company
2016S$ Mil
2015S$ Mil
2016S$ Mil
2015S$ Mil
Balance as at 1 April 268.3 291.3 43.6 54.9
Additions 38.8 34.2 – –
Disposals/ Write-offs (40.8) (87.2) – –
Provision for impairment (11.6) (25.3) – –
Write-off against provision for impairment – 32.4 – –
Net fair value (losses)/ gains included in
‘Other Comprehensive Income’ (87.5) 21.8 (8.5) (11.3)
Reclassified to ‘Associates’ (21.6) – – –
Translation differences 1.9 1.1 – –
Balance as at 31 March 147.5 268.3 35.1 43.6
AFS investments included the following –
Group Company
2016S$ Mil
2015S$ Mil
2016S$ Mil
2015S$ Mil
Quoted equity securities
- Thailand 18.7 24.5 18.7 24.5
- United States of America 14.1 67.2 – 0.5
- Singapore 8.7 9.1 8.7 9.1
41.5 100.8 27.4 34.1
Unquoted
Equity securities 95.0 153.1 7.7 9.5
Others 11.0 14.4 – –
106.0 167.5 7.7 9.5
147.5 268.3 35.1 43.6
ANNUAL REPORT 2016 188
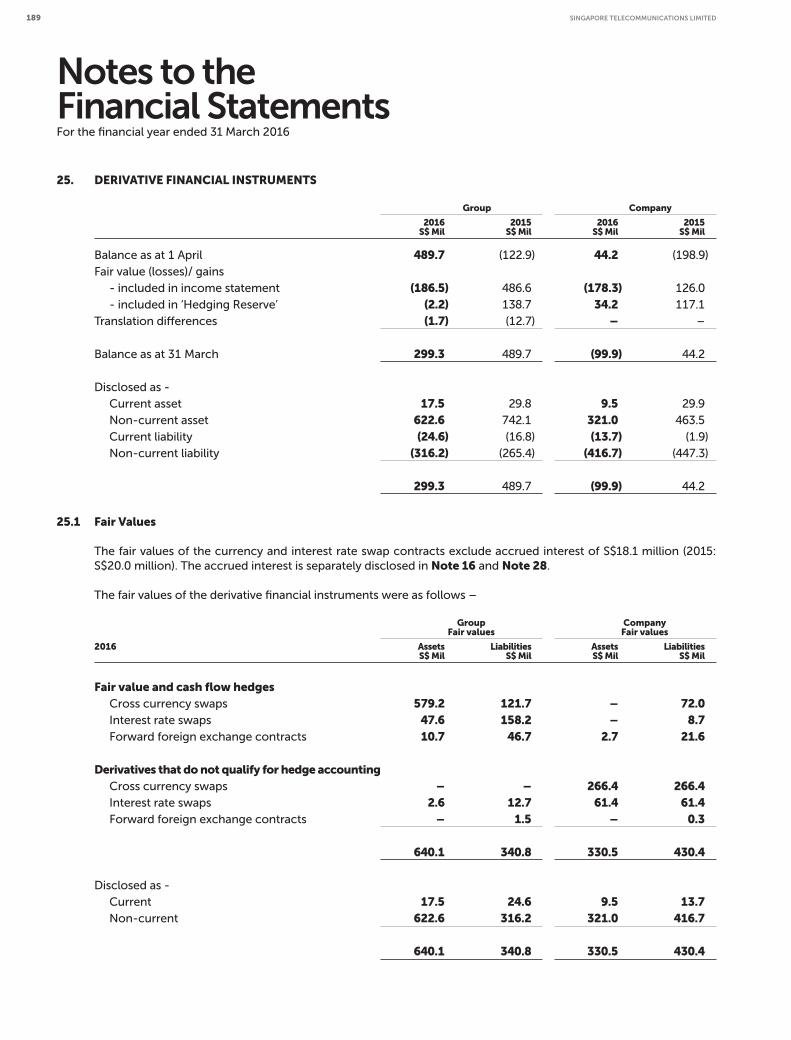
Notes to the Financial StatementsFor the financial year ended 31 March 2016
25. DERIVATIVE FINANCIAL INSTRUMENTS
Group Company
2016S$ Mil
2015S$ Mil
2016S$ Mil
2015S$ Mil
Balance as at 1 April 489.7 (122.9) 44.2 (198.9)
Fair value (losses)/ gains
- included in income statement (186.5) 486.6 (178.3) 126.0
- included in ‘Hedging Reserve’ (2.2) 138.7 34.2 117.1
Translation differences (1.7) (12.7) – –
Balance as at 31 March 299.3 489.7 (99.9) 44.2
Disclosed as -
Current asset 17.5 29.8 9.5 29.9
Non-current asset 622.6 742.1 321.0 463.5
Current liability (24.6) (16.8) (13.7) (1.9)
Non-current liability (316.2) (265.4) (416.7) (447.3)
299.3 489.7 (99.9) 44.2
25.1 Fair Values
The fair values of the currency and interest rate swap contracts exclude accrued interest of S$18.1 million (2015:
S$20.0 million). The accrued interest is separately disclosed in Note 16 and Note 28.
The fair values of the derivative financial instruments were as follows –
GroupFair values
CompanyFair values
2016 AssetsS$ Mil
LiabilitiesS$ Mil
AssetsS$ Mil
LiabilitiesS$ Mil
Fair value and cash flow hedges Cross currency swaps 579.2 121.7 – 72.0 Interest rate swaps 47.6 158.2 – 8.7 Forward foreign exchange contracts 10.7 46.7 2.7 21.6
Derivatives that do not qualify for hedge accounting Cross currency swaps – – 266.4 266.4 Interest rate swaps 2.6 12.7 61.4 61.4 Forward foreign exchange contracts – 1.5 – 0.3
640.1 340.8 330.5 430.4
Disclosed as - Current 17.5 24.6 9.5 13.7 Non-current 622.6 316.2 321.0 416.7
640.1 340.8 330.5 430.4
SINGAPORE TELECOMMUNICATIONS LIMITED 189
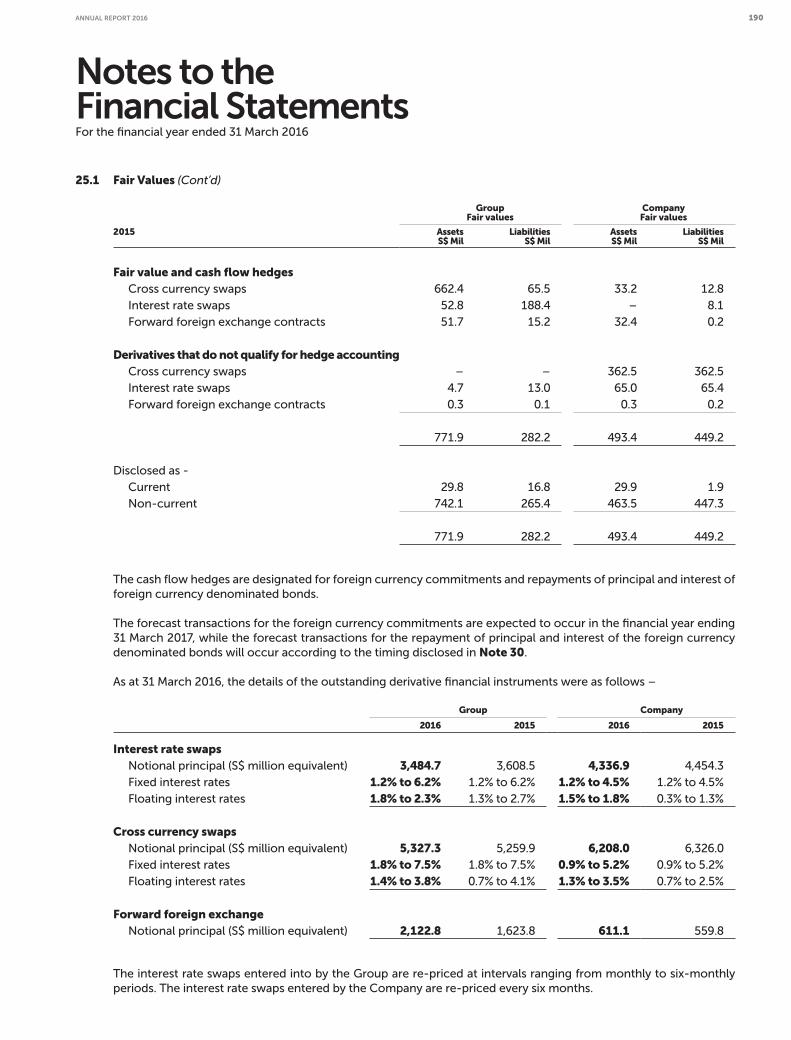
Notes to the Financial StatementsFor the financial year ended 31 March 2016
25.1 Fair Values (Cont’d)
GroupFair values
CompanyFair values
2015 AssetsS$ Mil
LiabilitiesS$ Mil
AssetsS$ Mil
LiabilitiesS$ Mil
Fair value and cash flow hedges Cross currency swaps 662.4 65.5 33.2 12.8
Interest rate swaps 52.8 188.4 – 8.1
Forward foreign exchange contracts 51.7 15.2 32.4 0.2
Derivatives that do not qualify for hedge accounting Cross currency swaps – – 362.5 362.5
Interest rate swaps 4.7 13.0 65.0 65.4
Forward foreign exchange contracts 0.3 0.1 0.3 0.2
771.9 282.2 493.4 449.2
Disclosed as - Current 29.8 16.8 29.9 1.9
Non-current 742.1 265.4 463.5 447.3
771.9 282.2 493.4 449.2
The cash flow hedges are designated for foreign currency commitments and repayments of principal and interest of
foreign currency denominated bonds.
The forecast transactions for the foreign currency commitments are expected to occur in the financial year ending
31 March 2017, while the forecast transactions for the repayment of principal and interest of the foreign currency
denominated bonds will occur according to the timing disclosed in Note 30.
As at 31 March 2016, the details of the outstanding derivative financial instruments were as follows –
Group Company
2016 2015 2016 2015
Interest rate swapsNotional principal (S$ million equivalent) 3,484.7 3,608.5 4,336.9 4,454.3
Fixed interest rates 1.2% to 6.2% 1.2% to 6.2% 1.2% to 4.5% 1.2% to 4.5%
Floating interest rates 1.8% to 2.3% 1.3% to 2.7% 1.5% to 1.8% 0.3% to 1.3%
Cross currency swapsNotional principal (S$ million equivalent) 5,327.3 5,259.9 6,208.0 6,326.0
Fixed interest rates 1.8% to 7.5% 1.8% to 7.5% 0.9% to 5.2% 0.9% to 5.2%
Floating interest rates 1.4% to 3.8% 0.7% to 4.1% 1.3% to 3.5% 0.7% to 2.5%
Forward foreign exchangeNotional principal (S$ million equivalent) 2,122.8 1,623.8 611.1 559.8
The interest rate swaps entered into by the Group are re-priced at intervals ranging from monthly to six-monthly
periods. The interest rate swaps entered by the Company are re-priced every six months.
ANNUAL REPORT 2016 190
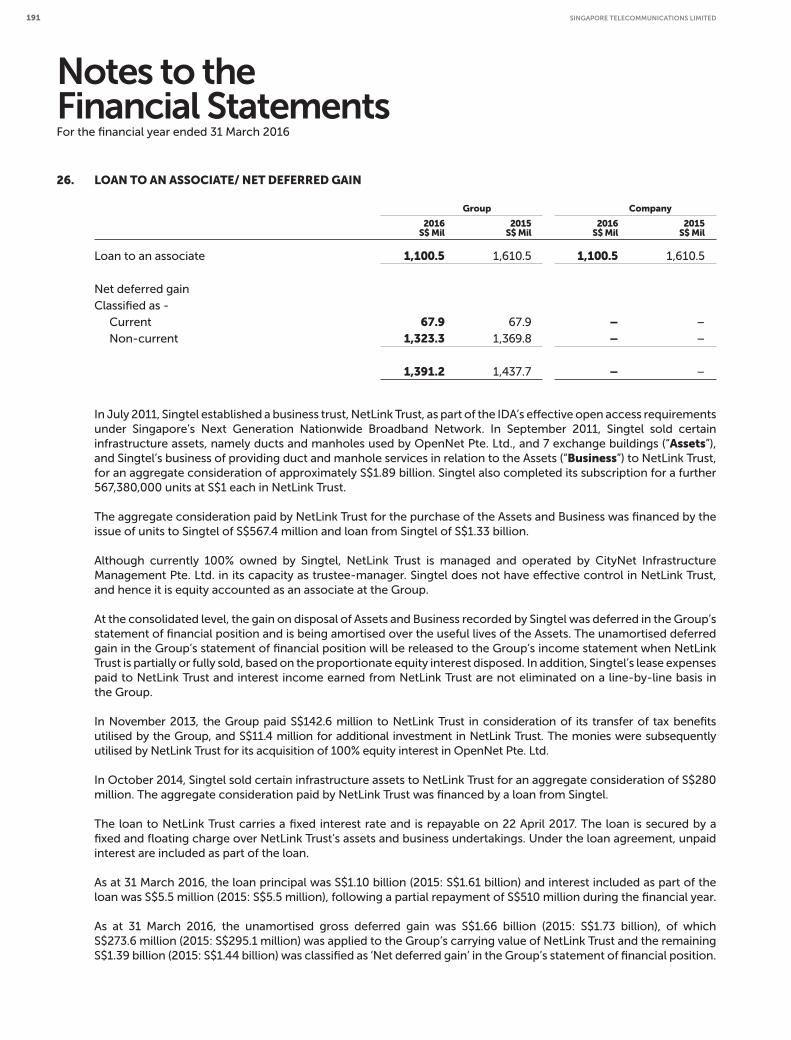
Notes to the Financial StatementsFor the financial year ended 31 March 2016
26. LOAN TO AN ASSOCIATE/ NET DEFERRED GAIN
Group Company
2016S$ Mil
2015S$ Mil
2016S$ Mil
2015S$ Mil
Loan to an associate 1,100.5 1,610.5 1,100.5 1,610.5
Net deferred gain
Classified as -
Current 67.9 67.9 – –
Non-current 1,323.3 1,369.8 – –
1,391.2 1,437.7 – –
In July 2011, Singtel established a business trust, NetLink Trust, as part of the IDA’s effective open access requirements
under Singapore’s Next Generation Nationwide Broadband Network. In September 2011, Singtel sold certain
infrastructure assets, namely ducts and manholes used by OpenNet Pte. Ltd., and 7 exchange buildings (“Assets”),
and Singtel’s business of providing duct and manhole services in relation to the Assets (“Business”) to NetLink Trust,
for an aggregate consideration of approximately S$1.89 billion. Singtel also completed its subscription for a further
567,380,000 units at S$1 each in NetLink Trust.
The aggregate consideration paid by NetLink Trust for the purchase of the Assets and Business was financed by the
issue of units to Singtel of S$567.4 million and loan from Singtel of S$1.33 billion.
Although currently 100% owned by Singtel, NetLink Trust is managed and operated by CityNet Infrastructure
Management Pte. Ltd. in its capacity as trustee-manager. Singtel does not have effective control in NetLink Trust,
and hence it is equity accounted as an associate at the Group.
At the consolidated level, the gain on disposal of Assets and Business recorded by Singtel was deferred in the Group’s
statement of financial position and is being amortised over the useful lives of the Assets. The unamortised deferred
gain in the Group’s statement of financial position will be released to the Group’s income statement when NetLink
Trust is partially or fully sold, based on the proportionate equity interest disposed. In addition, Singtel’s lease expenses
paid to NetLink Trust and interest income earned from NetLink Trust are not eliminated on a line-by-line basis in
the Group.
In November 2013, the Group paid S$142.6 million to NetLink Trust in consideration of its transfer of tax benefits
utilised by the Group, and S$11.4 million for additional investment in NetLink Trust. The monies were subsequently
utilised by NetLink Trust for its acquisition of 100% equity interest in OpenNet Pte. Ltd.
In October 2014, Singtel sold certain infrastructure assets to NetLink Trust for an aggregate consideration of S$280
million. The aggregate consideration paid by NetLink Trust was financed by a loan from Singtel.
The loan to NetLink Trust carries a fixed interest rate and is repayable on 22 April 2017. The loan is secured by a
fixed and floating charge over NetLink Trust’s assets and business undertakings. Under the loan agreement, unpaid
interest are included as part of the loan.
As at 31 March 2016, the loan principal was S$1.10 billion (2015: S$1.61 billion) and interest included as part of the
loan was S$5.5 million (2015: S$5.5 million), following a partial repayment of S$510 million during the financial year.
As at 31 March 2016, the unamortised gross deferred gain was S$1.66 billion (2015: S$1.73 billion), of which
S$273.6 million (2015: S$295.1 million) was applied to the Group’s carrying value of NetLink Trust and the remaining
S$1.39 billion (2015: S$1.44 billion) was classified as ‘Net deferred gain’ in the Group’s statement of financial position.
SINGAPORE TELECOMMUNICATIONS LIMITED 191
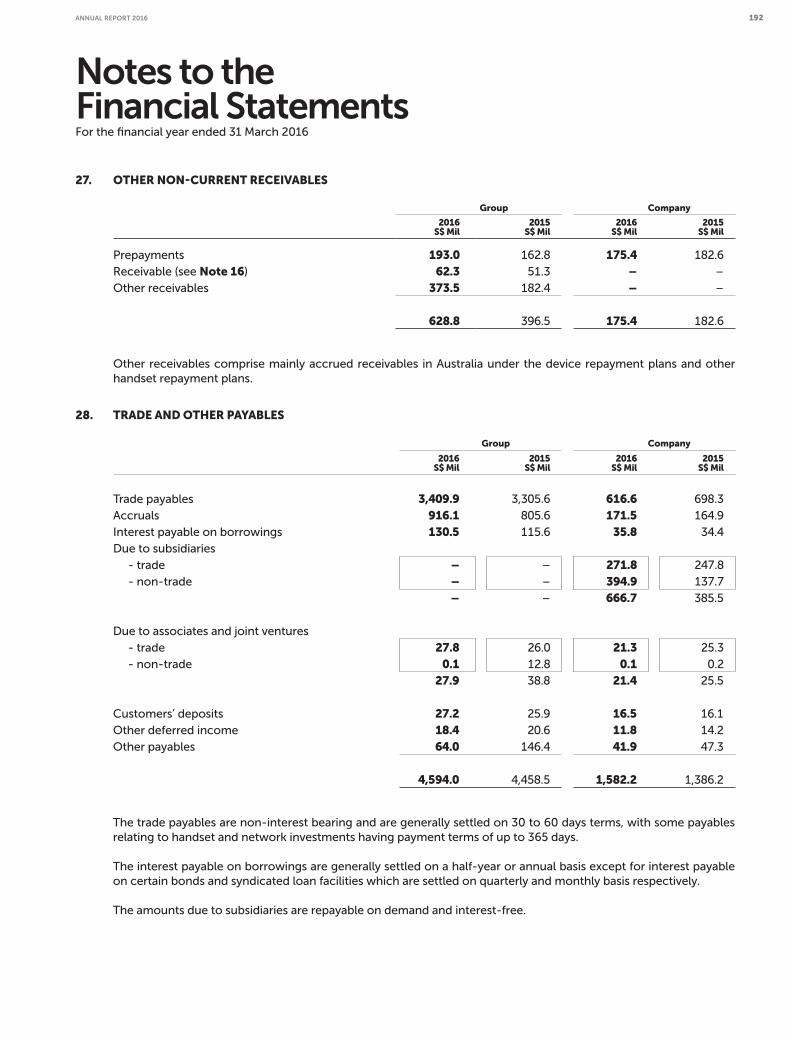
Notes to the Financial StatementsFor the financial year ended 31 March 2016
27. OTHER NON-CURRENT RECEIVABLES
Group Company
2016S$ Mil
2015S$ Mil
2016S$ Mil
2015S$ Mil
Prepayments 193.0 162.8 175.4 182.6
Receivable (see Note 16) 62.3 51.3 – –
Other receivables 373.5 182.4 – –
628.8 396.5 175.4 182.6
Other receivables comprise mainly accrued receivables in Australia under the device repayment plans and other
handset repayment plans.
28. TRADE AND OTHER PAYABLES
Group Company
2016S$ Mil
2015S$ Mil
2016S$ Mil
2015S$ Mil
Trade payables 3,409.9 3,305.6 616.6 698.3
Accruals 916.1 805.6 171.5 164.9
Interest payable on borrowings 130.5 115.6 35.8 34.4
Due to subsidiaries
- trade – – 271.8 247.8
- non-trade – – 394.9 137.7
– – 666.7 385.5
Due to associates and joint ventures
- trade 27.8 26.0 21.3 25.3
- non-trade 0.1 12.8 0.1 0.2
27.9 38.8 21.4 25.5
Customers’ deposits 27.2 25.9 16.5 16.1
Other deferred income 18.4 20.6 11.8 14.2
Other payables 64.0 146.4 41.9 47.3
4,594.0 4,458.5 1,582.2 1,386.2
The trade payables are non-interest bearing and are generally settled on 30 to 60 days terms, with some payables
relating to handset and network investments having payment terms of up to 365 days.
The interest payable on borrowings are generally settled on a half-year or annual basis except for interest payable
on certain bonds and syndicated loan facilities which are settled on quarterly and monthly basis respectively.
The amounts due to subsidiaries are repayable on demand and interest-free.
ANNUAL REPORT 2016 192
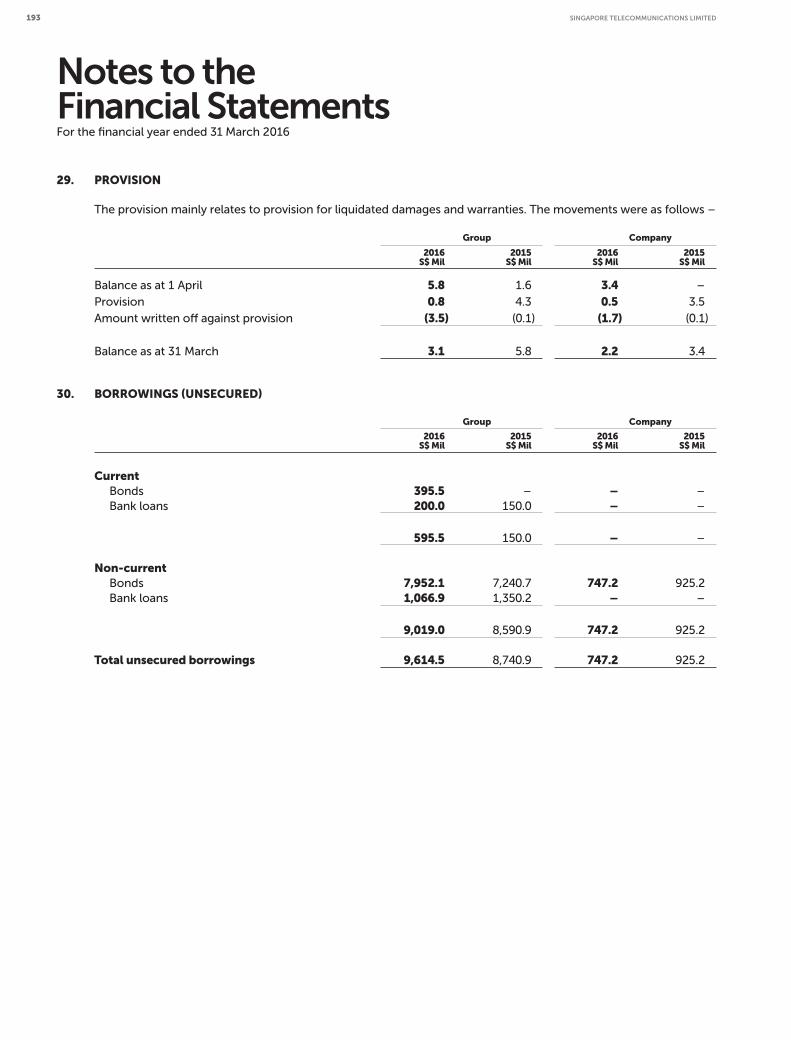
Notes to the Financial StatementsFor the financial year ended 31 March 2016
29. PROVISION
The provision mainly relates to provision for liquidated damages and warranties. The movements were as follows –
Group Company
2016S$ Mil
2015S$ Mil
2016S$ Mil
2015S$ Mil
Balance as at 1 April 5.8 1.6 3.4 –
Provision 0.8 4.3 0.5 3.5
Amount written off against provision (3.5) (0.1) (1.7) (0.1)
Balance as at 31 March 3.1 5.8 2.2 3.4
30. BORROWINGS (UNSECURED)
Group Company
2016S$ Mil
2015S$ Mil
2016S$ Mil
2015S$ Mil
Current Bonds 395.5 – – –
Bank loans 200.0 150.0 – –
595.5 150.0 – –
Non-current
Bonds 7,952.1 7,240.7 747.2 925.2
Bank loans 1,066.9 1,350.2 – –
9,019.0 8,590.9 747.2 925.2
Total unsecured borrowings 9,614.5 8,740.9 747.2 925.2
SINGAPORE TELECOMMUNICATIONS LIMITED 193

Notes to the Financial StatementsFor the financial year ended 31 March 2016
30.1 Bonds
Group Company
Principal amount2016
S$ Mil2015
S$ Mil2016
S$ Mil2015
S$ Mil
US$500 million (1)(2) 697.5 713.2 – –
US$1,800 million (2) (2015: US$1,300 million) 2,515.9 1,885.5 – –
US$500 million (2) 747.2 925.2 747.2 925.2
US$400 million 538.7 550.3 – –
€700 million (1)(2) 1,104.2 1,066.9 – –
A$625 million (1) (2015: A$375 million) 642.0 390.8 – –
S$800 million (2015: S$550 million) 800.0 550.0 – –
S$600 million (2) 600.0 600.0 – –
S$150 million (1) 149.9 – – –
¥10,000 million 122.3 116.2 – –
HK$1,450 million 256.3 265.4 – –
HK$1,000 million (1) 173.6 177.2 – –
8,347.6 7,240.7 747.2 925.2
Classified as -
Current 395.5 – – –
Non-current 7,952.1 7,240.7 747.2 925.2
8,347.6 7,240.7 747.2 925.2
Notes:(1) The bonds, issued by Optus Group, are subject to a negative pledge that limits the amount of secured indebtedness of certain subsidiaries of Optus.(2) The bonds are listed on the Singapore Exchange.
30.2 Bank Loans
Group
2016S$ Mil
2015S$ Mil
Current 200.0 150.0
Non-current 1,066.9 1,350.2
1,266.9 1,500.2
ANNUAL REPORT 2016 194
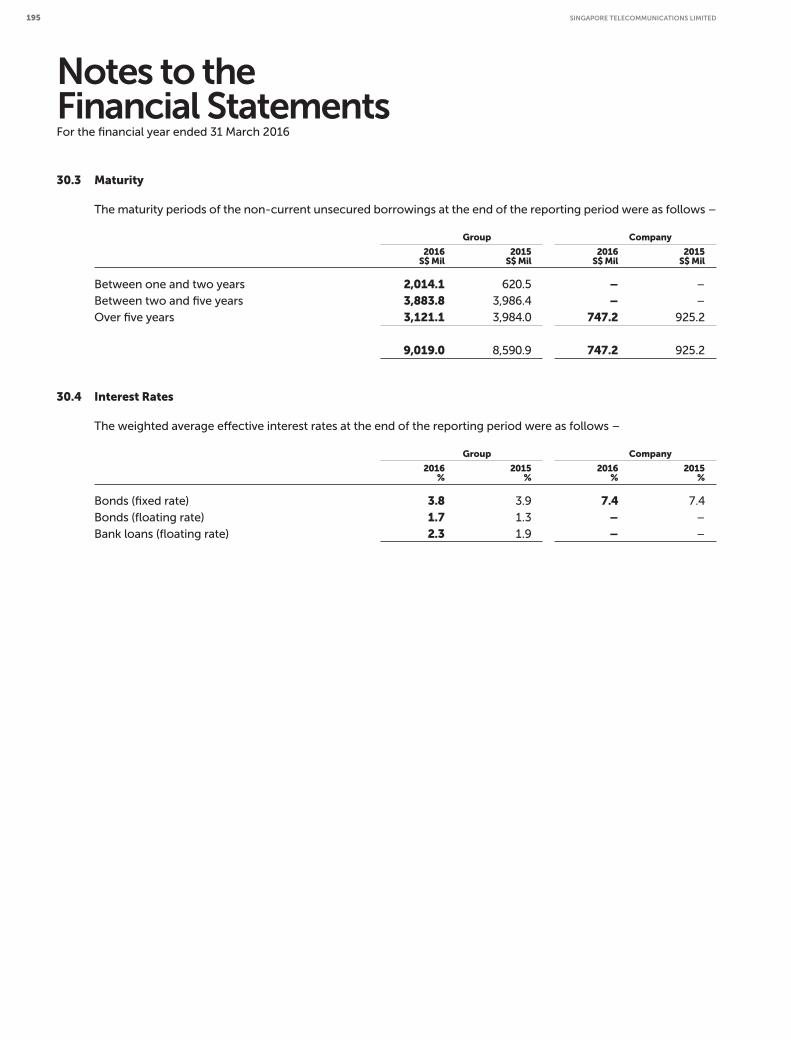
Notes to the Financial StatementsFor the financial year ended 31 March 2016
30.3 Maturity
The maturity periods of the non-current unsecured borrowings at the end of the reporting period were as follows –
Group Company
2016S$ Mil
2015S$ Mil
2016S$ Mil
2015S$ Mil
Between one and two years 2,014.1 620.5 – –
Between two and five years 3,883.8 3,986.4 – –
Over five years 3,121.1 3,984.0 747.2 925.2
9,019.0 8,590.9 747.2 925.2
30.4 Interest Rates
The weighted average effective interest rates at the end of the reporting period were as follows –
Group Company
2016%
2015%
2016%
2015%
Bonds (fixed rate) 3.8 3.9 7.4 7.4
Bonds (floating rate) 1.7 1.3 – –
Bank loans (floating rate) 2.3 1.9 – –
SINGAPORE TELECOMMUNICATIONS LIMITED 195
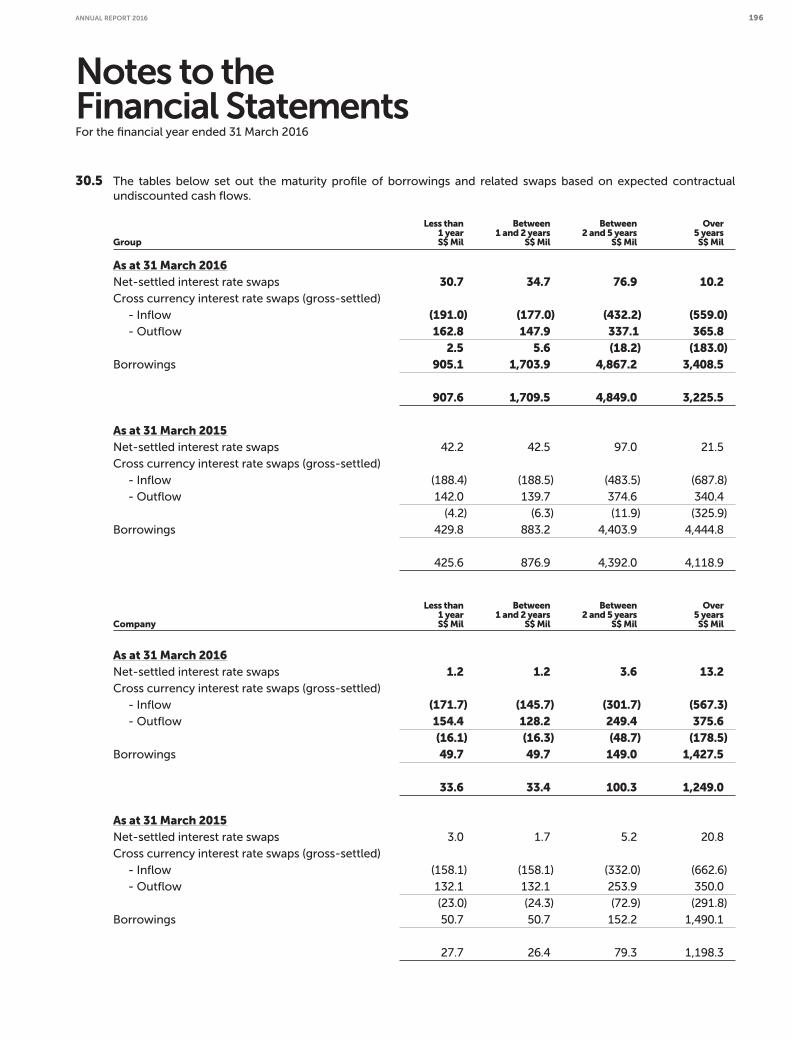
Notes to the Financial StatementsFor the financial year ended 31 March 2016
30.5 The tables below set out the maturity profile of borrowings and related swaps based on expected contractual
undiscounted cash flows.
Group
Less than1 yearS$ Mil
Between 1 and 2 years
S$ Mil
Between 2 and 5 years
S$ Mil
Over 5 yearsS$ Mil
As at 31 March 2016
Net-settled interest rate swaps 30.7 34.7 76.9 10.2 Cross currency interest rate swaps (gross-settled)
- Inflow (191.0) (177.0) (432.2) (559.0) - Outflow 162.8 147.9 337.1 365.8 2.5 5.6 (18.2) (183.0)Borrowings 905.1 1,703.9 4,867.2 3,408.5
907.6 1,709.5 4,849.0 3,225.5
As at 31 March 2015
Net-settled interest rate swaps 42.2 42.5 97.0 21.5
Cross currency interest rate swaps (gross-settled)
- Inflow (188.4) (188.5) (483.5) (687.8)
- Outflow 142.0 139.7 374.6 340.4
(4.2) (6.3) (11.9) (325.9)
Borrowings 429.8 883.2 4,403.9 4,444.8
425.6 876.9 4,392.0 4,118.9
Company
Less than1 yearS$ Mil
Between 1 and 2 years
S$ Mil
Between 2 and 5 years
S$ Mil
Over 5 years S$ Mil
As at 31 March 2016Net-settled interest rate swaps 1.2 1.2 3.6 13.2 Cross currency interest rate swaps (gross-settled)
- Inflow (171.7) (145.7) (301.7) (567.3) - Outflow 154.4 128.2 249.4 375.6 (16.1) (16.3) (48.7) (178.5)Borrowings 49.7 49.7 149.0 1,427.5
33.6 33.4 100.3 1,249.0
As at 31 March 2015Net-settled interest rate swaps 3.0 1.7 5.2 20.8
Cross currency interest rate swaps (gross-settled)
- Inflow (158.1) (158.1) (332.0) (662.6)
- Outflow 132.1 132.1 253.9 350.0
(23.0) (24.3) (72.9) (291.8)
Borrowings 50.7 50.7 152.2 1,490.1
27.7 26.4 79.3 1,198.3
ANNUAL REPORT 2016 196
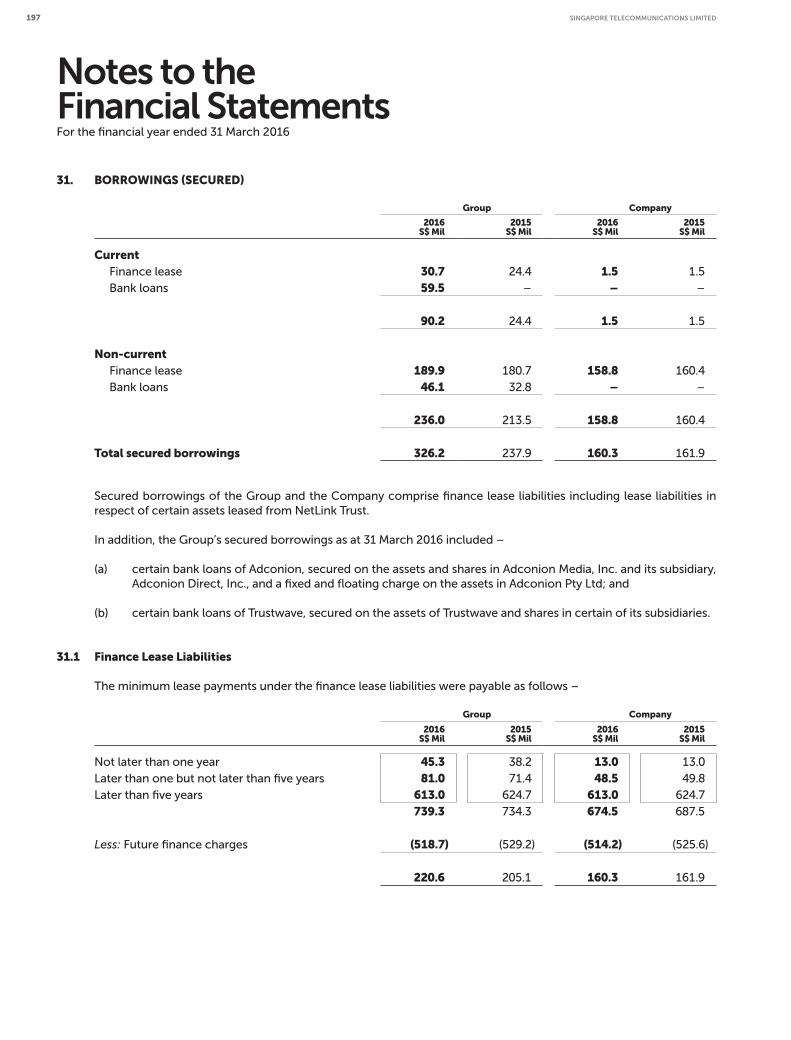
Notes to the Financial StatementsFor the financial year ended 31 March 2016
31. BORROWINGS (SECURED)
Group Company
2016S$ Mil
2015S$ Mil
2016S$ Mil
2015S$ Mil
Current
Finance lease 30.7 24.4 1.5 1.5
Bank loans 59.5 – – –
90.2 24.4 1.5 1.5
Non-current
Finance lease 189.9 180.7 158.8 160.4
Bank loans 46.1 32.8 – –
236.0 213.5 158.8 160.4
Total secured borrowings 326.2 237.9 160.3 161.9
Secured borrowings of the Group and the Company comprise finance lease liabilities including lease liabilities in
respect of certain assets leased from NetLink Trust.
In addition, the Group’s secured borrowings as at 31 March 2016 included –
(a) certain bank loans of Adconion, secured on the assets and shares in Adconion Media, Inc. and its subsidiary,
Adconion Direct, Inc., and a fixed and floating charge on the assets in Adconion Pty Ltd; and
(b) certain bank loans of Trustwave, secured on the assets of Trustwave and shares in certain of its subsidiaries.
31.1 Finance Lease Liabilities
The minimum lease payments under the finance lease liabilities were payable as follows –
Group Company
2016S$ Mil
2015S$ Mil
2016S$ Mil
2015S$ Mil
Not later than one year 45.3 38.2 13.0 13.0
Later than one but not later than five years 81.0 71.4 48.5 49.8
Later than five years 613.0 624.7 613.0 624.7
739.3 734.3 674.5 687.5
Less: Future finance charges (518.7) (529.2) (514.2) (525.6)
220.6 205.1 160.3 161.9
SINGAPORE TELECOMMUNICATIONS LIMITED 197
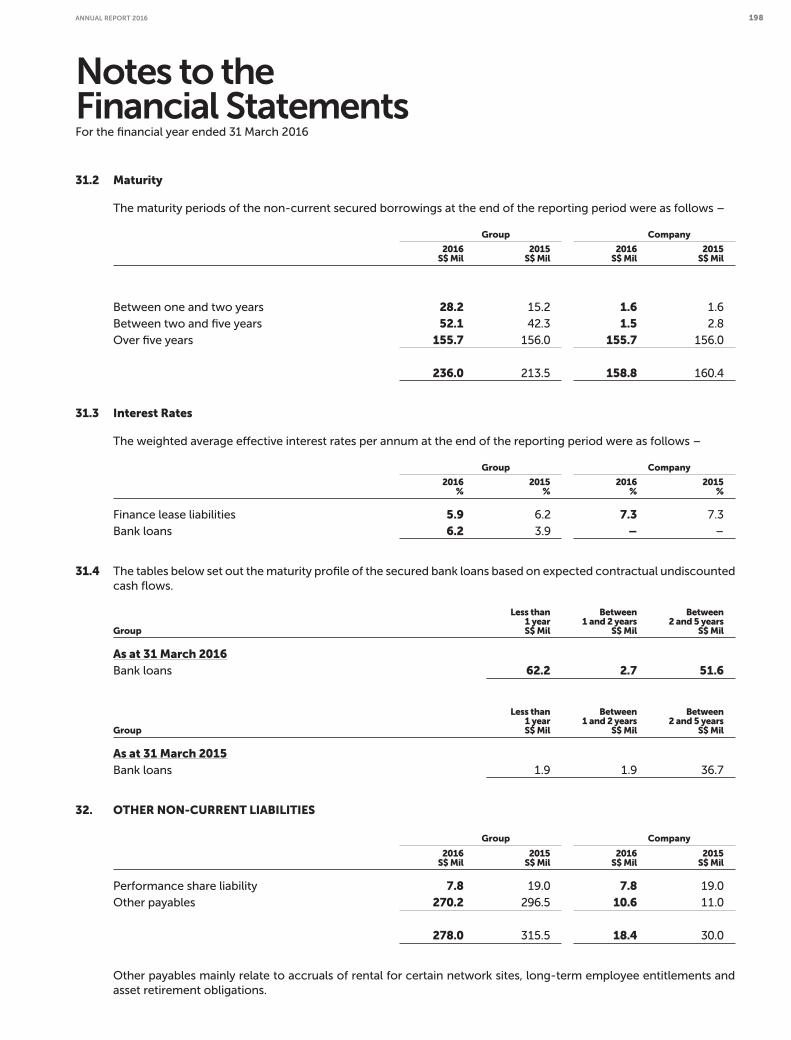
Notes to the Financial StatementsFor the financial year ended 31 March 2016
31.2 Maturity
The maturity periods of the non-current secured borrowings at the end of the reporting period were as follows –
Group Company
2016S$ Mil
2015S$ Mil
2016S$ Mil
2015S$ Mil
Between one and two years 28.2 15.2 1.6 1.6
Between two and five years 52.1 42.3 1.5 2.8
Over five years 155.7 156.0 155.7 156.0
236.0 213.5 158.8 160.4
31.3 Interest Rates
The weighted average effective interest rates per annum at the end of the reporting period were as follows –
Group Company
2016%
2015%
2016%
2015%
Finance lease liabilities 5.9 6.2 7.3 7.3
Bank loans 6.2 3.9 – –
31.4 The tables below set out the maturity profile of the secured bank loans based on expected contractual undiscounted
cash flows.
Group
Less than1 yearS$ Mil
Between 1 and 2 years
S$ Mil
Between 2 and 5 years
S$ Mil
As at 31 March 2016
Bank loans 62.2 2.7 51.6
Group
Less than1 yearS$ Mil
Between 1 and 2 years
S$ Mil
Between 2 and 5 years
S$ Mil
As at 31 March 2015
Bank loans 1.9 1.9 36.7
32. OTHER NON-CURRENT LIABILITIES
Group Company
2016S$ Mil
2015S$ Mil
2016S$ Mil
2015S$ Mil
Performance share liability 7.8 19.0 7.8 19.0
Other payables 270.2 296.5 10.6 11.0
278.0 315.5 18.4 30.0
Other payables mainly relate to accruals of rental for certain network sites, long-term employee entitlements and
asset retirement obligations.
ANNUAL REPORT 2016 198

Notes to the Financial StatementsFor the financial year ended 31 March 2016
33. SHARE CAPITAL
2016 2015
Group and Company
Number ofshares
Mil
Share capitalS$ Mil
Number ofshares
Mil
Share capitalS$ Mil
Balance as at 1 April and 31 March 15,943.5 2,634.0 15,943.5 2,634.0
All issued shares are fully paid and have no par value. The issued shares carry one vote per share and a right to
dividends as and when declared by the Company.
Capital Management
The Group is committed to an optimal capital structure while maintaining financial flexibility and investment
grade credit ratings. In order to achieve an optimal capital structure, the Group may adjust the amount of dividend
payment, return capital to shareholders, issue new shares, buy back issued shares, obtain new borrowings or reduce
its borrowings.
The Group monitors capital based on gross and net gearing ratios, and the dividend payout ratio ranges from 60% to
75% of underlying net profit. Underlying net profit is defined as net profit before exceptional and other one-off items.
From time to time, the Group purchases its own shares from the market. The shares purchased are primarily for
delivery to employees upon vesting of performance shares awarded under Singtel performance share plans. The
Group can also cancel the shares which are repurchased from the market.
There were no changes in the Group’s approach to capital management during the financial year.
34. DIVIDENDS
Group Company
2016S$ Mil
2015S$ Mil
2016S$ Mil
2015S$ Mil
Final dividend of 10.7 cents
(2015: 10.0 cents) per share, paid 1,705.4 1,593.8 1,705.9 1,594.3
Interim dividend of 6.8 cents
(2015: 6.8 cents) per share, paid 1,083.8 1,083.7 1,084.2 1,084.2
2,789.2 2,677.5 2,790.1 2,678.5
During the financial year, a final one-tier tax exempt ordinary dividend of 10.7 cents per share, totalling S$1.71 billion
was paid in respect of the previous financial year ended 31 March 2015, and an interim one-tier tax exempt ordinary
dividend of 6.8 cents per share totalling S$1.08 billion was paid in respect of the current financial year ended 31
March 2016.
The amount paid by the Group differed from that paid by the Company due to dividends on performance shares held
by the Trust that were eliminated on consolidation of the Trust.
The Directors have proposed a final one-tier tax exempt ordinary dividend of 10.7 cents per share, totalling
approximately S$1.71 billion in respect of the current financial year ended 31 March 2016 for approval at the
forthcoming Annual General Meeting.
These financial statements do not reflect the above final dividend payable of approximately S$1.71 billion, which
will be accounted for in the shareholders’ equity as an appropriation of ‘Retained Earnings’ in the next financial year
ending 31 March 2017.
SINGAPORE TELECOMMUNICATIONS LIMITED 199
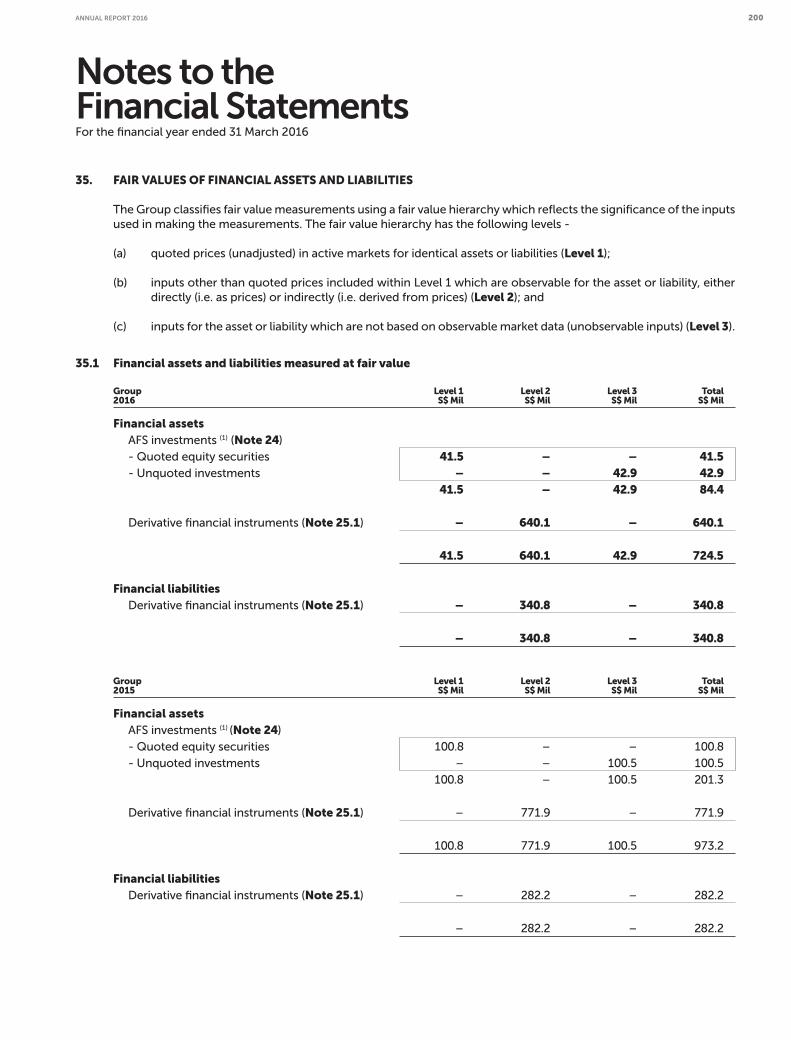
Notes to the Financial StatementsFor the financial year ended 31 March 2016
35. FAIR VALUES OF FINANCIAL ASSETS AND LIABILITIES
The Group classifies fair value measurements using a fair value hierarchy which reflects the significance of the inputs
used in making the measurements. The fair value hierarchy has the following levels -
(a) quoted prices (unadjusted) in active markets for identical assets or liabilities (Level 1);
(b) inputs other than quoted prices included within Level 1 which are observable for the asset or liability, either
directly (i.e. as prices) or indirectly (i.e. derived from prices) (Level 2); and
(c) inputs for the asset or liability which are not based on observable market data (unobservable inputs) (Level 3).
35.1 Financial assets and liabilities measured at fair value
Group 2016
Level 1S$ Mil
Level 2S$ Mil
Level 3S$ Mil
Total S$ Mil
Financial assets AFS investments (1) (Note 24)
- Quoted equity securities 41.5 – – 41.5 - Unquoted investments – – 42.9 42.9 41.5 – 42.9 84.4 Derivative financial instruments (Note 25.1) – 640.1 – 640.1 41.5 640.1 42.9 724.5 Financial liabilities Derivative financial instruments (Note 25.1) – 340.8 – 340.8 – 340.8 – 340.8
Group 2015
Level 1S$ Mil
Level 2S$ Mil
Level 3S$ Mil
Total S$ Mil
Financial assets
AFS investments (1) (Note 24)
- Quoted equity securities 100.8 – – 100.8
- Unquoted investments – – 100.5 100.5
100.8 – 100.5 201.3
Derivative financial instruments (Note 25.1) – 771.9 – 771.9
100.8 771.9 100.5 973.2
Financial liabilities Derivative financial instruments (Note 25.1) – 282.2 – 282.2
– 282.2 – 282.2
ANNUAL REPORT 2016 200
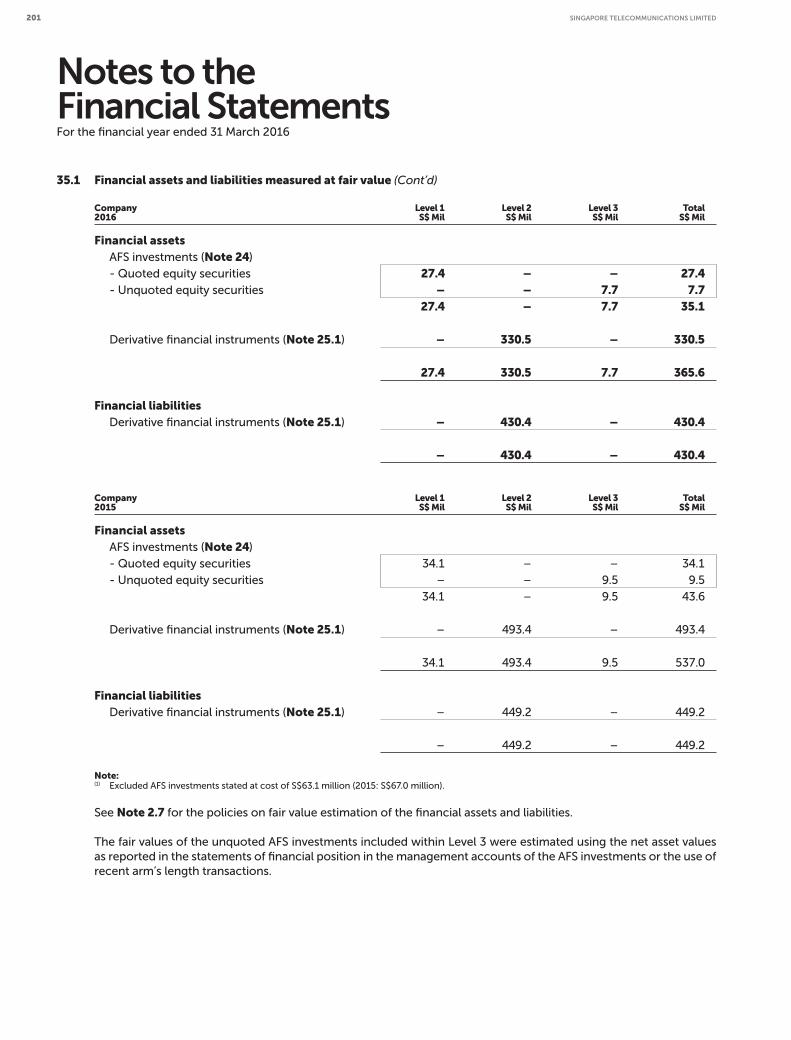
Notes to the Financial StatementsFor the financial year ended 31 March 2016
35.1 Financial assets and liabilities measured at fair value (Cont’d)
Company 2016
Level 1S$ Mil
Level 2S$ Mil
Level 3S$ Mil
Total S$ Mil
Financial assets
AFS investments (Note 24)
- Quoted equity securities 27.4 – – 27.4 - Unquoted equity securities – – 7.7 7.7 27.4 – 7.7 35.1 Derivative financial instruments (Note 25.1) – 330.5 – 330.5 27.4 330.5 7.7 365.6 Financial liabilities Derivative financial instruments (Note 25.1) – 430.4 – 430.4 – 430.4 – 430.4
Company 2015
Level 1S$ Mil
Level 2S$ Mil
Level 3S$ Mil
Total S$ Mil
Financial assets
AFS investments (Note 24)
- Quoted equity securities 34.1 – – 34.1
- Unquoted equity securities – – 9.5 9.5
34.1 – 9.5 43.6
Derivative financial instruments (Note 25.1) – 493.4 – 493.4
34.1 493.4 9.5 537.0
Financial liabilities Derivative financial instruments (Note 25.1) – 449.2 – 449.2
– 449.2 – 449.2
Note:(1) Excluded AFS investments stated at cost of S$63.1 million (2015: S$67.0 million).
See Note 2.7 for the policies on fair value estimation of the financial assets and liabilities.
The fair values of the unquoted AFS investments included within Level 3 were estimated using the net asset values
as reported in the statements of financial position in the management accounts of the AFS investments or the use of
recent arm’s length transactions.
SINGAPORE TELECOMMUNICATIONS LIMITED 201
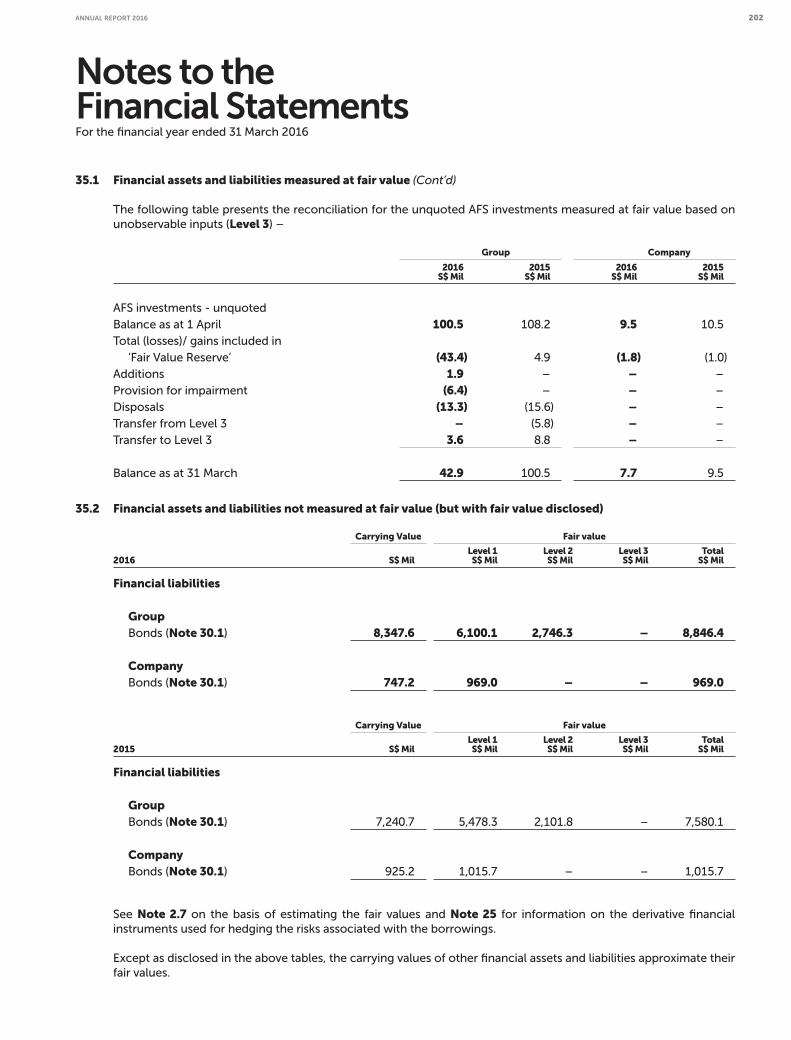
Notes to the Financial StatementsFor the financial year ended 31 March 2016
35.1 Financial assets and liabilities measured at fair value (Cont’d)
The following table presents the reconciliation for the unquoted AFS investments measured at fair value based on
unobservable inputs (Level 3) –
Group Company
2016S$ Mil
2015S$ Mil
2016S$ Mil
2015S$ Mil
AFS investments - unquoted
Balance as at 1 April 100.5 108.2 9.5 10.5
Total (losses)/ gains included in
‘Fair Value Reserve’ (43.4) 4.9 (1.8) (1.0)
Additions 1.9 – – –
Provision for impairment (6.4) – – –
Disposals (13.3) (15.6) – –
Transfer from Level 3 – (5.8) – –
Transfer to Level 3 3.6 8.8 – –
Balance as at 31 March 42.9 100.5 7.7 9.5
35.2 Financial assets and liabilities not measured at fair value (but with fair value disclosed)
Carrying Value Fair value
2016 S$ MilLevel 1S$ Mil
Level 2S$ Mil
Level 3S$ Mil
Total S$ Mil
Financial liabilities
Group
Bonds (Note 30.1) 8,347.6 6,100.1 2,746.3 – 8,846.4 Company Bonds (Note 30.1) 747.2 969.0 – – 969.0
Carrying Value Fair value
2015 S$ MilLevel 1S$ Mil
Level 2S$ Mil
Level 3S$ Mil
Total S$ Mil
Financial liabilities
Group
Bonds (Note 30.1) 7,240.7 5,478.3 2,101.8 – 7,580.1
Company
Bonds (Note 30.1) 925.2 1,015.7 – – 1,015.7
See Note 2.7 on the basis of estimating the fair values and Note 25 for information on the derivative financial
instruments used for hedging the risks associated with the borrowings.
Except as disclosed in the above tables, the carrying values of other financial assets and liabilities approximate their
fair values.
ANNUAL REPORT 2016 202

Notes to the Financial StatementsFor the financial year ended 31 March 2016
36. FINANCIAL RISK MANAGEMENT OBJECTIVES AND POLICIES
36.1 Financial Risk Factors
The Group’s activities are exposed to a variety of financial risks: foreign exchange risk, interest rate risk, credit risk,
liquidity risk and market risk. The Group’s overall risk management seeks to minimise the potential adverse effects of
these risks on the financial performance of the Group.
The Group uses financial instruments such as currency forwards, cross currency and interest rate swaps, and
foreign currency borrowings to hedge certain financial risk exposures. No financial derivatives are held or sold for
speculative purposes.
The Directors assume responsibility for the overall financial risk management of the Group. For the financial year
ended 31 March 2016, the Risk Committee and Finance and Investment Committee (“FIC”), which are committees
of the Board, assisted the Directors in reviewing and establishing policies relating to financial risk management in
accordance with the policies and directives of the Directors.
36.2 Foreign Exchange Risk
The foreign exchange risk of the Group arises from subsidiaries, associates and joint ventures operating in foreign
countries, mainly Australia, India, Indonesia, the Philippines, Thailand and United States of America. Additionally,
the Group’s joint venture in India, Bharti Airtel Limited, is exposed to foreign exchange risks from its operations in
Bangladesh, Sri Lanka and 17 countries across Africa. Translation risks of overseas net investments are not hedged
unless approved by the FIC.
The Group has borrowings denominated in foreign currencies that have primarily been hedged into the functional
currency of the respective borrowing entities using cross currency swaps in order to reduce the foreign currency
exposure on these borrowings. As the hedges are perfect, any change in the fair value of the cross currency swaps
has minimal impact on profit and equity.
The Group Treasury Policy, as approved by the FIC, is to substantially hedge all known transactional currency
exposures. The Group generates revenue, receives foreign dividends and incurs costs in currencies which are
other than the functional currencies of the operating units, thus giving rise to foreign exchange risk. The currency
exposures are primarily for the Australian Dollar, Euro, Hong Kong Dollar, Indian Rupee, Indonesian Rupiah, Philippine
Peso, Pound Sterling, Thai Baht, United States Dollar and Japanese Yen.
Foreign currency purchases and forward currency contracts are used to reduce the Group’s transactional exposure
to foreign currency exchange rate fluctuations. The foreign exchange difference on trade balances is disclosed
under Note 6 and the foreign exchange difference on non-trade balances is disclosed under Note 10.
36.3 Interest Rate Risk
The Group has cash balances placed with reputable banks and financial institutions which generate interest income
for the Group. The Group manages its interest rate risks on its interest income by placing the cash balances on
varying maturities and interest rate terms.
The Group’s borrowings include bank borrowings and bonds. The borrowings expose the Group to interest rate
risk. The Group seeks to minimise its exposure to these risks by entering into interest rate swaps over the duration
of its borrowings. Interest rate swaps entail the Group agreeing to exchange, at specified intervals, the difference
between fixed and variable rate interest amounts calculated by reference to an agreed-upon notional principal
amount. As at 31 March 2016, after taking into account the effect of interest rate swaps, approximately 76% (2015:
72%) of the Group’s borrowings were at fixed rates of interest.
SINGAPORE TELECOMMUNICATIONS LIMITED 203
Notes to the Financial StatementsFor the financial year ended 31 March 2016
36.3 Interest Rate Risk (Cont’d)
As at 31 March 2016, assuming that the market interest rate is 50 basis points higher or lower and with no change to
the other variables, the annualised interest expense on borrowings would be higher or lower by S$14.1 million (2015:
S$12.8 million).
36.4 Credit Risk
Financial assets that potentially subject the Group to concentrations of credit risk consist primarily of trade
receivables, cash and cash equivalents, marketable securities and financial instruments used in hedging activities.
The Group has no significant concentration of credit risk from trade receivables due to its diverse customer base.
Credit risk is managed through the application of credit assessment and approvals, credit limits and monitoring
procedures. Where appropriate, the Group obtains deposits or bank guarantees from customers or enters into credit
insurance arrangements.
The Group places its cash and cash equivalents and marketable securities with a number of major and high credit
rating commercial banks and other financial institutions. Derivative counter-parties are limited to high credit rating
commercial banks and other financial institutions. The Group has policies that limit the financial exposure to any one
financial institution.
36.5 Liquidity Risk
To manage liquidity risk, the Group monitors and maintains a level of cash and cash equivalents deemed adequate
by the management to finance the Group’s operations and mitigate the effects of fluctuations in cash flows. Due to
the dynamic nature of the underlying business, the Group aims at maintaining flexibility in funding by keeping both
committed and uncommitted credit lines available.
36.6 Market Risk
The Group has investments in quoted equity shares. The market value of these investments will fluctuate with
market conditions.
37. SEGMENT INFORMATION
Segment information is presented based on the information reviewed by senior management for performance
measurement and resource allocation.
Singtel Group is structured into three business segments, namely Group Consumer, Group Enterprise and Group
Digital Life.
Group Consumer comprises the consumer businesses across Singapore and Australia, as well as the Group’s
investments, namely AIS in Thailand, Airtel in India, Africa and South Asia, Globe in the Philippines, and Telkomsel in
Indonesia. It focuses on driving greater value and performance from the core carriage business including mobile,
pay TV, fixed broadband and voice, as well as equipment sales. From 1 April 2015, certain businesses which were
previously with Group Digital Life were transferred to Group Consumer.
Group Enterprise comprises the business groups across Singapore, Australia, United States of America, Europe
and the region, and focuses on growing the Group’s position in the enterprise markets. Key services include
mobile, equipment sales, fixed voice and data, managed services, cloud computing, cyber security, IT and
professional consulting.
ANNUAL REPORT 2016 204
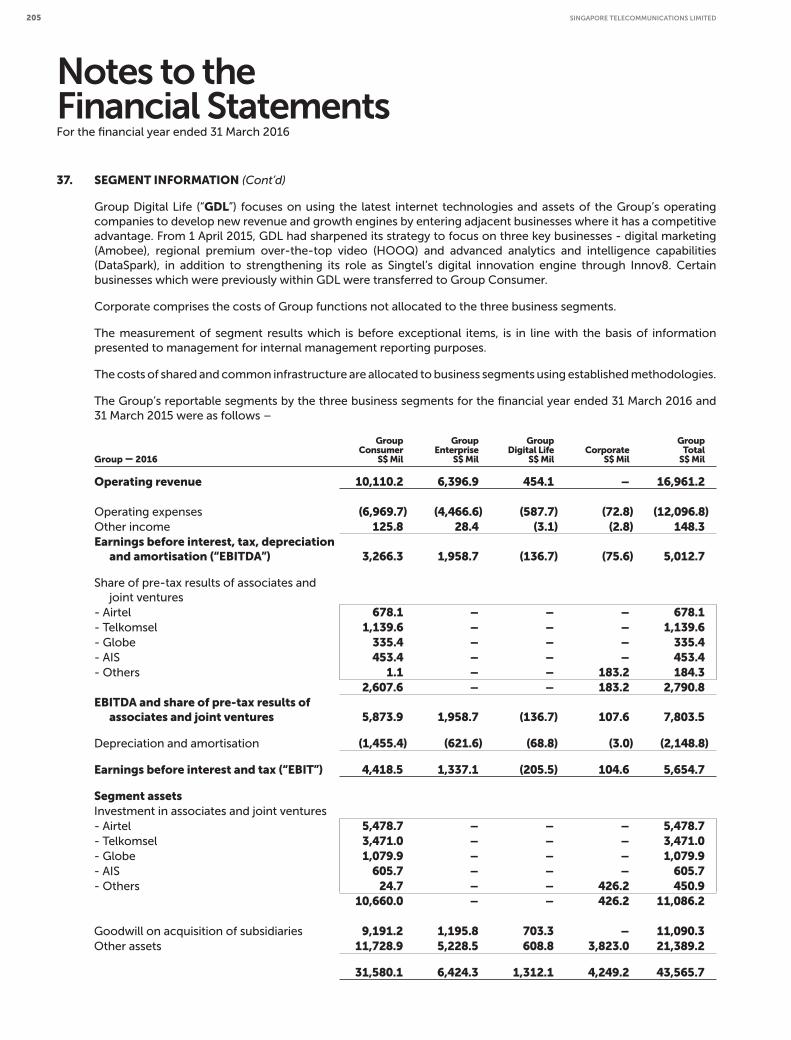
Notes to the Financial StatementsFor the financial year ended 31 March 2016
37. SEGMENT INFORMATION (Cont’d)
Group Digital Life (“GDL”) focuses on using the latest internet technologies and assets of the Group’s operating
companies to develop new revenue and growth engines by entering adjacent businesses where it has a competitive
advantage. From 1 April 2015, GDL had sharpened its strategy to focus on three key businesses - digital marketing
(Amobee), regional premium over-the-top video (HOOQ) and advanced analytics and intelligence capabilities
(DataSpark), in addition to strengthening its role as Singtel’s digital innovation engine through Innov8. Certain
businesses which were previously within GDL were transferred to Group Consumer.
Corporate comprises the costs of Group functions not allocated to the three business segments.
The measurement of segment results which is before exceptional items, is in line with the basis of information
presented to management for internal management reporting purposes.
The costs of shared and common infrastructure are allocated to business segments using established methodologies.
The Group’s reportable segments by the three business segments for the financial year ended 31 March 2016 and
31 March 2015 were as follows –
Group – 2016
Group Consumer
S$ Mil
Group Enterprise
S$ Mil
Group Digital Life
S$ Mil
Corporate
S$ Mil
Group Total
S$ Mil
Operating revenue 10,110.2 6,396.9 454.1 – 16,961.2 Operating expenses (6,969.7) (4,466.6) (587.7) (72.8) (12,096.8)Other income 125.8 28.4 (3.1) (2.8) 148.3 Earnings before interest, tax, depreciation
and amortisation (“EBITDA”) 3,266.3 1,958.7 (136.7) (75.6) 5,012.7
Share of pre-tax results of associates and
joint ventures
- Airtel 678.1 – – – 678.1 - Telkomsel 1,139.6 – – – 1,139.6 - Globe 335.4 – – – 335.4 - AIS 453.4 – – – 453.4 - Others 1.1 – – 183.2 184.3 2,607.6 – – 183.2 2,790.8 EBITDA and share of pre-tax results of
associates and joint ventures 5,873.9 1,958.7 (136.7) 107.6 7,803.5
Depreciation and amortisation (1,455.4) (621.6) (68.8) (3.0) (2,148.8)
Earnings before interest and tax (“EBIT”) 4,418.5 1,337.1 (205.5) 104.6 5,654.7
Segment assets Investment in associates and joint ventures - Airtel 5,478.7 – – – 5,478.7 - Telkomsel 3,471.0 – – – 3,471.0 - Globe 1,079.9 – – – 1,079.9 - AIS 605.7 – – – 605.7 - Others 24.7 – – 426.2 450.9 10,660.0 – – 426.2 11,086.2
Goodwill on acquisition of subsidiaries 9,191.2 1,195.8 703.3 – 11,090.3 Other assets 11,728.9 5,228.5 608.8 3,823.0 21,389.2
31,580.1 6,424.3 1,312.1 4,249.2 43,565.7
SINGAPORE TELECOMMUNICATIONS LIMITED 205

Notes to the Financial StatementsFor the financial year ended 31 March 2016
37. SEGMENT INFORMATION (Cont’d)
Group – 2015
Group Consumer
S$ Mil
Group Enterprise
S$ Mil
Group Digital Life
S$ Mil
Corporate
S$ Mil
Group Total
S$ Mil
Operating revenue 10,559.4 6,320.4 343.1 – 17,222.9
Operating expenses (7,354.3) (4,296.1) (554.8) (78.4) (12,283.6)
Other income 111.5 36.9 (4.2) 7.2 151.4
EBITDA 3,316.6 2,061.2 (215.9) (71.2) 5,090.7
Share of pre-tax results of associates and
joint ventures
- Airtel 735.7 – – – 735.7
- Telkomsel 982.3 – – – 982.3
- Globe 305.6 – – – 305.6
- AIS 431.0 – – – 431.0
- Others 1.1 – – 123.1 124.2
2,455.7 – – 123.1 2,578.8
EBITDA and share of pre-tax results of associates and joint ventures 5,772.3 2,061.2 (215.9) 51.9 7,669.5
Depreciation and amortisation (1,478.0) (608.4) (72.9) (2.1) (2,161.4)
EBIT 4,294.3 1,452.8 (288.8) 49.8 5,508.1
Segment assets
Investment in associates and joint ventures
- Airtel 5,323.3 – – – 5,323.3
- Telkomsel 3,410.1 – – – 3,410.1
- Globe 1,049.8 – – – 1,049.8
- AIS 686.3 – – – 686.3
- Others 24.1 – – 352.6 376.7
10,493.6 – – 352.6 10,846.2
Goodwill on acquisition of subsidiaries 9,191.9 175.1 756.0 – 10,123.0
Other assets 10,869.2 4,897.9 781.8 4,548.7 21,097.6
30,554.7 5,073.0 1,537.8 4,901.3 42,066.8
ANNUAL REPORT 2016 206
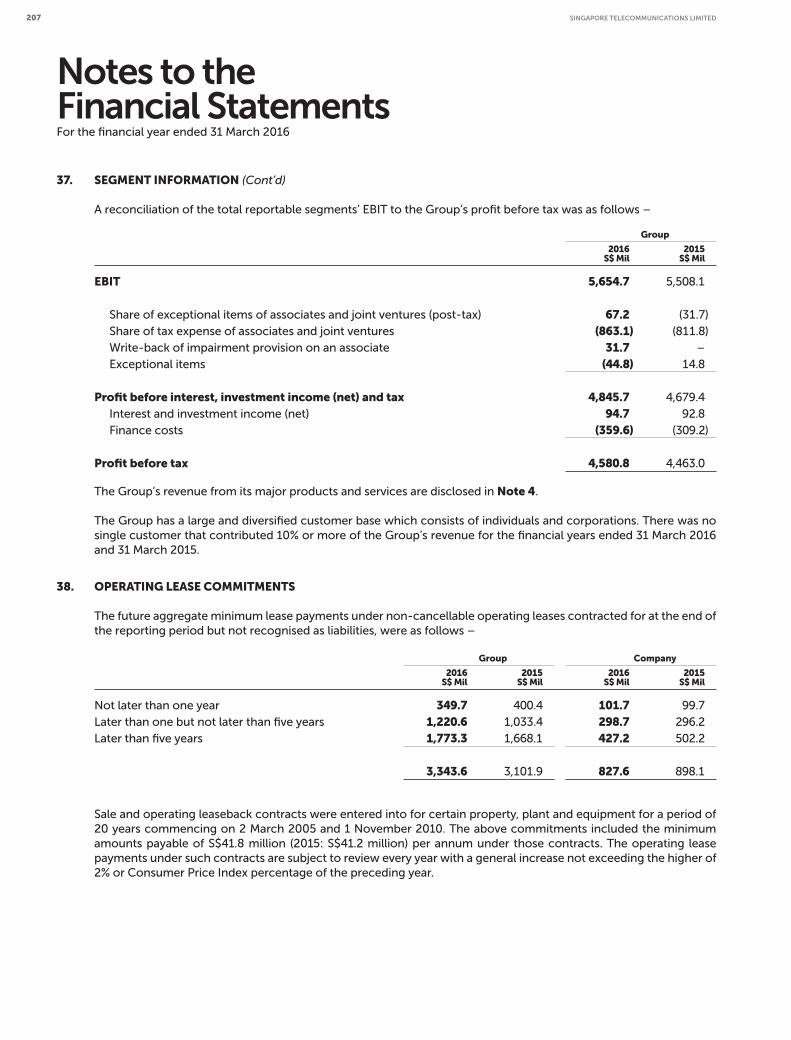
Notes to the Financial StatementsFor the financial year ended 31 March 2016
37. SEGMENT INFORMATION (Cont’d)
A reconciliation of the total reportable segments’ EBIT to the Group’s profit before tax was as follows –
Group
2016S$ Mil
2015S$ Mil
EBIT 5,654.7 5,508.1
Share of exceptional items of associates and joint ventures (post-tax) 67.2 (31.7)
Share of tax expense of associates and joint ventures (863.1) (811.8)
Write-back of impairment provision on an associate 31.7 –
Exceptional items (44.8) 14.8
Profit before interest, investment income (net) and tax 4,845.7 4,679.4
Interest and investment income (net) 94.7 92.8
Finance costs (359.6) (309.2)
Profit before tax 4,580.8 4,463.0
The Group’s revenue from its major products and services are disclosed in Note 4.
The Group has a large and diversified customer base which consists of individuals and corporations. There was no
single customer that contributed 10% or more of the Group’s revenue for the financial years ended 31 March 2016
and 31 March 2015.
38. OPERATING LEASE COMMITMENTS
The future aggregate minimum lease payments under non-cancellable operating leases contracted for at the end of
the reporting period but not recognised as liabilities, were as follows –
Group Company
2016S$ Mil
2015S$ Mil
2016S$ Mil
2015S$ Mil
Not later than one year 349.7 400.4 101.7 99.7
Later than one but not later than five years 1,220.6 1,033.4 298.7 296.2
Later than five years 1,773.3 1,668.1 427.2 502.2
3,343.6 3,101.9 827.6 898.1
Sale and operating leaseback contracts were entered into for certain property, plant and equipment for a period of
20 years commencing on 2 March 2005 and 1 November 2010. The above commitments included the minimum
amounts payable of S$41.8 million (2015: S$41.2 million) per annum under those contracts. The operating lease
payments under such contracts are subject to review every year with a general increase not exceeding the higher of
2% or Consumer Price Index percentage of the preceding year.
SINGAPORE TELECOMMUNICATIONS LIMITED 207
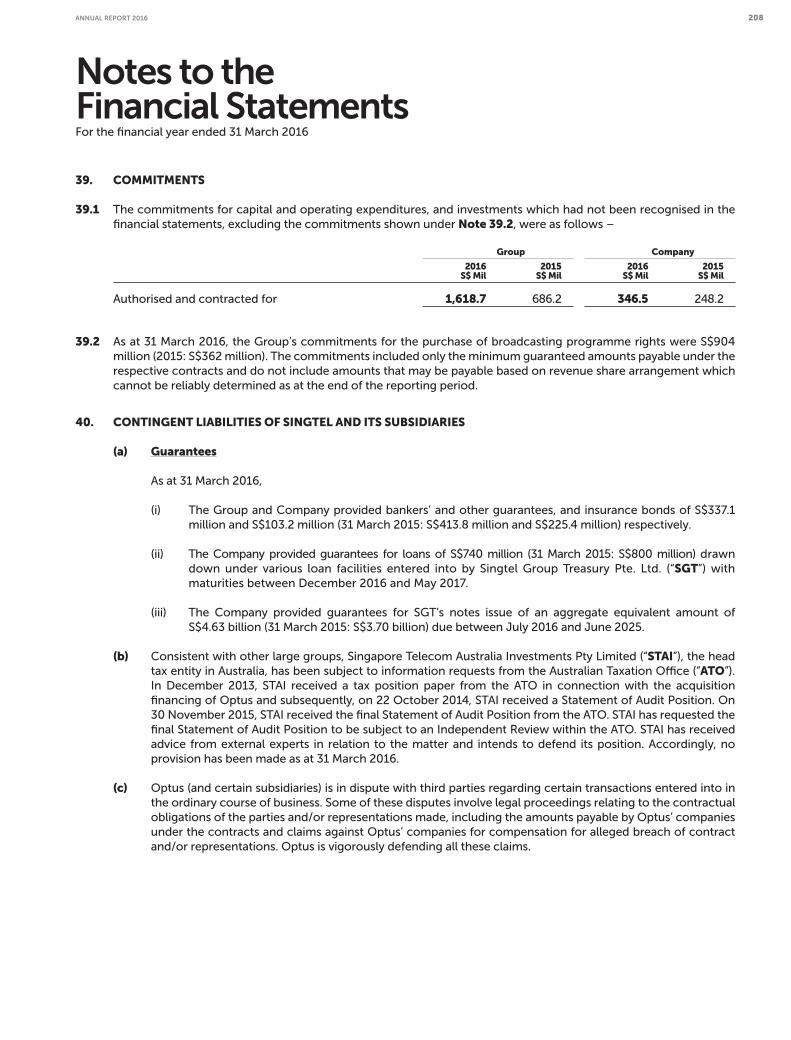
Notes to the Financial StatementsFor the financial year ended 31 March 2016
39. COMMITMENTS
39.1 The commitments for capital and operating expenditures, and investments which had not been recognised in the
financial statements, excluding the commitments shown under Note 39.2, were as follows –
Group Company
2016S$ Mil
2015S$ Mil
2016S$ Mil
2015S$ Mil
Authorised and contracted for 1,618.7 686.2 346.5 248.2
39.2 As at 31 March 2016, the Group’s commitments for the purchase of broadcasting programme rights were S$904
million (2015: S$362 million). The commitments included only the minimum guaranteed amounts payable under the
respective contracts and do not include amounts that may be payable based on revenue share arrangement which
cannot be reliably determined as at the end of the reporting period.
40. CONTINGENT LIABILITIES OF SINGTEL AND ITS SUBSIDIARIES
(a) Guarantees
As at 31 March 2016,
(i) The Group and Company provided bankers’ and other guarantees, and insurance bonds of S$337.1
million and S$103.2 million (31 March 2015: S$413.8 million and S$225.4 million) respectively.
(ii) The Company provided guarantees for loans of S$740 million (31 March 2015: S$800 million) drawn
down under various loan facilities entered into by Singtel Group Treasury Pte. Ltd. (“SGT”) with
maturities between December 2016 and May 2017.
(iii) The Company provided guarantees for SGT’s notes issue of an aggregate equivalent amount of
S$4.63 billion (31 March 2015: S$3.70 billion) due between July 2016 and June 2025.
(b) Consistent with other large groups, Singapore Telecom Australia Investments Pty Limited (“STAI”), the head
tax entity in Australia, has been subject to information requests from the Australian Taxation Office (“ATO”).
In December 2013, STAI received a tax position paper from the ATO in connection with the acquisition
financing of Optus and subsequently, on 22 October 2014, STAI received a Statement of Audit Position. On
30 November 2015, STAI received the final Statement of Audit Position from the ATO. STAI has requested the
final Statement of Audit Position to be subject to an Independent Review within the ATO. STAI has received
advice from external experts in relation to the matter and intends to defend its position. Accordingly, no
provision has been made as at 31 March 2016.
(c) Optus (and certain subsidiaries) is in dispute with third parties regarding certain transactions entered into in
the ordinary course of business. Some of these disputes involve legal proceedings relating to the contractual
obligations of the parties and/or representations made, including the amounts payable by Optus’ companies
under the contracts and claims against Optus’ companies for compensation for alleged breach of contract
and/or representations. Optus is vigorously defending all these claims.
ANNUAL REPORT 2016 208
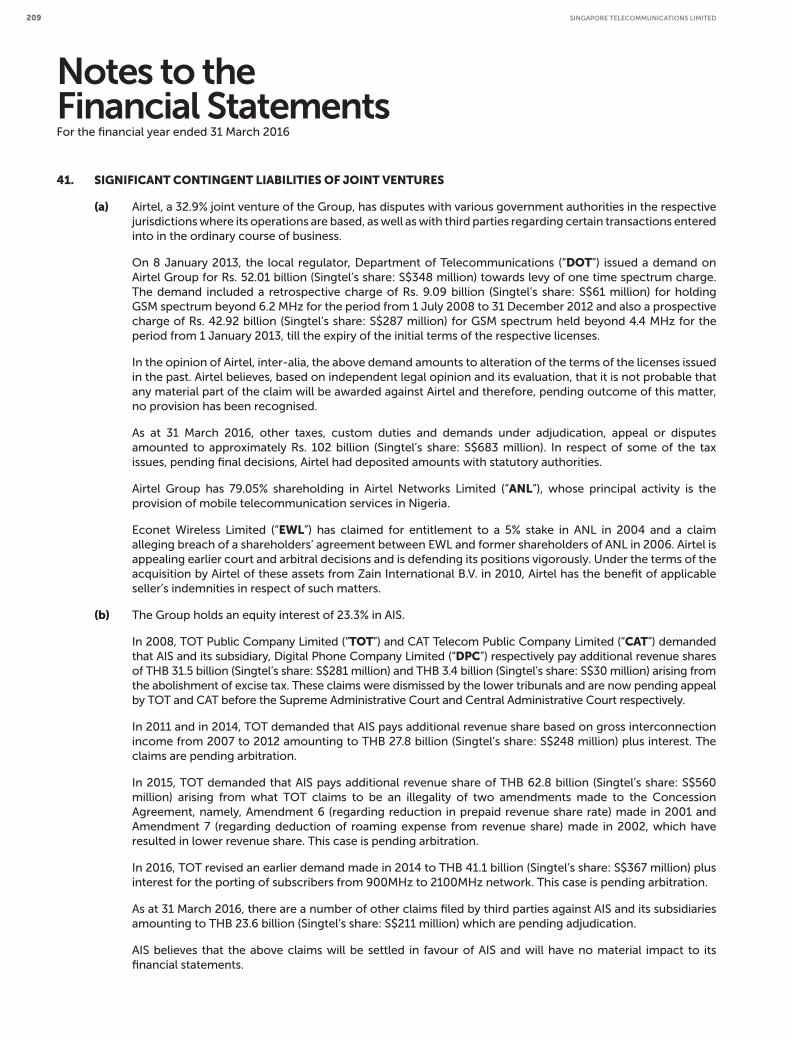
Notes to the Financial StatementsFor the financial year ended 31 March 2016
41. SIGNIFICANT CONTINGENT LIABILITIES OF JOINT VENTURES
(a) Airtel, a 32.9% joint venture of the Group, has disputes with various government authorities in the respective
jurisdictions where its operations are based, as well as with third parties regarding certain transactions entered
into in the ordinary course of business.
On 8 January 2013, the local regulator, Department of Telecommunications (“DOT”) issued a demand on
Airtel Group for Rs. 52.01 billion (Singtel’s share: S$348 million) towards levy of one time spectrum charge.
The demand included a retrospective charge of Rs. 9.09 billion (Singtel’s share: S$61 million) for holding
GSM spectrum beyond 6.2 MHz for the period from 1 July 2008 to 31 December 2012 and also a prospective
charge of Rs. 42.92 billion (Singtel’s share: S$287 million) for GSM spectrum held beyond 4.4 MHz for the
period from 1 January 2013, till the expiry of the initial terms of the respective licenses.
In the opinion of Airtel, inter-alia, the above demand amounts to alteration of the terms of the licenses issued
in the past. Airtel believes, based on independent legal opinion and its evaluation, that it is not probable that
any material part of the claim will be awarded against Airtel and therefore, pending outcome of this matter,
no provision has been recognised.
As at 31 March 2016, other taxes, custom duties and demands under adjudication, appeal or disputes
amounted to approximately Rs. 102 billion (Singtel’s share: S$683 million). In respect of some of the tax
issues, pending final decisions, Airtel had deposited amounts with statutory authorities.
Airtel Group has 79.05% shareholding in Airtel Networks Limited (“ANL”), whose principal activity is the
provision of mobile telecommunication services in Nigeria.
Econet Wireless Limited (“EWL”) has claimed for entitlement to a 5% stake in ANL in 2004 and a claim
alleging breach of a shareholders’ agreement between EWL and former shareholders of ANL in 2006. Airtel is
appealing earlier court and arbitral decisions and is defending its positions vigorously. Under the terms of the
acquisition by Airtel of these assets from Zain International B.V. in 2010, Airtel has the benefit of applicable
seller’s indemnities in respect of such matters.
(b) The Group holds an equity interest of 23.3% in AIS.
In 2008, TOT Public Company Limited (“TOT”) and CAT Telecom Public Company Limited (“CAT”) demanded
that AIS and its subsidiary, Digital Phone Company Limited (“DPC”) respectively pay additional revenue shares
of THB 31.5 billion (Singtel’s share: S$281 million) and THB 3.4 billion (Singtel’s share: S$30 million) arising from
the abolishment of excise tax. These claims were dismissed by the lower tribunals and are now pending appeal
by TOT and CAT before the Supreme Administrative Court and Central Administrative Court respectively.
In 2011 and in 2014, TOT demanded that AIS pays additional revenue share based on gross interconnection
income from 2007 to 2012 amounting to THB 27.8 billion (Singtel’s share: S$248 million) plus interest. The
claims are pending arbitration.
In 2015, TOT demanded that AIS pays additional revenue share of THB 62.8 billion (Singtel’s share: S$560
million) arising from what TOT claims to be an illegality of two amendments made to the Concession
Agreement, namely, Amendment 6 (regarding reduction in prepaid revenue share rate) made in 2001 and
Amendment 7 (regarding deduction of roaming expense from revenue share) made in 2002, which have
resulted in lower revenue share. This case is pending arbitration.
In 2016, TOT revised an earlier demand made in 2014 to THB 41.1 billion (Singtel’s share: S$367 million) plus
interest for the porting of subscribers from 900MHz to 2100MHz network. This case is pending arbitration.
As at 31 March 2016, there are a number of other claims filed by third parties against AIS and its subsidiaries
amounting to THB 23.6 billion (Singtel’s share: S$211 million) which are pending adjudication.
AIS believes that the above claims will be settled in favour of AIS and will have no material impact to its
financial statements.
SINGAPORE TELECOMMUNICATIONS LIMITED 209

Notes to the Financial StatementsFor the financial year ended 31 March 2016
41. SIGNIFICANT CONTINGENT LIABILITIES OF JOINT VENTURES (Cont’d)
(c) Globe, a joint venture of the Group, is contingently liable for various claims arising in the ordinary conduct of
business and certain tax assessments which are either pending decision by the Courts or are being contested,
the outcome of which are not presently determinable. In the opinion of Globe’s management and legal
counsel, the eventual liability under these claims, if any, will not have a material or adverse effect on Globe’s
financial position and results of operations.
(d) The Group holds an equity interest of 35% in Telkomsel. As at 31 March 2016, Telkomsel has filed appeals and
cross-appeals amounting to approximately IDR 511 billion (Singtel’s share: S$18 million) for various tax claims
arising in certain tax assessments which are pending final decisions, the outcome of which is not presently
determinable.
42. EFFECTS OF FRS AND INT FRS ISSUED BUT NOT YET ADOPTED
Certain new or revised FRS and INT FRS are mandatory for adoption by the Group for financial year beginning on or
after 1 April 2016.
(a) FRS 115 Revenue from Contracts with Customers
FRS 115 was issued in November 2014, which established a single comprehensive model for entities to use in
accounting for revenue arising from contracts with customers. FRS 115 will supersede the revenue recognition
guidance under FRS 18, Revenue and FRS 11, Construction Contracts as well as the related interpretations
when it becomes effective. This will take effect from financial year beginning on or after 1 April 2018, with
retrospective application.
(b) FRS 109 Financial Instruments
FRS 109 was issued in December 2014 to replace FRS 39, Financial Instruments: Recognition and Measurement.
The Standard introduced new requirements for classification and measurement of financial assets and
financial liabilities, general hedge accounting and impairment requirements for financial assets. This will take
effect from financial year beginning on or after 1 April 2018, with retrospective application.
The Group is currently assessing the impact of the above FRS on the financial statements of the Group and the
Company in the period of initial application.
The other new or revised FRS and INT FRS are not expected to have a significant impact on the financial statements
of the Group and the Company in the period of initial application.
43. COMPANIES IN THE GROUP
The Company’s immediate and ultimate holding company is Temasek Holdings (Private) Limited, a company
incorporated in Singapore. The following were the significant subsidiaries as well as associates and joint ventures as
at 31 March 2016 and 31 March 2015.
ANNUAL REPORT 2016 210

Notes to the Financial StatementsFor the financial year ended 31 March 2016
43.1 Significant subsidiaries incorporated in Singapore
Name of subsidiary Principal activities
Percentage of effective equity interest held by the Group
2016%
2015%
1. Amobee Group Pte Ltd Provider of digital marketing services 100 100
2. Computer Systems Holdings
Pte Ltd
Investment holding 100 100
3. DataSpark Pte. Ltd. Develop and market data analytics and
insights products and services
100 100
4. Hawk Digital Holding Co Pte. Ltd. Investment holding 100 100
5. Hawk Digital Pte. Ltd. Investment holding 100 100
6. HOOQ Digital Holdings Pte. Ltd. Investment holding 100 100
7. HOOQ Digital Pte. Ltd. Provision of regional premium over-the-top
video services
65 65
8. HOOQ Digital SG1 Pte. Ltd. Investment holding 65 65
9. HOOQ Digital SG2 Pte. Ltd. Investment holding 65 65
10. HOOQ Holdings Pte. Ltd. Investment holding 100 100
11. NCS Communications
Engineering Pte. Ltd.
Provision of facilities management and
consultancy services, and distributor of
specialised telecommunications and data
communication products
100 100
12. NCS Pte. Ltd. Provision of information technology and
consultancy services
100 100
13. NCSI Holdings Pte. Ltd. Investment holding 100 100
14. NCSI Solutions Pte. Ltd. Provision of information technology services 100 100
15. SCS Computer Systems Pte. Ltd. Provision of information technology and
consultancy services
100 100
16. Singapore Telecom Mobile
Pte Ltd
Investment holding and provision of
consultancy services
100 100
17. SingNet Pte Ltd Provision of internet access and pay
television services
100 100
SINGAPORE TELECOMMUNICATIONS LIMITED 211

Notes to the Financial StatementsFor the financial year ended 31 March 2016
Name of subsidiary Principal activities
Percentage of effective equity interest held by the Group
2016%
2015%
18. Singapore Telecom International
Pte Ltd
Holding of strategic investments and
provision of technical and management
consultancy services
100 100
19. Singtel Asia Pacific Investments
Pte. Ltd.
Investment holding and provision of
consultancy services
100 100
20. Singtel Asian Investments Pte Ltd Investment holding 100 100
21. Singtel Enterprise Security Pte. Ltd. Investment holding 100 –
22. Singtel Digital Life Pte. Ltd. Investment holding 100 100
23. Singtel Group Treasury Pte. Ltd. Provision of finance and treasury services to
Singtel and its subsidiaries
100 100
24. Singtel Idea Factory Pte. Ltd. Engaged in research and development,
products and services development and
business partnership
100 100
25. Singtel Innov8 Pte. Ltd. Venture capital investment holding 100 100
26. Singtel International Investments
Private Limited
Investment holding 100 100
27. Singtel Mobile Singapore Pte. Ltd. Operation and provision of cellular mobile
telecommunications systems and services,
resale of fixed line and broadband services
100 100
28. SingtelSat Pte Ltd Provision of satellite capacity for
telecommunications and video broadcasting
services
100 100
29. Singtel Singapore Pte. Ltd. Investment holding 100 100
30. Singtel Strategic Investments
Pte Ltd
Investment holding 100 100
31. ST-2 Satellite Ventures
Private Limited
Provision of satellite capacity for
telecommunications and video broadcasting
services
61.9 61.9
32. Subsea Network Services Pte Ltd Provision of storage facilities for submarine
telecommunication cables and related
equipment
100 100
43.1 Significant subsidiaries incorporated in Singapore (Cont’d)
ANNUAL REPORT 2016 212

Notes to the Financial StatementsFor the financial year ended 31 March 2016
Name of subsidiary Principal activities
Percentage of effective equity interest held by the Group
2016%
2015%
33. Sembawang Cable Depot Pte Ltd Provision of storage facilities for submarine
telecommunication cables and related
equipment
60 60
34. Singtel Digital Media Pte Ltd Development and management of on-line
internet portal
100 100
35 Telecom Equipment Pte Ltd Engaged in the sale and maintenance of
telecommunications equipment, and mobile
finance services
100 100
All companies are audited by Deloitte & Touche LLP.
43.2 Significant subsidiaries incorporated in Australia
Name of subsidiary Principal activities
Percentage of effective equity interest held by the Group
2016%
2015%
1. Amobee ANZ Pty Ltd Provider of digital marketing services 100 100
2. Alphawest Services Pty Ltd (1) Provision of information technology services 100 100
3. Ensyst Pty Limited Provision of cloud services 100 100
4. Inform Systems Australia Pty Ltd (1) Provision of information technology services 100 100
5. NCSI (Australia) Pty Limited Provision of information technology services 100 100
6. Optus Administration
Pty Limited (1)
Provision of management services to the
Optus Group
100 100
7. Optus Backbone Investments
Pty Limited
Investment in telecommunications network
infrastructure in Australia
100 100
8. Optus Billing Services
Pty Limited (*)
Provision of billing services to the
Optus Group
100 100
9. Optus Broadband Pty Limited (1) Provision of high speed residential
internet service
100 100
10. Optus C1 Satellite Pty Limited (1) C1 Satellite contracting party 100 100
11. Optus Data Centres Pty Limited (1) Provision of data communication services 100 100
43.1 Significant subsidiaries incorporated in Singapore (Cont’d)
SINGAPORE TELECOMMUNICATIONS LIMITED 213

Notes to the Financial StatementsFor the financial year ended 31 March 2016
Name of subsidiary Principal activities
Percentage of effective equity interest held by the Group
2016%
2015%
12. Optus Finance Pty Limited (1) Provision of financial services to the
Optus Group
100 100
13. Optus Fixed Infrastructure
Pty Limited (formerly known as
XYZed Pty Ltd) (1)
Provision of telecommunications
services
100 100
14. Optus Insurance Services
Pty Limited
Provision of handset insurance and
related services
100 100
15. Optus Internet Pty Limited (1) Provision of internet services to
retail customers
100 100
16. Optus Mobile Pty Limited (1) Provision of mobile phone services 100 100
17. Optus Narrowband Pty Limited (*) Provision of narrowband portal content
services
100 100
18. Optus Networks Pty Limited (1) Provision of telecommunications services 100 100
19. Optus Rental & Leasing
Pty Limited (*)
Provision of equipment rental services to
customers
100 100
20. Optus Stockco Pty Limited (*) Purchases of Optus Group network
inventory
100 100
21. Optus Systems Pty Limited (1) Provision of information technology services
to the Optus Group
100 100
22. Optus Vision Interactive
Pty Limited (*)
Provision of interactive television services 100 100
23. Optus Vision Media Pty Limited (*) (2) Provision of broadcasting related services 20 20
24. Optus Vision Pty Limited (1) Provision of telecommunications services 100 100
25. Perpetual Systems Pty Ltd (1) Provision of IT disaster recovery services 100 100
26. Prepaid Services Pty Limited (1) Distribution of prepaid mobile products 100 100
27. Reef Networks Pty Ltd (1) Operation and maintenance of fibre optic
network between Brisbane and Cairns
100 100
28. Singapore Telecom Australia
Investments Pty Limited
Investment holding 100 100
29. Simplus Mobile Pty Limited (1) Provision of mobile phone services 100 100
43.2 Significant subsidiaries incorporated in Australia (Cont’d)
ANNUAL REPORT 2016 214

Notes to the Financial StatementsFor the financial year ended 31 March 2016
Name of subsidiary Principal activities
Percentage of effective equity interest held by the Group
2016%
2015%
30. Singtel Enterprise Security
(Australia) Pty Limited
Investment holding 100 –
31. Singtel Optus Pty Limited Investment holding 100 100
32. Source Integrated Networks
Pty Limited (1)
Provision of data communications and
network services
100 100
33. Uecomm Operations
Pty Limited (1)
Provision of data communication services 100 100
34. Virgin Mobile (Australia)
Pty Limited (1)
Provision of mobile phone services 100 100
35. Vividwireless Group Limited Provision of wireless broadband services 100 100
36. XYZed LMDS Pty Limited (*) Holder of telecommunications licence 100 100
All companies are audited by Deloitte Touche Tohmatsu, Australia, except for those companies denoted (*) where
no statutory audit is required.
Notes:(1) These entities are relieved from the Australian Corporations Act 2001 requirements for preparation, audit and lodgement of financial reports
pursuant to ASIC Class Order 98/1418 (as amended) dated 13 August 1998.(2) Optus Vision Media Pty Limited is deemed to be a subsidiary by virtue of control.
43.3 Significant subsidiaries incorporated outside Singapore and Australia
Name of subsidiary Principal activities
Country of incorporation/operation
Percentage of effective equity interest held by the Group
2016%
2015%
1. Adconion Media, Inc. Provision of digital marketing
services
USA 100 100
2. Amobee, Inc. (2) Provision of digital marketing
services
USA 100 100
3. GB21 (Hong Kong) Limited Provision of telecommunications
services and products
Hong Kong 100 100
4. HOOQ Digital (India) Inc. Provision of internet video and
related activities and services
India 65 –
5. HOOQ Digital (Philippines)
Inc.
Provision of marketing support Philippines 65 –
43.2 Significant subsidiaries incorporated in Australia (Cont’d)
SINGAPORE TELECOMMUNICATIONS LIMITED 215
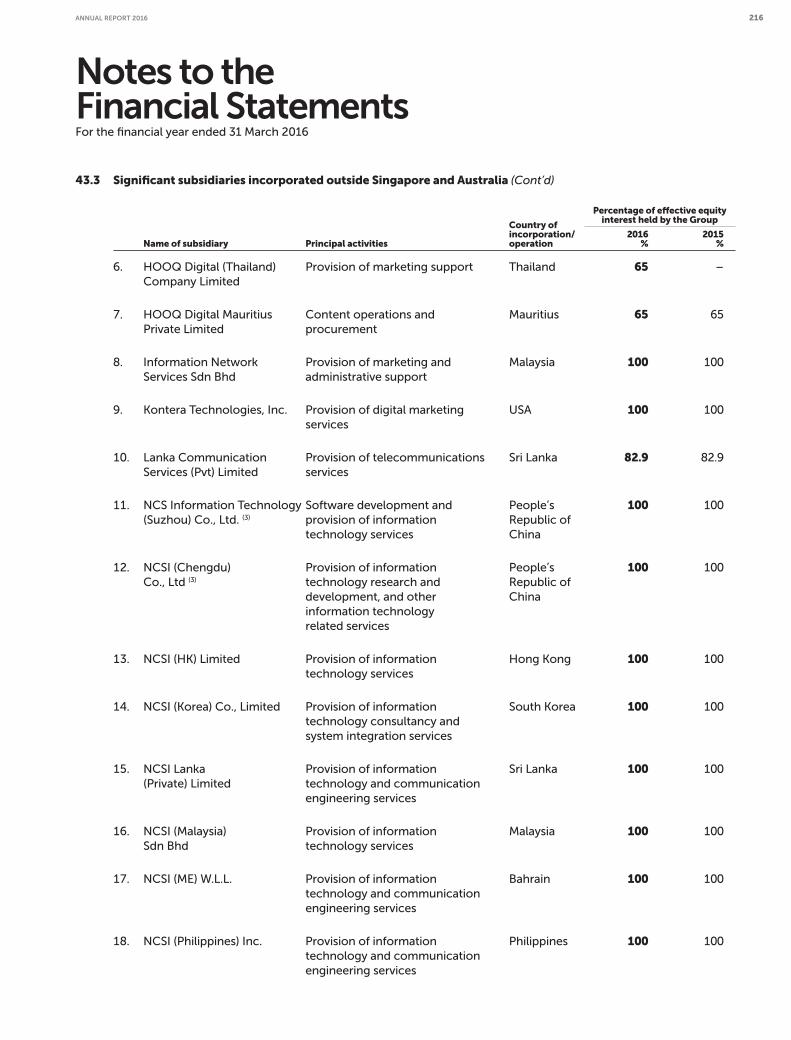
Notes to the Financial StatementsFor the financial year ended 31 March 2016
Name of subsidiary Principal activities
Country of incorporation/operation
Percentage of effective equity interest held by the Group
2016%
2015%
6. HOOQ Digital (Thailand)
Company Limited
Provision of marketing support Thailand 65 –
7. HOOQ Digital Mauritius
Private Limited
Content operations and
procurement
Mauritius 65 65
8. Information Network
Services Sdn Bhd
Provision of marketing and
administrative support
Malaysia 100 100
9. Kontera Technologies, Inc. Provision of digital marketing
services
USA 100 100
10. Lanka Communication
Services (Pvt) Limited
Provision of telecommunications
services
Sri Lanka 82.9 82.9
11. NCS Information Technology
(Suzhou) Co., Ltd. (3)
Software development and
provision of information
technology services
People’s
Republic of
China
100 100
12. NCSI (Chengdu)
Co., Ltd (3)
Provision of information
technology research and
development, and other
information technology
related services
People’s
Republic of
China
100 100
13. NCSI (HK) Limited Provision of information
technology services
Hong Kong 100 100
14. NCSI (Korea) Co., Limited Provision of information
technology consultancy and
system integration services
South Korea 100 100
15. NCSI Lanka
(Private) Limited
Provision of information
technology and communication
engineering services
Sri Lanka 100 100
16. NCSI (Malaysia)
Sdn Bhd
Provision of information
technology services
Malaysia 100 100
17. NCSI (ME) W.L.L. Provision of information
technology and communication
engineering services
Bahrain 100 100
18. NCSI (Philippines) Inc. Provision of information
technology and communication
engineering services
Philippines 100 100
43.3 Significant subsidiaries incorporated outside Singapore and Australia (Cont’d)
ANNUAL REPORT 2016 216

Notes to the Financial StatementsFor the financial year ended 31 March 2016
Name of subsidiary Principal activities
Country of incorporation/operation
Percentage of effective equity interest held by the Group
2016%
2015%
19. NCSI (Shanghai),
Co. Ltd (3)
Provision of system integration,
software research and
development and other
information technology-related
services
People’s
Republic of
China
100 100
20. Pastel Limited Investment holding Mauritius 100 100
21. Singtel Enterprise Security
(US), Inc.
Investment holding USA 100 –
22. Singtel Global
Private Limited
Provision of infotainment products
and services, and investment
holding
Mauritius 100 100
23. Singtel Global India
Private Limited
Provision of telecommunications
services and all related activities
India 100 100
24. Singtel Mobile Marketing,
Inc.
Investment holding USA 100 100
25. Singapore Telecom Hong
Kong Limited
Provision of telecommunications
services and all related activities
Hong Kong 100 100
26. Singapore Telecom India
Private Limited
Engaged in general liaison and
support services
India 100 100
27. Singapore Telecom Japan
Co Ltd
Provision of telecommunications
services and all related activities
Japan 100 100
28. Singapore Telecom Korea
Limited
Provision of telecommunications
services and all related activities
South Korea 100 100
29. Singapore Telecom USA,
Inc.
Provision of telecommunications,
engineering and marketing services
USA 100 100
30. Singtel Australia
Investment Ltd
Investment holding British Virgin
Islands
100 100
31. Singtel (Europe) Limited Provision of telecommunications
services and all related activities
United
Kingdom
100 100
32. SingTel (Philippines), Inc. Engaged in general liaison and
support services
Philippines 100 100
43.3 Significant subsidiaries incorporated outside Singapore and Australia (Cont’d)
SINGAPORE TELECOMMUNICATIONS LIMITED 217

Notes to the Financial StatementsFor the financial year ended 31 March 2016
Name of subsidiary Principal activities
Country of incorporation/operation
Percentage of effective equity interest held by the Group
2016%
2015%
33. Singtel Taiwan Limited Provision of telecommunications
services and all related activities
Taiwan 100 100
34. Singtel Ventures (Cayman)
Pte Ltd
Investment holding Cayman
Islands
100 100
35. Sudong Sdn. Bhd. Management, provision and
operations of a call centre for
telecommunications services
Malaysia 100 100
36. Trustwave Holdings, Inc. Provision of managed
security services
USA 98 –
37. Trustwave Limited Provision of managed
security services
United
Kingdom
98 –
38. Viridian Limited Investment holding Mauritius 100 100
All companies are audited by a member firm of Deloitte Touche Tohmatsu Limited except for the company denoted (*)
which is audited by another firm.
Notes:(1) The place of the business of the subsidiaries are the same as their country of incorporation, unless otherwise specified. (2) The company has operations mainly in the USA, Australia, Israel, Singapore and the United Kingdom.(3) Subsidiary’s financial year-end is 31 December.
43.4 Associates of the Group
Name of associate Principal activities
Country of incorporation/operation
Percentage of effective equity interest held by the Group
2016%
2015%
1. 2359 Media Pte. Ltd. (2) Development and design of
mobile-based advertising
Singapore 28.6 –
2. ADSB Telecommunications
B.V. (3)
Dormant Netherlands – 25.6
3. APT Satellite Holdings
Limited (4)
Investment holding Bermuda 20.3 20.3
4. APT Satellite International
Company Limited (4)
Investment holding British Virgin
Islands
28.6 28.6
5. HOPE Technik Pte Ltd Provision of high performance
unique engineering solutions
Singapore 21.3 –
43.3 Significant subsidiaries incorporated outside Singapore and Australia (Cont’d)
ANNUAL REPORT 2016 218

Notes to the Financial StatementsFor the financial year ended 31 March 2016
Name of associate Principal activities
Country of incorporation/operation
Percentage of effective equity interest held by the Group
2016%
2015%
6. IGA Limited (2) Provision of online digital
advertising platform
Cayman
Islands
22.1 –
7. Kai Square (2) Provision of next generation
cloud-based video surveillance
services, monitoring and analytics
based on a unified platform
Singapore 39.2 –
8. MassiveImpact International
Ltd
Provision of performance based
mobile advertising platform
British Virgin
Islands
48.9 –
9. NetLink Trust (5) To own, install, operate and
maintain the passive infrastructure
for Singapore’s Next Generation
Nationwide Broadband Network
Singapore 100.0 100.0
10. Sentilla Corporation (2) Provision of energy management
services for data centres
USA 23.4 –
11. Singapore Post Limited (6) Operation and provision of postal,
logistics and retail services
Singapore 22.8 23.0
12. Viewers Choice Pte Ltd Provision of services relating to
motor vehicle rental and retail of
general merchandise
Singapore 49.2 49.2
Notes:(1) The place of business of the associates are the same as their country of incorporation. (2) These companies were reclassified from ‘Available-for-sale Investments’ during the year. (3) The company was liquidated during the year. (4) The company has been equity accounted for in the consolidated financial statements based on results ended, or as at, 31 December 2015, the
financial year-end of the company. (5) Audited by Deloitte & Touche LLP, Singapore. NetLink Trust is a business trust established as part of IDA’s effective open access requirements
under Singapore’s Next Generation Nationwide Broadband Network, and is currently 100% owned by Singtel. It is regarded as an associate as Singtel does not have effective control in the trust.
(6) Audited by PricewaterhouseCoopers LLP, Singapore.
43.4 Associates of the Group (Cont’d)
SINGAPORE TELECOMMUNICATIONS LIMITED 219

Notes to the Financial StatementsFor the financial year ended 31 March 2016
Name of joint venture Principal activities
Country of incorporation/operation
Percentage of effective equity interest held by the Group
2016%
2015%
1. Abacus Travel Systems
Pte Ltd (3)
Marketing and distributing certain
travel-related services through
on-line airline computerised
reservations systems
Singapore – 30.0
2. Acasia Communications
Sdn Bhd (4)
Provision of networking services
to business customers operating
within and outside Malaysia
Malaysia 14.3 14.3
3. ACPL Marine Pte Ltd To own, operate and manage
maintenance-cum-laying cableships
Singapore 41.7 41.7
4. Advanced Info Service
Public Company Limited (5)
Provision of mobile, broadband,
international telecommunications
services, call centre and data
transmission
Thailand 23.3 23.3
5. ASEAN Cableship Pte Ltd Operation of cableships for
laying, repair and maintenance of
submarine telecommunication
cables
Singapore 16.7 16.7
6. ASEAN Telecom Holdings
Sdn Bhd (4)
Investment holding Malaysia 14.3 14.3
7. Asiacom Philippines, Inc. (4) Investment holding Philippines 40.0 40.0
8. Bharti Airtel
Limited (6)
Provision of mobile, long distance,
broadband and telephony
telecommunications services,
enterprise solutions, pay television
and passive infrastructure
India 32.9 32.4
9. Bharti Telecom
Limited (6)
Investment holding India 39.8 39.8
10. Bridge Mobile Pte. Ltd. Provision of regional mobile
services
Singapore 33.8 33.8
11. Globe Telecom, Inc. (7) (8) Provision of mobile, broadband,
international and fixed line
telecommunications services
Philippines 21.5 21.5
12. Grid Communications
Pte. Ltd. (4)
Provision of public trunk radio
services
Singapore 50.0 50.0
13. Indian Ocean Cableship
Pte. Ltd.
Leasing, operating and managing
of maintenance-cum-laying
cableship
Singapore 50.0 50.0
43.5 Joint Ventures of the Group
ANNUAL REPORT 2016 220

Notes to the Financial StatementsFor the financial year ended 31 March 2016
Name of joint venture Principal activities
Country of incorporation/operation
Percentage of effective equity interest held by the Group
2016%
2015%
14. International Cableship
Pte Ltd
Ownership and chartering of
cableships
Singapore 45.0 45.0
15. Main Event Television
Pty Limited
Provision of cable television
programmes
Australia 33.3 33.3
16. OPEL Networks Pty Limited Dormant Australia 50.0 50.0
17. Pacific Bangladesh Telecom
Limited
Provision of mobile
telecommunications, broadband
and data transmission services
Bangladesh 45.0 45.0
18. Pacific Carriage Holdings
Limited (9)
Operation and provision of
telecommunications facilities and
services utilising a network of
submarine cable systems
Bermuda 39.99 39.99
19. PT Telekomunikasi Selular (10) Provision of mobile
telecommunications and related
services
Indonesia 35.0 35.0
20. Radiance Communications
Pte Ltd (4)
Sale, distribution, installation
and maintenance of
telecommunications equipment
Singapore 50.0
39.99
50.0
50.0
49.0
50.0
39.99
50.0
50.0
49.0
21. Southern Cross Cables
Holdings Limited (9) (11)
Operation and provision of
telecommunications facilities and
services utilising a network of
submarine cable systems
Bermuda
22. SSBI Pte. Ltd. Dormant Singapore
23. Telescience Singapore
Pte Ltd
Sale, distribution and installation
of telecommunications
equipment
Singapore
24. VA Dynamics Sdn.
Bhd. (4)
Distribution of networking cables
and related products
Malaysia
Notes:(1) The place of business of the joint ventures are the same as their country of incorporation, unless otherwise specified. (2) The Group holds substantive participating rights over the significant financial and operating decisions of the above joint ventures, which enables
the Group to exercise joint control with the other shareholders. (3) The company has been disposed during the year.(4) The company has been equity accounted for in the consolidated financial statements based on the results ended, or as at, 31 December 2015, the
financial year-end of the company.(5) Audited by KPMG Phoomchai Audit Ltd, Bangkok. The company changed its auditor to Deloitte Touche Tohmatsu Jaiyos Audit Co. Ltd, Bangkok
from January 2016.(6) Audited by S.R.Batliboi & Associates, New Delhi (a member firm of Ernst & Young). The company has operations in India, Bangladesh, Sri Lanka,
and 17 countries across Africa. (7) Audited by Navarro Amper & Co. (a member firm of Deloitte Touche Tohmatsu Limited).(8) The Group has a 47.2% effective economic interest in Globe.(9) The Southern Cross Cable Consortium operates through two separate companies. Southern Cross Cables Holdings Limited owns a cable network
between Australia and the USA, with operations outside the USA. Pacific Carriage Holdings Limited has operations within the USA.(10) Audited by Purwantono, Sungkoro & Surja (a member firm of Ernst & Young).(11) Audited by KPMG, Bermuda.
43.5 Joint Ventures of the Group (Cont’d)
SINGAPORE TELECOMMUNICATIONS LIMITED 221