12879_2014_3797_moesm1_esm.docx - springer …10.1186/1471... · web viewwe constructed a...
TRANSCRIPT
Impact of novel diagnostic tests for childhood tuberculosis and
extrapulmonary tuberculosis
- Supplementary information
Claudia M. Denkinger, Beate Kampmann, Syed Ahmed, David W. Dowdy
1
1
2
3
4
5
6
7
8
9
1. Model Structure Description
We constructed a compartmental differential-equation model to describe a mature tuberculosis
(TB) epidemic in a stable population of 100,000 children and adults patterned on that of India.
The model population was divided into compartments defined by the individual’s age, TB status,
type of TB disease, HIV status and TB drug susceptibility pattern (sensitive, isoniazid [INH]-
monoresistant, multidrug-resistant [MDR], and extensively-drug resistant [XDR]) (Table E3).
All individuals at any stage of TB infection are presumed to harbor a ‘dominant’ TB strain;
this strain determines the patient’s drug-susceptibility pattern upon development of active TB.
An individual’s risk of becoming infected with a specified TB strain (defined by drug resistance:
sensitive, INH-monoresistant, MDR, or XDR) is directly proportional to the number of active TB
patients harboring the specified strain at a given time, and the relative infectivity of that strain.
Upon infection, the infecting strain will become the dominant strain in 100% of previously
uninfected individuals, and a smaller proportion of individuals harboring latent TB infection
because latent infection provides partial protection against reinfection [1, 2] (Table E1).
Among individuals in whom the infecting strain becomes the dominant strain, a proportion
will progress rapidly to active TB, and the remainder will become latently infected with the new
strain [2]. Latently infected individuals remain at risk of endogenous reactivation with the same
or reinfection with any other strain throughout their lifetimes (taking into account partial
protection through prior infection) [1, 3, 4]. The risk for primary progression and reactivation
depends on the HIV status of the patient (Table E1). Treatment for latent TB infection is not
incorporated into the model.
2
10
11
12
13
14
15
16
17
18
19
20
21
22
23
24
25
26
27
28
29
30
31
32

Individuals with HIV co-infection are presumed to have higher baseline mortality than non-
HIV infected patients and a higher mortality when infected with TB (Table E1) [5, 6].
Furthermore, these patients are presumed not to have a protective effect from latent infection and
are more likely to reactivate latent infection [1, 4, 7, 8]. New infection also is more likely to
directly progress to active disease in HIV-positive individuals and self-cure from active infection
does not occur [9].
Upon development of active TB, patients are immediately considered to be infectious if they
develop pulmonary TB (PTB) and have an increased mortality risk due to TB. Children with
PTB are considered to be less infectious than adults (by a factor of 1/5). In children 85% develop
TB that is difficult to diagnose with current widely available diagnostic methods [10-13]. In
adults the development of EPTB and sputum scarce TB will depend on the HIV-status of the
individual [14-16] (Table E1).
Some patients will not have access to health care and diagnostics for TB and will remain
infectious until they either self-cure or die (Table E1). Other patients will get diagnosed and will
exit the subpopulation of active diagnosed cases at a rate defined as the inverse of the mean time
to initial diagnosis. The likelihood of being diagnosed and the time to initial diagnosis will
depend on the diagnostic method available and the HIV status. Individuals with active TB are
assumed to undergo diagnostic attempts at a defined rate.
Unlike other models that assume diagnostic attempts to reflect tests with a single diagnostic
or defined series of diagnostic tests, our conceptualization of “diagnostic attempt” is more
3
33
34
35
36
37
38
39
40
41
42
43
44
45
46
47
48
49
50
51
52
53
54
55
inclusive and incorporates all initial and follow-on testing that is performed until a diagnosis of
TB is either made or excluded by the diagnosing practitioner or team of practitioners [17, 18].
One diagnostic attempt may include clinical judgment, radiography and other tests in addition to
the diagnostic test for TB specifically (smear microscopy or molecular test) and is considered to
lead to a diagnosis (Table E1). By using this more inclusive definition of “diagnostic attempt,”
we maximize our ability to account for empiric treatment but may underestimate the impact of a
rapid diagnostic test in terms of reducing diagnostic delays, which are intrinsically incorporated
into our rate of diagnostic attempt. Extrapulmonary TB requires an invasive sample for
microbiological proof, thus diagnostic attempts are often delayed (diagnostic rate is reduced by
half compared to PTB) [19-23].
At the time of diagnosis, we assume that 85% of patients obtain treatment [24]. Patients with
active TB who receive treatment are instantaneously placed into one of three subpopulations:
(i) Cured/Recovered: Those who are cured from TB whether or not that completed a full
course of therapy.
(ii) Active, previously treated TB: Those who default or complete therapy but will
relapse.
(iii) Failure: Those who fail therapy.
Depending on the baseline susceptibility of the strain (e.g. INH-resistant) the patients may
also develop further resistance. Patients who develop additional resistance mutations are
assigned directly to the failing group in the respective drug-resistant compartment (e.g. MDR
resistance). The distribution into the subpopulation compartments (cured, previously treated
4
56
57
58
59
60
61
62
63
64
65
66
67
68
69
70
71
72
73
74
75
76
77
78
active TB, failure and resistance) reflects the percentages as reported in the literature (Table E2).
We presumed that, before year zero, drug-susceptibility testing (DST) is limited only to those
who have failed a previous course of TB therapy and remain symptomatic [25]. In all other
cases, patients are treated with standard short-course (first-line) therapy. If resistance is present
at initial diagnosis, a higher proportion of patients will fail, recur or develop further resistance
(Table E2). Patients who already failed therapy are assumed to receive second-line therapy for
MDR-TB after the duration that it takes for them to be identified as failing first-line therapy (six
to eight months).
Patients with recurrent TB after completing an initial course of therapy are assumed to be
diagnosed at the same rate as new cases. The likelihood of being diagnosed depends on the
diagnostic method available [25]. If the patient does not receive DST or the DST does not
diagnose resistance, treatment including an aminoglycoside and lasting a total of eight months
(“category II”) is assumed. In contrast, if the patient is diagnosed with a resistance mutation
based on DST, a second-line regimen is assumed, with correspondingly higher cure rates (Table
E2). Patients who fail therapy are assumed to be re-diagnosed at twice the rate of new cases.
All patients with active PTB are considered infectious. Patients who are failing but on
partially active therapy (i.e. 1 or 2 active drugs) are assumed to be as infectious as smear-
negative patients, who are responsible for about 20% of cases in contact and outbreak
investigations [26]. Similarly, children are presumed to be less infectious overall (presumed to be
5
79
80
81
82
83
84
85
86
87
88
89
90
91
92
93
94
95
96
97
98
99
100
similar to failure cases), with likely no infectivity at all in children under 5, although data is very
limited.
Active regimens immediately render the patient non-infectious and return the patient’s
mortality risk to that of an uninfected individual [27]. Patients who are cured may get reinfected
but are considered to have partial protection against reinfection similar to that of latent TB
infection [1]. If these patients acquire infection again, they progress to the previously-treated
active TB group.
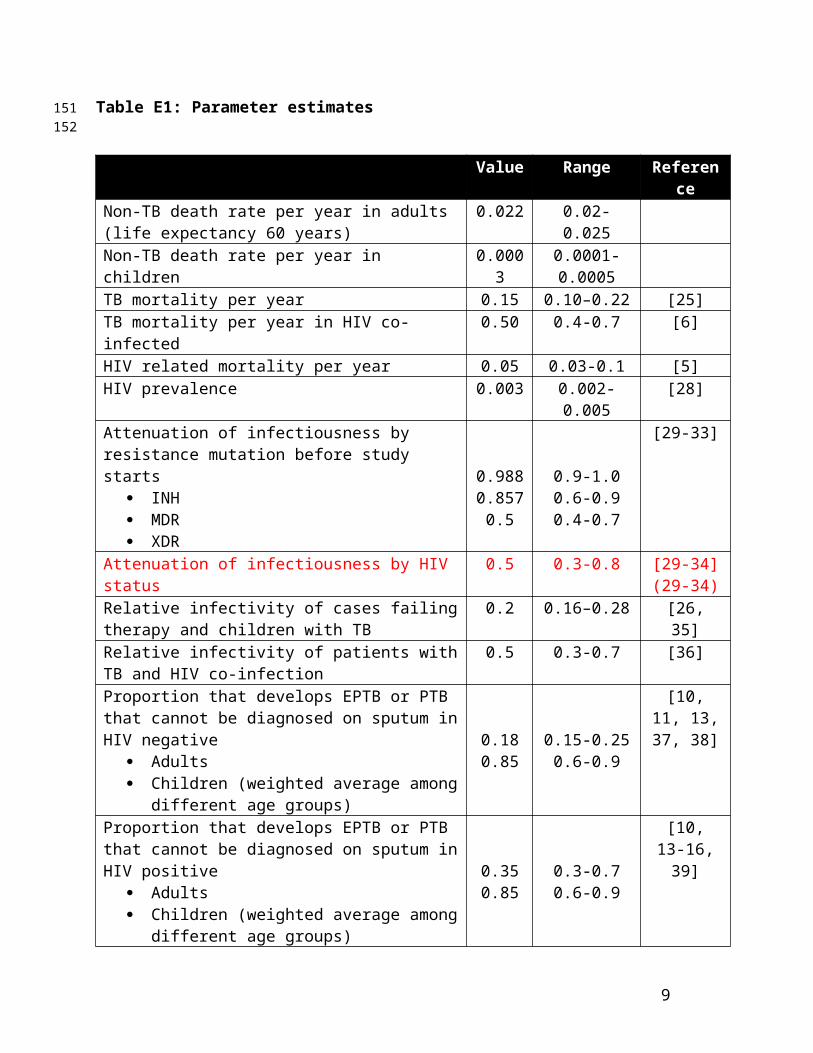
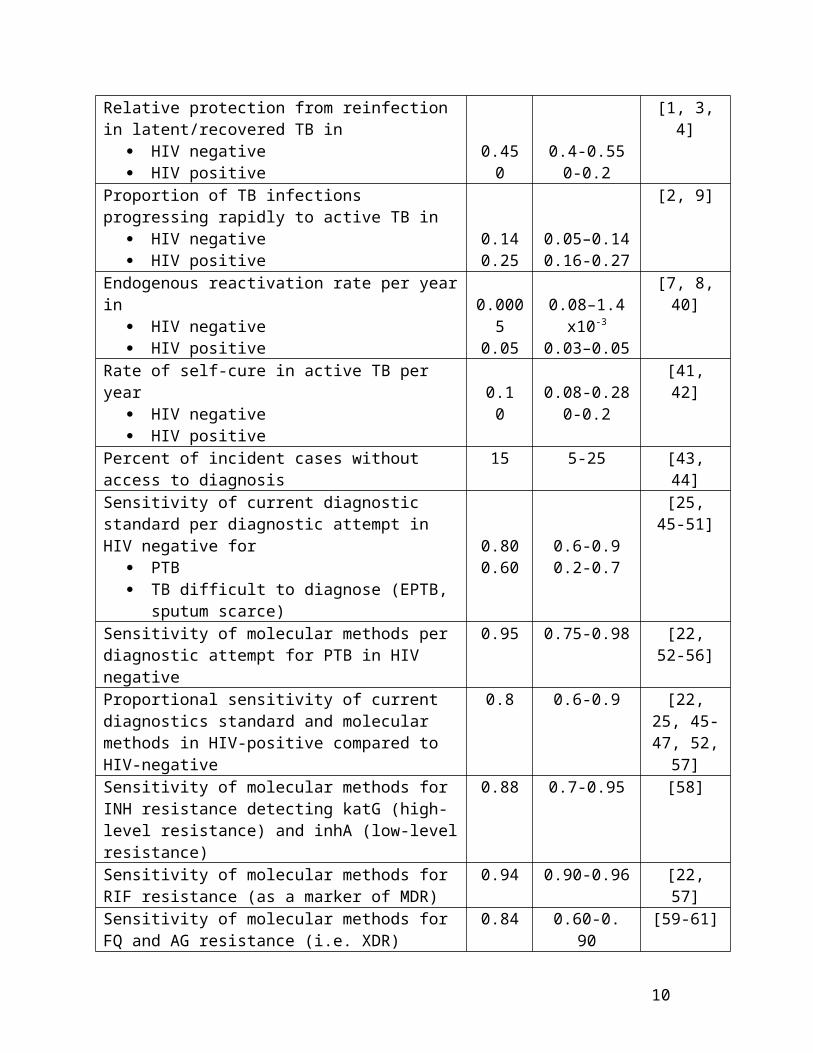
Table E1: Parameter estimates
Value Range ReferenceNon-TB death rate per year in adults (life expectancy 60 years)
0.022 0.02-0.025
Non-TB death rate per year in children 0.0003 0.0001-0.0005TB mortality per year 0.15 0.10–0.22 [25]TB mortality per year in HIV co-infected 0.50 0.4-0.7 [6]HIV related mortality per year 0.05 0.03-0.1 [5]HIV prevalence 0.003 0.002-0.005 [28]Attenuation of infectiousness by resistance mutation before study starts
INH MDR XDR
0.988 0.8570.5
0.9-1.00.6-0.90.4-0.7
[29-33]
Attenuation of infectiousness by HIV status 0.5 0.3-0.8 [29-34](29-34)
Relative infectivity of cases failing therapy and children with TB
0.2 0.16–0.28 [26, 35]
Relative infectivity of patients with TB and HIV co-infection
0.5 0.3-0.7 [36]
Proportion that develops EPTB or PTB that cannot be diagnosed on sputum in HIV negative
Adults Children (weighted average among different
age groups)
0.180.85
0.15-0.250.6-0.9
[10, 11, 13, 37, 38]
Proportion that develops EPTB or PTB that cannot be [10, 13-16,
6
101
102
103
104
105
106
107
108
109
110111
diagnosed on sputum in HIV positive Adults Children (weighted average among different
age groups)
0.350.85
0.3-0.70.6-0.9
39]
Relative protection from reinfection in latent/recovered TB in
HIV negative HIV positive
0.450
0.4-0.550-0.2
[1, 3, 4]
Proportion of TB infections progressing rapidly to active TB in
HIV negative HIV positive
0.140.25
0.05–0.140.16-0.27
[2, 9]
Endogenous reactivation rate per year in HIV negative HIV positive
0.00050.05
0.08–1.4 x10⁻³
0.03–0.05
[7, 8, 40]
Rate of self-cure in active TB per year HIV negative HIV positive
0.10
0.08-0.280-0.2
[41, 42]
Percent of incident cases without access to diagnosis 15 5-25 [43, 44]Sensitivity of current diagnostic standard per diagnostic attempt in HIV negative for
PTB TB difficult to diagnose (EPTB, sputum scarce)
0.800.60
0.6-0.90.2-0.7
[25, 45-51]
Sensitivity of molecular methods per diagnostic attempt for PTB in HIV negative
0.95 0.75-0.98 [22, 52-56]
Proportional sensitivity of current diagnostics standard and molecular methods in HIV-positive compared to HIV-negative
0.8 0.6-0.9 [22, 25, 45-47, 52, 57]
Sensitivity of molecular methods for INH resistance detecting katG (high-level resistance) and inhA (low-level resistance)
0.88 0.7-0.95 [58]
Sensitivity of molecular methods for RIF resistance (as a marker of MDR)
0.94 0.90-0.96 [22, 57]
Sensitivity of molecular methods for FQ and AG resistance (i.e. XDR)
0.84 0.60-0. 90 [59-61]
Sensitivity of phenotypic culture-based methods for RIF, INH, FQ and AG resistance
1 Assumed
Duration of illness before diagnostic attempt completed with standard test (months) for new and relapse cases
8 4-12 [19-22]
Duration of illness before diagnostic attempt completed with molecular test (months) for new and relapse cases
6 4-12 [19-22]
Proportional decrease in diagnostic rate for patients with EPTB if sampling of the site of disease is necessary for diagnostic test
0.5 0.5-1 [19-23]
Proportional increase in diagnostic rate for patients failing therapy
2 [19-22]
7
Proportional increase in diagnostic rate in patients with HIV
2 [21]
Proportion of patients that starts therapy after a TB diagnosis was achieved
0.85 0.81-0.89 [62, 63]
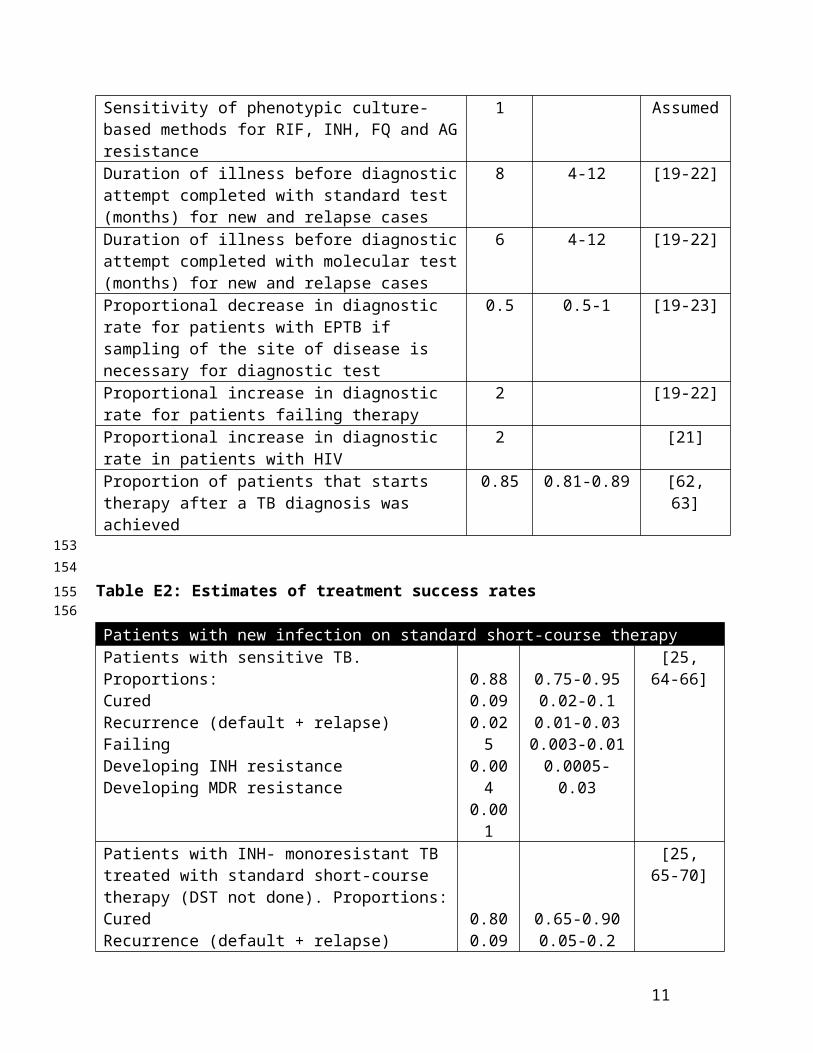
Table E2: Estimates of treatment success rates
Patients with new infection on standard short-course therapyPatients with sensitive TB. Proportions:CuredRecurrence (default + relapse)FailingDeveloping INH resistanceDeveloping MDR resistance
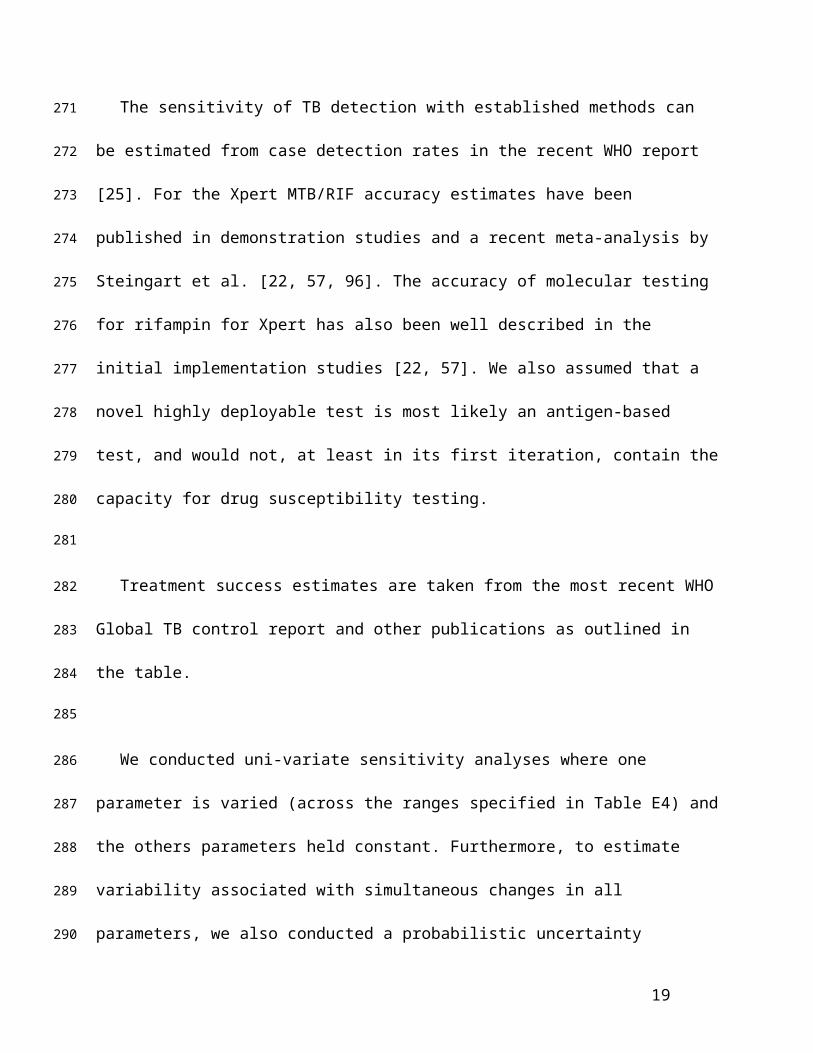
0.880.090.0250.0040.001
0.75-0.950.02-0.10.01-0.030.003-0.010.0005-0.03
[25, 64-66]
Patients with INH- monoresistant TB treated with standard short-course therapy (DST not done). Proportions:CuredRecurrence (default + relapse)Failing (not due to new drug resistance)Developing MDR resistance
0.800.090.100.01
0.65-0.900.05-0.20.03-0.2
0.001-0.02
[25, 65-70]
Patients with MDR TB treated with standard short-course therapy (DST not done). Proportions:CuredRecurrence (default + relapse)Failing (not due to new drug resistance)Developing XDR resistance
0.250.350.350.05
0.2-0.40.10-0.500.3-0.700.05-0.1
[25, 67, 68, 71-73]
Patients with XDR TB treated with standard short-course therapy (DST not done). Proportions:CuredRecurrence (default + relapse)Failing
0.150.400.45
0.05-0.30.10-0.600.4-0.70
Estimate
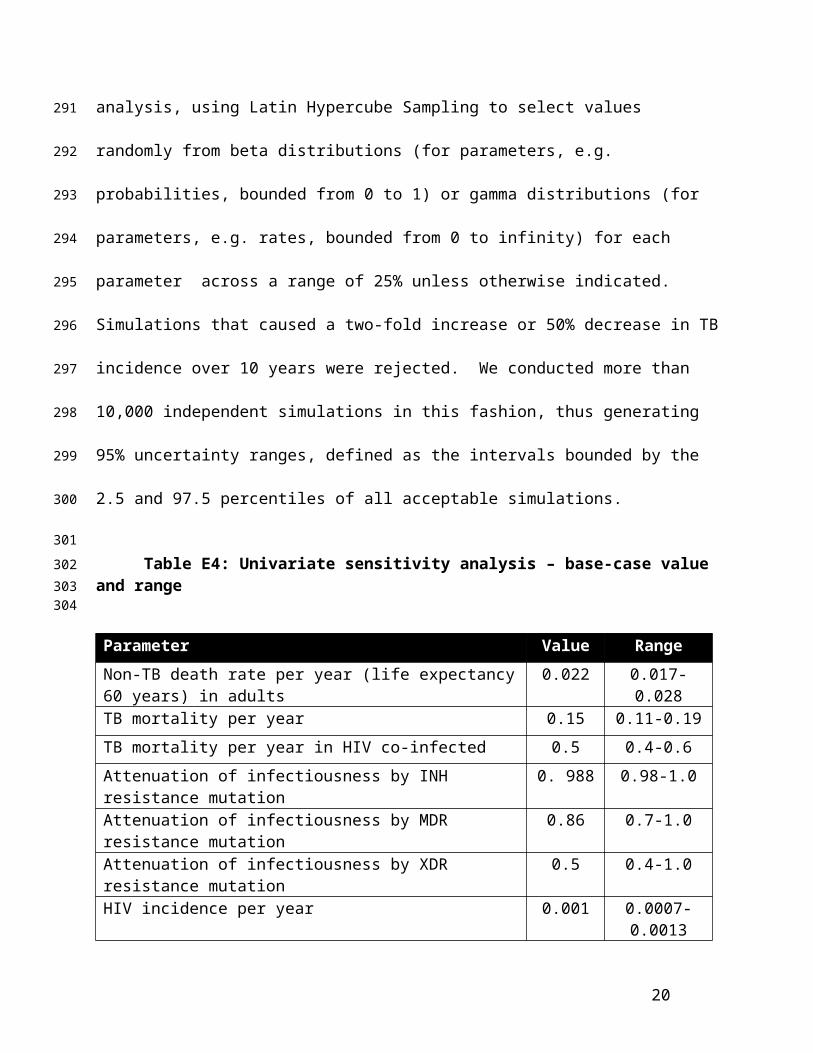
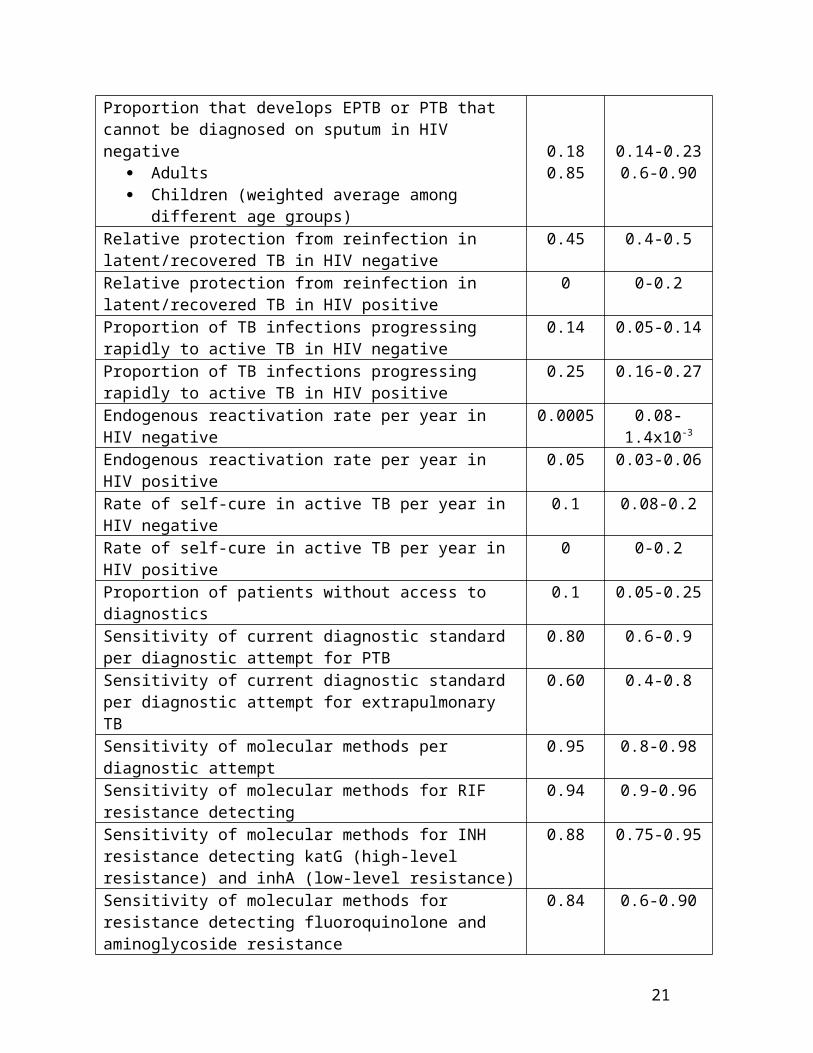
Patients with new infection on therapy based on DSTPatients with INH-monoresistant TB on active therapy based on DST. Proportions:CuredRecurrence (default + relapse)Failing (not due to new drug resistance)Developing MDR resistance
0.880.090.0290.001
0.75-0.950.05-0.170.02-0.11
0.001-0.005
[25, 65, 70, 74-77]
Patients with MDR TB on active therapy based on DST. Proportions:CuredRecurrence (default + relapse)FailingDeveloping XDR resistance
0.520.230.1760.069
0.40-0.830.15-0.350.1-0.300.03-0.1
[25, 73, 78-85]
8
112113
114115
Patients with XDR TB on active therapy based on DST. Proportions:CuredRecurrence (default + relapse)Failing
0.350.330.32
0.2-0.50.2-0.40.2-0.4
[25, 82, 86-89]
Table E3: Model compartmentsAll departments are subdivided by age, pulmonary versus extrapulmonary TB, drug-susceptibility and HIV-status. In total 164 compartments.
Compartment Description
Sa,h Susceptible never infected beforeMaximum risk of TB infection
Ld,a,h Latently infectedOffers partial protection against re-infection
Ad,a,h,t Actively infected that will be diagnosed and treatedInfectious, increased mortality
Nd,a,h,t Actively infected but never diagnosedInfectious, increased mortality
Fd,a,h,t Failure – requiring ongoing therapyIndividuals who develop resistance directly go from active treatment into the respective failed resistant compartmentInfectious at the rate of smear –negative cases
Rd,a,h,t Active recurring TB – Individuals who have active infection because they default, relapse or reinfection
Cd,a,h Cured/RecoveredAt risk for recurrent infection with partial infection conferred by prior infection
Legend: d refers to drug susceptibility (sensitive (s), multidrug-resistant (MDR), extensively drug-resistant (XDR) or INH-resistant (INH); t=type of infection (PTB, EPTB), h=HIV status (positive, negative), a=age group (children, adults)
2. Description of parameters
This section provides a more detailed description of the primary parameters for which the most
data exist to inform parameter estimates. The estimates for parameters with ranges and citations
are listed in Table E1.
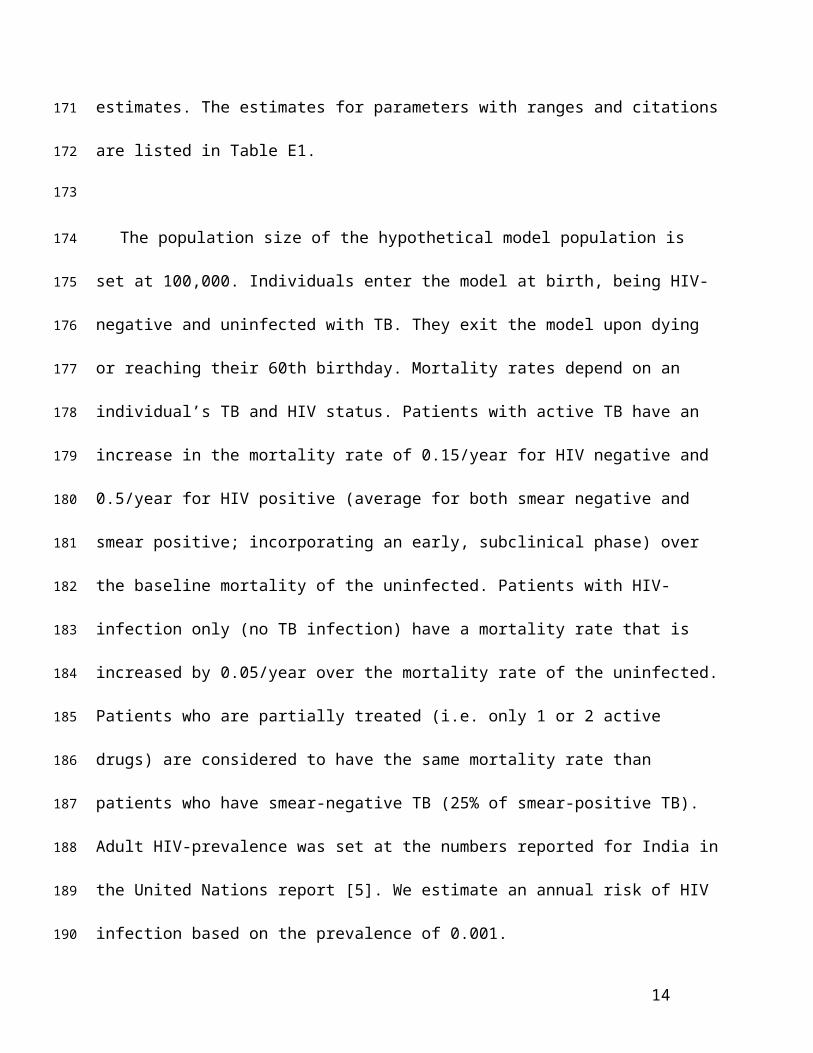
The population size of the hypothetical model population is set at 100,000. Individuals enter
the model at birth, being HIV-negative and uninfected with TB. They exit the model upon dying
9
116117
118119120121
122123
124
125
126
127
128
129
130
131
or reaching their 60th birthday. Mortality rates depend on an individual’s TB and HIV status.
Patients with active TB have an increase in the mortality rate of 0.15/year for HIV negative and
0.5/year for HIV positive (average for both smear negative and smear positive; incorporating an
early, subclinical phase) over the baseline mortality of the uninfected. Patients with HIV-
infection only (no TB infection) have a mortality rate that is increased by 0.05/year over the
mortality rate of the uninfected. Patients who are partially treated (i.e. only 1 or 2 active drugs)
are considered to have the same mortality rate than patients who have smear-negative TB (25%
of smear-positive TB). Adult HIV-prevalence was set at the numbers reported for India in the
United Nations report [5]. We estimate an annual risk of HIV infection based on the prevalence
of 0.001.
The transmission rate () denotes the number of secondary infections per infectious case. We
calculate the transmission based on the TB incidence in India in 2011 (181/100,000) [25].
Assuming an increase in resistance since introduction of anti-mycobacterial therapy in the
1950s, an attenuation of infectivity has to be expected for MDR strains to explain the currently
observed MDR estimates. Similar results have also been shown in laboratory experiments [31-
33]. Laboratory experiments on the transmissibility of INH-monoresistant TB suggest less
attenuation (range from 0.7 to 1.1) [29-31, 90]. In our model we calculated the attenuation
necessary to reproduce a constant increase in resistance since the 1950s. However, this proved
analytically impossible for INH-monoresistant TB without making unreasonable assumptions
(e.g., more transmissible than wild-type TB, very poor treatment outcomes).
10
132
133
134
135
136
137
138
139
140
141
142
143
144
145
146
147
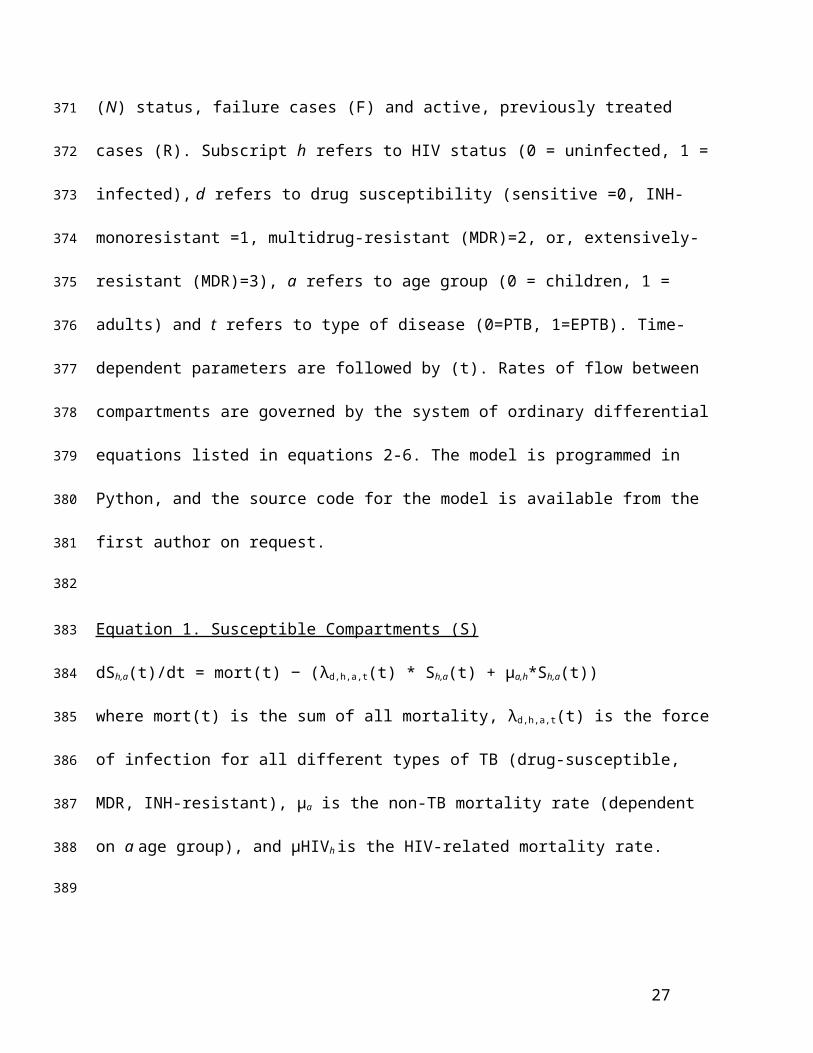
148
149
150
151
152
153
154
Thus, we instead calibrated the transmission rate of INH-monoresistant TB to provide a
steady-state level of INH-monoresistance (at 15% of new cases) over the past 60 years. This is
consistent with data of high INH-monoresistance from early surveillance reports and the lack of
a significant increase in INH-resistance in India since that time [25, 91-93]. This procedure
required only a minimal decrease in the transmission fitness of INH-monoresistant. After
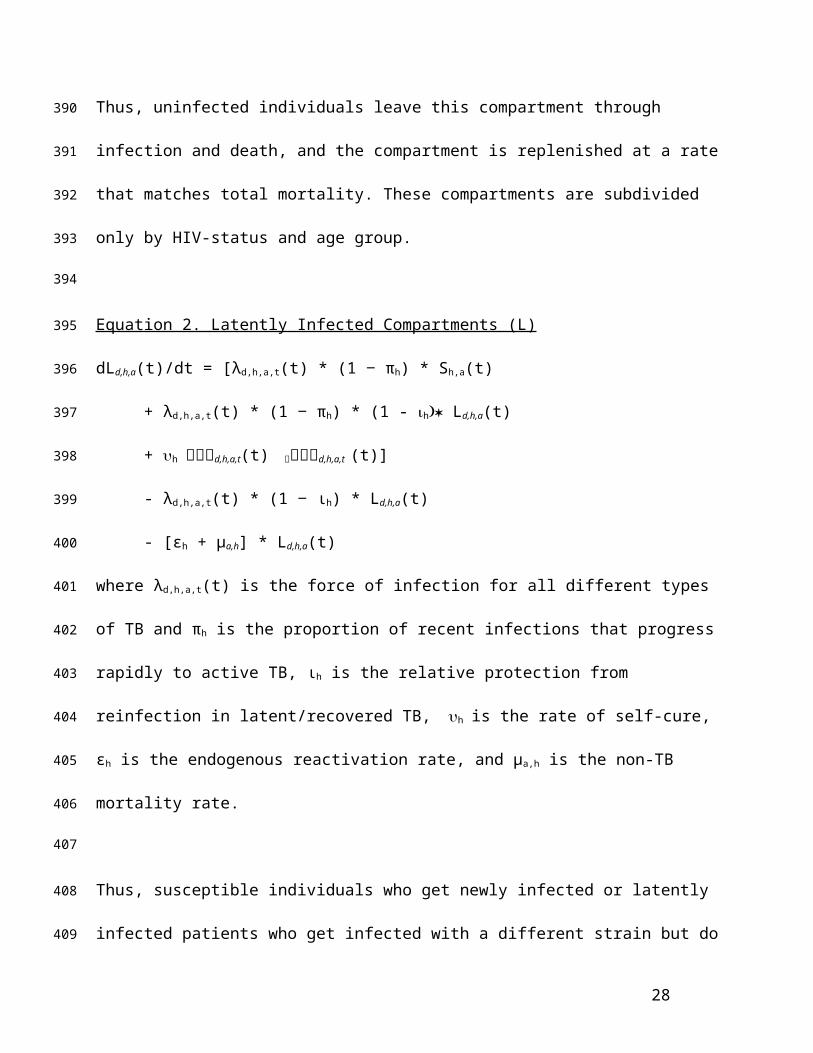
initiating this steady state, we calibrated the relative infectiousness of MDR-TB and XDR-TB
such that the modeled incidence among new (not previously treated) cases was 2.1% and 0.2%,
as estimated in India in 2011 respectively [25]. However, given the possibility of compensatory
mutations that restore the transmissibility, we do a sensitivity analysis around the attenuation
parameters.
The proportion of TB infections that progresses rapidly to active TB is taken as the
proportion of patients who develop active TB within one year of TB infection from Vynnycky
and Fine’s estimation in a British Population [2]. Of note, this estimate of 14% is greater than the
classically assumed 5%, or half of a 10% lifetime risk for active TB if infected in childhood.
Vynnycky and Fine suggest that the risk of rapid progression is higher in adults (14%) than in
children (4%). To account for the possibility of overestimating this parameter, we perform a
univariate sensitivity analysis to a lower bound of 5%.
The percentage of patients who are never diagnosed due lack of access to care also is a
matter of debate. Data exists from hospital studies primarily in an HIV-positive population where
up to three fourth of patients die of TB and a quarter was never suspected to have TB prior to
dying [43]. The proportion might be even higher in patients dying in the community but studies
11
155
156
157
158
159
160
161
162
163
164
165
166
167
168
169
170
171
172
173
174
175
176
177
are limited [44]. However, these estimates do not take into account self-cure and estimates are
certainly presumed to be lower in HIV-negative patients [25]. A sensitivity analysis was done to
a lower limit of 5% and an upper limit of 25% to account for uncertainty in this parameter value.
The annual endogenous reactivation rate in HIV-negative patients is taken from Ferebee’s
1970 review of TB chemoprophylaxis trials [40]. The estimate of the percent of patients that self
cure is taken from prior work of Enarson and Rouillon [94].
The diagnostic rate is calculated as the inverse of the mean time to initial diagnosis, which is
the sum of the disease duration of untreated TB and the provider delay after presentation. The
mean time to diagnosis varies between studies [19-21]. Given that the estimate may affect the
calculated TB incidence significantly, we perform a sensitivity analysis to account for a range of
duration until diagnosis. The delay in diagnosing EPTB is even more substantial, likely because
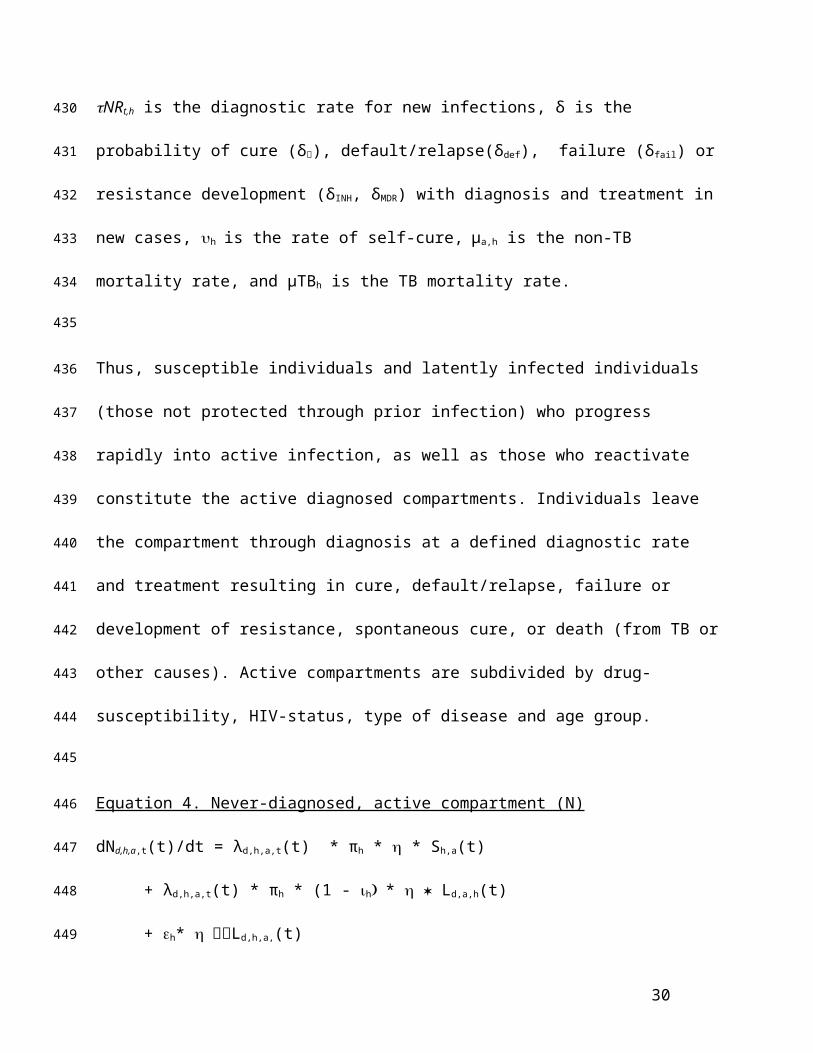
of the lack of suspicion for the diagnosis and the difficulty in obtaining a sample for diagnosis
[23]. In contrast, diagnosis in HIV-patients is more actively pursued as patients already have
access to the health care system and the need for diagnosing co-infection to prevent morbidity
and mortality is recognized [21, 95]. Thus, we assume that diagnostic attempts happen on
average twice as often for HIV-positive individuals than for HIV-negative individuals. At the
time of diagnosis, we assume that 85% of patients obtain treatment [24].
The sensitivity of TB detection with established methods can be estimated from case
detection rates in the recent WHO report [25]. For the Xpert MTB/RIF accuracy estimates have
been published in demonstration studies and a recent meta-analysis by Steingart et al. [22, 57,
12
178
179
180
181
182
183
184
185
186
187
188
189
190
191
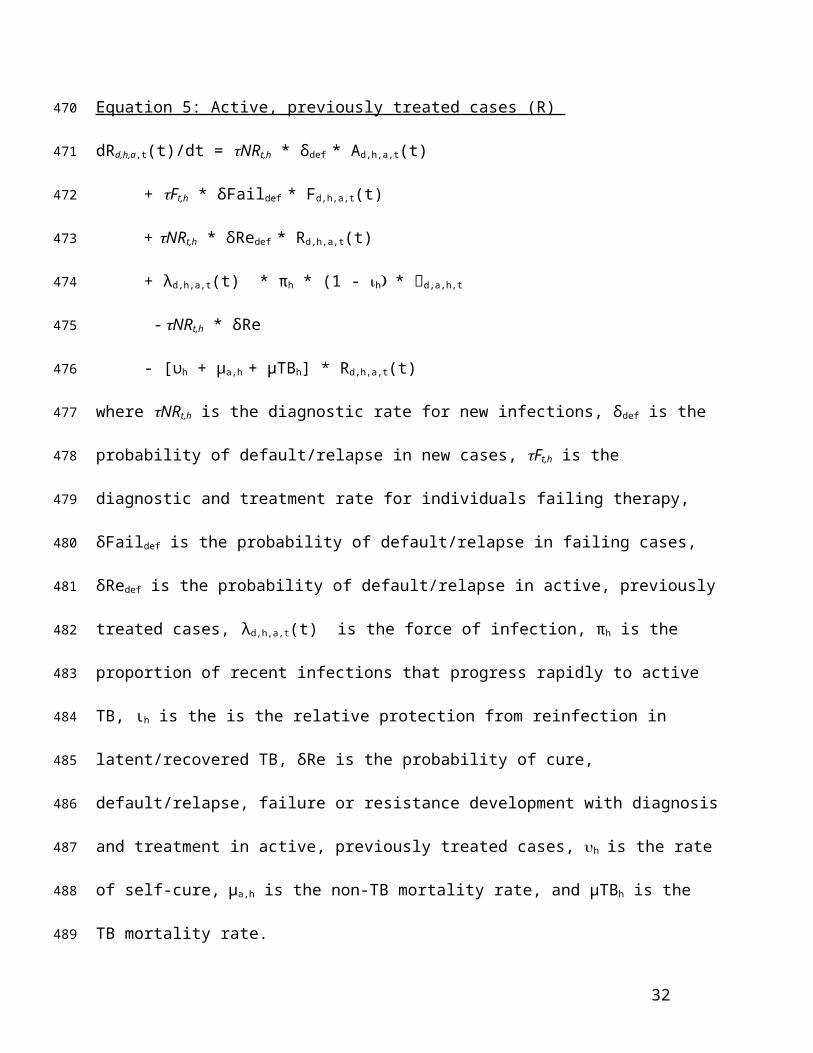
192
193
194
195
196
197
198
199
200

96]. The accuracy of molecular testing for rifampin for Xpert has also been well described in the
initial implementation studies [22, 57]. We also assumed that a novel highly deployable test is
most likely an antigen-based test, and would not, at least in its first iteration, contain the capacity
for drug susceptibility testing.
Treatment success estimates are taken from the most recent WHO Global TB control report
and other publications as outlined in the table.
We conducted uni-variate sensitivity analyses where one parameter is varied (across the
ranges specified in Table E4) and the others parameters held constant. Furthermore, to estimate
variability associated with simultaneous changes in all parameters, we also conducted a
probabilistic uncertainty analysis, using Latin Hypercube Sampling to select values randomly
from beta distributions (for parameters, e.g. probabilities, bounded from 0 to 1) or gamma
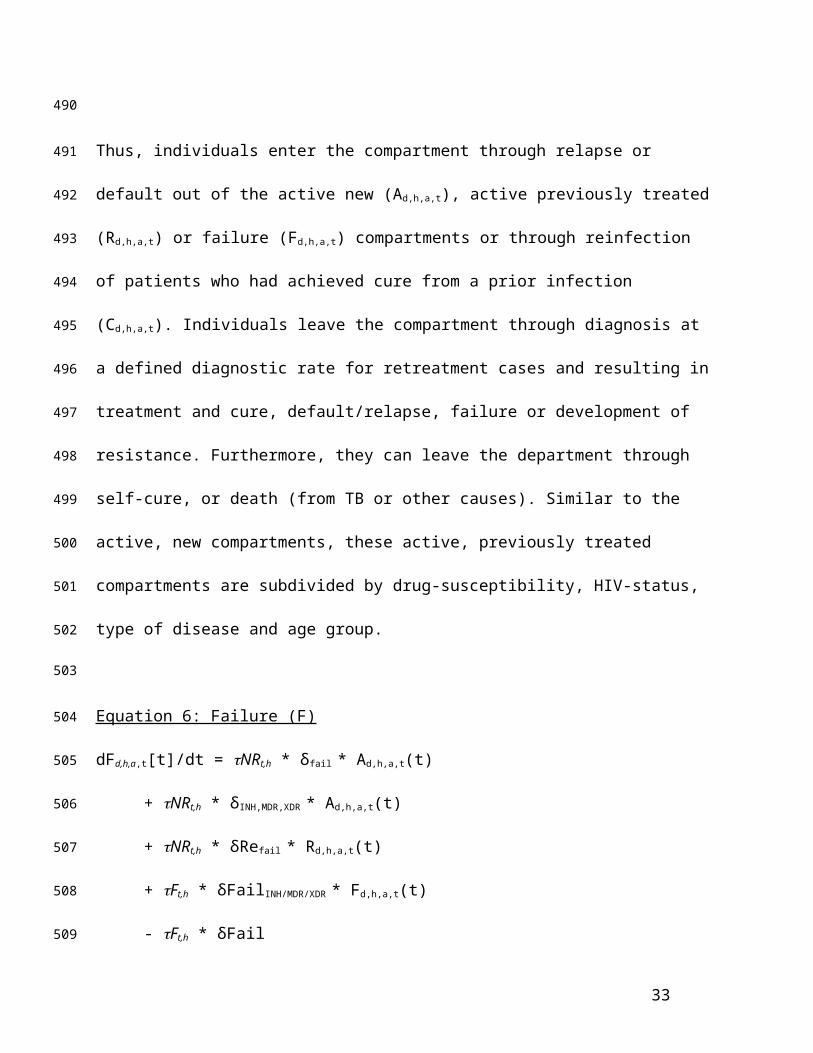
distributions (for parameters, e.g. rates, bounded from 0 to infinity) for each parameter across a
range of 25% unless otherwise indicated. Simulations that caused a two-fold increase or 50%
decrease in TB incidence over 10 years were rejected. We conducted more than 10,000
independent simulations in this fashion, thus generating 95% uncertainty ranges, defined as the
intervals bounded by the 2.5 and 97.5 percentiles of all acceptable simulations.
Table E4: Univariate sensitivity analysis – base-case value and range
Parameter Value Range
Non-TB death rate per year (life expectancy 60 years) in adults 0.022 0.017-0.028
TB mortality per year 0.15 0.11-0.19
TB mortality per year in HIV co-infected 0.5 0.4-0.6
13
201
202
203
204
205
206
207
208
209
210
211
212
213
214
215
216
217
218
219
220221
Attenuation of infectiousness by INH resistance mutation 0. 988 0.98-1.0
Attenuation of infectiousness by MDR resistance mutation 0.86 0.7-1.0
Attenuation of infectiousness by XDR resistance mutation 0.5 0.4-1.0
HIV incidence per year 0.001 0.0007-0.0013
Proportion that develops EPTB or PTB that cannot be diagnosed on sputum in HIV negative
Adults Children (weighted average among different age groups)
0.180.85
0.14-0.230.6-0.90
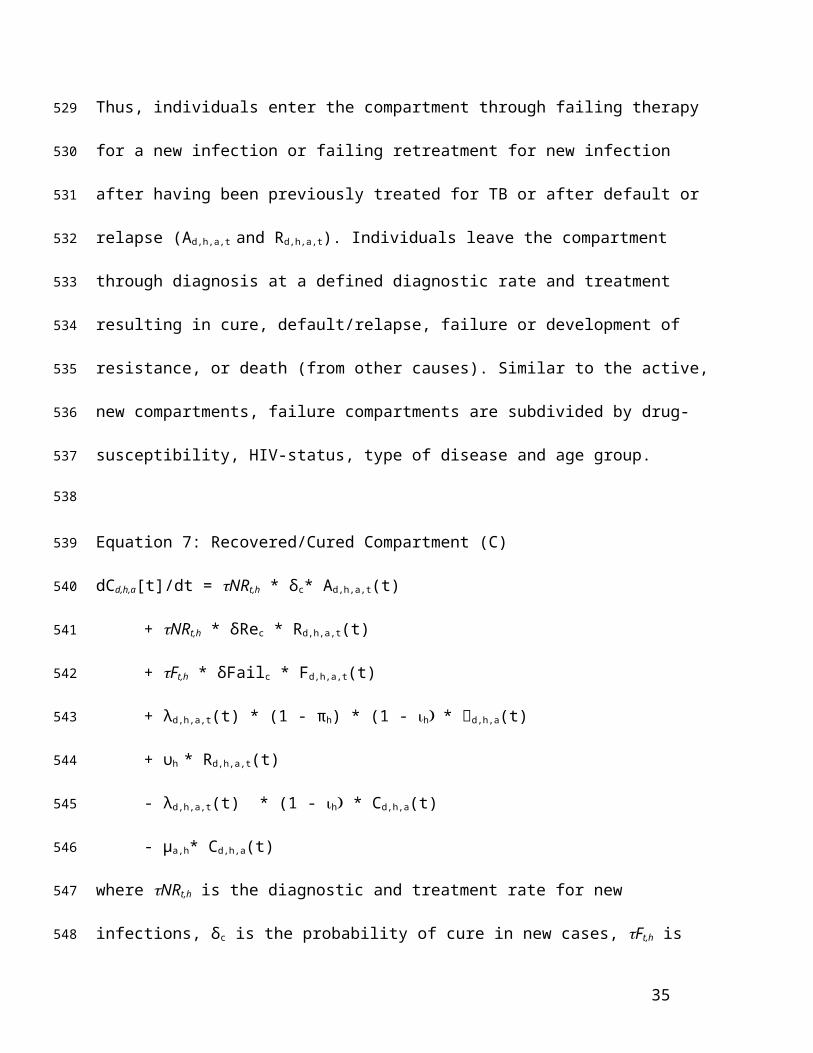
Relative protection from reinfection in latent/recovered TB in HIV negative
0.45 0.4-0.5
Relative protection from reinfection in latent/recovered TB in HIV positive
0 0-0.2
Proportion of TB infections progressing rapidly to active TB in HIV negative
0.14 0.05-0.14
Proportion of TB infections progressing rapidly to active TB in HIV positive
0.25 0.16-0.27
Endogenous reactivation rate per year in HIV negative 0.0005 0.08-1.4x10⁻³
Endogenous reactivation rate per year in HIV positive 0.05 0.03-0.06
Rate of self-cure in active TB per year in HIV negative 0.1 0.08-0.2
Rate of self-cure in active TB per year in HIV positive 0 0-0.2
Proportion of patients without access to diagnostics 0.1 0.05-0.25
Sensitivity of current diagnostic standard per diagnostic attempt for PTB
0.80 0.6-0.9
Sensitivity of current diagnostic standard per diagnostic attempt for extrapulmonary TB
0.60 0.4-0.8
Sensitivity of molecular methods per diagnostic attempt 0.95 0.8-0.98
Sensitivity of molecular methods for RIF resistance detecting 0.94 0.9-0.96
Sensitivity of molecular methods for INH resistance detecting katG (high-level resistance) and inhA (low-level resistance)
0.88 0.75-0.95
Sensitivity of molecular methods for resistance detecting fluoroquinolone and aminoglycoside resistance
0.84 0.6-0.90
Duration of illness before diagnostic attempt completed (months) for new and relapse cases
6 4-8
Duration of failing therapy before diagnostic attempt completed (months)
3 2-6
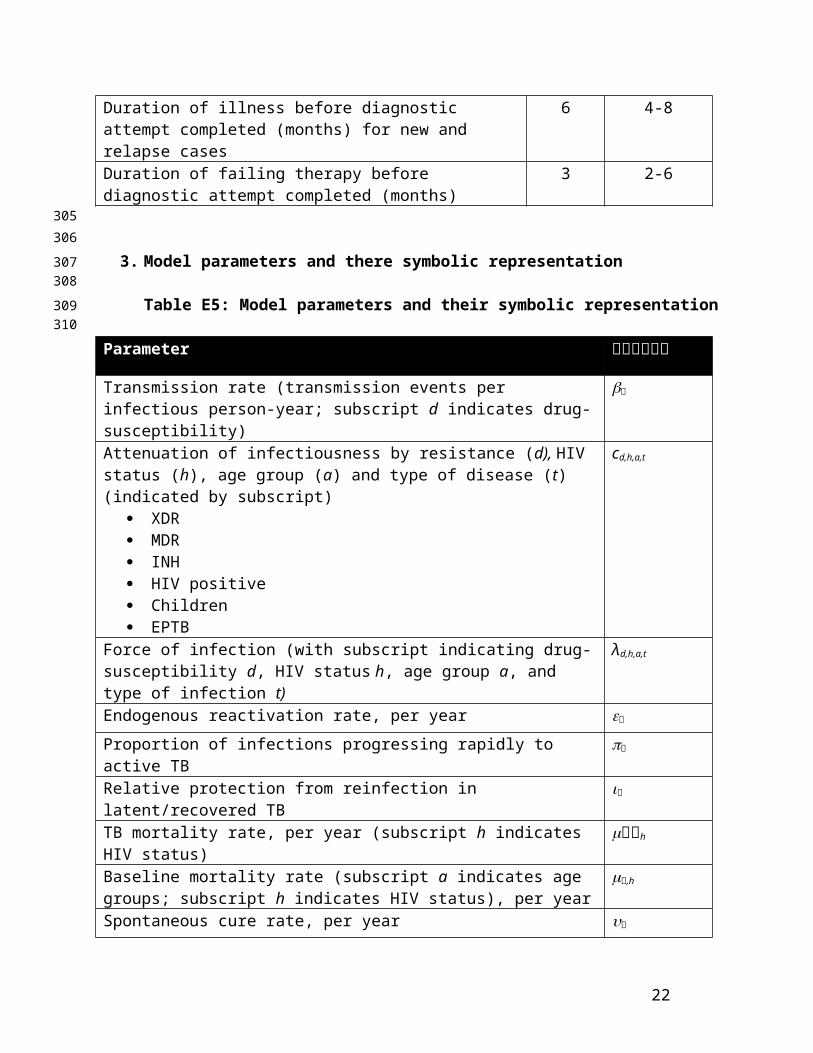
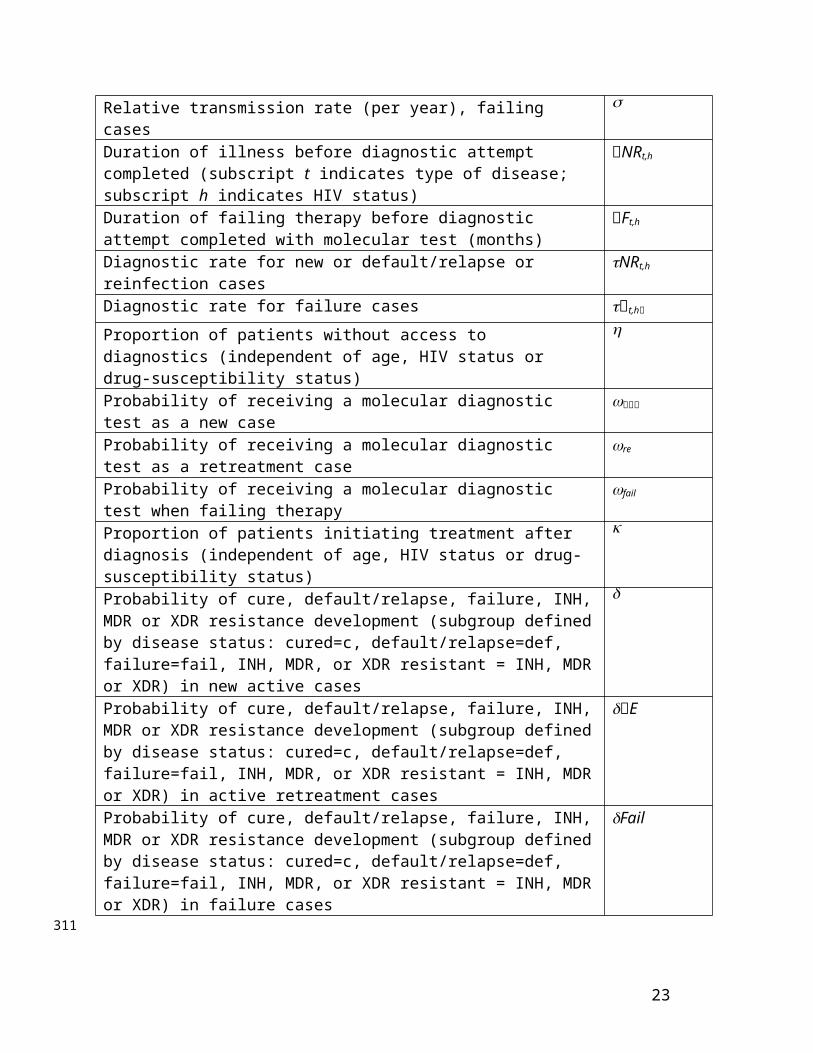
3. Model parameters and there symbolic representation
Table E5: Model parameters and their symbolic representation
14
222223
224225
226
Parameter
Transmission rate (transmission events per infectious person-year; subscript d indicates drug-susceptibility)
Attenuation of infectiousness by resistance (d), HIV status (h), age group (a) and type of disease (t) (indicated by subscript)
XDR MDR INH HIV positive Children EPTB
cd,h,a,t
Force of infection (with subscript indicating drug-susceptibility d, HIV status h, age group a, and type of infection t)
λd,h,a,t
Endogenous reactivation rate, per year
Proportion of infections progressing rapidly to active TB
Relative protection from reinfection in latent/recovered TB
TB mortality rate, per year (subscript h indicates HIV status) h
Baseline mortality rate (subscript a indicates age groups; subscript h indicates HIV status), per year
,h
Spontaneous cure rate, per year
Relative transmission rate (per year), failing cases
Duration of illness before diagnostic attempt completed (subscript t indicates type of disease; subscript h indicates HIV status)
NRt,h
Duration of failing therapy before diagnostic attempt completed with molecular test (months)
Ft,h
Diagnostic rate for new or default/relapse or reinfection cases NRt,h
Diagnostic rate for failure cases t,h
Proportion of patients without access to diagnostics (independent of age, HIV status or drug-susceptibility status)
Probability of receiving a molecular diagnostic test as a new case
Probability of receiving a molecular diagnostic test as a retreatment case re
Probability of receiving a molecular diagnostic test when failing therapy fail
Proportion of patients initiating treatment after diagnosis (independent of age, HIV status or drug-susceptibility status)
Probability of cure, default/relapse, failure, INH, MDR or XDR resistance development (subgroup defined by disease status: cured=c, default/relapse=def, failure=fail, INH, MDR, or XDR resistant = INH, MDR or XDR) in new active cases
15
227
Probability of cure, default/relapse, failure, INH, MDR or XDR resistance development (subgroup defined by disease status: cured=c, default/relapse=def, failure=fail, INH, MDR, or XDR resistant = INH, MDR or XDR) in active retreatment cases
E
Probability of cure, default/relapse, failure, INH, MDR or XDR resistance development (subgroup defined by disease status: cured=c, default/relapse=def, failure=fail, INH, MDR, or XDR resistant = INH, MDR or XDR) in failure cases
Fail
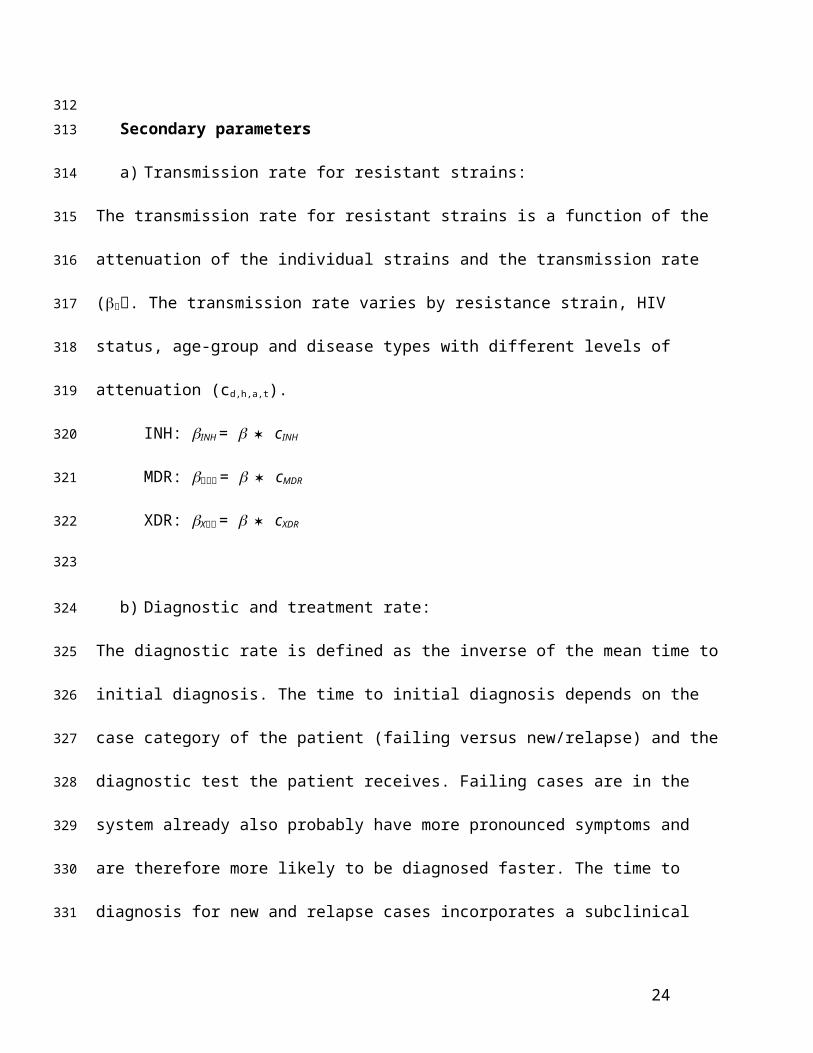
Secondary parameters
a) Transmission rate for resistant strains:
The transmission rate for resistant strains is a function of the attenuation of the individual strains
and the transmission rate (. The transmission rate varies by resistance strain, HIV status,
age-group and disease types with different levels of attenuation (cd,h,a,t).
INH: INH = cINH
MDR: = cMDR
XDR: X = cXDR
b) Diagnostic and treatment rate:
The diagnostic rate is defined as the inverse of the mean time to initial diagnosis. The time to
initial diagnosis depends on the case category of the patient (failing versus new/relapse) and the
diagnostic test the patient receives. Failing cases are in the system already also probably have
more pronounced symptoms and are therefore more likely to be diagnosed faster. The time to
diagnosis for new and relapse cases incorporates a subclinical period where the patient is
infectious but not seeking care yet. Once diagnosed only a proportion of patients ) actually
initiates treatment while others are lost to follow up (independent of age, HIV status or drug-
susceptibility status).
16
228229
230
231
232
233
234
235
236
237
238
239
240
241
242
243
244
245
246
247
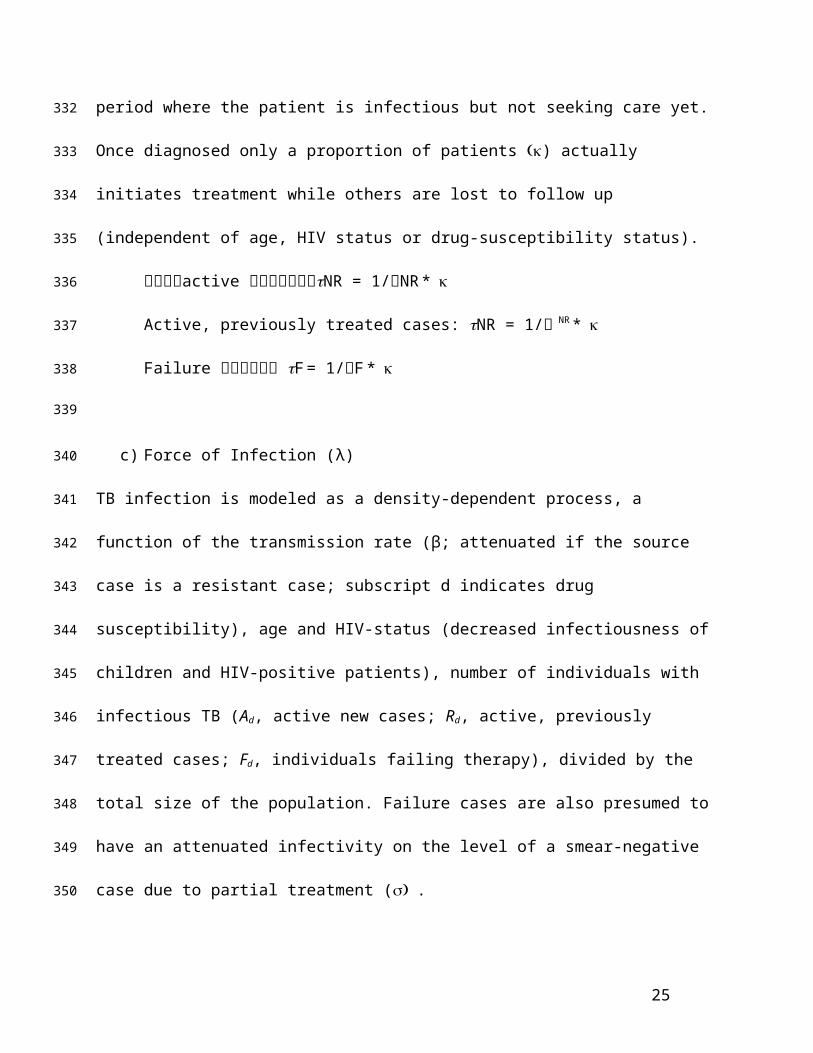
active NR = 1/NR *
Active, previously treated cases: NR = 1/ NR *
Failure F = 1/F *
c) Force of Infection (λ)
TB infection is modeled as a density-dependent process, a function of the transmission rate (β;
attenuated if the source case is a resistant case; subscript d indicates drug susceptibility), age and
HIV-status (decreased infectiousness of children and HIV-positive patients), number of
individuals with infectious TB (Ad, active new cases; Rd, active, previously treated cases; Fd,
individuals failing therapy), divided by the total size of the population. Failure cases are also
presumed to have an attenuated infectivity on the level of a smear-negative case due to partial
treatment (.
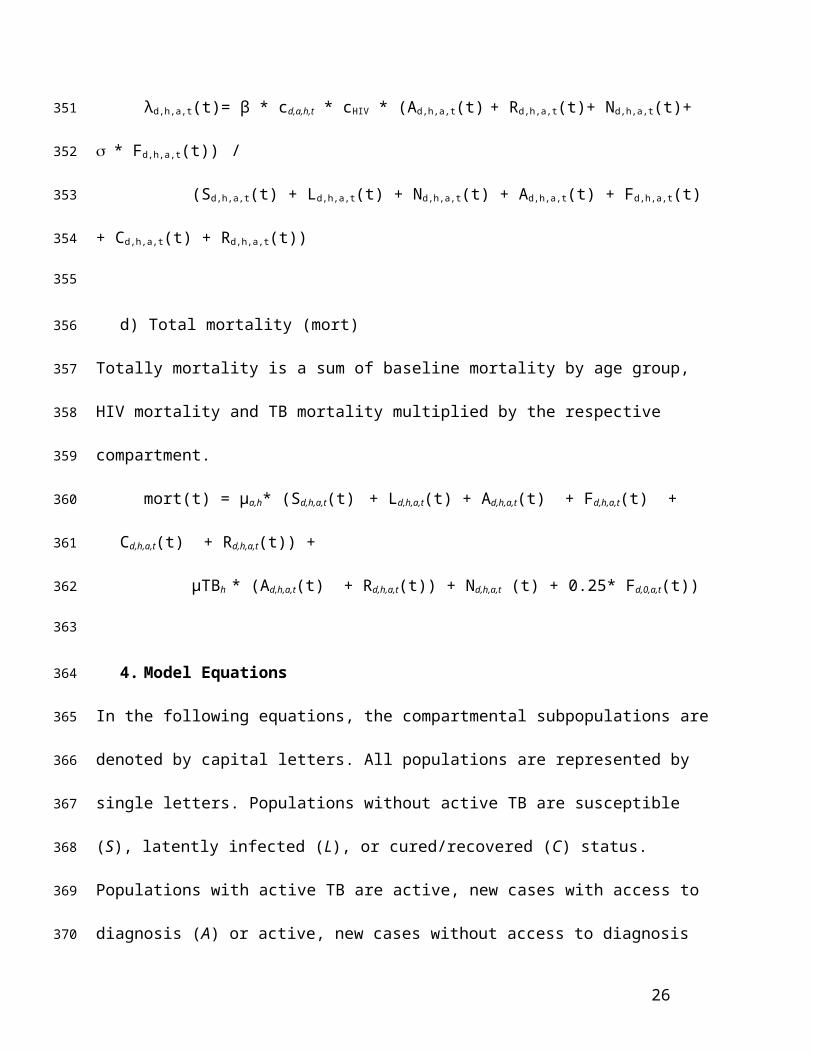
λd,h,a,t(t)= β * cd,a,h,t * cHIV * (Ad,h,a,t(t) + Rd,h,a,t(t)+ Nd,h,a,t(t)+ * Fd,h,a,t(t)) /
(Sd,h,a,t(t) + Ld,h,a,t(t) + Nd,h,a,t(t) + Ad,h,a,t(t) + Fd,h,a,t(t) + Cd,h,a,t(t) + Rd,h,a,t(t))
d) Total mortality (mort)
Totally mortality is a sum of baseline mortality by age group, HIV mortality and TB mortality
multiplied by the respective compartment.
mort(t) = μa,h* (Sd,h,a,t(t) + Ld,h,a,t(t) + Ad,h,a,t(t) + Fd,h,a,t(t) + Cd,h,a,t(t) + Rd,h,a,t(t)) +
μTBh * (Ad,h,a,t(t) + Rd,h,a,t(t)) + Nd,h,a,t (t) + 0.25* Fd,0,a,t(t))
4. Model Equations
17
248
249
250
251
252
253
254
255
256
257
258
259
260
261
262
263
264
265
266
267
268
269
In the following equations, the compartmental subpopulations are denoted by capital letters. All
populations are represented by single letters. Populations without active TB are susceptible (S),
latently infected (L), or cured/recovered (C) status. Populations with active TB are active, new
cases with access to diagnosis (A) or active, new cases without access to diagnosis (N) status,
failure cases (F) and active, previously treated cases (R). Subscript h refers to HIV status (0 =
uninfected, 1 = infected), d refers to drug susceptibility (sensitive =0, INH-monoresistant =1,
multidrug-resistant (MDR)=2, or, extensively-resistant (MDR)=3), a refers to age group (0 =
children, 1 = adults) and t refers to type of disease (0=PTB, 1=EPTB). Time-dependent
parameters are followed by (t). Rates of flow between compartments are governed by the system
of ordinary differential equations listed in equations 2-6. The model is programmed in Python,
and the source code for the model is available from the first author on request.
Equation 1. Susceptible Compartments (S)
dSh,a(t)/dt = mort(t) ‒ (λd,h,a,t(t) * Sh,a(t) + μa,h*Sh,a(t))
where mort(t) is the sum of all mortality, λd,h,a,t(t) is the force of infection for all different types of
TB (drug-susceptible, MDR, INH-resistant), μa is the non-TB mortality rate (dependent on a age
group), and μHIVh is the HIV-related mortality rate.
Thus, uninfected individuals leave this compartment through infection and death, and the
compartment is replenished at a rate that matches total mortality. These compartments are
subdivided only by HIV-status and age group.
Equation 2. Latently Infected Compartments (L)
18
270
271
272
273
274
275
276
277
278
279
280
281
282
283
284
285
286
287
288
289
290
291
292
dLd,h,a(t)/dt = [λd,h,a,t(t) * (1 ‒ πh) * Sh,a(t)
+ λd,h,a,t(t) * (1 ‒ πh) * (1 - h Ld,h,a(t)
+ hd,h,a,t(t) d,h,a,t (t)]
- λd,h,a,t(t) * (1 ‒ ιh) * Ld,h,a(t)
- [εh + μa,h] * Ld,h,a(t)
where λd,h,a,t(t) is the force of infection for all different types of TB and πh is the proportion of
recent infections that progress rapidly to active TB, ιh is the relative protection from reinfection
in latent/recovered TB, his the rate of self-cure, εh is the endogenous reactivation rate, and μa,h
is the non-TB mortality rate.
Thus, susceptible individuals who get newly infected or latently infected patients who get
infected with a different strain but do not progress rapidly to active disease, as well as patients
who self-cure make up these latent compartments. Latently-infected individuals leave these
compartment through TB reinfection with a different strain than the primary strain (with rapid
progression they go into respective active compartments; without rapid progression they go into
the respective latent compartments), endogenous reactivation, and death. These compartments
are subdivided by drug-susceptibility, HIV-status and age group.
Equation 3. Active TB Compartment (A)
dAd,h,a,t(t)/dt = λd,h,a,t(t) * πh * (1 – ) * Sh,a(t)
+ λd,h,a,t(t) * πh * (1 - h* (1 – ) Ld, h, a(t)
+ h* (1 – ) Ld,h,a,(t)
- NRt,h * δ * Ad,h,a,t(t)
19
293
294
295
296
297
298
299
300
301
302
303
304
305
306
307
308
309
310
311
312
313
314
315
- [υh + μa,h + μTBh] * Ad,h,a,t(t)
where λd,h,a,t(t) is the force of infection for all different forms of TB, πh is the proportion of recent
infections that progress rapidly to active TB, ιh is the is the relative protection from reinfection in
latent/recovered TB, is the proportion without access to diagnostics, εh is the endogenous
reactivation rate, NRt,h is the diagnostic rate for new infections, δ is the probability of cure (δ),
default/relapse(δdef), failure (δfail) or resistance development (δINH, δMDR) with diagnosis and
treatment in new cases, his the rate of self-cure,μa,h is the non-TB mortality rate, and μTBh is
the TB mortality rate.
Thus, susceptible individuals and latently infected individuals (those not protected through prior
infection) who progress rapidly into active infection, as well as those who reactivate constitute
the active diagnosed compartments. Individuals leave the compartment through diagnosis at a
defined diagnostic rate and treatment resulting in cure, default/relapse, failure or development of
resistance, spontaneous cure, or death (from TB or other causes). Active compartments are
subdivided by drug-susceptibility, HIV-status, type of disease and age group.
Equation 4. Never-diagnosed, active compartment (N)
dNd,h,a,t(t)/dt = λd,h,a,t(t) * πh * * Sh,a(t)
+ λd,h,a,t(t) * πh * (1 - h* Ld,a,h(t)
+ h* Ld,h,a,(t)
- [υh + μa,h + μTBh] * Nd,h,a,t(t)
where λd,h,a,t(t) is the force of infection for all different forms of TB, πh is the proportion of recent
infections that progress rapidly to active TB, ιh is the is the relative protection from reinfection in
20
316
317
318
319
320
321
322
323
324
325
326
327
328
329
330
331
332
333
334
335
336
337
338
latent/recovered TB, is the proportion without access to diagnostics, εh is the endogenous
reactivation rate, his the rate of self-cure,μa,h is the non-TB mortality rate, and μTBh is the TB
mortality rate.
Thus, susceptible individuals and latently infected individuals (those not protected through prior
infection) who progress rapidly into active infection as well as those who reactivate and never
get diagnosed due to lack of access to diagnostics constitute the active never-diagnosed
compartment. Individuals leave the compartment only through spontaneous cure, or death (from
TB or other causes). Similar to the active, diagnosed compartments, these active, never-
diagnosed compartments are subdivided by drug-susceptibility, HIV-status, type of disease and
age group.
Equation 5: Active, previously treated cases (R)
dRd,h,a,t(t)/dt = NRt,h * δdef * Ad,h,a,t(t)
+ Ft,h * δFaildef * Fd,h,a,t(t)
+ NRt,h * δRedef * Rd,h,a,t(t)
+ λd,h,a,t(t) * πh * (1 - h* d,a,h,t
- NRt,h * δRe
- [υh + μa,h + μTBh] * Rd,h,a,t(t)
where NRt,h is the diagnostic rate for new infections, δdef is the probability of default/relapse in
new cases, Ft,h is the diagnostic and treatment rate for individuals failing therapy, δFaildef is the
probability of default/relapse in failing cases, δRedef is the probability of default/relapse in active,
previously treated cases, λd,h,a,t(t) is the force of infection, πh is the proportion of recent infections
21
339
340
341
342
343
344
345
346
347
348
349
350
351
352
353
354
355
356
357
358
359
360
361
that progress rapidly to active TB, ιh is the is the relative protection from reinfection in
latent/recovered TB, δRe is the probability of cure, default/relapse, failure or resistance
development with diagnosis and treatment in active, previously treated cases, his the rate of
self-cure,μa,h is the non-TB mortality rate, and μTBh is the TB mortality rate.
Thus, individuals enter the compartment through relapse or default out of the active new (Ad,h,a,t),
active previously treated (Rd,h,a,t) or failure (Fd,h,a,t) compartments or through reinfection of
patients who had achieved cure from a prior infection (Cd,h,a,t). Individuals leave the compartment
through diagnosis at a defined diagnostic rate for retreatment cases and resulting in treatment and
cure, default/relapse, failure or development of resistance. Furthermore, they can leave the
department through self-cure, or death (from TB or other causes). Similar to the active, new
compartments, these active, previously treated compartments are subdivided by drug-
susceptibility, HIV-status, type of disease and age group.
Equation 6: Failure (F)
dFd,h,a,t[t]/dt = NRt,h * δfail * Ad,h,a,t(t)
+ NRt,h * δINH,MDR,XDR * Ad,h,a,t(t)
+ NRt,h * δRefail * Rd,h,a,t(t)
+ Ft,h * δFailINH/MDR/XDR * Fd,h,a,t(t)
- Ft,h * δFail
- [μa,h+ 0.25*μTBh] * Fd,h,a,t(t)
where NRt,h is the diagnostic and treatment rate for new infections, δfail and δRefail are the
probability of failure in active new and previously treated cases, δINH,MDR,XDR is the probability of
22
362
363
364
365
366
367
368
369
370
371
372
373
374
375
376
377
378
379
380
381
382
383
384
failure and development of resistance (INH monoresistance, MDR or XDR) with first line
therapy (either standard or based on drug-susceptibility testing) out of an active compartment,
δFailINH/MDR/XDR is the probability of failure and development of resistance (INH monoresistance,
MDR or XDR) with standard category II treatment or treatment guided by drug-susceptibility in
failing cases, which results in a change from one failure compartment into another (determined
by acquired drug-resistance). Ft,h is the diagnostic and treatment rate for individuals failing
therapy, δFail is the probability of cure, default/relapse, failure or resistance development with
diagnosis and treatment in failure cases, and μa,h is the non-TB mortality rate and μTBh is the TB
mortality rate (multiplied by 0.25 as failure cases are considered partially treated).
Thus, individuals enter the compartment through failing therapy for a new infection or failing
retreatment for new infection after having been previously treated for TB or after default or
relapse (Ad,h,a,t and Rd,h,a,t). Individuals leave the compartment through diagnosis at a defined
diagnostic rate and treatment resulting in cure, default/relapse, failure or development of
resistance, or death (from other causes). Similar to the active, new compartments, failure
compartments are subdivided by drug-susceptibility, HIV-status, type of disease and age group.
Equation 7: Recovered/Cured Compartment (C)
dCd,h,a[t]/dt = NRt,h * δc* Ad,h,a,t(t)
+ NRt,h * δRec * Rd,h,a,t(t)
+ Ft,h * δFailc * Fd,h,a,t(t)
+ λd,h,a,t(t) * (1 - πh) * (1 - h* d,h,a(t)
+ υh * Rd,h,a,t(t)
23
385
386
387
388
389
390
391
392
393
394
395
396
397
398
399
400
401
402
403
404
405
406
407
- λd,h,a,t(t) * (1 - h * Cd,h,a(t)
- μa,h* Cd,h,a(t)
where NRt,h is the diagnostic and treatment rate for new infections, δc is the probability of cure
in new cases, Ft,h is the diagnostic and treatment rate for individuals failing therapy, δFailc is the
probability of cure in failing cases, δRec is the probability of cure in active, previously treated
cases, λd,h,a,t(t) is the force of infection for all TB, πh is the proportion of recent infections that
progress rapidly to active TB, ιh is the relative protection from reinfection in latent/recovered TB,
his the rate of self-cure and μa,h is the non-TB mortality rate.
Thus, individuals enter the compartment through being cured out of the active new (Ad,h,a,t),
active, previously treated (Rd,h,a,t) or failure (Fd,h,a,t) compartments or through reinfection of
patients who had achieved cure from a prior infection (Cd) but do not progress to active disease.
Individuals leave the compartment through reinfection with TB or death (from TB or other
causes). Cured compartments are subdivided by drug-susceptibility, HIV-status, and age group.
5. Additional analyses
a) Economic Evaluation
We performed a cost-effectiveness analysis from the TB program perspective, calculating the
incremental cost-effectiveness ratio (ICER) of TB diagnosis and treatment, measured in U.S.
dollars (year 2012) per life year gained (YLG). The cost of diagnostic testing in India was taken
from an empiric study reported in the literature [18]. Treatment cost was abstracted from the
WHO financing report for India in 2012 (using US Dollars) [97]. Inflation to 2012 was
performed using the World Bank GDP deflator for US Dollars [98], and future costs and YLGs
24
408
409
410
411
412
413
414
415
416
417
418
419
420
421
422
423
424
425
426
427
428
429
430
were discounted at 3% annually. We assumed that all the cost of all novel tests was similar to
that of Xpert. In addition, we considered POC non-sputum NAAT at a price point of $8 per test.
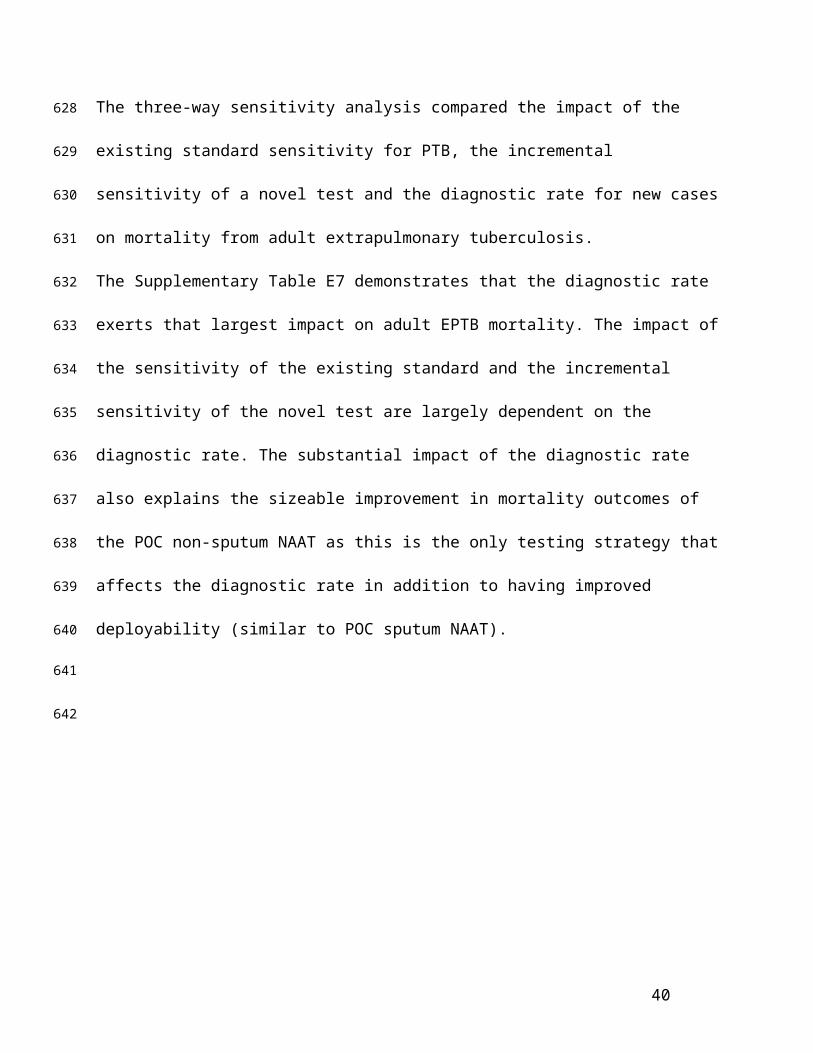
The projected incremental cost per YLG, relative to the existing standard of care, was similar for
Xpert and all optimized NAAT tests, ranging from $1400 to $2100 (Table 3). POC non-sputum
NAAT – which had the greatest impact on overall TB mortality despite not being able to
diagnose MDR-TB – was the most effective and cost-effective option, even assuming the same
cost for this test as for Xpert (Supplementary Table E6). MDR-TB treatment accounted for
about 40% of all incremental costs in the Xpert-based scenarios.
The cost estimates for all tests (except for POC non-sputum NAAT) are very similar. The
estimate for the cost of Xpert per life-year gained exceeds those projected by other studies, even
though we only project cost for TB care (not including cost conferred by HIV-treatment) [18,
99]. This is again explained by the lower incremental effectiveness of Xpert in our study as
compared to prior evaluations that assumed lower levels of empiric diagnosis [18, 22, 99]. The
cost per life-year gained in our study meets existing thresholds (e.g., cost per life-year gained
less than per-capita GDP) for cost-effective interventions in most Southeast Asian countries
[100]. But even independent of cost-effectiveness, tests targeting pediatric TB and EPTB would
likely have a substantial market potential given their impact on incidence and/or mortality,
coupled with the lack of good existing diagnostic options in these individuals. Thus, both cost-
effectiveness and market considerations may favor the development of such assays, even though
their direct effect on TB incidence will be limited.
25
431
432
433
434
435
436
437
438
439
440
441
442
443
444
445
446
447
448
449
450
451
452
453
b) Additional sensitivity analyses
Additional sensitivity analyses were performed to assess variables that have the most impact on
the results across different comparisons: diagnostic rate per year in new cases, sensitivity of
standard test as well as incremental sensitivity of novel test for PTB detection, proportion never
diagnosed and the proportion of patients who progress to primary disease immediately after
infection. The difference in the adult EPTB mortality was proportionally similar across the
different parameters in the different scenarios and the size of the difference depended on the
incremental effect of the individual scenario over the existing standard with the POC non-sputum
NAAT having the most substantial effect (Supplementary Figure E1 for the comparison of the
effect of NAAT EPTB with the existing standard on adult EPTB mortality).
c) Three-way sensitivity analysis
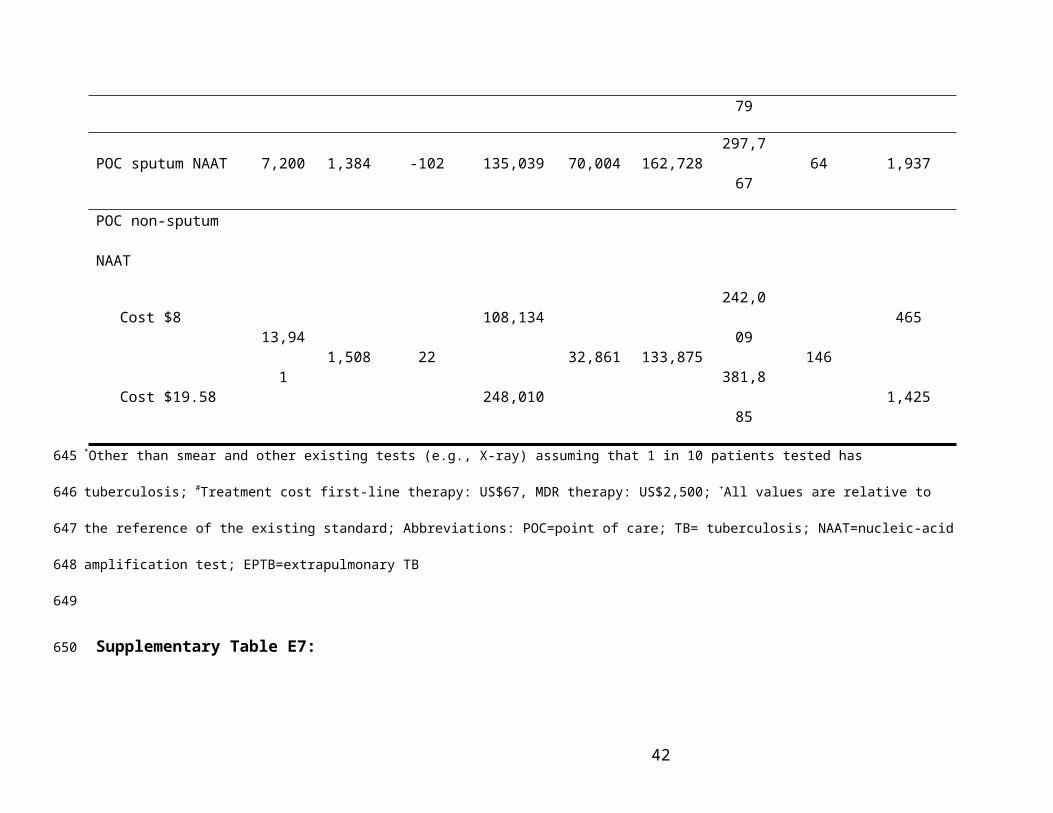
The three-way sensitivity analysis compared the impact of the existing standard sensitivity for
PTB, the incremental sensitivity of a novel test and the diagnostic rate for new cases on mortality
from adult extrapulmonary tuberculosis.
The Supplementary Table E7 demonstrates that the diagnostic rate exerts that largest impact on
adult EPTB mortality. The impact of the sensitivity of the existing standard and the incremental
sensitivity of the novel test are largely dependent on the diagnostic rate. The substantial impact
of the diagnostic rate also explains the sizeable improvement in mortality outcomes of the POC
non-sputum NAAT as this is the only testing strategy that affects the diagnostic rate in addition
to having improved deployability (similar to POC sputum NAAT).
26
454
455
456
457
458
459
460
461
462
463
464
465
466
467
468
469
470
471
472
473
474
475
476
Supplementary Table E6: Incremental cost per life-year gained
Incremental cost per life-year saved comparing the different test scenarios over 10 years.
Test scenario Total
number
of new
tests*
Total
number
treated
Difference
in number
treated
Diagnostic
cost (US$)
MDR
treatment
cost
(US$)
Total
treatment
cost
(US$)#
Total
cost
(US$)
Incremen-
tal life-
years
gained
Incremental
cost per life-
year gained
(ICER)+
Existing standard 0 1,486 Reference 20,507 54,196 153,758 174,265 Reference Reference
Xpert 2,276 1,448 -38 56,700 61,495 158,536 215,237 20 2,078
NAAT-Peds 2,748 1,452 -34 64,200 64,394 161,663 225,863 27 1,934
NAAT-EPTB 3,538 1,457 -29 76,769 68,559 166,211 242,979 35 1,968
POC sputum NAAT 7,200 1,384 -102 135,039 70,004 162,728 297,767 64 1,937
POC non-sputum NAAT
Cost $813,941 1,508 22
108,13432,861 133,875
242,009146
465
Cost $19.58 248,010 381,885 1,425
*Other than smear and other existing tests (e.g., X-ray) assuming that 1 in 10 patients tested has tuberculosis; #Treatment cost first-line therapy: US$67, MDR
therapy: US$2,500; +All values are relative to the reference of the existing standard; Abbreviations: POC=point of care; TB= tuberculosis; NAAT=nucleic-acid
amplification test; EPTB=extrapulmonary TB
27
477
478
479
480
481
482
Supplementary Table E7:
Three-way sensitivity analysis of the impact of the sensitivity of the existing standard for pulmonary TB (PTB), the incremental
sensitivity of a novel test and the diagnostic rate for new cases on adult EPTB mortality in the NAAT EPTB scenario. The table
demonstrates that the diagnostic rate exerts that largest impact on adult EPTB mortality.
Sensitivity novel test for PTB
Sens
itivi
ty e
xist
ing
stan
dard
for
PTB
0.6 0.8 0.95D
iagnostic-rate per year in new cases
0.6 30.2 23.8 20.3 1
0.8 - 19.8 17.3 1
0.6 9.7 8.1 7.3 2
0.8 - 7.2 6.7 2
0.6 5.9 5.2 4.9 3
0.8 - 4.8 4.6 3
28
483
484
485
486
487
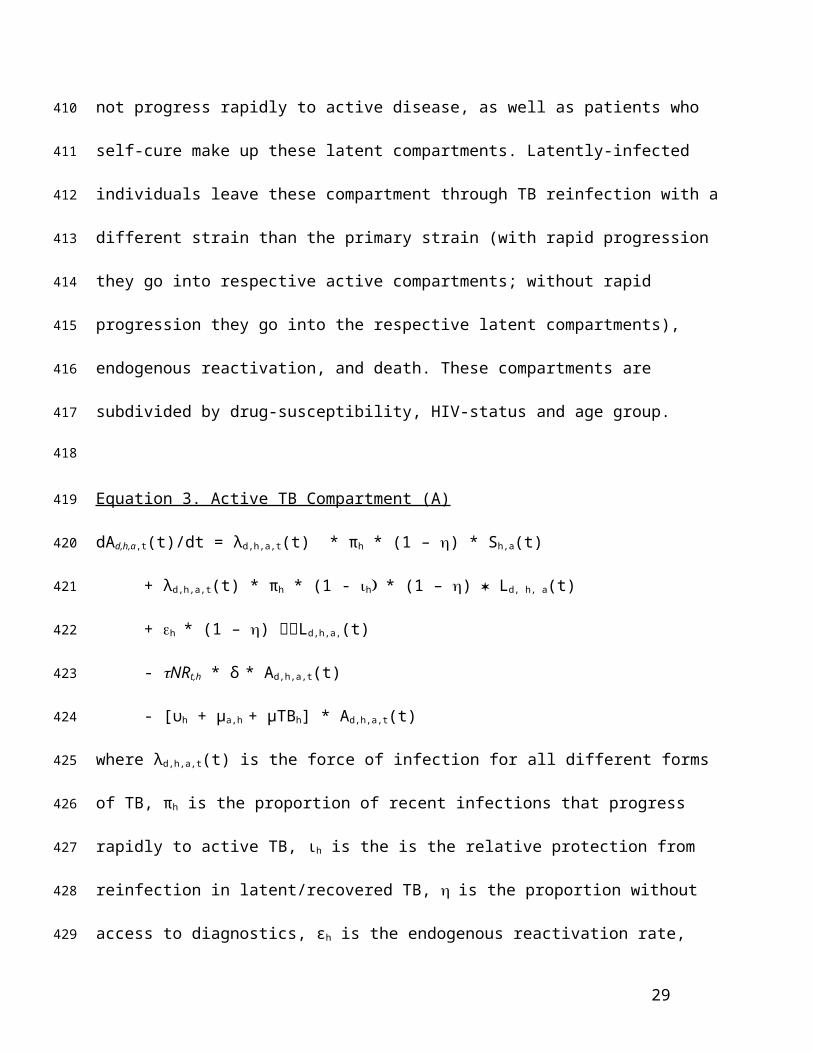
Figure Legends:
Supplementary Figure E1:
Absolute difference in extrapulmonary tuberculosis (EPTB) mortality in adults per 100,000 by
year 10 if NAAT-EPTB is compared to the existing standard (ES) varying one parameter at the
time (base-case: reduction of 0.6 in adult EPTB mortality comparing NAAT-EPTB with the
existing standard when all parameters are kept stable). The analysis shows that effect of NAAT
EPTB is primarily dependent on reducing transmission of pulmonary TB (PTB) and the
sensitivity of the test for existing standard for PTB in conjunction with the rate at which the test
is used.
29
488
489
490
491
492
493
494
495
496
References
1. Andrews JR, Noubary F, Walensky RP, Cerda R, Losina E, Horsburgh CR: Risk of
progression to active tuberculosis following reinfection with Mycobacterium
tuberculosis. Clin Infect Dis 2012, 54(6):784-791.
2. Vynnycky E, Fine PE: The natural history of tuberculosis: the implications of age-
dependent risks of disease and the role of reinfection. Epidemiol Infect 1997,
119(2):183-201.
3. Sutherland I, Svandova E, Radhakrishna S: The development of clinical tuberculosis
following infection with tubercle bacilli. 1. A theoretical model for the development
of clinical tuberculosis following infection, linking from data on the risk of
tuberculous infection and the incidence of clinical tuberculosis in the Netherlands.
Tubercle 1982, 63(4):255-268.
4. van Leth F, van der Werf MJ, Borgdorff MW: Prevalence of tuberculous infection and
incidence of tuberculosis: a re-assessment of the Styblo rule. Bull World Health
Organ 2008, 86(1):20-26.
5. Joint United Nations Programme on HIV/AIDS (UNAIDS): Global report: UNAIDS
report on the global AIDS epidemic 2012. In. Geneva; 2012.
6. Corbett EL, Charalambous S, Moloi VM, Fielding K, Grant AD, Dye C, De Cock KM,
Hayes RJ, Williams BG, Churchyard GJ: Human immunodeficiency virus and the
prevalence of undiagnosed tuberculosis in African gold miners. Am J Respir Crit
Care Med 2004, 170(6):673-679.
30
497
498
499
500
501
502
503
504
505
506
507
508
509
510
511
512
513
514
515
516
517
7. Antonucci G, Girardi E, Armignacco O, Salmaso S, Ippolito G: Tuberculosis in HIV-
infected subjects in Italy: a multicentre study. The Gruppo Italiano di Studio
Tubercolosi e AIDS. AIDS 1992, 6(9):1007-1013.
8. Gilks CF, Godfrey-Faussett P, Batchelor BI, Ojoo JC, Ojoo SJ, Brindle RJ, Paul J,
Kimari J, Bruce MC, Bwayo J et al: Recent transmission of tuberculosis in a cohort of
HIV-1-infected female sex workers in Nairobi, Kenya. AIDS 1997, 11(7):911-918.
9. Holmes CB, Wood R, Badri M, Zilber S, Wang B, Maartens G, Zheng H, Lu Z,
Freedberg KA, Losina E: CD4 decline and incidence of opportunistic infections in
Cape Town, South Africa: implications for prophylaxis and treatment. J Acquir
Immune Defic Syndr 2006, 42(4):464-469.
10. Harries AD, Hargreaves NJ, Graham SM, Mwansambo C, Kazembe P, Broadhead RL,
Maher D, Salaniponi FM: Childhood tuberculosis in Malawi: nationwide case-finding
and treatment outcomes. Int J Tuberc Lung Dis 2002, 6(5):424-431.
11. Hesseling AC, Cotton MF, Jennings T, Whitelaw A, Johnson LF, Eley B, Roux P,
Godfrey-Faussett P, Schaaf HS: High incidence of tuberculosis among HIV-infected
infants: evidence from a South African population-based study highlights the need
for improved tuberculosis control strategies. Clin Infect Dis 2009, 48(1):108-114.
12. Marais BJ, Gie RP, Schaaf HS, Hesseling AC, Obihara CC, Starke JJ, Enarson DA,
Donald PR, Beyers N: The natural history of childhood intra-thoracic tuberculosis: a
critical review of literature from the pre-chemotherapy era. Int J Tuberc Lung Dis
2004, 8(4):392-402.
31
518
519
520
521
522
523
524
525
526
527
528
529
530
531
532
533
534
535
536
537
538
13. Zar HJ, Hanslo D, Apolles P, Swingler G, Hussey G: Induced sputum versus gastric
lavage for microbiological confirmation of pulmonary tuberculosis in infants and
young children: a prospective study. Lancet 2005, 365(9454):130-134.
14. Chaisson RE, Schecter GF, Theuer CP, Rutherford GW, Echenberg DF, Hopewell PC:
Tuberculosis in patients with the acquired immunodeficiency syndrome. Clinical
features, response to therapy, and survival. Am Rev Respir Dis 1987, 136(3):570-574.
15. Jones BE, Young SM, Antoniskis D, Davidson PT, Kramer F, Barnes PF: Relationship
of the manifestations of tuberculosis to CD4 cell counts in patients with human
immunodeficiency virus infection. Am Rev Respir Dis 1993, 148(5):1292-1297.
16. Peter JG, Theron G, Singh N, Singh A, Dheda K: Sputum induction to aid diagnosis of
smear-negative or sputum-scarce tuberculosis in adults in HIV-endemic settings.
Eur Respir J 2014, 43(1):185-194.
17. Keeler E, Perkins MD, Small P, Hanson C, Reed S, Cunningham J, Aledort JE, Hillborne
L, Rafael ME, Girosi F et al: Reducing the global burden of tuberculosis: the
contribution of improved diagnostics. Nature 2006, 444 Suppl 1:49-57.
18. Vassall A, van Kampen S, Sohn H, Michael JS, John KR, den Boon S, Davis JL,
Whitelaw A, Nicol MP, Gler MT et al: Rapid diagnosis of tuberculosis with the Xpert
MTB/RIF assay in high burden countries: a cost-effectiveness analysis. PLoS Med
2011, 8(11):e1001120.
19. Kapoor SK, Raman AV, Sachdeva KS, Satyanarayana S: How did the TB patients
reach DOTS services in Delhi? A study of patient treatment seeking behavior. PLoS
One 2012, 7(8):e42458.
32
539
540
541
542
543
544
545
546
547
548
549
550
551
552
553
554
555
556
557
558
559
560
20. Storla DG, Yimer S, Bjune GA: A systematic review of delay in the diagnosis and
treatment of tuberculosis. BMC Public Health 2008, 8:15.
21. Corbett EL, Watt CJ, Walker N, Maher D, Williams BG, Raviglione MC, Dye C: The
growing burden of tuberculosis: global trends and interactions with the HIV
epidemic. Arch Intern Med 2003, 163(9):1009-1021.
22. Boehme CC, Nicol MP, Nabeta P, Michael JS, Gotuzzo E, Tahirli R, Gler MT,
Blakemore R, Worodria W, Gray C et al: Feasibility, diagnostic accuracy, and
effectiveness of decentralised use of the Xpert MTB/RIF test for diagnosis of
tuberculosis and multidrug resistance: a multicentre implementation study. Lancet
2011, 377(9776):1495-1505.
23. Leutscher P, Madsen G, Erlandsen M, Veirum J, Ladefoged K, Thomsen V, Wejse C,
Hilberg O: Demographic and clinical characteristics in relation to patient and health
system delays in a tuberculosis low-incidence country. Scand J Infect Dis 2012,
44(1):29-36.
24. Claassens MM, du Toit E, Dunbar R, Lombard C, Enarson DA, Beyers N, Borgdorff
MW: Tuberculosis patients in primary care do not start treatment. What role do
health system delays play? Int J Tuberc Lung Dis 2013, 17(5):603-607.
25. World Health Organization: Global tuberculosis report 2012. In. Geneva 2012: 1-282.
26. Behr MA, Warren SA, Salamon H, Hopewell PC, Ponce de Leon A, Daley CL, Small
PM: Transmission of Mycobacterium tuberculosis from patients smear-negative for
acid-fast bacilli. Lancet 1999, 353(9151):444-449.
27. Fennelly KP, Jones-Lopez EC, Ayakaka I, Kim S, Menyha H, Kirenga B, Muchwa C,
Joloba M, Dryden-Peterson S, Reilly N et al: Variability of infectious aerosols
33
561
562
563
564
565
566
567
568
569
570
571
572
573
574
575
576
577
578
579
580
581
582
583

produced during coughing by patients with pulmonary tuberculosis. Am J Respir
Crit Care Med 2012, 186(5):450-457.
28. HIV/AIDS in India [http://www.worldbank.org/en/news/feature/2012/07/10/hiv-aids-
india]
29. Pym AS, Saint-Joanis B, Cole ST: Effect of katG mutations on the virulence of
Mycobacterium tuberculosis and the implication for transmission in humans. Infect
Immun 2002, 70(9):4955-4960.
30. van Soolingen D, de Haas PE, van Doorn HR, Kuijper E, Rinder H, Borgdorff MW:
Mutations at amino acid position 315 of the katG gene are associated with high-level
resistance to isoniazid, other drug resistance, and successful transmission of
Mycobacterium tuberculosis in the Netherlands. J Infect Dis 2000, 182(6):1788-1790.
31. Cohen T, Murray M: Modeling epidemics of multidrug-resistant M. tuberculosis of
heterogeneous fitness. Nat Med 2004, 10(10):1117-1121.
32. Billington OJ, McHugh TD, Gillespie SH: Physiological cost of rifampin resistance
induced in vitro in Mycobacterium tuberculosis. Antimicrobial agents and
chemotherapy 1999, 43(8):1866-1869.
33. Gagneux S, Long CD, Small PM, Van T, Schoolnik GK, Bohannan BJ: The competitive
cost of antibiotic resistance in Mycobacterium tuberculosis. Science 2006,
312(5782):1944-1946.
34. Hanrahan CF, Theron G, Bassett J, Dheda K, Scott L, Stevens W, Sanne I, Van Rie A:
Xpert MTB/RIF as a measure of sputum bacillary burden. Variation by HIV status
and immunosuppression. Am J Respir Crit Care Med 2014, 189(11):1426-1434.
34
584
585
586
587
588
589
590
591
592
593
594
595
596
597
598
599
600
601
602
603
604
605
35. Tostmann A, Kik SV, Kalisvaart NA, Sebek MM, Verver S, Boeree MJ, van Soolingen
D: Tuberculosis transmission by patients with smear-negative pulmonary
tuberculosis in a large cohort in the Netherlands. Clin Infect Dis 2008, 47(9):1135-
1142.
36. Espinal MA, Perez EN, Baez J, Henriquez L, Fernandez K, Lopez M, Olivo P, Reingold
AL: Infectiousness of Mycobacterium tuberculosis in HIV-1-infected patients with
tuberculosis: a prospective study. Lancet 2000, 355(9200):275-280.
37. Marais BJ, Gie RP, Schaaf HS, Hesseling AC, Obihara CC, Nelson LJ, Enarson DA,
Donald PR, Beyers N: The clinical epidemiology of childhood pulmonary
tuberculosis: a critical review of literature from the pre-chemotherapy era. Int J
Tuberc Lung Dis 2004, 8(3):278-285.
38. Peto HM, Pratt RH, Harrington TA, LoBue PA, Armstrong LR: Epidemiology of
extrapulmonary tuberculosis in the United States, 1993-2006. Clin Infect Dis 2009,
49(9):1350-1357.
39. Marais BJ, Gie RP, Schaaf HS, Beyers N, Donald PR, Starke JR: Childhood pulmonary
tuberculosis: old wisdom and new challenges. Am J Respir Crit Care Med 2006,
173(10):1078-1090.
40. Ferebee SH: Controlled chemoprophylaxis trials in tuberculosis. A general review.
Bibliotheca tuberculosea 1970, 26:28-106.
41. Grzybowski S, Enarson D: [Results in pulmonary tuberculosis patients under various
treatment program conditions]. Bulletin of the International Union against
Tuberculosis 1978, 53(2):70-75.
35
606
607
608
609
610
611
612
613
614
615
616
617
618
619
620
621
622
623
624
625
626
627
42. Dye C, Garnett GP, Sleeman K, Williams BG: Prospects for worldwide tuberculosis
control under the WHO DOTS strategy. Directly observed short-course therapy.
Lancet 1998, 352(9144):1886-1891.
43. Wong EB, Omar T, Setlhako GJ, Osih R, Feldman C, Murdoch DM, Martinson NA,
Bangsberg DR, Venter WD: Causes of death on antiretroviral therapy: a post-
mortem study from South Africa. PLoS One 2012, 7(10):e47542.
44. Etard JF, Ndiaye I, Thierry-Mieg M, Gueye NF, Gueye PM, Laniece I, Dieng AB, Diouf
A, Laurent C, Mboup S et al: Mortality and causes of death in adults receiving highly
active antiretroviral therapy in Senegal: a 7-year cohort study. AIDS 2006,
20(8):1181-1189.
45. Davis JL, Cattamanchi A, Cuevas LE, Hopewell PC, Steingart KR: Diagnostic accuracy
of same-day microscopy versus standard microscopy for pulmonary tuberculosis: a
systematic review and meta-analysis. Lancet Infect Dis 2013, 13(2):147-154.
46. Mase SR, Ramsay A, Ng V, Henry M, Hopewell PC, Cunningham J, Urbanczik R,
Perkins MD, Aziz MA, Pai M: Yield of serial sputum specimen examinations in the
diagnosis of pulmonary tuberculosis: a systematic review. Int J Tuberc Lung Dis
2007, 11(5):485-495.
47. Geng E, Kreiswirth B, Burzynski J, Schluger NW: Clinical and radiographic correlates
of primary and reactivation tuberculosis: a molecular epidemiology study. JAMA
2005, 293(22):2740-2745.
48. Dinnes J, Deeks J, Kunst H, Gibson A, Cummins E, Waugh N, Drobniewski F, Lalvani
A: A systematic review of rapid diagnostic tests for the detection of tuberculosis
infection. Health Technol Assess 2007, 11(3):1-314.
36
628
629
630
631
632
633
634
635
636
637
638
639
640
641
642
643
644
645
646
647
648
649
650
49. Kennedy DH, Fallon RJ: Tuberculous meningitis. JAMA 1979, 241(3):264-268.
50. Lau SK, Wei WI, Hsu C, Engzell UC: Efficacy of fine needle aspiration cytology in the
diagnosis of tuberculous cervical lymphadenopathy. The Journal of laryngology and
otology 1990, 104(1):24-27.
51. Marais S, Thwaites G, Schoeman JF, Torok ME, Misra UK, Prasad K, Donald PR,
Wilkinson RJ, Marais BJ: Tuberculous meningitis: a uniform case definition for use
in clinical research. Lancet Infect Dis 2010, 10(11):803-812.
52. Steingart KR, Sohn H, Schiller I, Kloda LA, Boehme CC, Pai M, Dendukuri N: Xpert(R)
MTB/RIF assay for pulmonary tuberculosis and rifampicin resistance in adults.
Cochrane Database Syst Rev 2013, 1:CD009593.
53. Friedrich SO, von Groote-Bidlingmaier F, Diacon AH: Xpert MTB/RIF assay for
diagnosis of pleural tuberculosis. J Clin Microbiol 2011, 49(12):4341-4342.
54. Hillemann D, Ruesch-Gerdes S, Boehme C, Richter E: Rapid Molecular Detection of
Extrapulmonary Tuberculosis by the Automated GeneXpert MTB/RIF System. J
Clin Microbiol 2011, 49(4):1202-1205.
55. Moure R, Martin R, Alcaide F: Effectiveness of an integrated real-time PCR method
for detection of the Mycobacterium tuberculosis complex in smear-negative
extrapulmonary samples in an area of low tuberculosis prevalence. J Clin Microbiol
2012, 50(2):513-515.
56. Tortoli E, Russo C, Piersimoni C, Mazzola E, Dal Monte P, Pascarella M, Borroni E,
Mondo A, Piana F, Scarparo C et al: Clinical validation of Xpert MTB/RIF for the
diagnosis of extrapulmonary tuberculosis. Eur Respir J 2012, 40(2):442-447.
37
651
652
653
654
655
656
657
658
659
660
661
662
663
664
665
666
667
668
669
670
671
672
57. Chang K, Lu W, Wang J, Zhang K, Jia S, Li F, Deng S, Chen M: Rapid and effective
diagnosis of tuberculosis and rifampicin resistance with Xpert MTB/RIF assay: A
meta-analysis. J Infect 2012, 64(6):580-588.
58. Ling DI, Zwerling AA, Pai M: GenoType MTBDR assays for the diagnosis of
multidrug-resistant tuberculosis: a meta-analysis. Eur Respir J 2008, 32(5):1165-
1174.
59. Feng Y, Liu S, Wang Q, Wang L, Tang S, Wang J, Lu W: Rapid Diagnosis of Drug
Resistance to Fluoroquinolones, Amikacin, Capreomycin, Kanamycin and
Ethambutol Using Genotype MTBDRsl Assay: A Meta-Analysis. PLoS One 2013,
8(2):e55292.
60. Hillemann D, Rusch-Gerdes S, Richter E: Feasibility of the GenoType MTBDRsl assay
for fluoroquinolone, amikacin-capreomycin, and ethambutol resistance testing of
Mycobacterium tuberculosis strains and clinical specimens. J Clin Microbiol 2009,
47(6):1767-1772.
61. Said HM, Kock MM, Ismail NA, Baba K, Omar SV, Osman AG, Hoosen AA, Ehlers
MM: Evaluation of the GenoType(R) MTBDRsl assay for susceptibility testing of
second-line anti-tuberculosis drugs. Int J Tuberc Lung Dis 2012, 16(1):104-109.
62. Botha E, Den Boon S, Verver S, Dunbar R, Lawrence KA, Bosman M, Enarson DA,
Toms I, Beyers N: Initial default from tuberculosis treatment: how often does it
happen and what are the reasons? Int J Tuberc Lung Dis 2008, 12(7):820-823.
63. Khan MS, Khan S, Godfrey-Faussett P: Default during TB diagnosis: quantifying the
problem. Trop Med Int Health 2009, 14(12):1437-1441.
38
673
674
675
676
677
678
679
680
681
682
683
684
685
686
687
688
689
690
691
692
693
694
64. [No author listed]: A controlled trial of 6 months' chemotherapy in pulmonary
tuberculosis. Final report: results during the 36 months after the end of
chemotherapy and beyond. British Thoracic Society. British journal of diseases of the
chest 1984, 78(4):330-336.
65. Lew W, Pai M, Oxlade O, Martin D, Menzies D: Initial drug resistance and
tuberculosis treatment outcomes: systematic review and meta-analysis. Ann Intern
Med 2008, 149(2):123-134.
66. Menzies D, Benedetti A, Paydar A, Martin I, Royce S, Pai M, Vernon A, Lienhardt C,
Burman W: Effect of duration and intermittency of rifampin on tuberculosis
treatment outcomes: a systematic review and meta-analysis. PLoS Med 2009,
6(9):e1000146.
67. Espinal MA, Kim SJ, Suarez PG, Kam KM, Khomenko AG, Migliori GB, Baez J, Kochi
A, Dye C, Raviglione MC: Standard short-course chemotherapy for drug-resistant
tuberculosis: treatment outcomes in 6 countries. JAMA 2000, 283(19):2537-2545.
68. Seung KJ, Gelmanova IE, Peremitin GG, Golubchikova VT, Pavlova VE, Sirotkina OB,
Yanova GV, Strelis AK: The effect of initial drug resistance on treatment response
and acquired drug resistance during standardized short-course chemotherapy for
tuberculosis. Clin Infect Dis 2004, 39(9):1321-1328.
69. Primary multidrug-resistant tuberculosis--Ivanovo Oblast, Russia, 1999. MMWR
Morb Mortal Wkly Rep 1999, 48(30):661-664.
70. Menzies D, Benedetti A, Paydar A, Royce S, Madhukar P, Burman W, Vernon A,
Lienhardt C: Standardized treatment of active tuberculosis in patients with previous
39
695
696
697
698
699
700
701
702
703
704
705
706
707
708
709
710
711
712
713
714
715
716
treatment and/or with mono-resistance to isoniazid: a systematic review and meta-
analysis. PLoS Med 2009, 6(9):e1000150.
71. Hong Kong Chest-British Medical Research Council: Controlled trial of four twice-
weekly regimens and a daily regimen all given for 6 months for pulmonary
tuberculosis. Lancet 1981(317):171–174.
72. Migliori GB, Espinal M, Danilova ID, Punga VV, Grzemska M, Raviglione MC:
Frequency of recurrence among MDR-tB cases 'successfully' treated with
standardised short-course chemotherapy. Int J Tuberc Lung Dis 2002, 6(10):858-864.
73. Jones-Lopez EC, Ayakaka I, Levin J, Reilly N, Mumbowa F, Dryden-Peterson S,
Nyakoojo G, Fennelly K, Temple B, Nakubulwa S et al: Effectiveness of the standard
WHO recommended retreatment regimen (category II) for tuberculosis in
Kampala, Uganda: a prospective cohort study. PLoS Med 2011, 8(3):e1000427.
74. Jacobson KR, Theron D, Victor TC, Streicher EM, Warren RM, Murray MB: Treatment
outcomes of isoniazid-resistant tuberculosis patients, Western Cape Province, South
Africa. Clin Infect Dis 2011, 53(4):369-372.
75. Bang D, Andersen PH, Andersen AB, Thomsen VO: Isoniazid-resistant tuberculosis in
Denmark: mutations, transmission and treatment outcome. J Infect 2010, 60(6):452-
457.
76. Cattamanchi A, Dantes RB, Metcalfe JZ, Jarlsberg LG, Grinsdale J, Kawamura LM,
Osmond D, Hopewell PC, Nahid P: Clinical characteristics and treatment outcomes of
patients with isoniazid-monoresistant tuberculosis. Clin Infect Dis 2009, 48(2):179-
185.
40
717
718
719
720
721
722
723
724
725
726
727
728
729
730
731
732
733
734
735
736
737
738
77. Sonnenberg P, Murray J, Shearer S, Glynn JR, Kambashi B, Godfrey-Faussett P:
Tuberculosis treatment failure and drug resistance--same strain or reinfection?
Trans R Soc Trop Med Hyg 2000, 94(6):603-607.
78. Tahaoglu K, Torun T, Sevim T, Atac G, Kir A, Karasulu L, Ozmen I, Kapakli N: The
treatment of multidrug-resistant tuberculosis in Turkey. N Engl J Med 2001,
345(3):170-174.
79. Yew WW, Chan CK, Chau CH, Tam CM, Leung CC, Wong PC, Lee J: Outcomes of
patients with multidrug-resistant pulmonary tuberculosis treated with
ofloxacin/levofloxacin-containing regimens. Chest 2000, 117(3):744-751.
80. Mitnick C, Bayona J, Palacios E, Shin S, Furin J, Alcantara F, Sanchez E, Sarria M,
Becerra M, Fawzi MC et al: Community-based therapy for multidrug-resistant
tuberculosis in Lima, Peru. N Engl J Med 2003, 348(2):119-128.
81. Orenstein EW, Basu S, Shah NS, Andrews JR, Friedland GH, Moll AP, Gandhi NR,
Galvani AP: Treatment outcomes among patients with multidrug-resistant
tuberculosis: systematic review and meta-analysis. Lancet Infect Dis 2009, 9(3):153-
161.
82. Cavanaugh JS, Kazennyy BY, Nguyen ML, Kiryanova EV, Vitek E, Khorosheva TM,
Nemtsova E, Cegielski JP: Outcomes and follow-up of patients treated for multidrug-
resistant tuberculosis in Orel, Russia, 2002-2005. Int J Tuberc Lung Dis 2012,
16(8):1069-1074.
83. Lee J, Lim HJ, Cho YJ, Park YS, Lee SM, Yang SC, Yoo CG, Kim YW, Han SK, Yim
JJ: Recurrence after successful treatment among patients with multidrug-resistant
tuberculosis. Int J Tuberc Lung Dis 2011, 15(10):1331-1333.
41
739
740
741
742
743
744
745
746
747
748
749
750
751
752
753
754
755
756
757
758
759
760
761
84. Franke MF, Appleton SC, Mitnick CD, Furin JJ, Bayona J, Chalco K, Shin S, Murray M,
Becerra MC: Aggressive Regimens for Multidrug-Resistant Tuberculosis Reduce
Recurrence. Clin Infect Dis 2013.
85. Ershova JV, Kurbatova EV, Moonan PK, Cegielski JP: Acquired resistance to second-
line drugs among persons with tuberculosis in the United States. Clin Infect Dis 2012,
55(12):1600-1607.
86. Jacobson KR, Tierney DB, Jeon CY, Mitnick CD, Murray MB: Treatment outcomes
among patients with extensively drug-resistant tuberculosis: systematic review and
meta-analysis. Clin Infect Dis 2010, 51(1):6-14.
87. Jeon CY, Hwang SH, Min JH, Prevots DR, Goldfeder LC, Lee H, Eum SY, Jeon DS,
Kang HS, Kim JH et al: Extensively drug-resistant tuberculosis in South Korea: risk
factors and treatment outcomes among patients at a tertiary referral hospital. Clin
Infect Dis 2008, 46(1):42-49.
88. Kwon YS, Kim YH, Suh GY, Chung MP, Kim H, Kwon OJ, Choi YS, Kim K, Kim J,
Shim YM et al: Treatment outcomes for HIV-uninfected patients with multidrug-
resistant and extensively drug-resistant tuberculosis. Clin Infect Dis 2008, 47(4):496-
502.
89. Falzon D, Gandhi N, Migliori GB, Sotgiu G, Cox H, Holtz TH, Hollm-Delgado MG,
Keshavjee S, Deriemer K, Centis R et al: Resistance to fluoroquinolones and second-
line injectable drugs: impact on MDR-TB outcomes. Eur Respir J 2012.
90. Heym B, Stavropoulos E, Honore N, Domenech P, Saint-Joanis B, Wilson TM, Collins
DM, Colston MJ, Cole ST: Effects of overexpression of the alkyl hydroperoxide
42
762
763
764
765
766
767
768
769
770
771
772
773
774
775
776
777
778
779
780
781
782
783
reductase AhpC on the virulence and isoniazid resistance of Mycobacterium
tuberculosis. Infect Immun 1997, 65(4):1395-1401.
91. Jenkins HE, Zignol M, Cohen T: Quantifying the burden and trends of isoniazid
resistant tuberculosis, 1994-2009. PLoS One 2011, 6(7):e22927.
92. Cohn DL, Bustreo F, Raviglione MC: Drug-resistant tuberculosis: review of the
worldwide situation and the WHO/IUATLD Global Surveillance Project.
International Union Against Tuberculosis and Lung Disease. Clin Infect Dis 1997, 24
Suppl 1:S121-130.
93. Paramasivan CN, Chandrasekaran V, Santha T, Sudarsanam NM, Prabhakar R:
Bacteriological investigations for short-course chemotherapy under the tuberculosis
programme in two districts of India. Tuber Lung Dis 1993, 74(1):23-27.
94. Enarson D, Rouillon A: The epidemiological basis of tuberculosis control. London,
UK: Chapman and Hall; 1994.
95. Guidelines for intensified tuberculosis case-finding and isoniazid preventive therapy
for people living with HIV in resource-constrained settings
[http://whqlibdoc.who.int/publications/2011/9789241500708_eng.pdf]
96. Boehme CC, Nabeta P, Hillemann D, Nicol MP, Shenai S, Krapp F, Allen J, Tahirli R,
Blakemore R, Rustomjee R et al: Rapid molecular detection of tuberculosis and
rifampin resistance. N Engl J Med 2010, 363(11):1005-1015.
97. Tuberculosis finance profile - India
98. Inflation, GDP deflator (annual %)
[http://data.worldbank.org/indicator/NY.GDP.DEFL.KD.ZG]
43
784
785
786
787
788
789
790
791
792
793
794
795
796
797
798
799
800
801
802
803
804
805
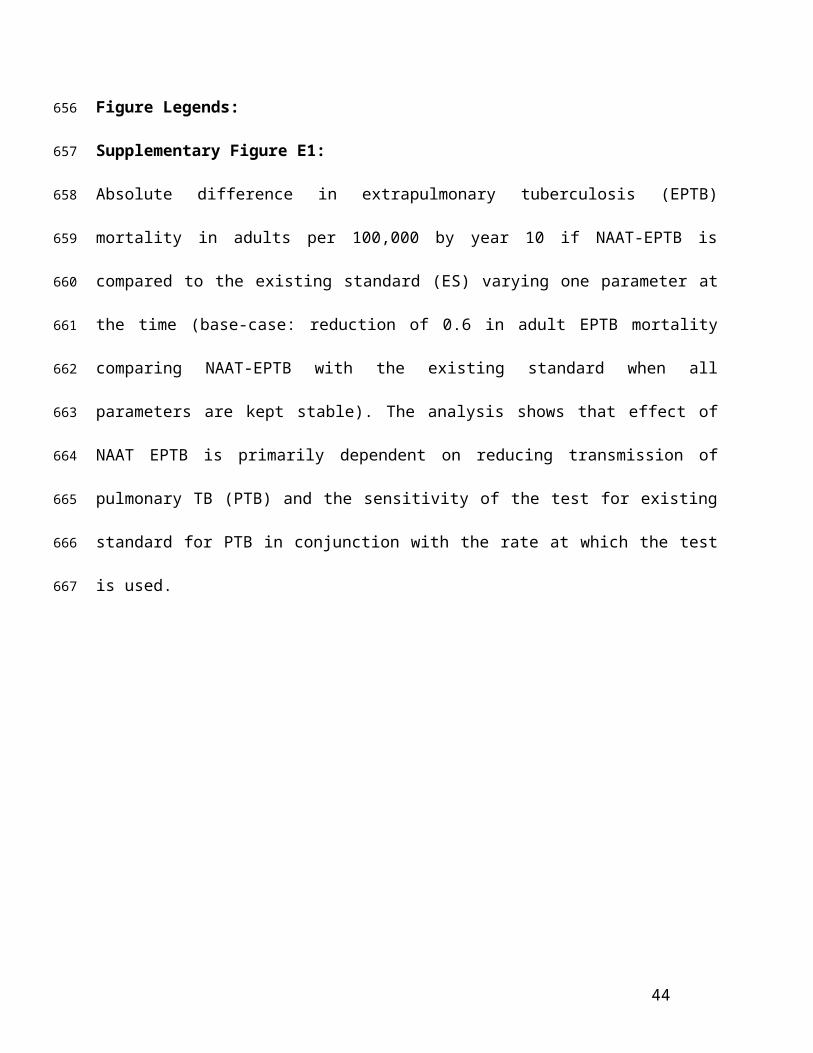
99. Menzies NA, Cohen T, Lin HH, Murray M, Salomon JA: Population health impact and
cost-effectiveness of tuberculosis diagnosis with Xpert MTB/RIF: a dynamic
simulation and economic evaluation. PLoS Med 2012, 9(11):e1001347.
100. World Health Organization: CHOosing Interventions that are Cost Effective (WHO-
CHOICE). In.
44
806
807
808
809
810
811