12/7/2011draft for discussion long range financial forecast december 7, 2011 subcommittee mary ann...
TRANSCRIPT

12/7/2011 Draft for Discussion
Long Range Financial Forecast
December 7, 2011
SubcommitteeMary Ann Ashton
Clint SewardDoug TindalSteve Noone
1

12/7/2011 Draft for Discussion
Description of the Issue
• Our taxes represent the price of a basket of assets and services that are desired by the taxpayer, so our long-range planning should look at two things:
• How do the costs of that basket behave over time?
• Does the service level need to be adjusted?
Our work has produced a spreadsheet tool that can be used to model changes in future revenues and expenses. This tool, if adopted by the Finance Committee and the operating entities, will provide a means to evaluate choices that will be presented to Acton voters this year and in the future about how much revenue needs to be raised, how it could be spent, and how to best use our reserves prudently to close gaps between revenues and expenses.
2
12/7/2011 Draft for Discussion
Overview of RevenuesFY12 Revenue by Source
Total $81,614In Thousands Less Excluded Debt
Tax Levy, $62,726
Tax Increase, $1,575
Overlay, -$600
New Growth, $425
Excise Tax, $2,640
Other, $1,214
Use of Reserves, $2,000
State Aid, $11,633

12/7/2011 Draft for Discussion
Predictability of Revenues
• Volatility– More than three-quarters of our revenue comes from the tax levy. While tax
revenue can vary year-to-year, the changes are not large and quite predictable. We generally assume taxes will go up by 2½ percent.
– Another 2 percent of total revenue comes from the Proposition 2½ percent increase on the previous year’s base, which is a highly predictable number.
– Reserves, new growth, and excise tax account for another 6 percent and we have a good history for predicting those. All together the predictable and not terribly volatile items total 85 percent of our revenue.
• State Aid– We spend a great deal of time trying to predict state aid, which accounts for 14
percent of our revenue. With the exception of 2008-2009 (when the Chapter 70 formula was changed), state aid has gradually increased over the last 30 years, with three periods of decline. More importantly for the past 20 years that pattern has been plus or minus 10 percent in terms of volatility.
– Since state aid is 14 percent of the total our potential error for total revenues is plus or minus 1.4 percent.
4

12/7/2011 Draft for Discussion
Overview of Expense
11,165,547
FY12 Expense by TypeTotal $81,614
In Thousands excludes Debt
Salaries, $45,550
Benefits, $15,436
Utilities , $2,427
SPED, $4,567
Capital, $1,425
Transportation, $2,002
Other, $12,801

12/7/2011 Draft for Discussion
Predictability of Expenses
• Salaries of union personnel are defined by collective bargaining agreements which typically last three years
• Health Insurance costs escalate every year but our opportunity to alter plan design (deductibles, copays, cost sharing) only occurs every three years as new collective bargaining agreements are negotiated.
• Capital spending for long lived assets occurs on a hit or miss basis as opposed to a planned replacement program
6

12/7/2011 Draft for Discussion
Overview of Reserve Use• The use of reserves (free cash and Regional Excess and Deficiency) has
been trending upward. The routine practice of using reserves to plug the gap between revenues and expenses is possibly an indication that our current basket of services cost more than we are charging for it.
• Using reserves to cover recurring or operating costs has a place in the fiscal management of the town and schools. Since FY08 we have been using reserves to plug the cap between revenue and expense at a rate of about $2 million per year.
• Limitations– First, there is a finite amount of reserves and this approach simply postpones the
problem. – Second, it tends to minimize the size of the problem we are dealing with and thus
we look for expedient measures to close the gap while all but ignoring longer term potentially more significant solutions.
– Third, there are other uses for reserves other than smoothing budget gaps, such as major capital asset repairs or replacements, unanticipated major repair projects, or unfunded liabilities for post employment benefits.
7

12/7/2011 Draft for Discussion
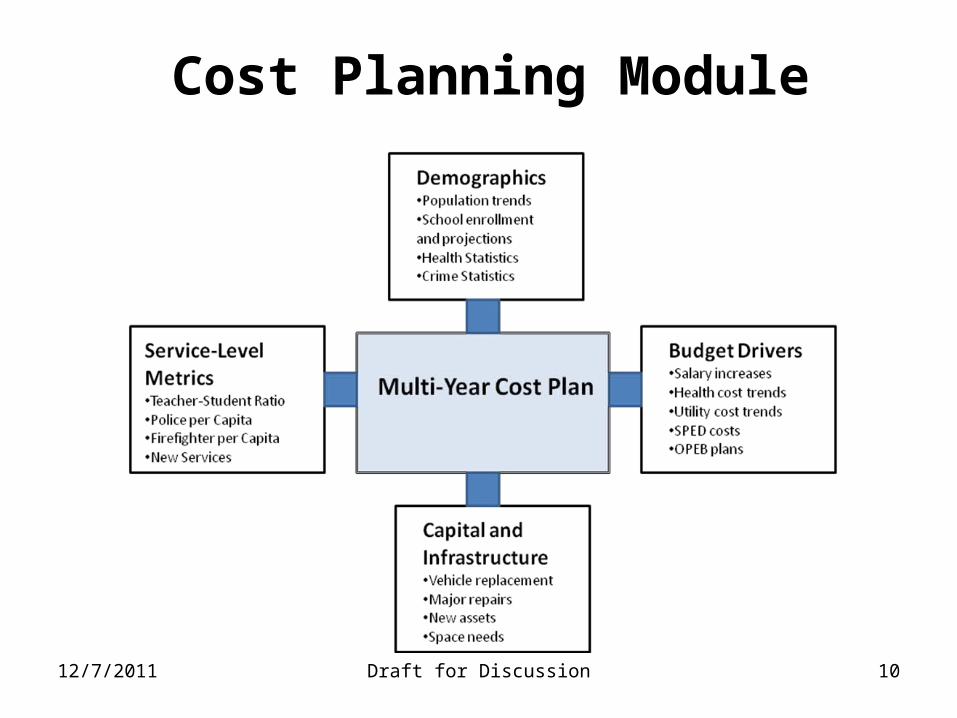
Overview of Service Metrics• A better approach to planning is to begin by reviewing our needs
and validate that those are still the services and levels of service desired by the taxpayers.
• Then the next step would be to estimate the cost of those needs. Much of the information exists now but it is not integrated in a plan to be understood by boards and Town Meeting members.
• A thoughtful review of the current types of services and service levels will allow us to plan for expansions or contractions of services based on the needs of Acton’s residents.
• In our model we’ve provided ways to analyze the cost of future services and future service levels and envision how these fit into the available revenues or assess what additional revenues would be required to provide for these services.
8

12/7/2011 Draft for Discussion
Overview of Long Range Fiscal Planning Model
• The Long Range Financial Forecast offers a tool to portray Acton’s finances as they may evolve over the next five years, given a specific set of assumptions.
• This is intended to be a tool to generate a discussion among citizens, town staff, elected officials, and volunteers as to what do we need to be doing as the years go by to keep Acton on a solid financial footing.
• The Long Range Financial Forecast is a series of interlocking spreadsheets
that project all of the financial revenue sources, expenses, and other financial issues for Acton based in part on our historic performance in various categories of income and expense.
• The spreadsheet format is similar to the ALG three-year spreadsheet, but differs significantly in that it attempts to predict expenses by analyzing specific categories of expenses. The model also adds several items that may need to be analyzed for their long-term effects
9
12/7/2011 Draft for Discussion
Cost Planning Module
10

12/7/2011 Draft for Discussion
Revenue Planning Module
11
12/7/2011 Draft for Discussion
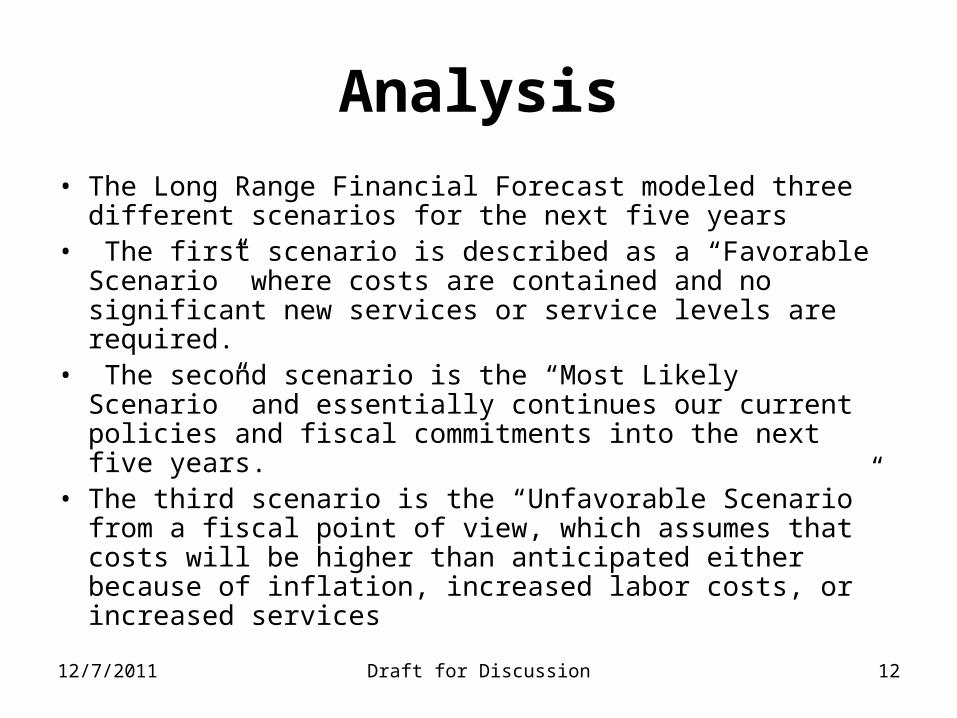
Analysis
• The Long Range Financial Forecast modeled three different scenarios for the next five years
• The first scenario is described as a “Favorable Scenario” where costs are contained and no significant new services or service levels are required.
• The second scenario is the “Most Likely Scenario” and essentially continues our current policies and fiscal commitments into the next five years.
• The third scenario is the “Unfavorable Scenario” from a fiscal point of view, which assumes that costs will be higher than anticipated either because of inflation, increased labor costs, or increased services
12
12/7/2011 Draft for Discussion
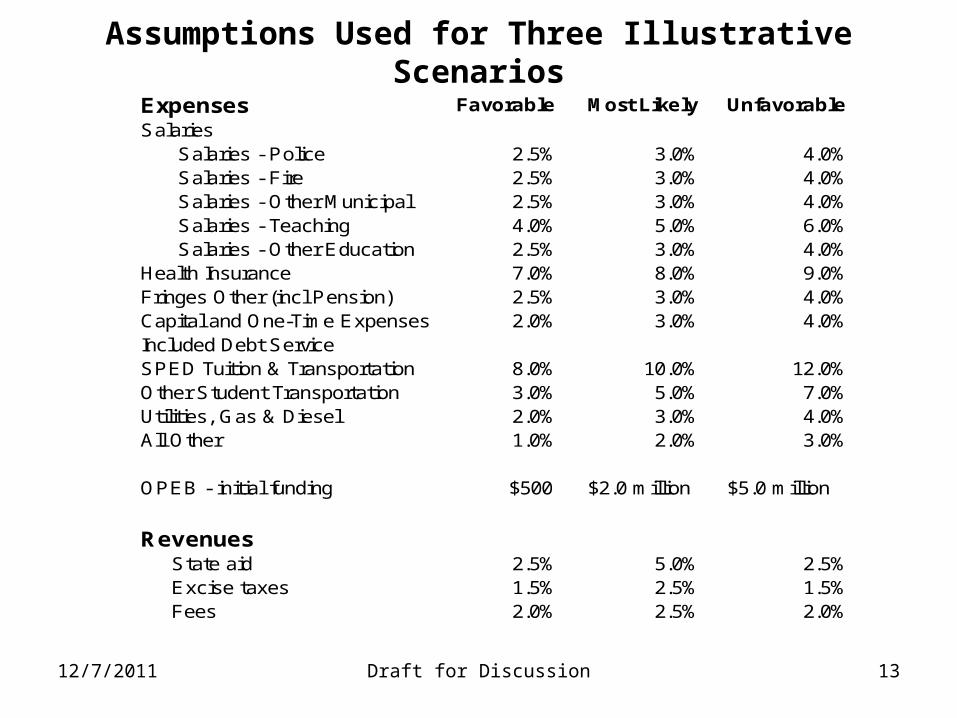
Assumptions Used for Three Illustrative Scenarios
Expenses Favorable Most Likely UnfavorableSalaries Salaries - Police 2.5% 3.0% 4.0% Salaries - Fire 2.5% 3.0% 4.0% Salaries - Other Municipal 2.5% 3.0% 4.0% Salaries - Teaching 4.0% 5.0% 6.0% Salaries - Other Education 2.5% 3.0% 4.0%Health Insurance 7.0% 8.0% 9.0%Fringes Other (incl Pension) 2.5% 3.0% 4.0%Capital and One-Time Expenses 2.0% 3.0% 4.0%Included Debt ServiceSPED Tuition & Transportation 8.0% 10.0% 12.0%Other Student Transportation 3.0% 5.0% 7.0%Utilities, Gas & Diesel 2.0% 3.0% 4.0%All Other 1.0% 2.0% 3.0%
OPEB - initial funding $500 $2.0 million $5.0 million
Revenues State aid 2.5% 5.0% 2.5% Excise taxes 1.5% 2.5% 1.5% Fees 2.0% 2.5% 2.0%
13
12/7/2011 Draft for Discussion
Results• Our analysis demonstrates that over the
next few years Acton may continue to face a period of continuing financial uncertainty.
• Sources of Uncertainty– Economy– Reserves for plugging the gap– Other Post Employment Benefit Funding decisions
– Capital Projects or land acquisition
14

12/7/2011 Draft for Discussion
ScenariosFY12 FY13 FY14 FY15 FY16 FY17
FavorableRevenues 81,839 84,413 86,551 89,005 91,276 94,116Expenses 81,614 84,662 87,857 91,208 94,724 98,415OPEB 0 250 500 750 1,000 1,500Difference 225 (499) (1,806) (2,953) (4,448) (5,799)
Most LikelyRevenues 81,839 84,735 87,219 90,043 92,709 95,972Expenses 81,614 85,409 89,424 93,674 98,174 102,942OPEB 0 1,000 2,000 2,000 2,000 2,000Difference 225 (1,675) (4,205) (5,631) (7,464) (8,970)
UnfavorableRevenues 81,839 84,413 86,551 89,005 91,276 94,116Expenses 81,614 86,285 91,274 96,605 102,307 108,408OPEB 0 2,500 5,000 5,000 5,000 5,000Difference 225 (4,373) (9,723) (12,600) (16,031) (19,292)
*Excluded debt not included in analysis.
15
12/7/2011 Draft for Discussion
Recommendations
• We recommend that the Long Range Financial Forecast be adopted by the Finance Committee, the Board of Selectmen, and the School Committees as a tool to model decisions for long-range planning.
• The Finance Committee will maintain and distribute the Long Range Financial Forecast annually. Wherever possible and available, the Long Range Financial Forecast should use the same assumptions about revenues and expenses as used in the Acton Leadership Group three-year plan
16