12/31/11 - home | matthews international
TRANSCRIPT
12/31/11

2
Business Overview
3
Disclaimer Any forward-looking statements in connection with this discussion are being made pursuant to the safe harbor provisions of the Private Securities Litigation Reform Act of 1995. Such forward-looking statements involve known and unknown risks and uncertainties that may cause the Company’s actual results in future periods to be materially different from management’s expectations. Although the Company believes that the expectations reflected in such forward-looking statements are reasonable, no assurance can be given that such expectations will prove correct. Factors that could cause the Company’s results to differ from those discussed today are set forth in the Company’s Annual Report on Form 10-K and other periodic filings with the Securities and Exchange Commission (“SEC”).
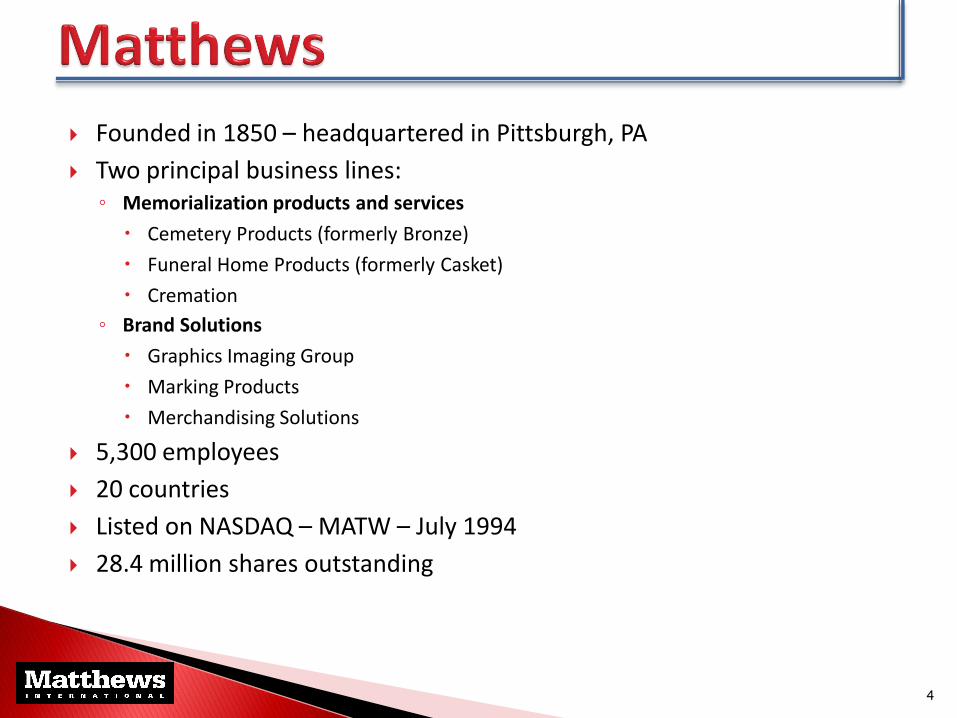
Founded in 1850 – headquartered in Pittsburgh, PA
Two principal business lines: ◦ Memorialization products and services
Cemetery Products (formerly Bronze)
Funeral Home Products (formerly Casket)
Cremation
◦ Brand Solutions
Graphics Imaging Group
Marking Products
Merchandising Solutions
5,300 employees
20 countries
Listed on NASDAQ – MATW – July 1994
28.4 million shares outstanding
4
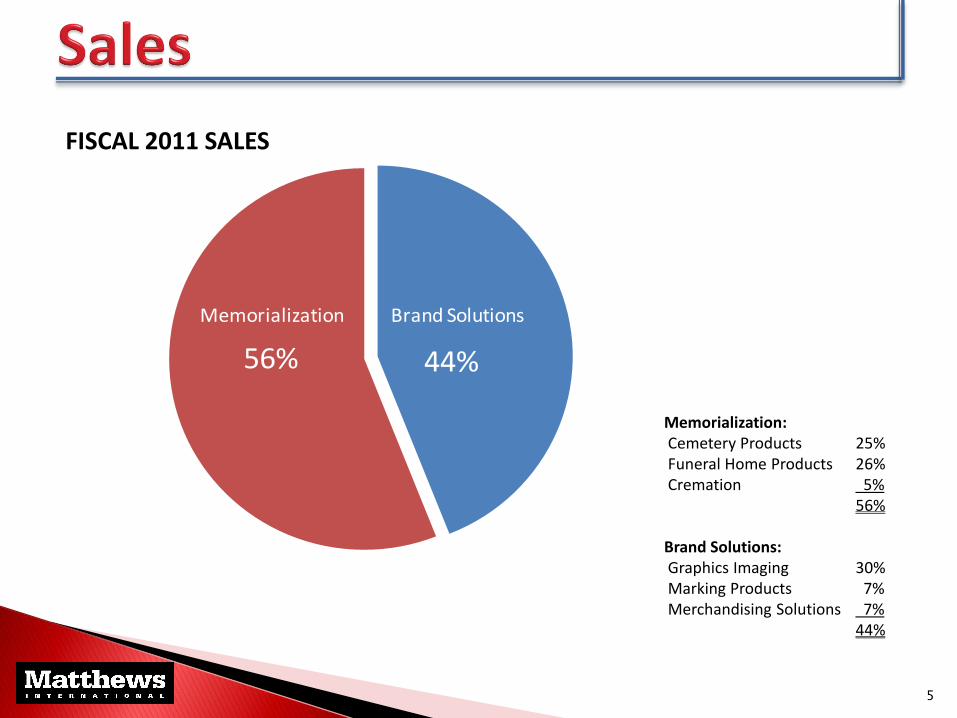
44%56%
Memorialization Brand Solutions
FISCAL 2011 SALES
Memorialization: Cemetery Products 25% Funeral Home Products 26% Cremation 5% 56% Brand Solutions: Graphics Imaging 30% Marking Products 7% Merchandising Solutions 7% 44%
5

6
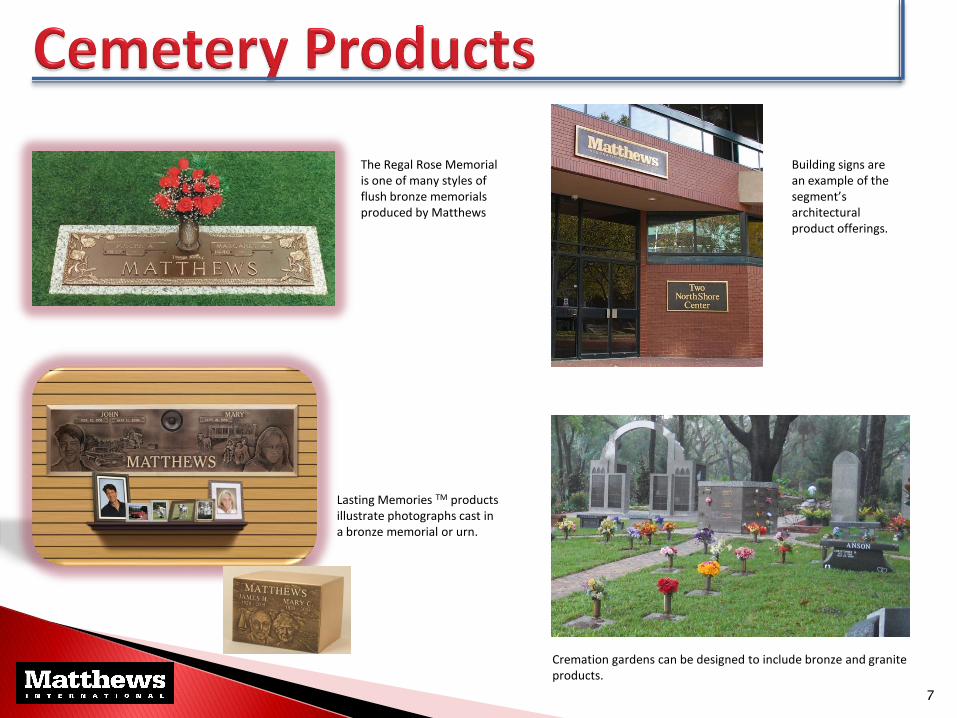
Lasting Memories TM products illustrate photographs cast in a bronze memorial or urn.
Cremation gardens can be designed to include bronze and granite products.
7
The Regal Rose Memorial is one of many styles of flush bronze memorials produced by Matthews
Building signs are an example of the segment’s architectural product offerings.

Wood Caskets are manufactured in York, PA
8
The Funeral Home Products segment is a leading manufacturer and distributor of caskets in North America, producing a wide variety of wood , metal and cremation caskets.
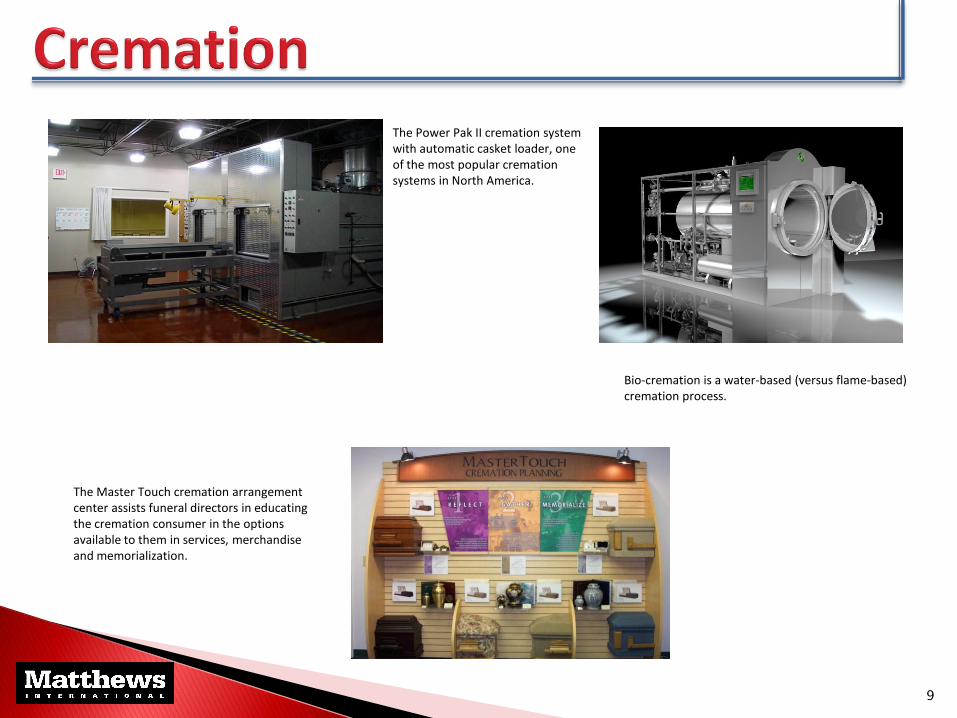
The Power Pak II cremation system with automatic casket loader, one of the most popular cremation systems in North America.
Bio-cremation is a water-based (versus flame-based) cremation process.
The Master Touch cremation arrangement center assists funeral directors in educating the cremation consumer in the options available to them in services, merchandise and memorialization.
9
◦ “Total Solutions” to funeral service providers
◦ Cremation
Memorialization
European market
Service
◦ Granite memorials
◦ Architectural products/signage
◦ Acquisitions
◦ Cost structure improvements
10

26.2% 32.3%
39.8% 46.0%
58.9%
60.6%
62.3%
64.0% 65.0%
66.0%
1999
2001
2003
2005
2007
2009
2011
2013
2015
2017
2019
2021
2023
2025
2027
2029
2031
2033
2035
2037
2039
2041
2043
2045
2047
2049
0
500
1,000
1,500
2,000
2,500
3,000
3,500
4,000
4,500
5,000
Source: CANA
Total Deaths
50.0%
Cremation Rate
11
12
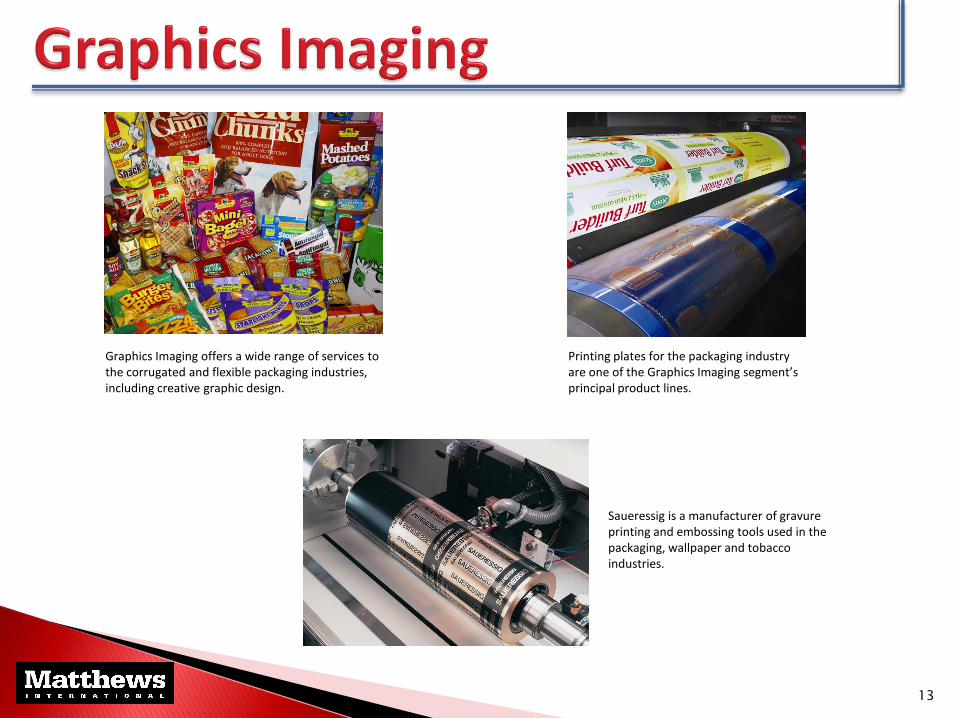
Printing plates for the packaging industry are one of the Graphics Imaging segment’s principal product lines.
Graphics Imaging offers a wide range of services to the corrugated and flexible packaging industries, including creative graphic design.
Saueressig is a manufacturer of gravure printing and embossing tools used in the packaging, wallpaper and tobacco industries.
13

Non-contact ink-jet printing units apply dot matrix coding on products.
The Marking Products segment designs and manufactures industrial quality printers for in-line marking. The ProPoint printer uses an etching process to mark items.
Marking Products manufactures industrial inks for offset, contact and ink-jet printing systems.
14
Matthews continues to be one of the market leaders in automated conveyor controls.
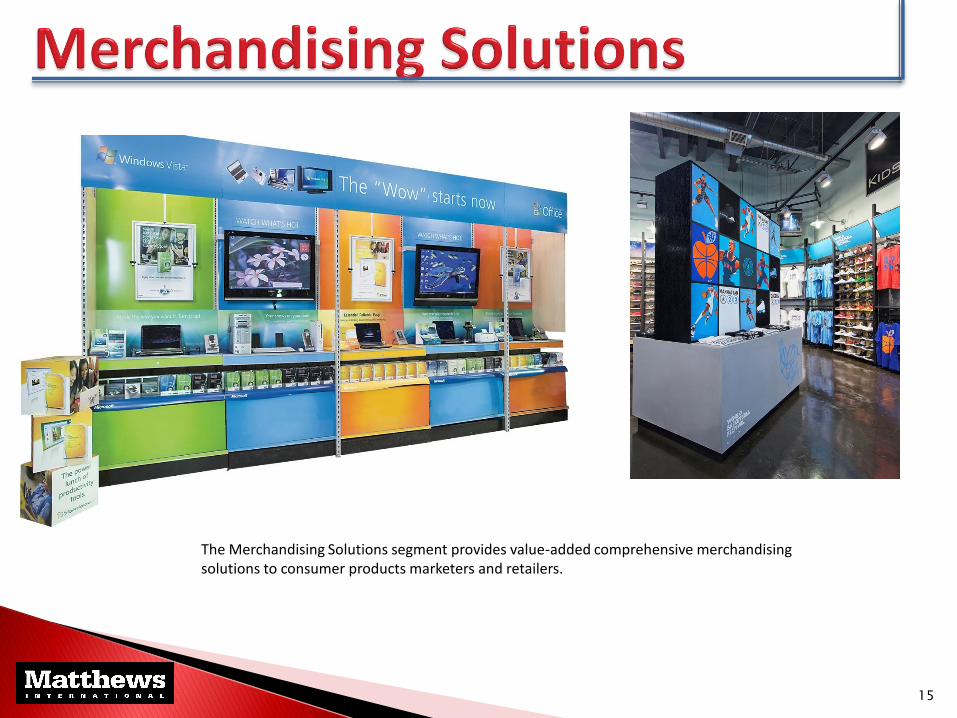
The Merchandising Solutions segment provides value-added comprehensive merchandising solutions to consumer products marketers and retailers.
15
◦ U.S. Graphics
Primary packaging
Gravure
◦ Skill extension
◦ Geographic expansion
◦ New product development
◦ Acquisitions
◦ Cost structure improvements
16

17
FINANCIAL OVERVIEW
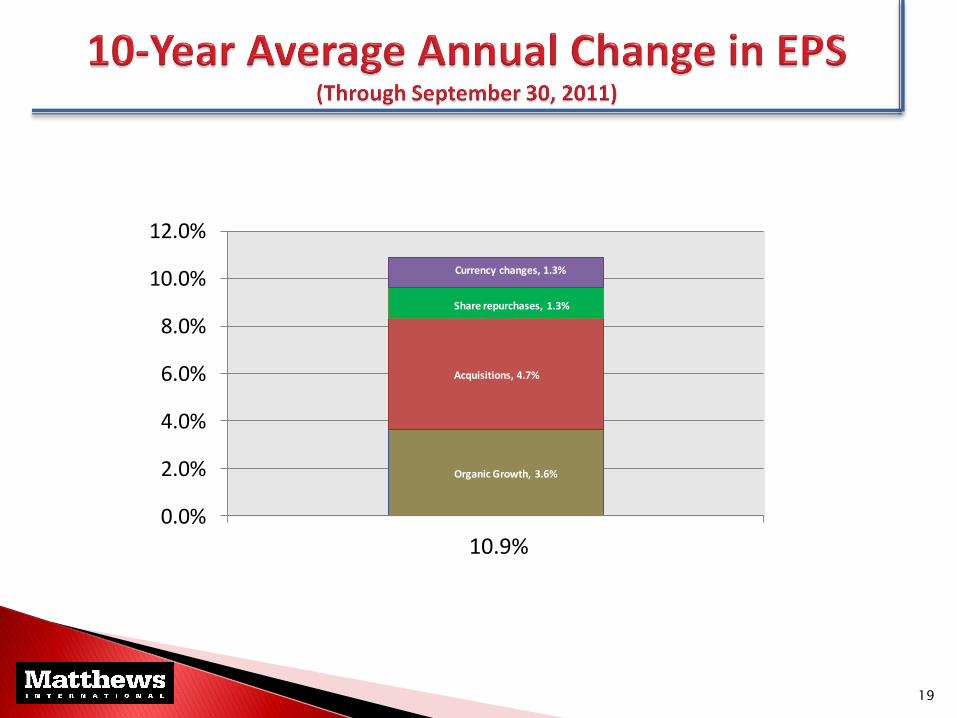
Internal Growth
◦ Expand market presence of existing products
◦ New product development
◦ Manufacturing/cost structure improvements
Acquisitions
Share Repurchases
18
19
Organic Growth, 3.6%
Acquisitions, 4.7%
Share repurchases, 1.3%
Currency changes, 1.3%
0.0%
2.0%
4.0%
6.0%
8.0%
10.0%
12.0%
10.9%

Principal objective: Support the business plan and long-term growth objectives of the Company and specific operating segment. Financial criteria: Immediately accretive to Earnings per Share. Achieve long-term target of an annual pre-tax Return on Invested Capital of 20%. Performance of companies acquired within last 10 years:
Strong Performers
Acceptable Performers
Marginal Performers
FCC Cloverleaf Casket Distributors (cost structure initiatives)
Holjeron Freeman / Reynoldsville Doyle Group (reduced cost structure)
IPTI / Lightning Pick Gem United Memorial (granite business plan)
Munich InTouch
Saueressig Kenuohua
Kroma
Milso
20
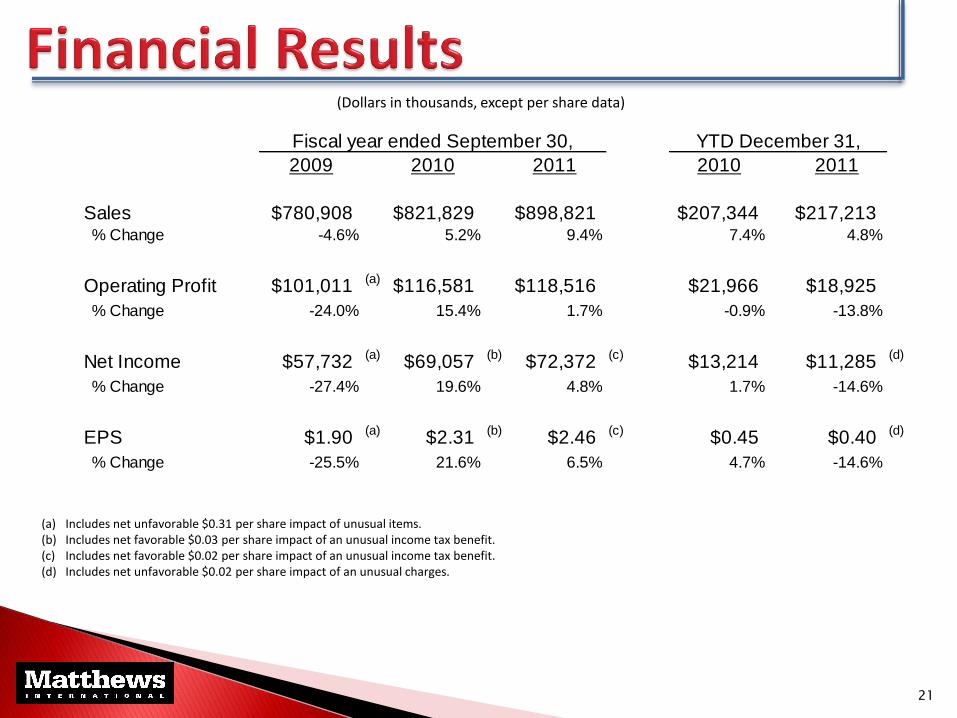
(a) Includes net unfavorable $0.31 per share impact of unusual items. (b) Includes net favorable $0.03 per share impact of an unusual income tax benefit. (c) Includes net favorable $0.02 per share impact of an unusual income tax benefit. (d) Includes net unfavorable $0.02 per share impact of an unusual charges.
21
Fiscal year ended September 30, YTD December 31,
2009 2010 2011 2010 2011
Sales $780,908 $821,829 $898,821 $207,344 $217,213 % Change -4.6% 5.2% 9.4% 7.4% 4.8%
Operating Profit $101,011(a)
$116,581 $118,516 $21,966 $18,925
% Change -24.0% 15.4% 1.7% -0.9% -13.8%
Net Income $57,732(a)
$69,057(b)
$72,372(c)
$13,214 $11,285(d)
% Change -27.4% 19.6% 4.8% 1.7% -14.6%
EPS $1.90(a)
$2.31(b)
$2.46(c)
$0.45 $0.40(d)
% Change -25.5% 21.6% 6.5% 4.7% -14.6%
(Dollars in thousands, except per share data)

(Dollars in thousands)
22
YTD December 31,
2009 2010 2011 2010 2011
Memorialization:
Cemetery Products $215,934 $224,247 $224,773 $50,513 $45,150
Funeral Home Products 203,247 210,279 238,753 61,657 58,571
Cremation 30,909 39,356 43,816 8,241 9,434
Total Memorialization $450,090 $473,882 $507,342 $120,411 $113,155
Brand Solutions:
Graphics Imaging $234,966 $239,957 $268,975 $60,027 $70,443
Marking Products 42,355 51,069 61,938 12,920 16,383
Merchandising Solutions 53,497 56,921 60,566 13,986 17,232
Total Brand Solutions $330,818 $347,947 $391,479 $86,933 $104,058
Total $780,908 $821,829 $898,821 $207,344 $217,213

(Dollars in thousands)
23
YTD December 31,
2009 2010 2011 2010 2011
Memorialization:
Cemetery Products $57,598 $56,167 $52,474 $10,127 $4,535
Funeral Home Products 17,716 26,242 26,785 6,371 6,488
Cremation 5,036 4,910 5,733 529 757
Total Memorialization $80,350 $87,319 $84,992 $17,027 $11,780
Brand Solutions:
Graphics Imaging $19,217 $21,077 $22,427 $3,718 $4,981
Marking Products 1,500 5,817 7,819 1,025 1,368
Merchandising Solutions (56) 2,368 3,278 196 796
Total Brand Solutions $20,661 $29,262 $33,524 $4,939 $7,145
Total $101,011 $116,581 $118,516 $21,966 $18,925

24
Fiscal year ended September 30,
2008 2009 2010 2011
Memorialization:
Cemetery Products 29.4% 26.7% 25.0% 23.3%
Funeral Home Products 10.6% 8.7% 12.5% 11.2%
Cremation 20.5% 16.3% 12.5% 13.1%
Total Memorialization 20.5% 17.9% 18.4% 16.8%
Brand Solutions:
Graphics Imaging 9.1% 8.2% 8.8% 8.3%
Marking Products 15.2% 3.5% 11.4% 12.6%
Merchandising Solutions 7.4% -0.1% 4.2% 5.4%
Total Brand Solutions 9.9% 6.2% 8.4% 8.6%
Total 16.2% 12.9% 14.2% 13.2%
25
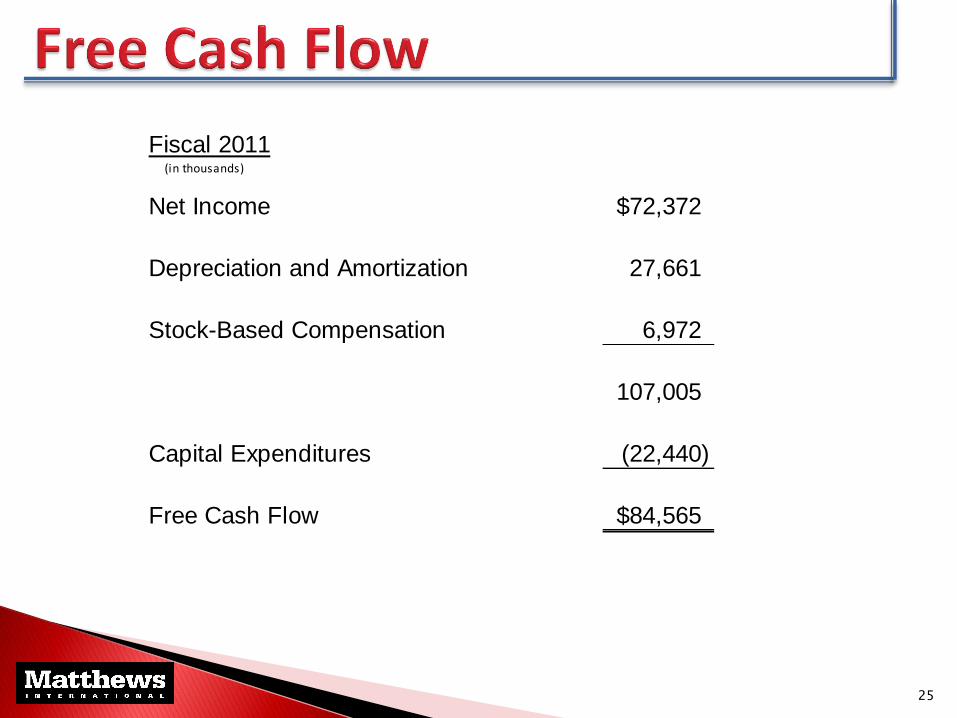
Fiscal 2011 (in thousands)
Net Income $72,372
Depreciation and Amortization 27,661
Stock-Based Compensation 6,972
107,005
Capital Expenditures (22,440)
Free Cash Flow $84,565

26
0%
2%
4%
6%
8%
10%
12%
9/30/02 9/30/03 9/30/04 9/30/05 9/30/06 9/30/07 9/30/08 9/30/09 9/30/10 9/30/11
5.3%
5.9% 5.7%
4.4%
6.2%
5.0%
6.2%
6.9%
7.8%
9.7%
27
$0.00
$0.50
$1.00
$1.50
$2.00
$2.50
$3.00
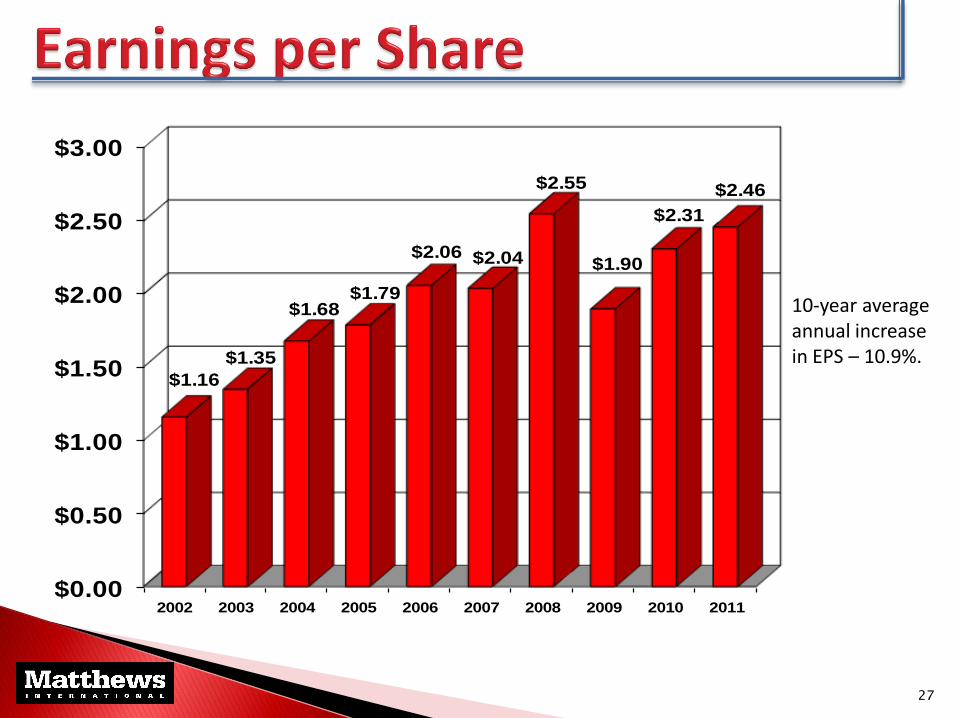
2002 2003 2004 2005 2006 2007 2008 2009 2010 2011
$1.16
$1.35
$1.68$1.79
$2.06 $2.04
$2.55
$1.90
$2.31
$2.46
10-year average annual increase in EPS – 10.9%.
28
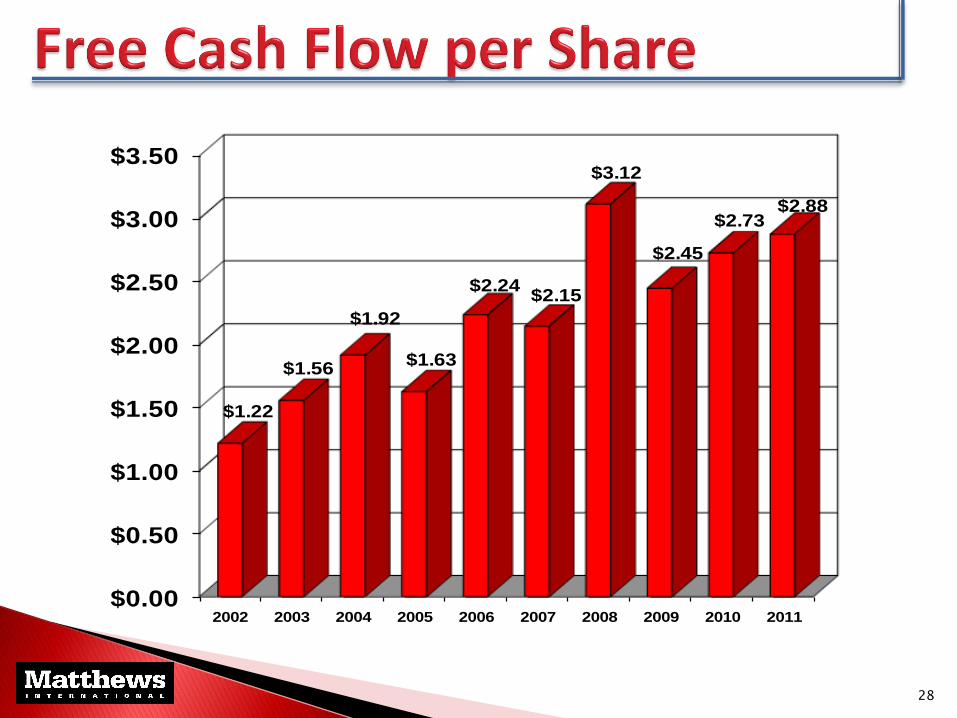
$0.00
$0.50
$1.00
$1.50
$2.00
$2.50
$3.00
$3.50
2002 2003 2004 2005 2006 2007 2008 2009 2010 2011
$1.22
$1.56
$1.92
$1.63
$2.24$2.15
$3.12
$2.45
$2.73$2.88
29
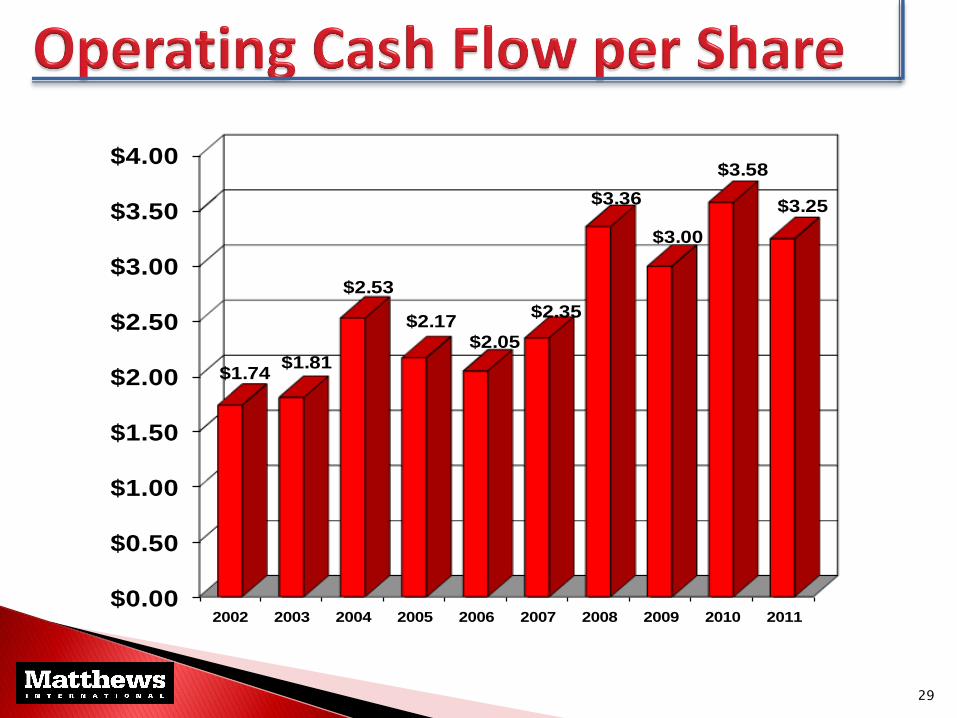
$0.00
$0.50
$1.00
$1.50
$2.00
$2.50
$3.00
$3.50
$4.00
2002 2003 2004 2005 2006 2007 2008 2009 2010 2011
$1.74$1.81
$2.53
$2.17$2.05
$2.35
$3.36
$3.00
$3.58
$3.25
30
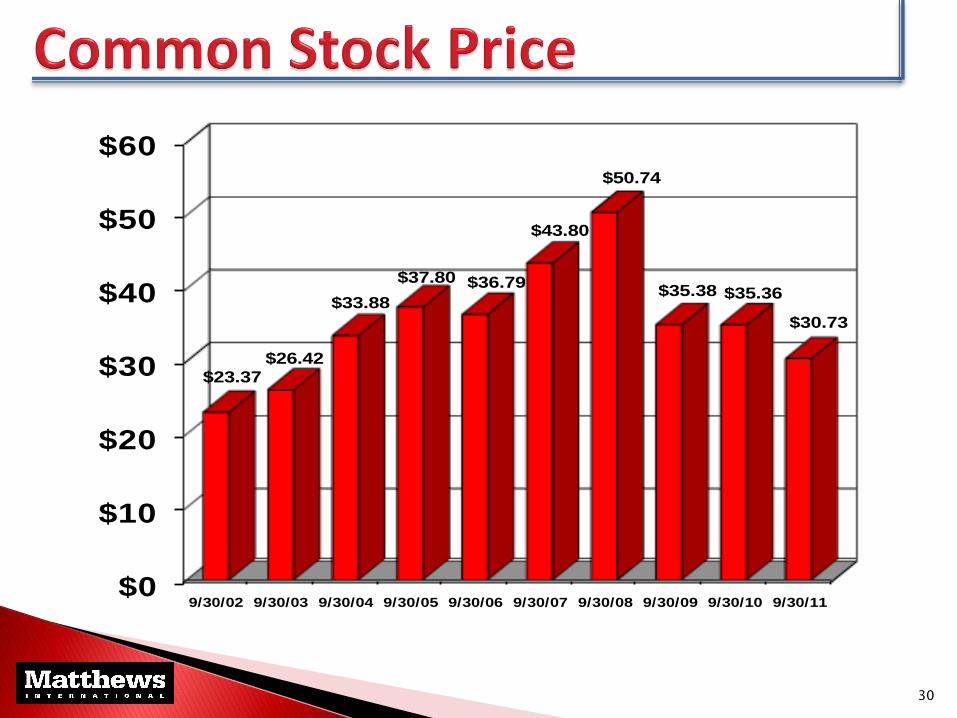
$0
$10
$20
$30
$40
$50
$60
9/30/02 9/30/03 9/30/04 9/30/05 9/30/06 9/30/07 9/30/08 9/30/09 9/30/10 9/30/11
$23.37$26.42
$33.88
$37.80 $36.79
$43.80
$50.74
$35.38 $35.36
$30.73

31
0%
5%
10%
15%
20%
25%
2007 2008 2009 2010 2011
15.8%
18.3%
13.2%
14.8% 15.0%
Increased quarterly dividend 12.5% to 9.0 cents (October 2011) ◦ 17th consecutive annual dividend increase since the IPO
Reported record sales of $899 million in fiscal 2011
Sales of $339 million (38% of total) generated outside the U.S. in fiscal 2011
Analyst coverage: ◦ CJS Securities (D. Moore)
◦ Davenport & Company (C. Fendley)
◦ Great Lakes Review (E. Schlang/G. Halter)
◦ Janney Montgomery Scott (L. Burke)
◦ Sidoti & Company (J. Clement)
32
33
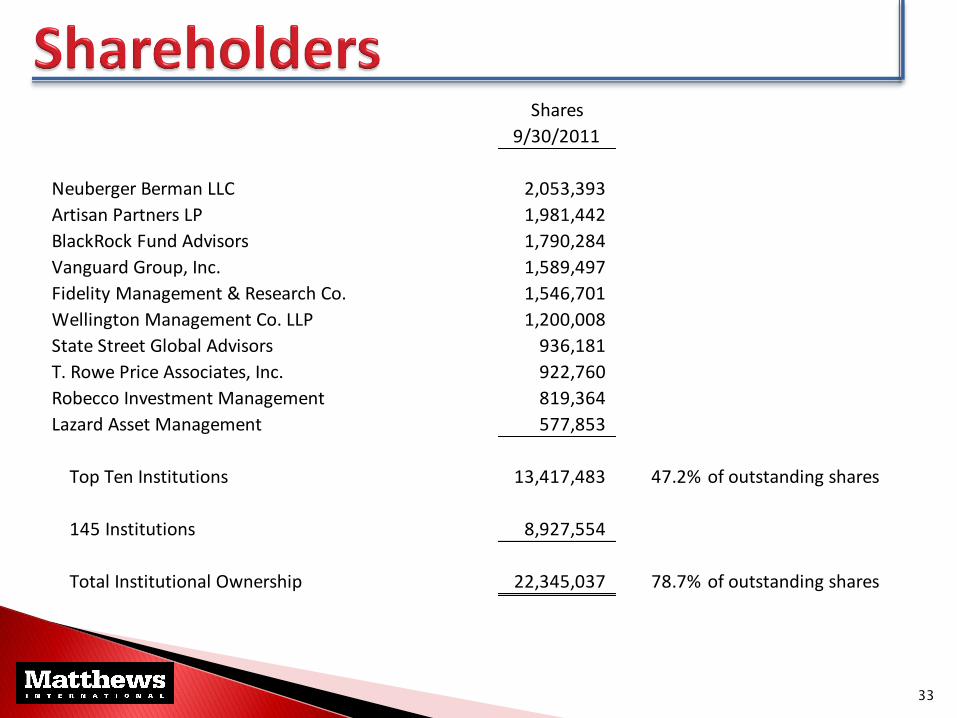
Shares
9/30/2011
Neuberger Berman LLC 2,053,393
Artisan Partners LP 1,981,442
BlackRock Fund Advisors 1,790,284
Vanguard Group, Inc. 1,589,497
Fidelity Management & Research Co. 1,546,701
Wellington Management Co. LLP 1,200,008
State Street Global Advisors 936,181
T. Rowe Price Associates, Inc. 922,760
Robecco Investment Management 819,364
Lazard Asset Management 577,853
Top Ten Institutions 13,417,483 47.2% of outstanding shares
145 Institutions 8,927,554
Total Institutional Ownership 22,345,037 78.7% of outstanding shares
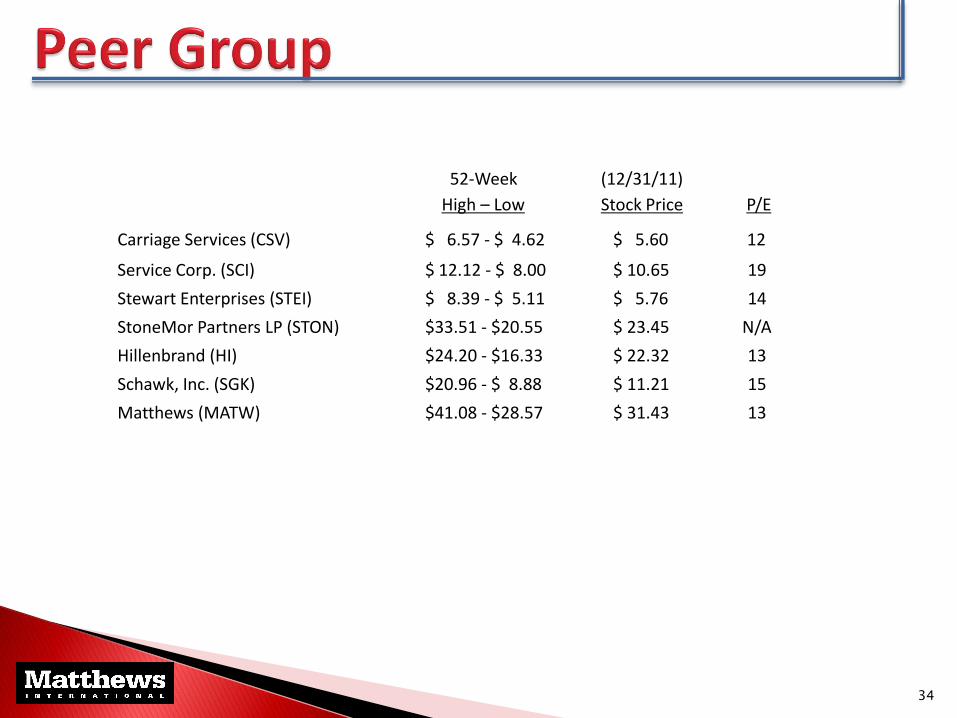
52-Week
High – Low
(12/31/11)
Stock Price
P/E
Carriage Services (CSV) $ 6.57 - $ 4.62 $ 5.60 12
Service Corp. (SCI) $ 12.12 - $ 8.00 $ 10.65 19
Stewart Enterprises (STEI) $ 8.39 - $ 5.11 $ 5.76 14
StoneMor Partners LP (STON) $33.51 - $20.55 $ 23.45 N/A
Hillenbrand (HI) $24.20 - $16.33 $ 22.32 13
Schawk, Inc. (SGK) $20.96 - $ 8.88 $ 11.21 15
Matthews (MATW) $41.08 - $28.57 $ 31.43 13
34
Long-term track record of EPS growth
Strong financial position and consistent free cash flow
◦ Ability to support growth strategies, share repurchases and debt reduction
Successful acquisition program
◦ Additional opportunities exist
Strong management team
35