121206-irea12608-toc-global homecare products … · microsoft word - 121206-irea12608-toc-global...
TRANSCRIPT

Lucintel http://www.marketresearch.com/Lucintel-v2747/
Publisher Sample
Phone: 800.298.5699 (US) or +1.240.747.3093 or +1.240.747.3093 (Int'l) Hours: Monday - Thursday: 5:30am - 6:30pm EST
Fridays: 5:30am - 5:30pm EST
Email: [email protected] MarketResearch.com

Global Homecare Products Industry 2012-2017:
Trend, Profit, and Forecast Analysis
Lucintel, a premier global management consulting and market research firm creates your equation for growth — whether you need to understand market dynamics, identify new opportunities, or increase your profitability.
Publication Date: October 2012

2
Global Homecare Products Industry 2012-2017: Trend, Profit , and Forecast Analysis
Background: The global homecare products industry experienced robust growth over the last five years and is expected to grow moderately with a CAGR of 4.6% over next five years (2012-2017). In 2017, the industry’s revenue is forecast to reach approximately US $146 billion. Recovery of the industrial and manufacturing sectors was the major driver for industry growth. Lucintel, a leading global management consulting and market research firm, has analyzed the global homecare products market and presents its findings in “Global Homecare Products Industry 2012-2017: Trend, Profit, and Forecast Analysis.” The research indicates that the Asia Pacific (APAC) region’s homecare product industry is forecast to lead the industry due to increasing population, new demand for homecare products, and changing lifestyles. Growth in this region is expected mainly in the developing markets such as India and China due to increased high retail sales growth. Higher sales growth percentage of consumer goods and rising consumer expenditures are the key factors that are boosting the homecare products industry. The laundry segment is rapidly growing due to innovative products such as liquid fabric softener, fine washable detergent, and fabric conditioner products. Necessity of product and the retail store that provides special offers and discounts depicts positive growth. Rapid rate of innovation, eco-friendly products, and the use of natural ingredients are creating the demand for homecare products. As per the study, the global homecare products industry is mainly driven by purchasing power of consumers, their disposable income, and a rising population. Some of the challenges for the global homecare industry are economic recession, resource constraints, climate impacts, and political instability (changing taxation polices). Maintaining balance between quality and price is the biggest challenge for the industry. This study provides an overview of the global homecare products industry. The report studies manufacturers serving this segment, providing a five-year annual trend and forecast analysis that highlights market size, profit, and cost structure for North America, Europe, APAC, and the Rest of the World. This comprehensive guide from Lucintel provides readers with valuable information and the tools needed to successfully drive critical business decisions with a thorough understanding of the market’s potential. This report will save Lucintel clients hundreds of hours in personal research time on a global market and it offers significant benefits in expanding business opportunities throughout the global homecare products industry analysis. In a fast-paced ever-changing world, business leaders need every advantage available to them in a timely manner to drive change in the market and to stay ahead of their competition. This report provides business leaders with a keen advantage in this regard by making them aware of emerging trends and demand requirements on an annual basis.
Features and Scope of this Report: To make any investment or strategic decision, you need adequate and timely information. This market report fulfills this core need. Some of the features of this market report are: • Industry size estimates in terms of (US $) value by regions and by segments
3
Global Homecare Products Industry 2012-2017: Trend, Profit , and Forecast Analysis
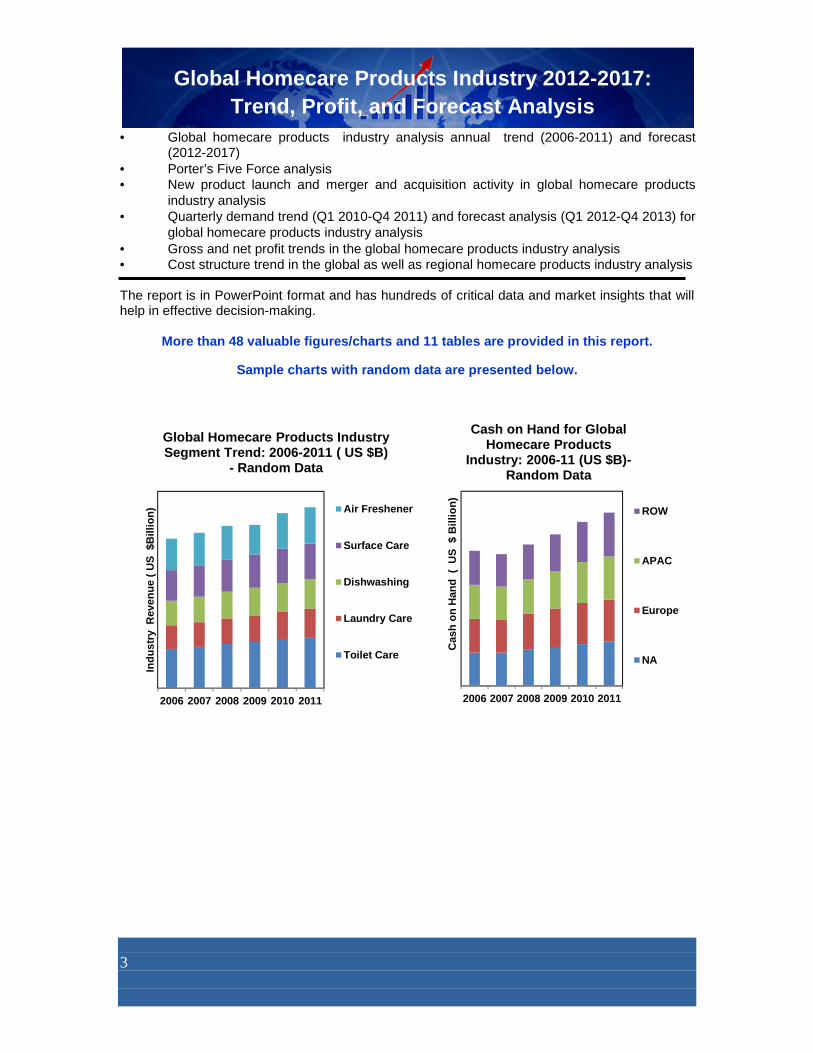
• Global homecare products industry analysis annual trend (2006-2011) and forecast (2012-2017)
• Porter’s Five Force analysis • New product launch and merger and acquisition activity in global homecare products
industry analysis • Quarterly demand trend (Q1 2010-Q4 2011) and forecast analysis (Q1 2012-Q4 2013) for
global homecare products industry analysis • Gross and net profit trends in the global homecare products industry analysis • Cost structure trend in the global as well as regional homecare products industry analysis The report is in PowerPoint format and has hundreds of critical data and market insights that will help in effective decision-making.
More than 48 valuable figures/charts and 11 tables a re provided in this report.
Sample charts with random data are presented below.
2006 2007 2008 2009 2010 2011
Indu
stry
Rev
enue
( U
S $
Bill
ion)
Global Homecare Products Industry Segment Trend: 2006-2011 ( US $B)
- Random Data
Air Freshener
Surface Care
Dishwashing
Laundry Care
Toilet Care
2006 2007 2008 2009 2010 2011
Cas
h on
Han
d (
US
$ B
illio
n)
Cash on Hand for Global Homecare Products
Industry: 2006-11 (US $B)-Random Data
ROW
APAC
Europe
NA
4
Global Homecare Products Industry 2012-2017: Trend, Profit , and Forecast Analysis
2006 2007 2008 2009 2010 2011
Pro
fit
(%
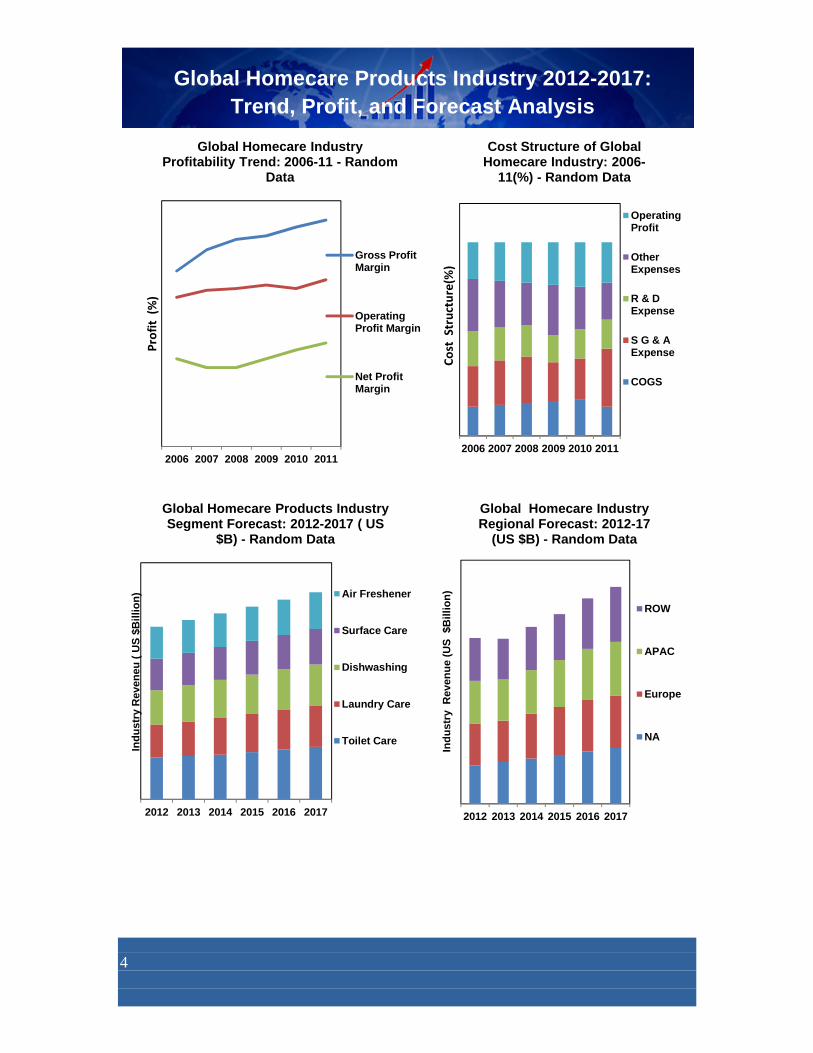
)Global Homecare Industry
Profitability Trend: 2006-11 - Random Data
Gross ProfitMargin
OperatingProfit Margin
Net ProfitMargin
2006 2007 2008 2009 2010 2011C
ost
S
tru
ctu
re(%
)
Cost Structure of Global Homecare Industry: 2006-
11(%) - Random Data
OperatingProfit
OtherExpenses
R & DExpense
S G & AExpense
COGS
2012 2013 2014 2015 2016 2017
Indu
stry
Rev
eneu
( U
S $
Bill
ion)
Global Homecare Products Industry Segment Forecast: 2012-2017 ( US
$B) - Random Data
Air Freshener
Surface Care
Dishwashing
Laundry Care
Toilet Care
2012 2013 2014 2015 2016 2017
Indu
stry
Rev
enue
(U
S $
Bill
ion)
Global Homecare Industry Regional Forecast: 2012-17
(US $B) - Random Data
ROW
APAC
Europe
NA

5
Global Homecare Products Industry 2012-2017: Trend, Profit, and Forecast Analysis
Global Homecare Products Industry: Porter’s Five Forces Analysis Random Data
CA
GR
(%
) : 2
012-
17
Gross Profit in US $B
Global Home Care Industry Opportunity by Region - Random Data
North America
Europe
Asia
Rest of World
Threat of Substitutes
• U
• V
• W
Threat of New Entrants
• A
• B
Competitive Rivalry
• D
• E
•
Supplier Power
• X
• Y
Buyer Power
• P
• Q

11
Global Homecare Products Industry 2012-2017: Trend, Profit , and Forecast Analysis
Table of Contents 1. Executive Summary
2. Industry Definition and Scope
3. Industry Overview
4. Global Macroeconomic Overview
5. Industry Trends
6. Industry Forecasts
7. Emerging Trends
8. Conclusions
List of Figures Chapter 3. Industry Overview
Figure 3.1: External forces shaping global homecare products industry Chapter 4. Global Macroeconomic Overview
Figure 4.1: Global GDP growth rate trend Figure 4.2: Global inflation rate trend Figure 4.3: Global population growth rate trend Figure 4.4: Global unemployment rate trend Figure 4.5: Regional GDP growth rate trend Figure 4.6: Regional inflation rate trend Figure 4.7: Regional population growth rate trend Figure 4.8: Regional unemployment rate trend
Chapter 5. Industry Trends
Figure 5.1: Global homecare products industry annual trend 2006-11 (US $B) Figure 5.2: Global homecare products industry regional trend 2006-11 (US $B) Figure 5.3: Global homecare products industry regional trend 2006-11 (%) Figure 5.4: Global homecare products industry segment trend 2006-11 (US $B) Figure 5.5: Global homecare products industry segment trend 2006-11 (%) Figure 5.6: Global homecare products industry quarterly trend 2010-11 (US $B) Figure 5.7: Global homecare products industry profitability trend 2006-11 Figure 5.8: Global homecare products industry revenue per employee Trend 2006-11 Figure 5.9: Cost structure of global homecare products industry 2006-11 Figure 5.10: Cost structure in North American homecare products industry 2006-11 Figure 5.9: Cost structure in European homecare products industry 2006-11 Figure 5.11: Cost structure in Asia Pacific homecare products industry 2006-11 Figure 5.12: Top 5 companies vs. homecare products gross profit & net profit analysis 2011 Figure 5.13: Cash on hand for global homecare products industry 2006-11 (US $B) Figure 5.14: Cash on hand for global homecare products industry 2006-11 (%) Figure 5.15: Asset for global homecare products industry 2006-11 (US $B)

12
Global Homecare Products Industry 2012-2017: Trend, Profit , and Forecast Analysis
Figure 5.16: Assets for global homecare products industry 2006-11 (%) Figure 5.17: Debt for global homecare products industry 2006-11 (US $B) Figure 5.18: Debt for global homecare products industry 2006-11 (%) Figure 5.19: Industry shares of top players in global homecare products industry in 2006 Figure 5.20: Industry shares of top players in global homecare products industry in 2011 Figure 5.21: Global homecare products industry 2006 market share analysis
Figure 5.22: Global homecare products industry 2011 market share analysis Chapter 6. Industry Forecasts
Figure 6.1: Global homecare products industry annual forecast 2012-17 (US $B) Figure 6.2: Global homecare products industry quarterly forecast 2012-13 (US $B) Figure 6.3: Global GDP growth rate forecast Figure 6.4: Global inflation rate forecast Figure 6.5: Global population growth rate forecast Figure 6.6: Global unemployment rate forecast Figure 6.7: Regional GDP growth rate forecast Figure 6.8: Regional inflation rate forecast Figure 6.9: Regional population growth rate forecast Figure 6.10: Regional unemployment rate forecast Figure 6.11: Global homecare products industry regional forecast 2012-17 (US $B) Figure 6.12: Global homecare products industry regional forecast 2012-17 (%) Figure 6.12: Global homecare products industry segment forecast 2012-17 (US $B) Figure 6.13: Global homecare products industry segment forecast 2012-17 (%)
Chapter 7. Emerging Trends Figure 7.1: Global homecare products industry opportunity by region Figure 7.1: Global homecare products industry opportunity by segment
List of Tables
Chapter 3. Industry Overview
Table 3.1: Industry parameters of global homecare products industry Table 3.2: Relative industry attractiveness by region
Chapter 5. Industry Trends Table 5.1: Regional revenue growth rate Table 5.2: Segment revenue growth rate Table 5.3: Percentage change in cost structure Table 5.4: Percentage change in cash on hand Table 5.5: Percentage change in total asset Table 5.6: Percentage change in total debt Table 5.7: Key companies by revenue growth Table 5.8: Key companies by revenue decline
Chapter 6. Industry Forecasts
Table 6.1: Global homecare products regional forecast growth rate