12 september 2019 - iea.blob.core.windows.net
TRANSCRIPT

Title of the Report Highlights
12 September 2019
• Our 2019 and 2020 global oil demand growth forecasts are unchanged at 1.1 mb/d and 1.3 mb/d, respectively. Growth was 0.5 mb/d in 1H19 and fell as low as 0.2 mb/d in June. For 2H19, we assume no further deterioration in the economic climate and in trade disputes. Oil demand growth will be significantly higher helped by a comparison versus a low base in 2H18, lower oil prices versus a year ago and additions to petrochemicals capacity. July data show y-o-y growth of 1.3 mb/d.
• A post-hurricane rebound in the US raised global oil supply by 530 kb/d in August to 100.7 mb/d. US expansion, plus big gains from Norway and Brazil, is set to boost non-OPEC growth from 1.9 mb/d this year to 2.3 mb/d in 2020. The non-OPEC surge will cut the need for OPEC crude to 28.3 mb/d in 1H20, 1.4 mb/d below the group’s August output. Compliance with the OPEC+ agreement fell to 116% in August. In June, the US overtook Saudi Arabia to become the world’s top oil exporter.
• The recent fall in global refining activity bottomed out in July, and throughput is set to return to y-o-y growth in 4Q19. Increased activity may depress refining margins from their current levels which are the highest for 2019. Preparations for the International Maritime Organisation’s new fuel emission standards are likely to offer support through stronger pricing for compliant fuels. We believe that, overall, the IMO regulations will be introduced with relatively little disruption.
• OECD commercial stocks increased by 1.5 mb in July to 2 931 mb, and stood 19.7 mb above the five-year average. Stocks in terms of days of forward demand rose by 0.1 days to 60.5 days, which is 1 day below the average. Preliminary data for August show inventories falling in US, while stocks increased in Europe and Japan. Floating storage of crude oil rose by 7.9 mb in August to 66.1 mb due to an increase of numbers of tankers storing crude oil in Iran.
• ICE Brent and NYMEX WTI are currently trading at $61/bbl and $56/bbl, respectively, having risen from seven month lows in early August. They are both about 20% below year-ago levels. US prices were boosted as new pipelines to transport crude from the Permian Basin came online and contributed to a narrowing of the WTI-Brent differential. Middle distillate cracks have strengthened ahead of the new IMO shipping fuel regulations.
.

IEA
. All
right
s re
serv
ed.
Table of contents
Taking a breather ....................................................................................................................................... 3 Demand ..................................................................................................................................................... 4
Overview .............................................................................................................................................. 4 Fundamentals .......................................................................................................................................6 OECD ................................................................................................................................................... 7 Non-OECD .......................................................................................................................................... 11 Other Non-OECD .............................................................................................................................................. 13
Supply ..................................................................................................................................................... 15 Overview ............................................................................................................................................ 15 OPEC crude oil supply .......................................................................................................................... 16 Non-OPEC supply ................................................................................................................................ 19
Refining ................................................................................................................................................... 27 Overview ............................................................................................................................................ 27 Margins ........................................................................................................................................................ 28 OECD refinery throughput ................................................................................................................... 29 Non-OECD refinery throughput ............................................................................................................ 31
Stocks ...................................................................................................................................................... 35 Overview ............................................................................................................................................ 35 Recent OECD industry stock changes .................................................................................................... 36 OECD Americas ................................................................................................................................................. 36 OECD Europe .................................................................................................................................................... 38 OECD Asia Oceania ........................................................................................................................................... 38 Other stock developments ................................................................................................................... 39
Prices ....................................................................................................................................................... 42 Overview ............................................................................................................................................ 42 Futures markets .................................................................................................................................. 42 Spot crude oil prices............................................................................................................................. 44 Spot product prices.............................................................................................................................. 47 Freight ............................................................................................................................................... 49 Tables ........................................................................................................................................................ 50
List of boxes
Box 1. Trade slowdown weighs on fuel oil demand and helps IMO 2020 fuel switching........................ 5 Box 2. Saudi surprises with energy reshuffle ...................................................................................... 17 Box 3. US vies with Saudi for top oil exporter spot ............................................................................. 21 Box 4. Johan Sverdrup start-up to reverse Norwegian decline ............................................................ 24 Box 5. IMO for refiners: it is more of an opportunity than a challenge ................................................ 33 Box 6. Finding a way out .................................................................................................................... 44

Oil Market Report Market Overview
Page | 3 IEA
. All
right
s re
serv
ed.
Taking a breather The oil market focus recently has been on demand as growth weakens amidst uncertainty around the global economy, and particularly trade. In this Report, we maintain our growth estimate for 2019 at 1.1 mb/d, even though June data show that demand increased year-on-year by less than 0.2 mb/d. For the second half of 2019 we retain the view that with oil prices currently about 20% lower than a year ago there will be support for consumers. Early data for July suggest that global demand grew by 1.3 mb/d y-o-y.
In recent weeks, tensions in the Middle East Gulf have eased and oil industry operations appear to be normal. The major political event that has taken place is a personnel change in Saudi Arabia with the appointment as energy minister of Prince Abdulaziz bin Salman, who is a well-known and experienced figure. An early event for him is a meeting of the OPEC+ agreement monitoring committee that takes place in Abu Dhabi as we publish this Report. To date, support for the agreement rate has been high, but ahead of the meeting data for August show the compliance rate slipping to 116 per cent. In August, three major countries Russia, Nigeria and Iraq, produced 0.6 mb/d more than their allocations. Saudi Arabia, on the other hand, produced 0.6 mb/d less than allowed, and it is clearly the lynchpin of the whole deal. A reminder to the producers that competition for market share is getting tougher comes from preliminary data showing that in June the US momentarily overtook Saudi Arabia and Russia as the world’s number one gross oil exporter.
Our balances for 2H19 imply a stock draw of 0.8 mb/d, based on the assumption of flat OPEC production, stronger demand growth and weaker non-OPEC supply growth. However, this is only really a breather: the 2H19 non-OPEC growth, although modest by recent standards at “only” 1.3 mb/d, is measured against the high base set by the enormous production surge seen this time last year. So far in 2019, US crude oil production growth has stalled with June output only 45 kb/d higher than in December. Even so, output is still growing strongly on an annual basis, rising this year by 1.25 mb/d, with 1 mb/d of growth to come in 2020. In Norway, long-awaited projects are coming on stream earlier than expected and may ramp up to peak production ahead of schedule. Oil production in Brazil is growing fast, reaching 3 mb/d in August, 0.4 mb/d higher than just two months earlier.
While the relentless stock builds we have seen since early 2018 have halted, this is temporary. Soon, the OPEC+ producers will once again see surging non-OPEC oil production with the implied market balance returning to a signifcant surplus and placing pressure on prices. The challenge of market management remains a daunting one well into 2020.
Finally, in January the International Maritime Organisation’s new marine fuel regulations are being introduced. In Oil-2019: Analysis and Forecast to 2024, published in March, we concluded that markets will be generally prepared for the shift, assuming a certain initial level of non-compliance. In this Report, we have looked at the latest developments in demand and refining and we reaffirm our view of a relatively smooth start for the new rules. In line with this view, markets are not currently signalling significant increases in diesel prices, but this is an issue that will be monitored closely.
-2.0
-1.0
0.0
1.0
2.0
3.0
94
96
98
100
102
104
1Q18 3Q18 1Q19 3Q19 1Q20 3Q20
mb/dDemand/Supply Balance until end-2020
Stock Ch. & Misc (RHS) Demand Supply*
*OPEC crude output held steady at 29.7 mb/d from August 2019.

Oil Market Report Demand
Page | 4
IEA
. All
right
s re
serv
ed.
Demand
Overview In this Report, we have left unchanged our oil demand growth forecasts for 2019 and 2020 at 1.1 mb/d and 1.3 mb/d, respectively. Within the overall picture, May demand figures were revised up 135 kb/d compared with last month’s Report. Data for June showed very low growth but data for July showed a robust picture. Crude oil prices in August were about 15-20% below the year-ago levels and this will provide support to consumption later in the year and into 2020.
Global oil demand reached 99.9 mb/d in June, only 155 kb/d higher than last year. The increase was the third lowest year-on-year (y-o-y) growth figure seen since the start of the year. Consumption fell in the OECD, by 510 kb/d, and rose by 665 kb/d in non-OECD countries. Demand was lower in Europe, Latin America, the Middle East and India. Reduced deliveries of naphtha and fuel oil were particularly noticeable. By contrast, demand growth was robust in China (+750 kb/d), Russia (+95 kb/d) and in parts of Africa.
Preliminary figures for July point to stronger global demand growth of 1.3 mb/d y-o-y. There was a rebound in India (+155 kb/d), continuing strong deliveries in Russia (+300 kb/d) and higher demand in several other large economies. On the downside, growth in China was lower than
-0.5
0.0
0.5
1.0
1.5
2.0
2016 2017 2018 2019 2020
mb/dGlobal Oil Demand Growth, y-o-y
Europe China India US Total
0.0
0.5
1.0
1.5
2.0
2016 2017 2018 2019 2020
mb/dGlobal Oil Demand Growth, y-o-y
Non OECD OECD
Global Oil Demand (2018-2020) (million barrels per day)*
1Q18 2Q18 3Q18 4Q18 2018 1Q19 2Q19 3Q19 4Q19 2019 1Q20 2Q20 3Q20 4Q20 2020Africa 4.3 4.2 4.1 4.3 4.2 4.3 4.3 4.2 4.3 4.3 4.4 4.4 4.3 4.4 4.4Americas 31.5 31.6 32.3 32.0 31.9 31.5 31.8 32.5 32.3 32.0 31.5 32.1 32.8 32.6 32.3Asia/Pacif ic 35.5 35.0 34.6 35.4 35.1 35.8 35.5 35.4 36.6 35.8 36.7 36.4 36.2 37.5 36.7Europe 14.8 14.9 15.4 14.9 15.0 14.7 14.8 15.6 15.1 15.0 14.8 14.9 15.5 15.2 15.1FSU 4.5 4.6 4.9 4.8 4.7 4.6 4.8 5.1 5.0 4.9 4.7 4.9 5.1 5.0 4.9Middle East 8.1 8.4 8.7 8.2 8.3 8.1 8.2 8.6 8.1 8.3 8.0 8.3 8.7 8.1 8.3World 98.6 98.9 100.0 99.5 99.3 99.1 99.4 101.3 101.5 100.3 100.1 101.0 102.7 102.8 101.6Annual Chg (%) 2.0 0.5 1.3 0.6 1.1 0.5 0.5 1.3 2.0 1.1 1.0 1.7 1.4 1.3 1.3Annual Chg (mb/d) 1.9 0.5 1.3 0.6 1.1 0.4 0.5 1.3 2.0 1.1 1.0 1.6 1.4 1.3 1.3Changes from last OMR (mb/d) 0.0 0.0 0.0 0.0 0.0 0.0 -0.3 0.1 0.1 0.0 0.0 -0.1 -0.1 0.1 0.0* Including biofuels

Oil Market Report Demand
Page | 5
IEA
. All
right
s re
serv
ed.
seen recently (+300 kb/d). Total OECD consumption rose 170 kb/d y-o-y, with booming demand for LPG/ethane in the US a key factor.
In 1H19, global oil demand increased by 485 kb/d. In 2H19 we forecast an acceleration to 1.65 mb/d, helped by a weak base of demand in the second half of 2018, significantly lower oil prices y-o-y and robust petrochemical plant additions.
Box 1. Trade slowdown weighs on fuel oil demand and helps IMO 2020 fuel switching
The International Maritime Organisation’s decision to reduce sulphur emissions from bunker fuel led many analysts to warn about possible fuel shortages in 2020. Our report Oil 2019 – Analysis and Forecast to 2024, published in March, concluded that gasoil markets could face moderate shortages of 200-300 kb/d in 2020 and that prices could increase by about 20%. With fewer than four months left before the rule kicks in, we believe that the oil market is likely to be better supplied than we thought (See the Refining section for an analysis on bunker fuels supply).
Compared to our view in March that oil demand would grow by 1.4 mb/d this year, we now see growth of 1.1 mb/d. For 2020, our estimate has been reduced from 1.4 mb/d to 1.3 mb/d. In the first seven months of 2019, global fuel oil demand fell by 225 kb/d y-o-y, the biggest fall for any oil product. The worsening economic outlook and weaker trade growth are key factors. The decline was seen in bunker hubs such as China (-30 kb/d), Singapore (-75 kb/d), Korea (-50 kb/d), and the Netherlands (-10 kb/d) as well as in countries that consume fuel oil for power generation.
Global Demand by Product (thousand barrels per day)
3Q18 4Q18 1Q19 4Q18 1Q19 4Q18 1Q19LPG & Ethane 12 129 12 465 13 077 300 203 2.5 1.6Naphtha 6 475 6 608 6 811 - 133 67 -2.0 1.0Motor Gasoline 26 632 26 259 25 658 365 94 1.4 0.4Jet Fuel & Kerosene 8 091 7 825 7 973 126 133 1.6 1.7Gas/Diesel Oil 28 288 28 862 28 295 100 296 0.3 1.1Residual Fuel Oil 6 760 6 523 6 601 - 180 - 164 -2.7 -2.4Other Products 11 579 10 984 10 672 43 - 180 0.4 -1.7Total Products 99 953 99 526 99 086 621 448 0.6 0.5
Annual Chg (kb/d) Annual Chg (%)Demand
0.0
0.5
1.0
1.5
2.0
2.5
3.0
3.5
1Q2019 3Q2019 1Q2020 3Q2020
mb/dIEA Marine Bunker Demand Forecasts
HSFO Gasoil VLSFO
700
750
800
850
900
950
1 000
Jan-18 May-18 Sep-18 Jan-19 May-19
Singapore Bunker Fuel Demandkb/d

Oil Market Report Demand
Page | 6
IEA
. All
right
s re
serv
ed.
We now expect that overall bunker fuel demand will grow by just 0.4% in 2019 and 3.7% in 2020. The expected recovery next year is mainly due to the lower density of gasoil relative to fuel oil, meaning that more fuel will be needed to produce the same amount of energy. So, most of the growth in 2020 will come from this volumetric expansion rather than an underlying increase in transport demand and “real” bunker fuel demand is expected to remain sluggish.
Our fuel switching assumptions remain little changed from the Oil 2019 report. We forecast marine gasoil sales to increase by 900 kb/d y-o-y in 4Q19 as shippers begin to transition away from fuel oil and by another 1.1 mb/d in 1Q20. High sulphur fuel oil (HSFO) demand will fall 1.2 mb/d in 4Q19 and 1.9 mb/d in 1Q20, whereas very low sulphur fuel oil demand will grow by 150 kb/d in 4Q19 and 200 kb/d in 1Q20. Scrubber installations are proceeding as we forecast and will help maintain some HSFO demand. We expect 2 500 scrubbers to have been installed by the end of 2019 and nearly 4 000 by end-2020, consuming a total of 510 kb/d and 820 kb/d of HSFO, respectively.
Fundamentals The economic forecasts used in this Report remain largely unchanged. International trade relations have further deteriorated in the past few weeks, but US and Chinese officials announced that they would resume trade negotiations in early October. Trade disputes and rising uncertainty about the impact of the UK’s possible exit from the European Union are reducing global growth through lower business and consumer confidence, supply chain re-assessments, declining investment and direct reduction of trade. While container trade has remained quite buoyant, the CPB Netherlands Bureau for Economic Policy Analysis shows that the volume of world trade contracted by 0.3% y-o-y in 1Q19 and 0.7% in 2Q19.
World industrial production growth slowed sharply, from 4.1% at the start of 2018 to 0.6% in June. It has been impacted by rising uncertainty, forcing companies to hold their hiring and investment plans in order to reduce risk. A resolution of trade disputes could have a quick and strong impact on economic activity.
China’s advanced indicators were mixed in August. The Caixin industrial PMI rose to 50.4 from 49.9 in July, whereas China’s NBS PMI contracted to 49.5 from 49.7 in July. The NBS PMI is
-4.0%
-2.0%
0.0%
2.0%
4.0%
6.0%
8.0%
10.0%
2015 2016 2017 2018 2019
Evolution in Global Trade Indices
CPB World trade index RWI/ISL Index (Containers)
0.0%0.5%1.0%1.5%2.0%2.5%3.0%3.5%4.0%4.5%
2015 2016 2017 2018 2019
World Industrial Production Index
CPB World Industrial production index

Oil Market Report Demand
Page | 7
IEA
. All
right
s re
serv
ed.
more oriented toward big companies and state-owned enterprises, while the Caixin PMI has a larger coverage of small and medium size companies. The Caixin services PMI rose to a three month high of 52.1 in August. Trade data are not encouraging, however, with China’s exports showing a decline of 1% y-o-y in August and imports lower by 5.6%. The Central Bank announced at the start of September that it was providing $125 billion more credit to banks.
The US economy is not immune to the global downturn. Industrial production growth has fallen steadily since its peak of 5.4% in September 2018, and was only 0.5% in July. Advanced indicators are not encouraging and the US Institute for Supply Management (ISM) manufacturing index fell to 49.1 in August, its lowest level since January 2016. Export dependent economies in Europe are also suffering. The German manufacturing sector continues to show signs of weakness, with factory production dropping by 0.6% m-o-m in July. Manufacturing orders fell 2.7% m-o-m in July. Orders from non-Eurozone countries dropped by 7%. German GDP contracted by 0.1% q-o-q in 2Q19 on weak exports and could decline again in 3Q19.
India is another country where growth appears to be slowing rapidly. GDP growth fell to 5% in 2Q19 after a disappointing 5.8% in 1Q19. This compares with y-o-y growth of 8% in 2Q18. Private consumption growth fell to 3.1% y-o-y in 2Q19 from 7% y-o-y in 1Q19. The automotive sector illustrates the sharp slowdown in demand, with car sales falling by more than 30% y-o-y in July and 40% in August.
Our oil price assumption for 2019 is slightly lower in this Report at $62.8/bbl, reflecting future prices that are 11.5% below the 2018 average of $71/bbl. While the oil price -being relatively close to last year’s level- had little impact on demand in the first half of the year, significantly lower y-o-y prices from June provide support to our 2H19 forecast.
OECD
OECD oil demand remained weak in June, posting a 510 kb/d y-o-y decline after a drop of 730 kb/d in May. For July, provisional data point to growth of 170 kb/d. Gasoil demand has been particularly impacted by slowing economic activity, declining by 165 kb/d y-o-y in 2Q19.
Residual fuel oil demand posted a sharp y-o-y decline in 2Q19 (140 kb/d), possibly reflecting bunker retailers’ preparations for the IMO 2020 switch and also because of lower trade activity.
44.545.045.546.046.547.047.548.048.5
Jan Mar May Jul Sep Nov
mb/dOECD Oil Products Demand
Range 2014-2018 2018
2019 5-year avg
12.5
13.0
13.5
14.0
Jan Mar May Jul Sep Nov
mb/dOECD Gasoil/Diesel Demand
Range 2014-2018 20182019 5-year avg

Oil Market Report Demand
Page | 8
IEA
. All
right
s re
serv
ed.
Naphtha demand remained subdued in 2Q19 because of spring maintenance at several petrochemical facilities and competition from US LPG and ethane.
OECD Americas
June US data were unavailable at the time of publication and are therefore estimated, based on weekly Department of Energy statistics. We estimate that US gasoline demand was 150 kb/d lower than last year. This figure is more or less in line with vehicle miles travelled (VMT) for June which fell 0.3% y-o-y, as reported by the Office of Highway Policy Information. It is likely that lower gasoline prices from June onwards supported travel in July and August.
Gasoil demand, by contrast, rose 70 kb/d y-o-y in June, but this was from a weak base in June 2018. Consumption remained low in July and August. US industrial production growth has weakened reducing diesel demand. However, the American Trucking Association truck tonnage index rose by 7.3% y-o-y in July, the largest gain since April. Jet and kerosene demand was 45 kb/d lower. US revenue passenger kilometres (RPK) growth declined from 4.7% in May to 3.1% in June.
LPG/ethane demand growth is set to accelerate in the second half of 2019 to 105 kb/d y-o-y, as several petrochemical projects start or ramp up production. These include the Indorama ethane
1.8
1.9
2.0
2.1
2.2
2.3
2.4
2.5
Jan Mar May Jul Sep Nov
kb/dOECD Residual Fuel Demand
Range 2014-2018 20182019 5-year avg
3.03.13.23.33.43.53.63.7
Jan Mar May Jul Sep Nov
kb/dOECD Naphtha Demand
Range 2014-2018 20182019 5-year avg
OECD Demand based on Adjusted Preliminary Submissions - July 19(million barrels per day)
mb/d % pa mb/d % pa mb/d % pa mb/d % pa mb/d % pa mb/d % pa mb/d % pa mb/d % paOECD Americas 11.36 -0.3 2.19 3.4 4.47 -3.7 0.50 3.6 3.66 4.9 0.62 -7.4 3.11 5.0 25.91 0.6 US* 9.65 -0.5 1.89 4.3 3.76 -3.3 0.14 3.0 2.83 6.1 0.38 -8.8 2.39 4.2 21.05 0.6 Canada 0.91 0.6 0.18 -4.1 0.26 2.5 0.29 -2.2 0.41 1.0 0.05 10.4 0.48 1.8 2.58 0.6 Mexico 0.71 0.6 0.09 0.0 0.28 -19.6 0.06 45.0 0.36 0.4 0.17 -9.5 0.21 23.2 1.89 -1.0OECD Europe 2.07 -0.4 1.68 0.0 5.32 0.3 1.33 13.8 1.18 1.7 0.89 -3.8 2.48 -0.6 14.96 0.9 Germany 0.49 -2.8 0.24 -2.4 0.81 2.7 0.35 46.9 0.12 3.2 0.06 -8.1 0.37 -6.4 2.44 3.6 United Kingdom 0.28 -0.2 0.30 -3.9 0.51 -1.3 0.15 10.4 0.14 5.3 0.02 2.7 0.15 9.0 1.56 1.0 France 0.23 10.1 0.19 -1.9 0.76 2.3 0.23 9.7 0.12 3.1 0.05 -11.6 0.30 3.9 1.87 3.5 Italy 0.15 -18.1 0.14 0.0 0.49 0.8 0.09 6.2 0.09 1.3 0.08 1.1 0.30 1.5 1.32 -1.4 Spain 0.14 5.0 0.18 3.5 0.53 3.7 0.13 -1.5 0.06 -19.7 0.15 -1.6 0.19 7.3 1.38 1.9OECD Asia & Oceania 1.52 -4.2 0.72 2.4 1.41 0.5 0.44 -1.8 0.73 3.2 0.44 -11.5 2.38 -1.4 7.64 -1.6 Japan 0.86 -7.2 0.31 0.0 0.47 1.9 0.26 -3.0 0.32 -11.4 0.26 -4.5 0.95 1.3 3.43 -3.0 Korea 0.22 -4.5 0.17 8.4 0.37 -1.3 0.12 4.8 0.33 23.5 0.15 -24.2 1.22 -4.0 2.57 -1.2 Australia 0.32 3.3 0.17 0.7 0.50 0.3 0.00 -142.9 0.07 1.2 0.01 13.9 0.13 3.2 1.20 1.9OECD Total 14.95 -0.7 4.59 2.0 11.20 -1.3 2.27 8.2 5.57 4.0 1.95 -6.8 7.97 1.2 48.51 0.4* Including US territories
RFO OtherOther Gasoil Total ProductsGasoline Jet/Kerosene Diesel LPG/Ethane

Oil Market Report Demand
Page | 9
IEA
. All
right
s re
serv
ed.
cracker (420 kt/y) which started operations in May, the Lotte/Westlake cracker (1 000 kt/y), which delayed its start-up to July, as well as the Shintech (500 kt/y), Sasol (1 550 kt/y) and Formosa (1 250 kt/y) projects expected in 2H19.
Canadian data showed an increase of 35 kb/d in total oil demand in June, supported by strong LPG deliveries. Gasoil demand was, however, reported to be 50 kb/d below last year’s level. Canada’s industrial production growth slowed to 1.4% y-o-y in June, from 2.9% in May.
Mexico also reported weak gasoil demand in July, down by 45 kb/d y-o-y during the month. Gasoline demand was up 5 kb/d.
Overall, OECD Americas demand is expected to grow by 195 kb/d in 2019, roughly half the growth seen in 2018. LPG/ethane demand will be supported by petrochemical projects coming on stream in the US in 2H19. Demand growth in 2020 is projected at a similar level of 195 kb/d, of which 170 kb/d will be LPG/ethane.
OECD Europe
OECD Europe demand fell 380 kb/d y-o-y in June, the continuation of several months of weak performance. Diesel, the mainstay of Europe’s consumption, was particularly weak, falling 210 kb/d y-o-y as a result of slowing industrial activity and the disaffection of European drivers for diesel cars. Naphtha demand declined by 135 kb/d y-o-y in June. However, provisional data pointed to a rebound in July for total demand of 140 kb/d. Naphtha demand is set to increase following the end of the spring turnaround season.
German oil demand declined by 25 kb/d in June but grew by 85 kb/d in July, according to provisional data. Very strong y-o-y increases in heating oil deliveries (from a very weak 2018 base) supported gasoil in both months. Lower oil prices are likely to further support heating fuel deliveries in 2H19.
Oil demand in the Netherlands declined sharply in June. Naphtha demand fell as some crackers were slow to restart after the spring maintenance (Shell Moerdijk) and others experienced unplanned outages (Sabic Geleen). In addition, sales of bunker fuel oil fell sharply in both May and June, possibly reflecting suppliers’ preparation ahead of the IMO 2020 switch and the trade slowdown.
23.6
24.1
24.6
25.1
25.6
26.1
Jan Mar May Jul Sep Nov
mb/dOECD Americas Oil Products Demand
Range 2014-2018 2018
2019 5-year avg
9.910.110.310.510.710.911.111.311.5
Jan Mar May Jul Sep Nov
kb/dOECD Americas Gasoline Demand
Range 2014-2018 20182019 5-year avg

Oil Market Report Demand
Page | 10
IEA
. All
right
s re
serv
ed.
French oil demand was flat y-o-y in June but rose by 65 kb/d y-o-y in July, according to provisional data. Diesel consumption fell by 35 kb/d in June but growth bounced back to 20 kb/d in July, supported by demand for transport during the summer holidays.
OECD Europe demand is likely to decline by just 10 kb/d in 2019, and increase by 60 kb/d in 2020, supported by lower prices and a small rebound in economic activity.
OECD Asia Oceania
After a fall of 400 kb/d y-o-y in May and 180 kb/d in June, demand in OECD Asia Oceania dropped by a further 120 kb/d, according to provisional data. Naphtha returned to growth following the end of cracker maintenance and diesel deliveries increased, but gasoline consumption declined.
Korean oil product demand showed some improvement in July. It fell by 30 kb/d y-o-y after a drop of 170 kb/d in June. Naphtha demand rose by 25 kb/d y-o-y and LPG demand by 60 kb/d.
Japan’s oil demand rose by 45 kb/d y-o-y in June but declined by 105 kb/d in July. Revised data show that consumption fell by 230 kb/d in 1Q19 (of which 50 kb/d was due to lower kerosene demand caused by high temperatures) and 50 kb/d y-o-y in 2Q19. Growth in June was supported by strong naphtha demand after the completion of plant maintenance.
12.7
13.2
13.7
14.2
14.7
Jan Mar May Jul Sep Nov
mb/dOECD Europe Oil Products Demand
Range 2014-2018 2018
2019 5-year avg
0.8
0.9
1.0
1.1
1.2
Jan Mar May Jul Sep Nov
kb/dOECD Europe Naphtha Demand
Range 2014-2018 20182019 5-year avg
0.8
0.8
0.9
0.9
1.0
Jan Mar May Jul Sep Nov
mb/dNetherlands Oil Products Demand
Range 2014-2018 2018
2019 5-year avg
0.9
1.0
1.0
1.1
1.1
1.2
1.2
Jan Mar May Jul Sep Nov
mb/dGermany Gasoil/Diesel Demand
Range 2014-2018 20182019 5-year avg

Oil Market Report Demand
Page | 11
IEA
. All
right
s re
serv
ed.
OECD Asia Oceania oil demand is expected to decline by 110 kb/d in 2019. In the first half of the year, warmer than usual weather and slowing economic activity resulted in a 285 kb/d decline in demand in 1H19. Looking ahead to 2020, demand is expected to grow by 65 kb/d.
Non-OECD Oil demand in non-OECD countries increased by 665 kb/d y-o-y in June and was up 845 kb/d on average in the first half of 2019. Consumption grew faster in 1H19 than during the same period in 2018, due to increased demand in China (+545 kb/d versus 255 kb/d in 1H18), despite a notable slowdown in India (+135 kb/d versus 310 kb/d in 1H18). Demand growth in Latin America, the Former Soviet Union and the Middle East was more or less the same in 1H19. On a product basis, transport fuels such as gasoil/diesel (+260 kb/d y-o-y) and gasoline (+315 kb/d y-o-y) continued to grow at a steady pace, but LPG/ethane, naphtha and fuel oil fared less well.
Demand figures for June were 240 kb/d lower than published in last month’s Report, due to revised data from Saudi Arabia, Chinese Taipei and Hong Kong, and several others. In July, non-OECD oil demand growth accelerated to 1.1 mb/d y-o-y, the fastest rate seen for five months, on the back of higher demand in Brazil, China, India, Indonesia and Russia. Even so, consumption growth in both China and India disappointed, according to preliminary figures.
2.3
2.4
2.5
2.6
2.7
2.8
Jan Mar May Jul Sep Nov
mb/dKorea Oil Products Demand
Range 2014-2018 2018
2019 5-year avg
3.3
3.8
4.3
4.8
Jan Mar May Jul Sep Nov
mb/dJapan Oil Products Demand
Range 2014-2018 2018
2019 5-year avg
9.8
10.3
10.8
11.3
11.8
Jan Mar May Jul Sep Nov
mb/dNon OECD Gasoline Demand
Range 2014-2018 20182019 5-year avg
4.44.54.64.74.84.95.05.15.2
Jan Mar May Jul Sep Nov
mb/dNon OECD Residual Fuel Demand
Range 2014-2018 20182019 5-year avg

Oil Market Report Demand
Page | 12
IEA
. All
right
s re
serv
ed.
Non-OECD oil demand is expected to grow by a robust 1 mb/d y-o-y in 3Q19 and 1.3 mb/d in 4Q19, with 2019 as a whole seeing growth of 990 kb/d. This will represent nearly 93% of total global growth.
China
Chinese apparent oil demand, an estimate based on refinery output, trade flows and oil stocks in the absence of recorded deliveries, rose 300 kb/d y-o-y in July, the latest month for which figures are available. The largest gains were seen for gasoil/diesel (+200 kb/d y-o-y) and LPG/ethane (+185 kb/d y-o-y), whereas naphtha (-80 kb/d y-o-y) and fuel oil consumption (-155 kb/d y-o-y) declined. Naphtha and fuel oil both underperformed, a phenomenon also seen elsewhere. Apparent gasoline demand was up 75 kb/d y-o-y during the month, despite much higher exports (+75%) y-o-y.
Despite ongoing speculation about the health of its economy, China’s apparent oil demand increased 545 kb/d in the first half of 2019, higher than the 255 kb/d y-o-y rate registered in 1H18. Consumption is forecast to rise by 450 kb/d y-o-y during 2H19, although less than in 2H18. Overall, we expect an average increase in oil deliveries of 500 kb/d in 2019, on a par with the level seen in 2018.
10.210.711.211.712.212.713.213.7
Jan Mar May Jul Sep Nov
mb/dChina Oil Products Demand
Range 2014-2018 2018
2019 5-year avg
2.1
2.3
2.5
2.7
2.9
3.1
3.3
Jan Mar May Jul Sep Nov
mb/dChina Gasoline Demand
Range 2014-2018 20182019 5-year avg
China: Demand by Product(thousand barrels per day)
2018 2019 2020 2019 2020 2019 2020LPG & Ethane 1 620 1 700 1 795 80 95 4.9 5.6Naphtha 1 268 1 308 1 372 40 64 3.2 4.9Motor Gasoline 2 984 3 130 3 187 146 57 4.9 1.8Jet Fuel & Kerosene 812 867 930 54 64 6.7 7.4Gas/Diesel Oil 3 355 3 447 3 514 91 68 2.7 2.0Residual Fuel Oil 432 391 341 - 41 - 50 -9.6 -12.8Other Products 2 503 2 626 2 629 123 3 4.9 0.1Total Products 12 975 13 468 13 768 493 301 3.8 2.2
Demand Annual Chg (kb/d) Annual Chg (%)

Oil Market Report Demand
Page | 13
IEA
. All
right
s re
serv
ed.
India
Indian oil demand increased by 155 kb/d y-o-y in July, recovering from an 80 kb/d y-o-y decline in June. Transport fuels such as diesel (+50 kb/d y-o-y) and gasoline (+55 kb/d) showed increases, and naphtha, which has been on a downward trend in recent months, saw demand fall once again, by 20 kb/d. The overall rate of growth is down from last year, when Indian consumption rose 200 kb/d on average. Total oil demand rose 135 kb/d during 1H19, less than half the rate seen in 1H18.
Indian vehicle sales fell by 31% y-o-y in July – the ninth consecutive monthly decrease – and by an even steeper 41% in August. Diesel demand growth slowed to 50 kb/d in 1H19, down from 105 kb/d in 1H18. Gasoline consumption, meanwhile, rose by 60 kb/d y-o-y in 1H19, on a par with the growth seen in 1H18.
Indian oil consumption is forecast to increase by 225 kb/d in the second half of 2019, a slight acceleration from 1H19. Growth will average 180 kb/d in 2019, down from the 200 kb/d pace seen in both 2017 and 2018.
Other Non-OECD Oil demand in the Middle East fell in July by 140 kb/d y-o-y, the fifth consecutive monthly decrease, with reductions seen in Iran and Saudi Arabia. During the first half of the year, demand decreased by 75 kb/d, and it is expected to decline by 60 kb/d overall in 2019.
1.2
1.3
1.4
1.5
1.6
1.7
1.8
Jan Mar May Jul Sep Nov
mb/dIndia Gasoil/Diesel Demand
Range 2014-2018 20182019 5-year avg
150
200
250
300
350
Jan Mar May Jul Sep Nov
Units (,000)
India Passenger Car Sales
Range 14-18 2018
2019 5-year avg
India: Demand by Product(thousand barrels per day)
2018 2019 2020 2019 2020 2019 2020LPG & Ethane 782 824 859 42 34 5.4 4.2Naphtha 324 318 333 - 6 14 -1.9 4.5Motor Gasoline 676 727 761 50 34 7.4 4.7Jet Fuel & Kerosene 252 254 271 2 17 0.7 6.8Gas/Diesel Oil 1 728 1 793 1 871 64 78 3.7 4.4Residual Fuel Oil 150 148 146 - 3 - 1 -1.8 -0.9Other Products 949 979 1 030 30 51 3.2 5.2Total Products 4 863 5 042 5 271 180 228 3.7 4.5
Demand Annual Chg (kb/d) Annual Chg (%)

Oil Market Report Demand
Page | 14
IEA
. All
right
s re
serv
ed.
Saudi Arabia saw consumption fall by 25 kb/d y-o-y in June, with falls in gasoil/diesel, gasoline and other products after a drop of 420 kb/d in May. Total oil demand will fall 50 kb/d y-o-y on average in 2019. The region’s economy has suffered this year from lower oil prices. In the case of Iran, US sanctions on oil exports have damaged the economy with oil demand falling 55 kb/d y-o-y in July and by 10 kb/d on average in 1H19.
Consumption in Latin America was up 55 kb/d y-o-y in July, a rare increase following the average 40 kb/d decline seen in 1H19. The July figure was boosted by strong growth in Brazil (+155 kb/d), which saw much higher demand for transport fuels such as gasoline and gasoil/diesel. By contrast, demand is likely to have fallen heavily in Venezuela as the economic situation continued to deteriorate, although no official figures have been published. We forecast that oil products demand will decline by an average 130 kb/d in 2019.
Russia’s oil demand continued to surprise to the upside in July, rising by 300 kb/d y-o-y with gains across all major products. Demand increased by 115 kb/d in the first half of 2019 and is forecast to rise by the same amount for the year as a whole. If realised, this would be Russia’s fastest demand growth since 2014.
In Singapore, oil consumption fell 10 kb/d y-o-y in July and was down 45 kb/d in the first half of 2019 as a result of reduced bunker fuel sales. Lower fuel oil demand has not been offset by higher deliveries of marine gasoil, suggesting that trade, rather the upcoming International Maritime Organisation regulation on sulphur, is responsible. GDP growth is expected to slow dramatically in 2019 due to the wider slowdown in trade and rising trade tariffs between China and the US.
Non-OECD: Demand by Product(thousand barrels per day)
3Q18 4Q18 1Q19 4Q18 1Q19 4Q18 1Q19LPG & Ethane 6 781 6 820 6 960 156 204 2.3 3.0Naphtha 3 135 3 280 3 275 158 110 5.1 3.5Motor Gasoline 11 706 11 767 11 641 399 144 3.5 1.2Jet Fuel & Kerosene 3 543 3 354 3 477 145 144 4.5 4.3Gas/Diesel Oil 14 766 14 981 14 510 86 135 0.6 0.9Residual Fuel Oil 4 721 4 566 4 609 - 25 - 75 -0.5 -1.6Other Products 7 118 6 967 7 118 140 210 2.1 3.0Total Products 51 770 51 735 51 589 1 060 871 2.1 1.7
Demand Annual Chg (kb/d) Annual Chg (%)

Oil Market Report Supply
Page | 15
IEA
. All
right
s re
serv
ed.
Supply
Overview A post-hurricane rebound in the US raised global oil supply by 530 kb/d in August, the fourth straight month with production topping the 100 mb/d mark. At 100.7 mb/d, output was nonetheless down nearly 800 kb/d on a year ago due to sharp reductions linked to sanctions and OPEC+ cuts. OPEC oil output during August was 2.4 mb/d lower than the previous year, while non-OPEC supply was up 1.6 mb/d year-on-year (y-o-y).
During August, the US turned in the biggest increase with supply up 520 kb/d month-on-month (m-o-m). Russia and Saudi Arabia delivered combined gains of 240 kb/d. Strong growth in the US is enabling it to challenge Saudi Arabia and Russia for the rank as the world’s biggest oil exporter (see US vies with Saudi for top oil exporter spot).
The US expansion, along with big gains from Norway and Brazil, is expected to boost non-OPEC growth from 1.9 mb/d this year to nearly 2.3 mb/d in 2020. As for OPEC, newly appointed Saudi Energy Minister Prince Abdulaziz bin Salman assured markets there would be no radical change in oil policy (see Saudi surprises with energy reshuffle). During August, higher Saudi production, record Iraqi flows and increased supply from Nigeria lifted OPEC’s crude oil output by 50 kb/d to 29.74 mb/d.
Despite the m-o-m increase, Saudi Arabia continues to cut far more than promised under the OPEC+ pact and August marked the sixth month in a row of outperformance. Compliance, however, eased to 116% during August from 130% the previous month with Iraq, Nigeria and Russia producing 650 kb/d above their allocations.
Our current balances show the market is tightening in 2H19 with the call on OPEC crude averaging 30.5 mb/d, which is higher than current production. However, due to an expected surge in non-OPEC production at the end of this year and into 2020, the requirement for OPEC crude will plunge in 1H20 to 28.3 mb/d - 1.4 mb/d below what the group produced during August.
-2.0
-1.0
0.0
1.0
2.0
3.0
4.0
Jan 17 Jul 17 Jan 18 Jul 18 Jan 19 Jul 19
mb/d
OPEC and Non-OPEC Oil Supply Year-on-Year Change
OPEC Crude Non-OPECOPEC NGLs Total Supply
27
28
29
30
31
32
33
1Q18 3Q18 1Q19 3Q19 1Q20 3Q20
mb/d Call on OPEC Crude
Actual/assumed* OPEC output Call on OPEC*Holds OPEC production steady at August level

Oil Market Report Supply
Page | 16
IEA
. All
right
s re
serv
ed.
OPEC crude oil supply OPEC crude output edged up from a five-year low to reach 29.74 mb/d in August, as Saudi Arabia pumped more, Iraq hit a new record high and Nigeria increased output. Despite the 50 kb/d m-o-m increase, members of the OPEC+ supply deal cut more than agreed for the sixth month running. Although Iraq and Nigeria produced far more than promised, compliance in August remained robust because Saudi Arabia continued to cut much more than agreed. That strong commitment is expected to be upheld by newly appointed Energy Minister Prince Abdulaziz.
Saudi Arabia’s outperformance, combined with losses in Iran and Venezuela due to sanctions, left OPEC crude oil output in August trailing 2.4 mb/d below the previous year. Iranian production eased further in August, with supply down 1.4 mb/d on a year ago. Output in Venezuela, relatively steady m-o-m, was 520 kb/d below a year ago. Supply from Saudi Arabia was running 670 kb/d lower than August 2018. Nigeria, Iraq and Libya between them pumped 400 kb/d more than the previous year. OPEC’s effective spare capacity in August was 3.2 mb/d, with Saudi Arabia holding 2.3 mb/d, or 71%.
OPEC / Non-OPEC Output1
(million barrels per day)
Jul 2019 Aug 2019 AugustSupply Supply Compliance
Algeria 1.03 1.02 1.06 0.032 116% 104% 1.05 0.03Angola 1.34 1.35 1.53 0.047 379% 254% 1.50 0.15Congo 0.34 0.34 0.33 0.010 -150% -175% 0.35 0.01Ecuador 0.54 0.54 0.52 0.016 -100% -45% 0.54 0.00Equatorial Guinea 0.12 0.12 0.13 0.004 175% 394% 0.12 0.00Gabon 0.22 0.22 0.19 0.006 -550% -529% 0.20 -0.02Iraq 4.78 4.81 4.65 0.141 -111% -57% 4.90 0.09Kuwait 2.67 2.64 2.81 0.085 199% 141% 2.93 0.29Nigeria3 1.80 1.84 1.65 0.053 -358% -160% 1.79 -0.05Saudi Arabia 9.65 9.75 10.63 0.322 274% 241% 12.02 2.27UAE 3.07 3.06 3.17 0.096 113% 116% 3.39 0.33Total OPEC 11 25.56 25.69 26.66 0.812 120% 117%Iran4 2.23 2.19 3.85 -Libya4 1.09 1.06 1.10 0.04Venezuela4 0.81 0.80 0.80 0.00Total OPEC 29.69 29.74 34.54 3.21Azerbaijan 0.78 0.75 0.80 0.020 235% 136%Kazakhstan 2.01 1.90 2.03 0.040 329% 273%Mexico 1.91 1.90 1.99 0.040 234% 202%Oman 0.98 0.98 1.00 0.025 98% 99%Russia 11.49 11.63 11.75 0.230 53% 74%Others7 1.19 1.22 1.23 0.028 7% -31%Total Non-OPEC 18.34 18.37 18.79 0.383 110% 105%
Total OPEC+ 43.90 44.06 45.46 1.195 116% 114%
1 OPEC figures are crude oil only, Non-OPEC figures are total oil supply (including NGLs). 4 Iran, Libya, Venezuela exempt from cuts.2 Based on Oct-2018 production, except for Azerbaijan and Kuwait based on Sept-2018 5 Capacity can be reached in 90 days and sustained for extended period. and Kazakhstan Nov-2018. Non-OPEC supply baseline based on IEA estimates 6 Spare capacity excludes Iranian crude offline due to sanctions.3 Nigeria supply based on IEA estimates, which exclude Akpo and Agbami condensates. 7 Bahrain, Brunei, Malaysia, Sudan and South Sudan
Agreed CutSupply
Baseline2 Average
Compliance
Sustainable Production Capacity5
Spare Capacity vs Aug Supply6

Oil Market Report Supply
Page | 17
IEA
. All
right
s re
serv
ed.
Box 2. Saudi surprises with energy reshuffle
Saudi King Salman appointed his son Prince Abdulaziz as energy minister in early September, placing a member of the ruling Al Saud family in charge of oil policy for the first time. The prince, a veteran energy ministry official, replaces Khalid al-Falih, who was removed as chairman of Saudi Aramco and stripped of his supervisory role in industrial development the previous week. Half-brother to Crown Prince Mohammed bin Salman, the prince most recently served as minister of state for energy affairs. He is a longstanding member of the Saudi delegation to OPEC, having joined the oil ministry in the 1980s.
Prince Abdulaziz, who helped forge the existing OPEC+ deal, has said there will be no drastic change in Saudi oil policy. Its commitment to the OPEC+ agreement has seen Saudi Arabia cut production below 10 mb/d. During August, Saudi Arabia turned in the largest output increase within OPEC with crude supply rising 100 kb/d to 9.75 mb/d. Despite the higher flows, output was still 560 kb/d below its target. The kingdom had previously signaled its intention to keep production under 10 mb/d and exports below 7 mb/d through September to help draw down inventories. Saudi Aramco shipped 6.6 mb/d of crude to world markets during August, up 100 kb/d m-o-m, according to Kpler data.
As Saudi Arabia gears up to sell shares in Aramco, it named Yasir al-Rumayyan, head of the sovereign wealth fund, as chairman of Aramco in place of al-Falih. The previous ministry structure has been reformed: Prince Abdulaziz heads the Ministry of Energy and Bandar Al-Khorayef, an investor and industrialist, was appointed as head of the new Ministry for Industry and Mineral Resources.
29
30
31
32
33
34
Jan Mar May Jul Sep Nov Jan
mb/dOPEC Crude Supply
2014 2015 20162017 2018 2019
-3
-2
-1
0
1
2
Aug 18 Dec 18 Apr 19 Aug 19
mb/dOPEC Crude Supply
Annual Change
Iran Venezuela Saudi NigeriaLibya Other Iraq Total OPEC
9.259.509.75
10.0010.2510.5010.7511.0011.25
Jan Mar May Jul Sep Nov Jan
mb/dSaudi Arabia Crude Supply
2014 2015 20162017 2018 2019

Oil Market Report Supply
Page | 18
IEA
. All
right
s re
serv
ed.
Elsewhere in the Gulf, supply from the UAE dipped 10 kb/d to 3.06 mb/d but was up 80 kb/d on a year ago. As part of its effort to boost capacity, the Abu Dhabi National Oil Co has ordered $3.6 billion worth of wells and drilling material as part of a broader $15 billion drilling-related spending plan over the next five years. Production in Kuwait eased 30 kb/d to 2.64 mb/d – the lowest in eight years. To help raise capacity, the Ratqa oil field is due to start pumping heavy crude in February 2020 with production gradually ramping up to around 75 kb/d.
Iraq hit a fresh record in August as production rose 30 kb/d m-o-m to 4.81 mb/d, including the Kurdistan Regional Government (KRG). Output from the core southern oil fields edged up, supporting higher shipments of Basra crude. Total exports were relatively steady at just above 4 mb/d. Exports from the south increased by 35 kb/d to 3.5 mb/d. Oil sales from the north via Kurdistan eased by 30 kb/d to around 530 kb/d. Iraq has resumed the delivery of oil to Jordan by truck, with volumes set to rise gradually to 10 kb/d. Trucking had ceased in 2014 after the situation in western Iraq grew increasingly insecure.
Iraq is negotiating a subsea pipeline project with Eni and BP that is needed to rehabilitate its ageing southern export system. The project, estimated to be worth around $400 million, involves building a new 1 mb/d pipeline connecting the main storage depot at Fao to the offshore Basra Oil Terminal and replacing an idled pipeline that ships crude to the Khor al-Amaya terminal.
Crude production in Iran fell a further 40 kb/d in August to 2.19 mb/d, hovering at a 30-year low. As the US seeks to eliminate oil exports, shipments fell 170 kb/d m-o-m to 200 kb/d. By comparison, exports were running at 2.1 mb/d in August 2018.
To put further pressure on exports, the US has sanctioned vessels, companies and individuals it claims are facilitating Iranian oil trade and warned the global maritime industry to avoid doing business with them. In the three months since the US ended waivers to eight of Iran’s major customers, China and Turkey appear to be the only remaining buyers. Iran was reported to be storing oil on 26 tankers at the end of August, up from 23 at the end of July, according to EA Gibson data. That is nearing an historic high of 28 vessels in 2016.
Production in Nigeria rose 40 kb/d during August to reach 1.84 mb/d, the highest level since October 2015. Despite the risk of renewed violence, production has risen steadily since the start of the year after the offshore Egina oil field came online and ramped up to its 200 kb/d plateau rate. President Muhammadu Buhari has meanwhile appointed Timipre Sylva as minister of
0.0
0.5
1.0
1.5
2.0
2.5
3.0
Aug-18 Nov-18 Feb-19 May-19 Aug-19
mb/dIranian Oil Exports
China India Korea Japan Europe Other
Source: Kpler
0.00
0.25
0.50
0.75
1.00
1.25
1.50
1.75
2.00
Nov15 Aug16 May17 Feb18 Nov 18 Aug 19
mb/dNigeria Surges, Libya Dips
Nigeria Libya

Oil Market Report Supply
Page | 19
IEA
. All
right
s re
serv
ed.
state for petroleum in a new cabinet that marks his second term. Sylva, a former governor of Bayelsa state in the Niger Delta oil heartland, replaces Emmanuel Kachikwu.
Crude supply in Libya edged 30 kb/d lower to 1.06 mb/d after the El Sharara field remained offline until 8 August due to sabotage. Output at the 300 kb/d field has been disrupted by civil unrest since July. Production in Algeria dipped to 1.02 mb/d during August.
Supply in Angola crept up 10 kb/d in August to 1.35 mb/d, 120 kb/d below a year ago. The country hopes to attract interest in 10 blocks that will be offered in a new licensing round scheduled for 3 October. Supply in Congo held at 340 kb/d, flat on a year ago. A new giant onshore oil discovery could boost production to record highs. A consortium of SARPD-Oil and Petroleum Exploration & Production Africa said that a find in the Cuvette basin could produce close to 1 mb/d. Production has climbed in the past two years after the ramp up of the offshore Moho Nord project. Production in Gabon was steady at 220 kb/d, while output in Equatorial Guinea held at 120 kb/d in August.
Supply in Venezuela inched 10 kb/d lower in August to 800 kb/d. Exports appeared to stabilise during August after a sharp m-o-m fall in July. A PDVSA joint venture with China National Petroleum Corp, Sinovensa, has started a project to raise production from 110 kb/d to 165 kb/d. Sinovensa produces extra-heavy Orinoco crude and blends it with lighter oil to produce medium-grade Merey. PDVSA said a second phase of the project would take capacity to 230 kb/d. Production in Ecuador was steady at 540 kb/d in August.
Non-OPEC supply Following July’s 375 kb/d monthly increase, non-OPEC oil supply rose a further 480 kb/d in August to 65.5 mb/d. A recovery in US oil supply, following the passing of Hurricane Barry, record output in Brazil and higher Russian flows led the gains. Seasonal declines in the North Sea, Kazakhstan and Brazilian biofuels provided a partial offset.
Annual non-OPEC supply gains of 1.6 mb/d in August were slightly higher than in July but substantially lower than the 2.4 mb/d growth recorded in 1H19 and the 3.4 mb/d seen in 2H18. In August, the US accounted for 83% of the increase, or 1.4 mb/d. Brazilian oil production stood 420 kb/d above a year ago while smaller increases came from Russia and Australia.
58
60
62
64
66
68
70
Jan Mar May Jul Sep Nov Jan
mb/dNon-OPEC Total Oil Supply
2017 20182019 2019 forecast2020 forecast
-2
-1
0
1
2
3
4
5
Jan-15 Jan-16 Jan-17 Jan-18 Jan-19 Jan-20
mb/dNon-OPEC Annual Supply Change

Oil Market Report Supply
Page | 20
IEA
. All
right
s re
serv
ed.
A 140 kb/d m-o-m increase in Russian production in August, saw compliance by non-OPEC countries participating in the OPEC+ deal slip to 110%, from 118% in July and 105% on average so far this year. Russia’s compliance dropped to 53% in August from 114% in July, when output was restrained by contamination along the Druzhba pipeline. Overall production from the 10 non-OPEC countries participating in the deal stood 420 kb/d below the agreed baseline but 50 kb/d higher than a year ago.
For the year as whole, non-OPEC supply growth is largely unchanged since last month’s Report at 1.9 mb/d. Growth accelerates to 2.3 mb/d in 2020 as Brazil picks up speed and new projects start up in Norway and Guyana. The US nevertheless remains the largest source of growth, contributing 1.7 mb/d in 2019 and 1.3 mb/d in 2020.
US crude and condensate production dropped unexpectedly in June, as a 60 kb/d decline in Oklahoma and smaller declines in Alaska (-19 kb/d) and New Mexico (-14 kb/d) offset marginal gains in Texas and North Dakota and as Gulf of Mexico production held steady. As such, June output was only 45 kb/d higher than end-2018 levels. At 12.1 mb/d, production was nevertheless 1.4 mb/d higher than a year earlier. Crude oil output is estimated to have eased further in July as Hurricane Barry shut in roughly 300 kb/d of offshore production. A sharp rebound is projected for August however, as offshore output recovered and onshore supply posted further gains.
The imminent start-up of more than 2 mb/d of new pipeline capacity in the Permian, and an uptick in fracking activity in June and July, is expected to spur further growth in output and exports from the Gulf Coast. However, producers are being cautious, with few signs of acceleration in drilling activity. During August, operators reduced the number of rigs targeting oil by a further 26, so that in early September there were 738 rigs in
2018 1Q19 2Q19 3Q19 4Q19 2019 1Q20 2Q20 3Q20 4Q20 2020
Americas 22.98 24.01 24.49 24.69 25.32 24.63 25.60 25.85 26.05 26.38 25.97Europe 3.47 3.47 3.17 3.16 3.47 3.32 3.66 3.70 3.67 3.85 3.72Asia Oceania 0.41 0.43 0.48 0.49 0.52 0.48 0.54 0.56 0.57 0.56 0.56Total OECD 26.9 27.9 28.1 28.3 29.3 28.4 29.8 30.1 30.3 30.8 30.3Former USSR 14.56 14.80 14.40 14.54 14.55 14.57 14.65 14.63 14.56 14.61 14.61Europe 0.12 0.12 0.12 0.12 0.12 0.12 0.12 0.11 0.11 0.11 0.11China 3.85 3.92 3.95 3.91 3.88 3.92 3.89 3.89 3.86 3.85 3.88Other Asia 3.36 3.33 3.26 3.22 3.22 3.26 3.21 3.17 3.15 3.11 3.16Latin America 4.52 4.51 4.58 4.85 4.97 4.73 5.02 5.08 5.10 5.12 5.08Middle East 3.27 3.26 3.27 3.26 3.26 3.26 3.27 3.27 3.27 3.27 3.27Africa 1.45 1.44 1.45 1.45 1.45 1.45 1.47 1.48 1.48 1.48 1.48Total Non-OECD 31.1 31.4 31.0 31.3 31.5 31.3 31.6 31.6 31.5 31.5 31.6Processing Gains 2.32 2.35 2.35 2.35 2.35 2.35 2.38 2.38 2.38 2.38 2.38Global Biofuels 2.62 2.21 2.90 3.10 2.56 2.69 2.36 2.93 3.20 2.82 2.83Total Non-OPEC 62.9 63.9 64.4 65.1 65.7 64.8 66.2 67.1 67.4 67.5 67.0Annual Chg (mb/d) 2.82 2.53 2.21 1.52 1.17 1.85 2.31 2.62 2.26 1.87 2.26Changes from last OMR (mb/d) 0.01 -0.01 -0.08 0.06 -0.04 0.01 0.07 0.16 0.05 -0.08 0.01
Non-OPEC Supply(million barrels per day)
8
9
10
11
12
13
14
Jan Mar May Jul Sep Nov Jan
mb/dUnited States Crude Oil Production
2017 20182019 2019 forecast2020 forecast

Oil Market Report Supply
Page | 21
IEA
. All
right
s re
serv
ed.
operation, 122 less than a year ago. Companies are reporting they are able to drill more wells using fewer rigs. Capital discipline remains in focus, supporting our view of slowing US supply growth during 2H19 and in 2020. Our forecast for US oil supply is largely unchanged since last month’s Report. Crude oil production is forecast to increase by 1.3 mb/d this year and a further 1 mb/d in 2020, while total oil supply rise 1.7 mb/d and 1.3 mb/d in 2019 and 2020, respectively.
Box 3. US vies with Saudi for top oil exporter spot
Booming shale production has allowed the US to close in on, and briefly overtake, Saudi Arabia as the world’s top oil exporter. The installation of the necessary pipelines and terminals is continuing apace, which will ensure that the trend continues. The US momentarily claimed the no. 1 rank in June, after crude exports surged above 3 mb/d, lifting total exports of crude and products to nearly 9 mb/d. At the same time, Saudi Arabia cut back on both crude and refined product exports while Russian flows were constrained due to the Druzhba pipeline problem.
However, the kingdom reclaimed the top spot in July and August, as US production was affected by hurricane disruptions. The US trade dispute with China has also made it more difficult for shale shipments to find markets.
The fourth quarter is expected to see a further build out of export infrastructure that should allow for up to 4 mb/d in crude exports. Indeed, the price spread between WTI Midland and WTI Houston has narrowed sharply to reflect the easing pipeline constraints (see Prices). With production expanding strongly, the question is can sellers of US crude price exports attractively enough to capture international markets.
Canadian oil production rose another 50 kb/d in July, to surpass 5.5 mb/d, as a 100 kb/d increase in output of synthetic crude oil was partly offset by a fall in raw bitumen and offshore production. Alberta’s upgraders produced 1.25 mb/d in July, 235 kb/d more than a year earlier. In contrast, un-upgraded supply fell by 60 kb/d m-o-m, to 1.77 mb/d, 125 kb/d less than a year ago.
In all, Albertan oil production subject to curtailment limits (including conventional crude oil, mined and in-situ bitumen) rose to 3.67 mb/din July, an increase of 45 kb/d from June and
0
2
4
6
8
10
12
Jan-10 Jan-12 Jan-14 Jan-16 Jan-18
mb/dUS Exports* Soar as Production Booms
US Saudi Arabia Russia* Gross exports of crude oil, NGLs and refined oil products. Source: JODI, Refinitiv, IEA estimates
0123456789
2017 2018 2019 2020 2021 2022 2023 2024
mb/dPlanned Permian Pipeline Capacity
Base Cactus 2EPIC Gray OakFuture projects Production

Oil Market Report Supply
Page | 22
IEA
. All
right
s re
serv
ed.
40 kb/d below the allowed level. The allowance regime permits an additional 25 kb/d increase in output in August, 25 kb/d in September and 25 kb/d in October when it will stand at 3.79 mb/d. Output is nevertheless expected to ease in September due to seasonal maintenance.
On 20 August, the Albertan government announced that because of the continuing pipeline delays, including to Enbridge Line 3, the oil production limit has been extended to 31 December 2020, albeit with an earlier termination possible. The government adjusted the policy to give industry more flexibility, including providing companies with more notice of changes to production limits and doubling the base limit for curtailment from 10 kb/d to 20 kb/d. The latter change means that only 16 of more than 300 producers in Alberta will be subject to the updated production limits. Increasing the base deduction and adjusting the curtailment formula accordingly, resulted in an overall increase of about 25 kb/d to the allowed production limit for October. Monthly production limits for raw crude and bitumen are set at: 3.74 mb/d for August, 3.76 mb/d for September and 3.79 mb/d for October. These changes will take effect in October 2019.
Total Canadian production is expected to increase by 95 kb/d on average this year and a further 100 kb/d next year, when output reaches 5.6 mb/d.
Mexican oil supply held largely steady in July at around 1.9 mb/d, down 190 kb/d on a year earlier. Crude production was just shy of 1.7 mb/d, 150 kb/d lower than a year earlier, led by declines from the Xanab shallow water field (-85 kb/d) field and from Ku-Maloob-Zaap (-58 kb/d). A rebound in output from the extra-heavy Ayatsil (+28 kb/d) field and Balam (+15 kb/d) provided a partial offset. In 2018, Pemex launched a $6.6 billion refurbishment plan for the shallow water Ek-Balam cluster intended to boost the field’s production to 100 kboe/d by 2022. In July, production was 46 kb/d. The start-up of Eni’s Mitzon 2 field on 30 June also provided some support.
In 2019, Mexican production is expected to decline by 170 kb/d y-o-y. The decline eases to 40 kb/d next year as reform efforts bear fruit.
4.24.44.64.85.05.25.45.65.8
Jan Mar May Jul Sep Nov Jan
mb/dCanada Total Oil Supply
2017 20182019 2019 forecast2020 forecast
3.03.13.23.33.43.53.63.73.83.9
Jan-18 Jul-18 Jan-19 Jul-19
mb/dAlberta Oil Output vs. Production Limit
Production Production Limit
Source: Alberta Energy Regulator

Oil Market Report Supply
Page | 23
IEA
. All
right
s re
serv
ed.
Revisions to official data show that UK oil production growth was slightly lower than previously indicated in 1H19 at 60 kb/d y-o-y. This is likely due to a slower ramp up in production from projects commissioned in 2017 and 2018, such as Clair Ridge and Schiehallion. In August, seasonal maintenance saw output dip 75 kb/d m-o-m to 1.01 mb/d. Workovers took place at a number of small fields that feed the Forties pipeline system and flows were temporarily restricted on 15-16 August due to “integrity” issues. In September, the system’s largest contributing field, Buzzard, is expected to go offline for maintenance for around one week and preliminary loading programmes suggest flows from the Brent system will also be reduced.
Further ahead, modest y-o-y growth of 40 kb/d is expected for 4Q19, thanks to new production from Equinor’s Mariner field that started up mid-August and also Hurricane Energy’s Lancaster field that has exceeded expectations since first oil was achieved in June. Initially expected to come online in 2018, Mariner will add 55 kb/d of crude on average when it reaches its plateau. For 2019 as a whole, the UK’s total oil supply will grow by 40 kb/d, slowing to 25 kb/d in 2020 and, further ahead, could return to decline in the absence of new project approvals.
Preliminary production data from the Petroleum Directorate show that Norway’s oil output rebounded by 320 kb/d m-o-m in July as field maintenance was completed. At 1.7 mb/d in July, flows were 200 kb/d below year ago levels. In August, Equinor was given regulatory approval to start production from the Utgard gas-condensate field and first output is expected in September. Around 10 kb/d of Utgard condensate will be transported to the Sleipner processing facilities and exported as part of the Gudrun oil blend. For 2019, Norwegian liquids output is expected to slip by 150 kb/d y-o-y. However, in 2020 Norway is expected to grow by 380 kb/d as the ramp up in output from the Johan Sverdrup field provides a major boost. We have revised up our production estimates on the announcement that Johan Sverdrups’s start-up has been brought forward to October. A loading programme was published in September.
1.8
1.9
2.0
2.1
2.2
2.3
2.4
Jan Mar May Jul Sep Nov Jan
mb/dMexico Total Oil Supply
2017 20182019 2019 forecast2020 forecast
-400
-300
-200
-100
0
100
Jan-15 Jan-16 Jan-17 Jan-18 Jan-19
kb/dMexican Crude Oil Output by Area
Annual change
Cantarell Ku-Maloob-ZaapSE Offshore S OnshoreN Onshore Total Crude
700
800
900
1000
1100
1200
1300
Jan Mar May Jul Sep Nov Jan
kb/dUnited Kingdom Total Oil Supply
2017 20182019 2019 forecast2020 forecast

Oil Market Report Supply
Page | 24
IEA
. All
right
s re
serv
ed.
Box 4. Johan Sverdrup start-up to reverse Norwegian decline
A lack of investment in new oil projects following the downturn in 2015 has put Norwegian output on a declining trend since 2017. However, the looming start-up of Equinor’s Johan Sverdrup project, by far the largest North Sea field to be commissioned since Troll in 1995, will return Norway to growth in 2020.
On 5 September, just days after the Norwegian Petroleum Directorate approved the project’s start-up, Equinor announced that first oil would come even earlier, in October 2019. Preliminary loading programmes show offtakes of an incredible 225 kb/d in the first month of production and, while some of these volumes may come from storage or testing operations, it seems that the ramp-up will be unprecedented. Equinor expects the first phase production plateau of 440 kb/d to be achieved by mid-2020 and be supplemented by an additional 220 kb/d when phase 2 comes online in late 2022. Achieving this would see Johan Sverdrup account for up to a third of Norway’s crude production and put it on a par with Brazil’s pre-salt Búzios field.
Equinor has also been touting the project’s impressive metrics: capital expenditure was reportedly 30% lower than expected and reserves are higher at 2.7 billion boe. For Norway, this is welcome news, coming on the heels of first oil from Equinor’s delayed and over-budget Mariner project in the UK North Sea. Its success suggests that, with strict project management, large offshore projects have a place in the global supply portfolio. With an API gravity of 28, medium sour Johan Sverdrup crude is relatively heavy for the North Sea and small amounts of condensate and NGLs are also expected.
Brazil’s oil expansion continues apace. According to Petrobras, its oil and gas output surged to 3 mboe/d in August, compared with 2.76 mboe/d a month earlier. In a press statement, the company said output from the seven new production units started up since 2018 reached 690 kb/d compared with 530 kb/d in July and only 50 kb/d a year ago. Total oil production is estimated at a record 3.05 m/d, up 420 kb/d on August 2018.
In July, the latest month for which official statistics are available, oil production, including NGLs, reached 2.9 mb/d an increase of 220 kb/d from June and 175 kb/d higher than a year ago. The increase came primarily from new production units in the Lula and Búzios fields. Notably, output at Lula, Brazil’s largest oil producing field, rose by 130 kb/d m-o-m to 980kb/d – a new record and 100 kb/d higher than a year ago. Petrobras has started up two new units at the field over the past year, including the P-69 that started up at the Lula Extreme South last October and the P-67 that was installed at Lula North in February. Production from the Búzios field increased by 100 kb/d, to 290 kb/d, with output from four FPSOs. In contrast, production from the more mature Campos basin held steady m-o-m at around 1 mb/d. Output declines slowed to
1.2
1.4
1.6
1.8
2.0
2.2
2.4
Jan Mar May Jul Sep Nov Jan
mb/dNorway Total Oil Supply
2017 20182019 2019 forecast2020 forecast *Excluding China and OECD Asia Oceania

Oil Market Report Supply
Page | 25
IEA
. All
right
s re
serv
ed.
125 kb/d, helped by the start-up of the Tartaruga Verde field in June last year. The forecast for Brazilian oil production has been largely unchanged since last month’s Report, with growth of 175 kb/d expected this year followed by a 330 kb/d increase in 2020.
Chinese crude oil production slumped by 80 kb/d m-o-m in July, in line with expectations and seasonal trends. At 3.78 mb/d, crude oil output was nevertheless 100 kb/d higher than a year earlier, albeit compared with a weak July performance last year. Higher output this year boosted earnings of China’s three largest producers. PetroChina reported its 1H19 net profits rose 3.6% from a year earlier, as crude oil production increased by 3.2% over the same period to 2.5 mb/d. Sinopec, meanwhile, reported upstream revenue rising 18% y-o-y during 1H19, as higher y-o-y gas production offset marginally lower overseas oil output. The company’s domestic crude oil production rose by 0.3% y-o-y to 650 kb/d. Lastly, CNOOC reported a 19% rise in first half profits as oil and gas sales rose 4.4% over the period. CNOOC said six new projects will start operation this year.
Total oil supply from other Asian countries eased by 65 kb/d in July, to 3.2 mb/d, some 130 kb/d below a year ago. The biggest decline stemmed from Malaysia, where oil production is estimated to have fallen by 45 kb/d m-o-m, to 650 kb/d. Royal Dutch Shell said earlier this year that it planned to carry out maintenance at the Gumusut-Kakap field lasting 27 days in July. Exports of Kimanis crude fell to three cargoes in July, down from eight cargoes in June. The maintenance includes development work that is expected to raise capacity at the field by 50 kb/d. Output from Gumusut-Kakap likely rebounded in August when works were completed
2.52.62.72.82.93.03.13.23.3
Jan Mar May Jul Sep Nov Jan
mb/dBrazil Total Oil Supply
2017 20182019 2019 forecast2020 forecast
0100200300400500600700
Apr-18 Jul-18 Oct-18 Jan-19 Apr-19 Jul-19
kb/dCrude Oil Production from New Units
Tartaruga Verde P-67(Lula) P-69 (Lula)
P-74 (Búzios) P-75 (Búzios) P-76 (Búzios)
P-77 (Búzios)
3.60
3.65
3.70
3.75
3.80
3.85
3.90
Jan Mar May Jul Sep Nov Jan
mb/dChina Crude Oil Production
2017 20182019 2019 forecast2020 forecast
3.0
3.1
3.2
3.3
3.4
3.5
3.6
3.7
Jan Mar May Jul Sep Nov Jan
mb/dOther Asia Total Oil Supply*
2017 20182019 2019 forecast2020 forecast *Excluding China and OECD Asia Oceania

Oil Market Report Supply
Page | 26
IEA
. All
right
s re
serv
ed.
and as phase 2 started up. In addition to Gumusut-Kakap, the Kimani crude grade includes oil from the nearby Malikai oilfield, with total output at around 190 kb/d. Elsewhere, Vietnam’s oil output dropped 17 kb/d in July while Indian and Indonesian supplies held largely steady.
In contrast, Australian oil production is on the rise. In June, supply rose to 430 kb/d, up 40 kb/d m-o-m and 100 kb/d higher than a year ago. New condensate and NGL supply from the Ichthys and Wheatstone projects underpins the increase.
Russian crude oil production surged by 140 kb/d in August, to 11.3 mb/d, as issues related to the Druzhbha contamination incident were mostly resolved. Rosneft propelled the increase reporting an increase of 184 kb/d m-o-m. Indeed the bulk of the increase came from the company’s largest subsidiary Yuganskneftegas, which had been forced to shut in output in July. Yugansk production rose by 170 kb/d m-o-m to a new record high of 1.44 mb/d, more than reversing July’s 70 kb/d drop. Production sharing agreements increased production by 35 kb/d m-o-m to 390 kb/d, on higher volumes from the Exxon Neftegas Sakhalin 1 project after maintenance had curbed output in June and July. Lukoil, GazpromNeft, and Tatneft posted m-o-m declines of 12 kb/d, 35 kb/d and 24 kb/d, respectively. In August, GazpromNeft’s 65 kb/d Prirazlomnoye field went offline for a four-week turnaround.
Overall, production was 80 kb/d higher than a year ago and 125 kb/d below the October 2018 level, implying a 53% compliance rate with agreed cuts. It is likely that production will fall back in September and we have held Russian crude and condensate production steady at around 11.2 mb/d through the end of 2020. Including NGLs, supply averages close to 11.6 mb/d for both 2019 and 2020.
Oil production in Kazakhstan dropped by 110 kb/d in August, to just shy of 1.9 mb/d. The decline was in line with expectations as maintenance at Tengiz had been flagged. CPC loadings eased by 70 kb/d in August, to 1.36 mb/d, with lower shipments from Tengiz (-50 kb/d) and other producers (-70 kb/d). Karachaganak and Kashagan shipments held steady. Output is expected to remain constrained through September as Tengiz maintenance continues and as scheduled work at the Karachaganak field commences. Azerbaijan’s crude and condensate production dropped by 30 kb/d in August, to 750 kb/d. The bulk of the decline stemmed from lower condensate supply from the Shah Deniz gas field. So far this year, oil output has averaged 769 kb/d, 7 kb/d lower than Azerbaijan’s OPEC+ output commitment.
10.6
10.8
11.0
11.2
11.4
11.6
Jan-16 Jan-17 Jan-18 Jan-19
mb/dRussian Crude Output vs Target
Production Pledge
1.651.701.751.801.851.901.952.002.05
Jan Mar May Jul Sep Nov Jan
mb/dKazakhstan Total Oil Supply
2017 20182019 2019 forecast2020 forecast

Oil Market Report Refining
Page | 27
IEA
. All
right
s re
serv
ed.
Refining
Overview Global refining throughput in July was down year-on-year (y-o-y) for the third consecutive month even as the annual decline slowed from May-June’s average 1.1 mb/d to 0.7 mb/d. The only significant y-o-y growth was observed in China. The rest of Asia continued to decline annually, partly under pressure from Chinese product exports, which have soared by 350 kb/d, or 40%, or over the last two years.
In 4Q19, global runs are forecast 340 kb/d higher quarter-on-quarter (q-o-q) and 1.4 mb/d higher y-o-y. This particularly strong growth, compared to declines in 2Q19-3Q19, is partially due to the base year effect, as in 4Q18 global throughput declined by 380 kb/d y-o-y, but also stems from higher expected demand growth in 4Q19. In 2020, annual growth is expected to remain robust, at 1.4 mb/d. Our throughput forecast to December 2020 fits into a 30-month cycle of refining activity, clearly observed since the recovery from the 2007-08 financial crisis. Production of compliant fuels to meet the International Maritime Organisation’s (IMO) new sulphur rules is also expected to support this growth rate.
76
78
80
82
84
86
88
Jan Mar May Jul Sep Nov
mb/d Global RefiningCrude Throughput
Range 14-18 Average 14-182018 2019 2019 forecast 2020 forecast
-0.8
-0.6
-0.4
-0.2
0.0
0.2
0.4
0.6
0.8
Jan-17 Jul-17 Jan-18 Jul-18 Jan-19 Jul-19
mb/dAsia ex China Crude Throughputs
Annual Change
-2.5
-2.0
-1.5
-1.0
-0.5
0.0
0.5
1.0
1.5
2.0
2.5
2006 2008 2010 2012 2014 2016 2018 2020
mb/d Global Throughput12-month rolling average annual growth

Oil Market Report Refining
Page | 28
IEA
. All
right
s re
serv
ed.
Margins Refining margins were mixed in August. Lower crude prices should have been supportive, but product cracks were likely under pressure from increased refining activity. Runs in August are estimated to have been 1.5 mb/d higher m-o-m and 0.3 mb/d higher y-o-y. However, in 3Q19 refined product markets are expected to be balanced, which will not allow the seasonal stockbuilds. This is because demand for refined products will increase by 1.8 mb/d q-o-q.
Sour crude refining economics in Europe deteriorated on stronger Urals differentials and a sharp decline in high-sulphur fuel oil (HSFO) cracks, which fell back to their lowest level since March 2018. This could be due to the double effect of a recovery in refining activity and the preparations to meet the new IMO regulations. The preparations include emptying storage tanks to make room for compliant fuels and blendstocks. The crack for low-sulphur fuel oil (LSFO), which is not compatible with the new IMO rules, turned negative again after pricing in positive territory and at historical highs in July.
In the US Gulf Coast, some sour crude margins made modest gains, as differentials to sweet grades narrowed. In the US Midwest, refining margins tumbled by $6-8/bbl m-o-m as runs reached record monthly rates. In Singapore, HSFO cracks flipped from a positive $3.35/bbl to
Global Refinery Crude Throughput1
(million barrels per day)
2018 1Q19 2Q19 Jul 19 Aug 19 Sep 19 3Q19 Oct 19 4Q19 2019 2020
Americas 19.4 18.7 19.2 19.8 20.1 19.4 19.8 19.5 19.8 19.4 19.7 Europe 12.2 12.3 11.9 12.4 12.9 12.3 12.5 12.3 12.6 12.3 12.3 Asia Oceania 7.0 7.1 6.6 6.7 7.2 6.9 7.0 6.6 6.9 6.9 6.9 Total OECD 38.6 38.1 37.8 38.9 40.2 38.6 39.3 38.4 39.2 38.6 39.0
FSU 6.8 6.8 6.5 7.0 7.0 6.7 6.9 6.6 6.8 6.7 6.8 Non-OECD Europe 0.6 0.5 0.6 0.6 0.6 0.7 0.6 0.6 0.6 0.6 0.6 China 12.1 12.7 12.8 12.4 12.6 12.7 12.6 12.9 12.9 12.7 13.0 Other Asia 10.6 10.9 10.5 10.6 10.8 10.6 10.7 10.3 10.6 10.7 11.1 Latin America 3.5 3.1 3.2 3.2 3.1 3.3 3.2 3.2 3.2 3.2 3.1 Middle East 7.8 7.9 7.8 8.1 8.0 8.0 8.0 8.0 8.2 8.0 8.3 Africa 2.1 2.0 2.0 2.0 2.1 2.1 2.1 2.1 2.1 2.0 2.0 Total Non-OECD 43.6 43.9 43.3 44.0 44.2 44.1 44.1 43.7 44.5 43.9 44.9
Total 82.2 81.9 81.0 82.9 84.4 82.7 83.3 82.1 83.7 82.5 83.9 Year-on-year change 0.7 0.5 -0.6 -0.7 0.3 -0.2 -0.2 1.0 1.4 0.3 1.4 1 Preliminary and estimated runs based on capacity, known outages, economic runcuts and global demand forecast
0
2
4
6
8
10
12
14
Jan 18 Apr 18 Jul 18 Oct 18 Jan 19 Apr 19 Jul 19
$/bbl Regional Refining Margins Monthly
USGC Maya/Mars cokingNWE Brent crackingSingapore Dubai cracking
0
2
4
6
8
10
12
14
Jan 18 May 18 Sep 18 Jan 19 May 19 Sep 19
$/bbl Regional Refining Margins
USGC coking Brent CrackingDubai Cracking

Oil Market Report Refining
Page | 29
IEA
. All
right
s re
serv
ed.
negative $4.8/bbl, pushing sour margins lower. LSFO cracks against benchmark Dubai fell from $13/bbl into negative territory.
OECD refinery throughput Preliminary July data for the OECD came in below expectations, with runs down y-o-y in all regions, by a total 0.7 mb/d. In North America, with Mexico’s runs stabilised, US refiners are the main source of annual declines, with runs remaining shy of the 2018 record seasonal levels. European refinery issues and apparent run cuts in Korea were also major factors in July.
US throughput in August continued to trail behind year-ago levels. However, excluding the impact of the closure of the PES refinery in Philadelphia, runs would have been up y-o-y. PADD 2 (US Midwest) was the best performer with throughput surging to record high levels of 4.1 mb/d. In PADD 3 throughput was lower by 205 kb/d from the near-record year-ago levels. Meanwhile, a takeover plan of the PES refinery may yet see the plant restart operations, but there are major financial and legal challenges.
IEA/KBC Global Indicator Refining Margins1
($/bbl)
Monthly Average Change Average for week ending:
May 19 Jun 19 Jul 19 Aug 19 Aug 19-Jul 19 09 Aug 16 Aug 23 Aug 30 Aug 06 Sep
NW Europe
Brent (Cracking) 5.38 3.78 6.79 7.62 0.83 8.49 7.94 6.92 6.84 5.69
Urals (Cracking) 4.50 4.67 6.55 5.64 -0.92 6.37 5.92 5.06 5.12 5.35
Brent (Hydroskimming) 1.41 1.52 4.18 4.40 0.21 5.12 4.36 4.07 3.75 2.90
Urals (Hydroskimming) -0.70 0.81 2.46 -0.60 -3.06 0.66 -0.87 -1.44 -1.31 -0.86
MediterraneanEs Sider (Cracking) 4.54 4.58 7.93 8.26 0.33 9.14 8.74 7.53 7.23 6.44
Urals (Cracking) 3.18 4.97 6.62 5.00 -1.62 5.73 4.93 4.27 4.75 5.38
Es Sider (Hydroskimming) 1.28 2.44 5.62 5.35 -0.27 6.27 5.49 4.85 4.29 3.57
Urals (Hydroskimming) -1.94 0.69 2.30 -1.65 -3.95 -0.25 -2.42 -2.76 -2.11 -1.93
US Gulf CoastMars (Cracking) 4.11 4.65 6.01 2.49 -3.52 3.62 0.53 1.40 2.61 1.53
50/50 HLS/LLS (Coking) 10.64 11.12 13.73 11.60 -2.13 11.76 10.23 11.80 11.38 9.30
50/50 Maya/Mars (Coking) 7.21 6.27 8.03 9.16 1.13 9.35 8.63 9.19 9.09 4.70
ASCI (Coking) 8.03 8.36 9.59 8.86 -0.73 8.89 7.42 8.77 9.81 7.77
US Midwest30/70 WCS/Bakken (Cracking) 23.27 18.87 18.76 11.04 -7.71 11.63 9.78 10.28 11.19 10.22
Bakken (Cracking) 25.34 20.50 20.40 13.97 -6.43 13.55 13.47 13.48 14.82 12.79
WTI (Coking) 24.97 21.12 21.01 14.38 -6.63 15.71 13.80 13.60 12.86 11.27
30/70 WCS/Bakken (Coking) 26.22 21.07 20.86 14.79 -6.08 15.18 13.96 14.51 14.82 12.95
SingaporeDubai (Hydroskimming) -1.57 -0.07 3.56 0.29 -3.27 1.11 -1.22 -1.36 1.30 1.09
Tapis (Hydroskimming) -0.93 -0.62 3.78 2.10 -1.69 3.49 1.74 1.10 1.11 -0.72
Dubai (Hydrocracking) 2.28 2.87 5.61 4.66 -0.95 5.14 4.57 3.66 4.86 5.18
Tapis (Hydrocracking) 0.60 -0.55 3.48 4.70 1.22 5.82 5.39 4.22 3.61 2.09 1 Global Indicator Refining Margins are calculated for various complexity configurations, each optimised for processing the specific crude(s) in a specific refining centre. Margins include energy cost, but exclude other variable costs, depreciation and amortisation. Consequently, reported margins should be taken as an indication, or proxy, of changes in profitability for a given refining centre. No attempt is made to model or otherwise comment upon the relative economics of specific refineries running individual crude slates and producing custom product sales, nor are these calculations intended to infer the marginal values of crude for pricing purposes.
Source: IEA, KBC Advanced Technologies (KBC)

Oil Market Report Refining
Page | 30
IEA
. All
right
s re
serv
ed.
In North West Europe overall performance in July was affected by the heavyweights Germany and France, which were down y-o-y by a combined 175 kb/d even as French throughput gained 185 kb/d m-o-m. With just over three months before the new IMO rules are implemented, France remains the largest middle distillates importer in the world, with average volumes above 500 kb/d. In Mediterranean Europe, higher Italian activity supported regional runs, even as the growth in Turkey came to an abrupt halt.
In OECD Asia, Korean throughput continues to underwhelm, with year-to-date throughput down 60 kb/d y-o-y. Runs were up 115 kb/d m-o-m, possibly in response to stronger July margins. Japanese throughput has so far been almost flat this year, compared to a 125 kb/d decline in the same period of last year. Australian runs have been flat year-to-date, after seeing a 55 kb/d growth in 2018. Meanwhile, the country has turned into the second largest middle distillates importer in the world.
14.5
15.0
15.5
16.0
16.5
17.0
17.5
18.0
Jan Mar May Jul Sep Nov
mb/d USCrude Throughput
Range 14-18 Average 14-182018 2019 2019 forecast 2020 forecast
0.4
0.6
0.8
1.0
1.2
1.4
Jan Mar May Jul Sep Nov
mb/d MexicoCrude Throughput
Range 14-18 Average 14-182018 2019 2019 forecast 2020 forecast
7.0
7.5
8.0
8.5
9.0
Jan Mar May Jul Sep Nov
mb/d North West EuropeCrude Throughput
Range 14-18 Average 14-182018 2019 2019 forecast 2020 forecast
2.8
3.0
3.2
3.4
3.6
3.8
4.0
4.2
Jan Mar May Jul Sep Nov
mb/d Mediterranean EuropeCrude Throughput
Range 14-18 Average 14-182018 2019 2019 forecast 2020 forecast
5.5
6.0
6.5
7.0
7.5
8.0
Jan Mar May Jul Sep Nov
mb/d OECD Asia OceaniaCrude Throughput
Range 14-18 Average 14-182018 2019 2019 forecast 2020 forecast

Oil Market Report Refining
Page | 31
IEA
. All
right
s re
serv
ed.
Non-OECD refinery throughput The July estimate for non-OECD throughput has been revised down on new Chinese data. In 4Q19 runs are forecast 335 kb/d lower due to increased maintenance. This year’s growth forecast, at just under 300 kb/d, would be the lowest in our records dating back to 2004.
Chinese throughput slumped 530 kb/d from June’s record high to 12.5 mb/d. The Shandong province accounted for the bulk of the slowdown as runs fell to 2.2 mb/d, the lowest in two years. This could be a cyclical issue, related to a local product stocks overhang, given the export controls. Or, this could be the start of the structural pressures arising from the large-scale independent refineries looking for market share for their transport fuel output. For August, runs
Refinery Crude Throughput and Utilisation in OECD Countries(million barrels per day)
Change from Utilisation rate 1
Feb 19 Mar 19 Apr 19 May 19 Jun 19 Jul 19 Jun 19 Jul 18 Jul 19 Jul 18
US2 15.86 15.94 16.34 16.72 17.25 17.26 0.01 -0.09 91% 91%Canada 1.74 1.75 1.55 1.63 1.77 1.69 -0.08 -0.08 84% 88%Chile 0.20 0.19 0.20 0.22 0.20 0.20 -0.01 0.02 87% 79%Mexico 0.59 0.55 0.58 0.59 0.68 0.65 -0.02 0.02 40% 38%
OECD Americas3 18.40 18.43 18.67 19.16 19.90 19.81 -0.10 -0.14 86% 87%France 1.17 1.04 1.04 0.99 0.90 1.08 0.19 -0.10 88% 96%Germany 1.74 1.73 1.71 1.65 1.75 1.83 0.08 -0.08 91% 94%Italy 1.20 1.24 1.30 1.33 1.37 1.46 0.09 0.13 84% 76%Netherlands 1.12 1.16 1.09 1.04 0.96 1.03 0.07 -0.04 80% 82%Spain 1.29 1.37 1.38 1.29 1.21 1.30 0.08 0.00 92% 92%United Kingdom 1.09 1.02 1.08 1.03 0.98 1.07 0.09 -0.02 84% 86%Other OECD Europe 4.59 4.54 4.56 4.40 4.57 4.64 0.08 -0.09 89% 94%
OECD Europe 12.20 12.10 12.16 11.73 11.73 12.40 0.67 -0.20 86% 89%Japan 3.19 3.14 3.08 2.72 2.87 2.89 0.03 -0.08 81% 84%South Korea 3.20 2.97 3.15 2.82 2.82 2.93 0.11 -0.22 86% 96%Other Asia Oceania 0.86 0.86 0.82 0.79 0.85 0.89 0.04 -0.01 102% 104%
OECD Asia Oceania 7.25 6.98 7.06 6.33 6.53 6.72 0.19 -0.31 86% 91%OECD Total 37.84 37.52 37.89 37.22 38.17 38.93 0.76 -0.66 86% 88%1 Expressed as a percentage, based on crude throughput and current operable refining capacity
2 US50
3 OECD Americas includes Chile and OECD Asia Oceania includes Israel. OECD Europe includes Slovenia and Estonia, though neither country has a refinery
9
10
11
12
13
14
Jan Mar May Jul Sep Nov
mb/d ChinaCrude Throughput
Range 14-18 Average 14-182018 2019 2019 forecast 2020 forecast
4.0
4.2
4.4
4.6
4.8
5.0
5.2
5.4
Jan Mar May Jul Sep Nov
mb/d IndiaCrude Throughput
Range 14-18 Average 14-182018 2019 2019 forecast 2020 forecast

Oil Market Report Refining
Page | 32
IEA
. All
right
s re
serv
ed.
are estimated 160 kb/d higher m-o-m despite temporary shutdowns in several refineries in Shandong and Jiangsu provinces caused by the deadly typhoon Lekima.
Refining runs in India were up 190 kb/d m-o-m in July, to 5.1 mb/d, but remained well below last year’s levels. Runs were down m-o-m in Thailand on refinery maintenance, while in Chinese Taipei throughput remained largely flat. The Philippines has not reported official data since March, but Petron said it had restarted its 180 kb/d Limay refinery in mid-August after a four-month shutdown caused by an earthquake.
In the Middle East, throughput declined y-o-y in June for the first time this year. This was due to Saudi Arabian runs falling by 290 kb/d y-o-y. There has been no recent news on a possible start-up date for the 400 kb/d Jazan refinery, which was initially scheduled for a 2016 launch.
Russian refining activity was stable in August from July levels, but finally showed a y-o-y increase of 210 kb/d, after five months of declines. Belarus reported May throughput numbers for the first time, showing a lower impact from the Druzhba shutdown than expected. From 380 kb/d, runs were down only 50 kb/d to 330 kb/d.
In Latin America, throughput remains anaemic, with runs fluctuating at just above 3 mb/d, having lost 1.6 mb/d in the last five years and with little prospects for growth in the near future. Colombian 2Q19 data were updated following Ecopetrol’s financial results release, and were some 20 kb/d higher than our initial estimate.
6.0
6.5
7.0
7.5
8.0
8.5
9.0
Jan Mar May Jul Sep Nov
mb/d Middle EastCrude Throughput
Range 14-18 Average 14-182018 2019 2019 forecast 2020 forecast
6.0
6.2
6.4
6.6
6.8
7.0
7.2
7.4
Jan Mar May Jul Sep Nov
mb/d FSUCrude Throughput
Range 14-18 Average 14-182018 2019 2019 forecast 2020 forecast
2.5
3.0
3.5
4.0
4.5
5.0
Jan Mar May Jul Sep Nov
mb/d Latin AmericaCrude Throughput
Range 14-18 Average 14-182018 2019 2019 forecast 2020 forecast
1.8
2.0
2.2
2.4
2.6
Jan Mar May Jul Sep Nov
mb/d AfricaCrude Throughput
Range 14-18 Average 14-182018 2019 2019 forecast 2020 forecast

Oil Market Report Refining
Page | 33
IEA
. All
right
s re
serv
ed.
Sparse data updates for Africa put June estimates at 160 kb/d lower y-o-y and remaining below the 2 mb/d threshold, which has been the case for most time this year. Nigeria is set to receive Dangote refinery’s crude distillation tower, the single largest such unit ever built, according to the manufacturer Sinopec that shipped it at the end of July from its Ningbo base, but operations are not expected to start before 2022.
Box 5. IMO for refiners: it is more of an opportunity than a challenge
The International Maritime Organisation adopted new marine bunker sulphur emission rules in October 2016. Our first forecast published after their adoption, in March 2017, envisaged a possible 2 mb/d shortage of compliant fuels in 2020 based on forecast refinery capacity, crude oil output, diesel demand, bunker fuel demand and assumptions for scrubber uptake. By the time we published Oil 2019 – Analysis and Forecast to 2024 last March, several key parameters had moved: onshore diesel demand forecast for 2020 was about 0.8 mb/d lower; the US light tight oil production forecast was about 3 mb/d higher; refining capacity forecast was 2.8 mb/d higher; scrubbers were estimated to consume 250 kb/d more high-sulphur fuel oil.
The significance of the US LTO forecast is twofold: first, it is a low-sulphur and low-residue grade that can be processed by simple refineries, which tend to be constrained by residue upgrading and desulphurisation capacity and thus are the marginal refiners. Most shale grades can yield IMO 2020-compliant fuel oil without additional processing needs; second, a side effect of LTO growth has been the revival of OPEC output cuts, which tend to affect predominantly medium-heavy high sulphur crude oil output.
With these changes, the compliant bunker fuel deficit narrowed to 0.9 mb/d in our March 2019 forecast, of which non-compliance, mostly for logistical reasons, accounted for 0.7 mb/d. This would result in a 0.2 mb/d gasoil stock draw, or a total of 70 mb for the year, which is about 10% of OECD total middle distillate stocks as of July 2019. In principle, this level of stock draws seems possible without major implications for prices. Moreover, compliant fuel and blendstocks in floating storage accumulated by industry players amounted to about 35 mb in early September, with volumes likely to rise further before January.
Starting in the June edition of this Report, we have published a monthly forecast for 2020. Our product supply model does not have monthly granularity, however, hence we are not able to provide a monthly view of diesel and bunker fuel balances in 2020. However, several developments in the last six months now point at the likelihood of an even smoother start to the implementation.
Refining capacity in 2020 is now expected 0.3 mb/d higher than forecast in March. However, refinery throughput is forecast 0.5 mb/d lower. This is because overall oil demand is 300 kb/d lower, while refined product demand is 550 kb/d lower than forecast in Oil 2019. Lower runs mean that the average complexity of operating refining assets should be higher, as there is less need for marginal, simple refineries. For the moment, plans to restart several units at two previously mothballed refineries, St Croix in the Virgin Islands and Wilhelmshaven in Germany, to cater specifically for the low-sulphur marine bunkers market, are going ahead. At the same time, two new projects have been announced for the same purpose. The UAE-based Brooge Petroleum and Gas Investment Company is working on a 250 kb/d project at Fujairah, to be built in several phases. In the US Gulf Coast, bunker supplier GCC Bunkers has partnered with Texas International Terminals for a 50 kb/d distillation project aimed at supplying the bunker market.

Oil Market Report Refining
Page | 34
IEA
. All
right
s re
serv
ed.
Bunker demand is now lower due to the ongoing contraction in global trade (see Demand).
US crude oil output forecast is also higher, by about 300 kb/d. In general, crude balances are expected to be less tight in 2020 than forecast at the start of this year. Refineries, especially in Asia, but also in Europe, are increasingly choosing US grades with the specific purpose of producing very low sulphur (VLSFO) bunker fuels.
These factors are the most visible and their impact is reasonably easy to quantify. The less visible aspect of preparations, and something that will vary greatly between individual refineries, is the ability to switch yields between other products and compliant marine fuels. Over the last few months several major refiners have announced their readiness to provide VLSFO to the bunker market starting either in 4Q19 or 1Q20. What is not clear is whether the nomenclature is being used consistently. VLSFO could mean mostly a marine distillate-based product, or de-sulphurised/straight-run residue, or a blend of any material of a range between HSFO and diesel. Therefore, it is not possible to compare the declared availabilities of VLSFO with our forecast of 1 mb/d published in Oil 2019, most of which was a fuel oil material, rather than a blend. Marine gasoil is still expected to account for the largest share in the switch at the start of the implementation period. We reviewed compliant fuel availability in terms of middle distillates supply and demand.
Middle distillates, a collective term for jet/kerosene, gasoil and heating oils, are the backbone of global oil demand and refinery margins. They account for about 36.7% of total oil demand, and this share is set to jump to 37.7 % with the implementation of the new IMO rules. However, since they have relatively few alternative sources (compared to LPG or gasoline), the share of refinery-produced diesel in total demand for refined products is significantly higher: 42.2% currently and increasing to 43.8% in 2020. This new, higher level is reasonably within the expected refinery yields. The levels of diesel cracks observed in recent years indirectly confirm that in principle middle distillate production capacity is far from stretched, and likely there is spare capacity, before factoring in new units coming online.
Naturally, refining throughput fluctuations will affect the total supply of middle distillates. Given the seasonality of refining activity, an interesting picture emerges for 2020 based on our current forecast of refinery throughput. In 1Q20, refined product balances, as runs increase 1.3 mb/d y-o-y, imply a 2 mb/d total product stock build, a significant portion of which should be middle distillates, especially as their demand seasonally declines by 0.6 mb/d. Thus, the start of the IMO 2020 implementation could well be much smoother than expected. This may not only allow the market to meet the incremental bunker demand, but also to store fuel or components. On the contrary, the availability will be very stretched in 2Q20 as demand increases by 0.6 mb/d q-o-q while runs decline by as much seasonally. Thus, the possibility of a supply crunch shifts to 1 April 2020 from 1 January. In the second half of the year, middle distillates balances will likely stabilise again with the expected growth in supply.
30%
34%
38%
42%
46%
1Q17 3Q17 1Q18 3Q18 1Q19 3Q19 1Q20 3Q20
Share of Middle Distillates
in refining outputin refined product demandin total oil demand

Oil Market Report Stocks
Page | 35 IEA
. All
right
s re
serv
ed.
Stocks
Overview OECD total commercial stocks increased by 1.5 mb month-on-month (m-o-m) in July to 2 931 mb, the fourth straight monthly increase. They reached the highest level since September 2017 and are 19.7 mb above the five-year average. The gain was less than the average of 20.1 mb for the month as crude oil showed a large draw. Stocks in terms of days of forward demand rose by 0.1 days to 60.5 days, which is 1 day below the average.
Crude oil inventories fell by a large 36.7 mb to 1 086 mb, more than three times the usual decrease for the month. OECD Americas showed a large contraction of 24.9 mb due to higher refinery runs and lower crude imports. Crude stocks in Europe and Asia Oceania fell by 8.2 mb and 3.6 mb, respectively. Oil product stocks rose by 37.8 mb, attributable to a large build in middle distillates and other products and counter-seasonal gains in gasoline and fuel oil inventories.
Preliminary data for August showed stocks falling in the US, while inventories gained in Europe and Japan. US oil stocks decreased by 6.7 mb as an increase in other products (13.6 mb) was offset by large draws in crude oil (-15.3 mb) and distillates. European oil inventories rose by 8.1 mb owing to increases in middle distillates (6.8 mb) and gasoline (1.8 mb). Crude stocks fell by 0.2 mb. Japanese preliminary data showed a 3 mb increase in total stocks. Middle distillates gained by 4.5 mb, while crude inventories fell by 4.2 mb.
2 500
2 600
2 700
2 800
2 900
3 000
3 100
3 200
Jan Mar May Jul Sep Nov Jan
mbOECD Total Oil Industry Stocks
Range 2014-2018 Avg 2014-20182018 2019
-100
0
100
200
300
400
500
2016 2017 2018 2019
mbOECD Stocks Vs 5-Year Average
Oil Products Crude + NGL + Feedstocks
mb mb/d
OECD Americas 52.8 0.6
OECD Europe -5.5 -0.1
OECD Asia Oceania 8.2 0.1
Total OECD Commercial Stocks 55.4 0.6
OECD Government Stocks -8.1 -0.1
Oil in Transit incl. Floating Storage (Refinitiv) -44.8 -0.5
Non-OECD Crude + NGL (JODI) -18.5 -0.2
Non-OECD Products (JODI) 8.5 0.1
Fujairah (FEDCom/S&P Global Platts) -4.6 -0.1
Singapore (Enterprise Singapore) -4.0 0.0
Total excl. China Balance -16.1 -0.2
China Crude Balance 58.4 0.6
Total 42.3 0.5
2Q19 v 1Q19 Stock Estimate (Revised)

Oil Market Report Stocks
Page | 36 IEA
. All
right
s re
serv
ed.
In this Report, we have amended our 2Q19 stock changes as OECD data for June were revised down. In 2Q19, OECD industry stocks increased by 55.4 mb (610 kb/d) from 1Q19 levels due to higher LPG production in the US which boosted inventories. Elsewhere, crude stocks including NGLs in 15 non-OECD economies (excluding China) fell by 18.5 mb (205 kb/d) according to JODI data. The implied crude stocks build in China in 2Q19 was 58.4 mb (640 kb/d). Seaborne oil in transit decreased by 44.8 mb in 2Q19 due to lower exports by OPEC countries and the increasing impact of sanctions against Iran and Venezuela.
Revisions versus the previous Report were relatively large. OECD stocks were revised down by 31.1 mb in June due to the Americas region, where both crude oil and total product inventories decreased by 12.6 mb and 20.4 mb, respectively. European crude inventories in June were revised up (+11.5 mb) and partly offset by a decrease in oil products (-6.5 mb). May stock figures were also changed, mainly in Europe.
Recent OECD industry stock changes
OECD Americas Industry stocks in the OECD Americas region decreased by 2.8 mb m-o-m in July to 1 558 mb, which is 40.7 mb above the five-year average. By the forward demand metric, they were 0.7 days below the average. The fall was counter-seasonal for the month (usually total oil inventories gain by 9.2 mb) due to large crude oil inventory draws in the US.
Am Europe As.Ocean Total Am Europe As.Ocean Total Am Europe As.Ocean Total
Crude Oil -24.9 -8.2 -3.6 -36.7 -0.8 -0.3 -0.1 -1.2 0.0 -0.1 -0.1 -0.2 Gasoline 0.3 -0.4 1.8 1.7 0.0 0.0 0.1 0.1 -0.1 -0.1 0.0 -0.2 Middle Distillates 9.6 2.1 3.7 15.4 0.3 0.1 0.1 0.5 -0.1 0.1 0.0 0.1 Residual Fuel Oil 2.9 0.6 -0.5 3.0 0.1 0.0 0.0 0.1 0.0 0.0 0.0 0.0 Other Products 13.0 3.0 1.8 17.8 0.4 0.1 0.1 0.6 0.5 0.0 0.1 0.6 Total Products 25.7 5.2 6.9 37.8 0.8 0.2 0.2 1.2 0.4 0.0 0.1 0.5 Other Oils1 -3.7 3.5 0.6 0.4 -0.1 0.1 0.0 0.0 0.2 0.0 0.1 0.2 Total Oil -2.8 0.5 3.9 1.5 -0.1 0.0 0.1 0.0 0.6 -0.1 0.1 0.6 1 Other oils includes NGLs, feedstocks and other hydrocarbons.
(million barrels) (million barrels per day) (million barrels per day)
Preliminary Industry Stock Change in July 2019 and Second Quarter 2019July 2019 (preliminary) Second Quarter 2019
(million barrels)
May-19 Jun-19 May-19 Jun-19 May-19 Jun-19 May-19 Jun-19
Crude Oil -1.0 -12.6 14.5 11.5 0.0 -3.1 13.5 -4.2 Gasoline -0.2 -3.6 -2.4 -0.1 0.0 -0.3 -2.6 -4.0 Middle Distillates -0.1 -4.1 -4.2 -0.2 0.0 0.3 -4.2 -4.1 Residual Fuel Oil 0.0 -0.1 -3.4 -6.0 0.0 0.4 -3.4 -5.6 Other Products 0.0 -12.6 -2.2 -0.3 0.0 -0.6 -2.2 -13.4 Total Products -0.2 -20.4 -12.2 -6.5 0.0 -0.2 -12.4 -27.1 Other Oils1 0.0 3.3 -2.4 -3.5 0.0 0.4 -2.3 0.2 Total Oil -1.2 -29.7 -0.1 1.4 0.0 -2.9 -1.3 -31.1 1 Other oils includes NGLs, feedstocks and other hydrocarbons.
Americas Europe Asia Oceania OECD
Revisions versus August 2019 Oil Market Report

Oil Market Report Stocks
Page | 37 IEA
. All
right
s re
serv
ed.
Crude oil inventories fell by 24.9 mb and stood at 589 mb. M-o-m higher refinery throughput in the US and lower crude imports (-335 kb/d to 7 mb/d on average in July according to the Energy Information Administration) helped deplete stocks. Lower crude oil production in the Gulf of Mexico caused by Hurricane Barry was also a factor.
For oil products, total stocks increased by 25.7 mb, which is more than double the five-year average of 11.6 mb. Gasoline inventories gained counter-seasonally by 0.3 mb, amidst m-o-m higher US gasoline prices. Fuel oil also showed a counter-seasonal increase of 2.9 mb. Middle distillates rose by 9.6 mb, larger than the usual increase of 4.1 mb for the month. These changes in distillate products could be attributable to slowing trade and economic activities. Other products gained by 13 mb, which was in line with the usual increase.
Preliminary August data from the EIA show a crude stock decrease of 15.3 mb due to higher m-o-m crude exports. The fall was more than double the usual decrease of 7.1 mb. By contrast, total oil products inventories increased by 4.8 mb. Other products gained by 13.6 mb (mainly LPG inventories). Middle distillates and residual fuel oil fell counter-seasonally by 3.4 mb and 1.1 mb, respectively. Gasoline stocks also declined, by 4.3 mb.
450
500
550
600
650
700
750
Jan Mar May Jul Sep Nov Jan
mbOECD Americas Crude Oil Industry Stocks
Range 2014-2018 Avg 2014-20182018 2019
183
193
203
213
223
233
243
253
Jan Mar May Jul Sep Nov Jan
mbOECD Americas Middle Distillates Industry
Stocks
Range 2014-2018 Avg 2014-20182018 2019
5.56.06.57.07.58.08.59.09.5
10.0
Jan Mar May Jul Sep Nov
mb/dUS Imports of Crude Oil
Range 2014-2018 Avg 2014-2018
2018 2019
Source: EIA
0.0
0.5
1.0
1.5
2.0
2.5
3.0
3.5
4.0
Jan Mar May Jul Sep Nov
mb/dUS Exports of Crude Oil
Range 2014-2018 Avg 2014-2018
2018 2019
Source: EIA

Oil Market Report Stocks
Page | 38 IEA
. All
right
s re
serv
ed.
OECD Europe In July, total commercial stocks in OECD Europe rose by 0.5 mb to 981 mb, which is 11.8 mb above the five-year average. Crude runs in Europe were higher by 670 kb/d m-o-m in July, and crude oil inventories fell by 8.2 mb versus the usual decline of 2 mb. Crude stocks in France and Italy decreased by 2.3 mb and 1.8 mb, respectively.
For products, total inventories increased by 5.2 mb in line with the usual gain. Middle distillate and other oil categories rose by 2.1 mb and 3 mb, respectively. Fuel oil increased counter-seasonally by 0.6 mb. Gasoline stocks fell by 0.4 mb.
Preliminary data from Euroilstock showed inventories increaseing by 8.1 mb m-o-m in August owing to gains in product stocks. Middle distillate (+6.8 mb), gasoline (+1.8 mb) and fuel oil (+0.3 mb) stocks showed an increase, while naphtha (-0.4 mb) stockpiles fell. Crude inventories drew by 0.2 mb.
OECD Asia Oceania Total industry stocks in the Asia Oceania region increased in July by 3.9 mb to 392 mb, which is 32.8 mb below the five-year average. The gain was lower than the average level of 7.7 mb as crude oil inventories fell counter-seasonally (-3.6 mb). Korean crude oil stocks fell by 5.1 mb, possibly due to higher m-o-m refinery runs (+115 kb/d). Gasoline stocks increased counter-seasonally by 1.8 mb. Middle distillates and other oil inventories also rose by 3.7 mb and 1.8 mb, respectively. Fuel oil stocks fell by 0.5 mb.
Preliminary data for August from the Petroleum Association of Japan show total inventories increasing by 3 mb m-o-m, which is lower than the five-year average gain of 5.5 mb. Crude oil stocks decreased by 4.2 mb, larger than the usual fall of 2.6 mb. Total products increased by 3.8 mb with gains in middle distillates (4.5 mb). Residual fuel and other products stocks fell counter-seasonally by 0.1 mb and 0.5 mb, respectively. Gasoline inventories also decreased by 0.1 mb.
300
310
320
330
340
350
360
370
380
Jan Mar May Jul Sep Nov Jan
mbOECD Europe Crude Oil Industry Stocks
Range 2014-2018 Avg 2014-20182018 2019
230
250
270
290
310
330
350
Jan Mar May Jul Sep Nov Jan
mbOECD Europe Middle Distillates Industry
Stocks
Range 2014-2018 Avg 2014-20182018 2019

Oil Market Report Stocks
Page | 39 IEA
. All
right
s re
serv
ed.
Other stock developments Short-term floating storage of crude oil rose by 7.9 mb in August to 66.1 mb, according to EA Gibson data. Storage in the Middle East Gulf increased by 8.1 mb to 57.9 mb as the number of Iranian VLCCs used for storage increased by 3 to 26. Together with Suezmax fleets, the total numbers of vessels thought to store Iranian crude oil is 29.
Seaborne oil in transit volumes, based on data from Refinitiv, fell by 28.9 mb in July as all categories showed a m-o-m decrease. Due to lower crude exports from OPEC+ producers and the impact of sanctions against Iran and Venezuela, crude oil in transit decreased by 14.3 mb. Clean products also fell by 14.5 mb. Fuel oil decreased by a modest 0.1 mb during the month.
Oil stocks in major bunkering hubs rose in August after three straight months of decreases. In Fujairah, they increased by 1.1 mb m-o-m according to data from FEDCom and S&P Global Platts. Heavy distillates inventories gained by 2.7 mb while both light and middle distillates fell by 1.5 mb and 0.1 mb, respectively, during the month. Fuel stocks in Singapore, the world’s largest bunkering hub, rose by 4.1 mb in the month based on data from Enterprise Singapore. Residual fuel oil stocks increased by 2.2 mb from the lowest level since November 2018. Light and middle distillate inventories also gained by 1.3 mb and 0.7 mb, respectively.
135
145
155
165
175
185
195
205
215
Jan Mar May Jul Sep Nov Jan
mbOECD Asia Oceania Crude Oil Industry
Stocks
Range 2014-2018 Avg 2014-20182018 2019
50
55
60
65
70
75
80
Jan Mar May Jul Sep Nov Jan
mbOECD Asia Oceania Middle Distillates
Industry Stocks
Range 2014-2018 Avg 2014-20182018 2019
0
20
40
60
80
100
120
Jan Mar May Jul Sep Nov Jan
mbGlobal Short-Term Crude Floating Storage
Range 2014-18 Average 2014-18
2018 2019
Source: EA Gibson
0
200
400
600
800
1 000
1 200
1 400
2016 2017 2018 2019
mbOil in Transit by Category
Crude Fuel oil Clean
Sources: Refinitiv, IEA
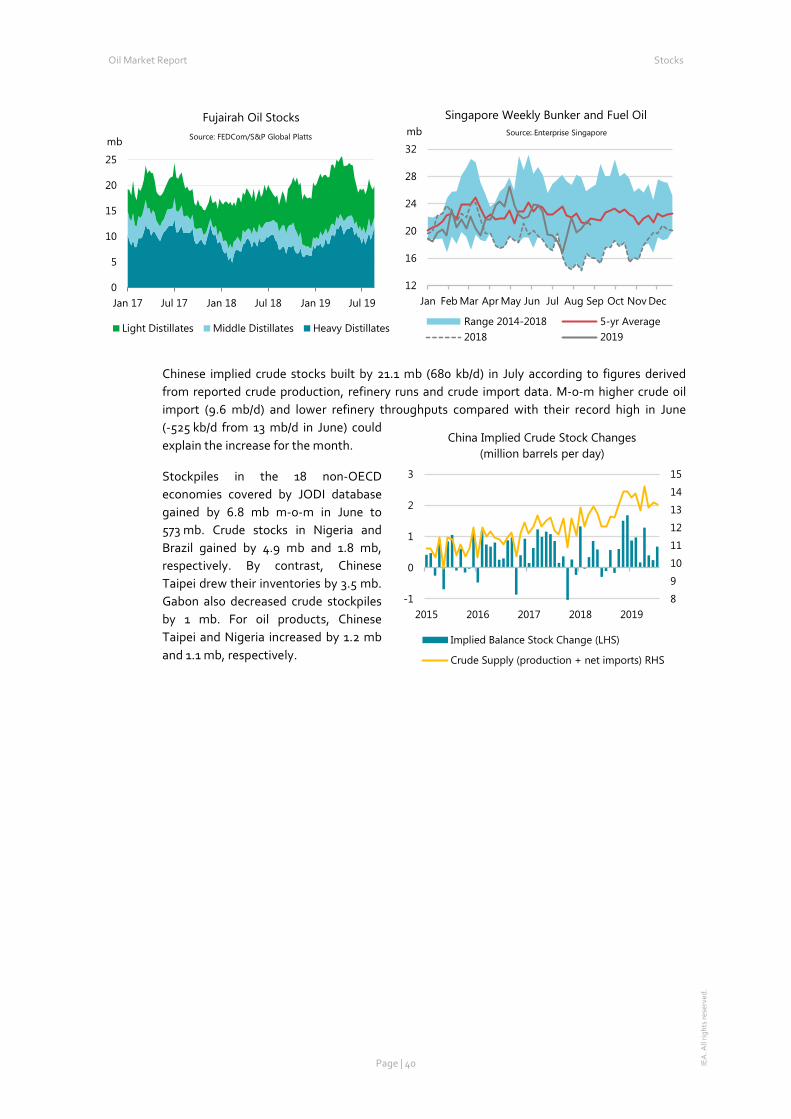
Oil Market Report Stocks
Page | 40 IEA
. All
right
s re
serv
ed.
Chinese implied crude stocks built by 21.1 mb (680 kb/d) in July according to figures derived from reported crude production, refinery runs and crude import data. M-o-m higher crude oil import (9.6 mb/d) and lower refinery throughputs compared with their record high in June (-525 kb/d from 13 mb/d in June) could explain the increase for the month.
Stockpiles in the 18 non-OECD economies covered by JODI database gained by 6.8 mb m-o-m in June to 573 mb. Crude stocks in Nigeria and Brazil gained by 4.9 mb and 1.8 mb, respectively. By contrast, Chinese Taipei drew their inventories by 3.5 mb. Gabon also decreased crude stockpiles by 1 mb. For oil products, Chinese Taipei and Nigeria increased by 1.2 mb and 1.1 mb, respectively.
0
5
10
15
20
25
Jan 17 Jul 17 Jan 18 Jul 18 Jan 19 Jul 19
mb
Fujairah Oil Stocks
Light Distillates Middle Distillates Heavy Distillates
Source: FEDCom/S&P Global Platts
12
16
20
24
28
32
Jan Feb Mar Apr May Jun Jul Aug Sep Oct Nov Dec
mbSingapore Weekly Bunker and Fuel Oil
Stocks
Range 2014-2018 5-yr Average2018 2019
Source: Enterprise Singapore
8
9
10
11
12
13
14
15
-1
0
1
2
3
2015 2016 2017 2018 2019
China Implied Crude Stock Changes(million barrels per day)
Implied Balance Stock Change (LHS)
Crude Supply (production + net imports) RHS

Oil Market Report Stocks
Page | 41 IEA
. All
right
s re
serv
ed.
1 Days of forward demand are based on average demand over the next three months
Days1 Million Barrels
Regional OECD End-of-Month Industry Stocks(in days of forward demand and million barrels of total oil)
56
58
60
62
64
66
68
Jan Mar May Jul Sep Nov Jan
Days OECD Total Oil
Range 2014-2018 Avg 2014-2018
2018 2019
525456586062646668
Jan Mar May Jul Sep Nov Jan
Days Americas
Range 2014-2018 Avg 2014-2018
2018 2019
626466687072747678
Jan Mar May Jul Sep Nov Jan
Days Europe
Range 2014-2018 Avg 2014-2018
2018 2019
424446485052545658
Jan Mar May Jul Sep Nov Jan
Days Asia Oceania
Range 2014-2018 Avg 2014-2018
2018 2019
1,250
1,350
1,450
1,550
1,650
1,750
Jan Mar May Jul Sep Nov Jan
mb Americas
Range 2014-2018 Avg 2014-2018
2018 2019
850
900
950
1,000
1,050
Jan Mar May Jul Sep Nov Jan
mb Europe
Range 2014-2018 Avg 2014-2018
2018 2019
360
380
400
420
440
460
Jan Mar May Jul Sep Nov Jan
mb Asia Oceania
Range 2014-2018 Avg 2014-2018
2018 2019
2,500 2,600 2,700 2,800 2,900 3,000 3,100 3,200
Jan Mar May Jul Sep Nov Jan
mb OECD Total Oil
Range 2014-2018 Avg 2014-2018
2018 2019

Oil Market Report Prices
Page | 42 IEA
. All
right
s re
serv
ed.
Prices
Overview Oil prices declined modestly month-on-month (m-o-m) in August. While prices have risen or fallen by up to $3/bbl in a single day they mostly traded in a fairly narrow band at around $60/bbl for ICE Brent and $55/bbl for NYMEX WTI. Increasingly backwardated futures curves indicate that prompt markets are tight despite ongoing concerns about slowing demand growth. There are clear signs that market participants are preparing for the International Maritime Organisations’s (IMO) changes to shipping fuel specifications that will come into effect in January 2020. These include stronger differentials for middle distillate-rich crude grades and high volatility of fuel oil cracks.
Futures markets Benchmark crude futures fell to seven month lows on 7 August with ICE Brent at $56.23/bbl and NYMEX WTI at $51.09/bbl. They subsequently recovered but were on average lower m-o-m by $4.71/bbl and $2.71/bbl, respectively. Headline prices are responding to developments in US-China trade negotiations and indicators that suggest slowing economic growth. On the other hand, there are signs that the physical crude market is tightening as refining activity picks up and on ongoing strong compliance with output cuts made by OPEC+ members.
The Brent and Dubai futures curves have been in backwardation for several months and in August the WTI curve flipped from contango to backwardation. WTI for delivery in October 2019 is priced at a premium of $0.40/bbl and $3.58/bbl above contracts three and twelve months out, respectively. The relative strength of prompt WTI came as two new pipelines that connect the Permian Basin to the US Gulf Coast began operations and as US refining activity ticked up. Meanwhile, oil demand growth uncertainty is pressuring contracts further out. For the same reasons, WTI’s discount to Brent narrowed for the third consecutive month in August, hitting $3.53bbl on 19 August, a 13 month low.
50
55
60
65
70
75
Feb 19 Apr 19 Jun 19 Aug 19
$/bbl Crude Futures Front Month Close
NYMEX WTI ICE Brent
Source: ICE, NYMEX
48
50
52
54
56
58
60
62
64
M1 2 3 4 5 6 7 8 9 10 11 12
$/bbl Forward Price Curves
NYMEX WTI ICE Brent
Source: ICE, NYMEX

Oil Market Report Prices
Page | 43 IEA
. All
right
s re
serv
ed.
With sanctions and output curbs mainly limiting the supply of sour grades, the Dubai forward curve steepened in August. At the same time, the elevated Brent-Dubai Exchange of Futures for Swaps (EFS) provided evidence of robust global demand for sweet crude. Consumption of sweet crudes is expected to increase as the new IMO regulations draw near as they yield lower sulphur products. In early September the Brent-Dubai EFS rose to a three month high of $3.68/bbl.
NYMEX ultra-low sulphur diesel (ULSD) futures and ICE gasoil futures declined $3.85/bbl and $3.27/bbl m-o-m, respectively, in August. The ICE gasoil crack forward curve is in contango in the run up to the 2020 IMO switch suggesting that the gasoil market will tighten in the next three months as declining high sulphur fuel oil (HSFO) demand is offset by higher gasoil consumption. NYMEX RBOB prices were down 12% in August as the upcoming switch to winter grades, which are cheaper, weighed on sentiment.
In August, money managers’ net length in oil futures remained flat at around 430 mb. Concerns that demand growth is stalling seemed to deter hedge funds from betting that oil prices will rise. Net length in product futures (ICE gasoil, NYMEX ULSD and NYMEX RBOB) fell by 32% in
-12-11-10-9-8-7-6-5-4-3-2
Feb 19 Apr 19 Jun 19 Aug 19
$/bbl NYMEX WTI vs ICE Brent
WTI - Brent (Mth1)
Source: ICE, NYMEX
0.0
1.0
2.0
3.0
4.0
5.0
Jan 19 Mar 19 May 19 Jul 19 Sep 19
$/bbl Brent - Dubai EFS
Brent-Dubai EFS
Copyright © 2019 Argus Media Ltd
Jun Jul Aug Aug-Jul % Week Commencing:Avg Chg Chg 05 Aug 12 Aug 19 Aug 26 Aug 02 Sep
NYMEXLight Sw eet Crude Oil 54.71 57.55 54.84 -2.71 -4.7 53.29 55.32 55.55 55.23 55.76RBOB 74.78 79.77 70.34 -9.43 -11.8 70.10 70.31 70.14 69.27 64.30ULSD 77.75 80.68 76.83 -3.85 -4.8 75.58 76.86 77.29 76.87 78.46ULSD ($/mmbtu) 13.71 14.23 13.55 -0.68 -4.8 13.33 13.56 13.63 13.56 13.84Henry Hub Natural Gas ($/mmbtu) 2.33 2.30 2.17 -0.13 -5.6 2.10 2.17 2.18 2.25 2.43
ICEBrent 63.04 64.21 59.50 -4.71 -7.3 58.18 59.24 59.87 60.04 60.02Gasoil 76.30 78.71 75.43 -3.27 -4.2 73.99 75.49 75.64 75.54 76.30
Prompt Month DifferentialsNYMEX WTI - ICE Brent -8.33 -6.66 -4.66 2.00 -4.89 -3.92 -4.32 -4.81 -4.26NYMEX ULSD - WTI 23.04 23.13 21.99 -1.14 22.29 21.54 21.74 21.64 22.70NYMEX RBOB - WTI 20.07 22.22 15.50 -6.72 16.81 14.99 14.59 14.04 8.54NYMEX 3-2-1 Crack (RBOB) 21.06 22.52 17.66 -4.86 18.64 17.18 16.97 16.58 13.26NYMEX ULSD - Natural Gas ($/mmbtu) 11.38 11.93 11.38 -0.55 11.23 11.39 11.45 11.30 11.40ICE Gasoil - ICE Brent 13.26 14.50 15.93 1.44 15.81 16.25 15.77 15.50 16.28
Source: ICE, NYMEX.
Prompt Month Oil Futures Prices(monthly and weekly averages, $/bbl)

Oil Market Report Prices
Page | 44 IEA
. All
right
s re
serv
ed.
August to 109 mb. Bets by hedge funds that product futures will rise have been on a declining trend since May.
Spot crude oil prices In August, differentials for sweet crude gained as refiners stepped up efforts to adjust to the higher demand for middle distillates that will come with the new IMO regulations. Meanwhile, differentials for sour crudes were underpinned by healthy demand as refiners return from maintenance and as supplies continued to be constrained by output cuts and sanctions. The price of crude at various locations in the US adjusted as WTI began to move on new pipeline infrastructure. These pipelines, and further additions expected to start-up later in the year, will allow US export capacity to catch up with the growth in production.
Box 6. Finding a way out
In recent years, the ramp up in light tight oil (LTO) production from the Permian Basin has run ahead of infrastructure capacity to transport the liquids to market. As a result, WTI Midland was priced at up to $18/bbl below the price in Cushing and $24/bbl below Houston. Spreads have narrowed in recent months in anticipation of new pipelines coming online. In August, two major new lines from the Permian to the US Gulf Coast started operations, Trafigura’s Cactus 2 and EPIC’s crude pipeline, with combined nameplate capacity of over 1.2 mb/d. WTI Midland gained $3.46/bbl m-o-m against North Sea Dated and is currently sitting at around parity with WTI Cushing. The narrowing of WTI Midland and WTI Cushing’s differential to WTI Houston to -$2.80/bbl on average suggests that output is no longer running against capacity constraints with the modest discount reflecting transportation costs and quality differences. In Oil 2019 we predicted that pipeline constraints in the Permian would be alleviated from September 2019 and we have updated this analysis based on recent company announcements and our US LTO output forecast. This shows that, depending on how quickly the recently commissioned pipelines ramp up, there may be minor bottlenecks in coming months but these should be entirely alleviated when Philips 66’s 900 kb/d Gray Oak line begins operations at the end of the year (see Supply: US vies with Saudi for top oil exporter spot). As a result, differentials for WTI Houston, Cushing and Midland
60
65
70
75
80
85
90
Apr 19 May 19 Jun 19 Jul 19 Aug 19 Sep 19
$/bbl Oil Product Futures
NYMEX ULSD NYMEX RBOB ICE Gasoil
Source: ICE, NYMEX
10
12
14
16
18
20
M1 2 3 4 5 6 7 8 9 10 11 12
$/bbl ICE Gasoil Crack Forward Price Curve
11 Jun 19 11 Jul 1908 Aug 19 10 Sep 19
Source: ICE

Oil Market Report Prices
Page | 45 IEA
. All
right
s re
serv
ed.
are expected to remain slim. The new infrastructure will direct flows to the Gulf Coast and allow the US to further boost its exports. However, prices at the coast strengthened relative to Brent making US crude less competitive. In August, WTI Houston was briefly priced at a premium to Brent for the first time since April and, according to tanker tracking data from Kpler, US exports have come down from record levels seen in June. WTI Houston prices have since eased to $4/bbl below North Sea Dated as additional volumes reach the Gulf Coast.
West Canadian Select prices in Hardisty gained $0.77/bbl m-o-m against Cushing on the announcement that production caps in Alberta will probably be extended to the end of 2020. Growing output and insufficient export infrastructure saw differentials blow out to -$50/bbl in 2018. Since the production curbs were enforced in January 2019, the discount has averaged around $12/bbl.
Price differentials for North Sea grades, including Forties, Brent, Oseberg and Ekofisk, weakened against North Sea Dated m-o-m in August. However, prices rallied over the course of the month as the narrowing of Brent’s premium to WTI made Brent-linked crude more attractive and stirred demand from Asia Pacific. On 14-15 August, flows on the Forties Pipeline System were restricted due to “integrity issues” and the Forties differential dived to a five month low of $0.70/bbl below North Sea Dated. The resumption of normal operations and healthy demand for Forties in China saw the price recover to a premium of $0.10/bbl by end-August.
Weaker naphtha markets and competition from US exports pressured Nigerian grades in August. The premia of both Qua Iboe and Bonny Light held relatively flat, narrowing by only $0.05/bbl and $0.11/bbl m-o-m, respectively, against North Sea Dated. Meanwhile, the premium enjoyed by Angolan grades to North Sea Dated rose for the third consecutive month to reach new record highs. Heavy sweet crudes, such as Dalia (+$0.76/bbl m-o-m against North Sea Dated) and Girassol (+$0.74/bbl m-o-m), are best-suited for producing middle distillates and demand is picking up ahead of the new IMO regulations. Further support came from preliminary loading programmes that indicate a fall in Angolan exports in October.
Urals prices have been volatile since the suspension of flows on the Druzhba pipeline in April due to contamination. In early August, prices rose to a three month high of $0.80/bbl above
-30
-25
-20
-15
-10
-5
0
5
May 18 Aug 18 Nov 18 Feb 19 May 19 Aug 19
$/bbl US grades diff to North Sea Dated
WTI Houston WTI Cushing WTI Midland
Copyright © 2019 Argus Media Ltd
-1.5
-0.5
0.5
1.5
2.5
Mar 19 May 19 Jul 19 Sep 19
$/bbl North Sea Crude Differentials
Statfjord Ekofisk Oseberg Forties
Copyright © 2019 Argus Media Ltd

Oil Market Report Prices
Page | 46 IEA
. All
right
s re
serv
ed.
North Sea Dated as Urals exports were disrupted by ongoing efforts to manage crude contamination. The differential subsequently crashed by $1.86/bbl over the course of the month as supplies returned to the market and on loading programmes which showed that exports will rise further in September. CPC Blend rose by $0.97/bbl m-o-m against North Sea Dated on the back of healthy Chinese demand. Competing Saharan Blend gained $0.58/bbl against North Sea Dated, boosted also as rival WTI became relatively more expensive. Es Sider’s differential to North Sea Dated climbed to a seven year high of $0.40/bbl on 21 August thanks to healthier middle distillate margins in the Mediterranean and as the September loading programme was revised down.
The price of several crudes from the Middle East strengthened against Dubai in August. Global demand for sour crudes was robust, particularly from China as refinery maintenance wound down, and steeper backwardation of the Dubai futures curve indicated prompt market tightness. Light sour Murban’s differential rose by $0.26/bbl over the month, boosted by stronger jet fuel and diesel cracks. The improvement in middle distillate margins also stirred demand for Basra Light which gained by $0.26/bbl m-o-m against Dubai. Conversely, Basra Heavy prices lost $0.51/bbl m-o-m against Dubai as fuel oil cracks tumbled.
-3.0
-2.0
-1.0
0.0
1.0
2.0
3.0
May 18 Aug 18 Nov 18 Feb 19 May 19 Aug 19
$/bbl Angolan Crude Differentials
Cabinda Dalia GirassolHungo Nemba Kissanje
Copyright © 2019 Argus Media Ltd
-3.0
-2.0
-1.0
0.0
1.0
Apr 19 May 19 Jun 19 Jul 19 Aug 19 Sep 19
$/bbl Urals / Saharan / CPC Blend Differentials
Urals NWE CPC Blend Saharan Blend
Copyright © 2019 Argus Media Ltd
Spot crude oil prices and differentials
Table Unavailable
Available in the subscription version.
To subscribe, visit: https://webstore.iea.org/

Oil Market Report Prices
Page | 47 IEA
. All
right
s re
serv
ed.
Spot product prices Cracks for super unleaded and unleaded gasoline on the US Gulf Coast declined by $5.07/bbl and $3.69/bbl m-o-m, respectively, as refining activity picked up providing additional supplies. Downward pressure on prices also came as the summer travel season in the western hemisphere drew to a close and with the upcoming switch to cheaper winter specification gasoline. In Rotterdam, barge quotes for premium unleaded fell by $4.82/bbl over August, with less demand to ship gasoline to the US also weighing on markets. Transatlantic flows had picked up following a refinery fire and closure in Philadelphia in June. In Singapore, unleaded gasoline cracks rose by $0.58/bbl m-o-m and the prompt swap prices averaged $1.48/bbl above contracts for delivery one month later. The market tightened due to healthy demand, in particular from India and Indonesia, amidst ongoing and imminent regional refinery maintenance.
Global naphtha markets stumbled in August. In Rotterdam and the Mediterranean, cracks slipped $1.28/bbl and $1.91/bbl, respectively, against benchmark crude due to weak demand from petrochemical facilities and the anticipation that blending demand will ease. In Singapore, prices fell by 9% over the month as Malaysian supplies returned following maintenance and as petrochemical facilities favoured rival feedstock LPG. Heading into winter, demand for LPG as a heating fuel should pick up and this should make it less price competitive against naphtha.
Spot product prices
Table Unavailable
Available in the subscription version.
To subscribe, visit: https://webstore.iea.org/

Oil Market Report Prices
Page | 48 IEA
. All
right
s re
serv
ed.
Cracks for jet fuel remained elevated in August in the middle of the peak US and European travel season. It is likely that prices also gained traction as demand for middle distillates is set to jump ahead of the new IMO regulations. In Rotterdam, cracks rose by $0.88/bbl m-o-m although market tightness eased towards the end of the month with higher imports to the region. In Singapore, cracks rose by a modest $0.25/bbl m-o-m.
Diesel drew strength as markets showed signs of transitioning to the new IMO regulations. In North West Europe and the Mediterranean ultra-low sulphur diesel cracks gained $1.97/bbl and $0.97/bbl m-o-m, respectively, while in Singapore, 0.05% gasoil was up $0.38/bbl. Singapore is a centre point for IMO preparations and it seems that, as more diesel is used as a blending component to produce compliant fuel, exports from the region are easing. Furthermore, demand picked up in China as the seasonal fishing ban was partially lifted and some supplies are hampered due to maintenance.
With only months to go before the new IMO regulations come into effect, fuel oil markets are increasingly volatile. Despite expectations that demand for HSFO will decline by 2 mb/d, cracks in the major bunkering hub of Singapore rose to $4.82 on 1 August. Less processing of sour crude and logistical preparations for the IMO switch had tightened supply while demand, particularly in the Middle East for power generation was robust. In the first two week of August, prices fell dramatically, by around $15/bbl in all regions, as demand from the Middle East declined seasonally. In North West Europe and the Mediterranean, cracks are at three year lows of $17/bbl below North Sea Dated and Urals, respectively. However, the market in Singapore
-5
0
5
10
15
20
25
30
Mar 19 Apr 19 May 19 Jun 19 Jul 19 Aug 19 Sep 19
$/bbl Gasoline Cracks
NWE Prem Unl USGC 93 ConvMed Prem Unl SP Prem Unl
Copyright © 2019 Argus Media Ltd
-16
-14
-12
-10
-8
-6
-4
-2
0
Mar 19 Apr 19 May 19 Jun 19 Jul 19 Aug 19 Sep 19
$/bbl Naphtha Cracks
NWE SP Med ME Gulf
Copyright © 2019 Argus Media Ltd
10
12
14
16
18
20
Mar 19 Apr 19 May 19 Jun 19 Jul 19 Aug 19 Sep 19
$/bbl Jet/Kerosene Cracks
NWE Jet/kero USGC Jet/kero SP Jet/kero
Copyright © 2019 Argus Media Ltd
5
10
15
20
Mar 19 Apr 19 May 19 Jun 19 Jul 19 Aug 19 Sep 19
$/bbl Diesel Fuel Cracks
NWE ULSD USGC ULSDMed ULSD SP Gasoil 0.05%
SS
Copyright © 2019 Argus Media Ltd
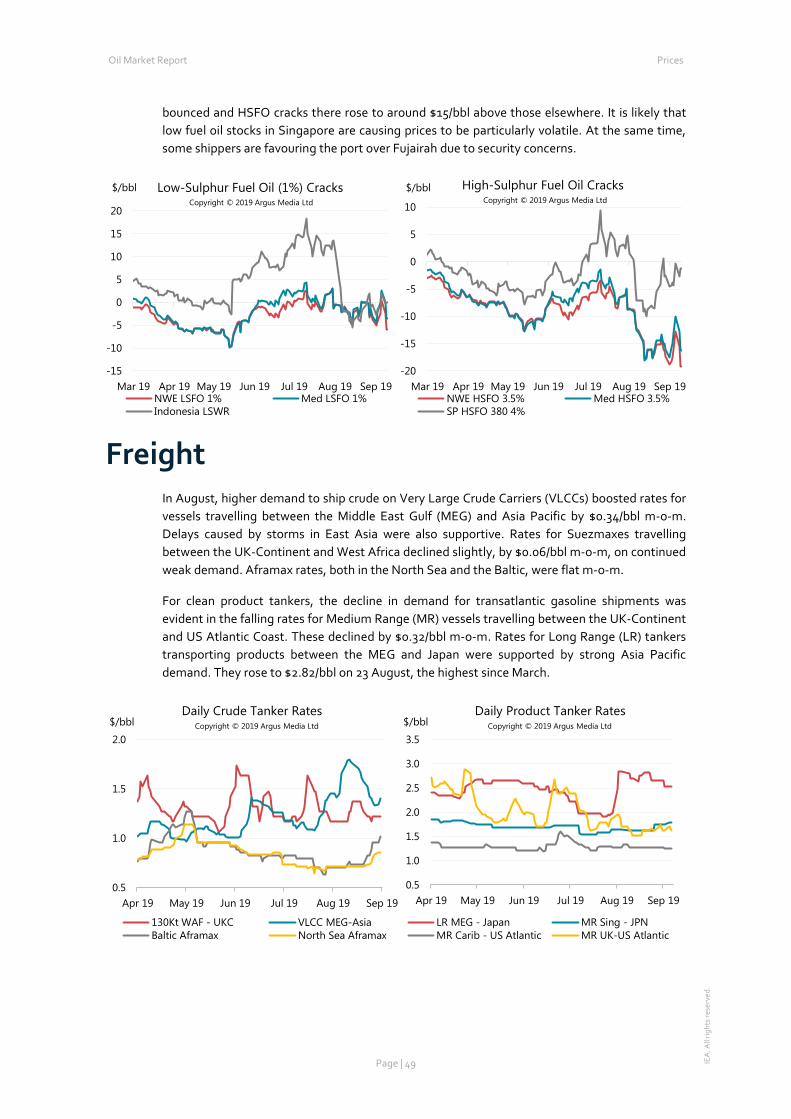
Oil Market Report Prices
Page | 49 IEA
. All
right
s re
serv
ed.
bounced and HSFO cracks there rose to around $15/bbl above those elsewhere. It is likely that low fuel oil stocks in Singapore are causing prices to be particularly volatile. At the same time, some shippers are favouring the port over Fujairah due to security concerns.
Freight In August, higher demand to ship crude on Very Large Crude Carriers (VLCCs) boosted rates for vessels travelling between the Middle East Gulf (MEG) and Asia Pacific by $0.34/bbl m-o-m. Delays caused by storms in East Asia were also supportive. Rates for Suezmaxes travelling between the UK-Continent and West Africa declined slightly, by $0.06/bbl m-o-m, on continued weak demand. Aframax rates, both in the North Sea and the Baltic, were flat m-o-m.
For clean product tankers, the decline in demand for transatlantic gasoline shipments was evident in the falling rates for Medium Range (MR) vessels travelling between the UK-Continent and US Atlantic Coast. These declined by $0.32/bbl m-o-m. Rates for Long Range (LR) tankers transporting products between the MEG and Japan were supported by strong Asia Pacific demand. They rose to $2.82/bbl on 23 August, the highest since March.
-15
-10
-5
0
5
10
15
20
Mar 19 Apr 19 May 19 Jun 19 Jul 19 Aug 19 Sep 19
$/bbl Low-Sulphur Fuel Oil (1%) Cracks
NWE LSFO 1% Med LSFO 1%Indonesia LSWR
Copyright © 2019 Argus Media Ltd
-20
-15
-10
-5
0
5
10
Mar 19 Apr 19 May 19 Jun 19 Jul 19 Aug 19 Sep 19
$/bbl High-Sulphur Fuel Oil Cracks
NWE HSFO 3.5% Med HSFO 3.5%SP HSFO 380 4%
Copyright © 2019 Argus Media Ltd
0.5
1.0
1.5
2.0
Apr 19 May 19 Jun 19 Jul 19 Aug 19 Sep 19
$/bblDaily Crude Tanker Rates
130Kt WAF - UKC VLCC MEG-AsiaBaltic Aframax North Sea Aframax
Copyright © 2019 Argus Media Ltd
0.5
1.0
1.5
2.0
2.5
3.0
3.5
Apr 19 May 19 Jun 19 Jul 19 Aug 19 Sep 19
$/bblDaily Product Tanker Rates
LR MEG - Japan MR Sing - JPNMR Carib - US Atlantic MR UK-US Atlantic
Copyright © 2019 Argus Media Ltd

Oil Market Report Tables
Page | 50
IEA
. All
right
s re
serv
ed.
Tables
Table 1: World Oil Supply And Demand 2016 2017 1Q18 2Q18 3Q18 4Q18 2018 1Q19 2Q19 3Q19 4Q19 2019 1Q20 2Q20 3Q20 4Q20 2020
OECD DEMANDAmericas 24.9 25.1 25.2 25.3 25.8 25.6 25.5 25.3 25.4 26.0 25.9 25.7 25.2 25.7 26.3 26.1 25.9Europe 14.0 14.4 14.1 14.2 14.7 14.1 14.3 13.9 14.0 14.8 14.3 14.2 14.0 14.2 14.7 14.4 14.3Asia Oceania 8.1 8.1 8.7 7.7 7.8 8.1 8.1 8.3 7.5 7.7 8.3 7.9 8.4 7.5 7.8 8.3 8.0
Total OECD 47.1 47.6 47.9 47.3 48.2 47.8 47.8 47.5 46.9 48.5 48.5 47.9 47.6 47.5 48.9 48.8 48.2
NON-OECD DEMANDFSU 4.4 4.5 4.5 4.6 4.9 4.8 4.7 4.6 4.8 5.1 5.0 4.9 4.7 4.9 5.1 5.0 4.9Europe 0.7 0.7 0.7 0.7 0.8 0.8 0.8 0.8 0.8 0.8 0.8 0.8 0.8 0.8 0.8 0.8 0.8China 12.0 12.5 12.7 13.0 13.1 13.1 13.0 13.0 13.7 13.5 13.6 13.5 13.3 14.0 13.9 13.9 13.8Other Asia 13.2 13.7 14.1 14.3 13.7 14.2 14.1 14.5 14.3 14.1 14.7 14.4 15.0 14.8 14.5 15.2 14.9Americas 6.5 6.4 6.3 6.3 6.5 6.4 6.4 6.2 6.3 6.5 6.4 6.4 6.3 6.4 6.5 6.5 6.4Middle East 8.4 8.4 8.1 8.4 8.7 8.2 8.3 8.1 8.2 8.6 8.1 8.3 8.0 8.3 8.7 8.1 8.3Africa 4.2 4.2 4.3 4.2 4.1 4.3 4.2 4.3 4.3 4.2 4.3 4.3 4.4 4.4 4.3 4.4 4.4
Total Non-OECD 49.3 50.6 50.7 51.6 51.8 51.7 51.5 51.6 52.4 52.8 53.0 52.5 52.5 53.6 53.8 54.0 53.5Total Demand1 96.4 98.2 98.6 98.9 100.0 99.5 99.3 99.1 99.4 101.3 101.5 100.3 100.1 101.0 102.7 102.8 101.6
OECD SUPPLYAmericas 19.6 20.5 22.0 22.3 23.4 24.2 23.0 24.0 24.5 24.7 25.3 24.6 25.6 25.8 26.1 26.4 26.0Europe 3.5 3.5 3.6 3.4 3.3 3.5 3.5 3.5 3.2 3.2 3.5 3.3 3.7 3.7 3.7 3.8 3.7Asia Oceania 0.4 0.4 0.4 0.4 0.4 0.4 0.4 0.4 0.5 0.5 0.5 0.5 0.5 0.6 0.6 0.6 0.6
Total OECD4 23.5 24.4 25.9 26.1 27.2 28.2 26.9 27.9 28.1 28.3 29.3 28.4 29.8 30.1 30.3 30.8 30.3
NON-OECD SUPPLYFSU 14.2 14.3 14.4 14.4 14.6 14.8 14.6 14.8 14.4 14.5 14.6 14.6 14.7 14.6 14.6 14.6 14.6Europe 0.1 0.1 0.1 0.1 0.1 0.1 0.1 0.1 0.1 0.1 0.1 0.1 0.1 0.1 0.1 0.1 0.1China 4.0 3.9 3.8 3.9 3.8 3.9 3.8 3.9 4.0 3.9 3.9 3.9 3.9 3.9 3.9 3.9 3.9Other Asia 3.6 3.5 3.4 3.4 3.3 3.3 3.4 3.3 3.3 3.2 3.2 3.3 3.2 3.2 3.1 3.1 3.2Americas 4.5 4.6 4.5 4.6 4.4 4.6 4.5 4.5 4.6 4.8 5.0 4.7 5.0 5.1 5.1 5.1 5.1Middle East 3.3 3.2 3.2 3.3 3.3 3.3 3.3 3.3 3.3 3.3 3.3 3.3 3.3 3.3 3.3 3.3 3.3Africa 1.4 1.4 1.4 1.5 1.5 1.4 1.4 1.4 1.4 1.4 1.5 1.4 1.5 1.5 1.5 1.5 1.5
Total Non-OECD4 31.0 31.0 30.9 31.1 31.0 31.5 31.1 31.4 31.0 31.3 31.5 31.3 31.6 31.6 31.5 31.5 31.6Processing gains3 2.3 2.3 2.3 2.3 2.3 2.3 2.3 2.3 2.3 2.3 2.3 2.3 2.4 2.4 2.4 2.4 2.4
Global Biofuels 2.4 2.5 2.1 2.8 3.1 2.5 2.6 2.2 2.9 3.1 2.6 2.7 2.4 2.9 3.2 2.8 2.8
Total Non-OPEC Supply 59.2 60.1 61.3 62.2 63.6 64.5 62.9 63.9 64.4 65.1 65.7 64.8 66.2 67.1 67.4 67.5 67.0
OPEC2
Crude 32.4 32.0 31.7 31.6 32.0 32.2 31.9 30.7 30.0 0.0 0.0 20.1 0.0NGLs 5.4 5.5 5.5 5.5 5.5 5.5 5.5 5.6 5.6 5.5 5.5 5.6 5.6 5.6 5.6 5.6 5.6Total OPEC 37.8 37.5 37.2 37.1 37.6 37.7 37.4 36.2 35.6 0.0 0.0 25.7 0.0Total Supply 97.0 97.6 98.6 99.3 101.2 102.2 100.3 100.1 100.1 0.0 0.0 90.4 0.0
STOCK CHANGES AND MISCELLANEOUSReported OECDIndustry 0.0 -0.4 -0.3 0.0 0.6 0.1 0.1 0.1 0.6 0.0 0.0 0.2 0.0Government 0.0 -0.1 0.0 0.0 0.0 -0.2 -0.1 0.1 -0.1 0.0 0.0 0.0 0.0
Total 0.0 -0.5 -0.2 -0.1 0.5 -0.1 0.0 0.2 0.5 0.0 0.0 0.2 0.0Floating storage/Oil in transit 0.2 0.4 -1.0 0.3 -0.3 0.6 0.0 -0.3 -0.5 0.0 0.0 0.0 0.0Miscellaneous to balance5 0.4 -0.4 1.2 0.2 1.0 2.2 1.1 1.1 0.7 0.0 0.0 -10.1 0.0
Total Stock Ch. & Misc 0.6 -0.6 -0.1 0.4 1.2 2.7 1.1 1.0 0.7 0.0 0.0 -9.9 0.0
Memo items:Call on OPEC crude + Stock ch.6 31.8 32.6 31.8 31.1 30.8 29.5 30.8 29.6 29.4 30.6 30.3 30.0 28.3 28.4 29.7 29.7 29.01 Measured as deliveries from refineries and primary stocks, comprises inland deliveries, international marine bunkers, refinery fuel, crude for direct burning, oil from non-conventional sources and other sources of supply. Includes Biofuels.2 OPEC data based on today's membership throughout the time series. 3 Net volumetric gains and losses in the refining process and marine transportation losses.4 Comprises crude oil, condensates, NGLs, oil from non-conventional sources and other sources of supply.5 Includes changes in non-reported stocks in OECD and non-OECD areas.6 Equals the arithmetic difference between total demand minus total non-OPEC supply minus OPEC NGLs.
Table 1WORLD OIL SUPPLY AND DEMAND
(million barrels per day)

Oil Market Report Tables
Page | 51
IEA
. All
right
s re
serv
ed.
Table 1a: World Oil Supply And Demand: Changes From Last Month’s Table 1
2016 2017 1Q18 2Q18 3Q18 4Q18 2018 1Q19 2Q19 3Q19 4Q19 2019 1Q20 2Q20 3Q20 4Q20 2020
OECD DEMANDAmericas - - - - - - - - - - - - -0.1 -0.1 -0.1 - -0.1Europe - - - - - - - - -0.2 0.1 - - - -0.1 -0.1 - -0.1Asia Oceania - - - - - - - - - - - - - - 0.1 0.1 -
Total OECD - - - - - - - -0.1 -0.3 0.1 0.1 - -0.1 -0.2 -0.2 - -0.1
NON-OECD DEMANDFSU - - - - - - - - - 0.1 - - - - 0.1 - -Europe - - - - - - - - - - - - - - - - -China - - - - - - - - 0.1 - - - - - - - -Other Asia - - - - - - - - - - - - - - -0.1 - -Americas - - - - - - - - - - - - - - - - -Middle East - - - - - - - - -0.1 - - - - - - - -Africa - - - - - - - - - - - - - - - - -
Total Non-OECD - - - - - - - - - - - - - 0.1 - - -Total Demand - - - - - - - - -0.3 0.1 0.1 - - -0.1 -0.1 0.1 -
OECD SUPPLYAmericas - - - - - - - - - - - - - - -0.1 - -Europe - - - - - - - - - -0.1 - - 0.1 0.1 - - 0.1Asia Oceania - - - - - - - - - - - - - - - - -
Total OECD 0.0 0.0 0.0 0.0 0.0 0.0 0.0 0.0 0.0 -0.1 0.0 0.0 0.1 0.2 0.0 -0.1 0.0
NON-OECD SUPPLYFSU - - - - - - - - - 0.1 - - - - 0.1 - 0.1Europe - - - - - - - - - - - - - - - - -China - - - - - - - - - - - - - - - - -Other Asia - - - - - - - - - - - - - - - - -Americas - - - - - - - - - - - - - - - - -Middle East - - - - - - - - - - - - - - - - -Africa - - - - - - - - - - - - - - - - -
Total Non-OECD 0.0 0.0 0.0 0.0 0.0 0.0 0.0 0.0 0.0 0.1 0.0 0.0 0.0 0.0 0.1 0.0 0.0Processing gains - - - - - - - - - - - - - - - - -
Global Biofuels - - - - - - - - - 0.1 -0.1 - - - - - -
Total Non-OPEC Supply - - - - - - - - -0.1 0.1 - - 0.1 0.2 0.1 -0.1 0.1
OPECCrude - - - - - - - - - - - 2.5 -NGLs - - - - - - - - - - - - - - - - -Total OPEC - 0.0 0.0 - 0.0 - 0.0 0.0 - - - 2.5 -Total Supply - 0.0 0.0 - 0.0 - 0.0 0.0 -0.1 - - 2.5 -
STOCK CHANGES AND MISCELLANEOUSREPORTED OECDIndustry - - 0.2 - - - - - -0.3 - - -0.1Government - - - - - - - - - - - -
Total - - 0.1 - - - - 0.1 -0.3 - - -0.1Floating storage/Oil in transit - - - - - - - - - - - -Miscellaneous to balance - - -0.1 0.1 - - - - 0.5 - - 2.6
Total Stock Ch. & Misc - - - 0.1 - - - - 0.2 - - 2.6 -
Memo items:Call on OPEC crude + Stock ch. - - - -0.1 - - - - -0.2 - 0.1 - -0.1 -0.3 -0.2 0.2 -0.1When submitting their monthly oil statistics, OECD Member countries periodically update data for prior periods. Similar updates to non-OECD data can occur.
Table 1aWORLD OIL SUPPLY AND DEMAND: CHANGES FROM LAST MONTH'S TABLE 1
(million barrels per day)

Oil Market Report Tables
Page | 52
IEA
. All
right
s re
serv
ed.
Table 2: Summary of Global Oil Demand 2017 1Q18 2Q18 3Q18 4Q18 2018 1Q19 2Q19 3Q19 4Q19 2019 1Q20 2Q20 3Q20 4Q20 2020
Demand (mb/d)Americas 25.07 25.20 25.31 25.78 25.61 25.48 25.27 25.43 26.03 25.93 25.67 25.21 25.74 26.34 26.15 25.86Europe 14.38 14.06 14.20 14.66 14.09 14.25 13.89 14.01 14.77 14.30 14.25 13.96 14.16 14.74 14.36 14.31Asia Oceania 8.15 8.66 7.73 7.75 8.10 8.06 8.33 7.49 7.71 8.26 7.95 8.41 7.55 7.78 8.32 8.01Total OECD 47.6 47.9 47.3 48.2 47.8 47.8 47.5 46.9 48.5 48.5 47.9 47.6 47.5 48.9 48.8 48.2Asia 26.20 26.80 27.26 26.83 27.26 27.04 27.49 28.02 27.64 28.32 27.87 28.26 28.80 28.43 29.14 28.66Middle East 8.38 8.08 8.42 8.69 8.16 8.34 8.13 8.21 8.63 8.14 8.28 8.02 8.31 8.70 8.12 8.29Americas 6.45 6.32 6.34 6.48 6.44 6.39 6.24 6.33 6.46 6.41 6.36 6.27 6.38 6.50 6.47 6.41FSU 4.55 4.50 4.62 4.89 4.82 4.71 4.63 4.75 5.05 4.97 4.85 4.73 4.87 5.13 4.99 4.93Africa 4.23 4.29 4.24 4.11 4.26 4.23 4.31 4.33 4.21 4.35 4.30 4.39 4.40 4.28 4.42 4.37Europe 0.75 0.73 0.74 0.77 0.80 0.76 0.80 0.78 0.79 0.81 0.80 0.82 0.78 0.80 0.84 0.81Total Non-OECD 50.6 50.7 51.6 51.8 51.7 51.5 51.6 52.4 52.8 53.0 52.5 52.5 53.6 53.8 54.0 53.5World 98.2 98.6 98.9 100.0 99.5 99.3 99.1 99.4 101.3 101.5 100.3 100.1 101.0 102.7 102.8 101.6
of which: US50 19.96 20.24 20.33 20.63 20.60 20.45 20.31 20.39 20.83 20.77 20.57 20.25 20.72 21.15 20.98 20.78Europe 5* 8.32 8.22 8.24 8.34 8.17 8.24 8.10 8.08 8.38 8.22 8.19 8.06 8.10 8.33 8.22 8.18
China 12.49 12.70 12.96 13.14 13.09 12.97 13.03 13.72 13.49 13.64 13.47 13.29 13.96 13.89 13.91 13.76Japan 3.92 4.31 3.46 3.56 3.92 3.81 4.09 3.41 3.52 3.93 3.73 4.04 3.37 3.53 3.92 3.71India 4.66 4.91 5.03 4.62 4.89 4.86 5.14 5.07 4.82 5.14 5.04 5.35 5.32 5.01 5.40 5.27
Russia 3.39 3.36 3.43 3.68 3.60 3.52 3.47 3.55 3.83 3.68 3.63 3.53 3.63 3.86 3.69 3.68Brazil 3.03 2.97 2.94 3.10 3.11 3.03 3.01 3.05 3.19 3.18 3.11 3.06 3.12 3.22 3.22 3.15
Saudi Arabia 3.30 2.96 3.21 3.35 2.99 3.13 2.96 3.05 3.27 3.01 3.07 2.79 3.04 3.24 2.88 2.99Canada 2.42 2.34 2.37 2.58 2.51 2.45 2.37 2.41 2.61 2.59 2.50 2.37 2.40 2.61 2.57 2.49
Korea 2.63 2.73 2.64 2.58 2.53 2.62 2.63 2.48 2.56 2.66 2.58 2.73 2.54 2.60 2.72 2.65Mexico 2.02 1.91 1.94 1.89 1.80 1.89 1.88 1.95 1.90 1.87 1.90 1.86 1.92 1.89 1.88 1.89
Iran 1.92 1.98 1.98 1.98 1.98 1.98 1.99 1.95 1.94 1.93 1.95 2.01 1.96 1.95 1.93 1.96Total 68.07 68.63 68.54 69.46 69.21 68.96 68.97 69.09 70.35 70.60 69.76 69.37 70.08 71.27 71.32 70.52
% of World 0.69 0.70 0.69 0.69 0.70 0.69 0.70 0.70 0.69 0.70 0.70 0.69 0.69 0.69 0.69 0.69Annual Change (% per annum)Americas 0.7 2.3 0.7 2.4 1.0 1.6 0.3 0.5 1.0 1.3 0.8 -0.2 1.2 1.2 0.8 0.8Europe 2.5 1.2 -1.0 -1.0 -2.7 -0.9 -1.2 -1.3 0.7 1.5 -0.1 0.5 1.1 -0.2 0.5 0.4Asia Oceania 0.1 1.2 -0.4 -1.6 -3.6 -1.1 -3.7 -3.2 -0.5 2.0 -1.4 1.0 0.7 0.9 0.7 0.9Total OECD 1.1 1.8 0.0 0.7 -0.9 0.4 -0.9 -0.7 0.7 1.4 0.2 0.2 1.1 0.7 0.7 0.7Asia 4.1 3.5 2.6 3.9 2.8 3.2 2.6 2.8 3.0 3.9 3.1 2.8 2.8 2.8 2.9 2.8Middle East 0.1 -0.2 -1.5 -0.7 0.6 -0.5 0.6 -2.5 -0.7 -0.3 -0.7 -1.4 1.2 0.8 -0.3 0.1Americas -0.3 0.1 -1.6 -1.5 -0.5 -0.9 -1.3 -0.1 -0.2 -0.4 -0.5 0.5 0.8 0.6 0.8 0.7FSU 2.5 4.1 2.1 2.9 5.0 3.5 2.9 3.0 3.4 3.1 3.1 2.1 2.4 1.5 0.6 1.6Africa 1.5 -0.6 -0.2 -0.8 0.9 -0.2 0.4 2.1 2.5 2.0 1.7 1.9 1.6 1.5 1.7 1.7Europe 3.2 2.4 -1.0 1.3 5.2 2.0 9.5 4.3 2.7 2.2 4.6 1.5 0.9 0.8 2.7 1.5Total Non-OECD 2.5 2.2 1.1 1.9 2.1 1.8 1.7 1.5 2.0 2.4 1.9 1.7 2.1 2.0 1.8 1.9World 1.8 2.0 0.5 1.3 0.6 1.1 0.5 0.5 1.3 2.0 1.1 1.0 1.7 1.4 1.3 1.3Annual Change (mb/d)Americas 0.18 0.58 0.18 0.61 0.25 0.41 0.07 0.12 0.25 0.32 0.19 -0.06 0.31 0.31 0.22 0.19Europe 0.35 0.16 -0.15 -0.14 -0.39 -0.13 -0.17 -0.19 0.11 0.21 -0.01 0.06 0.15 -0.02 0.06 0.06Asia Oceania 0.01 0.10 -0.03 -0.13 -0.31 -0.09 -0.32 -0.24 -0.04 0.16 -0.11 0.08 0.06 0.07 0.06 0.07Total OECD 0.5 0.8 0.0 0.3 -0.4 0.2 -0.4 -0.3 0.3 0.7 0.1 0.1 0.5 0.4 0.3 0.3Asia 1.04 0.91 0.68 1.01 0.74 0.84 0.68 0.75 0.81 1.06 0.83 0.77 0.79 0.79 0.82 0.79Middle East 0.01 -0.02 -0.12 -0.06 0.05 -0.04 0.05 -0.21 -0.06 -0.02 -0.06 -0.11 0.10 0.07 -0.02 0.01Americas -0.02 0.01 -0.10 -0.10 -0.03 -0.06 -0.08 0.00 -0.01 -0.02 -0.03 0.03 0.05 0.04 0.05 0.04FSU 0.11 0.18 0.10 0.14 0.23 0.16 0.13 0.14 0.16 0.15 0.15 0.10 0.11 0.07 0.03 0.08Africa 0.06 -0.03 -0.01 -0.04 0.04 -0.01 0.02 0.09 0.10 0.09 0.07 0.08 0.07 0.07 0.08 0.07Europe 0.02 0.02 -0.01 0.01 0.04 0.01 0.07 0.03 0.02 0.02 0.03 0.01 0.01 0.01 0.02 0.01Total Non-OECD 1.2 1.1 0.5 1.0 1.1 0.9 0.9 0.8 1.0 1.3 1.0 0.9 1.1 1.0 1.0 1.0World 1.8 1.9 0.5 1.3 0.6 1.1 0.4 0.5 1.3 2.0 1.1 1.0 1.6 1.4 1.3 1.3Revisions to Oil Demand from Last Month's Report (mb/d)Americas 0.00 0.00 0.00 0.00 0.00 0.00 -0.04 -0.04 0.01 0.02 -0.01 -0.11 -0.05 -0.13 -0.04 -0.08Europe 0.00 0.00 -0.05 -0.03 -0.02 -0.02 -0.02 -0.23 0.05 0.02 -0.05 0.01 -0.15 -0.08 0.02 -0.05Asia Oceania 0.00 0.00 0.00 0.00 0.00 0.00 0.00 -0.01 0.03 0.03 0.01 0.03 0.03 0.07 0.06 0.05Total OECD - -0.0 -0.0 -0.0 -0.0 -0.0 -0.1 -0.3 0.1 0.1 -0.0 -0.1 -0.2 -0.2 0.0 -0.1Asia 0.00 0.00 0.00 0.00 0.00 0.00 0.03 0.02 -0.09 -0.03 -0.02 0.02 0.01 -0.06 -0.01 -0.01Middle East 0.00 0.00 0.00 0.00 0.00 0.00 0.00 -0.05 -0.02 -0.02 -0.02 -0.03 -0.04 0.00 0.01 -0.02Americas 0.00 0.00 0.00 0.00 0.00 0.00 0.00 0.00 0.04 0.04 0.02 0.03 0.03 0.03 0.03 0.03FSU 0.00 0.00 0.00 0.00 0.00 0.00 0.00 0.01 0.08 0.01 0.02 0.00 0.03 0.07 0.00 0.03Africa 0.00 0.00 0.00 0.00 0.00 0.00 0.00 0.01 0.01 0.01 0.01 0.01 0.01 0.01 0.01 0.01Europe 0.00 0.00 0.00 0.00 0.00 0.00 0.00 0.00 0.00 0.00 0.00 0.00 0.00 0.00 0.00 0.00Total Non-OECD - -0.0 -0.0 -0.0 0.0 -0.0 0.0 -0.0 0.0 -0.0 0.0 0.0 0.1 0.0 0.0 0.0World - -0.0 -0.0 -0.0 -0.0 -0.0 -0.0 -0.3 0.1 0.1 -0.0 -0.0 -0.1 -0.1 0.1 -0.0Revisions to Oil Demand Growth from Last Month's Report (mb/d)World 0.00 0.00 -0.05 -0.03 -0.02 -0.03 -0.02 -0.25 0.13 0.09 -0.01 -0.02 0.19 -0.21 0.01 -0.01* France, Germany, Italy, Spain and UK
Table 2SUMMARY OF GLOBAL OIL DEMAND

Oil Market Report Tables
Page | 53
IEA
. All
right
s re
serv
ed.
Table 2a: OECD Regional Oil Demand 2017 2018 3Q18 4Q18 1Q19 2Q19 Apr 19 May 19 Jun 19 2 May 19 Jun 18
AmericasLPG and ethane 3.39 3.67 3.51 3.81 4.15 3.51 3.62 3.36 3.55 0.19 0.32 Naphtha 0.31 0.30 0.32 0.33 0.30 0.28 0.30 0.27 0.26 -0.01 -0.02 Motor gasoline 11.08 11.08 11.28 11.03 10.70 11.26 11.12 11.20 11.45 0.25 -0.18 Jet and kerosene 1.98 2.03 2.12 2.01 1.97 2.10 2.07 2.08 2.15 0.07 -0.02 Gasoil/diesel oil 5.15 5.31 5.23 5.39 5.44 5.16 5.11 5.22 5.14 -0.08 -0.03 Residual fuel oil 0.66 0.62 0.66 0.61 0.62 0.55 0.56 0.52 0.57 0.05 0.03 Other products 2.51 2.47 2.66 2.43 2.10 2.58 2.40 2.67 2.68 0.01 -0.05
Total 25.1 25.5 25.8 25.6 25.3 25.4 25.2 25.3 25.8 0.5 0.0
EuropeLPG and ethane 1.15 1.16 1.15 1.11 1.12 1.07 1.08 1.05 1.07 0.02 -0.03 Naphtha 1.13 1.03 1.00 0.93 1.13 0.88 0.98 0.83 0.85 0.02 -0.13 Motor gasoline 1.99 1.97 2.05 1.94 1.84 2.04 2.04 2.01 2.08 0.06 -0.04 Jet and kerosene 1.45 1.51 1.69 1.44 1.38 1.57 1.55 1.53 1.64 0.11 0.06 Gasoil/diesel oil 6.48 6.44 6.45 6.57 6.41 6.32 6.45 6.20 6.31 0.10 -0.09 Residual fuel oil 0.89 0.86 0.88 0.84 0.88 0.85 0.90 0.85 0.81 -0.04 -0.05 Other products 1.29 1.28 1.42 1.26 1.13 1.28 1.27 1.31 1.26 -0.05 -0.10
Total 14.4 14.3 14.7 14.1 13.9 14.0 14.3 13.8 14.0 0.2 -0.4
Asia OceaniaLPG and ethane 0.76 0.75 0.68 0.73 0.85 0.72 0.76 0.73 0.65 -0.08 -0.07 Naphtha 2.08 2.04 2.02 2.07 2.10 1.91 1.94 1.91 1.88 -0.04 0.05 Motor gasoline 1.54 1.53 1.59 1.52 1.47 1.47 1.51 1.43 1.47 0.04 -0.05 Jet and kerosene 0.93 0.93 0.74 1.02 1.15 0.78 0.89 0.72 0.73 0.01 0.03 Gasoil/diesel oil 1.89 1.89 1.84 1.92 1.94 1.87 1.95 1.80 1.87 0.08 -0.03 Residual fuel oil 0.54 0.53 0.50 0.51 0.50 0.41 0.44 0.39 0.40 0.01 -0.03 Other products 0.40 0.40 0.39 0.33 0.32 0.34 0.26 0.40 0.36 -0.04 -0.09
Total 8.1 8.1 7.8 8.1 8.3 7.5 7.7 7.4 7.4 -0.0 -0.2
OECDLPG and ethane 5.30 5.58 5.35 5.64 6.12 5.29 5.46 5.14 5.28 0.13 0.23 Naphtha 3.52 3.38 3.34 3.33 3.54 3.07 3.22 3.01 2.99 -0.02 -0.10 Motor gasoline 14.62 14.58 14.93 14.49 14.02 14.76 14.67 14.64 14.99 0.36 -0.27 Jet and kerosene 4.35 4.46 4.55 4.47 4.50 4.45 4.50 4.33 4.53 0.20 0.07 Gasoil/diesel oil 13.53 13.64 13.52 13.88 13.79 13.35 13.51 13.22 13.32 0.09 -0.15 Residual fuel oil 2.09 2.01 2.04 1.96 1.99 1.81 1.90 1.76 1.78 0.02 -0.05 Other products 4.20 4.14 4.46 4.02 3.55 4.20 3.93 4.37 4.30 -0.07 -0.24
Total 47.6 47.8 48.2 47.8 47.5 46.9 47.2 46.5 47.2 0.7 -0.51 Demand, measured as deliveries from refineries and primary stocks, comprises inland deliveries, international bunkers and refinery fuel. It includes crude for direct burning, oil from non-conventional sources and other sources of supply. Jet/kerosene comprises jet kerosene and non-aviation kerosene. Gasoil comprises diesel, light heating oil and other gasoils. North America comprises US 50 states, US territories, Mexico and Canada. 2 Latest official OECD submissions (MOS).
Latest month vs.
Table 2aOECD REGIONAL OIL DEMAND1
(million barrels per day)

Oil Market Report Tables
Page | 54
IEA
. All
right
s re
serv
ed.
Table 2b: Oil Demand in Selected OECD Countries
2017 2018 3Q18 4Q18 1Q19 2Q19 Apr 19 May 19 Jun 19 2 May 19 Jun 18
United States3
LPG and ethane 2.54 2.85 2.68 3.04 3.29 2.66 2.71 2.57 2.72 0.15 0.18 Naphtha 0.23 0.23 0.24 0.24 0.21 0.21 0.22 0.21 0.21 0.01 0.01 Motor gasoline 9.33 9.32 9.51 9.25 8.96 9.47 9.36 9.40 9.65 0.25 -0.15 Jet and kerosene 1.69 1.72 1.78 1.70 1.66 1.78 1.75 1.78 1.81 0.03 -0.05 Gasoil/diesel oil 3.93 4.13 4.05 4.18 4.28 4.02 3.98 4.04 4.03 -0.02 0.07 Residual fuel oil 0.34 0.32 0.34 0.34 0.29 0.23 0.26 0.20 0.24 0.04 -0.01 Other products 1.90 1.88 2.04 1.85 1.62 2.02 1.92 2.07 2.05 -0.01 -0.05
Total 20.0 20.5 20.6 20.6 20.3 20.4 20.2 20.3 20.7 0.4 -0.0JapanLPG and ethane 0.41 0.40 0.34 0.39 0.47 0.35 0.39 0.37 0.30 -0.08 -0.06 Naphtha 0.78 0.74 0.70 0.80 0.80 0.69 0.72 0.67 0.69 0.02 0.15 Motor gasoline 0.87 0.86 0.92 0.85 0.81 0.81 0.84 0.80 0.80 0.00 -0.05 Jet and kerosene 0.52 0.50 0.33 0.57 0.69 0.37 0.46 0.33 0.33 0.00 0.01 Diesel 0.44 0.46 0.47 0.49 0.47 0.45 0.46 0.43 0.47 0.03 -0.01 Other gasoil 0.34 0.32 0.27 0.32 0.35 0.28 0.32 0.26 0.27 0.01 0.00 Residual fuel oil 0.28 0.28 0.26 0.27 0.26 0.21 0.22 0.20 0.21 0.01 0.01 Other products 0.28 0.26 0.26 0.23 0.25 0.23 0.18 0.26 0.25 -0.01 0.00
Total 3.9 3.8 3.6 3.9 4.1 3.4 3.6 3.3 3.3 -0.0 0.0GermanyLPG and ethane 0.13 0.11 0.11 0.09 0.12 0.13 0.13 0.12 0.13 0.01 -0.01 Naphtha 0.30 0.27 0.24 0.23 0.33 0.22 0.22 0.23 0.21 -0.03 -0.02 Motor gasoline 0.50 0.49 0.50 0.48 0.47 0.50 0.49 0.51 0.50 -0.01 -0.02 Jet and kerosene 0.22 0.22 0.25 0.22 0.20 0.23 0.25 0.22 0.24 0.02 -0.01 Diesel 0.78 0.76 0.79 0.77 0.75 0.78 0.80 0.79 0.75 -0.03 -0.04 Other gasoil 0.35 0.32 0.28 0.35 0.41 0.29 0.28 0.28 0.32 0.04 0.12 Residual fuel oil 0.07 0.06 0.06 0.05 0.06 0.05 0.06 0.04 0.06 0.01 -0.01 Other products 0.10 0.11 0.14 0.13 0.08 0.10 0.10 0.09 0.10 0.00 -0.03
Total 2.5 2.4 2.4 2.3 2.4 2.3 2.3 2.3 2.3 0.0 -0.0ItalyLPG and ethane 0.10 0.10 0.08 0.10 0.09 0.07 0.08 0.07 0.05 -0.01 -0.02 Naphtha 0.12 0.13 0.13 0.11 0.08 0.08 0.08 0.08 0.09 0.02 -0.02 Motor gasoline 0.17 0.17 0.18 0.16 0.12 0.14 0.15 0.13 0.15 0.01 -0.04 Jet and kerosene 0.10 0.11 0.13 0.10 0.08 0.11 0.10 0.11 0.12 0.01 0.01 Diesel 0.45 0.46 0.46 0.47 0.45 0.45 0.46 0.45 0.45 0.00 -0.03 Other gasoil 0.08 0.08 0.08 0.08 0.06 0.06 0.06 0.05 0.08 0.02 0.00 Residual fuel oil 0.07 0.07 0.07 0.07 0.06 0.07 0.07 0.07 0.07 0.00 -0.01 Other products 0.15 0.16 0.17 0.17 0.14 0.16 0.15 0.16 0.17 0.01 0.01
Total 1.2 1.3 1.3 1.3 1.1 1.1 1.1 1.1 1.2 0.1 -0.1FranceLPG and ethane 0.12 0.13 0.11 0.12 0.15 0.12 0.13 0.12 0.11 -0.01 0.00 Naphtha 0.12 0.10 0.12 0.07 0.14 0.11 0.13 0.11 0.11 0.00 0.00 Motor gasoline 0.18 0.19 0.20 0.19 0.18 0.21 0.21 0.20 0.21 0.01 0.01 Jet and kerosene 0.16 0.17 0.19 0.16 0.16 0.18 0.18 0.17 0.18 0.01 0.01 Diesel 0.72 0.71 0.71 0.72 0.68 0.71 0.74 0.70 0.70 0.00 -0.04 Other gasoil 0.25 0.24 0.23 0.25 0.26 0.20 0.22 0.18 0.20 0.02 0.01 Residual fuel oil 0.05 0.05 0.05 0.05 0.05 0.05 0.06 0.05 0.05 -0.01 0.01 Other products 0.12 0.12 0.14 0.13 0.10 0.12 0.12 0.11 0.14 0.03 -0.01
Total 1.7 1.7 1.7 1.7 1.7 1.7 1.8 1.6 1.7 0.1 0.0United KingdomLPG and ethane 0.14 0.14 0.13 0.14 0.14 0.13 0.12 0.16 0.12 -0.04 -0.03 Naphtha 0.03 0.03 0.02 0.03 0.02 0.04 0.04 0.04 0.03 -0.01 0.01 Motor gasoline 0.29 0.28 0.29 0.28 0.29 0.29 0.29 0.28 0.29 0.01 -0.02 Jet and kerosene 0.32 0.32 0.33 0.31 0.33 0.32 0.34 0.31 0.30 -0.01 0.01 Diesel 0.52 0.52 0.52 0.52 0.51 0.53 0.54 0.49 0.57 0.08 0.03 Other gasoil 0.14 0.14 0.16 0.14 0.12 0.14 0.13 0.13 0.15 0.02 -0.01 Residual fuel oil 0.03 0.03 0.02 0.03 0.02 0.02 0.02 0.02 0.02 0.00 0.00 Other products 0.12 0.11 0.12 0.11 0.11 0.11 0.12 0.12 0.10 -0.02 -0.02
Total 1.6 1.6 1.6 1.6 1.5 1.6 1.6 1.6 1.6 0.0 -0.0CanadaLPG and ethane 0.40 0.39 0.41 0.35 0.42 0.41 0.46 0.38 0.40 0.02 0.13 Naphtha 0.05 0.05 0.05 0.05 0.05 0.03 0.05 0.02 0.01 -0.01 -0.04 Motor gasoline 0.84 0.88 0.92 0.91 0.85 0.87 0.87 0.87 0.88 0.01 0.00 Jet and kerosene 0.14 0.16 0.19 0.16 0.16 0.17 0.17 0.15 0.20 0.05 0.03 Diesel 0.29 0.26 0.26 0.26 0.27 0.26 0.27 0.26 0.27 0.01 0.00 Other gasoil 0.27 0.29 0.31 0.33 0.29 0.24 0.25 0.25 0.23 -0.03 -0.05 Residual fuel oil 0.05 0.05 0.04 0.06 0.07 0.06 0.07 0.07 0.05 -0.01 -0.02 Other products 0.37 0.38 0.40 0.38 0.26 0.35 0.27 0.38 0.39 0.01 -0.02
Total 2.4 2.5 2.6 2.5 2.4 2.4 2.4 2.4 2.4 0.0 0.01 Demand, measured as deliveries from refineries and primary stocks, comprises inland deliveries, international bunkers and refinery fuel. It includes crude for direct burning, oil from non-conventional sources and other sources of supply. Jet/kerosene comprises jet kerosene and non-aviation kerosene. Gasoil comprises diesel, light heating oil and other gasoils. 2 Latest official OECD submissions (MOS).3 US figures exclude US territories.
Latest month vs.
Table 2bOIL DEMAND IN SELECTED OECD COUNTRIES1
(million barrels per day)

Oil Market Report Tables
Page | 55
IEA
. All
right
s re
serv
ed.
Table 3: World Oil Production 2018 2019 2020 1Q19 2Q19 3Q19 4Q19 1Q20 Jun 19 Jul 19 Aug 19
OPECCrude Oil Saudi Arabia 10.33 6.56 10.06 9.76 9.77 9.65 9.75 Iran 3.58 1.66 2.73 2.43 2.28 2.23 2.19 Iraq 4.57 3.15 4.70 4.73 4.73 4.78 4.81 UAE 3.00 2.03 3.06 3.05 3.05 3.07 3.06 Kuwait 2.75 1.79 2.71 2.69 2.66 2.67 2.64 Neutral Zone 0.00 0.00 0.00 0.00 0.00 0.00 0.00 Angola 1.49 0.94 1.43 1.43 1.42 1.34 1.35 Nigeria 1.60 1.16 1.69 1.72 1.80 1.80 1.84 Libya 0.97 0.70 0.96 1.15 1.12 1.09 1.06 Algeria 1.04 0.68 1.03 1.02 1.01 1.03 1.02 Congo 0.32 0.23 0.34 0.35 0.34 0.34 0.34 Gabon 0.19 0.15 0.21 0.22 0.23 0.22 0.22 Equatorial Guinea 0.12 0.07 0.11 0.11 0.11 0.12 0.12 Ecuador 0.52 0.35 0.53 0.53 0.53 0.54 0.54 Venezuela 1.40 0.62 1.11 0.86 0.87 0.81 0.80
Total Crude Oil 31.88 20.10 30.65 30.05 29.92 29.69 29.74 Total NGLs1 5.53 5.56 5.59 5.58 5.57 5.54 5.53 5.59 5.57 5.54 5.54
Total OPEC2 37.40 25.65 36.23 35.62 35.49 35.23 35.28 NON-OPEC3
OECDAmericas 22.98 24.63 25.97 24.01 24.49 24.69 25.32 25.60 24.53 24.39 24.90 United States 15.52 17.25 18.53 16.64 17.12 17.36 17.85 18.10 17.15 16.96 17.48 Mexico 2.08 1.90 1.86 1.92 1.91 1.90 1.89 1.88 1.91 1.91 1.90 Canada 5.38 5.47 5.57 5.44 5.45 5.42 5.57 5.61 5.46 5.50 5.50 Chile 0.01 0.01 0.01 0.01 0.01 0.01 0.01 0.01 0.01 0.01 0.01 Europe 3.47 3.32 3.72 3.47 3.17 3.16 3.47 3.66 2.95 3.26 3.17 UK 1.11 1.15 1.17 1.20 1.14 1.04 1.20 1.22 1.10 1.09 1.01 Norway 1.85 1.70 2.08 1.77 1.57 1.65 1.81 1.97 1.40 1.71 1.69 Others 0.51 0.47 0.46 0.49 0.46 0.46 0.46 0.46 0.46 0.45 0.46 Asia Oceania 0.41 0.48 0.56 0.43 0.48 0.49 0.52 0.54 0.50 0.48 0.49 Australia 0.34 0.41 0.49 0.37 0.41 0.42 0.44 0.47 0.43 0.41 0.42 Others 0.07 0.07 0.07 0.07 0.07 0.07 0.07 0.07 0.07 0.07 0.07
Total OECD 26.86 28.43 30.25 27.91 28.15 28.34 29.31 29.80 27.99 28.12 28.56 NON-OECDFormer USSR 14.56 14.57 14.61 14.80 14.40 14.54 14.55 14.65 14.61 14.61 14.61 Russia 11.49 11.56 11.58 11.67 11.50 11.55 11.54 11.57 11.49 11.49 11.63 Others 3.07 3.01 3.04 3.13 2.90 2.99 3.01 3.09 3.12 3.12 2.98 Asia 7.21 7.17 7.03 7.25 7.21 7.13 7.10 7.10 7.29 7.15 7.11 China 3.85 3.92 3.88 3.92 3.95 3.91 3.88 3.89 4.02 3.94 3.89 Malaysia 0.71 0.69 0.70 0.71 0.69 0.67 0.70 0.71 0.69 0.65 0.67 India 0.84 0.81 0.79 0.82 0.80 0.80 0.80 0.80 0.79 0.80 0.81 Indonesia 0.80 0.77 0.74 0.79 0.77 0.77 0.76 0.75 0.78 0.78 0.77 Others 1.01 0.98 0.93 1.00 1.00 0.97 0.96 0.95 1.00 0.97 0.97 Europe 0.12 0.12 0.11 0.12 0.12 0.12 0.12 0.12 0.12 0.12 0.12 Americas 4.52 4.73 5.08 4.51 4.58 4.85 4.97 5.02 4.50 4.72 4.89 Brazil 2.71 2.89 3.22 2.67 2.74 3.01 3.14 3.19 2.66 2.88 3.05 Argentina 0.58 0.60 0.60 0.59 0.60 0.59 0.60 0.60 0.59 0.60 0.59 Colombia 0.87 0.90 0.88 0.90 0.90 0.90 0.89 0.89 0.90 0.90 0.90 Others 0.36 0.35 0.38 0.36 0.35 0.35 0.34 0.34 0.35 0.34 0.35 Middle East 3.27 3.26 3.27 3.26 3.27 3.26 3.26 3.27 3.26 3.26 3.26 Oman 0.99 0.98 0.98 0.98 0.98 0.98 0.98 0.98 0.98 0.98 0.98 Qatar 2.01 2.01 2.01 2.02 2.01 2.01 2.01 2.01 2.01 2.01 2.01 Syria 0.02 0.02 0.02 0.02 0.02 0.02 0.02 0.02 0.02 0.02 0.02 Yemen 0.04 0.04 0.04 0.04 0.04 0.04 0.04 0.04 0.04 0.04 0.04 Others 0.21 0.21 0.21 0.20 0.21 0.21 0.21 0.21 0.21 0.21 0.21 Africa 1.45 1.45 1.48 1.44 1.45 1.45 1.45 1.47 1.44 1.44 1.45 Egypt 0.65 0.64 0.64 0.64 0.64 0.64 0.64 0.64 0.64 0.64 0.64 Others 0.80 0.81 0.84 0.80 0.81 0.81 0.81 0.84 0.80 0.80 0.82
Total Non-OECD 31.13 31.31 31.59 31.39 31.03 31.34 31.45 31.63 31.23 31.30 31.45 Processing gains4 2.32 2.35 2.38 2.35 2.35 2.35 2.35 2.38 2.35 2.35 2.35 Global Biofuels 2.62 2.69 2.83 2.21 2.90 3.10 2.56 2.36 3.05 3.21 3.11 TOTAL NON-OPEC 62.93 64.78 67.04 63.87 64.43 65.13 65.67 66.17 64.61 64.98 65.46 TOTAL SUPPLY 100.33 100.09 100.06 100.10 100.22 100.75 1 Includes condensates reported by OPEC countries, oil from non-conventional sources, e.g. NGLs in Qatar and Nigeria and non-oil inputs to Saudi Arabian MTBE.2 OPEC data based on today's membership throughout the time series. 3 Comprises crude oil, condensates, NGLs and oil from non-conventional sources4 Net volumetric gains and losses in refining and marine transportation losses.
Table 3WORLD OIL PRODUCTION
(million barrels per day)

Oil Market Report Tables
Page | 56
IEA
. All
right
s re
serv
ed.
Table 3a: Oil Supply in OECD Countries 2018 2019 2020 1Q19 2Q19 3Q19 4Q19 1Q20 Jun 19 Jul 19 Aug 19
United StatesAlaska 479 459 444 488 468 404 475 472 455 436 361 California 477 462 449 469 464 460 457 453 459 462 461 Texas 4409 5118 5797 4850 4967 5225 5424 5583 4982 5160 5226 Federal Gulf of Mexico2 1758 1878 1975 1848 1933 1823 1907 1984 1909 1667 1900 Other US Lower 48 3869 4329 4602 4159 4278 4382 4494 4538 4278 4340 4388 NGLs3 4349 4831 5091 4658 4839 4897 4925 4916 4891 4737 4986 Other Hydrocarbons 178 168 174 168 172 164 167 156 175 163 163
Total 15518 17245 18531 16642 17120 17356 17848 18102 17149 16965 17485 CanadaAlberta Light/Medium/Heavy 489 482 478 486 486 479 478 478 477 480 479 Alberta Bitumen 1857 1800 1930 1683 1833 1813 1869 1913 1830 1770 1826 Saskatchewan 489 492 482 493 494 491 488 486 494 492 491 Other Crude 575 617 593 615 636 591 625 565 651 625 572 NGLs 909 938 942 983 916 898 954 988 857 891 908 Synthetic Crudes 1056 1144 1144 1183 1084 1154 1157 1183 1147 1246 1227
Total 5376 5472 5571 5443 5449 5425 5571 5612 5456 5504 5503 MexicoCrude 1833 1686 1655 1690 1690 1687 1677 1668 1693 1697 1682 NGLs 238 214 202 221 220 209 208 206 217 204 213
Total 2077 1905 1861 1915 1913 1900 1890 1878 1914 1905 1899
UK Offshore5
Brent Fields 38 37 33 39 40 32 35 37 40 39 29 Forties Fields 365 350 304 374 345 336 347 338 346 343 316 Ninian Fields 36 37 34 37 36 39 37 36 35 41 39 Flotta Fields 20 22 19 25 22 18 21 20 23 12 21 Other Fields 527 575 667 599 566 497 639 673 541 534 486 NGLs 89 97 92 102 97 95 95 94 83 95 96
Total 1075 1118 1149 1177 1106 1018 1174 1199 1068 1064 987
Norway5
Ekofisk-Ula Area 193 176 200 199 137 190 180 194 21 192 190 Oseberg-Troll Area 247 253 272 257 247 246 260 265 257 253 254 Statfjord-Gullfaks Area 311 238 169 281 217 236 219 187 173 273 230 Haltenbanken Area 331 282 284 290 271 275 291 298 276 288 295 Sleipner-Frigg Area 403 394 745 387 355 349 483 628 328 356 360 NGLs 365 343 335 361 339 335 337 335 340 351 336
Total 1850 1702 2080 1775 1568 1652 1815 1969 1396 1712 1693
Other OECD EuropeOther N Sea Crude/NGLs6 129 123 106 129 129 120 114 110 131 116 122 UK Onshore 18 17 15 18 17 16 16 16 17 17 16 Italy 90 84 107 86 78 82 90 98 75 80 82 Turkey 55 57 58 54 58 58 58 58 60 58 58 Other 117 109 99 117 109 107 104 102 100 109 107 NGLs (excl. North Sea) 10 9 7 9 7 9 9 8 6 9 9 Non-Conventional Oils 89 65 65 72 61 63 63 66 69 60 64
Total 509 463 458 485 459 455 455 457 458 449 458
AustraliaGippsland Basin 32 20 19 21 21 20 20 19 20 20 20 Cooper-Eromanga Basin 35 38 35 39 38 38 37 36 38 38 38 Carnarvon Basin 205 196 219 201 195 193 197 207 194 193 192 Other Crude 4 12 12 9 17 12 12 12 32 12 12 NGLs 59 64 92 49 59 69 77 87 67 65 69
Total 342 410 489 368 407 418 445 471 429 410 418
Other OECD Asia OceaniaNew Zealand 25 25 23 25 26 25 25 24 26 25 25 Japan 3 4 4 4 4 4 4 4 4 4 4 NGLs 13 12 11 14 11 11 11 11 11 11 11 Synthetic Fuels 29 29 31 24 32 31 31 31 30 31 31
Total 70 70 69 67 73 71 71 70 71 71 71
OECDCrude Oil 19294 20323 21871 19877 20113 20210 21078 21522 19912 20041 20238 NGLs 6010 6487 6751 6378 6468 6502 6597 6624 6452 6347 6606 Non-Conventional Oils4 1557 1621 1629 1657 1567 1627 1635 1654 1622 1735 1713
Total 26862 28431 30251 27912 28148 28339 29310 29800 27986 28123 28557 1 Subcategories refer to crude oil only unless otherwise noted.2 Only production from Federal waters is included.3 To the extent possible, condensates from natural gas processing plants are included with NGLs, while field condensates are counted as crude oil.4 Does not include biofuels.5 North Sea production is grouped by area including all fields being processed through the named field complex, ie, not just the field of that name.6 Other North Sea NGLs is included.
Table 3aOIL SUPPLY IN OECD COUNTRIES1
(thousand of barrels per day)

Oil Market Report Tables
Page | 57
IEA
. All
right
s re
serv
ed.
Table 4: OECD Industry Stocks and Quarterly Stock Changes
RECENT MONTHLY STOCKS2 PRIOR YEARS' STOCKS2 STOCK CHANGESin Million Barrels in Million Barrels in mb/d
Mar2019 Apr2019 May2019 Jun2019 Jul2019* Jul2016 Jul2017 Jul2018 3Q2018 4Q2018 1Q2019 2Q2019
OECD INDUSTRY-CONTROLLED STOCKS1
OECD AmericasCrude 615.2 629.6 639.2 613.9 589.0 649.7 643.3 563.2 0.00 0.35 0.12 -0.01 Motor Gasoline 266.4 260.7 265.1 261.6 261.8 272.8 262.2 264.7 0.04 0.09 -0.13 -0.05 Middle Distillate 205.1 199.8 198.8 199.1 208.7 230.1 222.2 199.3 0.27 0.01 -0.12 -0.07 Residual Fuel Oil 34.1 33.5 35.0 35.4 38.3 45.0 36.9 34.7 0.00 -0.01 -0.01 0.01 Total Products3 709.6 710.7 733.0 745.5 771.3 794.9 751.8 723.2 0.61 -0.17 -0.41 0.39
Total4 1508.3 1532.5 1571.9 1561.1 1558.3 1639.7 1588.0 1478.3 0.76 0.01 -0.34 0.58
OECD EuropeCrude 363.4 357.2 355.5 357.7 349.5 368.6 362.1 363.0 -0.31 -0.02 0.33 -0.06 Motor Gasoline 99.0 88.7 88.3 89.8 89.4 97.5 90.1 82.1 0.01 0.10 0.06 -0.10 Middle Distillate 268.3 270.8 273.2 278.6 280.7 335.3 305.6 258.7 0.18 -0.11 0.13 0.11 Residual Fuel Oil 59.3 59.0 60.7 59.2 59.8 76.0 63.8 58.7 -0.02 -0.02 0.06 0.00 Total Products3 541.4 530.1 534.3 544.0 549.3 611.6 568.8 516.0 0.16 -0.06 0.28 0.03
Total4 986.5 967.5 970.4 980.9 981.4 1051.0 1006.6 957.9 -0.21 -0.03 0.66 -0.06
OECD Asia OceaniaCrude 158.9 156.8 155.1 151.3 147.7 196.2 197.0 158.5 -0.24 0.16 0.05 -0.08 Motor Gasoline 25.9 25.1 26.5 24.6 26.4 24.9 22.8 24.7 0.00 0.00 0.02 -0.01 Middle Distillate 67.1 65.2 68.0 69.5 73.2 71.7 64.1 71.6 0.13 -0.04 -0.07 0.03 Residual Fuel Oil 19.7 20.5 20.3 20.1 19.6 19.4 21.6 19.7 -0.01 0.01 -0.01 0.00 Total Products3 164.4 161.7 170.1 173.1 180.0 184.2 175.6 172.0 0.22 -0.04 -0.18 0.10
Total4 379.7 379.8 385.6 387.9 391.8 441.6 436.5 393.8 0.02 0.11 -0.22 0.09
Total OECDCrude 1137.4 1143.5 1149.8 1122.9 1086.2 1214.5 1202.4 1084.7 -0.55 0.49 0.50 -0.16 Motor Gasoline 391.3 374.5 379.8 376.0 377.7 395.2 375.1 371.5 0.04 0.19 -0.06 -0.17 Middle Distillate 540.4 535.8 540.0 547.3 562.6 637.0 591.7 529.7 0.58 -0.14 -0.06 0.08 Residual Fuel Oil 113.2 113.0 116.1 114.8 117.8 140.4 122.3 113.2 -0.04 -0.02 0.04 0.02 Total Products3 1415.4 1402.4 1437.3 1462.6 1500.5 1590.7 1496.2 1411.2 0.98 -0.27 -0.30 0.52
Total4 2874.4 2879.8 2927.9 2929.9 2931.4 3132.3 3031.2 2830.0 0.57 0.08 0.11 0.61
OECD GOVERNMENT-CONTROLLED STOCKS5
OECD Americas
Crude 649.1 648.6 644.8 644.8 644.8 695.1 678.9 660.0 0.00 -0.12 0.00 -0.05 Products 2.0 2.0 2.0 2.0 2.0 2.0 2.0 2.0 0.00 0.00 0.00 0.00
OECD EuropeCrude 208.9 209.4 206.3 207.0 206.2 205.7 208.3 211.0 0.01 -0.01 -0.02 -0.02
Products 276.6 277.9 277.2 275.7 276.0 269.9 269.7 277.2 -0.05 -0.04 0.10 -0.01
OECD Asia OceaniaCrude 378.6 378.6 378.6 378.6 378.6 385.4 385.0 383.3 0.00 -0.02 -0.03 0.00 Products 38.8 38.8 38.8 38.8 38.9 35.5 38.0 38.7 0.00 0.00 0.00 0.00
Total OECDCrude 1236.6 1236.6 1229.7 1230.4 1229.7 1286.2 1272.2 1254.3 0.01 -0.16 -0.05 -0.07 Products 317.3 318.6 318.0 316.5 316.8 307.4 309.7 318.0 -0.05 -0.04 0.10 -0.01
Total4 1556.9 1557.5 1549.8 1548.8 1548.3 1596.1 1585.2 1575.5 -0.05 -0.20 0.06 -0.09
* estimated1 Stocks are primary national territory stocks on land (excluding utility stocks and including pipeline and entrepot stocks where known) and include stocks held by industry to meet IEA, EU and national emergency reserve commitments and are subject to government control in emergencies. 2 Closing stock levels.3 Total products includes gasoline, middle distillates, fuel oil and other products. 4 Total includes NGLs, refinery feedstocks, additives/oxygenates and other hydrocarbons. 5 Includes government-owned stocks and stock holding organisation stocks held for emergency purposes.
Table 4OECD STOCKS AND QUARTERLY STOCK CHANGES

Oil Market Report Tables
Page | 58
IEA
. All
right
s re
serv
ed.
Table 4a: Industry Stocks on Land in Selected Countries
February March April May June
2018 2019 % 2018 2019 % 2018 2019 % 2018 2019 % 2018 2019 %United States2
Crude 423.5 451.7 6.7 423.4 459.3 8.5 435.1 468.8 7.7 433.3 480.2 10.8 414.8 461.0 11.1 Motor Gasoline 252.6 251.4 -0.5 239.6 236.1 -1.5 239.9 230.2 -4.0 242.2 235.7 -2.7 240.3 231.5 -3.7 Middle Distillate 183.2 180.1 -1.7 172.4 175.7 1.9 162.9 171.1 5.0 157.9 171.4 8.5 162.5 171.8 5.7 Residual Fuel Oil 32.8 27.8 -15.2 35.0 28.7 -18.0 32.3 27.9 -13.6 31.9 30.0 -6.0 30.0 30.3 1.0 Other Products 160.6 176.1 9.7 162.1 183.7 13.3 168.9 195.6 15.8 180.8 214.0 18.4 193.0 230.6 19.5 Total Products 629.2 635.4 1.0 609.1 624.2 2.5 604.0 624.8 3.4 612.8 651.1 6.3 625.8 664.2 6.1 Other3 157.5 166.2 5.5 163.7 165.5 1.1 161.1 173.7 7.8 164.3 181.0 10.2 166.5 180.8 8.6
Total 1210.2 1253.3 3.6 1196.2 1249.0 4.4 1200.2 1267.3 5.6 1210.4 1312.3 8.4 1207.1 1306.0 8.2 JapanCrude 95.9 95.1 -0.8 87.3 95.5 9.4 93.4 94.1 0.7 97.5 97.2 -0.3 92.6 91.9 -0.8 Motor Gasoline 10.4 10.1 -2.9 10.1 10.3 2.0 10.7 9.7 -9.3 11.5 9.8 -14.8 9.9 9.5 -4.0 Middle Distillate 25.1 28.1 12.0 27.8 26.9 -3.2 29.8 25.8 -13.4 29.4 27.4 -6.8 28.4 28.2 -0.7 Residual Fuel Oil 7.1 8.0 12.7 7.2 8.0 11.1 7.7 7.9 2.6 8.3 8.0 -3.6 8.0 7.8 -2.5 Other Products 32.9 36.2 10.0 33.8 30.6 -9.5 34.2 30.9 -9.6 33.1 33.8 2.1 32.5 35.8 10.2 Total Products 75.5 82.4 9.1 78.9 75.8 -3.9 82.4 74.3 -9.8 82.3 79.0 -4.0 78.8 81.3 3.2 Other3 47.6 49.2 3.4 46.0 47.1 2.4 50.9 51.4 1.0 52.9 50.8 -4.0 51.7 53.1 2.7
Total 219.0 226.7 3.5 212.2 218.4 2.9 226.7 219.8 -3.0 232.7 227.0 -2.4 223.1 226.3 1.4 GermanyCrude 47.6 47.8 0.4 50.8 47.8 -5.9 48.0 48.7 1.5 48.9 48.6 -0.6 49.4 47.9 -3.0 Motor Gasoline 11.3 12.3 8.8 10.7 10.9 1.9 10.0 9.5 -5.0 9.5 10.0 5.3 9.4 11.9 26.6 Middle Distillate 24.5 22.9 -6.5 24.3 23.8 -2.1 26.5 23.7 -10.6 25.6 22.7 -11.3 25.2 25.2 0.0 Residual Fuel Oil 8.2 7.9 -3.7 8.1 7.0 -13.6 8.1 7.1 -12.3 8.3 7.0 -15.7 7.8 6.8 -12.8 Other Products 10.9 10.3 -5.5 10.8 10.9 0.9 10.9 10.3 -5.5 10.6 10.1 -4.7 10.8 10.4 -3.7 Total Products 54.9 53.4 -2.7 53.9 52.6 -2.4 55.5 50.6 -8.8 54.0 49.8 -7.8 53.2 54.3 2.1 Other3 0.0 0.0 0.0 0.0 0.0 0.0 0.0 0.0 0.0 0.0 0.0 0.0 0.0 0.0 0.0
Total 102.5 101.2 -1.3 104.7 100.4 -4.1 103.5 99.3 -4.1 102.9 98.4 -4.4 102.6 102.2 -0.4 ItalyCrude 38.7 38.4 -0.8 36.4 42.2 15.9 42.0 43.1 2.6 40.9 40.4 -1.2 39.7 45.0 13.4 Motor Gasoline 13.8 13.6 -1.4 13.2 13.0 -1.5 11.8 11.1 -5.9 10.3 11.0 6.8 10.9 11.3 3.7 Middle Distillate 30.1 31.2 3.7 30.3 30.3 0.0 27.5 29.9 8.7 28.2 29.3 3.9 27.4 28.0 2.2 Residual Fuel Oil 10.3 9.5 -7.8 9.6 8.4 -12.5 10.2 8.7 -14.7 10.4 8.6 -17.3 9.8 8.7 -11.2 Other Products 13.6 12.6 -7.4 13.7 12.7 -7.3 12.9 12.1 -6.2 13.4 11.7 -12.7 12.9 12.4 -3.9 Total Products 67.8 66.9 -1.3 66.8 64.4 -3.6 62.4 61.8 -1.0 62.3 60.6 -2.7 61.0 60.4 -1.0 Other3 15.9 15.0 -5.7 15.1 14.7 -2.6 15.2 14.8 -2.6 16.1 16.2 0.6 15.6 13.8 -11.5
Total 122.4 120.3 -1.7 118.3 121.3 2.5 119.6 119.7 0.1 119.3 117.2 -1.8 116.3 119.2 2.5 FranceCrude 12.5 11.4 -8.8 14.3 14.9 4.2 13.6 12.9 -5.1 15.2 13.7 -9.9 15.8 15.8 0.0 Motor Gasoline 4.5 4.5 0.0 3.5 4.5 28.6 3.4 3.8 11.8 3.3 4.5 36.4 4.1 5.9 43.9 Middle Distillate 18.9 20.5 8.5 17.5 20.4 16.6 20.1 20.9 4.0 18.9 21.7 14.8 18.1 21.1 16.6 Residual Fuel Oil 1.4 1.2 -14.3 1.2 1.4 16.7 1.0 0.9 -10.0 0.9 0.8 -11.1 0.8 0.9 12.5 Other Products 4.0 4.3 7.5 3.7 4.5 21.6 3.5 4.0 14.3 3.4 3.9 14.7 3.4 4.3 26.5 Total Products 28.8 30.5 5.9 25.9 30.8 18.9 28.0 29.6 5.7 26.5 30.9 16.6 26.4 32.2 22.0 Other3 8.1 8.3 2.5 8.6 8.0 -7.0 8.8 7.4 -15.9 9.0 7.6 -15.6 9.3 8.5 -8.6
Total 49.4 50.2 1.6 48.8 53.7 10.0 50.4 49.9 -1.0 50.7 52.2 3.0 51.5 56.5 9.7 United KingdomCrude 27.8 27.9 0.4 27.8 31.3 12.6 30.3 30.6 1.0 32.7 29.1 -11.0 34.2 30.0 -12.3 Motor Gasoline 11.0 10.5 -4.5 11.2 10.3 -8.0 10.5 9.8 -6.7 9.4 9.0 -4.3 9.9 8.7 -12.1 Middle Distillate 24.8 24.8 0.0 23.7 24.2 2.1 23.7 25.9 9.3 23.8 24.9 4.6 23.0 24.3 5.7 Residual Fuel Oil 1.6 0.9 -43.8 1.4 1.3 -7.1 1.2 1.4 16.7 1.2 1.3 8.3 1.3 1.4 7.7 Other Products 5.6 4.9 -12.5 5.3 5.1 -3.8 5.3 6.2 17.0 4.7 6.1 29.8 5.2 6.6 26.9 Total Products 43.0 41.1 -4.4 41.6 40.9 -1.7 40.7 43.3 6.4 39.1 41.3 5.6 39.4 41.0 4.1 Other3 8.7 8.8 1.1 8.4 8.6 2.4 7.6 9.7 27.6 8.5 8.8 3.5 8.4 8.9 6.0
Total 79.5 77.8 -2.1 77.8 80.8 3.9 78.6 83.6 6.4 80.3 79.2 -1.4 82.0 79.9 -2.6 Canada4
Crude 117.0 120.9 3.3 120.3 122.8 2.1 115.7 125.3 8.3 123.6 126.2 2.1 120.9 121.6 0.6 Motor Gasoline 18.0 14.9 -17.2 18.9 14.8 -21.7 16.8 14.6 -13.1 14.0 14.4 2.9 14.3 13.9 -2.8 Middle Distillate 19.7 16.4 -16.8 21.7 16.9 -22.1 20.1 17.1 -14.9 16.1 15.5 -3.7 17.0 14.9 -12.4 Residual Fuel Oil 2.4 2.7 12.5 2.1 2.4 14.3 2.4 2.2 -8.3 2.1 1.6 -23.8 2.3 2.0 -13.0 Other Products 11.3 11.7 3.5 12.6 11.6 -7.9 12.9 11.4 -11.6 13.7 11.2 -18.2 12.8 9.6 -25.0 Total Products 51.4 45.7 -11.1 55.3 45.7 -17.4 52.2 45.3 -13.2 45.9 42.7 -7.0 46.4 40.4 -12.9 Other3 15.8 18.8 19.0 16.2 17.7 9.3 18.0 18.4 2.2 20.6 18.5 -10.2 23.0 20.5 -10.9
Total 184.2 185.4 0.7 191.8 186.2 -2.9 185.9 189.0 1.7 190.1 187.4 -1.4 190.3 182.5 -4.1 1 Stocks are primary national territory stocks on land (excluding utilitity stocks and including pipeline and entrepot stocks where known) and include stocks held by industry to meet IEA, EU and national emergency reserve commitments and are subject to government control in emergencies.2 US figures exclude US territories.3 Other includes NGLs, refinery feedstocks, additives/oxygenates and other hydrocarbons.4 Canadian stock information for recent months is the administration's best estimate. Data are usually finalised three months after first publication.
Table 4aINDUSTRY STOCKS1
ON LAND IN SELECTED COUNTRIES(million barrels)
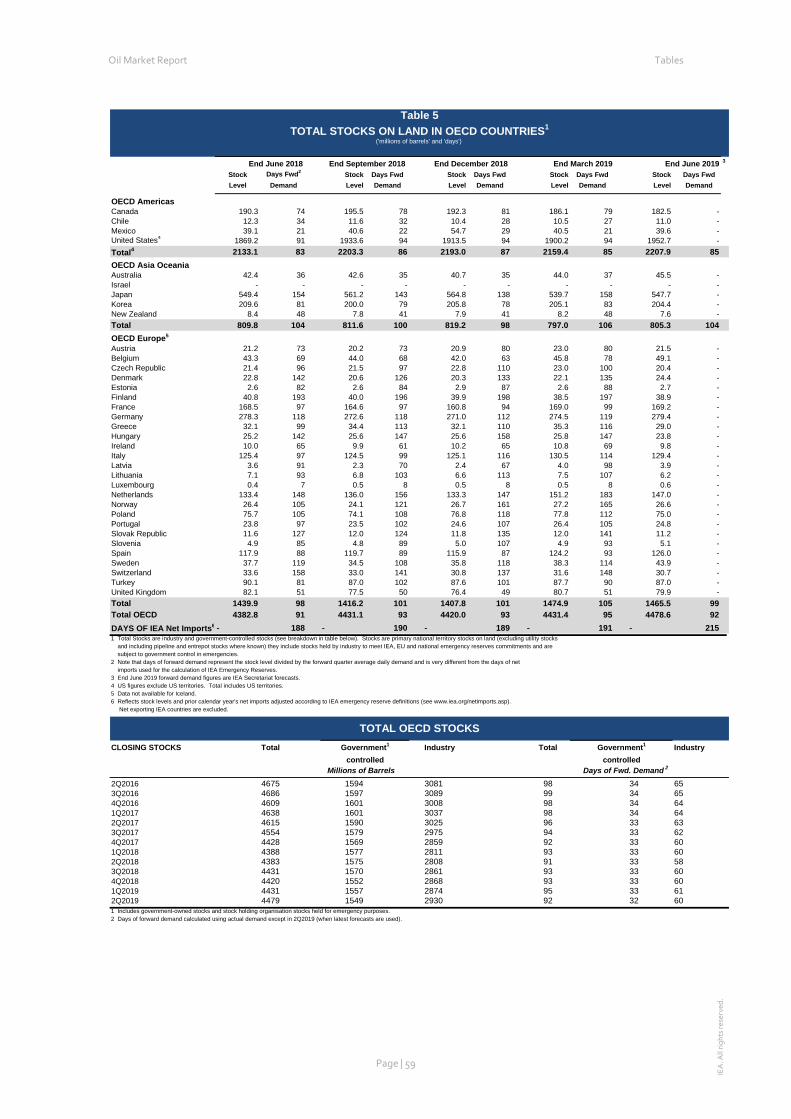
Oil Market Report Tables
Page | 59
IEA
. All
right
s re
serv
ed.
Table 5: Total Stocks on Land in OECD Countries
3
Stock Days Fwd2 Stock Days Fwd Stock Days Fwd Stock Days Fwd Stock Days FwdLevel Demand Level Demand Level Demand Level Demand Level Demand
OECD AmericasCanada 190.3 74 195.5 78 192.3 81 186.1 79 182.5 -Chile 12.3 34 11.6 32 10.4 28 10.5 27 11.0 -Mexico 39.1 21 40.6 22 54.7 29 40.5 21 39.6 -United States4 1869.2 91 1933.6 94 1913.5 94 1900.2 94 1952.7 -Total4 2133.1 83 2203.3 86 2193.0 87 2159.4 85 2207.9 85OECD Asia OceaniaAustralia 42.4 36 42.6 35 40.7 35 44.0 37 45.5 -Israel - - - - - - - - - -Japan 549.4 154 561.2 143 564.8 138 539.7 158 547.7 -Korea 209.6 81 200.0 79 205.8 78 205.1 83 204.4 -New Zealand 8.4 48 7.8 41 7.9 41 8.2 48 7.6 -Total 809.8 104 811.6 100 819.2 98 797.0 106 805.3 104OECD Europe5
Austria 21.2 73 20.2 73 20.9 80 23.0 80 21.5 -Belgium 43.3 69 44.0 68 42.0 63 45.8 78 49.1 -Czech Republic 21.4 96 21.5 97 22.8 110 23.0 100 20.4 -Denmark 22.8 142 20.6 126 20.3 133 22.1 135 24.4 -Estonia 2.6 82 2.6 84 2.9 87 2.6 88 2.7 -Finland 40.8 193 40.0 196 39.9 198 38.5 197 38.9 -France 168.5 97 164.6 97 160.8 94 169.0 99 169.2 -Germany 278.3 118 272.6 118 271.0 112 274.5 119 279.4 -Greece 32.1 99 34.4 113 32.1 110 35.3 116 29.0 -Hungary 25.2 142 25.6 147 25.6 158 25.8 147 23.8 -Ireland 10.0 65 9.9 61 10.2 65 10.8 69 9.8 -Italy 125.4 97 124.5 99 125.1 116 130.5 114 129.4 -Latvia 3.6 91 2.3 70 2.4 67 4.0 98 3.9 -Lithuania 7.1 93 6.8 103 6.6 113 7.5 107 6.2 -Luxembourg 0.4 7 0.5 8 0.5 8 0.5 8 0.6 -Netherlands 133.4 148 136.0 156 133.3 147 151.2 183 147.0 -Norway 26.4 105 24.1 121 26.7 161 27.2 165 26.6 -Poland 75.7 105 74.1 108 76.8 118 77.8 112 75.0 -Portugal 23.8 97 23.5 102 24.6 107 26.4 105 24.8 -Slovak Republic 11.6 127 12.0 124 11.8 135 12.0 141 11.2 -Slovenia 4.9 85 4.8 89 5.0 107 4.9 93 5.1 -Spain 117.9 88 119.7 89 115.9 87 124.2 93 126.0 -Sweden 37.7 119 34.5 108 35.8 118 38.3 114 43.9 -Switzerland 33.6 158 33.0 141 30.8 137 31.6 148 30.7 -Turkey 90.1 81 87.0 102 87.6 101 87.7 90 87.0 -United Kingdom 82.1 51 77.5 50 76.4 49 80.7 51 79.9 -Total 1439.9 98 1416.2 101 1407.8 101 1474.9 105 1465.5 99Total OECD 4382.8 91 4431.1 93 4420.0 93 4431.4 95 4478.6 92DAYS OF IEA Net Imports6 - 188 - 190 - 189 - 191 - 2151 Total Stocks are industry and government-controlled stocks (see breakdown in table below). Stocks are primary national territory stocks on land (excluding utility stocks and including pipeline and entrepot stocks where known) they include stocks held by industry to meet IEA, EU and national emergency reserves commitments and are subject to government control in emergencies.2 Note that days of forward demand represent the stock level divided by the forward quarter average daily demand and is very different from the days of net imports used for the calculation of IEA Emergency Reserves.3 End June 2019 forward demand figures are IEA Secretariat forecasts. 4 US figures exclude US territories. Total includes US territories.5 Data not available for Iceland.6 Reflects stock levels and prior calendar year's net imports adjusted according to IEA emergency reserve definitions (see www.iea.org/netimports.asp). Net exporting IEA countries are excluded.
CLOSING STOCKS Total Industry Total Industry
2Q2016 4675 1594 3081 98 34 653Q2016 4686 1597 3089 99 34 654Q2016 4609 1601 3008 98 34 641Q2017 4638 1601 3037 98 34 642Q2017 4615 1590 3025 96 33 633Q2017 4554 1579 2975 94 33 624Q2017 4428 1569 2859 92 33 601Q2018 4388 1577 2811 93 33 602Q2018 4383 1575 2808 91 33 583Q2018 4431 1570 2861 93 33 604Q2018 4420 1552 2868 93 33 601Q2019 4431 1557 2874 95 33 612Q2019 4479 1549 2930 92 32 601 Includes government-owned stocks and stock holding organisation stocks held for emergency purposes.2 Days of forward demand calculated using actual demand except in 2Q2019 (when latest forecasts are used).
Table 5TOTAL STOCKS ON LAND IN OECD COUNTRIES1
controlledDays of Fwd. Demand 2
End June 2019End September 2018 End June 2018 End December 2018 End March 2019
Millions of Barrels
Government1
controlledGovernment1
('millions of barrels' and 'days')
TOTAL OECD STOCKS

Oil Market Report Tables
Page | 60
IEA
. All
right
s re
serv
ed.
Table 6: IEA Member Country Destinations of Selected Crude Streams
2016 2017 2018 3Q18 4Q18 1Q19 2Q19 Apr 19 May 19 Jun 19 Jun 18 change
Saudi Light & Extra LightAmericas 0.69 0.59 0.66 0.64 0.66 0.35 0.15 0.29 0.04 0.12 0.97 -0.84Europe 0.79 0.69 0.69 0.76 0.73 0.70 0.75 0.70 0.79 0.75 0.80 -0.05Asia Oceania 1.40 1.56 1.45 1.36 1.50 1.62 1.41 1.50 1.40 1.34 1.40 -0.06
Saudi MediumAmericas 0.44 0.33 0.30 0.37 0.33 0.13 0.21 0.29 0.02 0.32 0.26 0.06Europe 0.01 0.01 0.01 0.01 0.01 - 0.01 0.01 0.01 0.01 - -Asia Oceania 0.41 0.37 0.41 0.41 0.39 0.24 0.23 0.24 0.22 0.23 0.42 -0.19
Canada HeavyAmericas 2.04 2.23 2.41 2.39 2.43 2.29 2.17 2.16 2.07 2.29 2.61 -0.32Europe 0.01 0.02 0.04 0.05 0.02 0.03 0.05 0.03 0.06 0.08 0.02 0.06Asia Oceania - - 0.00 - 0.01 - - - - - - -
Iraqi Basrah Light2
Americas 0.42 0.63 0.50 0.41 0.32 0.46 0.24 0.14 0.18 0.40 0.39 0.01Europe 0.81 0.76 0.76 0.87 0.92 0.89 0.96 0.74 1.21 0.93 0.67 0.26Asia Oceania 0.46 0.40 0.43 0.42 0.42 0.45 0.39 0.53 0.31 0.32 0.53 -0.21
Kuwait BlendAmericas 0.14 0.11 0.02 - - - - - - - 0.11 -Europe 0.19 0.20 0.13 0.17 0.13 0.04 0.11 0.08 0.10 0.16 0.10 0.05Asia Oceania 0.66 0.68 0.66 0.67 0.62 0.63 0.62 0.67 0.67 0.51 0.58 -0.06
Iranian LightAmericas - - - - - - - - - - - -Europe 0.21 0.27 0.16 0.13 0.03 0.01 - - - - 0.26 -Asia Oceania 0.01 0.01 0.01 0.01 - 0.01 - - - - 0.01 -
Iranian Heavy3
Americas - - - - - - - - - - - -Europe 0.21 0.52 0.35 0.41 0.11 0.09 0.07 0.10 0.09 0.00 0.39 -0.38Asia Oceania 0.52 0.57 0.28 0.24 0.02 0.36 0.18 0.56 - - 0.32 -
BFOEAmericas 0.02 0.02 0.00 0.00 - - - - - - - -Europe 0.44 0.45 0.35 0.43 0.31 0.39 0.31 0.29 0.39 0.24 0.33 -0.09Asia Oceania 0.05 0.10 0.09 0.07 0.10 - 0.01 - 0.03 - 0.07 -
KazakhstanAmericas 0.01 - - - - - - - - - - -Europe 0.70 0.75 0.75 0.70 0.71 0.86 0.78 0.82 0.75 0.77 0.68 0.09Asia Oceania 0.03 0.10 0.19 0.21 0.22 0.17 0.17 0.11 0.15 0.25 0.18 0.07
Venezuelan 22 API and heavierAmericas 0.63 0.48 0.44 0.45 0.45 0.19 - - - - 0.46 -Europe 0.05 0.04 0.03 0.03 0.06 0.10 0.06 0.07 0.06 0.06 0.03 0.03Asia Oceania - - - - - - - - - - - -
Mexican MayaAmericas 0.53 0.58 0.63 0.75 0.51 0.54 0.51 0.58 0.44 0.50 0.81 -0.31Europe 0.17 0.20 0.21 0.17 0.17 0.21 0.21 0.24 0.15 0.23 0.14 0.09Asia Oceania 0.05 0.07 0.08 0.08 0.09 0.12 0.14 0.20 0.09 0.13 0.09 0.04
Russian UralsAmericas - 0.01 0.01 - 0.02 0.04 - - - - - -Europe 1.72 1.64 1.40 1.37 1.38 1.38 1.38 1.54 1.06 1.55 1.36 0.19Asia Oceania - 0.01 0.00 - - - - - - - - -
Cabinda and Other AngolaNorth America 0.16 0.07 0.06 0.11 0.02 - 0.04 - - 0.11 0.15 -0.04Europe 0.27 0.11 0.14 0.22 0.08 0.17 0.10 0.09 0.14 0.06 0.06 0.00Pacific 0.01 0.01 0.01 - 0.03 - - - - - 0.01 -
Nigerian Light4
Americas 0.07 0.04 0.01 - - - 0.07 - 0.16 0.06 - -Europe 0.39 0.39 0.53 0.54 0.63 0.47 0.58 0.42 0.60 0.72 0.38 0.34Asia Oceania 0.01 0.02 0.02 0.01 0.02 0.03 0.00 0.01 - - 0.02 -
Libya Light and MediumAmericas - 0.02 - - - - 0.01 - - 0.03 - -Europe 0.20 0.54 0.62 0.55 0.65 0.54 0.72 0.72 0.77 0.66 0.62 0.04Asia Oceania 0.02 0.03 0.02 0.02 0.02 0.04 0.03 - 0.03 0.05 - -1 Data based on monthly submissions from IEA countries to the crude oil import register (in '000 bbl), subject to availability. May differ from Table 8 of the Report. IEA Americas includes United States and Canada. IEA Europe includes all countries in OECD Europe except Estonia, Hungary, Slovenia and Latvia. IEA Asia Oceania includes Australia, New Zealand, Korea and Japan.2 Iraqi Total minus Kirkuk.3 Iranian Total minus Iranian Light.4 33° API and lighter (e.g., Bonny Light, Escravos, Qua Iboe and Oso Condensate).
Year Earlier
Table 6IEA MEMBER COUNTRY DESTINATIONS OF SELECTED CRUDE STREAMS1
(million barrels per day)

Oil Market Report Tables
Page | 61
IEA
. All
right
s re
serv
ed.
Table 7: Regional OECD Imports 2016 2017 2018 3Q18 4Q18 1Q19 2Q19 Apr 19 May 19 Jun 19 Jun 18 % change
Crude Oil Americas 4542 4361 3759 3905 3223 2891 3020 2691 3137 3228 4050 -20%Europe 9437 9902 9814 10046 9664 10014 9574 9964 9198 9575 9537 0%Asia Oceania 6659 6846 6658 6473 6821 6860 6304 6749 6082 6087 6232 -2%
Total OECD 20639 21109 20230 20425 19708 19766 18898 19403 18417 18890 19820 -5%
LPGAmericas 20 20 22 17 24 35 19 24 17 17 12 44%Europe 441 432 457 404 470 482 411 425 365 445 486 -8%Asia Oceania 567 550 556 504 556 587 553 504 563 592 584 1%
Total OECD 1028 1002 1035 925 1050 1105 984 953 945 1054 1082 -3%
NaphthaAmericas 10 19 8 6 11 5 4 6 3 3 3 10%Europe 348 369 391 376 364 348 334 397 274 333 421 -21%Asia Oceania 908 978 1018 1004 1085 918 955 978 943 945 880 7%
Total OECD 1266 1366 1417 1386 1461 1271 1293 1380 1220 1281 1304 -2%
Gasoline3
Americas 735 727 773 968 504 595 1048 1036 1250 850 1084 -22%Europe 91 153 110 83 77 118 148 158 169 116 92 25%Asia Oceania 87 101 107 91 94 108 110 123 117 90 105 -14%
Total OECD 913 981 991 1142 676 821 1305 1317 1536 1056 1281 -18%
Jet & KeroseneAmericas 169 171 140 178 115 138 179 198 172 169 175 -3%Europe 502 504 509 591 476 455 567 568 558 575 490 17%Asia Oceania 73 80 88 55 120 81 60 72 74 33 41 -20%
Total OECD 744 755 737 825 711 674 806 838 804 776 706 10%
Gasoil/DieselAmericas 67 77 124 130 125 204 77 69 85 77 31 152%Europe 1304 1337 1339 1397 1224 1396 1299 1320 1176 1405 1408 0%Asia Oceania 196 195 254 232 313 231 260 287 262 229 215 6%
Total OECD 1566 1610 1717 1758 1663 1830 1636 1677 1523 1711 1654 3%
Heavy Fuel OilAmericas 149 131 161 195 130 149 105 116 115 82 143 -42%Europe 461 233 197 172 208 217 224 209 239 226 151 50%Asia Oceania 153 146 162 151 149 103 107 52 130 138 152 -9%
Total OECD 762 510 520 518 488 469 436 376 483 447 445 0%
Other ProductsAmericas 652 717 679 699 637 520 742 798 703 727 657 11%Europe 783 1012 1008 1056 937 1006 902 929 951 823 989 -17%Asia Oceania 348 258 281 271 294 274 292 262 337 276 281 -2%
Total OECD 1783 1987 1968 2026 1869 1800 1936 1988 1991 1826 1927 -5%
Total ProductsAmericas 1802 1862 1908 2194 1547 1645 2174 2246 2345 1925 2104 -8%Europe 3930 4040 4011 4078 3756 4022 3885 4007 3731 3924 4037 -3%Asia Oceania 2332 2309 2466 2308 2613 2302 2336 2277 2426 2302 2257 2%
Total OECD 8063 8211 8385 8580 7916 7969 8395 8530 8502 8150 8398 -3%
Total OilAmericas 6344 6223 5666 6100 4770 4536 5194 4936 5482 5153 6154 -16%Europe 13367 13942 13825 14124 13420 14036 13460 13970 12928 13498 13575 -1%Asia Oceania 8991 9154 9124 8781 9434 9162 8640 9026 8509 8389 8489 -1%
Total OECD 28702 29320 28615 29005 27624 27734 27293 27933 26919 27041 28218 -4%1 Based on Monthly Oil Questionnaire data submitted by OECD countries in tonnes and converted to barrels. 2 Excludes intra-regional trade.3 Includes additives.
Year Earlier
Table 7REGIONAL OECD IMPORTS1,2
(thousand barrels per day)

Oil Market Report Tables
Page | 62
IEA
. All
right
s re
serv
ed.
Table 7a: Regional OECD Imports From Non- OECD Countries
Year Earlier2016 2017 2018 3Q18 4Q18 1Q19 2Q19 Apr 19 May 19 Jun 19 Jun 18 % change
Crude Oil Americas 4428 4235 3606 3749 3051 2790 2747 2486 2830 2922 3894 -25%Europe 9051 9436 9093 9380 8926 9100 8773 9261 8423 8646 8858 -2%Asia Oceania 6429 6550 6210 6004 6175 6318 5733 6148 5489 5571 5852 -5%
Total OECD 19909 20221 18910 19133 18152 18208 17253 17895 16741 17139 18603 -8%
LPGAmericas 16 16 15 14 16 27 19 24 17 17 8 115%Europe 329 337 350 320 349 354 307 337 278 306 350 -13%Asia Oceania 342 205 161 111 143 85 99 77 115 105 163 -36%
Total OECD 687 557 527 445 508 466 425 438 410 427 521 -18%
NaphthaAmericas 5 16 4 2 8 1 0 1 0 0 0 naEurope 329 350 360 355 305 328 322 389 264 314 396 -21%Asia Oceania 856 931 921 906 1002 801 865 858 851 887 851 4%
Total OECD 1189 1297 1286 1263 1315 1130 1187 1248 1115 1202 1247 -4%
Gasoline3
Americas 246 213 271 344 210 244 337 394 369 247 338 -27%Europe 89 149 105 80 73 114 142 154 160 111 84 33%Asia Oceania 86 101 84 77 84 89 54 61 53 49 56 -13%
Total OECD 422 463 460 501 368 447 533 608 582 406 478 -15%
Jet & KeroseneAmericas 72 67 56 49 37 45 18 23 17 14 78 -82%Europe 409 436 445 491 425 414 518 539 519 495 435 14%Asia Oceania 73 80 88 55 120 81 60 72 74 33 41 -20%
Total OECD 554 583 589 594 582 540 596 634 610 542 554 -2%
Gasoil/DieselAmericas 37 50 100 105 114 167 32 38 38 19 25 -23%Europe 988 1086 1160 1154 1070 1228 1105 1126 1008 1185 1175 1%Asia Oceania 194 194 254 232 313 231 260 287 262 229 215 6%
Total OECD 1220 1331 1514 1491 1497 1626 1396 1451 1308 1433 1415 1%
Heavy Fuel OilAmericas 130 123 147 186 117 123 98 106 109 79 133 -41%Europe 436 218 185 153 190 206 196 188 212 188 143 31%Asia Oceania 152 146 162 151 148 101 107 52 130 138 152 -9%
Total OECD 718 487 493 490 454 430 401 346 450 405 429 -6%
Other ProductsAmericas 526 542 522 541 481 345 558 590 534 552 511 8%Europe 516 731 710 781 630 736 655 679 692 592 716 -17%Asia Oceania 268 181 200 192 206 192 199 192 239 165 186 -11%
Total OECD 1310 1454 1432 1514 1317 1273 1412 1461 1465 1309 1413 -7%
Total ProductsAmericas 1031 1026 1115 1241 982 952 1062 1176 1083 927 1094 -15%Europe 3097 3307 3314 3333 3042 3382 3244 3412 3133 3191 3300 -3%Asia Oceania 1970 1838 1870 1724 2016 1579 1644 1599 1724 1606 1664 -4%
Total OECD 6099 6171 6299 6298 6041 5913 5950 6186 5940 5724 6058 -6%
Total OilAmericas 5460 5261 4721 4990 4033 3742 3809 3662 3913 3849 4987 -23%Europe 12149 12744 12408 12714 11968 12482 12017 12673 11556 11837 12158 -3%Asia Oceania 8400 8388 8080 7728 8192 7897 7377 7746 7213 7177 7516 -5%
Total OECD 26008 26393 25209 25431 24193 24122 23203 24082 22681 22864 24661 -7%1 Based on Monthly Oil Questionnaire data submitted by OECD countries in tonnes and converted to barrels. 2 Excludes intra-regional trade3 Includes additives
Table 7aREGIONAL OECD IMPORTS FROM NON-OECD COUNTRIES1,2
(thousand barrels per day)
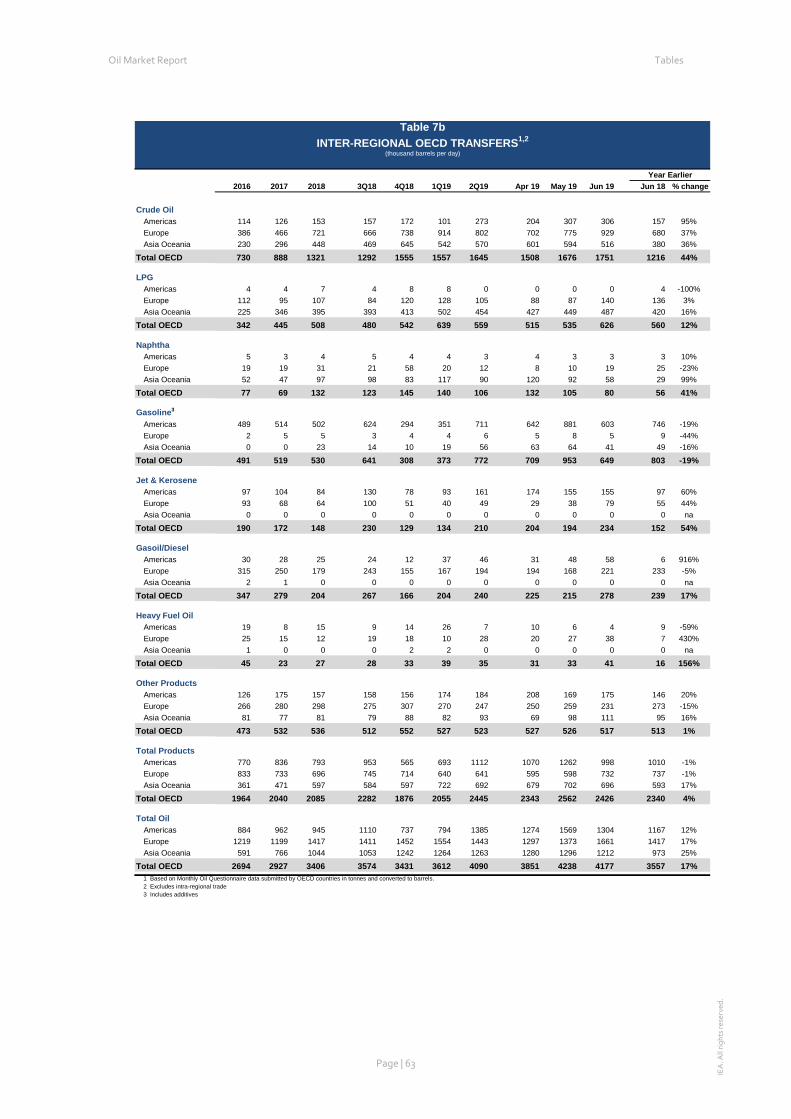
Oil Market Report Tables
Page | 63
IEA
. All
right
s re
serv
ed.
Table 7b: Inter-Regional OECD Transfers Year Earlier
2016 2017 2018 3Q18 4Q18 1Q19 2Q19 Apr 19 May 19 Jun 19 Jun 18 % change
Crude Oil Americas 114 126 153 157 172 101 273 204 307 306 157 95%Europe 386 466 721 666 738 914 802 702 775 929 680 37%Asia Oceania 230 296 448 469 645 542 570 601 594 516 380 36%
Total OECD 730 888 1321 1292 1555 1557 1645 1508 1676 1751 1216 44%
LPGAmericas 4 4 7 4 8 8 0 0 0 0 4 -100%Europe 112 95 107 84 120 128 105 88 87 140 136 3%Asia Oceania 225 346 395 393 413 502 454 427 449 487 420 16%
Total OECD 342 445 508 480 542 639 559 515 535 626 560 12%
NaphthaAmericas 5 3 4 5 4 4 3 4 3 3 3 10%Europe 19 19 31 21 58 20 12 8 10 19 25 -23%Asia Oceania 52 47 97 98 83 117 90 120 92 58 29 99%
Total OECD 77 69 132 123 145 140 106 132 105 80 56 41%
Gasoline3
Americas 489 514 502 624 294 351 711 642 881 603 746 -19%Europe 2 5 5 3 4 4 6 5 8 5 9 -44%Asia Oceania 0 0 23 14 10 19 56 63 64 41 49 -16%
Total OECD 491 519 530 641 308 373 772 709 953 649 803 -19%
Jet & KeroseneAmericas 97 104 84 130 78 93 161 174 155 155 97 60%Europe 93 68 64 100 51 40 49 29 38 79 55 44%Asia Oceania 0 0 0 0 0 0 0 0 0 0 0 na
Total OECD 190 172 148 230 129 134 210 204 194 234 152 54%
Gasoil/DieselAmericas 30 28 25 24 12 37 46 31 48 58 6 916%Europe 315 250 179 243 155 167 194 194 168 221 233 -5%Asia Oceania 2 1 0 0 0 0 0 0 0 0 0 na
Total OECD 347 279 204 267 166 204 240 225 215 278 239 17%
Heavy Fuel OilAmericas 19 8 15 9 14 26 7 10 6 4 9 -59%Europe 25 15 12 19 18 10 28 20 27 38 7 430%Asia Oceania 1 0 0 0 2 2 0 0 0 0 0 na
Total OECD 45 23 27 28 33 39 35 31 33 41 16 156%
Other ProductsAmericas 126 175 157 158 156 174 184 208 169 175 146 20%Europe 266 280 298 275 307 270 247 250 259 231 273 -15%Asia Oceania 81 77 81 79 88 82 93 69 98 111 95 16%
Total OECD 473 532 536 512 552 527 523 527 526 517 513 1%
Total ProductsAmericas 770 836 793 953 565 693 1112 1070 1262 998 1010 -1%Europe 833 733 696 745 714 640 641 595 598 732 737 -1%Asia Oceania 361 471 597 584 597 722 692 679 702 696 593 17%
Total OECD 1964 2040 2085 2282 1876 2055 2445 2343 2562 2426 2340 4%
Total OilAmericas 884 962 945 1110 737 794 1385 1274 1569 1304 1167 12%Europe 1219 1199 1417 1411 1452 1554 1443 1297 1373 1661 1417 17%Asia Oceania 591 766 1044 1053 1242 1264 1263 1280 1296 1212 973 25%
Total OECD 2694 2927 3406 3574 3431 3612 4090 3851 4238 4177 3557 17%1 Based on Monthly Oil Questionnaire data submitted by OECD countries in tonnes and converted to barrels. 2 Excludes intra-regional trade3 Includes additives
Table 7bINTER-REGIONAL OECD TRANSFERS1,2
(thousand barrels per day)

Oil Market Report Tables
Page | 64
IEA
. All
right
s re
serv
ed.
Table 8: Regional OECD Crude Imports by Source
Year Earlier2016 2017 2018 3Q18 4Q18 1Q19 2Q19 Apr 19 May 19 Jun 19 Jun 18 change
OECD AmericasVenezuela 741 618 506 538 506 285 45 114 11 12 552 -541Other Central & South America 1023 928 795 791 655 850 964 807 998 1084 823 261North Sea 109 124 150 151 172 101 258 204 285 283 157 126Other OECD Europe 1 - 1 - - - 15 - 22 23 - -Non-OECD Europe 7 - - - - - - - - - - -Former Soviet Union 75 121 145 217 94 151 256 293 249 226 238 -12Saudi Arabia 1185 1043 983 1084 1037 745 581 603 585 554 973 -419Kuwait 209 144 78 60 38 84 59 60 57 60 92 -32Iran - - - - - - - - - - - -Iraq 418 605 519 459 331 374 340 265 366 390 421 -31Oman 30 14 - - - - - - - - - -United Arab Emirates 11 20 5 10 - - - - - - 35 -Other Middle East - 2 - - - - - - - - - -West Africa2 451 497 317 232 222 165 310 184 380 364 495 -130Other Africa 223 214 196 260 134 121 179 160 166 211 199 11Asia 46 26 61 103 34 16 13 - 19 20 66 -45Other 13 4 3 - - - - - - - - -
Total 4542 4361 3759 3905 3223 2891 3020 2691 3137 3228 4050 -822of which Non-OECD 4428 4235 3606 3749 3051 2790 2747 2486 2830 2922 3894 -971
OECD EuropeCanada 32 45 81 94 44 66 34 40 9 54 84 -30Mexico + USA 354 419 640 572 694 848 768 662 766 875 595 280Venezuela 74 67 57 55 92 145 73 86 68 65 44 21Other Central & South America 170 160 132 142 134 117 76 52 102 73 97 -24Non-OECD Europe 11 9 12 9 11 11 11 9 14 10 10 0Former Soviet Union 4427 4437 4154 4024 4084 4347 4018 4547 3533 3991 4216 -225Saudi Arabia 861 750 818 921 883 825 852 810 926 818 838 -19Kuwait 194 201 137 157 116 85 105 130 82 103 100 3Iran 436 801 536 598 159 148 77 107 93 31 687 -656Iraq 1000 995 962 1060 1060 1180 1269 1142 1341 1322 884 437Oman - - - - - - - - - - - -United Arab Emirates 12 6 2 - 10 - - - - - - -Other Middle East 12 1 - - - 2 8 12 - 13 - -West Africa2 1095 960 1115 1269 1143 1146 1099 1115 1034 1150 849 301Other Africa 738 1045 1161 1149 1234 1074 1160 1250 1162 1070 1134 -65Asia - 2 - - - - - - - - - -Other 21 5 9 - - 18 24 - 69 0 0 0
Total 9438 9903 9816 10051 9665 10015 9575 9964 9199 9575 9539 36of which Non-OECD 9051 9436 9093 9380 8926 9100 8773 9261 8423 8646 8858 -212
OECD Asia OceaniaCanada - - 3 - 7 - - - - - - -Mexico + USA 179 199 344 384 522 542 559 601 561 516 285 231Venezuela 3 8 - - - - - - - - - -Other Central & South America 27 35 35 35 42 51 67 40 49 111 34 77North Sea 51 97 100 85 117 - 11 - 32 - 95 -Other OECD Europe - - - - - - - - - - - -Non-OECD Europe - - - - - - - - - - - -Former Soviet Union 341 413 437 445 465 458 405 335 415 466 361 105Saudi Arabia 2078 2163 2042 1879 2148 2108 1868 1965 1799 1842 1995 -153Kuwait 661 671 672 695 671 680 665 713 709 572 579 -7Iran 469 543 274 244 11 368 184 557 - - 332 -Iraq 456 402 435 416 422 446 388 533 308 325 533 -209Oman 86 41 56 68 43 54 66 46 82 68 51 17United Arab Emirates 1154 1148 1094 1148 1119 1116 1224 1117 1354 1196 884 312Other Middle East 475 391 450 464 454 430 387 277 415 468 371 96West Africa2 74 66 95 76 99 73 77 75 43 115 203 -88Other Africa 62 92 105 99 122 85 72 54 95 66 41 25Non-OECD Asia 340 324 320 296 321 263 198 200 185 209 271 -63Other 205 253 196 140 257 185 133 234 35 135 197 -62
Total 6659 6846 6658 6473 6821 6860 6304 6749 6082 6087 6232 -145of which Non-OECD 6429 6550 6210 6004 6175 6318 5733 6148 5489 5571 5852 -281
Total OECD Trade 20640 21110 20232 20429 19709 19767 18899 19403 18418 18890 19821 -931of which Non-OECD 19909 20221 18910 19133 18152 18208 17253 17895 16741 17139 18603 -14641 Based on Monthly Oil Questionnaire data submitted by OECD countries in tonnes, and converted to barrels at 7.37 barrels per tonne. Data will differ from Table 6 which is based on submissions in barrels.2 West Africa includes Angola, Nigeria, Gabon, Equatorial Guniea, Congo and Democratic Republic of Congo.
Table 8REGIONAL OECD CRUDE IMPORTS BY SOURCE1
(thousand barrels per day)

Oil Market Report Tables
Page | 65
IEA
. All
right
s re
serv
ed.
Table 9: Regional OECD Gasoline Imports by Source
Year Earlier2016 2017 2018 3Q18 4Q18 1Q19 2Q19 Apr 19 May 19 Jun 19 Jun 18 change
OECD AmericasVenezuela 15 18 23 26 23 15 - - - - 32 -Other Central & South America 69 42 64 83 58 81 65 88 70 36 34 2ARA (Belgium Germany Netherlands) 155 178 167 200 91 95 302 218 379 306 267 39Other Europe 328 326 323 420 203 232 368 364 462 275 458 -183FSU 90 84 80 86 52 66 78 79 102 54 106 -52Saudi Arabia - 1 11 14 28 19 9 11 10 7 - -Algeria 1 - 1 1 - - - - - - - -Other Middle East & Africa 32 24 19 22 12 10 7 8 9 6 4 2Singapore 6 10 8 16 4 - 8 - 19 6 10 -5OECD Asia Oceania 6 10 13 7 - 26 41 60 41 22 20 1Non-OECD Asia (excl. Singapore) 64 63 84 114 48 71 183 209 187 152 167 -15Other 3 3 0 - 0 - - - - - - -
Total2 769 759 794 988 518 614 1061 1036 1278 863 1098 -235of which Non-OECD 246 213 271 344 210 244 337 394 369 247 338 -92
OECD EuropeOECD Americas 1 4 4 3 4 3 5 4 7 4 8 -4Venezuela 0 - 0 0 - - - - - - - -Other Central & South America 1 3 5 2 9 6 2 4 1 1 2 -2Non-OECD Europe 15 15 11 17 9 11 20 16 27 17 14 4FSU 84 89 70 48 64 67 76 73 63 93 62 31Saudi Arabia 0 0 2 3 0 1 - - - - 10 -Algeria 1 1 0 - 1 0 0 - 0 - - -Other Middle East & Africa 2 5 4 4 5 6 4 3 1 8 3 6Singapore 1 2 2 2 2 2 4 9 2 3 2 1OECD Asia Oceania 1 1 1 0 - 1 1 1 2 1 0 1Non-OECD Asia (excl. Singapore) 1 3 2 0 6 0 - - - - - -Other -3 41 20 14 -9 30 44 56 75 -2 5 -7
Total2 104 163 122 93 90 126 156 165 179 124 106 18of which Non-OECD 89 149 105 80 73 114 142 154 160 111 84 27
OECD Asia OceaniaOECD Americas 0 - 4 5 - 5 - - - - 17 -Venezuela - - - - - - - - - - - -Other Central & South America - 0 - - - - - - - - - -ARA (Belgium Germany Netherlands) - - 13 9 10 8 40 49 49 23 23 0Other Europe - - 7 - - 6 15 13 15 18 8 9FSU - - 1 - - - 1 - 2 - - -Saudi Arabia 0 0 0 - 2 3 - - - - - -Algeria - - - - - - - - - - - -Other Middle East & Africa - 5 1 5 - - - - - - - -Singapore 44 50 47 36 47 41 27 26 31 25 35 -10Non-OECD Asia (excl. Singapore) 27 30 19 20 21 29 11 19 6 9 6 3Other 16 15 15 15 15 17 15 15 15 15 15 0
Total2 87 101 108 91 94 108 110 123 117 90 105 -15of which Non-OECD 86 101 84 77 84 89 54 61 53 49 56 -7
Total OECD Trade2 960 1023 1024 1172 702 849 1328 1324 1574 1077 1309 -231of which Non-OECD 422 463 460 501 368 447 533 608 582 406 478 -721 Based on Monthly Oil Questionnaire data submitted by OECD countries in tonnes.2 Total figure excludes intra-regional trade.
Table 9REGIONAL OECD GASOLINE IMPORTS BY SOURCE1
(thousand barrels per day)

Oil Market Report Tables
Page | 66
IEA
. All
right
s re
serv
ed.
Table 10: Regional OECD Gasoil/Diesel Imports by Source 2016 2017 2018 3Q18 4Q18 1Q19 2Q19 Apr 19 May 19 Jun 19 Jun 18 change
OECD AmericasVenezuela 0 2 4 8 7 3 - - - - - -Other Central and South America 10 13 30 25 46 29 28 38 28 19 20 -1ARA (Belgium Germany Netherlands) 3 7 6 4 - - 2 - 4 3 0 3Other Europe 9 3 3 - - 2 4 - - 13 1 12FSU 15 6 16 31 7 7 - - - - - -Saudi Arabia 1 2 17 20 24 13 - - - - 1 -Algeria - - - - - - - - - - - -Other Middle East and Africa 3 4 8 10 4 8 - - - - - -Singapore 1 0 1 - 3 0 - - - - - -OECD Asia Oceania 18 18 15 21 12 35 39 31 43 42 4 37Non-OECD Asia (excl. Singapore) 9 22 23 11 22 78 3 - 10 - 4 -Other 0 0 - - - 28 - - - - - -
Total2 68 77 124 130 125 204 77 69 85 77 31 47of which Non-OECD 37 50 100 105 114 167 32 38 38 19 25 -6
OECD EuropeOECD Americas 276 222 154 227 128 126 160 150 131 199 206 -7Venezuela - - - - - - - - - - - -Other Central and South America 3 3 4 1 1 - 0 1 - - 16 -Non-OECD Europe 48 48 39 44 41 41 37 38 39 35 44 -9FSU 663 732 714 684 641 770 661 707 623 653 690 -36Saudi Arabia 130 160 225 205 196 208 223 189 193 286 265 21Algeria 1 - - - - - - - - - - -Other Middle East and Africa 70 72 76 90 94 94 90 77 117 75 51 24Singapore 20 15 14 13 20 8 27 34 16 32 15 17OECD Asia Oceania 40 28 25 16 27 41 34 44 37 22 27 -6Non-OECD Asia (excl. Singapore) 172 125 151 171 128 188 138 173 97 146 144 1Other -18 21 12 12 16 6 13 1 6 32 0 32
Total2 1404 1427 1414 1463 1293 1482 1383 1413 1260 1480 1459 21of which Non-OECD 988 1086 1160 1154 1070 1228 1105 1126 1008 1185 1175 10
OECD Asia OceaniaOECD Americas 2 1 - - - - - - - - - -Venezuela - - - - - - - - - - - -Other Central and South America - 0 - - - - - - - - - -ARA (Belgium Germany Netherlands) - - - - - - - - - - - -Other Europe - - - - - - - - - - - -FSU 5 5 4 4 5 5 4 4 4 3 5 -2Saudi Arabia 1 - 3 - 9 - - - - - - -Algeria - - - - - - - - - - - -Other Middle East and Africa 2 1 8 1 32 10 9 26 - - - -Singapore 86 86 141 101 174 91 122 155 100 111 82 29Non-OECD Asia (excl. Singapore) 95 96 91 120 88 119 120 96 153 110 123 -13Other 6 7 6 6 6 6 6 6 6 6 6 0
Total2 196 195 254 232 313 231 260 287 262 229 215 14of which Non-OECD 194 194 254 232 313 231 260 287 262 229 215 14
Total OECD Trade2 1669 1700 1792 1825 1731 1917 1720 1770 1607 1786 1705 81of which Non-OECD 1220 1331 1514 1491 1497 1626 1396 1451 1308 1433 1415 181 Based on Monthly Oil Questionnaire data submitted by OECD countries in tonnes.2 Total figure excludes intra-regional trade.
Year Earlier
Table 10REGIONAL OECD GASOIL/DIESEL IMPORTS BY SOURCE1
(thousand barrels per day)

Oil Market Report Tables
Page | 67
IEA
. All
right
s re
serv
ed.
Table 11: Regional OECD Jet and Kerosene Imports by Source
Table 11: Regional OECD Jet and Kerosene Imports by Source
Year Earlier2016 2017 2018 3Q18 4Q18 1Q19 2Q19 Apr 19 May 19 Jun 19 Jun 18 change
OECD AmericasVenezuela 11 16 6 2 1 1 - - - - 20 -Other Central and South America 0 1 2 1 7 6 1 3 - - - -ARA (Belgium Germany Netherlands) 0 - 0 1 - - - - - - - -Other Europe - 0 0 - - - - - - - - -FSU 0 1 0 - - - - - - - 0 -Saudi Arabia 1 2 1 - 2 9 1 2 - - 0 -Algeria - 0 - - - - - - - - - -Other Middle East and Africa 1 3 2 1 0 4 10 - 17 14 - -Singapore 0 2 6 5 8 3 1 4 - - 19 -OECD Asia Oceania 97 104 84 129 78 93 161 174 155 155 97 58Non-OECD Asia (excl. Singapore) 55 30 27 28 9 12 5 15 - - 19 -Other 3 13 11 12 11 11 - - - - 20 -
Total2 169 171 140 178 115 138 179 198 172 169 175 -6of which Non-OECD 72 67 56 49 37 45 18 23 17 14 78 -64
OECD EuropeOECD Americas 38 20 32 30 30 19 13 5 3 31 40 -9Venezuela 6 5 1 1 0 - - - - - 1 -Other Central and South America 1 2 2 2 1 3 - - - - - -Non-OECD Europe 4 3 6 17 6 - 6 - 9 9 - -FSU 44 33 40 54 37 38 55 45 61 60 42 18Saudi Arabia 112 94 98 109 102 88 111 142 125 65 95 -30Algeria 14 12 9 8 8 12 - - - - 1 -Other Middle East and Africa 178 207 197 201 172 193 236 203 216 290 247 43Singapore 14 28 25 39 27 11 33 23 34 41 7 34OECD Asia Oceania 55 48 32 70 21 21 36 24 35 48 15 33Non-OECD Asia (excl. Singapore) 51 53 69 62 73 74 80 127 77 36 45 -9Other -7 1 1 2 0 0 0 0 0 - 1 -
Total2 509 508 512 595 478 459 570 571 561 580 495 85of which Non-OECD 409 436 445 491 425 414 518 539 519 495 435 61
OECD Asia OceaniaOECD Americas - - - - - - - - - - - -Venezuela - - - - - - - - - - - -Other Central and South America - - - - - - - - - - - -ARA (Belgium Germany Netherlands) - - - - - - - - - - - -Other Europe - - - - - - - - - - - -FSU - - - - - - - - - - - -Saudi Arabia - - 1 - - - - - - - - -Algeria - - - - - - - - - - - -Other Middle East and Africa - 1 1 - 5 - - - - - - -Singapore 24 23 27 36 19 21 19 16 23 18 11 7Non-OECD Asia (excl. Singapore) 36 34 26 6 42 27 21 41 23 - 15 -Other 13 22 33 13 54 33 19 15 28 15 14 0
Total2 73 80 88 55 120 81 60 72 74 33 41 -8of which Non-OECD 73 80 88 55 120 81 60 72 74 33 41 -8
Total OECD Trade2 751 758 740 829 713 678 810 840 807 782 711 71of which Non-OECD 554 583 589 594 582 540 596 634 610 542 554 -121 Based on Monthly Oil Questionnaire data submitted by OECD countries in tonnes.2 Total figure excludes intra-regional trade.
Table 11REGIONAL OECD JET AND KEROSENE IMPORTS BY SOURCE1
(thousand barrels per day)

Oil Market Report Tables
Page | 68
IEA
. All
right
s re
serv
ed.
Table 12: Regional OECD Residual Fuel Oil Imports by Source
Year Earlier2016 2017 2018 3Q18 4Q18 1Q19 2Q19 Apr 19 May 19 Jun 19 Jun 18 change
OECD AmericasVenezuela 17 16 42 65 27 27 - - - - 46 -Other Central and South America 49 71 72 80 63 56 57 46 70 54 40 14ARA (Belgium Germany Netherlands) 12 5 7 3 12 12 0 1 - - 0 -Other Europe 7 3 7 7 2 14 7 10 6 4 9 -5FSU 49 24 23 31 15 16 37 50 36 23 46 -23Saudi Arabia 0 - - - - 8 - - - - - -Algeria 4 1 - - - 10 4 8 3 2 - -Other Middle East and Africa 10 9 7 12 11 3 0 1 - - 1 -Singapore 1 3 - - - 4 - - - - - -OECD Asia Oceania - - - - - - - - - - - -Non-OECD Asia (excl. Singapore) - 1 0 - 1 - 0 0 - - - -Other 0 0 2 0 - - - - - - - -
Total2 149 131 161 197 130 149 105 116 115 82 143 -60of which Non-OECD 130 123 147 186 117 123 98 106 109 79 133 -55
OECD EuropeOECD Americas 15 6 4 11 5 1 8 3 - 20 - -Venezuela - - - - - - - - - - - -Other Central and South America 5 2 3 - - 6 4 - 8 4 4 0Non-OECD Europe 15 17 17 18 16 16 29 22 21 46 34 12FSU 448 195 154 130 155 158 146 120 165 151 121 31Saudi Arabia - 0 1 - - - - - - - - -Algeria 3 1 1 2 - 1 - - - - - -Other Middle East and Africa 16 23 15 10 19 12 17 27 10 15 9 6Singapore 0 - - - - - - - - - - -OECD Asia Oceania 10 9 8 8 12 10 21 18 27 17 7 10Non-OECD Asia (excl. Singapore) 0 1 0 - 0 7 1 1 - 1 - -Other -18 -8 5 8 4 14 10 18 7 3 4 -1
Total2 496 246 208 188 212 223 235 209 239 258 179 79of which Non-OECD 436 218 185 153 190 206 196 188 212 188 143 45
OECD Asia OceaniaOECD Americas - 0 0 - 2 2 - - - - - -Venezuela - - - - - - - - - - - -Other Central and South America - - - - - - - - - - - -ARA (Belgium Germany Netherlands) - - - - - - - - - - - -Other Europe 1 - - - - - - - - - - -FSU 4 9 16 24 19 7 0 - - 0 24 -23Saudi Arabia - - - - - - - - - - - -Algeria - 1 - - - - - - - - - -Other Middle East and Africa 5 18 23 23 16 9 27 - 49 32 30 2Singapore 73 58 37 29 24 36 21 19 15 29 37 -8Non-OECD Asia (excl. Singapore) 69 59 85 75 88 48 54 32 58 71 61 10Other 1 0 0 0 1 0 5 1 8 5 - -
Total2 153 146 162 151 149 103 107 52 130 138 152 -14of which Non-OECD 152 146 162 151 148 101 107 52 130 138 152 -14
Total OECD Trade2 798 523 531 535 492 475 446 376 483 479 473 5of which Non-OECD 718 487 493 490 454 430 401 346 450 405 429 -241 Based on Monthly Oil Questionnaire data submitted by OECD countries in tonnes.2 Total figure excludes intra-regional trade.
Table 12REGIONAL OECD RESIDUAL FUEL OIL IMPORTS BY SOURCE1
(thousand barrels per day)

Oil Market Report Tables
Page | 69
IEA
. All
right
s re
serv
ed.
Table 13
AVERAGE IEA CIF CRUDE COST AND SPOT CRUDE AND PRODUCT PRICES
Table Unavailable Available in the subscription version.
To subscribe, visit: https://webstore.iea.org/
Table 13: Average IEA CIF Crude Cost and Spot Crude and Production Prices

Oil Market Report Tables
Page | 70
IEA
. All
right
s re
serv
ed.
Table 14: Monthly Average End-User Prices for Petroleum Products
Total Ex-Tax Total Ex-TaxPrice Jul-19 Aug-18 Price Jul-19 Aug-18 Price Jul-19 Aug-18 Price Jul-19 Aug-18
GASOLINE 1 (per litre) France 1.502 - 0.8 - 2.8 0.561 -1.8 -6.0 1.671 -1.6 -6.4 0.624 -2.5 -9.5 Germany 1.427 - 2.3 - 3.7 0.544 -4.9 -7.8 1.588 -3.0 -7.2 0.605 -5.7 -11.2 Italy 1.577 - 1.0 - 3.2 0.565 -2.2 -6.9 1.754 -1.8 -6.7 0.629 -3.0 -10.3 Spain 1.319 - 0.1 - 0.6 0.617 -0.2 -3.0 1.467 -0.9 -4.3 0.686 -1.0 -6.6 United Kingdom 1.284 0.9 - 0.2 0.490 1.9 -0.4 1.561 -1.6 -5.8 0.596 -0.7 -6.0 Japan 144.6 - 0.8 - 4.9 77.3 -1.3 -8.1 1.360 1.0 -0.6 0.727 0.5 -4.0 Canada 1.205 - 5.0 - 10.1 0.811 -7.0 -13.7 0.908 -6.3 -11.7 0.611 -8.2 -15.3 United States 0.692 - 4.4 - 7.6 0.568 -5.3 -9.3 0.692 -4.4 -7.6 0.568 -5.3 -9.3
AUTOMOTIVE DIESEL FOR NON COMMERCIAL USE (per litre) France 1.415 - 0.4 - 2.4 0.570 -0.7 -4.7 1.574 -1.1 -6.0 0.634 -1.5 -8.2 Germany 1.234 - 1.1 - 4.3 0.567 -2.1 -7.5 1.373 -1.9 -7.8 0.631 -2.9 -10.9 Italy 1.465 - 1.1 - 2.7 0.584 -2.2 -5.3 1.630 -1.9 -6.2 0.650 -3.0 -8.8 Spain 1.206 - 0.2 - 1.8 0.618 -0.3 -4.6 1.342 -1.0 -5.4 0.688 -1.1 -8.1 United Kingdom 1.326 0.5 - 0.2 0.525 1.0 -0.4 1.612 -2.0 -5.8 0.638 -1.5 -6.0 Japan 125.8 - 0.7 - 3.7 84.0 -0.9 -5.1 1.183 1.1 0.5 0.790 0.8 -0.9 Canada 1.184 - 0.8 - 7.9 0.876 -1.0 -9.9 0.892 -2.1 -9.5 0.660 -2.3 -11.5 United States 0.794 - 1.2 - 6.6 0.649 -1.5 -8.3 0.794 -1.2 -6.6 0.649 -1.5 -8.3
DOMESTIC HEATING OIL (per litre) France 0.906 - 0.7 - 0.6 0.599 -0.9 -0.8 1.008 -1.5 -4.3 0.666 -1.7 -4.5 Germany 0.700 - 0.5 - 5.1 0.527 -0.5 -5.6 0.779 -1.3 -8.5 0.586 -1.3 -9.1 Italy 1.295 - 0.3 0.6 0.658 -0.5 0.9 1.440 -1.1 -3.1 0.732 -1.3 -2.8 Spain 0.769 - 0.3 - 1.8 0.539 -0.4 -3.1 0.856 -1.1 -5.4 0.599 -1.2 -6.6 United Kingdom 0.591 - 0.1 - 4.1 0.452 -0.1 -5.1 0.719 -2.6 -9.5 0.549 -2.6 -10.4 Japan 2 90.1 - 0.2 - 1.7 80.6 -0.3 -1.8 0.847 1.5 2.7 0.758 1.5 2.6 Canada 1.118 - 1.0 - 2.3 1.004 -1.0 -2.4 0.842 -2.3 -4.0 0.756 -2.3 -4.2 United States - - - - - - - - - - - -
LOW SULPHUR FUEL OIL FOR INDUSTRY 3 (per kg) France 0.557 - 4.5 - 4.2 0.418 -6.0 -5.5 0.620 -5.3 -7.7 0.465 -6.7 -9.0 Germany - - - - - - - - - - - - Italy 0.466 - 6.0 0.9 0.435 -6.4 1.0 0.519 -6.7 -2.8 0.484 -7.1 -2.7 Spain 0.439 - 1.3 - 2.0 0.422 -1.3 -2.2 0.488 -2.1 -5.6 0.469 -2.1 -5.8 United Kingdom - - - - - - - - - - - - Japan - - - - - - - - - - - - Canada - - - - - - - - - - - - United States - - - - - - - - - - - -1 Unleaded premium (95 RON) for France, Germany, Italy, Spain, UK; regular unleaded for Canada, Japan and the United States.2 Kerosene for Japan.3 VAT excluded from prices for low sulphur fuel oil when refunded to industry.
* Prices for France, Germany, Italy and Spain are in Euros; UK in British Pounds, Japan in Yen, Canada in Canadian Dollars.
% change from% change from
Table 14MONTHLY AVERAGE END-USER PRICES FOR PETROLEUM PRODUCTS
August 2019
NATIONAL CURRENCY * US DOLLARS
% change from % change from

Oil Market Report Tables
Page | 71
IEA
. All
right
s re
serv
ed.
Table 15: IEA/KBC Global Indicator Refining Margins Change
May 19 Jun 19 Jul 19 Aug 19 Aug 19-Jul 19 09 Aug 16 Aug 23 Aug 30 Aug 06 Sep
NW EuropeBrent (Cracking) 5.38 3.78 6.79 7.62 0.83 8.49 7.94 6.92 6.84 5.69 Urals (Cracking) 4.50 4.67 6.55 5.64 -0.92 6.37 5.92 5.06 5.12 5.35 Brent (Hydroskimming) 1.41 1.52 4.18 4.40 0.21 5.12 4.36 4.07 3.75 2.90 Urals (Hydroskimming) -0.70 0.81 2.46 -0.60 -3.06 0.66 -0.87 -1.44 -1.31 -0.86
MediterraneanEs Sider (Cracking) 4.54 4.58 7.93 8.26 0.33 9.14 8.74 7.53 7.23 6.44 Urals (Cracking) 3.18 4.97 6.62 5.00 -1.62 5.73 4.93 4.27 4.75 5.38 Es Sider (Hydroskimming) 1.28 2.44 5.62 5.35 -0.27 6.27 5.49 4.85 4.29 3.57 Urals (Hydroskimming) -1.94 0.69 2.30 -1.65 -3.95 -0.25 -2.42 -2.76 -2.11 -1.93
US Gulf CoastMars (Cracking) 4.11 4.65 6.01 2.49 -3.52 3.62 0.53 1.40 2.61 1.53 50/50 HLS/LLS (Coking) 10.64 11.12 13.73 11.60 -2.13 11.76 10.23 11.80 11.38 9.30 50/50 Maya/Mars (Coking) 7.21 6.27 8.03 9.16 1.13 9.35 8.63 9.19 9.09 4.70 ASCI (Coking) 8.03 8.36 9.59 8.86 -0.73 8.89 7.42 8.77 9.81 7.77
US Midwest30/70 WCS/Bakken (Cracking) 23.27 18.87 18.76 11.04 -7.71 11.63 9.78 10.28 11.19 10.22 Bakken (Cracking) 25.34 20.50 20.40 13.97 -6.43 13.55 13.47 13.48 14.82 12.79 WTI (Coking) 24.97 21.12 21.01 14.38 -6.63 15.71 13.80 13.60 12.86 11.27 30/70 WCS/Bakken (Coking) 26.22 21.07 20.86 14.79 -6.08 15.18 13.96 14.51 14.82 12.95
SingaporeDubai (Hydroskimming) -1.57 -0.07 3.56 0.29 -3.27 1.11 -1.22 -1.36 1.30 1.09 Tapis (Hydroskimming) -0.93 -0.62 3.78 2.10 -1.69 3.49 1.74 1.10 1.11 -0.72 Dubai (Hydrocracking) 2.28 2.87 5.61 4.66 -0.95 5.14 4.57 3.66 4.86 5.18 Tapis (Hydrocracking) 0.60 -0.55 3.48 4.70 1.22 5.82 5.39 4.22 3.61 2.09
1 Global Indicator Refining Margins are calculated for various complexity configurations, each optimised for processing the specific crude(s) in a specific refining centre. Margins include energy cost, but exclude other variable costs, depreciation and amortisation. Consequently, reported margins should be taken as an indication, or proxy, of changes in profitability for a given refining centre. No attempt is made to model or otherwise comment upon the relative economics of specific refineries running individual crude slates and producing custom product sales, nor are these calculations intended to infer the marginal values of crude for pricing purposes. Source: IEA, KBC Advanced Technologies (KBC)
Table 15IEA/KBC Global Indicator Refining Margins1
($/bbl)
Monthly Average Average for week ending:

Oil Market Report Tables
Page | 72
IEA
. All
right
s re
serv
ed.
Table 16: Refined Product Yields Based On Total Input (%) Apr-19 May-19 Jun-19 Jun-18
Jun 19 vs Previous
Month
Jun 19 vs Previous
Year
Jun 19 vs 5 Year
Average 5 Year
Average
OECD AmericasNaphtha 1.4 1.4 1.4 1.4 0.0 0.1 -0.1 1.6Motor gasoline 44.6 44.3 43.2 44.1 -1.0 -0.8 -2.0 45.2Jet fuel 9.5 9.3 9.6 9.7 0.4 0.0 0.7 9.0Other kerosene 0.1 0.1 0.1 0.1 0.0 -0.1 -0.1 0.1Gasoil/diesel oil 28.7 28.8 28.2 28.2 -0.5 0.0 -0.1 28.3Residual fuel oil 3.4 3.1 3.3 3.2 0.2 0.2 -0.2 3.6Petroleum coke 4.3 4.0 4.0 4.4 0.0 -0.4 -0.6 4.6Other products 12.8 13.1 13.3 13.0 0.2 0.3 0.1 13.1
OECD EuropeNaphtha 8.4 8.3 7.8 8.2 -0.5 -0.4 0.1 7.6Motor gasoline 20.0 20.3 20.9 20.6 0.6 0.3 0.3 20.6Jet fuel 8.9 9.0 8.9 9.1 -0.1 -0.2 0.3 8.5Other kerosene 2.2 2.1 1.9 1.7 -0.2 0.2 0.1 1.8Gasoil/diesel oil 40.2 40.3 39.5 38.3 -0.7 1.2 0.1 39.4Residual fuel oil 9.2 8.3 8.5 9.7 0.2 -1.2 -0.5 9.0Petroleum coke 1.3 1.4 1.4 1.3 0.0 0.1 0.1 1.3Other products 14.9 15.1 15.9 15.3 0.8 0.6 0.1 15.8
OECD Asia OceaniaNaphtha 16.2 16.4 16.6 14.9 0.3 1.7 2.1 14.5Motor gasoline 20.6 21.6 21.6 21.8 0.0 -0.3 -0.9 22.5Jet fuel 14.8 15.3 15.7 15.0 0.3 0.7 1.3 14.3Other kerosene 2.8 2.8 2.1 1.6 -0.6 0.5 -0.1 2.2Gasoil/diesel oil 29.6 30.9 30.5 30.1 -0.4 0.3 0.1 30.3Residual fuel oil 6.5 5.7 5.4 7.0 -0.3 -1.6 -1.9 7.3Petroleum coke 0.5 0.4 0.5 0.5 0.1 0.0 0.0 0.5Other products 12.9 12.9 12.7 12.8 -0.2 -0.1 0.2 12.5
OECD TotalNaphtha 6.4 6.2 6.0 5.8 -0.2 0.2 0.3 5.7Motor gasoline 32.2 32.7 32.6 32.9 -0.1 -0.3 -1.0 33.6Jet fuel 10.3 10.2 10.4 10.4 0.2 0.1 0.7 9.7Other kerosene 1.3 1.2 1.0 0.9 -0.2 0.1 0.0 1.0Gasoil/diesel oil 32.6 32.8 32.1 31.7 -0.7 0.4 -0.1 32.2Residual fuel oil 5.8 5.2 5.3 5.9 0.1 -0.6 -0.6 5.9Petroleum coke 2.6 2.6 2.6 2.8 0.0 -0.2 -0.2 2.8Other products 13.5 13.7 14.0 13.7 0.3 0.3 0.1 13.91 Due to processing gains and losses, yields in % will not always add up to 100%
Table 16REFINED PRODUCT YIELDS BASED ON TOTAL INPUT (%)1

Oil Market Report Tables
Page | 73
IEA
. All
right
s re
serv
ed.
Table 17: World Biofuels Production 2017 2018 2019 4Q18 1Q19 2Q19 Jun 19 Jul 19 Aug 19
ETHANOLOECD Americas1 1062 1081 1064 1073 1048 1072 1067 1067 1067
United States 1032 1048 1028 1040 1012 1037 1031 1031 1031Other 30 33 36 33 36 36 36 36 36
OECD Europe2 88 93 93 91 96 102 110 87 87France 13 16 15 17 16 19 21 12 12Germany 14 16 16 14 19 22 23 12 12Spain 7 9 9 9 7 7 7 11 11United Kingdom 11 9 8 9 11 9 10 5 5Other 42 43 46 42 43 45
OECD Asia Oceania3 3 5 5 5 5 5 5 5 5Australia 3 4 4 4 5 4 4 4 4Other 0 1 1 1 1 1 1 2 2
Total OECD Ethanol 1153 1179 1162 1169 1149 1179 1181 1160 1160Total Non-OECD Ethanol 627 713 734 618 331 943 1068 1211 1109
Brazil 478 547 540 453 138 751 876 1020 918China 71 70 69 77 69 67Argentina 15 19 19 19 19 19Other 64 77 105 70 105 105 192 192 192
TOTAL ETHANOL 1780 1892 1896 1788 1480 2122 2248 2372 2270
BIODIESELOECD Americas1 111 128 148 137 114 136 163 170 170
United States 104 121 140 129 110 132 159 159 159Other 7 7 8 7 4 4 4 12 12
OECD Europe2 265 257 275 247 246 270 258 291 291France 47 48 51 49 49 54 54 51 51Germany 62 58 58 52 50 57 58 63 63Italy 13 14 26 14 29 25 16 25 25Spain 34 36 35 36 30 30 30 40 40Other 108 101 104 95 88 104 100 112 112
OECD Asia Oceania3 12 14 15 11 10 17 18 17 17Australia 1 1 1 1 0 0 0 1 1Other 11 13 14 10 10 17 17 15 15
Total OECD Biodiesel 388 399 438 394 370 423 439 478 478Total Non-OECD Biodiesel 293 325 360 326 360 359 359 360 360
Brazil 74 92 94 100 93 95 97 101 93Argentina* 56 51 53 51 53 53Other 163 182 213 175 215 211
TOTAL BIODIESEL 680 725 798 720 730 783 798 839 839
GLOBAL BIOFUELS 2460 2616 2694 2508 2210 2904 3046 3211 31091 As of August 2012 OMR, OECD Americas includes Chile.2 As of August 2012 OMR, OECD Europe includes Estonia and Slovenia.3 As of August 2012 OMR, OECD Asia Oceania includes Israel.
Table 17WORLD BIOFUELS PRODUCTION
(thousand barrels per day)

Source: IEA 2019. All Rights Reserved
Without prejudice to the terms and conditions on the IEA website at www.iea.org/t&c/termsandconditions/ (the Terms), which also apply to this Oil Market Report (OMR) and its related publications, the Executive Director and the Secretariat of the IEA are responsible for the publication of the OMR. Although some of the data are supplied by IEA Member-country governments, largely on the basis of information they in turn receive from oil companies, neither these governments nor these oil companies necessarily share the Secretariat’s views or conclusions as expressed in the OMR. The OMR is prepared for general circulation and is distributed for general information only. Neither the information nor any opinion expressed in the OMR constitutes an offer, or an invitation to make an offer, to buy or sell any securities or any options, futures or other derivatives related to such securities.
As set out in the Terms, the IEA owns the copyright in this OMR. However, in relation to the edition of OMR made available to Subscribers (as defined in the Terms), all Argus information is sourced as Copyright © 2019 Argus Media Limited and is published here with the permission of Argus. The spot crude and product price assessments are based on daily Argus prices, converted when appropriate to USD per barrel according to the Argus specification of products. Argus Media Limited reserves all rights in relation to all Argus information. Any reproduction of Argus information requires the express prior written permission of Argus. Argus shall not be liable to any party for any inaccuracy, error or omission contained or provided in Argus information contained in this OMR or for any loss, or damage, whether or not due to reliance placed by that party on information in this OMR.
Oil Market Team
Editor
Neil Atkinson +33 (0)1 40 57 65 90
Prices / Supply Anne Kloss +33 (0)1 40 57 67 28
[email protected] Demand Christophe Barret
+33 (0)1 40 57 65 16 [email protected]
Stocks / Demand Masataka Yarita +33 (0)1 40 57 67 64
[email protected] Demand / Stocks Olivier Lejeune
+33 (0)1 40 57 67 58 [email protected]
Research Assistant Limin Wang +33 (0)1 40 57 66 34
[email protected] OPEC Supply Peg Mackey
+33 (0)1 40 57 65 81 [email protected]
Statistics Pierre Monferrand +33 (0)1 40 57 66 67
[email protected] Non-OPEC Supply Toril Bosoni
+33 (0)1 40 57 67 18 [email protected]
Statistics Luis Fernando Rosa +33 (0)1 40 57 65 56
[email protected] Refining Kristine Petrosyan
+33 (0)1 40 57 66 05 [email protected]
Editorial Assistant Deven Mooneesawmy +33 (0)1 40 57 65 03
[email protected] Subscription & Delivery Enquiries
+33 (0)1 40 57 66 90 [email protected]
Media Enquiries IEA Press Office
+33 (0)1 40 57 66 94 [email protected]
Next Issue: 11 October 2019
For information on the data sources, definitions, technical terms and general approach used in preparing the Oil Market Report (OMR), Market Report Series_Oil and Annual Statistical Supplement (current issue of the Statistical Supplement dated 9 August 2019), readers are referred to the Users’ Guide at www.oilmarketreport.org/glossary.asp. It should be noted that the spot crude and product price assessments are based on daily Argus prices, converted when appropriate to US$ per barrel according to the Argus specification of products (Copyright © 2019 Argus Media Limited - all rights reserved)