12. earth/geology technical report · geology (cdmg), as “active” if there is evidence of...
TRANSCRIPT
Technical Report
LAX Master Plan EIS/EIR
12. Earth/Geology Technical Report
January 2001
Prepared for:
Los Angeles World Airports
U.S. Department of TransportationFederal Aviation Administration
Prepared by:
Camp Dresser & McKee Inc.

Los Angeles International Airport i LAX Master Plan Draft EIS/EIR
Table of Contents1. Introduction ...................................................................................................................................... 12. Affected Environment/Environmental Baseline................................................................................ 1
2.1 Geology and Soils ............................................................................................................... 12.1.1 Stratigraphy............................................................................................................ 12.1.2 Artificial Fill............................................................................................................. 22.1.3 Typical Foundations............................................................................................... 2
2.2 Faults and Earthquakes...................................................................................................... 22.2.1 Faults ..................................................................................................................... 22.2.2 Earthquake Generating Characteristics of Faults Affecting LAX .............................. 142.2.3 Historic Earthquakes............................................................................................ 17
2.3 Hydrogeology.................................................................................................................... 192.4 Geologic Hazards ............................................................................................................. 20
2.4.1 Seismic Hazards.................................................................................................. 202.4.1.1 Fault Surface Rupture and Co-seismic Ground Deformation................. 202.4.1.2 Ground Shaking...................................................................................... 212.4.1.3 Liquefaction............................................................................................. 222.4.1.4 Seismic Slope Stability............................................................................ 282.4.1.5 Seismic Settlement ................................................................................. 282.4.1.6 Tsunami, Seiche, and Flooding .............................................................. 28
2.4.2 Volcanic Hazards ................................................................................................. 292.4.3 Settlement............................................................................................................ 292.4.4 Oil Field Subsidence/Oil Field Gas ...................................................................... 292.4.5 Subsidence Due to Groundwater Withdrawal...................................................... 30
3. Methodology................................................................................................................................... 303.1 Fault Surface Rupture Potential – Estimate of Magnitude of Displacement ..................... 31
3.1.1 Surface Rupture due to Vertical Displacement.................................................... 313.1.2 Surface Rupture due to Strike-Slip Displacement ............................................... 313.1.3 Summary and Conclusions.................................................................................. 32
3.2 Ground Shaking Analysis.................................................................................................. 373.3 Liquefaction Evaluation..................................................................................................... 413.4 Seismic Settlement Evaluation ......................................................................................... 413.5 Aerial Photograph Review................................................................................................. 41
4. References..................................................................................................................................... 43
List of TablesTable 1 Abridged Modified Mercalli Intensity Scale ....................................................................... 14Table 2 Fault Source Parameters.................................................................................................. 18Table 3 Historical Seismicity (M>5) of the LAX Vicinity (100 km radius) ....................................... 19Table 4 Depth to Perched Water at Selected Locations................................................................ 25Table 5 Matrix of Potential Earth/Geologic Considerations for Major Master Plan Facilities......... 33Table 6 Deterministic Ground Motion Estimates for Site A............................................................ 38Table 7 Deterministic Ground Motion Estimates for Site B............................................................ 39Table 8 Deterministic Ground Motion Estimates for Site C ........................................................... 40Table 9 Summary of Aerial Photographs Reviewed ...................................................................... 42
List of FiguresFigure 1 Generalized Stratigraphic Column, Coastal Plain of Los Angeles County.......................... 3Figure 2 Geologic Map...................................................................................................................... 5Figure 3 Cross Sections A-A’ and B-B’ ............................................................................................. 7Figure 4 Physiographic Map.............................................................................................................. 9Figure 5 Fault Map .......................................................................................................................... 11Figure 6 Composite Aerial Lineament Map..................................................................................... 15Figure 7 Depth to Perched Water at Selected Locations................................................................ 23

Los Angeles International Airport 1 LAX Master Plan Draft EIS/EIR
1. INTRODUCTIONThis Supplemental Report presents additional information to support the assessment of potentialearth/geology impacts associated with implementation of the Los Angeles International (LAX) AirportMaster Plan. This report provides data and analysis in support of the Environmental ImpactStatement/Environmental Impact Report (EIS/EIR) for the LAX Master Plan pursuant to the NationalEnvironmental Policy Act (NEPA) and the California Environmental Quality Act (CEQA).
This report provides information regarding the affected environment and methodologies used to determineproject impacts that is supplemental to the material presented in Section 4.22, Earth/Geology, of theEIS/EIR. Impacts associated with the information contained in this Supplemental Report are addressed inthe EIS/EIR section.
The EIS/EIR evaluates four alternatives, including a No Action/No Project Alternative and three buildalternatives (Alternatives A, B, and C). The study area for the earth/geology analysis includes the existingairport and the total (composite) area considered for acquisition under the three build alternatives, theAircraft Noise Mitigation Program (ANMP) acquisition areas (Manchester Square and Belford), the off-sitefuel farm sites, and the LAX Expressway alignments.
2. AFFECTED ENVIRONMENT/ENVIRONMENTALBASELINE
The supplemental information presented in the following sections was derived from published references(as noted) and unpublished reports of consultant investigations from the LAWA files. Some of the datapresented below are based on data from numerous sources in the LAWA files, and in such cases, thereferences are not listed within the text. However, these sources are listed in Section 4, References, atthe end of this report. Additional information on existing conditions is presented in the Section 4.22,Earth/Geology, of the EIS/EIR.
2.1 Geology and Soils2.1.1 StratigraphyIn the vicinity of LAX (including Manchester Square, Continental City, LAX Northside/WestchesterSouthside, and the LAX Expressway alignments), the stratigraphy generally consists of a basement ofMesozoic schistose rock, overlain by the Miocene Puente Formation, the Pliocene Repetto and PicoFormations, the Lakewood Formation and, in the western areas, Older Dune Sands of Pleistocene age,and Recent Dune Sands of Holocene age. Analysis of air photos from the 1920s also indicates Holoceneaged alluvium deposits may occupy local drainage channels at LAX as well. Figure 1, GeneralizedStratigraphic Column, presents a generalized stratigraphic column for these formations.
Older Dune Sand immediately underlies the ground surface in the majority of the airport area includingLAX Northside/Westchester Southside, with the exception of the portion east of Sepulveda Boulevard, andthe extreme western portion. The Lakewood Formation is exposed in the eastern portion of the airport,and Recent Dune Sand is exposed in the extreme western area. Approximate areal extents of theseformations are illustrated in Figure 2, Geologic Map. Cross-sections showing selected boring logs fromsome of the geotechnical and geologic investigations at LAX are presented in Figure 3, Cross Sections.
The Lakewood Formation generally consists of alternating layers of dense to very dense sand, clayeysand, silty sand, and very stiff to hard silty to sandy clay and clayey silt. Older Dune Sand overlies theLakewood Formation, and generally is composed of sand and silty sand. The sands are fine to mediumgrained, poorly graded, and dense to very dense. Clayey sand and clay layers are locally present atshallow depths. Scattered gravel is also present. Recent Dune Sand overlies Older Dune Sand, and isexposed in the area extending from the beach to approximately Pershing Drive.
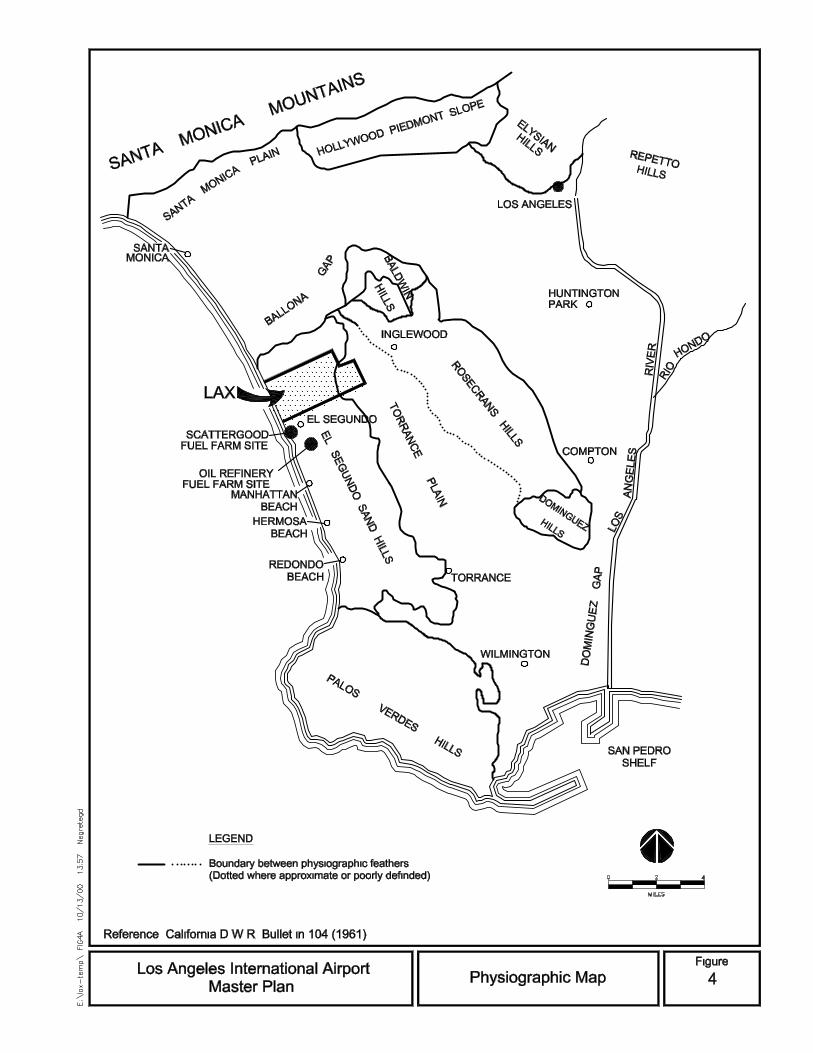
The Recent Dune Sand consists of fine to medium grained, poorly graded sand. In the vicinity of theScattergood Fuel Farm site and the oil refinery fuel farm site, as shown in Figure 4, Physiographic Map,the stratigraphy generally consists of a basement of Mesozoic schistose rock, overlain by the MiocenePuente Formation, the Pliocene Repetto and Pico Formations, the Lakewood Formation and Older DuneSands of Pleistocene age, and Recent Dune Sands of Holocene age. Recent dune sand underlies the
12. Earth/Geology Technical Report
Los Angeles International Airport 2 LAX Master Plan Draft EIS/EIR
entire Scattergood Fuel Farm Site and the extreme western portion of the oil refinery located south of theairport. Older Dune Sand underlies the majority of the oil refinery.
2.1.2 Artificial FillBased on a review of geotechnical investigations conducted at LAX, artificial fill of varying thickness, age,and quality is present at different locations in the LAX area. Large amounts of fill were placed under thedirection of the Los Angeles City Department of Public Works (LADPW) during the extensive phase ofairport development in the late 1950s and early 1960s. No comprehensive source documenting thepresence of artificial fill at LAX was discovered during review of LAWA files; however, most of theinvestigations reported at least some amounts of artificial fill, particularly in the Central Terminal Area(CTA). Several of the subsurface investigations included in the LAWA files reviewed reported thepresence of artificial fill up to 23 feet in the CTA.
As part of the EIS/EIR, numerous investigation documents from the LAWA files were reviewed in an effortto map the presence of fill materials at LAX (see Section 4, References). However, the amount andgeneral quality of information on fill location is very limited. The scope and area covered by most reportsis relatively small, and reliable information on the depth of the fill is often lacking. The reports in theLAWA files only cover certain areas, with no information on the majority of the airport area. Comparisonsbetween historic and current topographic maps were also made; however, because the map scalesmasked significant elevation differences and uncertainties regarding relative baseline elevations, noconclusions regarding the location of artificial fill could be developed.
2.1.3 Typical FoundationsTypical structures at LAX include multi-story passenger terminal buildings, aircraft cargo and maintenancestructures, elevated roadway structures, roadway and runway structural pavements, and tall towers.Typical subsurface structures beneath LAX include utility conduits and pipelines, subterranean basementstructures, subterranean pedestrian walkways, subterranean roadways, and large diameter tunnels,including the Coastal Interceptor Sewer, the North Outfall Sewer, and the North Central Outfall Sewer.
Most engineered structures located in the airport area are founded in either the Lakewood Formation orOlder Dune Sand. The Lakewood and Older Dune Sand Formations are typically suitable foundationbearing material although foundations bearing in or near the local clay layers may require special design.Recent Dune Sand occurs on the extreme western edge, where currently few structures are located.Existing artificial fill has generally not been considered a suitable foundation material in any portion of LAXby previous investigators. Older Dune Sand serves as a foundation for structures in the majority of thecentral and west LAX area, while in the portion of the airport east of Sepulveda Boulevard, the LakewoodFormation generally is the foundation material.
Conventional spread footings and mat foundations are common foundations for structures in the airportarea, based on a review of geotechnical investigation reports in LAWA files. Conventional spread footingsare typically founded 24 inches below grade or into natural soils. Typical recommendations for allowablebearing pressures for continuous footings in the Older Dune Sands have been between 2,000 to 5,000pounds per square foot (psf). Recommended bearing pressures for spread footings in the LakewoodFormation were as high as 6,000 psf (for a subterranean structure.) A mat foundation in Older Dune Sandwas two feet thick and was designed using an allowable bearing pressure of 1,500 psf. A mat foundationin the Lakewood Formation was designed for an allowable bearing capacity of 6,000 psf. Deepenedfoundations are utilized in areas of deep fill and typical recommended diameters for piles range from 18inches for parking structures to eight feet for elevated roadways.
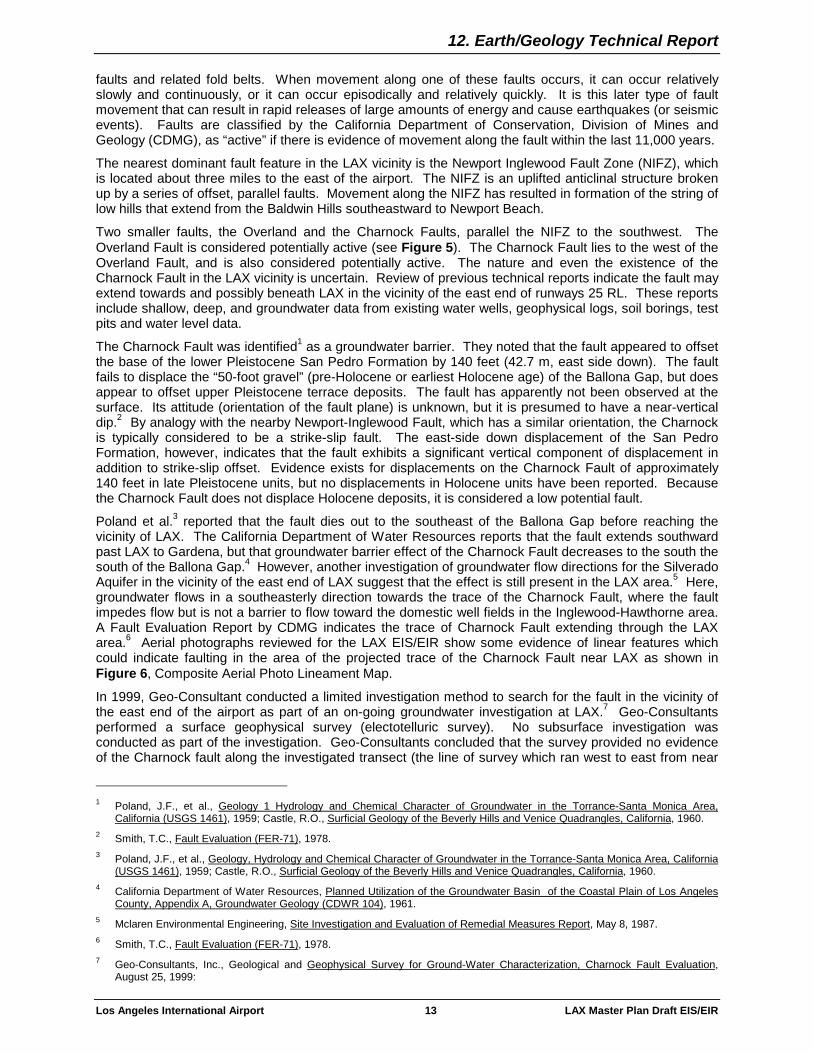
2.2 Faults and Earthquakes2.2.1 FaultsSouthern California is one of the more seismically active regions of the United States. Numerous faultscapable of causing earthquakes are located throughout the Los Angeles Basin as shown in Figure 5,Fault Map.
In general these faults represent a boundary between two tectonic plates of the earth’s crust, known asthe Pacific Plate and the North American Plate. These two crustal plates move relative to each other inresponse to forces within the earth. In the Los Angeles Basin, this plate movement typically occurs along


12. Earth/Geology Technical Report
Los Angeles International Airport 13 LAX Master Plan Draft EIS/EIR
faults and related fold belts. When movement along one of these faults occurs, it can occur relativelyslowly and continuously, or it can occur episodically and relatively quickly. It is this later type of faultmovement that can result in rapid releases of large amounts of energy and cause earthquakes (or seismicevents). Faults are classified by the California Department of Conservation, Division of Mines andGeology (CDMG), as “active” if there is evidence of movement along the fault within the last 11,000 years.
The nearest dominant fault feature in the LAX vicinity is the Newport Inglewood Fault Zone (NIFZ), whichis located about three miles to the east of the airport. The NIFZ is an uplifted anticlinal structure brokenup by a series of offset, parallel faults. Movement along the NIFZ has resulted in formation of the string oflow hills that extend from the Baldwin Hills southeastward to Newport Beach.
Two smaller faults, the Overland and the Charnock Faults, parallel the NIFZ to the southwest. TheOverland Fault is considered potentially active (see Figure 5). The Charnock Fault lies to the west of theOverland Fault, and is also considered potentially active. The nature and even the existence of theCharnock Fault in the LAX vicinity is uncertain. Review of previous technical reports indicate the fault mayextend towards and possibly beneath LAX in the vicinity of the east end of runways 25 RL. These reportsinclude shallow, deep, and groundwater data from existing water wells, geophysical logs, soil borings, testpits and water level data.
The Charnock Fault was identified1 as a groundwater barrier. They noted that the fault appeared to offsetthe base of the lower Pleistocene San Pedro Formation by 140 feet (42.7 m, east side down). The faultfails to displace the “50-foot gravel” (pre-Holocene or earliest Holocene age) of the Ballona Gap, but doesappear to offset upper Pleistocene terrace deposits. The fault has apparently not been observed at thesurface. Its attitude (orientation of the fault plane) is unknown, but it is presumed to have a near-verticaldip.2 By analogy with the nearby Newport-Inglewood Fault, which has a similar orientation, the Charnockis typically considered to be a strike-slip fault. The east-side down displacement of the San PedroFormation, however, indicates that the fault exhibits a significant vertical component of displacement inaddition to strike-slip offset. Evidence exists for displacements on the Charnock Fault of approximately140 feet in late Pleistocene units, but no displacements in Holocene units have been reported. Becausethe Charnock Fault does not displace Holocene deposits, it is considered a low potential fault.
Poland et al.3 reported that the fault dies out to the southeast of the Ballona Gap before reaching thevicinity of LAX. The California Department of Water Resources reports that the fault extends southwardpast LAX to Gardena, but that groundwater barrier effect of the Charnock Fault decreases to the south thesouth of the Ballona Gap.4 However, another investigation of groundwater flow directions for the SilveradoAquifer in the vicinity of the east end of LAX suggest that the effect is still present in the LAX area.5 Here,groundwater flows in a southeasterly direction towards the trace of the Charnock Fault, where the faultimpedes flow but is not a barrier to flow toward the domestic well fields in the Inglewood-Hawthorne area.A Fault Evaluation Report by CDMG indicates the trace of Charnock Fault extending through the LAXarea.6 Aerial photographs reviewed for the LAX EIS/EIR show some evidence of linear features whichcould indicate faulting in the area of the projected trace of the Charnock Fault near LAX as shown inFigure 6, Composite Aerial Photo Lineament Map.
In 1999, Geo-Consultant conducted a limited investigation method to search for the fault in the vicinity ofthe east end of the airport as part of an on-going groundwater investigation at LAX.7 Geo-Consultantsperformed a surface geophysical survey (electotelluric survey). No subsurface investigation wasconducted as part of the investigation. Geo-Consultants concluded that the survey provided no evidenceof the Charnock fault along the investigated transect (the line of survey which ran west to east from near
1 Poland, J.F., et al., Geology 1 Hydrology and Chemical Character of Groundwater in the Torrance-Santa Monica Area,
California (USGS 1461), 1959; Castle, R.O., Surficial Geology of the Beverly Hills and Venice Quadrangles, California, 1960.2 Smith, T.C., Fault Evaluation (FER-71), 1978.3 Poland, J.F., et al., Geology, Hydrology and Chemical Character of Groundwater in the Torrance-Santa Monica Area, California
(USGS 1461), 1959; Castle, R.O., Surficial Geology of the Beverly Hills and Venice Quadrangles, California, 1960.4 California Department of Water Resources, Planned Utilization of the Groundwater Basin of the Coastal Plain of Los Angeles
County, Appendix A, Groundwater Geology (CDWR 104), 1961.5 Mclaren Environmental Engineering, Site Investigation and Evaluation of Remedial Measures Report, May 8, 1987.6 Smith, T.C., Fault Evaluation (FER-71), 1978.7 Geo-Consultants, Inc., Geological and Geophysical Survey for Ground-Water Characterization, Charnock Fault Evaluation,
August 25, 1999:

12. Earth/Geology Technical Report
Los Angeles International Airport 14 LAX Master Plan Draft EIS/EIR
the intersection of Airport Boulevard and Sepulveda to near the intersection of Inglewood Avenue and104th Street). Geo-Consultants concluded that the fault is either buried more deeply in the subsurface, ormoves further northeast towards the Newport-Inglewood Fault Zone and away from LAX. For thepurposes of this EIS/EIR, it has been assumed that the Charnock Fault does exist in the vicinity of theeastern end of LAX and that it is potentially active as reported by the State Geologist.
2.2.2 Earthquake Generating Characteristics of Faults AffectingLAX
Over the past century, efforts have been made to quantify earthquake (or seismic) activity for research and planningpurposes. Two common methods for measuring and recording seismic activity in Southern California are; 1) humanobservations of damage intensity to engineered structures and, 2) instrumental readings. Observed intensity data arerelatively easy to gather, but somewhat subjective. Much of the early intensity data was obtained by collection, review,and analysis of mission records, newspaper articles, letters, diaries, and other sources. Several scales have beendeveloped to rank intensity observations. The most commonly used scale in the U.S. is the Modified Mercalli Intensity(MMI) Scale, which assigns intensity values ranging from I to XII. A MMI of ‘I’ generally would not be noticed byhumans. A MMI of ‘XII’ would include nearly total destruction of most engineered structures. Detailed descriptions ofMercalli intensities are presented in Table 1, Abridged Modified Mercalli Intensity Scale.
Table 1
Abridged Modified Mercalli Intensity Scale
Intensity DescriptionI Not felt except by a very few under especially favorable circumstances.II Felt by only a few persons at rest, especially on upper floors of buildings. Delicately suspended objects
may swing.III Felt quite noticeably indoors, especially on upper floors of buildings, but many people do not recognize it
as an earthquake. Standing motorcars may rock slightly. Vibration like passing of a truck. Durationestimated.
IV During the day felt indoors by many, outdoors by few. At night some awakened. Dishes, windows, doorsdisturbed; walls make creaking sound. Sensation like heavy truck striking building. Standing motorcarsrocked noticeably.
V Felt by nearly everyone, many awakened. Some dishes, windows, and so on broken; cracked plaster in afew places; unstable objects overturned. Disturbances of trees, poles, and other tall objects sometimesnoticed. Pendulum clocks may stop.
VI Felt by all, many frightened and run outdoors. Some heavy furniture moved; a few instances of fallenplaster and damaged chimneys. Damage slight.
VII Everybody runs outdoors. Damage negligible in buildings of good design and construction; slight tomoderate in well-built ordinary structures; considerable in poorly built or badly designed structures; somechimneys broken. Noticed by persons driving cars.
VIII Damage slight in specially designed structures; considerable in ordinary substantial buildings with partialcollapse; great in poorly built structures. Panel walls thrown out of frame structures. Fall of chimneys,factory stacks, columns, monuments, and walls. Heavy furniture overturned. Sand and mud ejected insmall amounts. Changes in well water. Persons driving cars disturbed.
IX Damage considerable in specially designed structures; well-designed frame structures thrown out ofplumb; great in substantial buildings, with partial collapse. Buildings shifted off foundations. Groundcracked conspicuously. Underground pipes broken.
X Some well-built wooden structures destroyed; most masonry and frame structures destroyed withfoundations; ground badly cracked. Railway lines bent. Landslides considerable from riverbanks andsteep slopes. Shifted sand and mud. Water splashed, slopped over banks.
XI Few, if any, (masonry) structures remain standing. Bridges destroyed. Broad fissures in ground.Underground pipelines completely out of service. Earth slumps and land slips in soft ground. Rails bentgreatly.
XII Damage total. Waves seen on ground surface. Lines of sight and level distorted. Objects thrown into theair.
Source: California Department of Conservation, Division of Mines and Geology, Planning Scenario for a Major Earthquake onthe Newport-Inglewood Fault Zone, Special Publication 99, 1988.

12. Earth/Geology Technical Report
Los Angeles International Airport 17 LAX Master Plan Draft EIS/EIR
Instrumental readings and analysis of recordings or seismograms provide data on earthquake size (i.e.,magnitude), and location or epicenter, among other things. In the 1930s, Charles Richter developed themagnitude scale. The magnitude (M) of an earthquake is based on the maximum-recorded amplitude ofmotion measured by a Wood-Anderson seismograph normalized to a distance of 100 km. An increase inmagnitude from six to seven represents a ten-fold increase in the recorded peak motion. Earthquakemagnitudes greater than five are generally responsible for damage to structures. The generallyrecognized upper bound for earthquake magnitudes is between eight and nine. Instruments can alsorecord the ground acceleration caused by an earthquake. The earthquake induced acceleration value iscommonly measured as a decimal fraction of the earth’s gravitational constant. For example, anearthquake producing a ground acceleration of ½ that of earth’s gravity would be rated as “0.5 g.”
It is important to note that an earthquake’s magnitude is a constant value independent of other factors.However, intensity values, ground acceleration, and seismic shaking are dependent on many differentfactors, including distance from the earthquake location or epicenter, and rock or soil types. Therefore, anearthquake of a given magnitude would produce different seismic intensities at different locations.
Scientists have known for some time that earthquakes are associated with movement along faults in theearth’s crust. In an effort to quantify and study earthquakes’ characteristics, scientists have created whatare known as seismic source models (SSM). An SSM identifies the location and characteristics of fault(s)or seismogenic sources within a particular area. Within the last ten years, several dozen seismic sourcemodels (SSM) have been developed for Southern California by various researchers. In order to provideestimates of future seismic shaking, also known as strong ground motion, CDMG and the SouthernCalifornia Earthquake Center (SCEC) have developed detailed SSMs. Estimates of strong motion can beused by engineers, planners, emergency service organizations and others for design of structures, landuse planning, and emergency response. The type of SSM used effects the estimates of future strongmotion used for design and planning purposes at LAX. Several different SSMs were referred to in reportsfor previous LAX projects, and components of different SSMs were used in the evaluation of groundshaking for the EIS/EIR as described in Section 3, Methodology, below.
It is unlikely that ruptures associated with large earthquakes are truly independent from all other faults inthe region. There is evidence from both historic and prehistoric earthquakes that fault rupture on two ormore faults may occur during a “single” earthquake. Earthquakes that rupture multiple fault segmentswould result in increased estimates of magnitude, particularly in the use of moment magnitude (Mw).Moment magnitude is directly related to the size of the rupture area. Therefore, for purposes of this study,seismogenic source regions were considered as both individual and multiple faults.
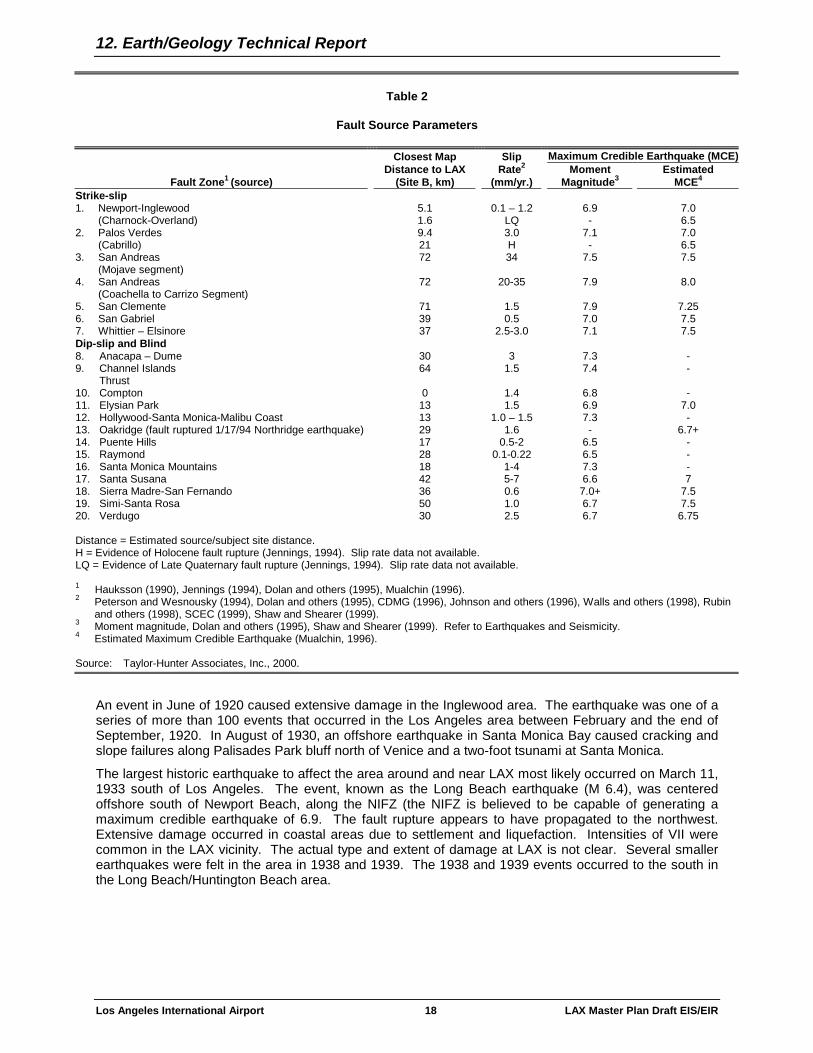
Shown in Table 2, Fault Source Parameters, are the significant seismogenic (capable of rapid strainenergy release resulting in a tectonic earthquake) faults or source zones in the general LAX area. Alsoshown in the table are estimated source/site distances and estimated significant earthquake magnitudesfor each seismogenic source.
The maximum credible earthquake (MCE) is defined in CDMG Note 43 as “the maximum earthquake thatappears capable of occurring under the presently known tectonic framework.” The MCEs presented inTable 2 are moment magnitudes (Mw) obtained from (1) the most recent Fault Parameter Data Tablesavailable on the CDMG Seismic Hazard web page, and (2) recent scientific publications. These estimatesof moment magnitude were based on fault area (i.e., the length and width of the fault) and the definition ofmoment magnitude by Hanks and Kanamori.8
2.2.3 Historic EarthquakesThe Los Angeles Basin has experienced a number of significant earthquakes since the first record of asignificant event in 1769. Table 3, Historic Seismicity of the LAX Vicinity, summarizes the events with amagnitude greater than 5 within a distance of 100 kilometers of LAX. Additional details are providedbelow for some of these earthquakes as they relate to the LAX vicinity. Possibly the first historicearthquake affecting the LAX area was on September 24, 1827. People in Los Angeles reportedly ranoutdoors in panic. Thirty years later in 1857, the Fort Tejon earthquake shook California. Intensities fromthis magnitude (M) 7.5+ earthquake may have reached VI to VII in the LAX vicinity.
8 Hanks, T.C. and Kanomori, H., A moment magnitude scale, Journal of Geophysical Research, Vol. 84, pp. 2348-2350,1979.
12. Earth/Geology Technical Report
Los Angeles International Airport 18 LAX Master Plan Draft EIS/EIR
Table 2
Fault Source Parameters
Maximum Credible Earthquake (MCE)
Fault Zone1 (source)
Closest MapDistance to LAX
(Site B, km)
SlipRate2
(mm/yr.)Moment
Magnitude3Estimated
MCE4
Strike-slip1. Newport-Inglewood 5.1 0.1 – 1.2 6.9 7.0
(Charnock-Overland) 1.6 LQ - 6.52. Palos Verdes 9.4 3.0 7.1 7.0
(Cabrillo) 21 H - 6.53. San Andreas 72 34 7.5 7.5
(Mojave segment)4. San Andreas 72 20-35 7.9 8.0
(Coachella to Carrizo Segment)5. San Clemente 71 1.5 7.9 7.256. San Gabriel 39 0.5 7.0 7.57. Whittier – Elsinore 37 2.5-3.0 7.1 7.5Dip-slip and Blind8. Anacapa – Dume 30 3 7.3 -9. Channel Islands 64 1.5 7.4 -
Thrust10. Compton 0 1.4 6.8 -11. Elysian Park 13 1.5 6.9 7.012. Hollywood-Santa Monica-Malibu Coast 13 1.0 – 1.5 7.3 -13. Oakridge (fault ruptured 1/17/94 Northridge earthquake) 29 1.6 - 6.7+14. Puente Hills 17 0.5-2 6.5 -15. Raymond 28 0.1-0.22 6.5 -16. Santa Monica Mountains 18 1-4 7.3 -17. Santa Susana 42 5-7 6.6 718. Sierra Madre-San Fernando 36 0.6 7.0+ 7.519. Simi-Santa Rosa 50 1.0 6.7 7.520. Verdugo 30 2.5 6.7 6.75
Distance = Estimated source/subject site distance.H = Evidence of Holocene fault rupture (Jennings, 1994). Slip rate data not available.LQ = Evidence of Late Quaternary fault rupture (Jennings, 1994). Slip rate data not available.
1 Hauksson (1990), Jennings (1994), Dolan and others (1995), Mualchin (1996).2 Peterson and Wesnousky (1994), Dolan and others (1995), CDMG (1996), Johnson and others (1996), Walls and others (1998), Rubin
and others (1998), SCEC (1999), Shaw and Shearer (1999).3 Moment magnitude, Dolan and others (1995), Shaw and Shearer (1999). Refer to Earthquakes and Seismicity.4 Estimated Maximum Credible Earthquake (Mualchin, 1996).
Source: Taylor-Hunter Associates, Inc., 2000.
An event in June of 1920 caused extensive damage in the Inglewood area. The earthquake was one of aseries of more than 100 events that occurred in the Los Angeles area between February and the end ofSeptember, 1920. In August of 1930, an offshore earthquake in Santa Monica Bay caused cracking andslope failures along Palisades Park bluff north of Venice and a two-foot tsunami at Santa Monica.
The largest historic earthquake to affect the area around and near LAX most likely occurred on March 11,1933 south of Los Angeles. The event, known as the Long Beach earthquake (M 6.4), was centeredoffshore south of Newport Beach, along the NIFZ (the NIFZ is believed to be capable of generating amaximum credible earthquake of 6.9. The fault rupture appears to have propagated to the northwest.Extensive damage occurred in coastal areas due to settlement and liquefaction. Intensities of VII werecommon in the LAX vicinity. The actual type and extent of damage at LAX is not clear. Several smallerearthquakes were felt in the area in 1938 and 1939. The 1938 and 1939 events occurred to the south inthe Long Beach/Huntington Beach area.

12. Earth/Geology Technical Report
Los Angeles International Airport 19 LAX Master Plan Draft EIS/EIR
Table 3
Historical Seismicity (M>5) of the LAX Vicinity (100 km radius)
Earthquake Date
MomentMagnitude
(Mw)
LocalMagnitude
(M>5) Latitude Longitude
EpicentralDistance
(km)Los Angeles Basin 7/28/1769 - 6.0 34.0 118.0 38Wrightwood 12/8/1812 - 7.0 34.4 117.7 84Los Angeles Region 9/24/1827 - 5.5 34.0 119.0 55Los Angeles Region 7/11/1855 - 6.0 34.1 118.1 33Fort Tejon 1857 7.5San Bernardino Region 12/16/1858 - 6.0 34.0 117.5 84Pico Canyon 5/19/1893 - 5.8 34.1 119.4 94Lytle Creek Region 7/30/1894 - 6.0 34.3 117.6 84Lytle Creek Region 7/22/1899 - 5.8 34.3 117.5 92Glen Ivy Hot Springs 5/15/10 - 5.5 33.7 117.4 97Los Angeles Region 6/20San Bernardino Region 7/23/23 - 6.0 34.0 117.3 102Santa Monica Bay 8/30Long Beach 3/11/33 - 6.3 33.6167 117.9667 54Gardena 1941Redondo/Gardena 6/19/44San Fernando 2/9/71 6.6 - 34.4112 118.4007 52Point Magu 2/21/73 - 5.2 34.0667 119.0333 60Point Magu 1/1/79 - 5.2 33.9433 118.6817 26Santa Barbara Island 9/4/81 - 5.5 33.8094 119.1181 68Whittier Narrows 10/1/87 5.9 - 34.0613 118.0785 33Pasadena 12/3/88 - 5.0 34.1412 118.1327 33Malibu 1/18/89 - 5.0 33.9167 118.6267 21Sierra Madre 6/28/91 5.8 - 34.2590 118.0010 51Northridge 1/17/94 6.7 - 34.2133 118.5370 32
Source: Robert E. Wallace ed., USGS Professional Paper 1515, 1990, and USGS earthquake catalogues.
Another Santa Monica Bay earthquake occurred on October 11, 1940 (M 4.6). Some damage wasreported along the coast at Manhattan Beach and Redondo Beach. Nearly a year later, in late 1941,several earthquakes caused damage in Gardena, south and east of LAX. The largest event was M 5.4.On June 19, 1944, two events caused some damage in Redondo Beach and easterly near Gardena.
With the exception of several minor events, the general region was relatively quiet until the San Fernandoearthquake of February 9, 1971 (M 6.5; Mw 6.6). Local observed intensities at LAX for this earthquakewere on the order of VI. Another offshore earthquake occurred on September 4, 1981. The 1981 M 5.5event induced relatively minor damage at Marina del Rey. No damage to LAX was reported following theOctober 1, 1987 Whittier earthquake (Mw 5.9). Local observed intensities at LAX for this earthquake wereapproximately V to VI. Another earthquake (M 5.0) in the Malibu area occurred on January 19, 1989. Theevent caused minor damage in the Malibu area. Significant damage at LAX was not reported for any ofthe 1971 through 1989 earthquakes.
The most recent earthquake to cause damage in the vicinity of LAX was the January 17, 1994 Northridgeearthquake (Mw 6.7). Strong shaking, recorded on accelerographs through the Los Angeles Basin, mayhave reached 0.15 to 0.2 times the acceleration of gravity in the LAX vicinity. Liquefaction was observedalong coast beach and harbor areas, to the north and south of LAX. Regional MMIs were on the order ofVI to VII. Several slope failures occurred to the north along coastal bluffs in Santa Monica and PacificPalisades. The City of Santa Monica suffered substantial damage. There was no major damage at LAX.
2.3 HydrogeologyLAX is situated within the West Coast Groundwater Basin. The West Coast Groundwater Basin iscontained by the Ballona Escarpment to the north, the NIFZ to the east, the Palos Verdes Hills to thesouth, and the Pacific Ocean to the west. Groundwater flow in the West Coast Groundwater Basin iscontrolled by hydrologic properties of unconsolidated, permeable Quaternary sediments that are partiallyseparated by less permeable aquitards. Groundwater beneath LAX is not used for drinking water (seeSection 4.23, Hazardous Materials, of the EIS/EIR).

12. Earth/Geology Technical Report
Los Angeles International Airport 20 LAX Master Plan Draft EIS/EIR
Regional groundwater flow in the West Coast Basin is generally in a westerly direction toward the PacificOcean. However, historical dewatering in and around the LAX vicinity has exposed the groundwater tosaltwater encroachment. A seawater intrusion abatement project has been implemented by the LosAngeles County Department of Public Works. The project, deemed successful, created an injection wellbarrier (an elongated groundwater high paralleling the coast) that runs south of LAX. Thus, approximatelywest of Sepulveda Boulevard, groundwater flows westerly; this is considered to be a brackish water area.Approximately east of Sepulveda Boulevard, groundwater flows to the east.
Groundwater occurs in several aquifers within the West Coast Groundwater Basin. Water bearing unitsand aquitards include the localized semiperched aquifer, the upper and lower Bellflower aquitards, and theGage aquifer, respectively. The Gage Aquifer is underlain by the El Segundo Aquiclude and the SilveradoAquifer.
Locally, semiperched groundwater exists in discontinuous, unconfined clay lenses in the LakewoodFormation and Older Dune Sand. In the LAX vicinity, discontinuous perched groundwater is encounteredat depths of approximately 20 to 60 feet. Additional details regarding perched groundwater are presentedin the discussion of liquefaction later in this report.
The upper and lower Bellflower Aquiclude (also known as the Manhattan Beach Aquiclude), correspondsto the upper and lower portions of the Lakewood Formation, and houses the Gage Aquifer (also known asthe 200 Foot Sand). The Gage Aquifer is unconfined and groundwater observation wells indicate thataverage water levels are at 100 to 110 feet below ground surface and that the general flow direction istoward the southeast.
The El Segundo Aquiclude underlies the Gage Aquifer and is estimated to be 40 to 100 feet thick. Itcontains the Silverado Aquifer, which occurs throughout coastal portions of the Los Angeles Basin, and isthe most productive aquifer in the basin. Located within the San Pedro Formation, the Silverado Aquiferranges from 100 to 500 feet thick. In the LAX vicinity, west of the Gardena syncline, the El SegundoAquitard is discontinuous allowing the Gage Aquifer to merge with, and become indistinguishable from,the Silverado Aquifer.
2.4 Geologic Hazards2.4.1 Seismic HazardsSeismic hazards are caused by, or associated with, earthquakes (see EIS/EIR Section 4.22,Earth/Geology discussion of Seismic Hazards). These hazards commonly include co-seismic faultsurface rupture and associated regional tectonic deformation (i.e., uplift and subsidence), strong motion orseismic vibratory shaking (ground shaking), liquefaction, slope failures, seismic settlement, seismic seawaves (i.e., tsunami), seiches, and flooding due to dam and/or dike failure. Most of these seismic hazardsare discussed in the Seismic Hazards section of Section 4.22, Earth/Geology, of the EIS/EIR. Additionaldetails on these hazards and their relevance to conditions at LAX are discussed below.
2.4.1.1 Fault Surface Rupture and Co-seismic Ground DeformationFault surface rupture occurs during an earthquake when movement along the fault displaces or causesdeformation at the ground surface. Horizontal and/or vertical surface displacements along faults during aseismic event can range from zero to tens of feet. The Alquist-Priolo Fault Zoning Act was enacted by theState of California in 1972 to mitigate the damage caused by fault rupture during an earthquake. Underthis act, faults throughout the state are evaluated for surface rupture potential, and fault zones areestablished around active faults.9 Although no earthquake fault zones lie within the LAX Master Planboundaries, the NIFZ is regulated by the Act, and lies close to LAX.
Although the site is not located within an existing Alquist-Priolo Earthquake Fault Zone, the CharnockFault may be located near or through portions of the site (see Figure 2) as discussed in Section 2.2.1,Faults. Review of available geologic literature indicates the Charnock Fault has displaced Quaternary toLate Quaternary units; however, no offset of Holocene units has been reported. The potential for surfacerupture associated with the Charnock Fault is considered low. Nevertheless, the existing data cannot
9 Hart, E., et al., Fault-Rupture Hazard zones in California, Alquist – Priolo Earthquake Fault Zoning Act with Index to Earthquake
Fault Zone Maps, (Pub. 49), 1997.
12. Earth/Geology Technical Report
Los Angeles International Airport 21 LAX Master Plan Draft EIS/EIR
preclude surface rupture of the Charnock Fault at LAX during the life of the facility either independently orin conjunction with movement along the NIFZ or other yet unidentified fault(s).
The Charnock Fault may extend beneath LAX in the vicinity of the east end of Runways 25 R,L. Itappears theoretically capable of rupturing in a Mw~6.5 event, corresponding with 0.7 m of horizontal and0.5 m of vertical displacement at depth (see Section 3, Methodology). Some surface rupture would beanticipated in such an event where the Holocene overburden measures less than about 12.5 m (41 feet) inthickness. Where the primary rupture extends to within 5 m (16 feet) of the surface, the resultant surfacerupture pattern would consist of a 1.2 m (4 feet) wide fault zone, across which about 0.7 m of horizontaland 0.25 m of vertical offset (down to the east) may be anticipated. Where the overburden thickness isgreater than 5 m (but less than 12.5 m), the fault zone would likely be wider, but the overall offsets lowerthan those indicated above. Sympathetic (triggered) slip due to earthquakes on nearby faults may occurat depth along the Charnock Fault, but would appear unlikely to result in surface rupture along the faulttrace.
The potential impacts of such a rupture include moderate to severe damage to the runway or otherstructures at LAX. FAA regulations stipulate that any three-inch or larger hole in a runway necessitatesshutdown of airport operations.
Localized folding and distributed ground fracturing associated with active faulting (known as co-seismicground deformation) are common in active seismogenic regions such as Southern California. Thesetypes of geologic structures are often characterized at the surface as active fold scarps or monoclinalwarps. The California Seismic Safety Commission recommended to the Governor in their recent reportentitled Turning Loss to Gain that the CDMG, as part of its Seismic Hazards Mapping Program, “…expandthe categories of seismic hazards to create a new hazard zone to address ground deformation associatedwith folding and fracturing.”
These types of geologic structures can present considerable risks to structures intended for humanoccupancy. Ground deformation of this type is not considered significant unless it results in substantialelevation changes, shortening, or ground displacement (i.e., fracturing). It is difficult to accurately predictthe locations of future co-seismic ground deformation. Potentially significant co-seismic grounddeformation during the typical 50-year design life of a new facility in the LAX vicinity cannot be precludedbased on the available data. However, the potential for damage to the LAX area from such an event isprobably similar to that of other areas of the Los Angeles Basin located within similar proximity to the NIFZor other active faults.
2.4.1.2 Ground ShakingThe proximity of LAX to large, active faults suggests that strong ground shaking could occur at the siteduring the design life of the airport. Two measures are typically used to evaluate the severity of groundshaking: local site intensity and instrumental recordings of ground movement. Both of these measuresare dependent on the magnitude of the earthquake, and distance from the causative fault. The groundshaking would tend to be greater as the magnitude increases and the distance from the fault decreases.
Local site intensity, recorded in the U.S. using the MMI scale, is a subjective measure based on humanperception and observed response of civil facilities. Descriptions of observations and damage associatedwith these intensities are provided in Table 1. Most of the Los Angeles Basin could potentially besubjected to a local MMI intensity of IX.
CDMG has produced several documents related directly to planning for postulated ground shakingintensity, including one that directly covers LAX entitled Planning Scenario for a Major Earthquake on theNewport-Inglewood Fault Zone. This document hypothesizes a particular earthquake on the NIFZ, andprojects associated hypothetical ground shaking and ground failure. CDMG has indicated that local siteintensities of VIII to IX could be experienced at LAX should a magnitude 7 earthquake occur on the NIFZ.Based on those hypothetical assumptions, certain facilities would be damaged, including LAX.
Instrumental recordings of ground motion, primarily ground acceleration, measure ground shaking in thehorizontal and vertical directions with time. Instrumental recordings are the basis for structural design ofbuildings per the Uniform Building Code (UBC). The Los Angeles Basin and LAX are in seismic zone 4(highest) per the UBC, indicating that the highest seismic acceleration forces be used in the design ofstructures.
The expected level of instrumental ground shaking at a location is typically estimated either for (1) a givenearthquake scenario (deterministic method), or (2) a given likelihood of occurring (probabilistic method).

12. Earth/Geology Technical Report
Los Angeles International Airport 22 LAX Master Plan Draft EIS/EIR
Both of these methods have different advantages and disadvantages and applicability to different types ofprojects. For the purposes of the EIS/EIR, both results of a probabilistic estimate by the State and adeterministic estimate performed for the EIS/EIR are provided.
The results of nationwide probabilistic analyses of ground shaking performed by the U.S. GeologicalSurvey (USGS) and state-wide probabilistic analyses performed by CDMG indicate that peak horizontalground accelerations corresponding to a 475-year annual return period of between 0.4 and 0.5g areexpected to occur at LAX. This hazard level (475-year annual return period) is generally consistent withUBC design for normal structures.
For purposes of the EIS/EIR, the deterministic method was used to estimate the expected peak level ofground shaking for 24 different earthquake scenarios at three site locations (see Section 3, Methodology,and Tables 6, 7 and 8). Based on this analysis, the peak horizontal and vertical accelerations areestimated to be 0.63 and 0.55g, respectively, resulting from a magnitude 7.3 earthquake on the combinedCompton and Elysian Park faults. A magnitude 6.9 earthquake on the NIFZ is expected to produce peakhorizontal and vertical accelerations of 0.41 and 0.35g, respectively.
Detailed analyses of strong ground shaking close to the faults that occurred during the 1992 Landers,1994 Northridge, and 1995 Hyogo-Ken (Kobe, Japan) earthquakes indicate that ground shaking at higherlevels than previously anticipated can occur in close vicinity of the rupturing fault. These findings haveaffected changes to ground motion design provided in the most recent version of the UBC (1997). Inaddition, analysis of ground motions from these earthquakes suggests that stronger ground shaking canoccur in the direction of rupture propagation. These “rupture directivity” effects are currently being used toevaluate the response of long-period structures, such as tall buildings and long bridges. Given that LAX iswithin 5 km of several active faults, the design-basis ground motions could be developed on a site-specificbasis, including rupture directivity effects, depending on the nature of the individual project. Rupturedirectivity effects would typically include increases in spectral acceleration (a measurement of groundshaking) at periods of one second or greater. The greatest increase to account for these effects wouldtend to occur at periods of four seconds or greater.
The Seismic Hazard Mapping Act of 1990 (also known as the Brown Act) was enacted, in part, to addressseismic hazards not included in the Alquist-Priolo Act, including strong ground shaking. Under this Act,the State Geologist is assigned the responsibility of identifying and mapping seismic hazard zones.Detailed maps showing levels of ground shaking hazards have not been published; however, a statewidemap depicting ground shaking hazard on a regional scale for a certain seismic probability was published in1999. There is currently no schedule for developing more detailed maps of ground shaking hazard in theLAX area.
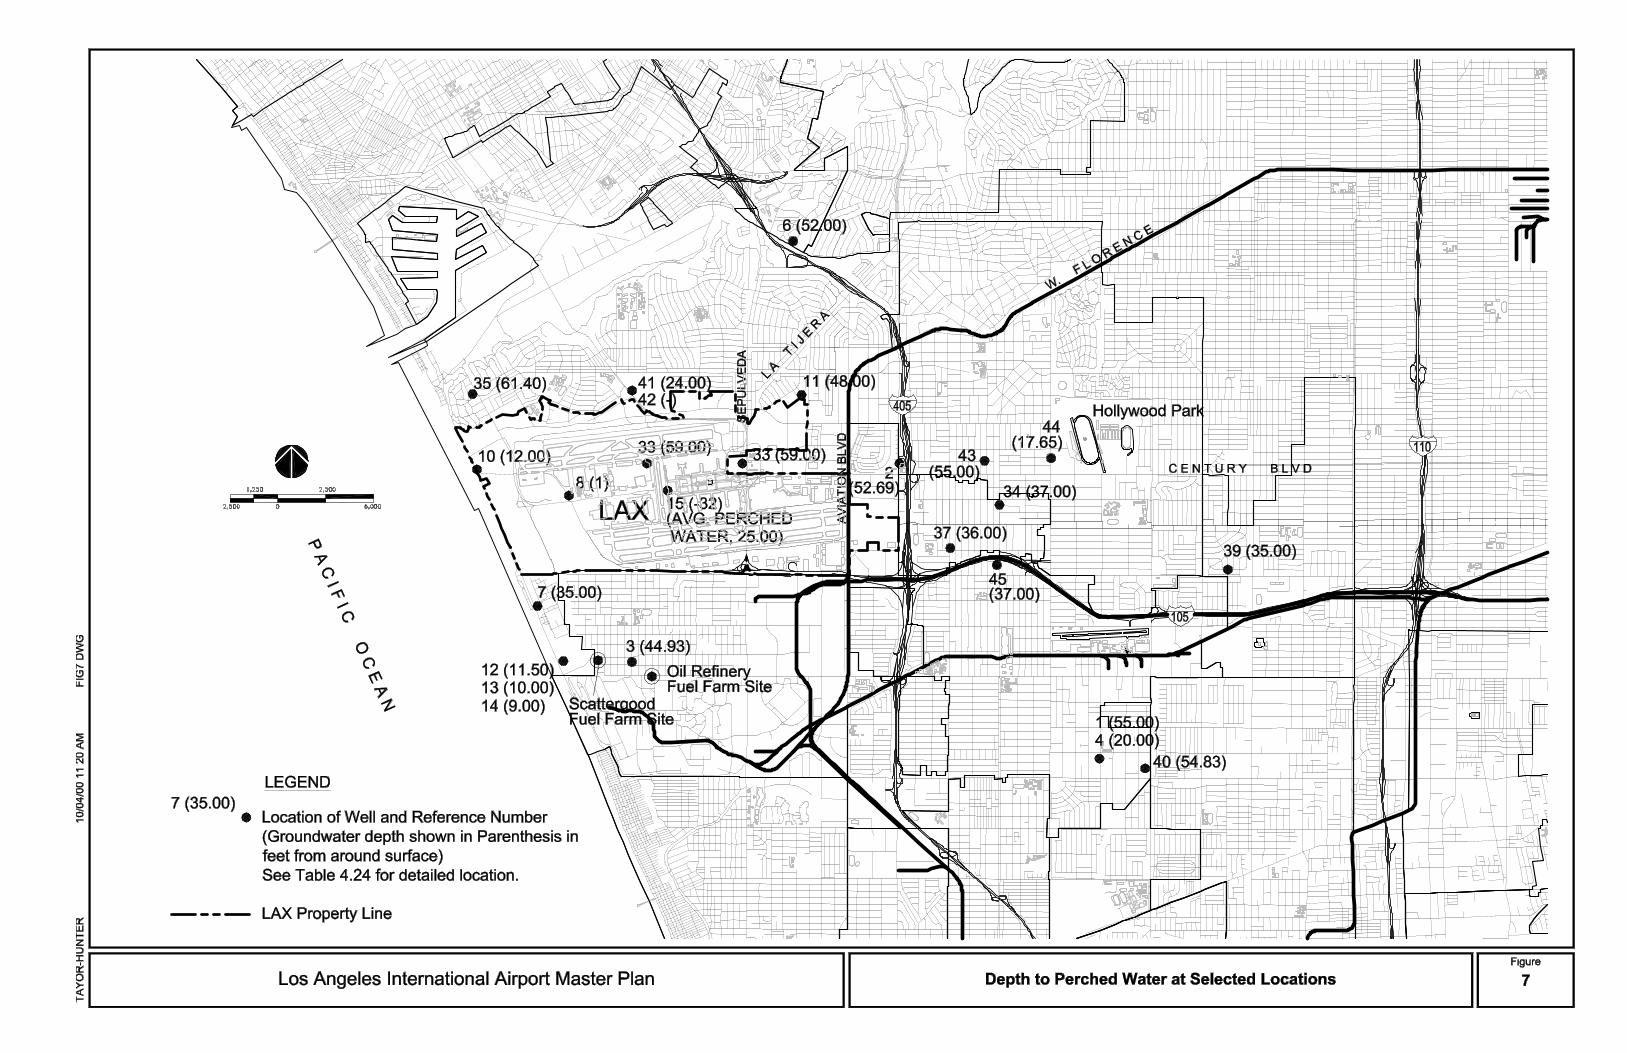
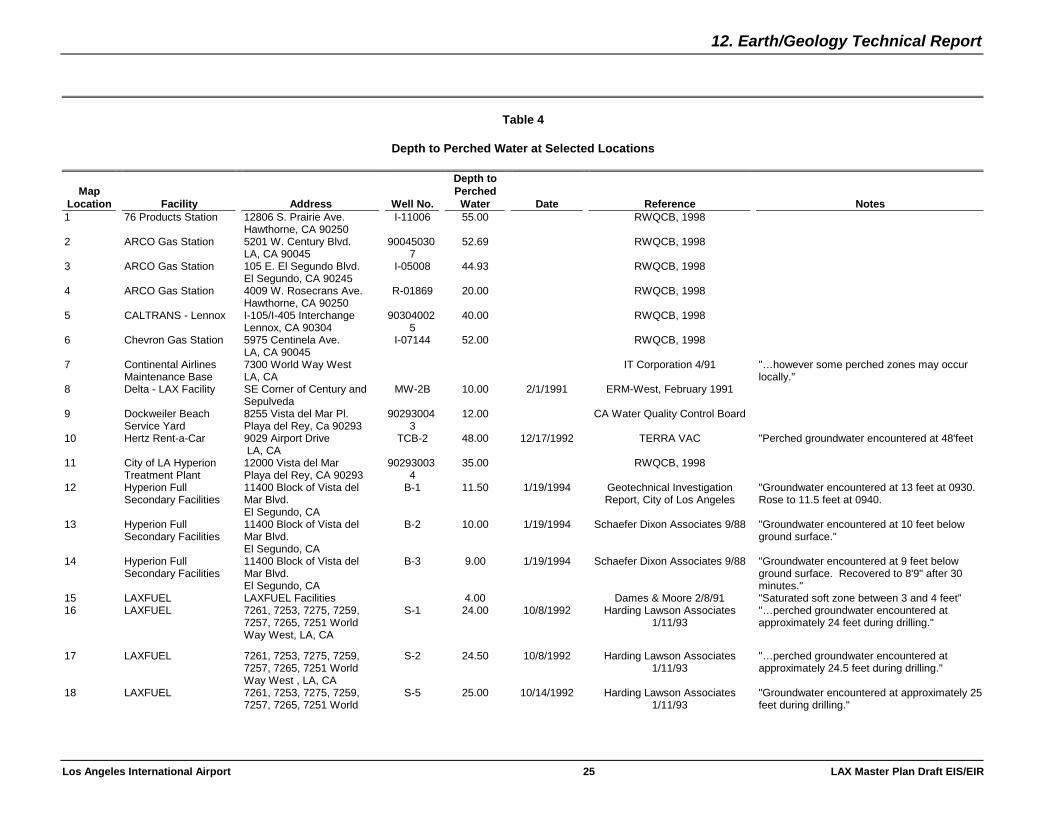
2.4.1.3 LiquefactionLiquefaction is a phenomenon that can occur in saturated granular soil during significant ground shaking.Liquefaction has also been reported in some clayey soils. Liquefaction can result in loss of groundstrength and ground failure. The susceptibility of soil to liquefy tends to decrease as the density of the soilincreases and the level of ground shaking decreases. The density of Quarternary-age sand deposits inthe upper 30 feet is generally considered to be low to dense. Based on numerous studies of liquefaction,soil must be below groundwater level in order to liquefy. The depth to groundwater at LAX is generallygreater than 90 feet, which would indicate that the site has a very low susceptibility to liquefaction.However, perched groundwater conditions have been noted in the upper 60 feet at some locations at LAX.The thickness of saturated sand in perched groundwater layers would need to be on the order of severalfeet for liquefaction to occur. Table 4, Depth to Perched Water at Selected Locations, and Figure 7,Depth to Perched Water of Selected Locations, summarize some of the locations where perched waterhas been observed in the LAX area. The perched water information was collected from variousreferences of investigation in the LAX area (see Section 4, References). A review of these referencesindicates that the presence of perched water varies greatly with area and possibly with time of year;information on the thickness of the saturated layer is typically missing.
12. Earth/Geology Technical Report
Los Angeles International Airport 25 LAX Master Plan Draft EIS/EIR
Table 4
Depth to Perched Water at Selected Locations
MapLocation Facility Address Well No.
Depth toPerched
Water Date Reference Notes1 76 Products Station 12806 S. Prairie Ave.
Hawthorne, CA 90250I-11006 55.00 RWQCB, 1998
2 ARCO Gas Station 5201 W. Century Blvd.LA, CA 90045
900450307
52.69 RWQCB, 1998
3 ARCO Gas Station 105 E. El Segundo Blvd.El Segundo, CA 90245
I-05008 44.93 RWQCB, 1998
4 ARCO Gas Station 4009 W. Rosecrans Ave.Hawthorne, CA 90250
R-01869 20.00 RWQCB, 1998
5 CALTRANS - Lennox I-105/I-405 InterchangeLennox, CA 90304
903040025
40.00 RWQCB, 1998
6 Chevron Gas Station 5975 Centinela Ave.LA, CA 90045
I-07144 52.00 RWQCB, 1998
7 Continental AirlinesMaintenance Base
7300 World Way WestLA, CA
IT Corporation 4/91 "…however some perched zones may occurlocally."
8 Delta - LAX Facility SE Corner of Century andSepulveda
MW-2B 10.00 2/1/1991 ERM-West, February 1991
9 Dockweiler BeachService Yard
8255 Vista del Mar Pl.Playa del Rey, Ca 90293
902930043
12.00 CA Water Quality Control Board
10 Hertz Rent-a-Car 9029 Airport Drive LA, CA
TCB-2 48.00 12/17/1992 TERRA VAC "Perched groundwater encountered at 48'feet
11 City of LA HyperionTreatment Plant
12000 Vista del MarPlaya del Rey, CA 90293
902930034
35.00 RWQCB, 1998
12 Hyperion FullSecondary Facilities
11400 Block of Vista delMar Blvd.El Segundo, CA
B-1 11.50 1/19/1994 Geotechnical InvestigationReport, City of Los Angeles
"Groundwater encountered at 13 feet at 0930.Rose to 11.5 feet at 0940.
13 Hyperion FullSecondary Facilities
11400 Block of Vista delMar Blvd.El Segundo, CA
B-2 10.00 1/19/1994 Schaefer Dixon Associates 9/88 "Groundwater encountered at 10 feet belowground surface."
14 Hyperion FullSecondary Facilities
11400 Block of Vista delMar Blvd.El Segundo, CA
B-3 9.00 1/19/1994 Schaefer Dixon Associates 9/88 "Groundwater encountered at 9 feet belowground surface. Recovered to 8'9" after 30minutes."
15 LAXFUEL LAXFUEL Facilities 4.00 Dames & Moore 2/8/91 "Saturated soft zone between 3 and 4 feet”16 LAXFUEL 7261, 7253, 7275, 7259,
7257, 7265, 7251 WorldWay West, LA, CA
S-1 24.00 10/8/1992 Harding Lawson Associates1/11/93
"…perched groundwater encountered atapproximately 24 feet during drilling."
17 LAXFUEL 7261, 7253, 7275, 7259,7257, 7265, 7251 WorldWay West , LA, CA
S-2 24.50 10/8/1992 Harding Lawson Associates1/11/93
"…perched groundwater encountered atapproximately 24.5 feet during drilling."
18 LAXFUEL 7261, 7253, 7275, 7259,7257, 7265, 7251 World
S-5 25.00 10/14/1992 Harding Lawson Associates1/11/93
"Groundwater encountered at approximately 25feet during drilling."

12. Earth/Geology Technical Report
Los Angeles International Airport 26 LAX Master Plan Draft EIS/EIR
Table 4
Depth to Perched Water at Selected Locations
MapLocation Facility Address Well No.
Depth toPerched
Water Date Reference NotesWay West , LA, CA
19 LAXFUEL 7261, 7253, 7275, 7259,7257, 7265, 7251 WorldWay West , LA, CA
S-6 25.00 11/2/1992 Harding Lawson Associates1/11/93
"…perched groundwater encountered atapproximately 25 feet during drilling."
20 LAXFUEL 7261, 7253, 7275, 7259,7257, 7265, 7251 WorldWay West , LA, CA
S-31 27.50 11/10/1992 Harding Lawson Associates1/11/93
"…perched groundwater encountered atapproximately 27.5 feet during drilling."
21 LAXFUEL 7261, 7253, 7275, 7259,7257, 7265, 7251 WorldWay West , LA, CA
S-36 25.50 11/11/1992 Harding Lawson Associates1/11/93
"…perched groundwater encountered atapproximately 25.5 feet during drilling."
22 LAXFUEL 7261, 7253, 7275, 7259,7257, 7265, 7251 WorldWay West , LA, CA
S-38 25.50 11/11/1992 Harding Lawson Associates1/11/93
"…perched groundwater encountered atapproximately 25.5 feet during drilling."
23 LAXFUEL 7261, 7253, 7275, 7259,7257, 7265, 7251 WorldWay West , LA, CA
S-39 25.00 11/11/1992 Harding Lawson Associates1/11/93
"…perched groundwater encountered atapproximately 25 feet during drilling."
24 LAXFUEL 7261, 7253, 7275, 7259,7257, 7265, 7251 WorldWay West , LA, CA
S-40 24.50 11/12/1992 Harding Lawson Associates1/11/93
"…perched groundwater encountered atapproximately 24.5 feet during drilling."
25 LAXFUEL 7261, 7253, 7275, 7259,7257, 7265, 7251 WorldWay West , LA, CA
S-42 25.50 11/12/1992 Harding Lawson Associates1/11/93
"…perched groundwater encountered atapproximately 25.5 feet during drilling."
26 LAXFUEL 7261, 7253, 7275, 7259,7257, 7265, 7251 WorldWay West , LA, CA
S-43 28.00 11/13/1992 Harding Lawson Associates1/11/93
"Groundwater encountered at approximately 28feet during drilling."
27 LAXFUEL 7261, 7253, 7275, 7259,7257, 7265, 7251 WorldWay West , LA, CA
S-46 23.50 11/12/1992 Harding Lawson Associates1/11/93
"perched groundwater encountered atapproximately 23.5 feet during drilling."
28 LAXFUEL 7261, 7253, 7275, 7259,7257, 7265, 7251 WorldWay West, LA, CA
S-47 28.00 11/12/1992 Harding Lawson Associates1/11/93
"Groundwater encountered at approximately 28feet during drilling."
29 LAXFUEL 7261, 7253, 7275, 7259,7257, 7265, 7251 WorldWay West , LA, CA
S-55 26.00 11/16/1992 Harding Lawson Associates1/11/93
"Groundwater encountered at approximately 26feet during drilling."
30 LAXFUEL 6900, 6940, 6949, and 6950World Way West , LA, CA
BIII-10 41.50 6/24/1993 Harding Lawson Associates6/25/94
31 LAXFUEL 6900, 6940, 6949, and 6950World Way West , LA, CA
BIII-11 41.00 6/22/1993 Harding Lawson Associates6/25/94
32 LAXFUEL 6900, 6940, 6949, and 6950World Way West , LA, CA
MW-43 40.00 6/23/1993 Harding Lawson Associates6/25/94
33 LAX Second Level Adjacent to Los Angeles 59.00 10/1/1979 Moore & Taber Consulting "Water seepage was encountered near
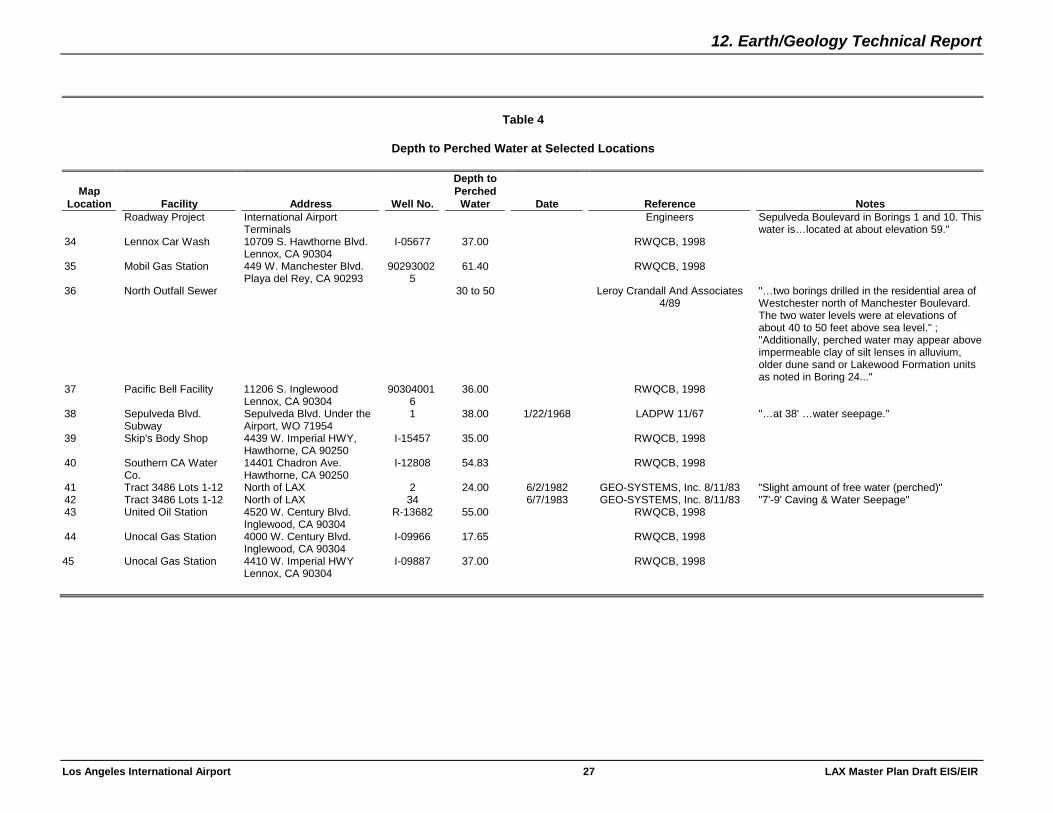
12. Earth/Geology Technical Report
Los Angeles International Airport 27 LAX Master Plan Draft EIS/EIR
Table 4
Depth to Perched Water at Selected Locations
MapLocation Facility Address Well No.
Depth toPerched
Water Date Reference NotesRoadway Project International Airport
TerminalsEngineers Sepulveda Boulevard in Borings 1 and 10. This
water is…located at about elevation 59."34 Lennox Car Wash 10709 S. Hawthorne Blvd.
Lennox, CA 90304I-05677 37.00 RWQCB, 1998
35 Mobil Gas Station 449 W. Manchester Blvd.Playa del Rey, CA 90293
902930025
61.40 RWQCB, 1998
36 North Outfall Sewer 30 to 50 Leroy Crandall And Associates4/89
"…two borings drilled in the residential area ofWestchester north of Manchester Boulevard.The two water levels were at elevations ofabout 40 to 50 feet above sea level." ;"Additionally, perched water may appear aboveimpermeable clay of silt lenses in alluvium,older dune sand or Lakewood Formation unitsas noted in Boring 24..."
37 Pacific Bell Facility 11206 S. InglewoodLennox, CA 90304
903040016
36.00 RWQCB, 1998
38 Sepulveda Blvd.Subway
Sepulveda Blvd. Under theAirport, WO 71954
1 38.00 1/22/1968 LADPW 11/67 "…at 38' …water seepage."
39 Skip's Body Shop 4439 W. Imperial HWY,Hawthorne, CA 90250
I-15457 35.00 RWQCB, 1998
40 Southern CA WaterCo.
14401 Chadron Ave.Hawthorne, CA 90250
I-12808 54.83 RWQCB, 1998
41 Tract 3486 Lots 1-12 North of LAX 2 24.00 6/2/1982 GEO-SYSTEMS, Inc. 8/11/83 "Slight amount of free water (perched)"42 Tract 3486 Lots 1-12 North of LAX 34 6/7/1983 GEO-SYSTEMS, Inc. 8/11/83 "7'-9' Caving & Water Seepage"43 United Oil Station 4520 W. Century Blvd.
Inglewood, CA 90304R-13682 55.00 RWQCB, 1998
44 Unocal Gas Station 4000 W. Century Blvd.Inglewood, CA 90304
I-09966 17.65 RWQCB, 1998
45 Unocal Gas Station 4410 W. Imperial HWYLennox, CA 90304
I-09887 37.00 RWQCB, 1998

12. Earth/Geology Technical Report
Los Angeles International Airport 28 LAX Master Plan Draft EIS/EIR
As indicated above, the Seismic Hazard Mapping Act of 1990 was enacted, in part, to address seismichazards not included in the Alquist-Priolo Act, including liquefaction and other ground failures induced byseismic activity. Currently, the CDMG has begun mapping the seismic hazard zones associated with theLAX area, and preliminary seismic hazard maps identifying areas potentially subject to liquefaction wererecently published for the area within the Master Plan boundaries. This map indicates that the LAX area,including the Scattergood and oil refinery fuel farm sites, and LAX Expressway, are not zoned by the statefor liquefaction hazard potential. However, for the purposes of the Draft EIS/EIR, it is concluded thatliquefaction could potentially occur in very localized areas of Quarternary-age sands saturated by perchedwater (see Section 3, Methodology). Therefore, generally low susceptibility to liquefaction may be presentin the LAX area, including the Scattergood Fuel Farm site, the oil refinery site, and the LAX Expresswayalignments.
2.4.1.4 Seismic Slope StabilitySlope failure occurs when the driving force induced by the weight of the earth materials within the slopeexceed the shear strength of those materials. During seismic shaking, the ground surface is subjected toaccelerations which can cause an increase in the apparent weight and driving force of earth materials, anda slope which was stable under static gravity loads can fail. Review of historic seismicity and closeproximity of the area to significant fault zones clearly indicates that the LAX area is subject to future strongseismic ground motion. Slopes that could be subject to seismic instability are located in the LAX vicinity tothe west of Pershing Drive, and at the Scattergood and oil refinery fuel farm sites.
As with liquefaction under the Seismic Hazard Mapping Act of 1990, the CDMG has begun mapping theseismic hazard zones associated with the LAX area, and preliminary seismic hazard maps identifyingareas potentially subject to earthquake induced landslides were recently published for the LAX area. Thepreliminary maps indicate the presence of potentially unstable slopes near the west end of LAX. Becausethese slopes are typically in Quarternary dune sand deposits, the risk of large scale and deep seatedfailure is probably low. Other slopes at LAX are generally flat (typically less than 30 percent) and low inrelief (typically less than 15 feet). The potential for seismic slope instability associated with these slopes isalso considered to be low.
2.4.1.5 Seismic SettlementStrong ground shaking can densify loose to medium dense deposits of partially saturated granular soilsand could result in seismic settlement of foundations and the ground surface at LAX. Due to variations inmaterial type, seismic settlements would tend to vary considerably across LAX, but are generallyestimated to be between negligible and ½ inch (see Section 3, Methodology). Such settlement couldaffect some facilities, such as utility connections, but typically would not cause severe damage tostructures; therefore, the overall potential for damaging seismically-induced settlements is considered tobe low.
2.4.1.6 Tsunami, Seiche, and FloodingTsunamis are among the most potentially destructive natural phenomena to threaten coastal areas inCalifornia. Tsunamis are generated by seismic shaking of the sea floor, submarine landslides, rock fallsinto bays, and exploding volcanic islands. These events displace sea water and impulsively generatewave trains. Of greatest concern in Southern California is the potential for local fault-generated tsunamis.
A tsunamis’ size and intensity relates to: the magnitude and depth of the reasonable earthquake; volume,shape and magnitude of any sea floor displacement; and, water depth or the amount of water displaced.Thus, most historically significant tsunamis are generated by seismic thrusting events which occur atoceanic trenches. Strike slip earthquake events historically have not caused great tsunamis.
In Southern California, plate movement is accommodated mainly by strike slip faults; thus, locallygenerated tsunamis pose little danger. Trans-oceanic tsunamis also have negligible effects in SouthernCalifornia. Van Dorn attributes low tsunamis heights in Southern California with the complex basin-ridgebathymetry of the wide Southern California borderland terrace.10 Essentially, tsunami wave amplitude isdiminished by Southern California’s complex submerged topography.
10 Van Dorn, “Instrumentation and Observations,” Tsunamis Proceedings of the National Science Foundation Workshop, 1979.
12. Earth/Geology Technical Report
Los Angeles International Airport 29 LAX Master Plan Draft EIS/EIR
Houston combined historical data and numerical modeling to predict 100- and 500-year tsunami heights.11
For the LAX area, predicted 100- and 500-year tsunami heights are 4.2 and 6.0 feet, respectively. Inreference to the predicted tsunami height values, it should be noted that (1) the historic tsunami recordmay not be long enough to allow meaningful extrapolation to future events; (2) the predicted heights arenot the maximum creditable heights; and (3) the 100- and 500-year intervals do not specify a time period,rather they represent a probability over time. Due to the elevation of LAX (100 feet above sea level), thereis no risk of tsunamis directly affecting LAX, the potential fuel farm sites, or the LAX Expresswayalignment.
Seiches are oscillations and waves generated in an enclosed body of water by seismic shaking. Becausethere are no closed bodies of water at LAX, seiches are not a hazard at LAX. No dams or dikes arelocated within the LAX vicinity; therefore, flooding due to a dam or dike failure during an earthquake is notconsidered a potential hazard at LAX.
2.4.2 Volcanic HazardsNo volcanoes or volcanic activity have been identified in the vicinity of LAX.
2.4.3 SettlementSettlement of foundation soils beneath engineered structures or fills typically results from the consolidationand/or compaction of the foundation soils in response to the increased load induced by the structure or fill.Some settlement occurs beneath most engineered structures and is typically accounted for in thefoundation design, or mitigated prior to construction. Problems can occur when settlement is greater thanwas anticipated during design, particularly if the settlement is greater beneath one part of the structurethan the rest (known as differential settlement). Settlement is generally of greater concern in silty andclayey soils because of the relatively larger settlements and longer periods over which settlement occurs.Sandy soils tend to settle relatively less and more quickly upon application of initial load.
Settlement or collapse can also occur due to tunneling or excavation activities where large quantities ofearth material are removed. This removal can result in a redistribution of earth stresses and subsequentvertical and lateral movement of the material surrounding the tunnel or excavation. Water pressure canalso cause surrounding earth material to “flow” into an excavation or tunnel when such excavations arebelow a groundwater table. If not properly prevented or accounted for, such earth movements can resultin damage to existing structures located in the vicinity of the excavation or tunnel.
The amount of settlement required to cause damage varies with the type of structure. Typically, when theratio of differential settlement/distance is greater than 0.001 there is potential for damage. This ratio isapproximately equivalent to one inch of differential settlement over a distance of 30 feet. Based on areview of the geotechnical investigations performed in the vicinity of LAX and the off-site fuel farm sites(see Section 4, References), excessive or problematic settlement of geologic materials has not typicallybeen a concern. Generally, the major portion of settlement for typical structures is limited to a relativelyrapid recompression of the typically sandy soils.
2.4.4 Oil Field Subsidence/Oil Field GasThe removal of oil, gas, and other fluids from oil field reservoir materials can create voids that cancollapse and may result in eventual ground surface subsidence. Ground surface subsidence can result indifferential settlement and cause damage to engineered structures. Subsidence has been documented inseveral oil fields in the vicinity of LAX, including the Inglewood and Playa del Rey fields, which are locatedto the north and northeast of LAX. The Inglewood Oil Field may be experiencing subsidence at a rate of0.2 feet per year. However, LAX is not located within the subsidence bowl, the center of which is locatedabout seven miles to the north, near the corner of La Cienega Boulevard and Stocker Street.
The El Segundo and Hyperion Oil Fields lie beneath and to the south of LAX. Subsidence has not beenrecognized in the El Segundo Oil Field or in the Hyperion Oil Field.
Oil field gas (methane, hydrogen sulfide) can migrate from oil field reservoirs upward through earthmaterials or as a result of disposal of oil field by-products in the near-surface soils. If gas migratestowards, or is released near, the surface, it can accumulate in shallow earth materials, construction
11 Houston, J.L., Type 19 Flood Insurance Study: Tsunami Predictions for Southern California: US Army Corps of Engineers
Waterways Experiment Station (Technical Report HL-79-2), 1980.
12. Earth/Geology Technical Report
Los Angeles International Airport 30 LAX Master Plan Draft EIS/EIR
related depressions, and engineered structures. Such accumulations of gas can lead to exposure ofworkers, fires, or explosions. Oil field gas seepage has not been reported in the LAX area; however, dueto the presence of the Hyperion Oil Field, the potential for the presence of oil field gas seepage may exist,particularly for deeper subterranean structures.
2.4.5 Subsidence Due to Groundwater WithdrawalThe removal of groundwater from subsurface aquifers can cause the collapse of voids in aquifer materialsand lead to ground surface subsidence which can, in turn, cause damage to engineered structures.Although groundwater is pumped from, as well as injected into, the West Coast Basin aquifers that liebeneath the LAX vicinity, the withdrawals are apparently in general balance with influx and no groundwaterwithdrawal-related subsidence has been reported in the geotechnical investigations reviewed for the LAXarea.
3. METHODOLOGYThe general assumptions and methods listed below were used to identify and evaluate earth-relatedconditions and potential impacts associated with the No Action/No Project Alternative and the three buildalternatives.
♦ Soil and bedrock materials described in the referenced documents reviewed for the LAX vicinity aretypical of the conditions at the sites of proposed LAX Master Plan facilities.
♦ Groundwater conditions described in referenced documents for the LAX vicinity are accurate andrepresentative of the conditions at the sites of proposed Master Plan facilities.
♦ Land use planning for mitigation of seismic hazards has not been considered for the purposes of theEIS/EIR, in accordance with the general approach of the Safety Element of the City of Los Angeles.
♦ Construction phasing and sequencing plans for the various major earthwork projects would becoordinated to minimize the need for imported fill material. The general approaches listed below wereused to identify and evaluate earth-related conditions and impacts. Details regarding the specificmethodology follow, where appropriate.
♦ Identification of Geologic and Geotechnical Conditions and Potential Hazards - Reports of geological,geotechnical and environmental investigations and conditions from the files of LAWA, CaliforniaDepartment of Conservation, Division of Oil, Gas, and Geothermal Resources (DOGGR), CDMG,USGS, and others were reviewed to assess the general nature of earth materials and geologicenvironment and potential hazards within the LAX Master Plan area. Guidelines published by CDMGwere followed to identify existing conditions and potential impacts associated with the LAX MasterPlan.
♦ Construction - Individual LAX Master Plan project components were assessed in accordance withCDMG guidelines for potential geological and geotechnically related impacts caused by constructionactivities (e.g., slope stability, grading, erosion, settlement, etc.).
♦ Oil fields – Using data from DOGGR, oil fields located in the vicinity of LAX Master Plan areas wereidentified. LAX Master Plan project components located over oil fields were identified.
♦ Evaluation of Seismic Ground Shaking – Using fault location and characteristic data summarized byCDMG, The Earthquake Engineering Research Institute, USGS, and attenuation relationshipsdeveloped by various researchers, fault source and general ground response parameters wereestimated for three widely distributed locations across LAX. Additional details of this evaluation areprovided below.
♦ Liquefaction and Seismically Induced Settlement Potential - Using data from historic topographicsurveys and air photos, data from recent work by CDMG under the seismic hazards mapping programand data from consultants’ investigation reports, the potential for liquefaction and seismically inducedsettlement was evaluated for a specific location using procedures described by Seed et al.12
Additional details of these evaluations are provided below.
12 Seed, H.B., et al., “Influence of SPT Procedures in Soil Liquefaction Resistance Evaluations,” Journal Geotechnical
Engineering Division, ASCE, December 1985.
12. Earth/Geology Technical Report
Los Angeles International Airport 31 LAX Master Plan Draft EIS/EIR
♦ Evaluation of the Potential for Fault Surface Rupture – Using data from historic topographic surveysand air photos, data from recent work by CDMG under the seismic hazards mapping program andconsultants’ investigation reports, the potential for fault surface rupture was assessed and potentialareas subject to potential fault surface rupture were identified on Figure 2, and Figure 5. Additionaldetails of the air photo interpretation used in this evaluation are provided below.
The following describes the analyses conducted to determine the potential presence ofgeologic/geotechnical hazards and conditions within the Master Plan boundaries. Table 5, Matrix ofPotential Earth/Geologic Considerations for Major Master Plan Facilities, summarizes the majorcomponents considered as part of the various project alternatives and the associated geological andgeotechnical considerations and/or impacts.
3.1 Fault Surface Rupture Potential – Estimate ofMagnitude of Displacement
As discussed above, a low potential exists for surface rupture along the Charnock Fault in the vicinity ofthe eastern end of LAX either independently or sympathetically in response to movement on other faults.In the following discussion, the theoretical magnitude of a primary displacement of the Charnock Fault isoutlined. More likely, but less potentially damaging, would be sympathetic (triggered) rupture of the fault inresponse to an earthquake on the Newport-Inglewood or other local seismic source faults. The likelymaximum magnitude of the offset would be a few centimeters along the existing fault trace. The faulttrace does not extend to the ground surface, however, and the small magnitude of the triggered offset isunlikely to propagate upwards any great distance through the overlying, unfaulted. Recent deposits (seediscussion below). Hence, triggered offset on the Charnock Fault is not anticipated to result in notablesurface effects.
3.1.1 Surface Rupture due to Vertical DisplacementWehmiller and others13 report an absolute age of 0.7 to 1.8 million years for the lower Pleistocene epoch,and Ponti and Lajoie14 report a minimum age of about 800,000 years for the top of the San PedroFormation. If deposition of the San Pedro Formation commenced about 1 million years ago and wascorrelative with displacement on the Charnock Fault, the vertical offset rate on the fault would beapproximately 0.04 mm per year (42.7 m/1,000,000 years). If it is assumed that the latest movement onthe fault occurred immediately prior to Holocene time and that the fault is still active at the calculated long-term rate, rupture of the fault could result in as much as ~0.5 m of vertical offset at depth. Because thefault is not exposed at the surface in the LAX area, any rupture at depth would have to propagate throughrecent sedimentary deposits to evidence surface rupture.
Experimental studies by Cole and Lade15 indicate that a normal fault that ruptures in bedrock beneath apoorly consolidated granular overburden must exhibit a vertical displacement equal to at least 4 percent ofthe total height of the overburden to enable the rupture to propagate to the surface. For the estimatedvertical displacement described above (0.5 m), the vertical component of the rupture would not beanticipated to propagate to the surface through more than about 12.5 m (41 feet) of unconsolidatedoverburden.
3.1.2 Surface Rupture due to Strike-Slip DisplacementThe horizontal slip rate on the Charnock Fault has not been determined. However, it is likely to beconsiderably less than the slip rate on the nearby NIFZ, which exhibits notable surficial geomorphicexpression (compared with the complete lack of surface expression of the Charnock Fault). In aninvestigation of a graben located on a right stepover of the NIFZ, Grant et al.16 reported an apparent 13 Wehmiller, J.F., et al., “Correlation and Chronology of the Pacific Coast Marine Terrace Deposits of the Continental United
States by Fossil Amino Acid Stereochemistry – Technique Evaluation, Relative Age,” Kinetic Model Ages and GeologicImplications (USGS 77-680), 1977.
14 Ponti, D.J. and K.R. Lajoie, “Chronostratigraphic Implications for Techtonic Deformation of Palos Verdes and Signal Hills, LosAngeles Basin, California,” The Regressive Pleistocene Shoreline, Coastal Southern California: South Coast GeologicalSociety, 1992.
15 Cole, D.A. and P.V. Lade, “Influence Zones in Alluvium over Dip-Slip Faults,” Journal of Geotechnical Engineering, 1984.16 Grant, L.B., et al., “Paleoseismicity of the North Branch of the Newport-Inglewood Fault Zone in Huntington Beach, California,
from Cone Penetration Test Data,” Seismological Society of America Bulletin, 1997.

12. Earth/Geology Technical Report
Los Angeles International Airport 32 LAX Master Plan Draft EIS/EIR
vertical separation of 0.22 to 0.36 mm/yr across the fault splay. The minimum horizontal slip rate of thefault in the same vicinity was estimated at 0.34 to 0.55 mm/yr. If a similar geometric relationship holds forthe Charnock Fault, a horizontal slip rate of about 0.06 mm/yr may be reasonable for the fault.
If, as before, the latest movement on the fault is assumed to have occurred immediately prior to Holocenetime and that the fault is still active at the calculated long-term rate, rupture of the fault could result in asmuch as ~0.7 m of horizontal offset at depth. Combined with the vertical component, overall throw of thefault would then measure about 0.86 m. Assuming a 15 km long rupture length and a 15 km deepseismogenic source region yields a Mw~6.4 for such an event17, 18 a value consistent with the 6-1/2maximum credible earthquake on the fault assigned by Mualchin.19
Rupture attenuation estimates in alluvium, such as those described by Cole and Lade20 (1984), have notbeen obtained for strike-slip ruptures. However, Emmons21 reported the results of sand box experimentsin which strike-slip offset was shown to produce a zone of faulting centered over a basal rupture. Theoffset on the principal rupture was always observed to become distributed across numerous minor faultswith a distributed rupture displacement in the overlying zone. Although the minimum offset required toestablish a rupture extending to the surface was not reported for these experiments, multiple rupturesurfaces were shown extending to the surface after 2 inches of translational movement in a 14-inch deepshear box (i.e., offset corresponding to 14 percent of the total depth). Horizontal offset of 0.7 m shouldtherefore be anticipated to propagate through a minimum of 5 m (16 feet) of unconsolidated overburden.In the absence of other information, the 12.5 m estimate reported above for vertical displacements shouldbe used as a minimum depth of unconsolidated overburden through which a primary rupture on theCharnock Fault could propagate.
Due to the expected rapid upward branching of the primary fault offset into numerous splays, thetranslational offset on any individual rupture surface at the surface should be expected to diminish withincreasing depth of overburden, although currently there is no way to quantify this effect. A correspondingwidening of the fault zone should also be anticipated where the fault is propagating throughunconsolidated overburden deposits. Again using the model results of Emmons,22 a 3-1/2 inch wide faultzone was observed to form at the surface of the 14-inch deep shear box after 2 inches of translationaldisplacement. Scaled to the field model, this would correspond to a 1.2 m (4 feet) wide zone of faultdisruption in the case of propagation through 5 m of overburden.
3.1.3 Summary and ConclusionsThe Charnock Fault is considered to be potentially active. However, the likelihood of surface ruptureoccurring on the Charnock Fault, either independently or in conjunction with movement on the NIFZ orother faults, is considered to be low. It appears theoretically capable of rupturing in a Mw~6-1/2 event,corresponding with 0.7 m of horizontal and 0.5 m of vertical displacement at depth. The actual amount ofsurface displacement caused by the rupture at depth is difficult to estimate given the relativelyunconsolidated nature of the near surface soil, but would typically be some fraction of the rupturedisplacement at depth. Some surface rupture would be anticipated in such an event where the Holoceneoverburden measures less than about 12.5 m (40 feet) in thickness. Where the primary rupture extendsto within 5 m (16 feet) of the surface, the resultant surface rupture pattern would consist of a 1.2 m (4 feet)wide fault zone, across which about 0.7 m of horizontal and 0.25 m of vertical offset (down to the east)may be anticipated. Where the overburden thickness is greater than 5 m (but less than 12.5 m), the fault
17 Wells, D.L. and K.J. Coppersmith, “New Empirical Relationships Among Magnitude, Rupture Length, Rupture Area, and
Surface Displacement,” Seismological Society of America Bulletin, 1994.18 Dolan, J.F., et al., “Prospects for Larger or More Frequent Earthquakes in the Los Angeles Metropolitan Region,” Science,
1995.19 Mualchin, L., Caltrans California Seismic Hazard Map, California Department of Transportation, 1996.20 Cole, D.A. and P.V. Lade, “Influence Zones in Alluvium over Dip-Slip Faults,” Journal of Geotechnical Engineering, 1984.21 Emmons, R.C., “Strike-Slip Rupture Patterns in Sand Model,” Tectonophysics, 1969.22 Emmons, R.C., “Strike-Slip Rupture Patterns in Sand Model,” Tectonophysics, 1969.
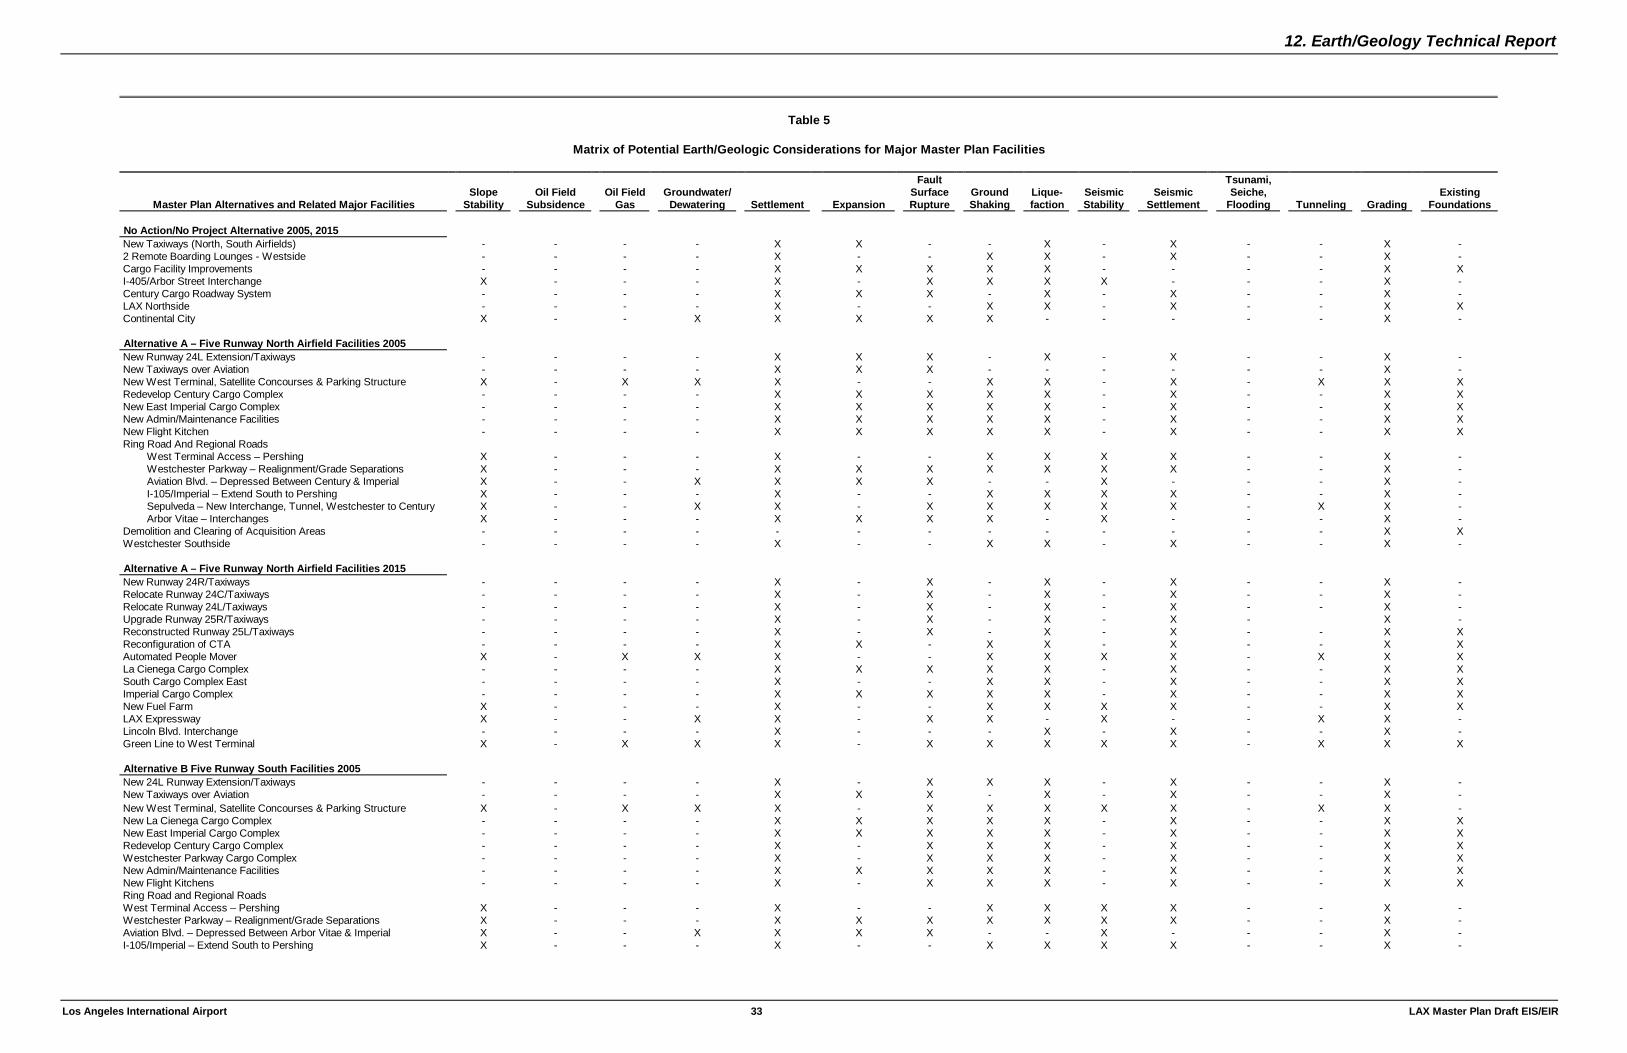
12. Earth/Geology Technical Report
Los Angeles International Airport 33 LAX Master Plan Draft EIS/EIR
Table 5
Matrix of Potential Earth/Geologic Considerations for Major Master Plan Facilities
Master Plan Alternatives and Related Major FacilitiesSlope
StabilityOil Field
SubsidenceOil Field
GasGroundwater/
Dewatering Settlement Expansion
FaultSurfaceRupture
GroundShaking
Lique-faction
SeismicStability
SeismicSettlement
Tsunami,Seiche,
Flooding Tunneling GradingExisting
Foundations
No Action/No Project Alternative 2005, 2015New Taxiways (North, South Airfields) - - - - X X - - X - X - - X -2 Remote Boarding Lounges - Westside - - - - X - - X X - X - - X -Cargo Facility Improvements - - - - X X X X X - - - - X XI-405/Arbor Street Interchange X - - - X - X X X X - - - X -Century Cargo Roadway System - - - - X X X - X - X - - X -LAX Northside - - - - X - - X X - X - - X XContinental City X - - X X X X X - - - - - X -
Alternative A – Five Runway North Airfield Facilities 2005New Runway 24L Extension/Taxiways - - - - X X X - X - X - - X -New Taxiways over Aviation - - - - X X X - - - - - - X -New West Terminal, Satellite Concourses & Parking Structure X - X X X - - X X - X - X X XRedevelop Century Cargo Complex - - - - X X X X X - X - - X XNew East Imperial Cargo Complex - - - - X X X X X - X - - X XNew Admin/Maintenance Facilities - - - - X X X X X - X - - X XNew Flight Kitchen - - - - X X X X X - X - - X XRing Road And Regional Roads
West Terminal Access – Pershing X - - - X - - X X X X - - X -Westchester Parkway – Realignment/Grade Separations X - - - X X X X X X X - - X -Aviation Blvd. – Depressed Between Century & Imperial X - - X X X X - - X - - - X -I-105/Imperial – Extend South to Pershing X - - - X - - X X X X - - X -Sepulveda – New Interchange, Tunnel, Westchester to Century X - - X X - X X X X X - X X -Arbor Vitae – Interchanges X - - - X X X X - X - - - X -
Demolition and Clearing of Acquisition Areas - - - - - - - - - - - - - X XWestchester Southside - - - - X - - X X - X - - X -
Alternative A – Five Runway North Airfield Facilities 2015New Runway 24R/Taxiways - - - - X - X - X - X - - X -Relocate Runway 24C/Taxiways - - - - X - X - X - X - - X -Relocate Runway 24L/Taxiways - - - - X - X - X - X - - X -Upgrade Runway 25R/Taxiways - - - - X - X - X - X - X -Reconstructed Runway 25L/Taxiways - - - - X - X - X - X - - X XReconfiguration of CTA - - - - X X - X X - X - - X XAutomated People Mover X - X X X - - X X X X - X X XLa Cienega Cargo Complex - - - - X X X X X - X - - X XSouth Cargo Complex East - - - - X - - X X - X - - X XImperial Cargo Complex - - - - X X X X X - X - - X XNew Fuel Farm X - - - X - - X X X X - - X XLAX Expressway X - - X X - X X - X - - X X -Lincoln Blvd. Interchange - - - - X - - - X - X - - X -Green Line to West Terminal X - X X X - X X X X X - X X X
Alternative B Five Runway South Facilities 2005New 24L Runway Extension/Taxiways - - - - X - X X X - X - - X -New Taxiways over Aviation - - - - X X X - X - X - - X -New West Terminal, Satellite Concourses & Parking Structure X - X X X - X X X X X - X X -New La Cienega Cargo Complex - - - - X X X X X - X - - X XNew East Imperial Cargo Complex - - - - X X X X X - X - - X XRedevelop Century Cargo Complex - - - - X - X X X - X - - X XWestchester Parkway Cargo Complex - - - - X - X X X - X - - X XNew Admin/Maintenance Facilities - - - - X X X X X - X - - X XNew Flight Kitchens - - - - X - X X X - X - - X XRing Road and Regional RoadsWest Terminal Access – Pershing X - - - X - - X X X X - - X -Westchester Parkway – Realignment/Grade Separations X - - - X X X X X X X - - X -Aviation Blvd. – Depressed Between Arbor Vitae & Imperial X - - X X X X - - X - - - X -I-105/Imperial – Extend South to Pershing X - - - X - - X X X X - - X -

12. Earth/Geology Technical Report
Los Angeles International Airport 35 LAX Master Plan Draft EIS/EIR
Table 5
Matrix of Potential Earth/Geologic Considerations for Major Master Plan Facilities
Master Plan Alternatives and Related Major FacilitiesSlope
StabilityOil Field
SubsidenceOil Field
GasGroundwater/
Dewatering Settlement Expansion
FaultSurfaceRupture
GroundShaking
Lique-faction
SeismicStability
SeismicSettlement
Tsunami,Seiche,
Flooding Tunneling GradingExisting
FoundationsSepulveda – New Interchange, Tunnel Westchester to Century X - - X X - X X X X X - X X -Arbor Vitae – Interchanges X - - - X X X X - X X - - X -Aviation Blvd. Tunnel X - - X X - X X X X X - X X -Demolition and Clearing of Acquisition Areas - - - - - - - - - - - - - X XWestchester Southside - - - - X - - X X - X - - X -
Alternative B – Five Runway South Airfield Facilities 2015Relocated/Replacement Runway 24R/Taxiways X - - - X - - X X X X - - X XRelocated/Replacement New Runway 24C/Taxiways X - - - X - - X X X X - - X XNew Runway 24L/Taxiways X - - - X - - X X X X - - X XReconfiguration of CTA - - - - X X X X X - X - X X XAutomated People Mover X - X X X - - X X X X - X X XNew Imperial Cargo Complex - - - - X X X X X - X - - X XOff-Site Fuel Farm X - - - X - X X X X X - - X -Lincoln Blvd. Interchange - - - - X - - - X - X - - X -LAX Expressway X - - - - - - - - - X - - X XGreen Line to West Terminal X - X X X - X X X X - - X X X
Alternative C - Four Runway Facilities 2005Extend/Upgrade Runway 24L/Taxiways - - - - X X X - X - X - - X -Relocate/Upgrade Runway 24R/Taxiways - - - - X X X - X - X - - X -New Westside Terminal, Satellite Concourses & Parking Structure X - X X X - X X X X X - X X -Expansion of TBIT - - - - X X - X X - X - - X XWestchester Parkway Cargo Complex - - - - X X X X X - - - - X XNew Admin/Maintenance/Flight Kitchen/General Aviation Facilities X - - - X - - X X X X - - X XRing Road and Regional RoadsWest Terminal Access – Pershing X - - - X - - X X X X - - X -Westchester Parkway – Realignment/Grade Separations X - - - X X X X X X X - - X -Aviation Blvd. – Depressed Between Arbor Vitae & Imperial X - - X X X X - - X - - - X -I-105/Imperial – Extend South to Pershing X - - - X - - X X X X - - X -Sepulveda – New Interchange, Tunnel Westchester To Century - - - X - - X X X X X - X X -Arbor Vitae – Interchanges X - - - X X X X - X X - - X -Demolition and Clearing of Acquisition Areas - - - - - - - - - - - - - X XWestchester Southside - - - - X - - X X - X - - X X
Alternative C - Four Runway Facilities 2015Relocate Runway 25L X - - - X X X - X - X - - X -Realign/Widen Taxiways B, C - - - - X X X - X - X - - X -Automated People Mover X - X X - - - X X - X - X X XUnderground Spine Road CTA to West Terminal X - X X - - - X X - X - X X XManchester Square Cargo Complex - - - - X X X X X - X - - X XRedevelop Century Cargo Complex - - - - X X X X X - X - - X XNew Cargo Ramp SE Corner of Airport - - - - X - X X X - X - - X XSouth Cargo Complex (East / West) - - - - X - X X X - X - - X XManchester Square Cargo Complex - - - - X X X X - - - - - X -Fuel Farm – Additions to Existing - - - - X - - X X - X - - X -LAX Expressway X - - X - - - - - - X - X X -Green Line to West Terminal X - X X X - X X X X X - X X X
Source: Taylor-Hunter Associates, 2000.
12. Earth/Geology Technical Report
Los Angeles International Airport 37 LAX Master Plan Draft EIS/EIR
zone would likely be wider, but the overall offsets lower than those indicated above. Sympathetic(triggered) slip due to earthquakes on nearby faults may occur at depth along the Charnock Fault, butwould appear unlikely to result in surface rupture along the fault trace. The possibility of fault surfacerupture or co-seismic ground deformation along a previously unidentified fault also exists, although thepotential cannot be quantified with currently available data.
3.2 Ground Shaking AnalysisA deterministic analysis of the potential levels of ground shaking in the LAX area was performed for thepurposes of the EIS/EIR. Maximum instrumental ground shaking, in terms of peak horizontal and verticalground acceleration, was estimated by considering the characteristics of maximum credible earthquakeevents identified in Table 2, and the distance between the seismic sources for these events and LAX(deterministic method). Given that LAX is over two miles long in an east-west direction, the groundshaking at three “sub-sites” in or near LAX were evaluated in order to consider potential differences inground shaking hazard across the site. These three sub-sites are: the proposed West Terminal (referredto as Site A); the existing main control tower near the center of LAX (referred to as Site B); and, theintersection of the I-405 and I-105 freeways to the southeast of LAX (referred to as Site C).
Three SSM relationships were used to evaluate peak horizontal ground acceleration, and two attenuationrelationships were used to evaluate peak vertical ground accelerations, at the three sub-sites. Theserelationships, termed attenuation relationships, were derived from databases of instrumental recordingsduring previous earthquakes. These relationships are dependent on the distance from the fault, themagnitude of the earthquake, the type of faulting mechanism, and the general subsurface stratigraphy.More than one relationship was used in order to compute an average for each earthquake scenario. Thedistances used to calculate the deterministic ground-shaking values for these faults are to the down-dipprojection of the faults (5 km depth, into the seismogenic source region).
As shown in Tables 6, 7, and 8, Deterministic Ground Motion Estimates for Sites A, B, and C,respectively, a different means of calculating the closest distance is used for each of the threerelationships. In addition, the characterization of site subsurface conditions differs. For relationships byAbrahamson and Silva23 and Campbell,24 the site was categorized as being a deep soil site. However,attenuation relationships by Boore, Joyner, and Fumal25 require an estimate of the shear wave velocity inthe upper 30 meters of the ground surface in order to categorize the subsurface conditions. In the area ofLAX, two profiles of shear wave velocity have been reported by the USGS. One profile, near thesouthwest corner of LAX, has an average shear wave velocity of 310 m/sec in the upper 30 meters.Another profile, near the northeast corner of LAX has an average shear wave velocity of 390 m/sec. Thedifferences in the average shear wave velocity at these two locations may be attributable to differences ingeology. At the southwestern site, the soils are primarily younger; at the northeastern site, the soils areprimarily older.
For purposes of the ground motion estimates reported herein, Site A was assumed to correspond to thelower shear wave velocity profile (Class C); Site C was assumed to correspond to the higher shear wavevelocity profile (Class B); and Site B was assumed to have a shear wave velocity profile between thesetwo (using the average of the results for Class B and Class C).
23 Abrahamson, N.A., and W.J. Silva “Equations for Estimating Horizontal Response Spectran and Peak Acceleration from
Western North American Earthquakes: A Summary of Recent Work,” Seismoligical Research Letters, January 1997.24 Campbell, K.W., “Attention Relationships for Shallow Crustal Earthquakes Based on California Strong Motion Data,”
Seismological Research Letters, January 1997.25 Boore, D.M., et al., Estimation of Response Spectra and Peak Accelerations from Western North American Earthquakes
(USGS 94-127), 1994.
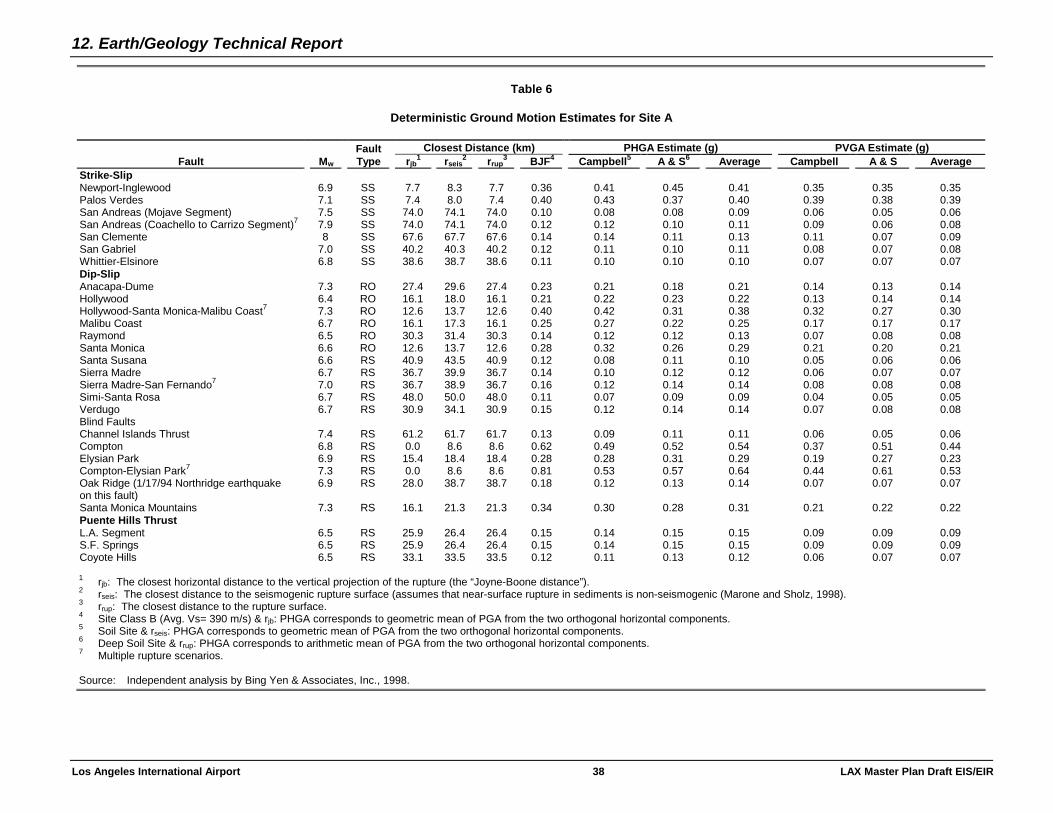
12. Earth/Geology Technical Report
Los Angeles International Airport 38 LAX Master Plan Draft EIS/EIR
Table 6
Deterministic Ground Motion Estimates for Site A
Closest Distance (km) PHGA Estimate (g) PVGA Estimate (g)Fault Mw
FaultType rjb
1 rseis2 rrup
3 BJF4 Campbell5 A & S6 Average Campbell A & S AverageStrike-SlipNewport-Inglewood 6.9 SS 7.7 8.3 7.7 0.36 0.41 0.45 0.41 0.35 0.35 0.35Palos Verdes 7.1 SS 7.4 8.0 7.4 0.40 0.43 0.37 0.40 0.39 0.38 0.39San Andreas (Mojave Segment) 7.5 SS 74.0 74.1 74.0 0.10 0.08 0.08 0.09 0.06 0.05 0.06San Andreas (Coachello to Carrizo Segment)7 7.9 SS 74.0 74.1 74.0 0.12 0.12 0.10 0.11 0.09 0.06 0.08San Clemente 8 SS 67.6 67.7 67.6 0.14 0.14 0.11 0.13 0.11 0.07 0.09San Gabriel 7.0 SS 40.2 40.3 40.2 0.12 0.11 0.10 0.11 0.08 0.07 0.08Whittier-Elsinore 6.8 SS 38.6 38.7 38.6 0.11 0.10 0.10 0.10 0.07 0.07 0.07Dip-SlipAnacapa-Dume 7.3 RO 27.4 29.6 27.4 0.23 0.21 0.18 0.21 0.14 0.13 0.14Hollywood 6.4 RO 16.1 18.0 16.1 0.21 0.22 0.23 0.22 0.13 0.14 0.14Hollywood-Santa Monica-Malibu Coast7 7.3 RO 12.6 13.7 12.6 0.40 0.42 0.31 0.38 0.32 0.27 0.30Malibu Coast 6.7 RO 16.1 17.3 16.1 0.25 0.27 0.22 0.25 0.17 0.17 0.17Raymond 6.5 RO 30.3 31.4 30.3 0.14 0.12 0.12 0.13 0.07 0.08 0.08Santa Monica 6.6 RO 12.6 13.7 12.6 0.28 0.32 0.26 0.29 0.21 0.20 0.21Santa Susana 6.6 RS 40.9 43.5 40.9 0.12 0.08 0.11 0.10 0.05 0.06 0.06Sierra Madre 6.7 RS 36.7 39.9 36.7 0.14 0.10 0.12 0.12 0.06 0.07 0.07Sierra Madre-San Fernando7 7.0 RS 36.7 38.9 36.7 0.16 0.12 0.14 0.14 0.08 0.08 0.08Simi-Santa Rosa 6.7 RS 48.0 50.0 48.0 0.11 0.07 0.09 0.09 0.04 0.05 0.05Verdugo 6.7 RS 30.9 34.1 30.9 0.15 0.12 0.14 0.14 0.07 0.08 0.08Blind FaultsChannel Islands Thrust 7.4 RS 61.2 61.7 61.7 0.13 0.09 0.11 0.11 0.06 0.05 0.06Compton 6.8 RS 0.0 8.6 8.6 0.62 0.49 0.52 0.54 0.37 0.51 0.44Elysian Park 6.9 RS 15.4 18.4 18.4 0.28 0.28 0.31 0.29 0.19 0.27 0.23Compton-Elysian Park7 7.3 RS 0.0 8.6 8.6 0.81 0.53 0.57 0.64 0.44 0.61 0.53Oak Ridge (1/17/94 Northridge earthquakeon this fault)
6.9 RS 28.0 38.7 38.7 0.18 0.12 0.13 0.14 0.07 0.07 0.07
Santa Monica Mountains 7.3 RS 16.1 21.3 21.3 0.34 0.30 0.28 0.31 0.21 0.22 0.22Puente Hills ThrustL.A. Segment 6.5 RS 25.9 26.4 26.4 0.15 0.14 0.15 0.15 0.09 0.09 0.09S.F. Springs 6.5 RS 25.9 26.4 26.4 0.15 0.14 0.15 0.15 0.09 0.09 0.09Coyote Hills 6.5 RS 33.1 33.5 33.5 0.12 0.11 0.13 0.12 0.06 0.07 0.07
1 rjb: The closest horizontal distance to the vertical projection of the rupture (the “Joyne-Boone distance”).2 rseis: The closest distance to the seismogenic rupture surface (assumes that near-surface rupture in sediments is non-seismogenic (Marone and Sholz, 1998).3 rrup: The closest distance to the rupture surface.4 Site Class B (Avg. Vs= 390 m/s) & rjb: PHGA corresponds to geometric mean of PGA from the two orthogonal horizontal components.5 Soil Site & rseis: PHGA corresponds to geometric mean of PGA from the two orthogonal horizontal components.6 Deep Soil Site & rrup: PHGA corresponds to arithmetic mean of PGA from the two orthogonal horizontal components.7 Multiple rupture scenarios.
Source: Independent analysis by Bing Yen & Associates, Inc., 1998.

12. Earth/Geology Technical Report
Los Angeles International Airport 39 LAX Master Plan Draft EIS/EIR
Table 7
Deterministic Ground Motion Estimates for Site B
Closest Distance (km) PHGA Estimate PVGA EstimateFault Mw
FaultType rjb
1 rseis2 rrup
3 BJF4 Campbell5 A & S6 Average Campbell A & S AverageStrike-SlipNewport-Inglewood 6.9 SS 5.1 6.0 5.1 0.41 0.45 0.45 0.44 0.41 0.44 0.43Palos Verdes 7.1 SS 9.7 10.1 9.7 0.34 0.40 0.31 0.35 0.34 0.32 0.33San Andreas (Mojave Segment) 7.5 SS 72.4 72.5 72.4 0.10 0.09 0.08 0.09 0.06 0.05 0.06San Andreas (Coachello to CarrizoSegment)7
7.9 SS 72.4 72.5 72.4 0.12 0.12 0.10 0.11 0.09 0.06 0.08
San Clemente 8 SS 70.9 70.8 0.13 0.13 0.10 0.12 0.10 0.06 0.08San Gabriel 7.0 SS 38.6 38.7 38.6 0.12 0.12 0.11 0.12 0.09 0.08 0.09Whittier-Elsinore 6.8 SS 37.3 37.5 37.3 0.12 0.11 0.10 0.11 0.07 0.07 0.07Dip-SlipAnacapa-Dume 7.3 RO 30.3 32.5 30.3 0.21 0.19 0.16 0.19 0.13 0.11 0.12Hollywood 6.4 RO 15.8 17.7 15.8 0.21 0.22 0.21 0.21 0.14 0.15 0.15Hollywood-Santa Monica-Malibu Coast7 7.3 RO 12.6 13.7 12.6 0.39 0.42 0.31 0.37 0.32 0.27 0.30Malibu Coast 6.7 RO 17.7 18.9 17.7 0.22 0.24 0.21 0.22 0.16 0.15 0.16Raymond 6.5 RO 28.0 29.2 28.0 0.15 0.13 0.13 0.14 0.08 0.09 0.09Santa Monica 6.6 RO 12.6 13.7 12.6 0.27 0.32 0.26 0.28 0.21 0.20 0.21Santa Susana 6.6 RS 41.5 44.1 41.5 0.12 0.08 0.11 0.10 0.05 0.06 0.06Sierra Madre 6.7 RS 36.0 39.2 36.0 0.13 0.10 0.13 0.12 0.06 0.07 0.07Sierra Madre-San Fernando7 7.0 RS 36.0 38.3 36.0 0.16 0.13 0.14 0.14 0.08 0.08 0.08Simi-Santa Rosa 6.7 RS 49.6 51.6 49.6 0.11 0.07 0.10 0.09 0.04 0.05 0.05Verdugo 6.7 RS 29.6 32.9 29.6 0.16 0.14 0.15 0.15 0.09 0.09 0.09Blind FaultsChannel Islands Thrust 7.4 RS 64.4 64.9 64.9 0.13 0.09 0.10 0.11 0.06 0.05 0.06Compton 6.8 RS 0.0 8.6 8.6 0.60 0.49 0.52 0.54 0.37 0.51 0.44Elysian Park 6.9 RS 13.2 16.6 16.6 0.30 0.31 0.34 0.32 0.21 0.31 0.26Compton-Elysian Park7 7.3 RS 0.0 8.6 8.6 0.78 0.53 0.57 0.63 0.44 0.61 0.53Oak Ridge 6.9 RS 29.0 37.9 37.9 0.17 0.12 0.13 0.14 0.08 0.07 0.08Santa Monica Mountains 7.3 RS 17.7 22.6 22.6 0.31 0.28 0.25 0.28 0.19 0.18 0.19Puente Hills ThrustL.A. Segment 6.5 RS 21.6 22.2 22.2 0.17 0.18 0.18 0.18 0.11 0.11 0.11S.F. Springs 6.5 RS 23.0 23.6 23.6 0.17 0.18 0.17 0.17 0.10 0.10 0.10Coyote Hills 6.5 RS 28.9 29.4 29.4 0.14 0.13 0.14 0.14 0.08 0.08 0.08
1 rjb: The closest horizontal distance to the vertical projection of the rupture (the “Joyne-Boone distance”).2 rseis: The closest distance to the seismogenic rupture surface (assumes that near-surface rupture in sediments is non-seismogenic (Marone and Sholz, 1998).3 rrup: The closest distance to the rupture surface.4 Site Class B (Avg. Vs= 390 m/s) & rjb: PHGA corresponds to geometric mean of PGA from the two orthogonal horizontal components.5 Soil Site & rseis: PHGA corresponds to geometric mean of PGA from the two orthogonal horizontal components.6 Deep Soil Site & rrup: PHGA corresponds to arithmetic mean of PGA from the two orthogonal horizontal components.7 Multiple rupture scenarios.
Source: Independent analysis by Bing Yen & Associates, Inc., 1998.
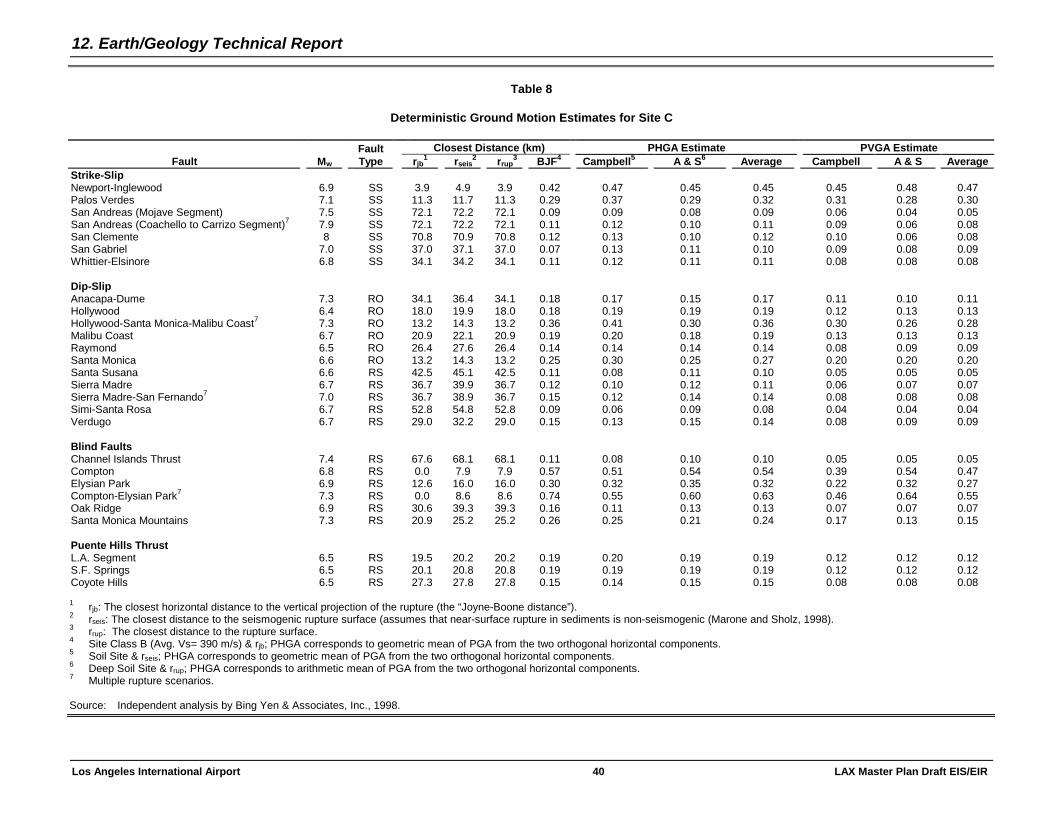
12. Earth/Geology Technical Report
Los Angeles International Airport 40 LAX Master Plan Draft EIS/EIR
Table 8
Deterministic Ground Motion Estimates for Site C
Closest Distance (km) PHGA Estimate PVGA EstimateFault Mw
FaultType rjb
1 rseis2 rrup
3 BJF4 Campbell5 A & S6 Average Campbell A & S AverageStrike-SlipNewport-Inglewood 6.9 SS 3.9 4.9 3.9 0.42 0.47 0.45 0.45 0.45 0.48 0.47Palos Verdes 7.1 SS 11.3 11.7 11.3 0.29 0.37 0.29 0.32 0.31 0.28 0.30San Andreas (Mojave Segment) 7.5 SS 72.1 72.2 72.1 0.09 0.09 0.08 0.09 0.06 0.04 0.05San Andreas (Coachello to Carrizo Segment)7 7.9 SS 72.1 72.2 72.1 0.11 0.12 0.10 0.11 0.09 0.06 0.08San Clemente 8 SS 70.8 70.9 70.8 0.12 0.13 0.10 0.12 0.10 0.06 0.08San Gabriel 7.0 SS 37.0 37.1 37.0 0.07 0.13 0.11 0.10 0.09 0.08 0.09Whittier-Elsinore 6.8 SS 34.1 34.2 34.1 0.11 0.12 0.11 0.11 0.08 0.08 0.08
Dip-SlipAnacapa-Dume 7.3 RO 34.1 36.4 34.1 0.18 0.17 0.15 0.17 0.11 0.10 0.11Hollywood 6.4 RO 18.0 19.9 18.0 0.18 0.19 0.19 0.19 0.12 0.13 0.13Hollywood-Santa Monica-Malibu Coast7 7.3 RO 13.2 14.3 13.2 0.36 0.41 0.30 0.36 0.30 0.26 0.28Malibu Coast 6.7 RO 20.9 22.1 20.9 0.19 0.20 0.18 0.19 0.13 0.13 0.13Raymond 6.5 RO 26.4 27.6 26.4 0.14 0.14 0.14 0.14 0.08 0.09 0.09Santa Monica 6.6 RO 13.2 14.3 13.2 0.25 0.30 0.25 0.27 0.20 0.20 0.20Santa Susana 6.6 RS 42.5 45.1 42.5 0.11 0.08 0.11 0.10 0.05 0.05 0.05Sierra Madre 6.7 RS 36.7 39.9 36.7 0.12 0.10 0.12 0.11 0.06 0.07 0.07Sierra Madre-San Fernando7 7.0 RS 36.7 38.9 36.7 0.15 0.12 0.14 0.14 0.08 0.08 0.08Simi-Santa Rosa 6.7 RS 52.8 54.8 52.8 0.09 0.06 0.09 0.08 0.04 0.04 0.04Verdugo 6.7 RS 29.0 32.2 29.0 0.15 0.13 0.15 0.14 0.08 0.09 0.09
Blind FaultsChannel Islands Thrust 7.4 RS 67.6 68.1 68.1 0.11 0.08 0.10 0.10 0.05 0.05 0.05Compton 6.8 RS 0.0 7.9 7.9 0.57 0.51 0.54 0.54 0.39 0.54 0.47Elysian Park 6.9 RS 12.6 16.0 16.0 0.30 0.32 0.35 0.32 0.22 0.32 0.27Compton-Elysian Park7 7.3 RS 0.0 8.6 8.6 0.74 0.55 0.60 0.63 0.46 0.64 0.55Oak Ridge 6.9 RS 30.6 39.3 39.3 0.16 0.11 0.13 0.13 0.07 0.07 0.07Santa Monica Mountains 7.3 RS 20.9 25.2 25.2 0.26 0.25 0.21 0.24 0.17 0.13 0.15
Puente Hills ThrustL.A. Segment 6.5 RS 19.5 20.2 20.2 0.19 0.20 0.19 0.19 0.12 0.12 0.12S.F. Springs 6.5 RS 20.1 20.8 20.8 0.19 0.19 0.19 0.19 0.12 0.12 0.12Coyote Hills 6.5 RS 27.3 27.8 27.8 0.15 0.14 0.15 0.15 0.08 0.08 0.08
1 rjb: The closest horizontal distance to the vertical projection of the rupture (the “Joyne-Boone distance”).2 rseis: The closest distance to the seismogenic rupture surface (assumes that near-surface rupture in sediments is non-seismogenic (Marone and Sholz, 1998).3 rrup: The closest distance to the rupture surface.4 Site Class B (Avg. Vs= 390 m/s) & rjb; PHGA corresponds to geometric mean of PGA from the two orthogonal horizontal components.5 Soil Site & rseis; PHGA corresponds to geometric mean of PGA from the two orthogonal horizontal components.6 Deep Soil Site & rrup; PHGA corresponds to arithmetic mean of PGA from the two orthogonal horizontal components.7 Multiple rupture scenarios.
Source: Independent analysis by Bing Yen & Associates, Inc., 1998.
12. Earth/Geology Technical Report
Los Angeles International Airport 41 LAX Master Plan Draft EIS/EIR
3.3 Liquefaction EvaluationThe potential for soils inundated by perched water to liquefy was evaluated using empirical methodsbased on standard penetration test (SPT) blow counts developed by Seed et al.26 For this study, SPTdata from Borings B-1, B-5, B-8, B-10, and B-14 made by Dames and Moore in 1991 were assessed to beof sufficient quality and representative of the specific location and were used for the analysis. The intentof this evaluation was not to determine which areas within the LAX Master Plan boundaries were subjectto liquefaction, but to provide an indication of whether some materials in the LAX area could besusceptible.
As indicated above, the Seismic Hazard Mapping Act of 1990 was enacted, in part, to address seismichazards not included in the Alquist-Priolo Act, including liquefaction and other ground failures induced byseismic activity. Currently, the CDMG has begun mapping the seismic hazard zones associated with theLAX area, and preliminary seismic hazard maps identifying areas potentially subject to liquefaction wererecently published for the LAX area. This map indicates that the LAX area, including the Scattergood andoil refinery fuel farm sites and LAX Expressway, are not zoned by the state for liquefaction hazardpotential. However, for the purposes of the Draft EIS/EIR, it is concluded that liquefaction could potentiallyoccur in very localized areas of Quarternary-age sands saturated by perched water (see Section 3,Methodology). Therefore, generally low susceptibility to liquefaction may be present in the LAX area,including the Scattergood Fuel Farm site, the oil refinery fuel farm site, and the LAX Expresswayalignments.
3.4 Seismic Settlement EvaluationAs discussed above, strong ground shaking can densify loose to medium dense deposits of sand, whichcould result in seismic settlement of foundations and the ground surface. At LAX, the subsurface soils aretypically medium dense to dense sand. For the purposes of the Draft EIS/EIR, an evaluation was made ofthe potential for seismic settlement of sand using boring data from an investigation performed in thevicinity of LAXFUEL Fuel Farm. Empirical procedures developed by Tokimatsu and Seed27 were used toevaluate the potential for seismic settlement. This procedure involves using SPT blow count data fromborings at the site. For this study, SPT data from Borings B-1, B-5, B-8, B-10, and B-14 made by Damesand Moore28 were assessed to be of sufficient quality and representative of the specific location and wereused for the analysis. Based on an assumed earthquake on the combined Compton and Elysian Parkfaults, the estimated maximum seismic settlement in this area is less than ½ at the location of the abovereferenced borings.
It is likely that the potential for seismic settlements would tend to vary considerably across the site,generally between negligible levels and ½ inch. Because of variations in the level of detail and quality ofdata included in various documents reviewed for the Draft EIS/EIR, it is difficult to estimate the potentialfor seismic settlement in different areas of LAX. The intent of this evaluation was not to determine whichareas within the Master Plan boundaries were subject to seismic settlement, but to provide a qualitativeindication of whether some materials in the LAX area may be susceptible.
3.5 Aerial Photograph ReviewIn order to evaluate geologic processes that may have effected the landforms in and around the LAXstudy area, historic topographic maps and aerial photographs were researched, reviewed anddocumented. In this review, topographic features were looked for that could be related to active faulting orshaking-induced ground deformation. Such features include linear valleys, scarps, elongated drainages,or tonal lineaments due to material or moisture variation across a fault. Topographic maps covering thestudy area were acquired for the Redondo 15 minute quadrangle (scale 1 inch = 1 mile), dated 1896, andfor the Venice and Inglewood 7-1/2 minute quadrangles (scale 1 inch = 2,000 feet) dated 1924.
26 Seed, H.B. et al., “Influence of SPT Procedures in Soil Liquefaction Resistance Evaluations,” Journal, Geotechnical
Engineering Division, December 1985.27 Seed, H.B. et al., “Influence of SPT Procedures in Soil Liquefaction Resistance Evaluations,” Journal, Geotechnical
Engineering Division, December 1985.28 Dames and Moore: Geotechnical Investigation, Proposed Fuel Facilities Expansion, Los Angeles International Airport, Los
Angeles, California, February 8, 1991.
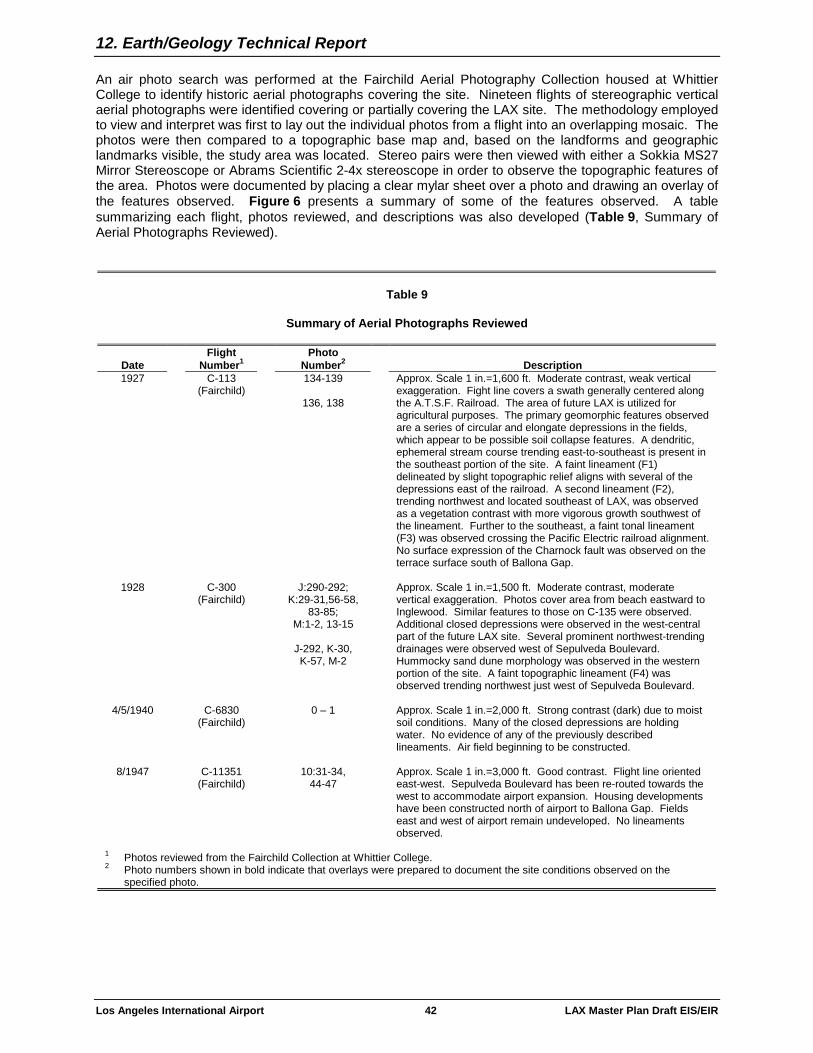
12. Earth/Geology Technical Report
Los Angeles International Airport 42 LAX Master Plan Draft EIS/EIR
An air photo search was performed at the Fairchild Aerial Photography Collection housed at WhittierCollege to identify historic aerial photographs covering the site. Nineteen flights of stereographic verticalaerial photographs were identified covering or partially covering the LAX site. The methodology employedto view and interpret was first to lay out the individual photos from a flight into an overlapping mosaic. Thephotos were then compared to a topographic base map and, based on the landforms and geographiclandmarks visible, the study area was located. Stereo pairs were then viewed with either a Sokkia MS27Mirror Stereoscope or Abrams Scientific 2-4x stereoscope in order to observe the topographic features ofthe area. Photos were documented by placing a clear mylar sheet over a photo and drawing an overlay ofthe features observed. Figure 6 presents a summary of some of the features observed. A tablesummarizing each flight, photos reviewed, and descriptions was also developed (Table 9, Summary ofAerial Photographs Reviewed).
Table 9
Summary of Aerial Photographs Reviewed
DateFlight
Number1Photo
Number2 Description1927 C-113
(Fairchild)134-139
136, 138
Approx. Scale 1 in.=1,600 ft. Moderate contrast, weak verticalexaggeration. Fight line covers a swath generally centered alongthe A.T.S.F. Railroad. The area of future LAX is utilized foragricultural purposes. The primary geomorphic features observedare a series of circular and elongate depressions in the fields,which appear to be possible soil collapse features. A dendritic,ephemeral stream course trending east-to-southeast is present inthe southeast portion of the site. A faint lineament (F1)delineated by slight topographic relief aligns with several of thedepressions east of the railroad. A second lineament (F2),trending northwest and located southeast of LAX, was observedas a vegetation contrast with more vigorous growth southwest ofthe lineament. Further to the southeast, a faint tonal lineament(F3) was observed crossing the Pacific Electric railroad alignment.No surface expression of the Charnock fault was observed on theterrace surface south of Ballona Gap.
1928 C-300(Fairchild)
J:290-292;K:29-31,56-58,
83-85;M:1-2, 13-15
J-292, K-30,K-57, M-2
Approx. Scale 1 in.=1,500 ft. Moderate contrast, moderatevertical exaggeration. Photos cover area from beach eastward toInglewood. Similar features to those on C-135 were observed.Additional closed depressions were observed in the west-centralpart of the future LAX site. Several prominent northwest-trendingdrainages were observed west of Sepulveda Boulevard.Hummocky sand dune morphology was observed in the westernportion of the site. A faint topographic lineament (F4) wasobserved trending northwest just west of Sepulveda Boulevard.
4/5/1940 C-6830(Fairchild)
0 – 1 Approx. Scale 1 in.=2,000 ft. Strong contrast (dark) due to moistsoil conditions. Many of the closed depressions are holdingwater. No evidence of any of the previously describedlineaments. Air field beginning to be constructed.
8/1947 C-11351(Fairchild)
10:31-34,44-47
Approx. Scale 1 in.=3,000 ft. Good contrast. Flight line orientedeast-west. Sepulveda Boulevard has been re-routed towards thewest to accommodate airport expansion. Housing developmentshave been constructed north of airport to Ballona Gap. Fieldseast and west of airport remain undeveloped. No lineamentsobserved.
1 Photos reviewed from the Fairchild Collection at Whittier College.2 Photo numbers shown in bold indicate that overlays were prepared to document the site conditions observed on the
specified photo.

12. Earth/Geology Technical Report
Los Angeles International Airport 43 LAX Master Plan Draft EIS/EIR
4. REFERENCESAbrahamson, N.A. and Silva, W.J., “Equations for Estimating Horizontal Response Spectran and PeakAcceleration from Western North American Earthquakes: A Summary of Recent Work,” SeismologicalResearch Letters, Volume 68, Number 1, January 1997.
Associated Soils Engineering, Inc., Geotechnical Investigation Report, Soil Percolation Study, ProposedFIS Facility, Ontario Airport, Ontario, California, for the City of Los Angeles, Department of Airports, April27, 1993.
Boore, D.M., Joyner, W.B. and Fumal, T.E., Estimation of Response Spectra and Peak Accelerations fromWestern North American Earthquakes, U.S. Geological Survey Open File Report 94-127, 1994.
Bryant, W.A., Recently Active Traces of the Newport-Inglewood Fault Zone, Los Angeles and OrangeCounties, California, CDMG Open File Report 88-14, 1988.
California Department of Mines and Geology (CDMG), California Fault Parameters, Open File Report 96-08, 1996.
California Department of Transportation, Materials Section, Geotechnical Report, Route I 105, ElSegundo-Norwalk Transportation Corridor, April 1974.
California Department of Water Resources, Planned Utilization of the Ground Water Basins of the CoastalPlain of Los Angeles County, Appendix A, Ground Water Geology, CDWR Bulletin 104, 1961.
California Department of Conservation, Division of Mines and Geology, Planning Scenario for a MajorEarthquake on the Newport-Inglewood Fault Zone, CDMG Special Publication 99, 1988.
California Department of Conservation, California Division of Mines and Geology, Probabilistic SeismicHazard Assessment for the State of California, Available: http://www.consrv.ca.gov/dmg/pubs/ofr/96/_08/appen_a.htm [May 5, 2000].
Camp Dresser and McKee Inc., Phase I Environmental Audit, Final Report, Volume 2 Appendices, for theCity of Los Angeles, Department of Airports, July 1988.
Camp Dresser and McKee Inc., Underground Tanks and Hazardous Substances (UTAHS) ProgramEnvironmental Audit Compliance Status, for the City of Los Angeles, Department of Airports, January 31,1989.
Camp Dresser and McKee Inc., Report of Bioventing Pilot Study For Air Freight 7 Facility 10013International Road, Los Angeles, California, for the City of Los Angeles, Department of Airports, January13, 1994.
Campbell, Kenneth W., “Attenuation Relationships for Shallow Crustal Earthquakes Based on CaliforniaStrong Motion Data,” Seismological Research Letters, Volume 68, Number 1, January 1997.
Castle, R.O., Surficial Geology of the Beverly Hills and Venice Quadrangles, California, U.S. GeologicalSurvey Open-File Report, 1960
City of Los Angeles, Department of Public Works, Foundation Conditions for Sepulveda BoulevardUnderpass, Los Angeles Airport, for the City of Los Angeles, Department of Airports, December 21, 1947.
City of Los Angeles, Department of Public Works, Municipal Airport Tunnels, Highways and GradeSeparations, December 24, 1947.
City of Los Angeles, Department of Public Works, Foundation Conditions for Sepulveda Boulevard,Subway Ventilation Buildings, for the City of Los Angeles, Department of Airports, April 20, 1951.
City of Los Angeles, Department of Public Works, Subsurface Investigation, Sepulveda Boulevard,Subway Strengthening Under The International Airport, November 16, 1967.
City of Los Angeles, Department of Public Works, Sepulveda Boulevard, South Service Road Bridge OverSepulveda Boulevard at Los Angeles International Airport, for the City of Los Angeles, Department ofAirports, February 2, 1979.
Cole, D.A. and Lade, P.V., “Influence Zones in Alluvium over Dip-Slip Faults,” Journal of GeotechnicalEngineering, Vol. 110, 1984.

12. Earth/Geology Technical Report
Los Angeles International Airport 44 LAX Master Plan Draft EIS/EIR
Converse Consultants, Foundation Investigation, Proposed Air France Cargo Facility, Los AngelesInternational Airport, Near Northwest Corner of Imperial Highway and Aviation Boulevard, Los Angeles,California, for Air France Airlines, October, 28, 1985.
Dames and Moore, Geotechnical Investigation, (1), Construction Monitoring Services (2), ProposedConnector Facilities, Los Angeles International Airport, Los Angeles, California, for United Airlines.January 8, 1980.
Dames and Moore, Proposed Elevated Connecting Corridor, Los Angeles International Airport, LosAngeles, California, for Continental Airlines, October 8, 1985.
Dames and Moore, Geotechnical Investigation, Proposed Terminal 2 Renovation, Los AngelesInternational Airport, Los Angeles, California, February 21, 1986.
Dames and Moore, Geotechnical Investigation, Proposed Fuel Oil Storage Tanks and Office Building, LosAngeles International Airport, Los Angeles, California, for LAXFUEL Corporation, June 3, 1988.
Dames and Moore, Geotechnical Investigation, Proposed Renovation at Flight Services (Terminal 4), LosAngeles International Airport, Los Angeles, California, for American Airlines, March 16, 1990.
Dames and Moore, Geotechnical Investigation, Proposed Fuel Facilities Expansion, Los AngelesInternational Airport, Los Angeles, California, for LAXFUEL Corporation, February 8, 1991.
DMJM / BV, Final Supplemental Environmental Impact Report / Environmental Impact Statement City ofLos Angeles Wastewater Facilities Plan Update, Volume 1, for the City of Los Angeles and the U.S.Environmental Protection Agency, October 1990.
DMJM / BV, Final Supplemental Environmental Impact Report / Environmental Impact Statement City ofLos Angeles Wastewater Facilities Plan Update, Volume 2, for the City of Los Angeles and the U.S.Environmental Protection Agency, October 1990.
Dolan, J.F., Sieh, K., Rockwell, T.K., Yeats, R.S., Shaw, J., Suppe, J., Huftile, G.J. and Gath, E.M.,“Prospects for Larger or More Frequent Earthquakes in the Los Angeles Metropolitan Region,” Science, v.267, 1995.
Donald R. Warren Company, Report on Soils Investigation, Los Angeles International Airport, ProposedTaxiway Extension, for Pereira and Luckman, July, 1955.
Donald R. Warren Company, Los Angeles International Airport, Proposed Terminal Facilities, for the Cityof Los Angeles, Department of Airports, March 1958.
Donald R. Warren Company, Foundation Investigation, Los Angeles International Airport, ProposedTerminal Facilities, for the City of Los Angeles, Department of Airports, 1958.
Donald R. Warren Company, Additional Foundation Test Borings, Central Utilities Plant, Complex 4, LosAngeles International Airport, for the City of Los Angeles, Department of Airports, August 24, 1959.
Ecology and Environment, Report of Findings, LAX and Van Nuys Airports, Fire Drill Site Investigations,for the City of Los Angeles, Department of Airports, March 4, 1988.
Emmons, R.C., “Strike-Slip Rupture Patterns in Sand Model,” Tectonophysics, Vol. 7, 1969.
ENSR Consulting and Engineering, Remedial Investigation, Continental Airlines LAX Maintenance Facility,Los Angeles, California, for Continental Airlines Inc., July 1994.
Enviroclean West, Remedial Action Plan, Delta - LAX Facility, Los Angeles, California, for Delta AirlinesInc., December 1991.
Enviroclean West, Deep Ground Water Monitoring Well (MW-5) Report, Delta - LAX Facility, Los Angeles,California, for Delta Airlines Inc., July 1992.
Enviroclean West, Remedial Pilot Study, Delta - LAX Facility, Los Angeles, California, for Delta AirlinesInc., June 1993.
ERM-West, Report for Tank 3A, Western Airlines, Los Angeles, California, 1986.
Geoconsultants, Inc., Geological and Geophysical Survey for Ground-Water characterization, CharnockFault Evaluation, Los Angeles International Airport, Los Angeles, California, August 25, 1999.

12. Earth/Geology Technical Report
Los Angeles International Airport 45 LAX Master Plan Draft EIS/EIR
Geotechnical Consultants, Inc., Project Report – Volume 2, Preliminary Geotechnical Report, North OutfallReplacement Sewer, for City of Los Angeles, Department of Public Works, Los Angeles, California, March18,1988.
Geo-Systems, Inc., Preliminary Soils Investigation for Tentative Tract 34836, Los Angeles InternationalAirport, North Side Development, Los Angeles, California, August 11, 1983.
Graner, Rob, Graner Oil Company, Personal Communication, February 23, 1998.
Grant, L.B., Waggoner, J.T., Rockwell, T.K. and von Stein, C., Paleoseismicity of the North Branch of theNewport-Inglewood Fault Zone in Huntington Beach, California, from Cone Penetration Test Data,Seismological Society of America Bulletin, Vol. 87, 1997.
Harding Lawson Associates, Preliminary Site Investigation, LAXFUEL Corporation Bulk Storage and DayStorage Facilities, Los Angeles International Airport, Los Angeles, California, for LAXFUEL Corporation,December 21, 1989.
Harding Lawson Associates, Volume 1, Phase 2 Subsurface Investigation, LAXFUEL Corporation BulkFuel Storage Facility, Los Angeles International Airport, Los Angeles, California, for LAXFUELCorporation, January 18, 1991.
Harding Lawson Associates, Phase 3 Soil Characterization, LAXFUEL Corporation Bulk Fuel StorageFacility, Los Angeles International Airport, Los Angeles, California, for LAXFUEL Corporation, January 11,1993.
Harding Lawson Associates, Soil and Groundwater Investigation, LAXFUEL Corporation Day Fuel StorageFacilities, Los Angeles International Airport, Los Angeles, California, for LAXFUEL Corporation, March 25,1994.
Hart, Earl and Bryant, William A., Fault-Rupture Hazard Zones in California, Alquist-Priolo EarthquakeFault Zoning Act with Index to Earthquake Fault Zone Maps, Special Publication 42, 1997.
Haukkson, E., “Earthquakes, Faulting and Stress in the Los Angeles Basin,” Journal of GeophysicalResearch, v. 95, no. B10, 1990.
Hekimian and Associates Inc., Site Assessment Report, for Continental Airlines Boiler Auxiliary Fuel TankNo. 6, for Continental Airlines Inc., August 10, 1989.
Hekimian and Associates Inc., Addendum to Site Assessment Report for Continental Airlines BoilerAuxiliary Fuel Tank No. 6, for Continental Airlines Inc., December 28, 1989.
Houston, J.R., Type 19 Flood Insurance Study: Tsunami Predictions For Southern California: US ArmyCorps of Engineers Waterways Experiment Station, Technical Report HL-79-2, 1980.
IT Corporation, Report of Phase 2 Site Assessment, Continental Maintenance Base, 7300 World WayWest, Los Angeles, California, for Continental Airlines, April 1991.
Jennings, C.W., Fault Activity Map of California and Adjacent Areas, CDMG Geologic Data Map No. 6.,1994.
Johnson, M.L., Dolan, J.F. and Meigs, A., “Geomorphic and Structural Analysis of the Stage 5e MarineTerrace, Malibu, California, Suggests that the Santa Monica Mountains Blind Thrust Fault is no Longer aMajor Seismic Hazard,” Eos Transactions, Fall Meeting Abstract Supplement, 1996.
Law Crandall, Inc., Report of Geotechnical Investigation, Proposed New Air Traffic Control Tower andAdministrative Base Building, Los Angeles International Airport, for the Federal Aviation Administration,June 6, 1992.
Lawrence Livermore National Laboratory, U.S. Department of Energy, ATCI / Oil and Gas DataInfrastructure Project Database, Available: http://wildcat.llnl.gov [May 5, 2000].
Leroy Crandall and Associates, Report of Preliminary Soil Investigation Proposed Underground VehicularTunnel, Los Angeles International Airport, Los Angeles, California, for the City of Los Angeles, Departmentof Airports, January 8, 1968.
Leroy Crandall and Associates, Report of Preliminary Soil Investigation, Proposed West Terminal, LosAngeles International Airport, Los Angeles, California, for the City of Los Angeles, November 27, 1968.

12. Earth/Geology Technical Report
Los Angeles International Airport 46 LAX Master Plan Draft EIS/EIR
Leroy Crandall and Associates, Report of Foundation Investigation, Proposed Tunnel, Phase OneConstruction, Road from West Terminal To Manchester, Los Angeles International Airport, Los Angeles,California, for the City of Los Angeles, Department of Airports, December 21, 1968.
Leroy Crandall and Associates, Report of Foundation Investigation, Proposed World Way West Overpassat Pershing Drive, Los Angeles International Airport, Los Angeles, California, for the City of Los Angeles,Department of Airports, February 21, 1969.
Leroy Crandall and Associates, Report of Foundation Investigation, Proposed Hilton Hotel - LAX,Vicksburg Avenue Between Century Boulevard and 98th Street, for the Hilton Hotels Corporation, August19, 1969.
Leroy Crandall and Associates, Geotechnical Data Review and Interpretation North Outfall ReplacementSewer, Book 1 of 2, for the City of Los Angeles, Department of Public Works, April 1989.
Leroy Crandall and Associates, Geotechnical Data Review and Interpretation North Outfall ReplacementSewer, Book 2 of 2, for the City of Los Angeles, Department of Public Works, April 1989.
McCulloch, D.S., Evaluating Tsunami Potential. In Evaluating Earthquake Hazards in the Los AngelesRegion, USGS Prof. Paper 1360, 1985.
McLaren Environmental Engineering, Site Investigation and Evaluation of Remedial Measures Report,Howard Hughes Properties Plant Site, Los Angles, California, May 8, 1987.
McLaren Environmental Engineering, Soil Investigation at Terminal One Fuels Corporation (TOFCO), Bulkand Day Fuel Storage Facilities, Los Angeles International Airport, California, June 1, 1989.
Moore and Taber, Geotechnical Investigation, Second Level Roadway Project, Los Angeles InternationalAirport, February 20, 1980.
Moore and Taber, Los Angeles International Airport, Second Level Roadway Project, for the City of LosAngeles, Department of Airports, February 20, 1980.
Mualchin, L., California Department of Transportation, Engineering Service Center, Office of EarthquakeEngineering, Caltrans California Seismic Hazard Map, 1996.
Ninyo and Moore, Monitoring Well Installation Observation, Work Performed By T A. Gleason Associates,Inc., Los Angeles International Airport, Skyway Drive, Los Angeles, California, January 2, 1991.
Ninyo and Moore, Groundwater Assessment Terminal One - Monitoring Well AM, Los AngelesInternational Airport, World Way, Los Angeles, California, October 12, 1992.
Ninyo and Moore, Groundwater Monitoring Well Observation Summary, September 1994, Los AngelesInternational Airport, Los Angeles, California, October 14, 1994.
Petersen, M.D. and Wesnousky, S.G., “Fault Slip Rates and Earthquake Histories for Active Faults inSouthern California,” Bulletin of the Seismological Society of America, v. 84, no. 5, 1994.
Poland, J.F., Garrett, A. A., and Sinott, A.,. Geology, Hydrology and Chemical Character of GroundWaters in the Torrance-Santa Monica Area, California, U.S. Geological Survey Water-Supply Paper 1461,1959.
Ponti, D.J. and Lajoie, K.R., “Chronostratigraphic Implications for Tectonic Deformation of Palos Verdesand Signal Hills, Los Angeles Basin, California,” The Regressive Pleistocene Shoreline, Coastal SouthernCalifornia: South Coast Geological Society, Annual Field Trip Guidebook No. 20, 1992.
R. V. Labarre, Report on Foundation Investigations, Proposed Administration Buildings, Los AngelesMunicipal Airport, for the City of Los Angeles, July 30, 1941.
Ralph Stone and Company, Inc., Geotechnical and Geologic Engineering Investigation and Report forProposed Parking Structure #6 at Los Angeles International Airport, December 20, 1991.
Rawlings Enterprises, Inc., Los Angeles International Airport, Initial Study, Delta Airlines Air Cargo Facility,Cargo City Complex, for the City of Los Angeles, Department of Airports, December 1990.
Rubin, C.M., Lindvall, S.C. and Rockwell, T.K., “Evidence for Large Earthquakes in Metropolitan LosAngeles,” Science, Vol. 281, 1998.
SCS Engineers, Site Investigation for Marriott In-Flite Services, 6901 W. Imperial Highway, Los Angeles,California, for Marriott In-Flite Services, October 1989.
12. Earth/Geology Technical Report
Los Angeles International Airport 47 LAX Master Plan Draft EIS/EIR
Schaefer Dixon Associates, Specifications for Hyperion Full Secondary (HFS) C 117 Secondary Facilities -Phase 2, for the City of Los Angeles, September 20, 1988.
Seed, H.B., Tokimatsu, K., Harder, L. F. and Chung, R.M., "Influence of SPT Procedures in SoilLiquefaction Resistance Evaluations," Journal, Geotechnical Engineering Division, ASCE, Vol III, No. 12,December, 1985.
Shaw, J.H. and Shearer, P.M., “An Elusive Blind-Thrust Fault Beneath Metropolitan Los Angeles,”Science, Vol. 283, 1999.
Smith, T.C., California Department of Conservation, Division of Mines and Geology, Fault EvaluationReport FER-71 (Overland Avenue, Charnock and Nearby Faults), 1978.
Southern California Earthquake Center (SCEC), Faults in California, Los Angeles Region, Available:http://www.scecdc.scec.org/lafault.html [May 5, 2000].
T. A. Gleason Associates, Report Pilot Vapor Extraction System, Study and Installation of VaporExtraction Wells, December 6, 1989.
T. A. Gleason Associates, Phase 2 On-Site Groundwater Assessment, for Allied-Signal AerospaceCompany, November 6, 1990.
Terra Vac., Site Assessment Report, Tank Cluster B, Hertz LAX Customer Service Building, 9029 AirportDrive, Los Angeles, California, for the Hertz Corporation, February 17, 1993.
Tokimatsu, Kohji and Seed, H. Bolton, “Evaluation of Settlement in Sands due to Earthquake Shaking,”Journal of Geotechnical Engineering, Vol. 113, No. 8, August 1987.
U.S. Agricultural Consultants and Laboratories, Soils Investigation, Los Angeles International Airport, forthe City of Los Angeles, Department of Airports, March, 16, 1961.
U.S. Army Corps of Engineers, Report on Airfield Pavement Evaluation for Los Angeles Airport (MinesField), Los Angeles, California, for the City of Los Angeles, May 1944.
U.S. Geological Survey, In-Situ Measurements of Seismic Velocity at 22 Locations in the Los Angeles,California Region, USGS Open File Report 82-833, 1982.
Van Dorn, “Instrumentation and Observations,” Tsunamis Proceedings of the National ScienceFoundation Workshop, 1979.
Walls, C., Rockwell, T., Mueller, K., Bock, Y., Williams, S., Pfanner, J., Dolan, J., and Fang, P., “EscapeTectonics in the Los Angeles Metropolitan Region and Implications for Seismic Risk,” Nature, Vol. 394,1998.
Wehmiller, J.F., Lajoie, K.R., Kvenvolden, K.A., Peterson, E., Belknap, D.F., Kennedy, G.L., Addicott,W.D., Vedder, J.G., and Wright, R.W., Correlation and Chronology of the Pacific Coast Marine TerraceDeposits of the Continental United States by Fossil Amino Acid Stereochemistry – Technique Evaluation,Relative Age, Kinetic Model Ages and Geologic Implications, U.S. Geological Survey Open-File Report 77-680, 1977.
Wells, D.L. and Coppersmith, K.J.,. “New Empirical Relationships Among Magnitude, Rupture Length,Rupture Area, and Surface displacement,” Seismological Society of America Bulletin, Vol. 84, 1994.
Woodward-Clyde Consultants, Revised Draft Environmental Impact Report, Chevron Refinery – ElSegundo, Reformulated Gasoline Projects, Volume 1, December 16, 1994.
Ziony, J.I., and Jones, L.M., California, Department of the Interior, U.S. Geological Survey, Map ShowingLate Quaternary Faults and 1978-84 Seismicity of the Los Angeles Region, 1989.
12. Earth/Geology Technical Report
Los Angeles International Airport 48 LAX Master Plan Draft EIS/EIR
This Page Intentionally Left Blank