1.2 coca / cocaine market
TRANSCRIPT
1.2 Coca / cocaine market
63
1.2.1 Summary trend overview
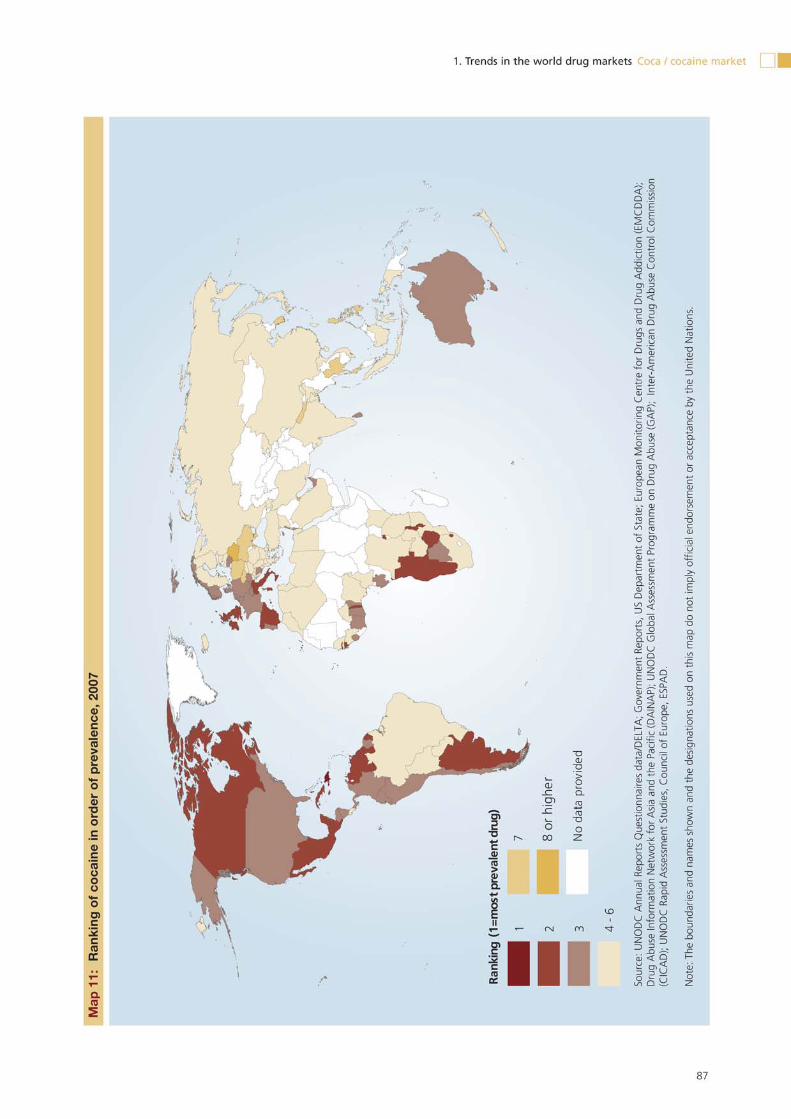
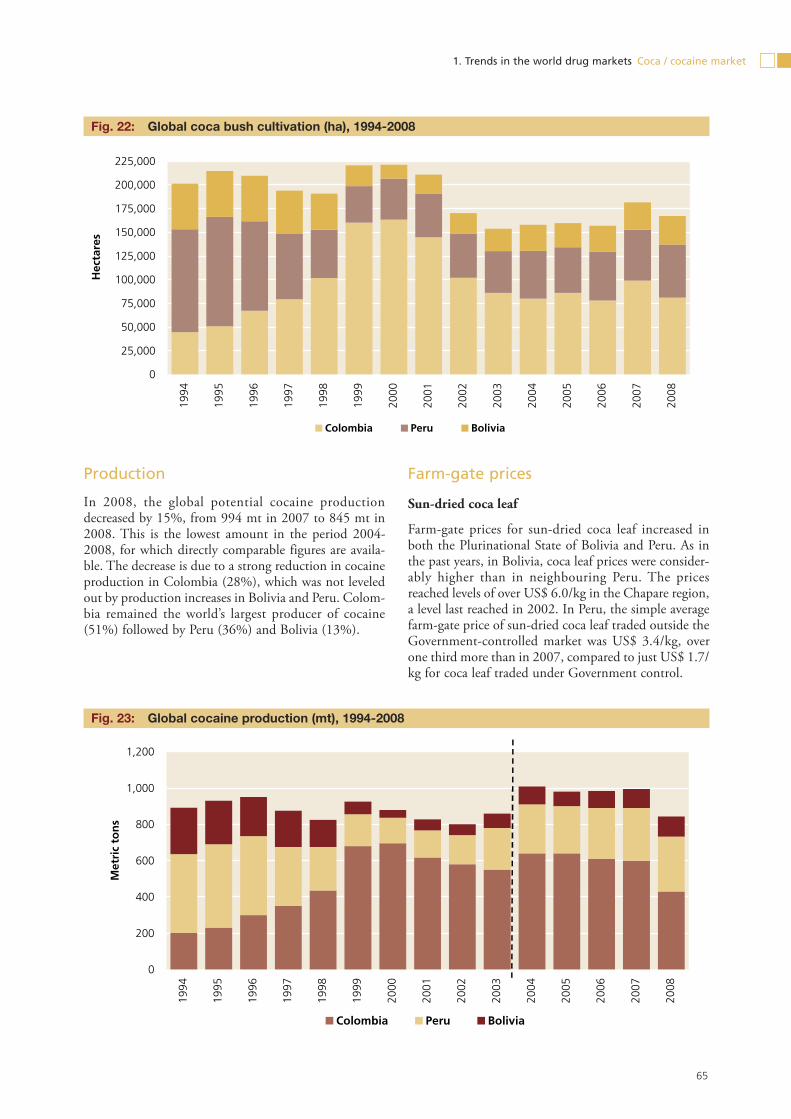
In 2008, a significant decrease in Colombia, the world’s largest cultivator of coca bush, brought the total area under coca cultivation down by some 8% to 167,600 ha. Total cultivation is close to the average level since 2002, and well below the levels reached in the 1990s. Similarly, the estimated global cocaine production also decreased in 2008, due to a strong reduction in Colom-bia. The Plurinational State of Bolivia and Peru both registered small increases in cultivation and produc-tion.
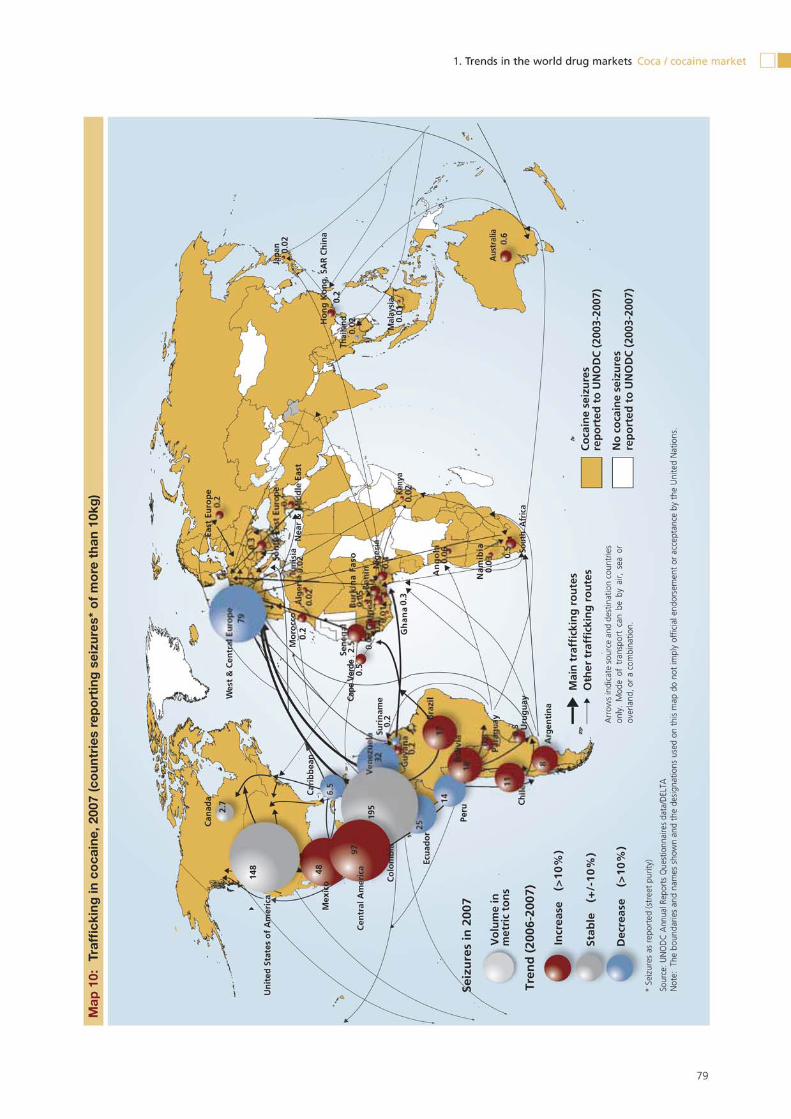
Compared to the record high in 2005, cocaine seizures decreased in 2007. The Americas account for the vast majority of the world’s cocaine seizures, although a sig-nificant decline in trafficking towards North America, the world's largest cocaine consumer market, was reported in 2008. This decline was reflected in rapidly rising prices and falling purity levels.
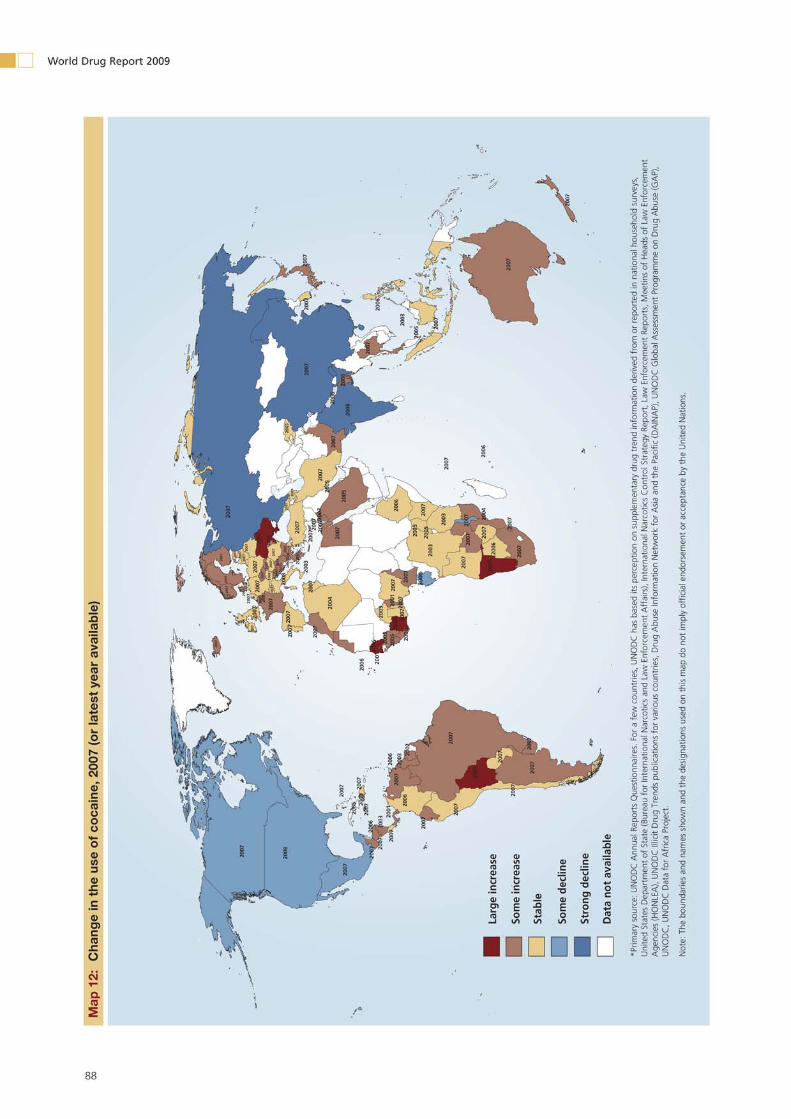
North America also reported significant declines in cocaine use, notably from the USA. Following strong increases in recent years, a number of surveys in West European countries – including Spain - showed the first signs of a stabilization in 2008, whereas cocaine use still appears to be increasing in South America. The total number of people who used cocaine at least once in 2007 worldwide is estimated to range between 16 and 21 million.
1.2.2 Production
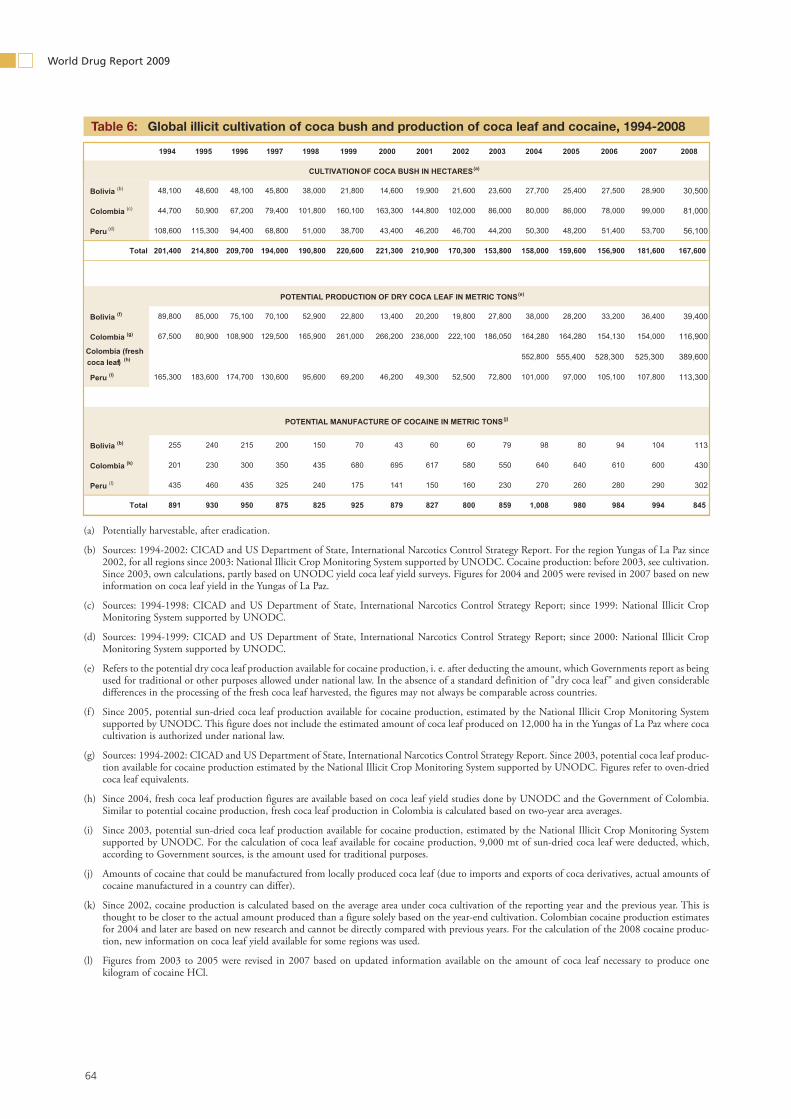
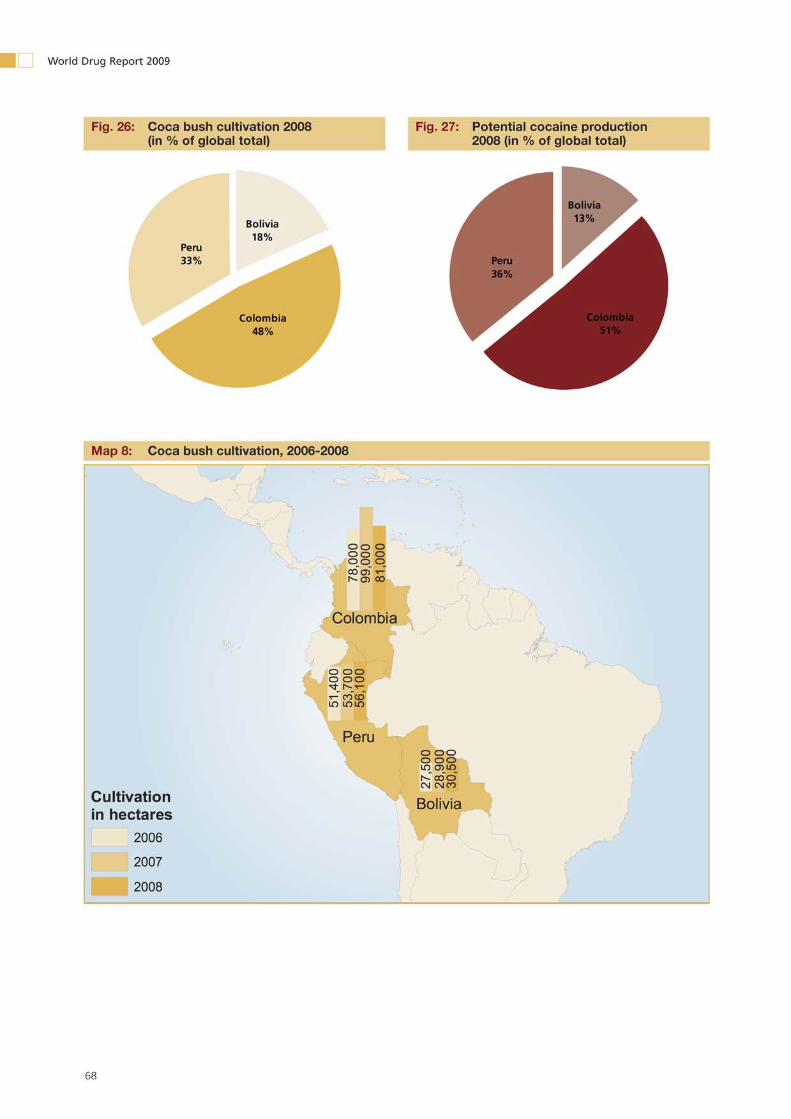
CultivationIn 2008, the total area under coca cultivation decreased by 8% due to a significant reduction in Colombia (-18%), which was not offset by small increases in the Plurinational State of Bolivia (6%) and Peru (4%). The total area under coca cultivation decreased to 167,600 ha, which is well below the level reached in the 1990s. In spite of this decrease, Colombia remained the world’s largest coca bush-cultivating country with 81,000 ha, followed by Peru (56,100 ha) and Bolivia (30,500 ha).
Most of the decrease of 18,000 ha in Colombia hap-pened in the regions of Meta-Guaviare and Putumayo-Caquetá. However, a significant increase was observed in the Pacific region as well as in some smaller cultivation regions.
In 2008, the area under coca cultivation in Peru increased by 4% to 56,100 ha, the third, albeit relatively small, consecutive yearly increase. Peru remains the world’s second largest coca bush-cultivating country.
The area under coca cultivation in the Plurinational State of Bolivia in 2008 increased by 6% to 30,500. Like in Peru, this was the third consecutive yearly increase. An expansion of the area under coca cultivation was observed in both large cultivation regions, the Yungas of La Paz and Chapare.
Although sizeable coca cultivation does not exist outside Bolivia, Peru and Colombia, eradication reports from Governments and media reports indicate that small-scale coca cultivation took place in other countries in the region in 2008.
64
World Drug Report 2009
Global illicit cultivation of coca bush and production of coca leaf and cocaine, 1994-2008Table 6:
(a) Potentially harvestable, after eradication.
(b) Sources: 1994-2002: CICAD and US Department of State, International Narcotics Control Strategy Report. For the region Yungas of La Paz since 2002, for all regions since 2003: National Illicit Crop Monitoring System supported by UNODC. Cocaine production: before 2003, see cultivation. Since 2003, own calculations, partly based on UNODC yield coca leaf yield surveys. Figures for 2004 and 2005 were revised in 2007 based on new information on coca leaf yield in the Yungas of La Paz.
(c) Sources: 1994-1998: CICAD and US Department of State, International Narcotics Control Strategy Report; since 1999: National Illicit Crop Monitoring System supported by UNODC.
(d) Sources: 1994-1999: CICAD and US Department of State, International Narcotics Control Strategy Report; since 2000: National Illicit Crop Monitoring System supported by UNODC.
(e) Refers to the potential dry coca leaf production available for cocaine production, i. e. after deducting the amount, which Governments report as being used for traditional or other purposes allowed under national law. In the absence of a standard definition of "dry coca leaf" and given considerable differences in the processing of the fresh coca leaf harvested, the figures may not always be comparable across countries.
(f ) Since 2005, potential sun-dried coca leaf production available for cocaine production, estimated by the National Illicit Crop Monitoring System supported by UNODC. This figure does not include the estimated amount of coca leaf produced on 12,000 ha in the Yungas of La Paz where coca cultivation is authorized under national law.
(g) Sources: 1994-2002: CICAD and US Department of State, International Narcotics Control Strategy Report. Since 2003, potential coca leaf produc-tion available for cocaine production estimated by the National Illicit Crop Monitoring System supported by UNODC. Figures refer to oven-dried coca leaf equivalents.
(h) Since 2004, fresh coca leaf production figures are available based on coca leaf yield studies done by UNODC and the Government of Colombia. Similar to potential cocaine production, fresh coca leaf production in Colombia is calculated based on two-year area averages.
(i) Since 2003, potential sun-dried coca leaf production available for cocaine production, estimated by the National Illicit Crop Monitoring System supported by UNODC. For the calculation of coca leaf available for cocaine production, 9,000 mt of sun-dried coca leaf were deducted, which, according to Government sources, is the amount used for traditional purposes.
(j) Amounts of cocaine that could be manufactured from locally produced coca leaf (due to imports and exports of coca derivatives, actual amounts of cocaine manufactured in a country can differ).
(k) Since 2002, cocaine production is calculated based on the average area under coca cultivation of the reporting year and the previous year. This is thought to be closer to the actual amount produced than a figure solely based on the year-end cultivation. Colombian cocaine production estimates for 2004 and later are based on new research and cannot be directly compared with previous years. For the calculation of the 2008 cocaine produc-tion, new information on coca leaf yield available for some regions was used.
(l) Figures from 2003 to 2005 were revised in 2007 based on updated information available on the amount of coca leaf necessary to produce one kilogram of cocaine HCl.
1994 1995 1996 1997 1998 1999 2000 2001 2002 2003 2004 2005 2006 2007 2008
CULTIVATION OF COCA BUSH IN HECTARES (a)
Bolivia (b) 48,100 48,600 48,100 45,800 38,000 21,800 14,600 19,900 21,600 23,600 27,700 25,400 27,500 28,900 30,500
Colombia (c) 44,700 50,900 67,200 79,400 101,800 160,100 163,300 144,800 102,000 86,000 80,000 86,000 78,000 99,000 81,000
Peru (d) 108,600 115,300 94,400 68,800 51,000 38,700 43,400 46,200 46,700 44,200 50,300 48,200 51,400 53,700 56,100
Total 201,400 214,800 209,700 194,000 190,800 220,600 221,300 210,900 170,300 153,800 158,000 159,600 156,900 181,600 167,600
POTENTIAL PRODUCTION OF DRY COCA LEAF IN METRIC TONS (e)
Bolivia (f) 89,800 85,000 75,100 70,100 52,900 22,800 13,400 20,200 19,800 27,800 38,000 28,200 33,200 36,400 39,400
Colombia (g) 67,500 80,900 108,900 129,500 165,900 261,000 266,200 236,000 222,100 186,050 164,280 164,280 154,130 154,000 116,900
Colombia (fresh coca leaf) (h) 552,800 555,400 528,300 525,300 389,600
Peru (i) 165,300 183,600 174,700 130,600 95,600 69,200 46,200 49,300 52,500 72,800 101,000 97,000 105,100 107,800 113,300
POTENTIAL MANUFACTURE OF COCAINE IN METRIC TONS (j)
Bolivia (b) 255 240 215 200 150 70 43 60 60 79 98 80 94 104 113
Colombia (k) 201 230 300 350 435 680 695 617 580 550 640 640 610 600 430
Peru (l) 435 460 435 325 240 175 141 150 160 230 270 260 280 290 302
Total 891 930 950 875 825 925 879 827 800 859 1,008 980 984 994 845
65
1. Trends in the world drug markets Coca / cocaine market
Production
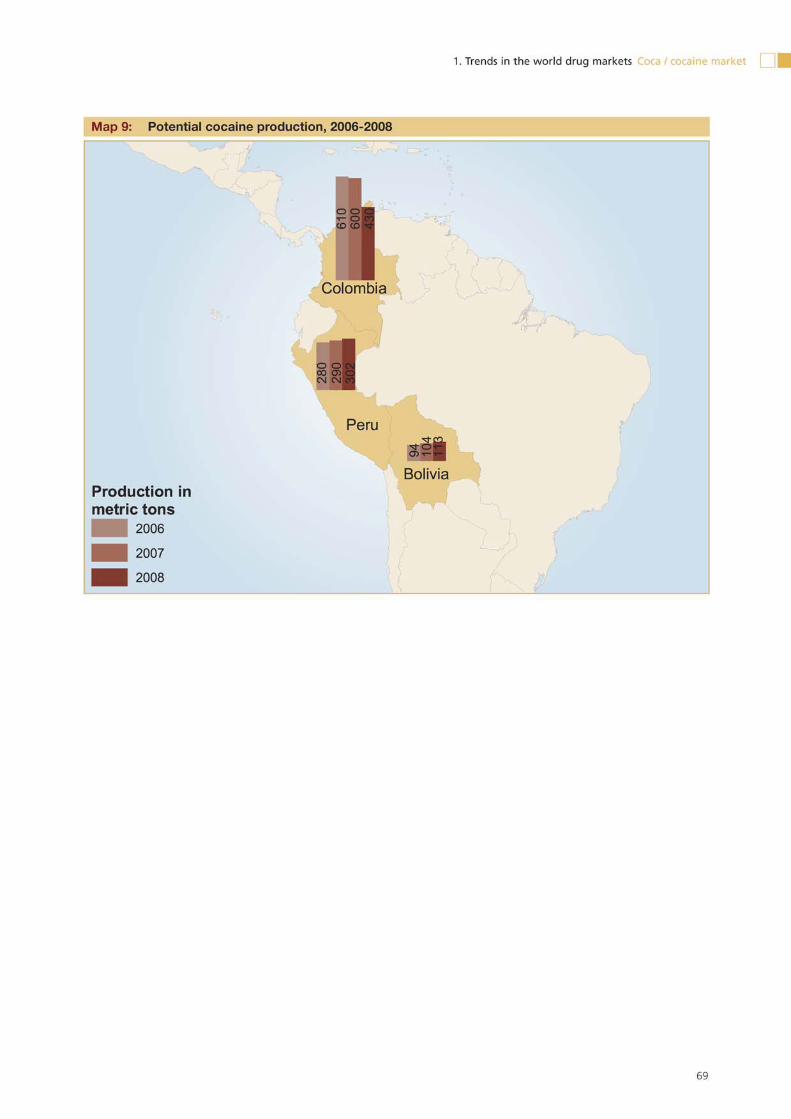
In 2008, the global potential cocaine production decreased by 15%, from 994 mt in 2007 to 845 mt in 2008. This is the lowest amount in the period 2004-2008, for which directly comparable figures are availa-ble. The decrease is due to a strong reduction in cocaine production in Colombia (28%), which was not leveled out by production increases in Bolivia and Peru. Colom-bia remained the world’s largest producer of cocaine (51%) followed by Peru (36%) and Bolivia (13%).
Farm-gate prices
Sun-dried coca leaf
Farm-gate prices for sun-dried coca leaf increased in both the Plurinational State of Bolivia and Peru. As in the past years, in Bolivia, coca leaf prices were consider-ably higher than in neighbouring Peru. The prices reached levels of over US$ 6.0/kg in the Chapare region, a level last reached in 2002. In Peru, the simple average farm-gate price of sun-dried coca leaf traded outside the Government-controlled market was US$ 3.4/kg, over one third more than in 2007, compared to just US$ 1.7/kg for coca leaf traded under Government control.
Global coca bush cultivation (ha), 1994-2008Fig. 22:
Global cocaine production (mt), 1994-2008Fig. 23:
0
25,000
50,000
75,000
100,000
125,000
150,000
175,000
200,000
225,000
1994
1995
1996
1997
1998
1999
2000
2001
2002
2003
2004
2005
2006
2007
2008
Hec
tare
s
Colombia Peru Bolivia
0
200
400
600
800
1,000
1,200
1994
1995
1996
1997
1998
1999
2000
2001
2002
2003
2004
2005
2006
2007
2008
Met
ric
ton
s
Colombia Peru Bolivia

66
World Drug Report 2009
1994 1995 1996 1997 1998 1999 2000 2001 2002 2003 2004 2005 2006 2007 2008
Bolivia manual 1,100 5,493 7,512 7,000 11,620 15,353 7,653 9,395 11,839 10,089 8,437 6,073 5,070 6,269 5,484
Colombiamanual 1,033 1,487 4,057 2,262 3,126 1,046 3,495 1,745 2,762 4,219 6,234 31,980 43,051 66,805 95,634
aerial spraying 3,871 23,915 18,519 41,861 66,029 43,112 58,073 94,153 130,364 132,817 136,552 138,775 172,026 153,134 133,496
Peru manual 1,259 3,462 7,834 14,733 6,208 6,436 7,134 11,312 10,399 12,237 12,688 12,072 10,143
Ecuador manual 4 18 9 36 10
Venezuela manual 44 181 18 0 0 0 38 47 0 0 118 40 0 0 0
Reported eradication of coca bush (ha), 1994-2008Table 7:
Sources: Bolivia (Plurinational State of)/Colombia/Peru/Venezuela (Bolivarian Republic of): as reported by the respective Government. Ecuador: Comisión Interamericana para el Control del Abuso de Drogas (CICAD); US Department of State: International Narcotics Control Strategy Report.
Annual coca bush cultivation and cocaine production in main producing countries, Fig. 24: 1994-2008
)tm( 8002 - 4991 ,NOITCUDORP ENIACOC LAITNETOP - AIBMOLOC)ah( 8002 - 4991 ,NOITAVITLUC HSUB ACOC - AIBMOLOC
)tm( 8002 - 4991 ,NOITCUDORP ENIACOC LAITNETOP - UREP)ah( 8002 - 4991 ,NOITAVITLUC HSUB ACOC - UREP
)tm( 8002 - 4991 ,NOITCUDORP ENIACOC LAITNETOP - AIVILOB)ah( 8002 - 4991 ,NOITAVITLUC HSUB ACOC - AIVILOB
0
25,000
50,000
75,000
100,000
125,000
150,000
175,000
94 95 96 97 98 99 00 01 02 03 04 05 06 07 08
0
25,000
50,000
75,000
100,000
125,000
150,000
175,000
94 95 96 97 98 99 00 01 02 03 04 05 06 07 08
0
25,000
50,000
75,000
100,000
125,000
150,000
175,000
94 95 96 97 98 99 00 01 02 03 04 05 06 07 08
0
100
200
300
400
500
600
700
94 95 96 97 98 99 00 01 02 03 04 05 06 07 08
0
100
200
300
400
500
600
700
94 95 96 97 98 99 00 01 02 03 04 05 06 07 08
0
100
200
300
400
500
600
700
94 95 96 97 98 99 00 01 02 03 04 05 06 07 08
Estimates for Bolivia since 2003, for Colombia since 1999 and for Peru since 2000 come from national monitoring systems establihed by the respective Governments with the support of UNODC. Due to the change ofmethodology, these figures are not directly comparable with data from previous years. Colombian cocaine production estimates for 2004 and later are based on new research cannot be directly compared with previous years.For detailed source information, see Table: Global illicit cultivation of coca bush and production of coca leaf and cocaine.

67
1. Trends in the world drug markets Coca / cocaine market
Fresh leaf
In Colombia, coca leaf is traded as fresh leaf, and the average per kilo price of fresh coca leaf decreased from COP 2,400,000/kg or US$ 1.2/kg in 2007 to COP 2,200,000/kg or US$ 1.1/kg in 2008. Converted into sun-dried coca leaf equivalents this would correspond to US$ 2.6/kg.
Coca paste and cocaine
Prices for coca paste and cocaine in different countries may not be directly comparable as little is known about their quality and composition. In Peru, the average farm-gate price of coca paste increased by 21% from US$ 600/kg in 2007 to US$ 723/kg in 2008. In Colom-bia, however, coca paste prices decreased in Colombian peso terms by 4% but increased slightly (by 2%) in US$ terms, from US$ 943/kg to US$ 963/kg as the Colom-bian peso gained strength against the US dollar. Whole-sale prices for cocaine HCl increased in both Colombia (7%, in main cities) and Peru (10%, in producing regions) in US dollar terms.
As the availability of farm-gate prices differs from region to region and over the course of a year, small changes should be interpreted with caution.
Clandestine laboratories and precursors
In 2007, Governments reported the detection of 7,225 clandestine coca processing laboratories, compared to 7,060 laboratories reported for 2006.1 Over 99% of the coca processing laboratories were located in the three coca cultivating countries. Bolivia and Peru also destroyed large numbers of coca maceration pits, which are typi-
1 The 2006 figure was updated from originally 6,390 laboratories based on additional reports received from Governments.
cally found in coca cultivation regions to produce coca paste.2 In 2007, a small number of cocaine laboratories was reported from other Latin American countries such as Chile (5), Ecuador (1) and Mexico (1). In previous years, similarly small numbers of laboratories were reported from countries such as Argentina, Brazil and the Bolivarian Republic of Venezuela. Outside Latin America, the highest number of laboratories detected was reported by Spain (18), followed by the USA (3).
Potassium permanganate is believed to be essential for cocaine manufacturing and large amounts are required each year in coca producing countries. In 2007, 15 countries reported seizures of potassium permanganate totaling 153.3 mt, of which Colombia seized 144 mt. The Colombian authorities also dismantled 4 clandes-tine potassium permanganate laboratories, from which they seized almost 45 mt of substance, which may sug-gest that it is becoming more difficult to import or divert potassium permanganate from the licit to the illicit market. Peru reported the seizure of 1,5 mt of potassium permanganate in 2007. The large amount of seizures and the detection of potassium permanganate laboratories in coca producing countries may indicate that traffickers have found ways to circumvent interna-tional control mechanisms, for example, by diverting potassium permanganate from domestic trade, by smug-gling or by clandestine manufacturing.3
2 An extract of the leaves of the coca bush. Purification of coca paste yields cocaine.
3 International Narcotics Control Board, E/INCB/2008/4.
Monthly prices for coca paste in Peru and Colombia, 2002-2008Fig. 25:
Sources: National monitoring system in Colombia and Peru supported by UNODC.
0
250
500
750
1,000
1,250
Jan-02 Jan-03 Jan-04 Jan-05 Jan-06 Jan-07 Jan-08
US$
/kg
0
500
1,000
1,500
2,000
2,500
'000
CO
P/kg
Peru (US$/kg) Colombia (US$/kg) Colombia (COP/kg)
1.2.3 Trafficking
70
World Drug Report 2009
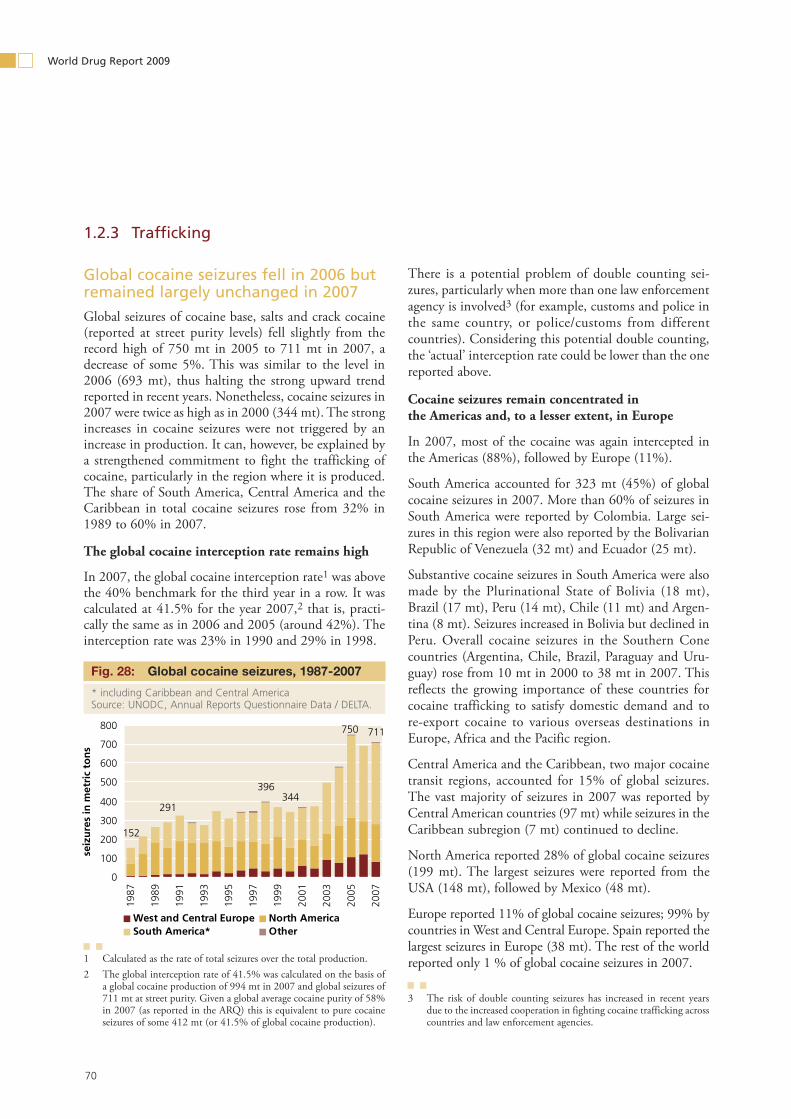
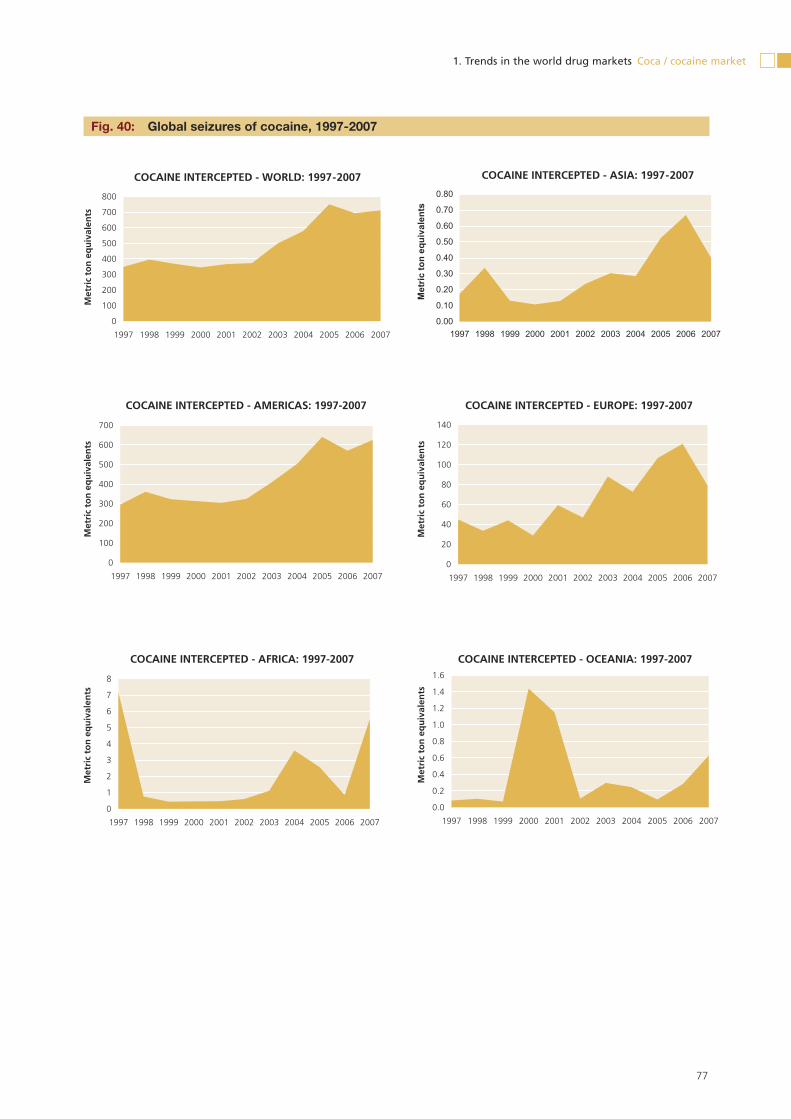
Global cocaine seizures fell in 2006 but remained largely unchanged in 2007 Global seizures of cocaine base, salts and crack cocaine (reported at street purity levels) fell slightly from the record high of 750 mt in 2005 to 711 mt in 2007, a decrease of some 5%. This was similar to the level in 2006 (693 mt), thus halting the strong upward trend reported in recent years. Nonetheless, cocaine seizures in 2007 were twice as high as in 2000 (344 mt). The strong increases in cocaine seizures were not triggered by an increase in production. It can, however, be explained by a strengthened commitment to fight the trafficking of cocaine, particularly in the region where it is produced. The share of South America, Central America and the Caribbean in total cocaine seizures rose from 32% in 1989 to 60% in 2007.
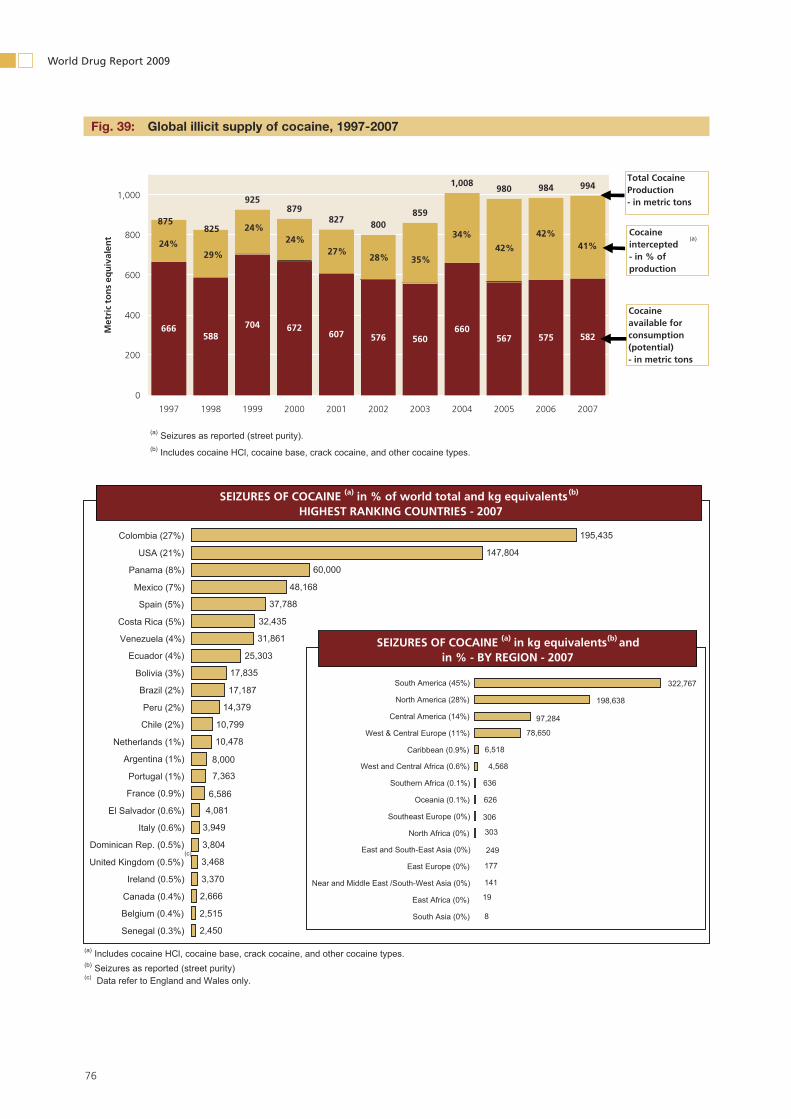
The global cocaine interception rate remains high
In 2007, the global cocaine interception rate1 was above the 40% benchmark for the third year in a row. It was calculated at 41.5% for the year 2007,2 that is, practi-cally the same as in 2006 and 2005 (around 42%). The interception rate was 23% in 1990 and 29% in 1998.
1 Calculated as the rate of total seizures over the total production.2 The global interception rate of 41.5% was calculated on the basis of
a global cocaine production of 994 mt in 2007 and global seizures of 711 mt at street purity. Given a global average cocaine purity of 58% in 2007 (as reported in the ARQ) this is equivalent to pure cocaine seizures of some 412 mt (or 41.5% of global cocaine production).
There is a potential problem of double counting sei-zures, particularly when more than one law enforcement agency is involved3 (for example, customs and police in the same country, or police/customs from different countries). Considering this potential double counting, the ‘actual’ interception rate could be lower than the one reported above.
Cocaine seizures remain concentrated in the Americas and, to a lesser extent, in Europe
In 2007, most of the cocaine was again intercepted in the Americas (88%), followed by Europe (11%).
South America accounted for 323 mt (45%) of global cocaine seizures in 2007. More than 60% of seizures in South America were reported by Colombia. Large sei-zures in this region were also reported by the Bolivarian Republic of Venezuela (32 mt) and Ecuador (25 mt).
Substantive cocaine seizures in South America were also made by the Plurinational State of Bolivia (18 mt), Brazil (17 mt), Peru (14 mt), Chile (11 mt) and Argen-tina (8 mt). Seizures increased in Bolivia but declined in Peru. Overall cocaine seizures in the Southern Cone countries (Argentina, Chile, Brazil, Paraguay and Uru-guay) rose from 10 mt in 2000 to 38 mt in 2007. This reflects the growing importance of these countries for cocaine trafficking to satisfy domestic demand and to re-export cocaine to various overseas destinations in Europe, Africa and the Pacific region.
Central America and the Caribbean, two major cocaine transit regions, accounted for 15% of global seizures. The vast majority of seizures in 2007 was reported by Central American countries (97 mt) while seizures in the Caribbean subregion (7 mt) continued to decline.
North America reported 28% of global cocaine seizures (199 mt). The largest seizures were reported from the USA (148 mt), followed by Mexico (48 mt).
Europe reported 11% of global cocaine seizures; 99% by countries in West and Central Europe. Spain reported the largest seizures in Europe (38 mt). The rest of the world reported only 1 % of global cocaine seizures in 2007.
3 The risk of double counting seizures has increased in recent years due to the increased cooperation in fighting cocaine trafficking across countries and law enforcement agencies.
Global cocaine seizures, 1987-2007Fig. 28:
* including Caribbean and Central America Source: UNODC, Annual Reports Questionnaire Data / DELTA.
152
750 711
344396
291
0
100
200
300
400
500
600
700
800
1987
1989
1991
1993
1995
1997
1999
2001
2003
2005
2007
seiz
ure
s in
met
ric
ton
s
West and Central Europe North AmericaSouth America* Other
71
1. Trends in the world drug markets Coca / cocaine market
Declining trafficking of cocaine towards North America, the world’s largest cocaine market
Cocaine trafficked to North America typically originates in Colombia and reaches the USA through Mexico, either directly by speed boats or via countries such as the Bolivarian Republic of Venezuela, Ecuador and Panama. Most of the cocaine (close to 70%) is estimated to be transported via the Eastern-Pacific route towards Mexico and some 20% via the Western Caribbean route.4
North America, notably the USA, reported some of the most striking declines of cocaine trafficking in 2007. This trend became even more pronounced in 2008. On average, federal US seizures fell from more than 13 mt per quarter in 2006 to less than 10 mt per quarter over the first six months of 2008. A strong decline of 40% was observed at the US-Mexican border.5
In parallel, Mexico saw a major decline of cocaine sei-zures from 48 mt in 2007 to 19 mt in 2008; a reduction of some 60%. Both Mexico and the US reported that this decline was linked to a strong decrease in cocaine trafficking.6 There are no indications that the reductions are related to less enforcement efforts.7
A number of indicators showed that cocaine availability decreased in the USA in 2007 and 2008.8 For one, law enforcement agencies and interagency analysis coordi-nated by the National Drug Intelligence Center indi-cated that the large US cocaine markets experienced a substantial cocaine shortage in 20079 and during the the first quarter of 2008. Secondly, the number of emer-gency department visits related to cocaine abuse declined in the great majority of the cities in the first quarter of 2008, compared to 2006.10 Thirdly, the workplace test-ing results revealed a strong decline in the use of cocaine in 2008.11 Finally, the ‘Monitoring the Future’ high
4 National Drug Intelligence Center, National Drug Threat Assessment 2009, December 2008.
5 Ibid. 6 UNODC, Annual Reports Questionnaire Data.7 The Mexican Government substantially increased supports for its
security forces and the justice sector in 2008. This resulted, inter alia, in the arrest of a number of drug kingpins of the various Mexi-can drug cartels (Source: US State Department, 2009 International Narcotics Control Strategy Report, March 2009). Increased efforts were also reported by the United States which continuously increased its federal drug control budget for domestic law enforcement over the 2000-2008 period from $2 bn to $3.8 bn and for interdiction from $1.9 bn to $3.2 bn; the overall federal drug control budget rose from $9.6 to $13.7 bn. (Source: ONDCP, National Drug Control Strategy FY 2009 Budget Summary).
8 Cocaine shortages were most evident in the Great Lakes, New Eng-land and the Mid-Atlantic regions, as well as in the cities of Atlanta, Los Angeles, Phoenix and San Francisco.
9 ONDCP, National Drug Control Strategy, 2008 Annual Report, Febru-ary 2008.
10 National Drug Intelligence Centre, National Drug Threat Assessment 2009, December 2008.
11 Ibid.
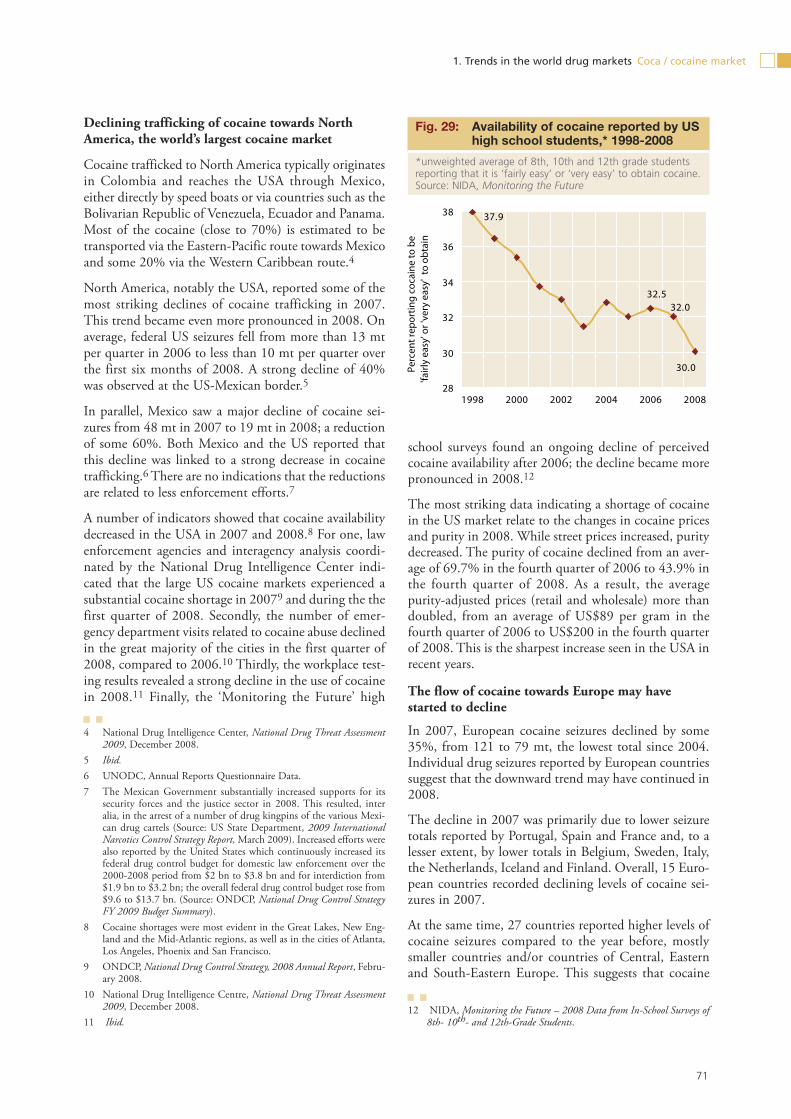
school surveys found an ongoing decline of perceived cocaine availability after 2006; the decline became more pronounced in 2008.12
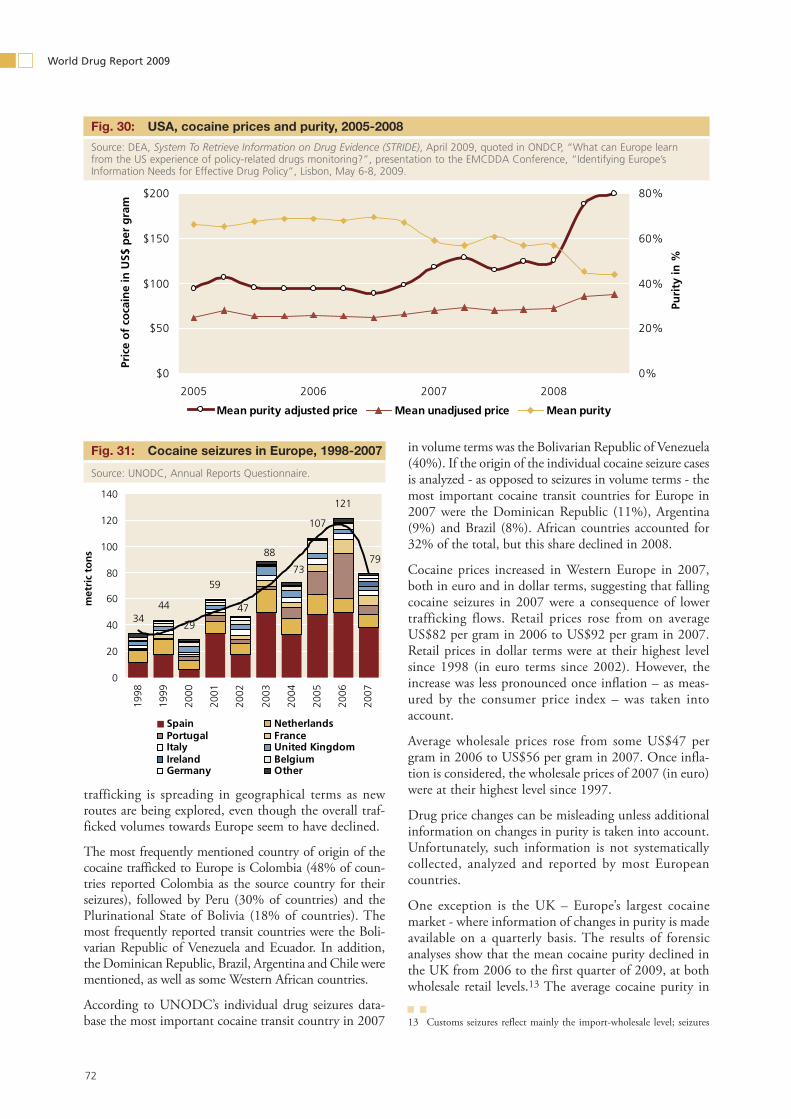
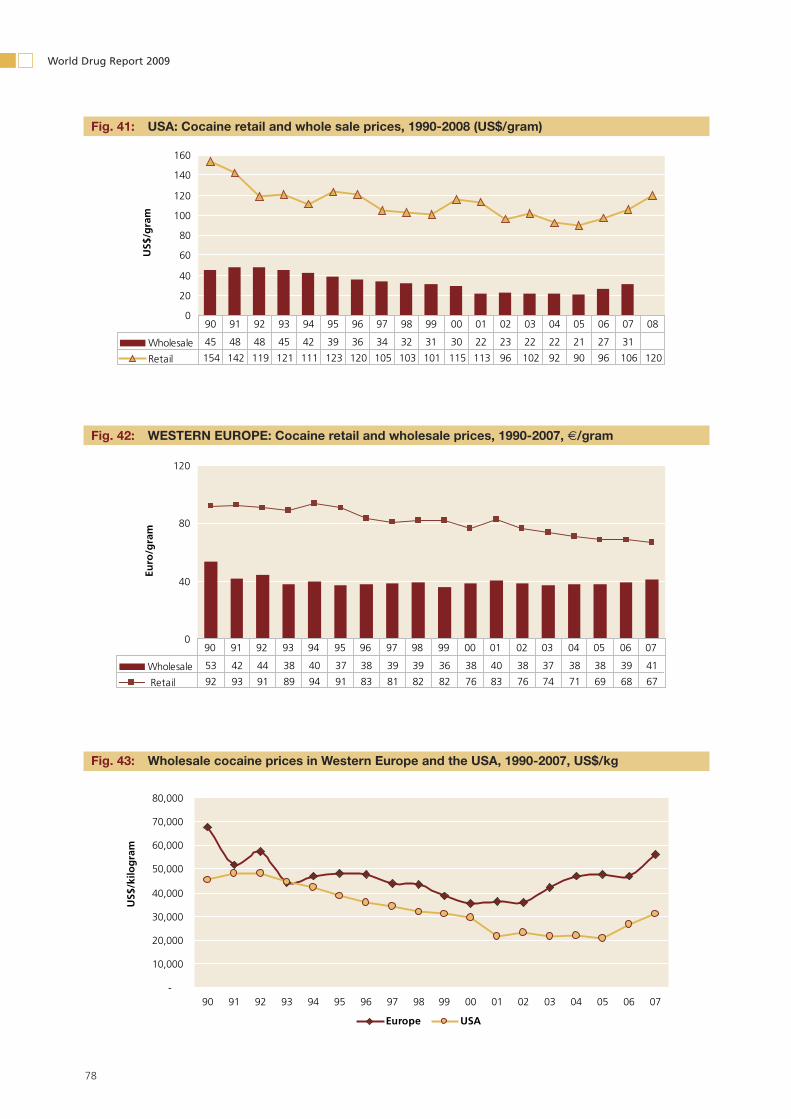
The most striking data indicating a shortage of cocaine in the US market relate to the changes in cocaine prices and purity in 2008. While street prices increased, purity decreased. The purity of cocaine declined from an aver-age of 69.7% in the fourth quarter of 2006 to 43.9% in the fourth quarter of 2008. As a result, the average purity-adjusted prices (retail and wholesale) more than doubled, from an average of US$89 per gram in the fourth quarter of 2006 to US$200 in the fourth quarter of 2008. This is the sharpest increase seen in the USA in recent years.
The flow of cocaine towards Europe may have started to decline
In 2007, European cocaine seizures declined by some 35%, from 121 to 79 mt, the lowest total since 2004. Individual drug seizures reported by European countries suggest that the downward trend may have continued in 2008.
The decline in 2007 was primarily due to lower seizure totals reported by Portugal, Spain and France and, to a lesser extent, by lower totals in Belgium, Sweden, Italy, the Netherlands, Iceland and Finland. Overall, 15 Euro-pean countries recorded declining levels of cocaine sei-zures in 2007.
At the same time, 27 countries reported higher levels of cocaine seizures compared to the year before, mostly smaller countries and/or countries of Central, Eastern and South-Eastern Europe. This suggests that cocaine
12 NIDA, Monitoring the Future – 2008 Data from In-School Surveys of 8th- 10th- and 12th-Grade Students.
Availability of cocaine reported by US Fig. 29: high school students,* 1998-2008
*unweighted average of 8th, 10th and 12th grade students reporting that it is ‘fairly easy’ or ‘very easy’ to obtain cocaine. Source: NIDA, Monitoring the Future
30.0
32.5
37.9
32.0
28
30
32
34
36
38
1998 2000 2002 2004 2006 2008Pe
rcen
t rep
ortin
g co
cain
e to
be
'fairl
y ea
sy' o
r 've
ry e
asy'
to
obta
in
72
World Drug Report 2009
trafficking is spreading in geographical terms as new routes are being explored, even though the overall traf-ficked volumes towards Europe seem to have declined.
The most frequently mentioned country of origin of the cocaine trafficked to Europe is Colombia (48% of coun-tries reported Colombia as the source country for their seizures), followed by Peru (30% of countries) and the Plurinational State of Bolivia (18% of countries). The most frequently reported transit countries were the Boli-varian Republic of Venezuela and Ecuador. In addition, the Dominican Republic, Brazil, Argentina and Chile were mentioned, as well as some Western African countries.
According to UNODC’s individual drug seizures data-base the most important cocaine transit country in 2007
in volume terms was the Bolivarian Republic of Venezuela (40%). If the origin of the individual cocaine seizure cases is analyzed - as opposed to seizures in volume terms - the most important cocaine transit countries for Europe in 2007 were the Dominican Republic (11%), Argentina (9%) and Brazil (8%). African countries accounted for 32% of the total, but this share declined in 2008.
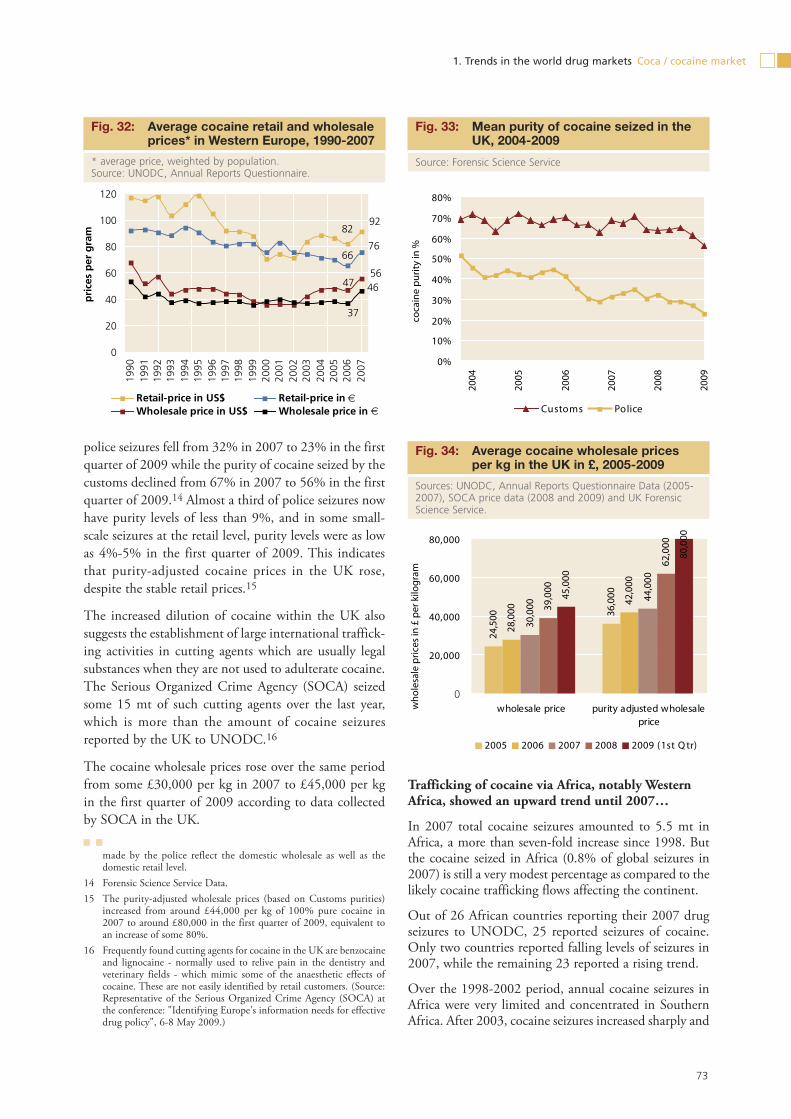
Cocaine prices increased in Western Europe in 2007, both in euro and in dollar terms, suggesting that falling cocaine seizures in 2007 were a consequence of lower trafficking flows. Retail prices rose from on average US$82 per gram in 2006 to US$92 per gram in 2007. Retail prices in dollar terms were at their highest level since 1998 (in euro terms since 2002). However, the increase was less pronounced once inflation – as meas-ured by the consumer price index – was taken into account.
Average wholesale prices rose from some US$47 per gram in 2006 to US$56 per gram in 2007. Once infla-tion is considered, the wholesale prices of 2007 (in euro) were at their highest level since 1997.
Drug price changes can be misleading unless additional information on changes in purity is taken into account. Unfortunately, such information is not systematically collected, analyzed and reported by most European countries.
One exception is the UK – Europe’s largest cocaine market - where information of changes in purity is made available on a quarterly basis. The results of forensic analyses show that the mean cocaine purity declined in the UK from 2006 to the first quarter of 2009, at both wholesale retail levels.13 The average cocaine purity in
13 Customs seizures reflect mainly the import-wholesale level; seizures
USA, cocaine prices and purity, 2005-2008Fig. 30:
Source: DEA, System To Retrieve Information on Drug Evidence (STRIDE), April 2009, quoted in ONDCP, “What can Europe learn from the US experience of policy-related drugs monitoring?”, presentation to the EMCDDA Conference, “Identifying Europe’s Information Needs for Effective Drug Policy”, Lisbon, May 6-8, 2009.
$0
$50
$100
$150
$200
2005 2006 2007 2008
Pric
e o
f co
cain
e in
US$
per
gra
m
0%
20%
40%
60%
80%
Puri
ty in
%
Mean purity adjusted price Mean unadjused price Mean purity
Cocaine seizures in Europe, 1998-2007Fig. 31:
Source: UNODC, Annual Reports Questionnaire.
3444
29
59
107
121
47
7988
73
0
20
40
60
80
100
120
140
1998
1999
2000
2001
2002
2003
2004
2005
2006
2007
met
ric
ton
s
Spain NetherlandsPortugal FranceItaly United KingdomIreland BelgiumGermany Other
73
1. Trends in the world drug markets Coca / cocaine market
police seizures fell from 32% in 2007 to 23% in the first quarter of 2009 while the purity of cocaine seized by the customs declined from 67% in 2007 to 56% in the first quarter of 2009.14 Almost a third of police seizures now have purity levels of less than 9%, and in some small-scale seizures at the retail level, purity levels were as low as 4%-5% in the first quarter of 2009. This indicates that purity-adjusted cocaine prices in the UK rose, despite the stable retail prices.15
The increased dilution of cocaine within the UK also suggests the establishment of large international traffick-ing activities in cutting agents which are usually legal substances when they are not used to adulterate cocaine. The Serious Organized Crime Agency (SOCA) seized some 15 mt of such cutting agents over the last year, which is more than the amount of cocaine seizures reported by the UK to UNODC.16
The cocaine wholesale prices rose over the same period from some £30,000 per kg in 2007 to £45,000 per kg in the first quarter of 2009 according to data collected by SOCA in the UK.
made by the police reflect the domestic wholesale as well as the domestic retail level.
14 Forensic Science Service Data.15 The purity-adjusted wholesale prices (based on Customs purities)
increased from around £44,000 per kg of 100% pure cocaine in 2007 to around £80,000 in the first quarter of 2009, equivalent to an increase of some 80%.
16 Frequently found cutting agents for cocaine in the UK are benzocaine and lignocaine - normally used to relive pain in the dentistry and veterinary fields - which mimic some of the anaesthetic effects of cocaine. These are not easily identified by retail customers. (Source: Representative of the Serious Organized Crime Agency (SOCA) at the conference: "Identifying Europe's information needs for effective drug policy", 6-8 May 2009.)
Trafficking of cocaine via Africa, notably Western Africa, showed an upward trend until 2007…
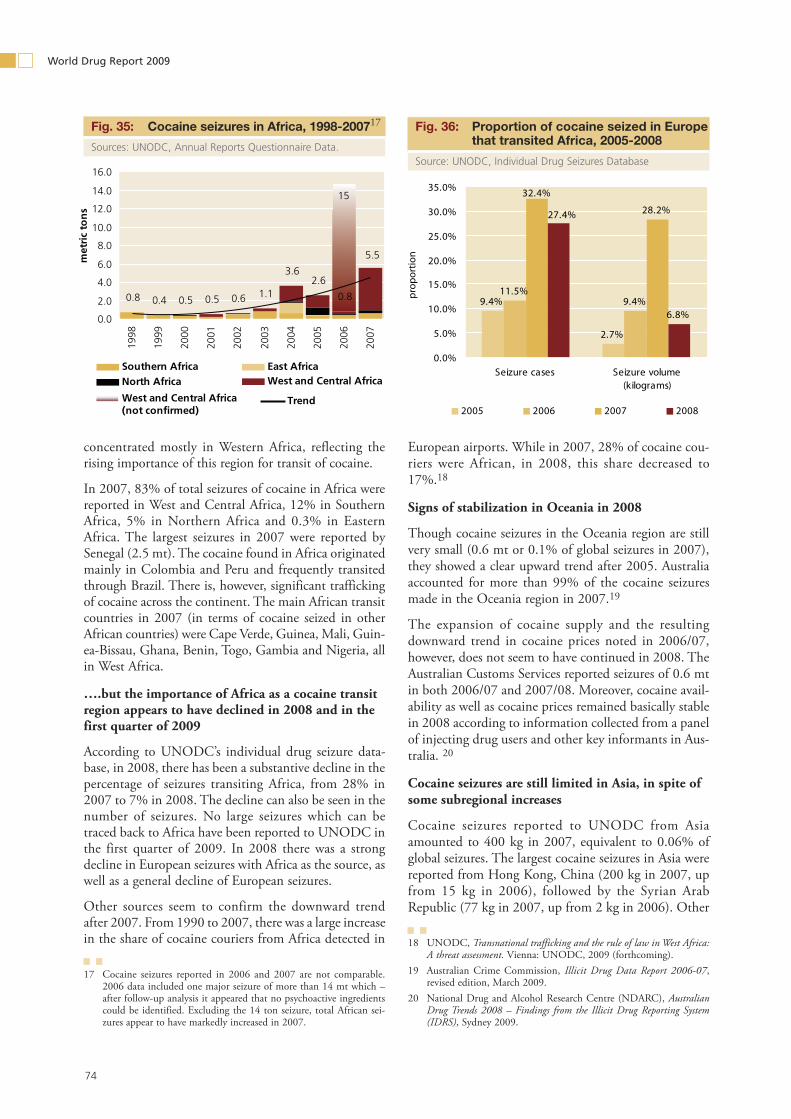
In 2007 total cocaine seizures amounted to 5.5 mt in Africa, a more than seven-fold increase since 1998. But the cocaine seized in Africa (0.8% of global seizures in 2007) is still a very modest percentage as compared to the likely cocaine trafficking flows affecting the continent.
Out of 26 African countries reporting their 2007 drug seizures to UNODC, 25 reported seizures of cocaine. Only two countries reported falling levels of seizures in 2007, while the remaining 23 reported a rising trend.
Over the 1998-2002 period, annual cocaine seizures in Africa were very limited and concentrated in Southern Africa. After 2003, cocaine seizures increased sharply and
8292
6676
5647
37
46
0
20
40
60
80
100
120
1990
1991
1992
1993
1994
1995
1996
1997
1998
1999
2000
2001
2002
2003
2004
2005
2006
2007
pri
ces
per
gra
m
Retail-price in US$ Retail-price in Wholesale price in US$ Wholesale price in
Average cocaine retail and wholesale Fig. 32: prices* in Western Europe, 1990-2007
* average price, weighted by population. Source: UNODC, Annual Reports Questionnaire.
Mean purity of cocaine seized in the Fig. 33: UK, 2004-2009
Source: Forensic Science Service
0%
10%
20%
30%
40%
50%
60%
70%
80%
2003
2004
2005
2006
2007
2008
2009
coca
ine
purit
y in
%Customs Police
Average cocaine wholesale prices Fig. 34: per kg in the UK in £, 2005-2009
Sources: UNODC, Annual Reports Questionnaire Data (2005-2007), SOCA price data (2008 and 2009) and UK Forensic Science Service.
24,5
00 36,0
00
28,0
00
42,0
00
30,0
00
44,0
00
39,0
00
62,0
00
45,0
00
80,0
00-
20,000
40,000
60,000
80,000
wholesale price purity adjusted wholesaleprice
who
lesa
le p
rices
in £
per
kilo
gram
2005 2006 2007 2008 2009 (1st Q tr)
€
€
0
74
World Drug Report 2009
concentrated mostly in Western Africa, reflecting the rising importance of this region for transit of cocaine.
In 2007, 83% of total seizures of cocaine in Africa were reported in West and Central Africa, 12% in Southern Africa, 5% in Northern Africa and 0.3% in Eastern Africa. The largest seizures in 2007 were reported by Senegal (2.5 mt). The cocaine found in Africa originated mainly in Colombia and Peru and frequently transited through Brazil. There is, however, significant trafficking of cocaine across the continent. The main African transit countries in 2007 (in terms of cocaine seized in other African countries) were Cape Verde, Guinea, Mali, Guin-ea-Bissau, Ghana, Benin, Togo, Gambia and Nigeria, all in West Africa.
….but the importance of Africa as a cocaine transit region appears to have declined in 2008 and in the first quarter of 2009
According to UNODC’s individual drug seizure data-base, in 2008, there has been a substantive decline in the percentage of seizures transiting Africa, from 28% in 2007 to 7% in 2008. The decline can also be seen in the number of seizures. No large seizures which can be traced back to Africa have been reported to UNODC in the first quarter of 2009. In 2008 there was a strong decline in European seizures with Africa as the source, as well as a general decline of European seizures.
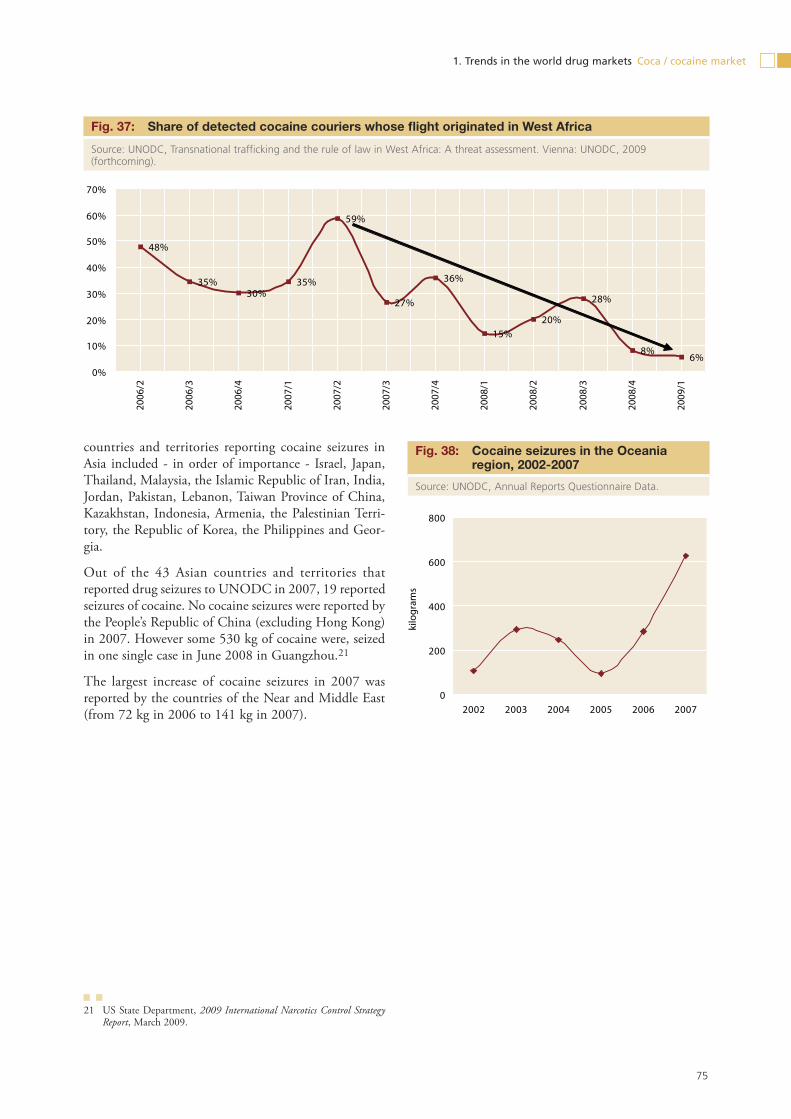
Other sources seem to confirm the downward trend after 2007. From 1990 to 2007, there was a large increase in the share of cocaine couriers from Africa detected in
17 Cocaine seizures reported in 2006 and 2007 are not comparable. 2006 data included one major seizure of more than 14 mt which – after follow-up analysis it appeared that no psychoactive ingredients could be identified. Excluding the 14 ton seizure, total African sei-zures appear to have markedly increased in 2007.
European airports. While in 2007, 28% of cocaine cou-riers were African, in 2008, this share decreased to 17%.18
Signs of stabilization in Oceania in 2008
Though cocaine seizures in the Oceania region are still very small (0.6 mt or 0.1% of global seizures in 2007), they showed a clear upward trend after 2005. Australia accounted for more than 99% of the cocaine seizures made in the Oceania region in 2007.19
The expansion of cocaine supply and the resulting downward trend in cocaine prices noted in 2006/07, however, does not seem to have continued in 2008. The Australian Customs Services reported seizures of 0.6 mt in both 2006/07 and 2007/08. Moreover, cocaine avail-ability as well as cocaine prices remained basically stable in 2008 according to information collected from a panel of injecting drug users and other key informants in Aus-tralia. 20
Cocaine seizures are still limited in Asia, in spite of some subregional increases
Cocaine seizures reported to UNODC from Asia amounted to 400 kg in 2007, equivalent to 0.06% of global seizures. The largest cocaine seizures in Asia were reported from Hong Kong, China (200 kg in 2007, up from 15 kg in 2006), followed by the Syrian Arab Republic (77 kg in 2007, up from 2 kg in 2006). Other
18 UNODC, Transnational trafficking and the rule of law in West Africa: A threat assessment. Vienna: UNODC, 2009 (forthcoming).
19 Australian Crime Commission, Illicit Drug Data Report 2006-07, revised edition, March 2009.
20 National Drug and Alcohol Research Centre (NDARC), Australian Drug Trends 2008 – Findings from the Illicit Drug Reporting System (IDRS), Sydney 2009.
Cocaine seizures in Africa, 1998-2007Fig. 35: 17
Sources: UNODC, Annual Reports Questionnaire Data.
Proportion of cocaine seized in Europe Fig. 36: that transited Africa, 2005-2008
Source: UNODC, Individual Drug Seizures Database
9.4%
2.7%
11.5%9.4%
28.2%
6.8%
32.4%
27.4%
0.0%
5.0%
10.0%
15.0%
20.0%
25.0%
30.0%
35.0%
Seizure cases Seizure volume(kilograms)
prop
ortio
n2005 2006 2007 2008
0.8 0.4 0.5 0.5 0.6 1.1
3.62.6
0.8
5.5
0.0
2.0
4.0
6.0
8.0
10.0
12.0
14.0
16.0
1998
1999
2000
2001
2002
2003
2004
2005
2006
2007
met
ric
ton
s
Southern Africa East AfricaNorth Africa West and Central Africa
West and Central Africa(not confirmed)
Trend
15
75
1. Trends in the world drug markets Coca / cocaine market
countries and territories reporting cocaine seizures in Asia included - in order of importance - Israel, Japan, Thailand, Malaysia, the Islamic Republic of Iran, India, Jordan, Pakistan, Lebanon, Taiwan Province of China, Kazakhstan, Indonesia, Armenia, the Palestinian Terri-tory, the Republic of Korea, the Philippines and Geor-gia.
Out of the 43 Asian countries and territories that reported drug seizures to UNODC in 2007, 19 reported seizures of cocaine. No cocaine seizures were reported by the People’s Republic of China (excluding Hong Kong) in 2007. However some 530 kg of cocaine were, seized in one single case in June 2008 in Guangzhou.21
The largest increase of cocaine seizures in 2007 was reported by the countries of the Near and Middle East (from 72 kg in 2006 to 141 kg in 2007).
21 US State Department, 2009 International Narcotics Control Strategy Report, March 2009.
Share of detected cocaine couriers whose flight originated in West AfricaFig. 37:
Source: UNODC, Transnational trafficking and the rule of law in West Africa: A threat assessment. Vienna: UNODC, 2009 (forthcoming).
Cocaine seizures in the Oceania Fig. 38: region, 2002-2007
Source: UNODC, Annual Reports Questionnaire Data.
48%
35%30%
35%
59%
27%
36%
15%20%
28%
8%6%
0%
10%
20%
30%
40%
50%
60%
70%
2006
/2
2006
/3
2006
/4
2007
/1
2007
/2
2007
/3
2007
/4
2008
/1
2008
/2
2008
/3
2008
/4
2009
/10
200
400
600
800
2002 2003 2004 2005 2006 2007
kilo
gram
s
76
World Drug Report 2009
Global illicit supply of cocaine, 1997-2007Fig. 39:
(a) Seizures as reported (street purity).
(b) Seizures as reported (street purity)(c) Data refer to England and Wales only.
(b) Includes cocaine HCl, cocaine base, crack cocaine, and other cocaine types.
(a) Includes cocaine HCl, cocaine base, crack cocaine, and other cocaine types.
195,435
147,804
60,000
48,168
37,788
32,435
31,861
25,303
17,835
17,187
14,379
10,799
10,478
3,804
3,468
3,370
2,666
2,515
2,450
8,000
6,586
7,363
4,081
3,949
- 50,000 100,000 150,000 200,000 250,000
Colombia (27%)
USA (21%)
Panama (8%)
Mexico (7%)
Spain (5%)
Costa Rica (5%)
Venezuela (4%)
Ecuador (4%)
Bolivia (3%)
Brazil (2%)
Peru (2%)
Chile (2%)
Netherlands (1%)
Argentina (1%)
Portugal (1%)
France (0.9%)
El Salvador (0.6%)
Italy (0.6%)
Dominican Rep. (0.5%)
United Kingdom (0.5%)
Ireland (0.5%)
Canada (0.4%)
Belgium (0.4%)
Senegal (0.3%)
(c)
78,650
6,518
97,284
198,638
322,767
626
306
303
249
177
4,568
636
141
19
8
-50,000
100,000
150,000
200,000
250,000
300,000
350,000
South America (45%)
North America (28%)
Central America (14%)
West & Central Europe (11%)
Caribbean (0.9%)
West and Central Africa (0.6%)
Southern Africa (0.1%)
Oceania (0.1%)
Southeast Europe (0%)
North Africa (0%)
East and South-East Asia (0%)
East Europe (0%)
Near and Middle East /South-West Asia (0%)
East Africa (0%)
South Asia (0%)
666588
704 672607 576 560
660567 575 582
925879
827 800859
1,008980 984 994
24%29%
24%24%
27%28% 35%
34%
42%
42%41%
825875
0
200
400
600
800
1,000
1997 1998 1999 2000 2001 2002 2003 2004 2005 2006 2007
Met
ric
ton
s eq
uiv
alen
t Cocaine intercepted- in % of production
Total Cocaine Production- in metric tons
Cocaineavailable for consumption(potential)- in metric tons
SEIZURES OF COCAINE (a) in % of world total and kg equivalents(b)
HIGHEST RANKING COUNTRIES - 2007
SEIZURES OF COCAINE (a) in kg equivalents(b) and in % - BY REGION - 2007
(a)
77
1. Trends in the world drug markets Coca / cocaine market
Global seizures of cocaine, 1997-2007Fig. 40:
7002 - 7991 :AISA - DETPECRETNI ENIACOC7002 - 7991 :DLROW - DETPECRETNI ENIACOC
COCAINE INTERCEPTED - AMERICAS: 1997-2007 COCAINE INTERCEPTED - EUROPE: 1997-2007
COCAINE INTERCEPTED - AFRICA: 1997-2007 COCAINE INTERCEPTED - OCEANIA: 1997-2007
0.00
0.10
0.20
0.30
0.40
0.50
0.60
0.70
0.80
1997 1998 1999 2000 2001 2002 2003 2004 2005 2006 2007
Met
ric to
n eq
uiva
lent
s
0
100
200
300
400
500
600
700
800
1997 1998 1999 2000 2001 2002 2003 2004 2005 2006 2007
Met
ric
ton
eq
uiv
alen
ts
0
100
200
300
400
500
600
700
1997 1998 1999 2000 2001 2002 2003 2004 2005 2006 2007
Met
ric
ton
eq
uiv
alen
ts
0
20
40
60
80
100
120
140
1997 1998 1999 2000 2001 2002 2003 2004 2005 2006 2007
Met
ric
ton
eq
uiv
alen
ts
0
1
2
3
4
5
6
7
8
1997 1998 1999 2000 2001 2002 2003 2004 2005 2006 2007
Met
ric
ton
eq
uiv
alen
ts
0.0
0.2
0.4
0.6
0.8
1.0
1.2
1.4
1.6
1997 1998 1999 2000 2001 2002 2003 2004 2005 2006 2007
Met
ric
ton
eq
uiv
alen
ts
78
World Drug Report 2009
USA: Cocaine retail and whole sale prices, 1990-2008 (US$/gram)Fig. 41:
0
20
40
60
80
100
120
140
160U
S$/g
ram
Wholesale 45 48 48 45 42 39 36 34 32 31 30 22 23 22 22 21 27 31
Retail 154 142 119 121 111 123 120 105 103 101 115 113 96 102 92 90 96 106 120
90 91 92 93 94 95 96 97 98 99 00 01 02 03 04 05 06 07 08
WESTERN EUROPE: Cocaine retail and wholesale prices, 1990-2007, Fig. 42: €/gram
0
40
80
120
Euro
/gra
m
Wholesale 53 42 44 38 40 37 38 39 39 36 38 40 38 37 38 38 39 41
Retail 92 93 91 89 94 91 83 81 82 82 76 83 76 74 71 69 68 67
90 91 92 93 94 95 96 97 98 99 00 01 02 03 04 05 06 07
Wholesale cocaine prices in Western Europe and the USA, 1990-2007, US$/kgFig. 43:
-
10,000
20,000
30,000
40,000
50,000
60,000
70,000
80,000
90 91 92 93 94 95 96 97 98 99 00 01 02 03 04 05 06 07
US$
/kilo
gra
m
Europe USA
1.2.4 Consumption
80
World Drug Report 2009
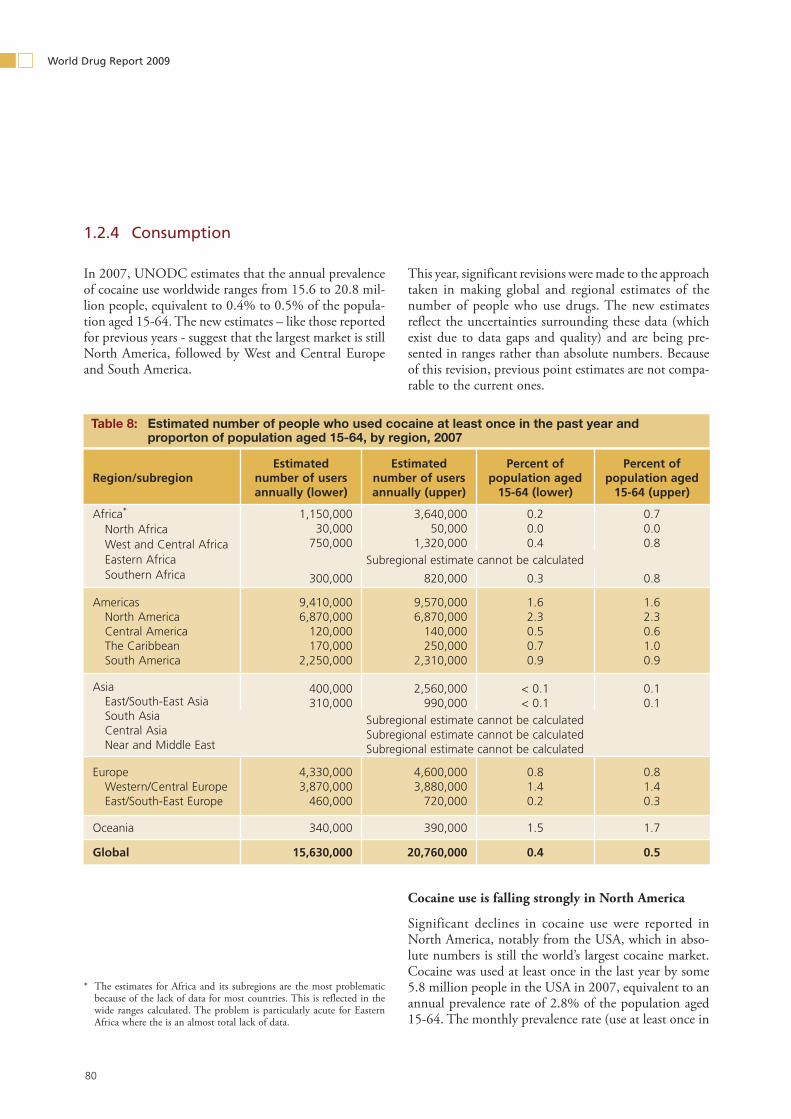
In 2007, UNODC estimates that the annual prevalence of cocaine use worldwide ranges from 15.6 to 20.8 mil-lion people, equivalent to 0.4% to 0.5% of the popula-tion aged 15-64. The new estimates – like those reported for previous years - suggest that the largest market is still North America, followed by West and Central Europe and South America.
This year, significant revisions were made to the approach taken in making global and regional estimates of the number of people who use drugs. The new estimates reflect the uncertainties surrounding these data (which exist due to data gaps and quality) and are being pre-sented in ranges rather than absolute numbers. Because of this revision, previous point estimates are not compa-rable to the current ones.
Cocaine use is falling strongly in North America
Significant declines in cocaine use were reported in North America, notably from the USA, which in abso-lute numbers is still the world’s largest cocaine market. Cocaine was used at least once in the last year by some 5.8 million people in the USA in 2007, equivalent to an annual prevalence rate of 2.8% of the population aged 15-64. The monthly prevalence rate (use at least once in
* The estimates for Africa and its subregions are the most problematic because of the lack of data for most countries. This is reflected in the wide ranges calculated. The problem is particularly acute for Eastern Africa where the is an almost total lack of data.
Estimated number of people who used cocaine at least once in the past year and Table 8: proporton of population aged 15-64, by region, 2007
Region/subregionEstimated
number of users annually (lower)
Estimated number of users annually (upper)
Percent of population aged
15-64 (lower)
Percent of population aged
15-64 (upper)
Africa*
North Africa West and Central Africa Eastern Africa Southern Africa
1,150,00030,000
750,000
3,640,00050,000
1,320,000
0.20.00.4
0.70.00.8
Subregional estimate cannot be calculated
300,000 820,000 0.3 0.8
Americas North America Central America The Caribbean South America
9,410,0006,870,000
120,000170,000
2,250,000
9,570,0006,870,000
140,000250,000
2,310,000
1.62.30.50.70.9
1.62.30.61.00.9
Asia East/South-East Asia South Asia Central Asia Near and Middle East
400,000310,000
2,560,000990,000
< 0.1< 0.1
0.10.1
Subregional estimate cannot be calculatedSubregional estimate cannot be calculatedSubregional estimate cannot be calculated
Europe Western/Central Europe East/South-East Europe
4,330,0003,870,000
460,000
4,600,0003,880,000
720,000
0.81.40.2
0.81.40.3
Oceania 340,000 390,000 1.5 1.7
Global 15,630,000 20,760,000 0.4 0.5
81
1. Trends in the world drug markets Coca / cocaine market
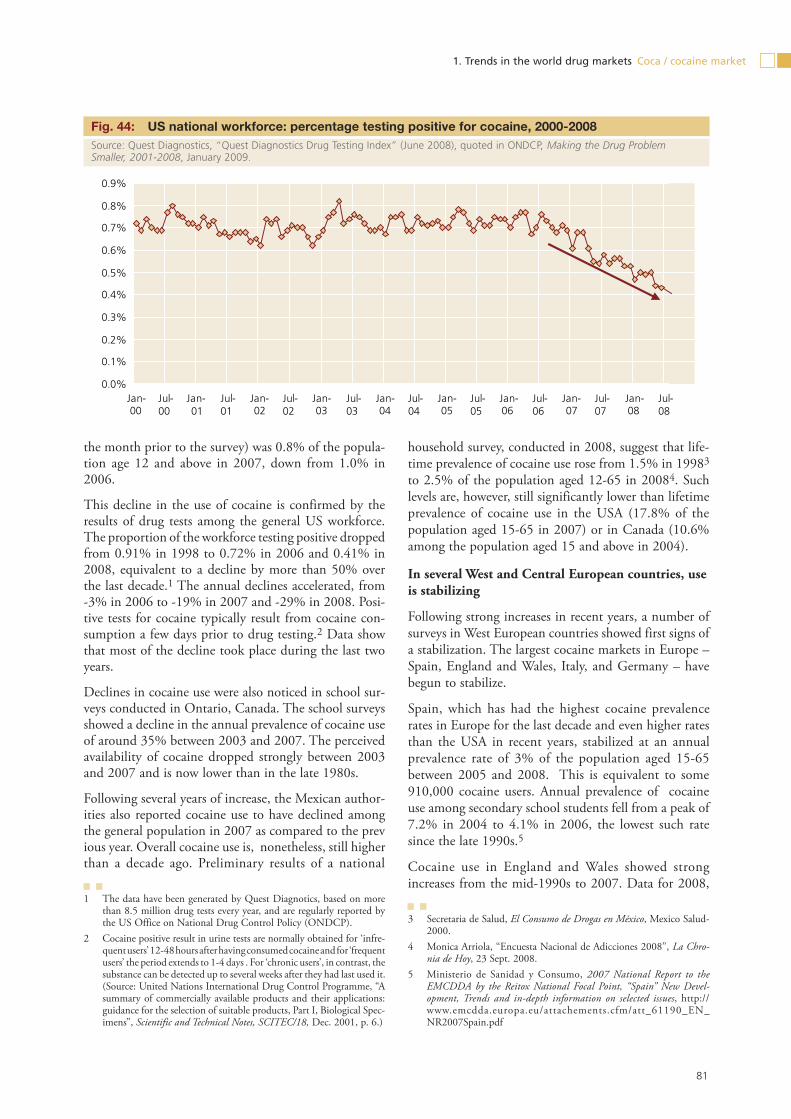
the month prior to the survey) was 0.8% of the popula-tion age 12 and above in 2007, down from 1.0% in 2006.
This decline in the use of cocaine is confirmed by the results of drug tests among the general US workforce. The proportion of the workforce testing positive dropped from 0.91% in 1998 to 0.72% in 2006 and 0.41% in 2008, equivalent to a decline by more than 50% over the last decade.1 The annual declines accelerated, from -3% in 2006 to -19% in 2007 and -29% in 2008. Posi-tive tests for cocaine typically result from cocaine con-sumption a few days prior to drug testing.2 Data show that most of the decline took place during the last two years.
Declines in cocaine use were also noticed in school sur-veys conducted in Ontario, Canada. The school surveys showed a decline in the annual prevalence of cocaine use of around 35% between 2003 and 2007. The perceived availability of cocaine dropped strongly between 2003 and 2007 and is now lower than in the late 1980s.
Following several years of increase, the Mexican author-ities also reported cocaine use to have declined among the general population in 2007 as compared to the prev ious year. Overall cocaine use is, nonetheless, still higher than a decade ago. Preliminary results of a national
1 The data have been generated by Quest Diagnotics, based on more than 8.5 million drug tests every year, and are regularly reported by the US Office on National Drug Control Policy (ONDCP).
2 Cocaine positive result in urine tests are normally obtained for ‘infre-quent users’ 12-48 hours after having consumed cocaine and for ‘frequent users’ the period extends to 1-4 days . For ‘chronic users’, in contrast, the substance can be detected up to several weeks after they had last used it. (Source: United Nations International Drug Control Programme, “A summary of commercially available products and their applications: guidance for the selection of suitable products, Part I, Biological Spec-imens”, Scientific and Technical Notes, SCITEC/18, Dec. 2001, p. 6.)
household survey, conducted in 2008, suggest that life-time prevalence of cocaine use rose from 1.5% in 19983 to 2.5% of the population aged 12-65 in 20084. Such levels are, however, still significantly lower than lifetime prevalence of cocaine use in the USA (17.8% of the population aged 15-65 in 2007) or in Canada (10.6% among the population aged 15 and above in 2004).
In several West and Central European countries, use is stabilizing
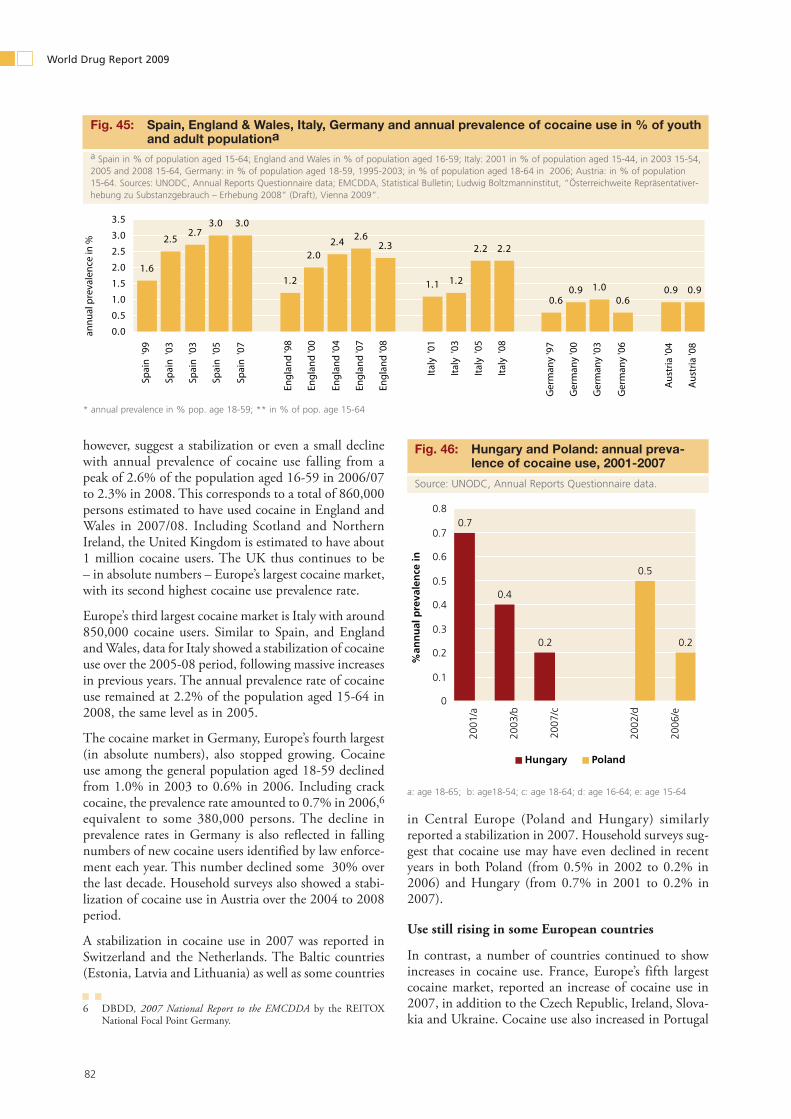
Following strong increases in recent years, a number of surveys in West European countries showed first signs of a stabilization. The largest cocaine markets in Europe – Spain, England and Wales, Italy, and Germany – have begun to stabilize.
Spain, which has had the highest cocaine prevalence rates in Europe for the last decade and even higher rates than the USA in recent years, stabilized at an annual prevalence rate of 3% of the population aged 15-65 between 2005 and 2008. This is equivalent to some 910,000 cocaine users. Annual prevalence of cocaine use among secondary school students fell from a peak of 7.2% in 2004 to 4.1% in 2006, the lowest such rate since the late 1990s.5
Cocaine use in England and Wales showed strong increases from the mid-1990s to 2007. Data for 2008,
3 Secretaria de Salud, El Consumo de Drogas en México, Mexico Salud-2000.
4 Monica Arriola, “Encuesta Nacional de Adicciones 2008”, La Chro-nia de Hoy, 23 Sept. 2008.
5 Ministerio de Sanidad y Consumo, 2007 National Report to the EMCDDA by the Reitox National Focal Point, “Spain” New Devel-opment, Trends and in-depth information on selected issues, http://www.emcdda.europa.eu/attachements.cfm/att_61190_EN_NR2007Spain.pdf
US national workforce: percentage testing positive for cocaine, 2000-2008 Fig. 44: Source: Quest Diagnostics, “Quest Diagnostics Drug Testing Index” (June 2008), quoted in ONDCP, Making the Drug Problem Smaller, 2001-2008, January 2009.
0.0%
0.1%
0.2%
0.3%
0.4%
0.5%
0.6%
0.7%
0.8%
0.9%
Jan-00
Jul-00
Jan-01
Jul-01
Jan-02
Jul-02
Jan-03
Jul-03
Jan-04
Jul-04
Jan-05
Jul-05
Jan-06
Jul-06
Jan-07
Jul-07
Jan-08
Jul-08
82
World Drug Report 2009
however, suggest a stabilization or even a small decline with annual prevalence of cocaine use falling from a peak of 2.6% of the population aged 16-59 in 2006/07 to 2.3% in 2008. This corresponds to a total of 860,000 persons estimated to have used cocaine in England and Wales in 2007/08. Including Scotland and Northern Ireland, the United Kingdom is estimated to have about 1 million cocaine users. The UK thus continues to be – in absolute numbers – Europe’s largest cocaine market, with its second highest cocaine use prevalence rate.
Europe’s third largest cocaine market is Italy with around 850,000 cocaine users. Similar to Spain, and England and Wales, data for Italy showed a stabilization of cocaine use over the 2005-08 period, following massive increases in previous years. The annual prevalence rate of cocaine use remained at 2.2% of the population aged 15-64 in 2008, the same level as in 2005.
The cocaine market in Germany, Europe’s fourth largest (in absolute numbers), also stopped growing. Cocaine use among the general population aged 18-59 declined from 1.0% in 2003 to 0.6% in 2006. Including crack cocaine, the prevalence rate amounted to 0.7% in 2006,6 equivalent to some 380,000 persons. The decline in prevalence rates in Germany is also reflected in falling numbers of new cocaine users identified by law enforce-ment each year. This number declined some 30% over the last decade. Household surveys also showed a stabi-lization of cocaine use in Austria over the 2004 to 2008 period.
A stabilization in cocaine use in 2007 was reported in Switzerland and the Netherlands. The Baltic countries (Estonia, Latvia and Lithuania) as well as some countries
6 DBDD, 2007 National Report to the EMCDDA by the REITOX National Focal Point Germany.
in Central Europe (Poland and Hungary) similarly reported a stabilization in 2007. Household surveys sug-gest that cocaine use may have even declined in recent years in both Poland (from 0.5% in 2002 to 0.2% in 2006) and Hungary (from 0.7% in 2001 to 0.2% in 2007).
Use still rising in some European countries
In contrast, a number of countries continued to show increases in cocaine use. France, Europe’s fifth largest cocaine market, reported an increase of cocaine use in 2007, in addition to the Czech Republic, Ireland, Slova-kia and Ukraine. Cocaine use also increased in Portugal
Spain, England & Wales, Italy, Germany and annual prevalence of cocaine use in % of youth Fig. 45: and adult populationa
a Spain in % of population aged 15-64; England and Wales in % of population aged 16-59; Italy: 2001 in % of population aged 15-44, in 2003 15-54, 2005 and 2008 15-64, Germany: in % of population aged 18-59, 1995-2003; in % of population aged 18-64 in 2006; Austria: in % of population 15-64. Sources: UNODC, Annual Reports Questionnaire data; EMCDDA, Statistical Bulletin; Ludwig Boltzmanninstitut, “Österreichweite Repräsentativer-hebung zu Substanzgebrauch – Erhebung 2008” (Draft), Vienna 2009”.
Hungary and Poland: annual preva-Fig. 46: lence of cocaine use, 2001-2007
Source: UNODC, Annual Reports Questionnaire data.
* annual prevalence in % pop. age 18-59; ** in % of pop. age 15-64
1.6
2.52.7
3.0
1.2
2.02.4 2.6
2.3
1.1 1.20.9 1.0
0.60.9 0.9
3.0
2.2 2.2
0.6
0.0
0.5
1.0
1.5
2.0
2.5
3.0
3.5
Spai
n '9
9
Spai
n '0
3
Spai
n '0
3
Spai
n '0
5
Spai
n '0
7
Engl
and
'98
Engl
and
'00
Engl
and
'04
Engl
and
'07
Engl
and
'08
Italy
'01
Italy
'03
Italy
'05
Italy
'08
Ger
man
y '9
7
Ger
man
y '0
0
Ger
man
y '0
3
Ger
man
y '0
6
Aus
tria
'04
Aus
tria
'08
annu
al p
reva
lenc
e in
%
a: age 18-65; b: age18-54; c: age 18-64; d: age 16-64; e: age 15-64
0.7
0.4
0.2
0.5
0.2
0
0.1
0.2
0.3
0.4
0.5
0.6
0.7
0.8
2001
/a
2003
/b
2007
/c
2002
/d
2006
/e
%an
nu
al p
reva
len
ce in
Hungary Poland
83
1. Trends in the world drug markets Coca / cocaine market
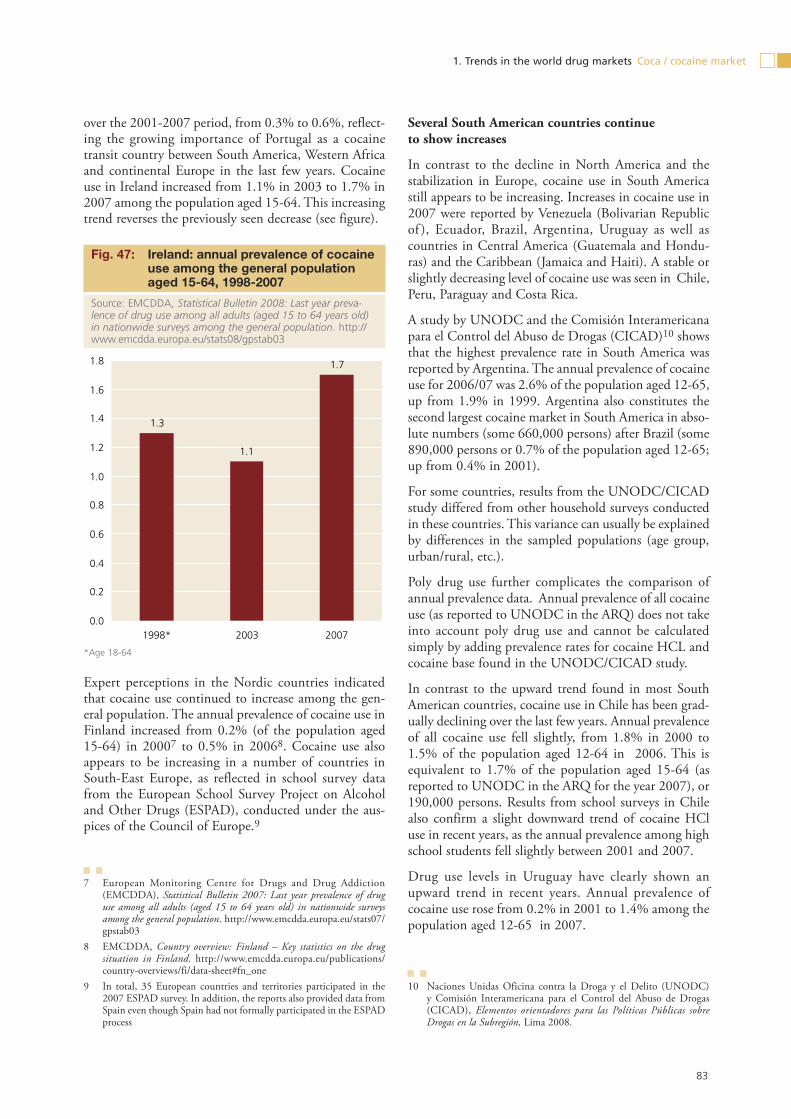
over the 2001-2007 period, from 0.3% to 0.6%, reflect-ing the growing importance of Portugal as a cocaine transit country between South America, Western Africa and continental Europe in the last few years. Cocaine use in Ireland increased from 1.1% in 2003 to 1.7% in 2007 among the population aged 15-64. This increasing trend reverses the previously seen decrease (see figure).
Expert perceptions in the Nordic countries indicated that cocaine use continued to increase among the gen-eral population. The annual prevalence of cocaine use in Finland increased from 0.2% (of the population aged 15-64) in 20007 to 0.5% in 20068. Cocaine use also appears to be increasing in a number of countries in South-East Europe, as reflected in school survey data from the European School Survey Project on Alcohol and Other Drugs (ESPAD), conducted under the aus-pices of the Council of Europe.9
7 European Monitoring Centre for Drugs and Drug Addiction (EMCDDA), Statistical Bulletin 2007: Last year prevalence of drug use among all adults (aged 15 to 64 years old) in nationwide surveys among the general population. http://www.emcdda.europa.eu/stats07/gpstab03
8 EMCDDA, Country overview: Finland – Key statistics on the drug situation in Finland. http://www.emcdda.europa.eu/publications/country-overviews/fi/data-sheet#fn_one
9 In total, 35 European countries and territories participated in the 2007 ESPAD survey. In addition, the reports also provided data from Spain even though Spain had not formally participated in the ESPAD process
Several South American countries continue to show increases
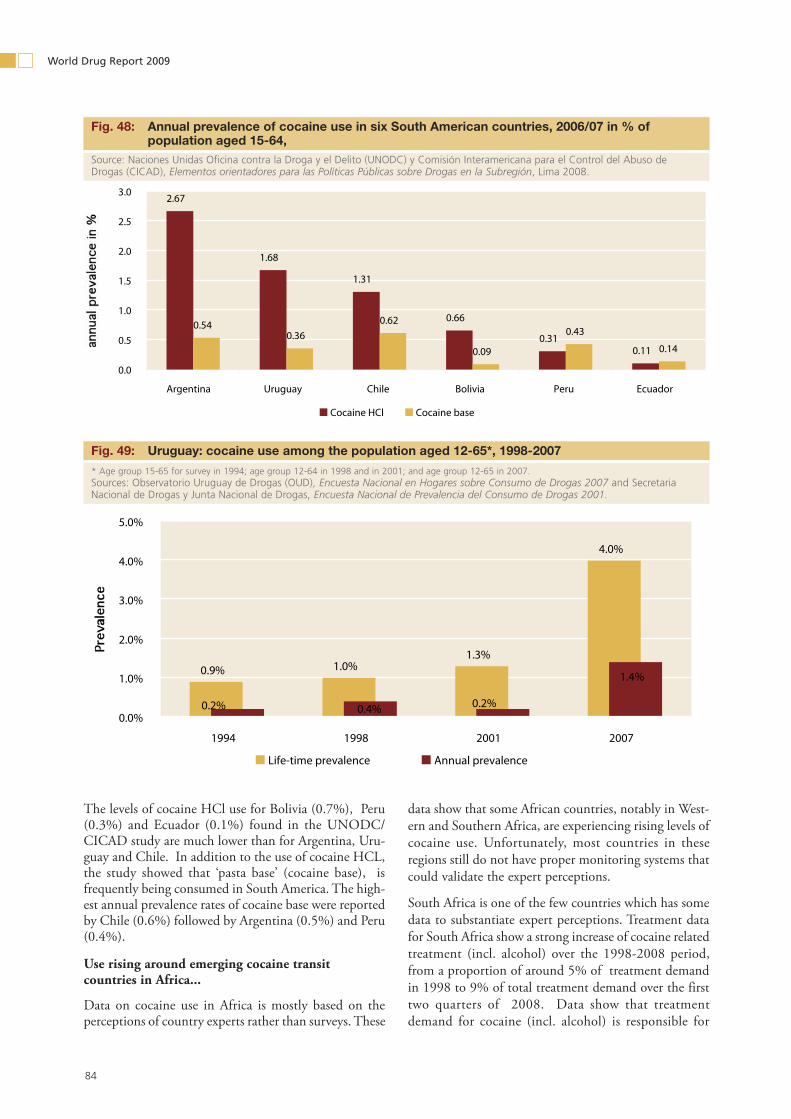
In contrast to the decline in North America and the stabilization in Europe, cocaine use in South America still appears to be increasing. Increases in cocaine use in 2007 were reported by Venezuela (Bolivarian Republic of ), Ecuador, Brazil, Argentina, Uruguay as well as countries in Central America (Guatemala and Hondu-ras) and the Caribbean (Jamaica and Haiti). A stable or slightly decreasing level of cocaine use was seen in Chile, Peru, Paraguay and Costa Rica.
A study by UNODC and the Comisión Interamericana para el Control del Abuso de Drogas (CICAD)10 shows that the highest prevalence rate in South America was reported by Argentina. The annual prevalence of cocaine use for 2006/07 was 2.6% of the population aged 12-65, up from 1.9% in 1999. Argentina also constitutes the second largest cocaine market in South America in abso-lute numbers (some 660,000 persons) after Brazil (some 890,000 persons or 0.7% of the population aged 12-65; up from 0.4% in 2001).
For some countries, results from the UNODC/CICAD study differed from other household surveys conducted in these countries. This variance can usually be explained by differences in the sampled populations (age group, urban/rural, etc.).
Poly drug use further complicates the comparison of annual prevalence data. Annual prevalence of all cocaine use (as reported to UNODC in the ARQ) does not take into account poly drug use and cannot be calculated simply by adding prevalence rates for cocaine HCL and cocaine base found in the UNODC/CICAD study.
In contrast to the upward trend found in most South American countries, cocaine use in Chile has been grad-ually declining over the last few years. Annual prevalence of all cocaine use fell slightly, from 1.8% in 2000 to 1.5% of the population aged 12-64 in 2006. This is equivalent to 1.7% of the population aged 15-64 (as reported to UNODC in the ARQ for the year 2007), or 190,000 persons. Results from school surveys in Chile also confirm a slight downward trend of cocaine HCl use in recent years, as the annual prevalence among high school students fell slightly between 2001 and 2007.
Drug use levels in Uruguay have clearly shown an upward trend in recent years. Annual prevalence of cocaine use rose from 0.2% in 2001 to 1.4% among the population aged 12-65 in 2007.
10 Naciones Unidas Oficina contra la Droga y el Delito (UNODC) y Comisión Interamericana para el Control del Abuso de Drogas (CICAD), Elementos orientadores para las Políticas Públicas sobre Drogas en la Subregión, Lima 2008.
Ireland: annual prevalence of cocaine Fig. 47: use among the general population aged 15-64, 1998-2007
Source: EMCDDA, Statistical Bulletin 2008: Last year preva-lence of drug use among all adults (aged 15 to 64 years old) in nationwide surveys among the general population. http://www.emcdda.europa.eu/stats08/gpstab03
1.3
1.1
1.7
0.0
0.2
0.4
0.6
0.8
1.0
1.2
1.4
1.6
1.8
1998* 2003 2007
*Age 18-64
84
World Drug Report 2009
The levels of cocaine HCl use for Bolivia (0.7%), Peru (0.3%) and Ecuador (0.1%) found in the UNODC/CICAD study are much lower than for Argentina, Uru-guay and Chile. In addition to the use of cocaine HCL, the study showed that ‘pasta base’ (cocaine base), is frequently being consumed in South America. The high-est annual prevalence rates of cocaine base were reported by Chile (0.6%) followed by Argentina (0.5%) and Peru (0.4%).
Use rising around emerging cocaine transit countries in Africa...
Data on cocaine use in Africa is mostly based on the perceptions of country experts rather than surveys. These
data show that some African countries, notably in West-ern and Southern Africa, are experiencing rising levels of cocaine use. Unfortunately, most countries in these regions still do not have proper monitoring systems that could validate the expert perceptions.
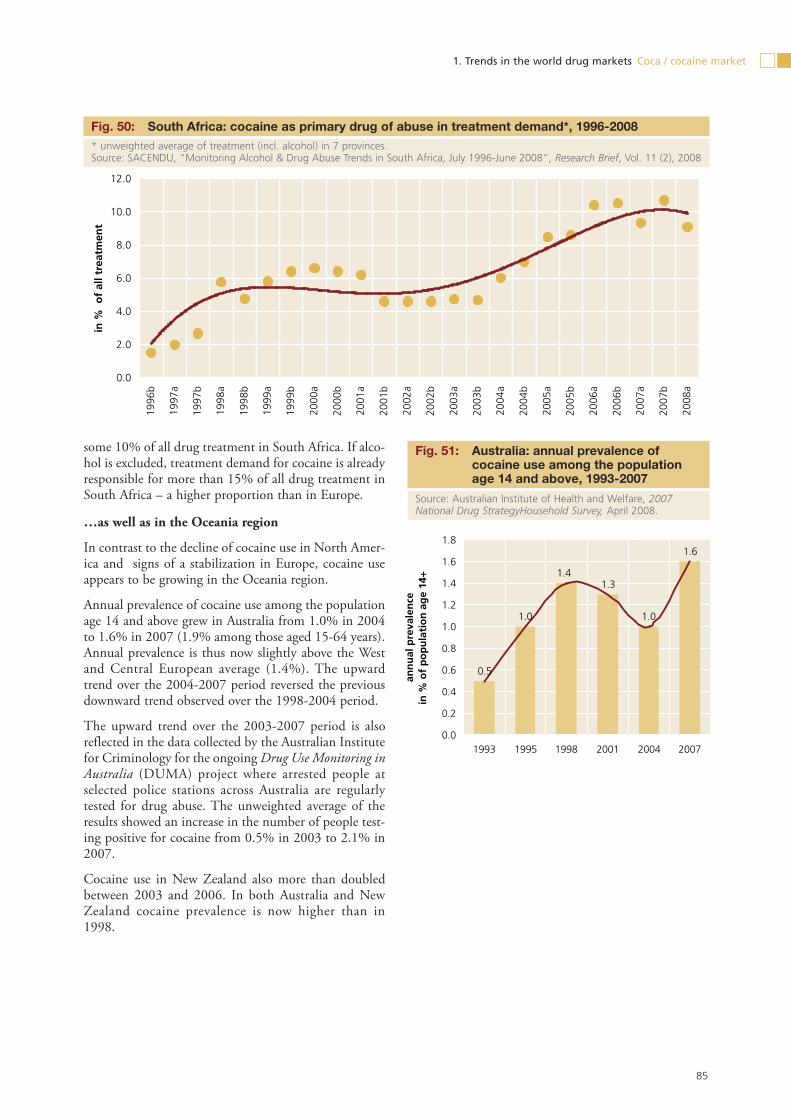
South Africa is one of the few countries which has some data to substantiate expert perceptions. Treatment data for South Africa show a strong increase of cocaine related treatment (incl. alcohol) over the 1998-2008 period, from a proportion of around 5% of treatment demand in 1998 to 9% of total treatment demand over the first two quarters of 2008. Data show that treatment demand for cocaine (incl. alcohol) is responsible for
Annual prevalence of cocaine use in six South American countries, 2006/07 in % of Fig. 48: population aged 15-64,
Source: Naciones Unidas Oficina contra la Droga y el Delito (UNODC) y Comisión Interamericana para el Control del Abuso de Drogas (CICAD), Elementos orientadores para las Políticas Públicas sobre Drogas en la Subregión, Lima 2008.
Uruguay: cocaine use among the population aged 12-65*, 1998-2007 Fig. 49:
* Age group 15-65 for survey in 1994; age group 12-64 in 1998 and in 2001; and age group 12-65 in 2007. Sources: Observatorio Uruguay de Drogas (OUD), Encuesta Nacional en Hogares sobre Consumo de Drogas 2007 and Secretaria Nacional de Drogas y Junta Nacional de Drogas, Encuesta Nacional de Prevalencia del Consumo de Drogas 2001.
2.67
1.68
1.31
0.66
0.310.11
0.540.36
0.62
0.09
0.43
0.14
0.0
0.5
1.0
1.5
2.0
2.5
3.0
Argentina Uruguay Chile Bolivia Peru Ecuador
Cocaine HCl Cocaine base
0.9% 1.0%1.3%
4.0%
1.4%
0.2%0.4%0.2%0.0%
1.0%
2.0%
3.0%
4.0%
5.0%
1994 1998 2001 2007
Life-time prevalence Annual prevalence
85
1. Trends in the world drug markets Coca / cocaine market
some 10% of all drug treatment in South Africa. If alco-hol is excluded, treatment demand for cocaine is already responsible for more than 15% of all drug treatment in South Africa – a higher proportion than in Europe.
…as well as in the Oceania region
In contrast to the decline of cocaine use in North Amer-ica and signs of a stabilization in Europe, cocaine use appears to be growing in the Oceania region.
Annual prevalence of cocaine use among the population age 14 and above grew in Australia from 1.0% in 2004 to 1.6% in 2007 (1.9% among those aged 15-64 years). Annual prevalence is thus now slightly above the West and Central European average (1.4%). The upward trend over the 2004-2007 period reversed the previous downward trend observed over the 1998-2004 period.
The upward trend over the 2003-2007 period is also reflected in the data collected by the Australian Institute for Criminology for the ongoing Drug Use Monitoring in Australia (DUMA) project where arrested people at selected police stations across Australia are regularly tested for drug abuse. The unweighted average of the results showed an increase in the number of people test-ing positive for cocaine from 0.5% in 2003 to 2.1% in 2007.
Cocaine use in New Zealand also more than doubled between 2003 and 2006. In both Australia and New Zealand cocaine prevalence is now higher than in 1998.
South Africa: cocaine as primary drug of abuse in treatment demand*, 1996-2008Fig. 50: * unweighted average of treatment (incl. alcohol) in 7 provinces. Source: SACENDU, “Monitoring Alcohol & Drug Abuse Trends in South Africa, July 1996-June 2008”, Research Brief, Vol. 11 (2), 2008
Australia: annual prevalence of Fig. 51: cocaine use among the population age 14 and above, 1993-2007
Source: Australian Institute of Health and Welfare, 2007 National Drug StrategyHousehold Survey, April 2008.
0.0
2.0
4.0
6.0
8.0
10.0
12.0
1996
b
1997
a
1997
b
1998
a
1998
b
1999
a
1999
b
2000
a
2000
b
2001
a
2001
b
2002
a
2002
b
2003
a
2003
b
2004
a
2004
b
2005
a
2005
b
2006
a
2006
b
2007
a
2007
b
2008
a
in %
of
all t
reat
men
t
0.5
1.0
1.3
1.0
1.6
1.4
0.0
0.2
0.4
0.6
0.8
1.0
1.2
1.4
1.6
1.8
1993 1995 1998 2001 2004 2007
ann
ual
pre
vale
nce
in
% o
f p
op
ula
tio
n a
ge
14+
86
World Drug Report 2009
Joint UNODC-WHO Programme on Drug Dependence Treatment and Care The Joint UNODC-WHO Programme on Drug Depend-ence Treatment and Care is a milestone in the develop-ment of a comprehensive, integrated health-based approach to drug policy that can reduce demand for illicit sub-stances, relieve suffering and decrease drug-related harm to individuals, families, communities and societies.
The initiative sends a strong message to policymakers regarding the need to develop services that address drug use disorders in a pragmatic, science-based and humanitarian way, replacing stigma and discrimination with knowledge, care, recovery opportunities and reintegration.
The programme is based on a global collaborative effort, under the leadership of UNODC and WHO. The col-laboration will include governments, health profession-als, nongovernmental organizations (NGOs) and funding agencies committed to increasing the coverage of essential services for drug dependence treatment and care.
Why UNODC and WHO together? UNODC and WHO both have constitutional mandates to address issues presented by drug use and dependence. Moreover, taking into account the health, socioeconomic and security implications of drug use and related disor-ders, the two agencies are uniquely positioned to lead this initiative. In particular, it will open a dialogue with Member States and involve a varied group of government ministries such as those for health and welfare, as well as the criminal justice system and other relevant sectors.
Objectives:Promoting and supporting worldwide (with a par- ticular focus on low- and middle-income countries) evidence-based policies, strategies and interventions that are based on a public health and human rights approach, in order to reduce drug use and the health and social burden it causes.
Recognizing drug dependence as a preventable and treatable multi-factorial health disorder; and recog-nizing the social advantages of investing in treatment: lowering health-related costs, improving security and contributing to social cohesion.
Bringing drug dependence treatment into the main- stream health care and social welfare system, without discrimination.
Promoting investment in comprehensive and re- sults-oriented programmes for drug dependence treatment and care, particularly community-based interventions.
The Joint Programme: Leads a global collaborative effort for improving 1.
coverage and quality of treatment and care services for drug use disorders in low- and middle-income countries.
Promotes the development of comprehensive and 2. integrated treatment systems that are able to deliver a continuum of care for drug users and link services at municipal and national levels.
Maps population needs, legislative frameworks and 3. available services and programmes for drug depend-ence treatment and care.
Supports policy and legislation revision to achieve 4. balance in drug policy and to support humane and effective drug prevention, treatment and care.
Develops low-cost outreach treatment and care ser-5. vices, and increases access in rural and remote areas.
Places prevention, treatment and care of drug use 6. disorders into the mainstream health care system, linking with NGOs and ensuring full coordination with the health care system, as part of an integrated continuum of care.
Provides alternative measures to imprisonment for 7. dependent drug users where appropriate and, where this is not possible, provision of drug-dependence treatment in prison settings.
Supports universities at the national level to promote 8. research and training curricula on drug dependence treatment and care.
Provides and supports training programmes for pro-9. fessionals involved in the provision of treatment and care for drug users, including those whose profes-sional primary focus is not in that area.
Develops international recommendations, guide-10. lines and standards aiming at the knowledge transfer from research to practice and supports adaptation and implementation at country level.
Supports regional networks of quality service pro-11. viders, working on drug dependence treatment, so-cial support services and HIV/AIDS prevention and care.
Seeks to assist the development of drug treatment 12. monitoring systems in countries, in ways that will facilitate not only a greater understanding of the drug situation within countries, but also between countries, for a better understanding of regional and global trends.