12-15-08 final state of the madison region report
TRANSCRIPT

State of the Madison Region
2008‐2009 Report
Issued in December 2008

2008‐2009 STATE OF THE MADISON REGION REPORT 2
Consulting Economist Terry Ludeman
Special Thanks to:
Eric Grosso, Economist Wisconsin Department of Workforce Development Matthew Kures, GIS Specialist University of Wisconsin‐Extension, Center for Community and Economic Development Andrew B. Lewis, Professor University of Wisconsin‐Extension, Center for Community and Economic Development
Report Prepared by: Sue Gleason, Thrive
Director of Regional Assets and Metrics
608‐443‐[email protected]
with assistance from Julia Popolizio, Thrive Project Specialist
andShane Wibeto, Thrive Project Assistant
MEDIA INQUIRIES TO JENNIFER
SMITH at 608‐443‐1961 OR

2008‐2009 STATE OF THE MADISON REGION REPORT 3
GROWING THE MADISON REGION’S ECONOMY IN WAYS THAT
PRESERVE AND ENHANCE QUALITY OF LIFE.
In order to begin a dialogue concerning our shared regional future in five, ten, twenty years and beyond, we need to understand the state of our eight‐county Madison Region today. Thrive’s first annual STATE OF THE MADISON REGION report is that tool, a report to foster a more complete and accurate view of our interdependencies as a region, so we can all move forward… together.
Planning for this report began in 2007 when the Thrive Quality of Life Committee launched a regional survey effort to find out what people cared about and how they thought the region was doing in key areas. Those findings served as the foundation for the development of this STATE OF THE MADISON
REGION report. This new report brings traditional economic indicators together with quality of life indicators for a unique set of quantitative measures that will help guide our decisions as a region and over time, will help monitor the long‐term impact of our region’s collective efforts.
Thrive intends to issue a STATE OF THE MADISON REGION report on an annual basis, and will include updates and changes to the measures as we learn what is most useful for the region. The report here is just the start of a long‐term process of monitoring and measuring performance and motivating action. As part of an ongoing process using the report, Thrive will focus on one key theme each month by engaging experts, delving into the nuances of the data, and providing insights into how we can use this data to celebrate our strengths and work together to better understand and tackle areas where there is room for improvement. Be sure to sign up for the Thrive Newsletter on any page of the www.thrivehere.org website to get the Monthly Insights. In addition, look for our Sector Snapshots in early 2009 and a Regional Innovation report mid‐year. We recognize that we are issuing this report at an unprecedented time in the world and in our nation’s history and expect that the next few years will bring changes and impacts to the region that no one can foresee. Nevertheless, we are excited to offer this report to the Madison Region and on behalf of the Thrive Board and staff we look forward to joining with all of our regional leaders and stakeholders as we embark on a new chapter in defining the Madison Region, celebrating its strengths and working together to make it even better.
Jennifer Alexander, Thrive President John Biondi, Thrive Board Chair

2008‐2009 STATE OF THE MADISON REGION REPORT 4
The Madison Region consists of the eight counties in south central Wisconsin that
cluster around the State Capital and contain some of the most
beautiful geography in the nation.
The region’s rich agricultural heritage combined with a world renowned university in the center
of the region, surrounded by a strong
manufacturing network of small, medium, and large firms creates a region that feeds, educates and builds the world.

2008‐2009 STATE OF THE MADISON REGION REPORT 5
TTaabbllee ooff CCoonntteennttss
Executive Summary 6‐7 Choosing our Peer Regions 8‐9 Choosing our Measures 9 State of the Region Themes
Life at Work 10 1. Employment Growth 2. Establishment Growth 3. Productivity 4. Employer Supplement to Wages 5. Per Capita Personal Income 6. Average Wage per Job
Life at Home 14 7. Home Ownership 8. Cost of Home Ownership per Income 9. Poverty Rate 10. Median Household Income
Life at School 16 11. 3rd Grade Reading and 5th Grade Math Levels 12. Eligibility for Subsidized Lunch 13. K‐12 Enrollment 14. High School Degree in Adult Population 15. Associates Degree in Adult Population 16. Bachelor’s Degrees and Higher in Adult Population
Life in our Communities 18 17. Population Change 18. Age Dependency 19. Crime Rate 20. Local Governments
Life on the Move 20 21. Biking or Walking to Work 22. Traveling Over 30 Minutes to Work 23. Vehicle Miles Traveled 24. Traffic Fatalities 25. Alcohol Impaired Drivers in Fatal Crashes
A Healthy Active Life 22 26. Low Birth Weight Births 27. Health Insurance Coverage 28. Fitness and Sports Centers 29. Air Quality Index‐ Ozone Days 30. Special Outdoor Places
Regional Maps 24 Additional Reports Planned in 2009 26

2008‐2009 STATE OF THE MADISON REGION REPORT 6
PPEEEERR RREEGGIIOONNSS LLiinnccoollnn,, NNeebbrraasskkaa CCoolluummbbuuss,, OOhhiioo SSaalleemm,, OOrreeggoonn
CCoolluummbbiiaa,, SSoouutthh CCaarroolliinnaa
RRiicchhmmoonndd,, VViirrggiinniiaa
EExxeeccuuttiivvee SSuummmmaarryy The first annual State of the Madison Region Report provides a unique set of regional economic and quality of life metrics. This annual report will inform us about where we are doing well, where we can improve, and will help regional decision‐makers make focused decisions in a collaborative manner for the good of the overall region. To ensure a comprehensive look at the region, we selected measures that tell the full story about our region. To that end, there are thirty individual metrics grouped into six topic areas to cover all aspects of life.
In addition to reporting on the overall “health” of the Madison Region, metrics are included for five peer regions, and when appropriate, for the state and the nation. There might be some surprise at the five regions that were chosen as our representative peers as they are not the usual areas that are often compared Madison. But they are unique similar in many ways to our region as a whole and will serve us well as overall benchmark regions. They were chosen based on key similarities such as being a State Capital and having a major university important to the region. They are all key regions in their states but not the primary metro region. These are important features to benchmark against, but we recognize that a different set of regions might be chosen to look at related to specific aspects of the region. In fact we may compare ourselves to others for reports with a different focus such as the Sector Snapshots or Regional Innovation report. See page 8‐9 on more about choosing these peer regions.
Thrive’s objective with this report is to inform and to spur action for individuals and organizations in the region as we move toward a shared regional vision. The metrics used are objective, quantitative measures of specific aspects of our region, chosen for this inaugural report with guidance from the Summary of the Madison Region Quality of Life Indicators. We anticipate changes over the coming years as we fine‐tune our metrics to best tell our story and help us grow together as a region. Still to come in 2009 are Monthly Insights to further explore these measures, Sector Snapshots on our targeted three sectors of agriculture, biotechnology and healthcare, and planning is underway for a mid‐year Regional Innovation report.
Life at Work ‐ Work is one of the activities in life that give us meaning, an opportunity to contribute, to create, and to provide for our families. The kinds of work we do help define our communities and our region. o Per capita income, including all forms of income, was quite high in the Madison Region, estimated at
$36,071, 3rd among the peer regions with the weighted peer average at $35,006.
o For wages per job, the Madison Region averaged $36,348; lower than the peer average of $38,001 but placing 3rd, behind the Columbus, OH and Richmond, VA regions.
o Employer contributions to pension and insurance funds, ranged from a low of 15.7% of wages/salaries to a high of 18.6% with the Madison Region at 16.7%.
o Productivity is an important measure of output per measured input. Every dollar paid for wages and salaries produced $1.71 in the Madison Region and the highest was Columbus, OH at $1.78, a seemingly small gap that translates to a difference of $1.75 billion per year.
o In growth of business establishments, the Madison Region, at 8.5%, was slightly above the 8.1% average for the peer regions.
o Actual employment growth in most of the peer regions has been quite robust at 7.1% over the period from 2001 to 2006. The Madison Region was second at 8.4% with Salem, OR leading at 10%.

2008‐2009 STATE OF THE MADISON REGION REPORT 7
EExxeeccuuttiivvee SSuummmmaarryy Life at Home – The shelter of a home has always been one of the most important components of quality of life along with having the means to care for one’s family. Success at school and at work often starts at home. o The Madison Region has the 3rd highest rate of ownership compared to the peer regions, but ranks 2nd in
terms of the percent of household income that goes to mortgage costs.
o Our region boasts the lowest poverty rates among the peer regions but has seen the 3rd highest increase in the percent of the population in poverty from 2000 to 2005.
Life at School – Education has become widely recognized as a foundation of both quality of life and economic vitality. We must have an adequate and well‐educated pipeline for the future.
o Looking at just the Madison Region since 2005, 5th graders have increased 2.2% in math skills, while 3rd graders dropped 1.7% in reading skills.
o From 2000 to 2005, the Madison Region declined in overall K‐12 enrollment, rebounding slightly in 2007 but still lagging our peers.
o Again just for the Madison Region, the percentage of children that met poverty thresholds to be eligible for subsidized lunches increased from 17.8% in 2000 to 25.7% in 2007, now over a quarter of the children in our region’s schools.
o Among our peer regions adult populations, we have a high percent of high school graduates, the 2nd highest in associate’s degrees, and are 4th in bachelor’s degrees or better.
Life in our Communities – Vital and safe communities contribute immensely to the quality of life in the Madison Region and are at the heart of what makes this region such a great place to live. o The Madison Region has the lowest rate of violent and property crime combined of the peer regions.
o Our population growth lagged behind all but one of the other peer regions from 2000 to 2007.
o We have the 2nd highest number of local governmental units per 10,000 in population among the peers.
Life on the Move – How we get from one place to the other is more important than ever and will help define our region in the future. o The Madison Region is the highest among the peer regions in walking
or biking to work and 2nd lowest in traveling over 30 minutes to work.
o Our traffic fatalities per capita have decreased since 2000 compared to the peer regions.
o Compared to our peer regions, we were #1 in 2000 and #2 in 2007 for alcohol impaired drivers involved in those fatal crashes.
Living a Healthy, Active Life – Health and activity go hand‐in‐hand and are important components of our regions’ quality of life. o Among the peers, the Madison Region was 1st for health insurance coverage in 2000 and 3rd in 2007.
o The Madison Region has the 2nd lowest percentage of low birth weight births of the peer regions.
o Somewhat surprisingly, the region has the lowest number of fitness centers per 1,000 of population.
o Related to air quality, the region had the 2nd highest increase in ozone days from 2000 to 2007.
o Our region is 2nd in the number of special places like national and state parks, and rails to trails.

2008‐2009 STATE OF THE MADISON REGION REPORT 8
CChhoooossiinngg oouurr PPeeeerr RReeggiioonnss
LLIINNCCOOLLNN,, NNEEBBRRAASSKKAA AANNDD AA SSIIXX‐‐CCOOUUNNTTYY SSUURRRROOUUNNDDIINNGG AARREEAA See pages 24‐25 for detailed maps
Population 342,300, and 19 percent of Nebraska’s total population Growth 16 percent growth from 1990 to 2000, and 8 percent from 2000 to 2007 Features State Capital; University of Nebraska; Lincoln is 40 miles from Omaha, the largest city
CCOOLLUUMMBBUUSS,, OOHHIIOO AANNDD AANN EEIIGGHHTT‐‐CCOOUUNNTTYY SSUURRRROOUUNNDDIINNGG AARREEAA Population 1,754,300, and 15 percent of Ohio’s total population Growth 14.8 percent growth from 1990 to 2000 and 8.8 percent from 2000 to 2007 Features State Capital; Ohio State University; Columbus is Ohio’s largest city but slightly smaller
than the metro areas of Cincinnati and Cleveland
CCOOLLUUMMBBIIAA,, SSOOUUTTHH CCAARROOLLIINNAA AANNDD AA SSIIXX‐‐CCOOUUNNTTYY SSUURRRROOUUNNDDIINNGG AARREEAA Population 716,000, and 15 percent of South Carolina’s total population Growth 18 percent growth from 1990 to 2000 and 10.6 percent growth from 2000 to 2007 Features State Capital; University of South Carolina; South Carolina’s largest metro area, although
the City of Charleston is a somewhat larger city than Columbia
SSAALLEEMM,, OORREEGGOONN AANNDD AA FFIIVVEE ‐‐CCOOUUNNTTYY SSUURRRROOUUNNDDIINNGG AARREEAA Population 925,000, and 25 percent of Oregon’s total population Growth 15.7 percent growth from 1990 to 2000, and 8.8 percent growth from 2000 to 2007 Features State Capital; University of Oregon at Eugene and Oregon State University at Corvallis,
region contains three mid‐size cities; Salem, Corvallis and Eugene, and is 35 miles south of Portland, Oregon’s largest city
RRIICCHHMMOONNDD,, VVIIRRGGIINNIIAA AANNDD AA SSIIXXTTEEEENN‐‐CCOOUUNNTTYY AARREEAA,, PPLLUUSS FFOOUURR CCIITTIIEESS Population 1,220,000, and 15 percent of Virginia’s total population Growth 15.6 percent growth from 1990 to 2000, and 11.2 percent from 2000 to 2007 Features State Capital; University of Richmond; and near two super metros, the Virginia
Beach/Newport News, Norfolk metro and of course the Washington, D.C metro. Also nearby are several other well known colleges and universities
MMAADDIISSOONN,, WWII AANNDD AANN EEIIGGHHTT‐‐CCOOUUNNTTYY SSUURRRROOUUNNDDIINNGG AARREEAA Population 977,500, and 17 percent of Wisconsin’s total population Growth 11 percent growth from 1990 to 2000, and 8.3 percent growth from 2000 to 2007 Features State Capital; University of Wisconsin‐Madison; 2nd largest metro area in WI, between
Milwaukee, Chicago, and Twin Cities
Salem OR Region
Lincoln NERegion
Madison WIRegion
Columbus OHRegion
Columbia SC Region
Richmond VA Region

2008‐2009 STATE OF THE MADISON REGION REPORT 9
CChhoooossiinngg oouurr PPeeeerr RReeggiioonnss These five regions were chosen because they possess many of the same advantages present in the Madison Region, including their respective State Capitals and therefore the seat of their state governments, and the presence or close proximity to a major University. They are not the largest area in their states, but they have enough of their respective state’s population to be vital in their own right. They have research and innovation occurring at their universities, stable economies anchored by state government employment, and other employment opportunities in vibrant private sectors.
The metropolitan areas included have gross domestic product ranging from $10 billion to $75.4 billion. The Madison Region metro areas combined, Janesville/Beloit and Madison, are near the middle, with about $35.1 billion. The 2005 gross domestic product ranges from $23,362 per capita to $41,776 per capita for all the peer regions. The combined Madison and Janesville metro area is about $39,360 per capita, slightly over $38,095 which the mean for all of the regions.
Each of these region’s populations grew at a fast pace. In the period from 1990 to 2000, the average growth was 16.2 percent, led by Columbia, South Carolina at 18 percent. The Madison Region metros were actually the slowest growing metro areas with a 14.4 percent growth. Between 2000 and 2007, these areas have grown on average about 9.6 percent. Richmond, Virginia was the fastest growing at 11.2 percent, while Lincoln, Nebraska grew the slowest at 8.0 percent. The Madison Region grew from a population of 902,871 in 2000 to 977,470 in 2007, a growth of 8.3 percent, slightly below the average for these regions.
CChhoooossiinngg oouurr MMeeaassuurreess A metric is an objective, quantitative measure that describes some aspect of our region—economic, social, cultural, and environmental—over time. Our goal was to select measures that address both quality of life and economic measures. Based on guidance from the recent Madison Region Quality of Life Indicators Summary, as well as research on other regional indicators/metrics reports, the measures are organized into eight themes: Life at Work, Life at Home, Life at School, Life in our Communities, Life on the Move, and Living a Healthy, Active Life. To ensure that the effort is doable, sustainable, and credible, we have established guidelines for choosing the metrics that will be used:
1. The data must be publicly available without charge. 2. The data should be available at the county level across the nation for comparisons to peer regions.
However, locally collected data is used occasionally to augment or highlight more recent regional data. 3. The data must be the most current available. 4. The data selected must be available at least to 2000 to show trends. 5. The metrics should be actionable, suggesting an important issue for regional leaders to address.
BBUUTT WWHHYY NNOOTT ____________________??
Several capital regions were not chosen due to an overwhelming size compared to their respective states.
o Minneapolis/St. Paul, Indianapolis, Phoenix, Oklahoma City, and Atlanta were not chosen for this reason.
Other regions that were initially considered were ultimately not selected because they were not as dominant in their states as the Madison Region.
o Austin, Texas is often compared to Madison, but the Austin region is only 6 percent of the population of Texas and doesn’t have the same statewide political and economic clout in Texas that Madison does in Wisconsin.
o Lansing, Michigan and Montgomery, Alabama are also too small in their respective states to make the “short list”.

LLiiffee aat
Industry ERegion is stransportarepresentethe profeswhile the tpaying indregions is a
Edu
Nat
Professi
Trade,
Work is onprovide focommunit
Income cavariety of and a meaprovided a
tt WWoorrkk
mployment cstrongest in joation and utilied in jobs in tsional and butrade, transpoustrial sectoralso in the low
Co
ucation & Healt
Financia
In
Leisure &
Man
tural Resource
Oth
ional & Busine
Public Adm
Transportatio
ne of the thinor our familieties and our r
an mean seveincome meaasure of grossand discussed
comparisons obs in the maties sector, athe professionusiness servicortation and rs, the wage sw‐ to middle
SSoouurrcc
0.0%
onstruction
th Services
al Activities
nformation
Hospitality
nufacturing
s & Mining
er Services
ss Services
ministration
n, Utilities
Ind
ngs in life thats. The kinds oregion. Our in
eral things to sures. We ws product. Asd per capita,
10
between the nufacturing snd the leisurenal and busines sector andutilities sectostructure for trange.
ccee:: UUSS CCoommmmeerrcce
% 2.0% 4.0
dustry Sect
Madison
t gives us meof work and tndustry struc
both economill use wages s the regions or, when app
2008‐20090
Madison Regsector, with ge and hospitaess services sd the financiaor and the leisthe Madison
ee,, BBuurreeaauu ooff EEccoo
0% 6.0% 8.0
tor Employ
Region Pe
aning, an opphe income thcture helps us
mists as well aper job, per care varied in propriate, per
9 STATE OF THE
gion and the greater than aality sector. Tsector, and inl services secsure and hospRegion in com
oonnoommiicc AAnnaallyyssiiss,,
0% 10.0% 12
yment ‐ 20
eer Averages
portunity to chat we gain frs understand
as people in gcapita personpopulation, er job.
E MADISON RE
peer regions average repreThe Madison n the financiator tend to bpitality sectormparison to s
,, 22000066
2.0% 14.0% 1
006
contribute, toom that workthe region fu
eneral. This nal income, vaeach of these
EGION REPORT
finds the Maesentation in Region is lessl services secte high‐payingr tend to be losome of the p
6.0% 18.0% 2
o create, and tk help define rther.
report presenalue of benefe measures w
T
dison the trade, s tor. As g jobs ower‐peer
20.0%
to our
nts a fits ill be

Employme7.1 percenRegion at percent. I
As employpeer regioregions experhaps thmanufactu
Another inemploymeproprietorincreased proprietorself‐emplo Establishmlooks at thnumber ofestablishmemploymeperiod of 2The six peeaggregate The Madisabove the regions wiincrease. region hadduring thepercent in
MLinc
ColumSa
ColumRichmAverag
1.
ent Growth Fnt. The Salem8.4 percent. n all peer reg
yment in totaln lost employperienced anhe greatest exuring base, ex
nteresting pheent. Althoughr’s employmeby 4.9 percenr’s employmeoyment as we
ment or firm ghe increase in f business ments with soent activity du2001 througher regions saw8.1 percent ison Region waverage for tith an 8.5 perThe Lincoln Nd the fastest g period with crease.
Madison Regioncoln NE Regionbus OH Regionlem OR Regionmbia SC Regionond VA Regionge Peer Region
Wisconsin
Employment
rom 2001 to m, Oregon regDuring that s
gions except C
Source: U
l was growingyment, led by 11.8 percentxposure in emxperienced on
enomenon is h wage and sant increased nt, while propnt has becomell as locally o
growth the
me uring the 2006. w an ncrease.
was slightly the peer rcent Nebraska growth a 12.3
4.3
4
nnnnnnnn
t Growth 200
11
SSoo
Ma
Linco
Columb
Sale
Colum
Richmo
2.
2006, all peeion reported same period, Columbus, Oh
S Commerce, Bu
g, there werey a loss of 18.t decrease in mployment innly a 7.3 perc
the increase alary employm25.6 percentprietor’s empme 18.9 percewned busine
8.47.3
310
87.77.1
.7
00 to 2006
2008‐20091
oouurrccee:: UUSS CCoommmm
adison Region
oln NE Region
us OH Region
em OR Region
bia SC Region
nd VA Region
WI
US
Peer Average
. Growth in E
r regions expthe fastest gpopulation ghio, employm
ureau of Econom
structural em9 percent in tmanufacturin manufacturient decline.
in proprietorment on aver. In the Madloyment increent, very nearsses paying w
‐17
‐18.9
9 STATE OF THE
eerrccee,, BBuurreeaauu ooff
Establishme
perienced emrowth, at 10.grew for the sment growth o
mic Analysis, 200
mployment chthe Richmondng employmeng based on
r’s employmerage for the pison Region, weased by 26.1rly one‐fifth owages to the o
‐17.3
‐9
‐11
Manufactu
E MADISON RE
EEccoonnoommiicc AAnnaallyy
8.5
4.6%
9
9
8.1%
ents ‐ 2000 t
ployment gro0 percent, fosix peer regionoutpaced pop
00 to 2006
hanges. Mand, VA region. ent. The Madits relatively s
ent as opposepeer regions inwage and sal1 percent. In of total emploowner.
‐7.311.2
‐1.9‐10.8
1.8‐8.5
LiColu
SColRichAver
uring Change
EGION REPORT
yyssiiss,, 22000066
5%
12.3%
11.7%
9.3%
9.0%
9.1%
10.0%
%
o 2006
LLiiffee aatt
owth. The avellowed by thens, averagingpulation grow
nufacturing in On average,dison Region, stronger
ed to wage anncreased 3.8ary employmthe Madison
oyment. This
Madison Regiincoln NE Regimbus OH RegiSalem OR Regiumbia SC Regimond VA Regirage Peer Regi
Wiscon
2000 to 2006
T
%
WWoorrkk
erage was e Madison g 6.2 th.
each , the peer with
nd salary percent,
ment n Region, includes
ionionionionionionionsin
6

LLiiffee aat
Productiviper input, input of toRegion it wfigure is $1
Although tlike a smalvariance injob of $47, “Fringe Beby looking salaries. Coranged fropercent in percent in pensions asocial insuthe peer reaverage emgovernmeand salarieas well. Alcontributiosame throthe Salem,high, and tVA region
MadisLinc
ColumbSal
ColumRichmo
tt WWoorrkk
Source: US
ty is an extreusually a labootal employerwas $1.71. Th1.77, and for
the differencel differential,nto perspectiv,155 equals a
enefits” can bat employer ontributions fom 15.7 perce2006. The pemployer co
and insurancerance. The Megion averagmployer contnt social insues, and the Mlthough it woons for goverughout the re, OR region hathe Columbushad a low of
son WI Regioncoln NE Regionbus OH Regionem OR Region
mbia SC Regionond VA Region
WIUS
Peer Average
3. Amount
S Commerce, Bu
emely importaor cost figurer wage and sae highest outWisconsin th
e between $1, using the nuve. The avera productivity
be roughly estsupplementsfor insuranceent of wages aeer regions antributions foe funds not coMadison Regige, at 16.7 peribution for erance was 7.4
Madison Regioould be expecnment insuraegions, this wad an 8.8 pes, OH region a7.2 percent.
1.55 1.6
Productivity Produced pWages/Sa
12
ureau of Econom
ant metric as . The figure ualary input. Thtput was repoe figure was
1.71 and $1.7umber of wagage peer regi difference be
timated s to wages ane and pensionand salaries tveraged 16.6or employee ounting goveron was just arcent. The peemployee 4 percent of won was at thatted that empance would bwas not the carcent figure fand the Richm
1.631.67
1.6
1.65 1.7
y Measureper Dollar Paalaries
2008‐20092
mic Analysis, 200
it looks at thused here is thhe peer averaorted for the reported at $
8 as reportede and salary jon had 530,4etween $1.71
nd ns to 18.6 6
rnment above eer
wages t figure ployer e the ase as for a mond,
1.711.76
1
1.768
1.71.72
7 1.75
aid in
9 STATE OF THE
Source: US C
1
4.Wa
06
e value of thehe dollar valuage for this figColumbus, O$1.68.
d for Madisonjobs and the 421 salary job1 and $1.78 o
61.78
77
1.8
E MADISON RE
ommerce, Burea
16.7%16.6%15.
Employer Sage/Salary ‐
Ben
e products prue of Gross Stgure was $1.7H region at $
n and Columbaverage disbus at an averaof output of $
In ProRegionand rig
In EstaMadisothe pee
EGION REPORT
au of Economic
7%
18.0%18.6%
Supplements2006 or "Frefits"
roduced basetate Product p72. For the M1.78. The nat
bus, respectivursement putge disbursem1,750,826,19
ductivity, the is 3rd among ht at the Pee
ablishment Gon Region waer average.
T
Analysis, 2006
%
16.4%16.6%
s to ringe
ed output per dollar adison tional
ely, seems ts the ment per 90.
e Madison the peers
er Average.
rowth, the s above

Per CapitainvestmenRegion in aaverage wapproximaincome, atthe strong
Wages perworkers anindustries on the areconcentratlawyers, ensmall comRegion has
MadiLinc
ColumbSal
ColumRichmo
In averMadiso
Source: US Co
a Personal Incts. The PCPI fa strong thirdas $35,006, aately six percet about 86 peest growth of
r Job Wagesnd is normallyhaving wagesa where the etion of emplongineers), finmunities ands an average o
son WI Regioncoln NE Regionbus OH Regionlem OR Regionmbia SC Regionond VA Region
WIUS
Peer Average
5. Per C
rage wage peon Region ran
ommerce, Burea
come Personafor the Madisd place amongand the nationent higher tharcent of the nf any of the o
s per job is bay compiled pes double the wemployment oyment in higancial service small urban of $36,348; th
nnnnnnI
e
Capita Perso
r job, the nked 3rd..
13
au of Economic A
al income is dson Region wag the peer regnal figure wasan the Madisonorm for the other peer reg
S
sed on place er industry. Twages in otheis measured.h paying serves, or informaareas. It therhe peer avera
onal Income
$38,
PeAver
2008‐20093
Analysis, 2006
defined as all as quite high,gions, close tos $36,744. Ricon Region. Thpeer regions.gions.
Source: US Com
of work dataThere is a greaer industries.. Areas with dvice sectors suation servicesefore has lowage was $38,0
$36,$33,17
$36,$30,065$32,614
$3$34,4$36
$35,0
e ‐ 2006
,001$42,223
eer rage
RichmondVA
Region
9 STATE OF THE
income from, at $36,071 fo the Columbchmond, VA, he Salem, OR. Since 2001,
merce, Bureau o
a. It measureat variation in The structurdense populatuch as profess. The Madisower wages tha001.
,0719,110
438,233606,744006
3 $35,654 $3
d Columbia SC Region
SalR
6. Average W
E MADISON RE
wages, businfor 2006. Thisbus, OH regiohad the highregion had ththe Richmon
of Economic Ana
s the wages an wages per inre of industry tion often hassional and teon Region conan the peer a
33,565 $40,3
lem OR egion
ColumbOH
Regio
Wage per Jo
Per capimeasureindividuaMadisonamong pstate and
EGION REPORT
LLiiffee aatt
ness enterpriss put the Madn. The weightest per capitahe lowest perd, VA area ha
alysis, 2006
and salary paindustry, withemploymentve heavier echnical servicnsists of a numverage. The M
50 $32,710
bus
on
Lincoln NE
Region
ob ‐ 2006
ta income is ae of all incomals and the n Region rankpeers, ahead d the nation.
T
WWoorrkk
se and dison ted peer a income, r capita as seen
id to some t depends
ces (i.e., mber of Madison
$36,348
Madison Region
a e for
ked 3rd of the

LLiiffee aat
The sheltealways beimportantquality of having theone’s fam
Success atoften star
Theranpeeow
Theat tfor incotha
Thto owissmadrpanewithhacope
tt HHoommee
er of a homeeen one of tht componenlife along we means to c
mily.
t school andrts at home.
Madison Renks 3rd amoner regions fonership.
e Madison Rthe national mortgage coome, slightlyn the peer a
his is a difficuaddress hom
wnership andsues as the harket has chamatically inast two yearsext Census inll help us see Madison Ras fared in thompared to oeers.
ee
e has he most ts of
with care for
d at work
egion g the or home
egion is average ost per y more average/
ult time me d cost housing anged n the s. The n 2010 e how Region his area our
14
Ma
L
Colu
Colu
Rich
Mad
Lin
Colum
S
Colu
Richm
2008‐20094
adison WI Regi
Lincoln NE Regi
umbus OH Regi
Salem OR Regi
umbia SC Regi
hmond VA Regi
7. H
dison WI Regio
ncoln NE Regio
mbus OH Regio
Salem OR Regio
mbia SC Regio
mond VA Regio
W
U
Peer Averag
8. Homeo
9 STATE OF THE
Source: US C
Source: US C
ion
ion
ion
ion
ion
ion
WI
US
ome Owner
on
on
on
on
on
on
WI
US
ge
owner Cost a
E MADISON RE
Census, 2000
Census, 2000
62.9%
63.0%
63.1%
rship Rate ‐ 2
20.2%
20.2%
2
2
as % of Inco
EGION REPORT
65.3%
68.7
68.4
66.2%
2000
21.8%
21.1%
21.0%
0.9%
21.7%
21.2%
me ‐ 2000
T
70.2%
7%
%
23.1%

Source: US
Source: US
Madi
Linc
Columb
Sal
Colum
Richmo
9
Madis
Linc
Columb
Sale
Colum
Richmo
S Census, Small A
S Census, Small A
son WI Region
coln NE Region
bus OH Region
lem OR Region
mbia SC Region
ond VA Region
WI
US
9. Poverty Ra
2005
son WI Region
coln NE Region
bus OH Region
em OR Region
mbia SC Region
ond VA Region
WI
US
10. Median
Area Income an
Area Income an
n
n
n
n
n
n
I
S
ate ‐ % Popu
5 All ages %
Household from 2000
15
d Poverty Estim
d Poverty Estim
6.9%
8.2%
9.2%
8.1%
9.6%
10
10
ulation ‐ 200
2000 All age
3.7%
5.8
5.9
Income ‐ % to 2005
2008‐20095
ates, 2000 and 2
ates, 2000 and 2
%
11.7%
11.4%
11.9%
11.3%
%
0.5%
13.3%
15.7
13.9%
13.0%
0.2%
13.3%
00 to 2005
es %
6.9%
1
9.8
%
11
9%
10
increase
9 STATE OF THE
2005
2005
%
10.8%
8%
1.3%
0.1%
Atds
Hint
Dtinhkinloo
E MADISON RE
L
Adequate inche most impdeterminantuccess and q
Lowestin 2005peers, tnation,highest2000 topeers aincreasthan W
Fourth incomecomparlaggingahead o
Household inncome fromhe househo
During the saime, our povncreased anhousehold inkeep pace wndication of ower wage jour region’s
EGION REPORT
LLiiffee aatt HH
come is one portant s of economquality of lif
% poverty r5 compared tthe state an though 3rdt % increase o 2005 amonand a higher e in poverty
WI and the U.
in househole increase red to peers the US, andof WI.
ncome calcum all workers ld.
ame period overty rate d our mediancome did noith our peeran increaseobs for morworkers.
T
HHoommee
of
mic e.
rate to d the
from ng
y rate S.
ld
s, d
lates in
of
an ot s, an e in re of

LLiiffee aat
Education hrecognized both qualityvitality. Weadequate apipeline for
Preparationlevel is crucacademic sgrade readito read” shlearn,” and where basicachieved tomath skills.
In ththe Mseen 3rd grabove
In ththe Mseen of 5th
proficmath
SinceRegioperceincomfor su
Enroin thfromwas 2007Regi
tt SScchhoooo
has become was a foundaty of life and ee must have and well‐educr the future.
n at the elemcial for futureuccess. We loing, where “leifts to “readin5th grade mac skills need to build higher
he past three Madison Regioa decline in trades readinge grade level.
he past three Madison Regioan increase i
h graders withcient or adva skills.
e 2000, the Mon has seen aent increase ime children eubsidized mea
ollment has dehe Madison Rm 2000 to 200slight increas7 for the Madion.
ooll
widely ion of economic an cated
entary e ook at 3rd earning ng to ath, to be r level
years, on has the % of g at or .
years, on has n the % h nced
Madison n 8 n low ligible als.
eclined egion 05. There se in dison
16
So
Source: Enroon Kids based
8
M
Lin
Colum
S
Colu
Richm
2008‐20096
Source: Madiso
ource: Madison Re
ollment Data frod on data contri
83.7%
78.1%
2005
P3rd Grad
3rd Grade R
17.8%
2000
Increfor S
Madison Regio
ncoln NE Regio
mbus OH Regio
alem OR Regio
umbia SC Regio
mond VA Regio
W
U
13. K‐12 E
9 STATE OF THE
on Region only – W
gion data only – W
om Annie E. Casebuted form each
83.4%
7
200
11. MadisoProficient orde Reading a
Reading Level
24.4
200
12. Madisease in K‐12Subsided Lun
Inc
‐0.12
2
‐1.15
‐0.49
on
on
on
on
on
on
WI
US
Enrollment C
E MADISON RE
Wisconsin Departm
Wisconsin Departm
ey Kids Count Coh state educatio
79.2%
06
on Regionr Advancedand 5th Grad
5th Grad
40% 2
05 2
son Region Students Elnch due to Fome
.00
3.42
6
3.78
Change 2000
EGION REPORT
ment of Public Inst
ment of Public Inst
ommunity‐Level on department, 2
82.0%80.3%
2007
de Math
e Math Level
25.7%
2007
ligible Family
6.08
0 to 2005
T
truction WINSS
ruction WINSS
Information 2000 to 2005
%
11.24

MadiLinc
ColumbSal
ColumRichmo
MadiLinc
ColumbSal
ColumRichmo
Mad
Lin
Colum
Sa
Colu
Richm
Source: US
Source: US
Source: US
son WI Regioncoln NE Regionbus OH Regionlem OR Regionmbia SC Regionond VA Region
WIUS
14. High SAdult P
son WI Regioncoln NE Regionbus OH Regionlem OR Regionmbia SC Regionond VA Region
WIUS
15. AA
dison WI Regio
ncoln NE Regio
mbus OH Regio
alem OR Regio
mbia SC Regio
mond VA Regio
16. BachA
Census, Educati
Census, Educati
Census, Educati
nnnnnnIS
School DegrPopulation o
nnnnnnIS
Associates DAdult Popula
on
on
on
on
on
on
elor's DegreAdult Popula
17
ion Attainment,
ion Attainment,
ion Attainment,
8281.5
80.4%
ree or Higheover 25 yrs ‐
5
Degrees in tation ‐ 2000
ee or Higheration ‐ 2000
2008‐20097
2000
2000
2000
87.9%88.9%
85.7%
.1%5%
85.1%%
er in the‐ 2000
8.0
5.7%7.0%7.4%
.1%7.5%
6.3%
he
27.6%
29.0%
28.3%
24.0%
26.6%
27.8%
r in the
9 STATE OF THE
%
91.4%
0%8.6%
Itcsinesc
Rasmhpra
HncMn
RofrInHrRra
E MADISON RE
LL
t is more impcontinue educchool, both tn demand secembrace life‐lkill upgradingcentury globa
Regardless of against our petrive to impromeasures as whave residentsprosper and cegion due to and skills.
2nd schhigpo
2nd deg
4th bachig
High school grnot included acalculated uniMadison Regionation.
Recently releaon high schoorom the UW nstitute in theHealth Rankinange across tRegion from 5anking betweamong WI cou
EGION REPORT
LLiiffee aatt SS
ortant than ecation beyondo achieve degctors and alsoong learning g for the 21st l economy.
where we raeers, we mustove on all of twe cannot affs unable to ontribute to ta lack of edu
highest high hool diploma gher in adult pulation
highest assogree
highest with chelors’ degrgher
raduation ratas these are niformly in theon or across t
ased informatol non‐complePopulation He 2008 WI Congs indicates athe Madison 5.7 to 13.9 peeen 23 and 65unties.
T
SScchhooooll
ever to d high grees o to and
nk t these ford to
the cation
or
ciate’s
ee or
es are not e the
tion etion ealth ounty a
rcent, 5

LLiiffee iinn
Vital acontribqualityRegionwhat mgreat p
Htna
TdMe4a
An intemeasuwhich 65+ agworkinchild da low navailabfuture. For theRegionratio—of the indicatfor theshortafor the The avdepenpopulaMadiso
nn oouurr CCoo
nd safe commbute immensey of life in then and are at thmakes this regplace to live.
Higher populathan the statenation, but 2n
among peer r
The populatiodependency rMadison Regiestimated at 43.6, the loweamong the pe
eresting popuure is the depelooks at the 0ge cohorts agang age populaependency ranumber of yoble for work in.
e 0‐14 cohortn registered a—good for nowpeer regions tive of a saggie area and a pge of entry lee future.
verage peer redency ratio foation was 16.3on Region at
oommmmuunn
munities ely to the e Madison he heart of gion such a
ation growth e or the nd to last regions
on ratio for ion was a total of est figure eer regions.
ulation endency ratio0‐14 and the ainst the ation. A low atio indicatesoung people n the near
t the Madison 27.1 percentw, but lowestand an ing birth totapotential evel workers
egion or the 65+ 3 percent the16.5 percent
18
niittiieess
C
R
C
C
R
o
s
n t t
l
e .
2008‐20098
Source: U
Sourc
Madison WI R
Lincoln NE R
Columbus OH R
Salem OR R
Columbia SC R
Richmond VA R
17. %
Madison R
Lincoln NE R
olumbus OH R
Salem OR R
Columbia SC R
Richmond VA R
Peer Av
18. Age
0‐14
9 STATE OF THE
US Census, Popu
ce: US Census, P
Region
Region
Region
Region
Region
Region
WI
US
Population
Region
Region
Region
Region
Region
Region
erage
Dependenc
4 Child Depend
E MADISON RE
lation Estimates
Population Estim
4
Change ‐ 20
27.1
28.6
31.0
27.7
28.9
28.6
29.0
cy Ratio ‐ Ag
dency 65+
EGION REPORT
s, 2000 to 2007
mates, 2006
7.
7.0
4.06
5.47
000 to 2007
16.5
17.0
14.
19.5
13.8
16.5
16.1
ges 0‐14 & 6
+ Dependency
T
.15
03
7.68
7.79
9.34
9.16
0
6
5
1
5+
y

Madi
Linc
Columb
Sal
Colum
Richmo
1
0.001.002.003.004.005.006.007.008.009.0010.00
Source: U
son WI Region
oln NE Region
bus OH Region
lem OR Region
mbia SC Region
ond VA Region
WI
US
19. Total Vio
3.48
8.6
00000000000
20. Local G
Total
Schoo
Specia
Source
US Census, Local
n
n
n
n
n
I
S
olent and ProResidents
2
1.892
Government
Local Govts. Pe
ol Districts per 0
al Districts per
19
e:
Governments, 2
29.
28.
operty Crims ‐ 2005
2.64
0.94
ts per 10,00
er 10,000
0‐19 Ages oer
10,000
2008‐20099
2002
.0
49
47.4
38.7
4
37.0
e per 1000
0.55
3.86
00 ‐ 2002
10,000
9 STATE OF THE
LLiiffee
9.2
51.8
52.6
4
6
E MADISON RE
iinn oouurr CC
Our communsafe places foproperty andand cost‐effegovernments
Lowestcapita
2nd Higtotal lounits
Local governan interestinand includes villages, schospecial districsewer, and w The Madisonreflects the logovernment doubt contribof life. The questionwhether the comes at a pwhether we efforts to shasome case comakes sense governments
EGION REPORT
CCoommmmuu
nities need toor both peopd we need accective local s and schools
t crime rate p
hest numberocal governm
ments per cag measure ofall cities, tow
ool districts, acts such as firwater.
n Region’s ranong history oin Wisconsin butes to our q
n can be askedincreased accrice and as a have seen recare services aonsolidate wh for local s.
T
uunniittiieess
o be le and cessible
.
er
of ent
pita is f access wns, and re,
nk at 2nd f local and no quality
d cess result, cent and in here it

LLiiffee oonn
How we gethe other ithan ever aour region
While the be more omore denswe can celdrive less afor ways tomiles trave
Highbikin
2nd lotravemor
Dailyhas dfrom
Most transfound in thwhich is noso is minimlook forwafor new m
Vehicle Miwas not repeer regiohere for th
A positive regional Vthe same pgrowth.
nn tthhee MM
et from one pis more impoand will help in the future
Midwest mayf a car culturesely populateebrate our efand continue o reduce our eled (VMT).
est percent wng to work
owest perceneling 30 minue to work
y vehicle miledecreased sligm 2000 to 200
sportation dahe decennial ow eight yearmally useful toard to the 201eaningful dat
iles Traveled eadily availablns but is preshe Madison R
trend is that MT is not incpace as our p
MMoovvee
place to rtant define e.
y always e than d regions, fforts to to look vehicle
walking or
nt utes or
s traveled ghtly 07
ata is census rs old and o us. We 10 Census ta.
(VMT) le for sented egion.
the reasing at opulation
20
Madi
Linc
Columb
Sal
Colum
Richmo
Madi
Linc
Columb
Sal
Colum
Richmo
2008‐20090
Source: U
So
Source: Wi
son WI Region
coln NE Region
bus OH Region
lem OR Region
mbia SC Region
ond VA Region
WI
US
21. Popu
son WI Region
coln NE Region
bus OH Region
lem OR Region
mbia SC Region
ond VA Region
WI
US
22. Trave
2007
2000
Dap
9 STATE OF THE
US Census, Mean
urce: US Census
isconsin DepartmUS Census Popu
0.0% 2.0%
n
n
n
n
n
n
I
S
ulation Bike/
n
n
n
n
n
n
I
S
ling Over 30
23. Madisaily Vehicle per Capita ‐2
E MADISON RE
ns of Transporta
s, Travel Time, 20
ment of Transpoulation Estimate
4.0% 6.0
/Walk to Wo
14.9%
0 mins to Wo
30.8
son RegionMiles Travel2000 and 200
EGION REPORT
tion, 2000
000
ortation and s
0% 8.0%
ork ‐ 2000
22.1%
28.7
25.3%
3
22.4%
ork ‐ 2000
31.6
led 07
T
Bike
Walk
7%
31.4%
32.7%
33.4%

Source: US
Source: US
Mad
Lin
Colum
Sale
Colum
Richmo
Mad
Lin
Colum
Sale
Colum
Richmo
2
S Department of
S Department of
ison WI Region
coln NE Region
mbus OH Region
em OR Region
mbia SC Region
ond VA Region
WI
US
24. Traffic Fa
ison WI Region
coln NE Region
mbus OH Region
em OR Region
mbia SC Region
ond VA Region
WI
US
25. Alcohol
f Transportation2000 and
f Transportation2000 and
n
n
n
n
n
n
S
atalities per
n
n
n
n
n
n
S
Impaired Dr2000 an
21
n, Fatality Analys2007
n, Fatality Analys2007
5.7
8
7.
5.1
5.9
7.4
7.3
6.3
6.6
6.6
4.0
6.0
6.7
6.8
r 1000 ‐ 2000
30.
24.6%
26.5%
24.5%
29.7
3
25.6%
32
29.4
22.4%
26.1%
28.1%
26.4%
27.6%
25.9%
rivers in Fatand 2007
2008‐20091
sis Reporting Sys
sis Reporting Sys
.0
10.8
.8
4
3
9.8
0 and 2007
.8%
%
46.0%
7%
34.6%
2.2%
4%
%
%
%
%
%
al Crashes ‐
9 STATE OF THE
stem,
stem,
2000
2007
2000
2007
Wro
Ato
TMWmort
Snpc
Faiwr
E MADISON RE
LLiiffee
While we areregion, safetyof quality of l
A recent induthat 77 perceoccur within
2nd loweper 100our pop7.7% fr
2nd highalcoholfatal craslightly with sli2007
The majority Madison RegiWhile there ismade on moroptions, it is lremain the mtransportatio
Safety on ournot only for dpassengers incyclists and p
Further reseaas well as tracincrease in otwill be includreports.
EGION REPORT
oonn tthhee
on the movey is a key indicife.
ustry survey sent of acciden15 miles of ho
est traffic fata00 in 2007 thopulation grewom 2000 to 2
hest percent o impaired driashes amongbehind WI, aght reduction
of people in tion travel by s progress bere mass transikely this will
major mode ofon.
r roads is impdrivers and n cars but for pedestrians as
arch of these cking the potther transit oped in future
T
MMoovvee
e in our cator
howed nts ome.
alities ough w by 2007
of vers in g peers, and n in
the car. eing it f
ortant,
s well.
issues ential ptions
AA HHeeaa
Health in‐handcomponquality have acservicesactive lioutdooseasons
2lofo
3ind
The drop icoverage wand is moscombinatioinclude: thwith emploinsurance,wage and often do nsponsoredreduction providing ccost, and twho are noMedicare.
Regardlis not thto be tras a nat
aalltthhyy,, AA
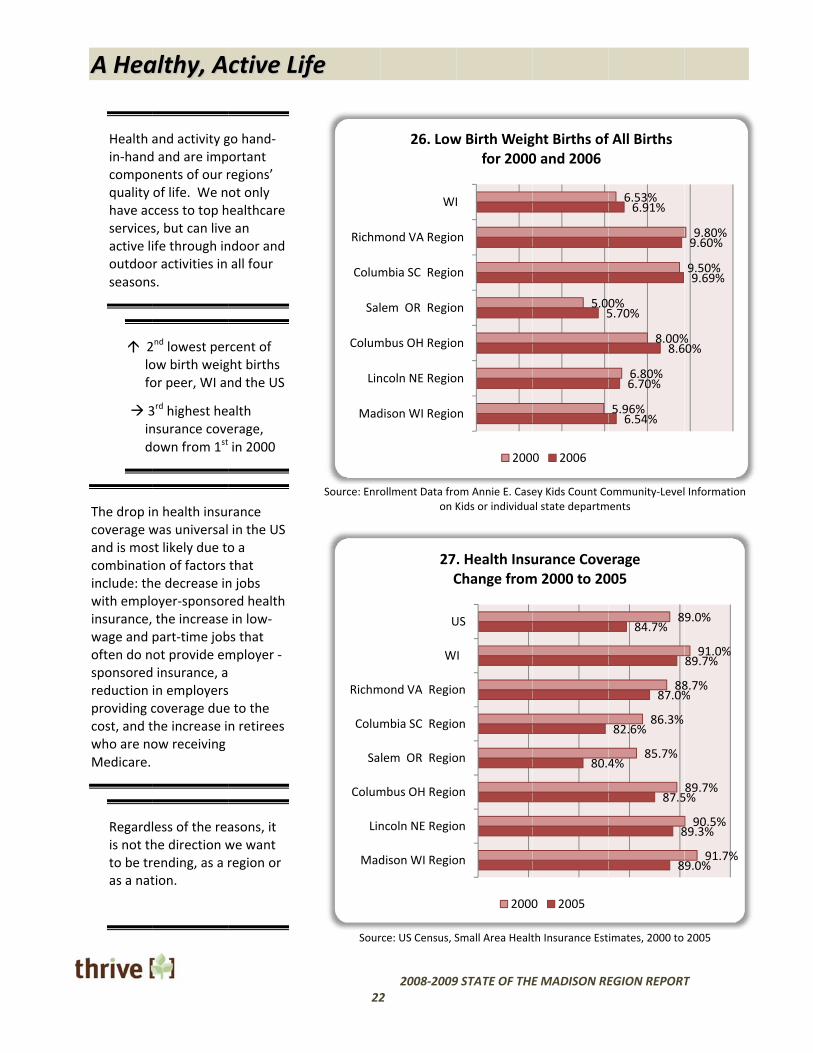
and activity gd and are impnents of our rof life. We nccess to top hs, but can liveife through inr activities in s.
2nd lowest perow birth weigor peer, WI an
3rd highest hensurance coveown from 1st
n health insuwas universalst likely due toon of factors he decrease inoyer‐sponsor the increasepart‐time jobot provide emd insurance, ain employerscoverage duethe increase iow receiving
less of the reahe direction wrending, as a rtion.
ccttiivvee LLiiff
go hand‐ortant regions’ ot only healthcare e an ndoor and all four
rcent of ght births nd the US
alth erage, in 2000
rance in the US o a that n jobs red health in low‐bs that mployer ‐ e to the n retirees
asons, it we want region or
22
iiffee
Source: Enro
Sour
Mad
Lin
Colum
Sal
Colum
Richm
Mad
Lin
Colum
Sa
Colu
Richm
2008‐20092
ollment Data froon K
rce: US Census, S
dison WI Regio
ncoln NE Regio
mbus OH Regio
lem OR Regio
mbia SC Regio
mond VA Regio
WI
26. Low
dison WI Regio
ncoln NE Regio
mbus OH Regio
lem OR Regio
mbia SC Regio
mond VA Regio
W
U
27C
9 STATE OF THE
om Annie E. CaseKids or individua
Small Area Healt
on
on
on
on
on
on
I
w Birth Weigfor 2000
200
on
on
on
on
on
on
I
US
. Health InsuChange from
2000
E MADISON RE
ey Kids Count Coal state departm
th Insurance Est
55.0
ght Births of0 and 2006
0 2006
80.4
urance Covem 2000 to 20
0 2005
EGION REPORT
ommunity‐Levelments
imates, 2000 to
6.54%
6.70%
8.6
5.70%
6.91%
5.96%
6.80%
8.00%
0%
6.53%
f All Births
8
8
87.5
4%
82.6%
87.0%
84.7%
85.7%
86.3%
88
8
erage 005
T
Information
2005
60%
9.69%
9.60%
%
9.50%
9.80%
9.0%
89.3%
5%
%
89.7%
91.7%
90.5%
89.7%
8.7%
91.0%
9.0%

S
So
Madi
Linc
Colum
Sale
Colum
Richmo
Mad
Lin
Colum
Sale
Colum
Richmo
Mad
Linc
Colum
Sale
Colum
Richm
Source US Comm
Source: EP
ource: National
ison WI Region
coln NE Region
bus OH Region
em OR Region
mbia SC Region
ond VA Region
W
US
28. Fitness/
ison WI Region
coln NE Region
mbus OH Region
em OR Region
mbia SC Region
ond VA Region
29. Air QSensitive &
ison WI Region
coln NE Region
bus OH Region
em OR Region
mbia SC Region
ond VA Region
30.
Rails to Trai
merce, Bureau o
PA Air Quality In
and State Park,
n
n
n
n
n
n
I
S
/Sports Cent
0
13
0
n
n
n
n
n
n
uality ‐ # Un& All Group
0 10
n
n
n
n
n
n
Special Outd
ils Nationa
23
of Economic Ana
ndex, 2000 and 2
and Rails to Tra
ters per 100
34
21
25
34
23
37
32
nhealthy Dayps ‐ 2000 and
20
door Places
al Parks St
2008‐20093
lysis, 2006
2007
ils websites
7.2
8.3
8.9
9.7
9.8
8.0
10.0
9.7
0 ‐ 2006
53
48
ys for d 2007
200
200
30 4
tate Parks
9 STATE OF THE
AA
0
00
07
40
Inseq
Trra
Tgotm
ScwMaaaec
E MADISON RE
AA HHeeaalltthh
n addition to ervices, an acenhances our quality of life.
The region abesources andound indoor activities.
Lowest centers this perentrepreopportu
3rd higheincreasequality d
3rd high“specialnationawithin e
There are magauge our acoptions and wo look for mmeasures in
Special outdochosen as a wwhat is uniquMadison Regalso work to additional spand county pestablish a pacapita pictur
EGION REPORT
hhyy AAccttiivv
healthcare ctive lifestyle overall healt
ounds in natud access to yeand outdoor
number of fiper capita, thhaps presenteneurial unity
est number ae of unhealthdays
hest number o places” – tral and state paeasy drive dist
any ways to ctivity levels we will cont
meaningful this categor
oor places wway to look aue to the gion but we wcatalogue
paces such asparks in ordeark acres pee of the regi
T
vvee LLiiffee
h and
ural ar‐
tness hough s an
nd y air
of ails, arks tance.
and tinue
ry.
was at
will
s city er to er ion.

2008‐2009 STATE OF THE MADISON REGION REPORT 24
RReeggiioonnaall MMaappss

2008‐2009 STATE OF THE MADISON REGION REPORT 25
RReeggiioonnaall MMaappss

2008‐2009 STATE OF THE MADISON REGION REPORT 26
AAddddiittiioonnaall RReeppoorrttss PPllaannnneedd ffoorr 22000099
State of the Madison Region – Monthly Insights focused on further exploring the individual metrics and what regional experts think they mean for the Madison Region
o One of the early 2009 features will explore race and ethnicity in the region Sector Snapshots that will help us further understand the targeted sectors of Agriculture, Biotechnology and Healthcare and how they each compare against a unique set of peer regions
Preliminary planning is underway for a mid‐year Regional Innovations report that will explore how the Madison Region is doing on measures related to entrepreneurism, patents, research funding, etc.
Receive the monthly Thrive Newsletter to get the latest information about the above reports and other regional news. Sign up from any page on our website: www.thrivehere.org

2008‐2009 STATE OF THE MADISON REGION REPORT 27

2008‐2009 STATE OF THE MADISON REGION REPORT 28
Thrive ©Madison Region Economic Development Enterprise
615 East Washington Avenue Madison, WI 53701 (608) 443‐1960
[email protected] www.thrivehere.org