11c – madison neighborhood indicators: past, present and future
TRANSCRIPT
Madison Neighborhood IndicatorsPast, Present, & Future
Applied Population Laboratory, University of Wisconsin –Madison
www.cityofmadison.com/ni
• Principal Figures: Bruer, Cieslewicz, Statz
• Funding: City ~$50K/yr, Planning Office, No Federal or Foundations $$
• Internal/External Purposes
• Four years of data: 2008‐2011 Demographics, Housing, Economic, Health and Family, Transportation, Public Safety, Community Involvement, Conservation
• Indicators: geographically specific, regularly updated and consistently and systematically collected.
Background

0 5 10 15 20 25 30 35 40 45 50
Data collection, Cleaning, Validation
Geospatial tabulation/summary
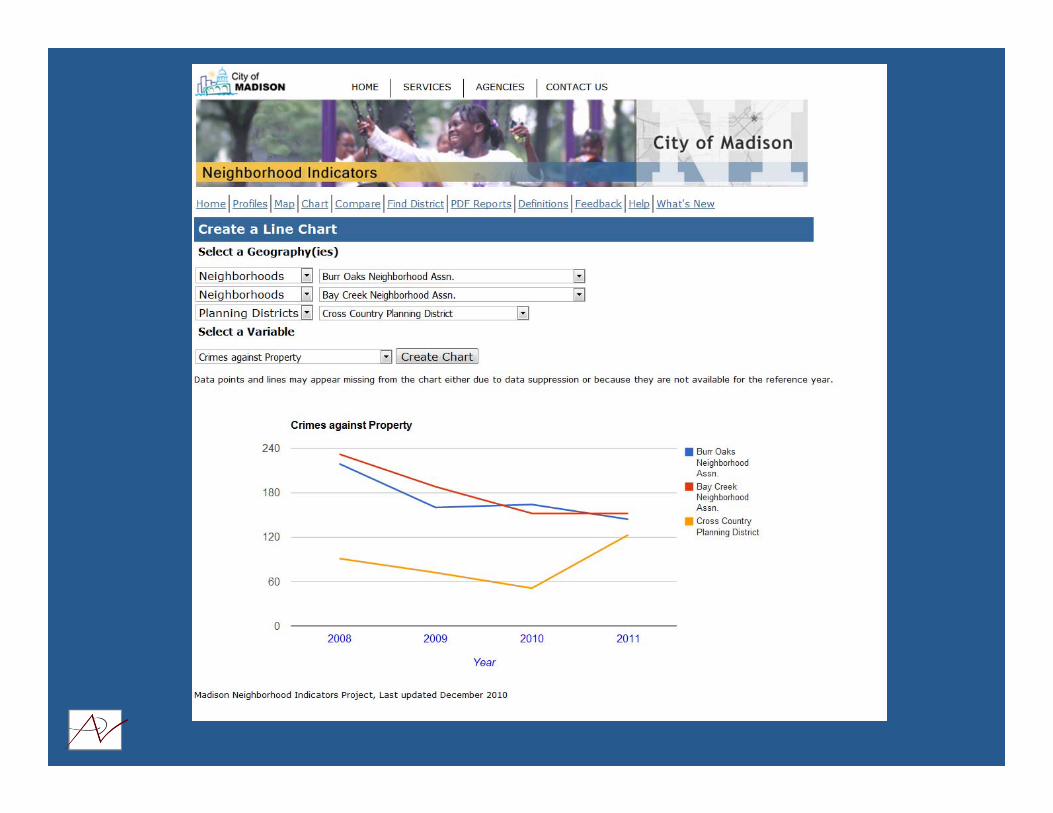
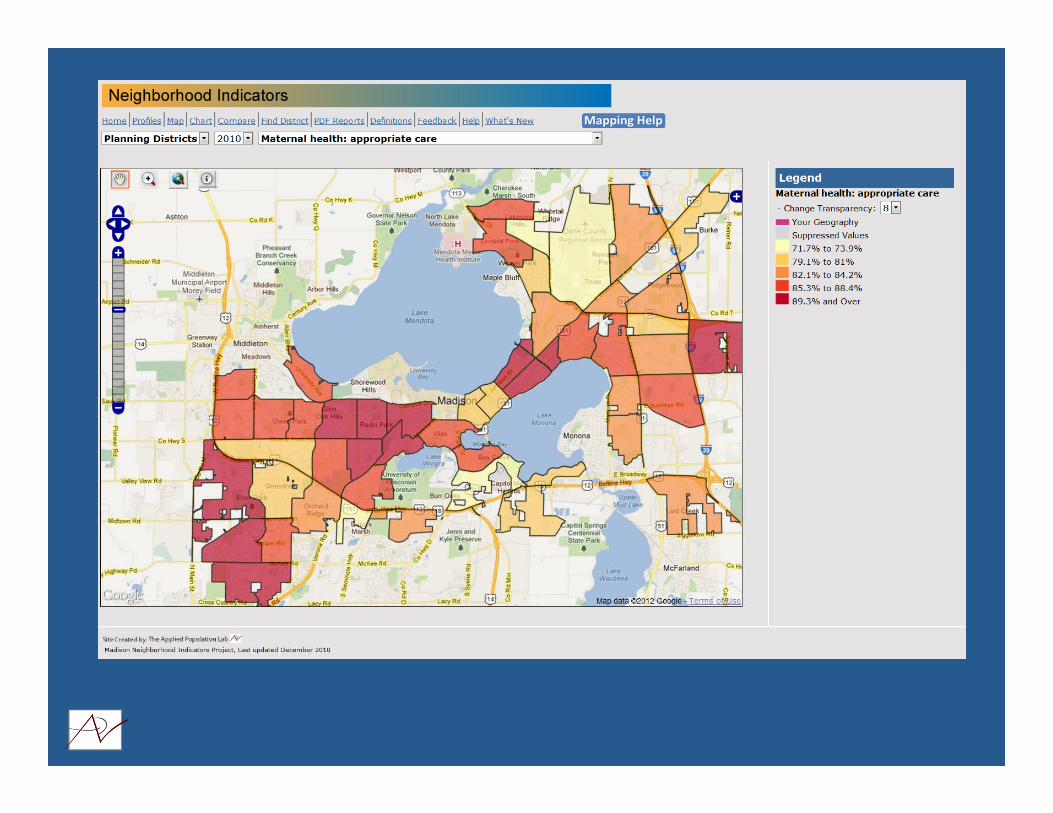
Website tools: interactive charting & mapping
Profiles & Annual report production for printing
Coordination w/ City staff on System Development
Stakeholders Identification, Training, Feedback
Percent
Share of APL effort by task
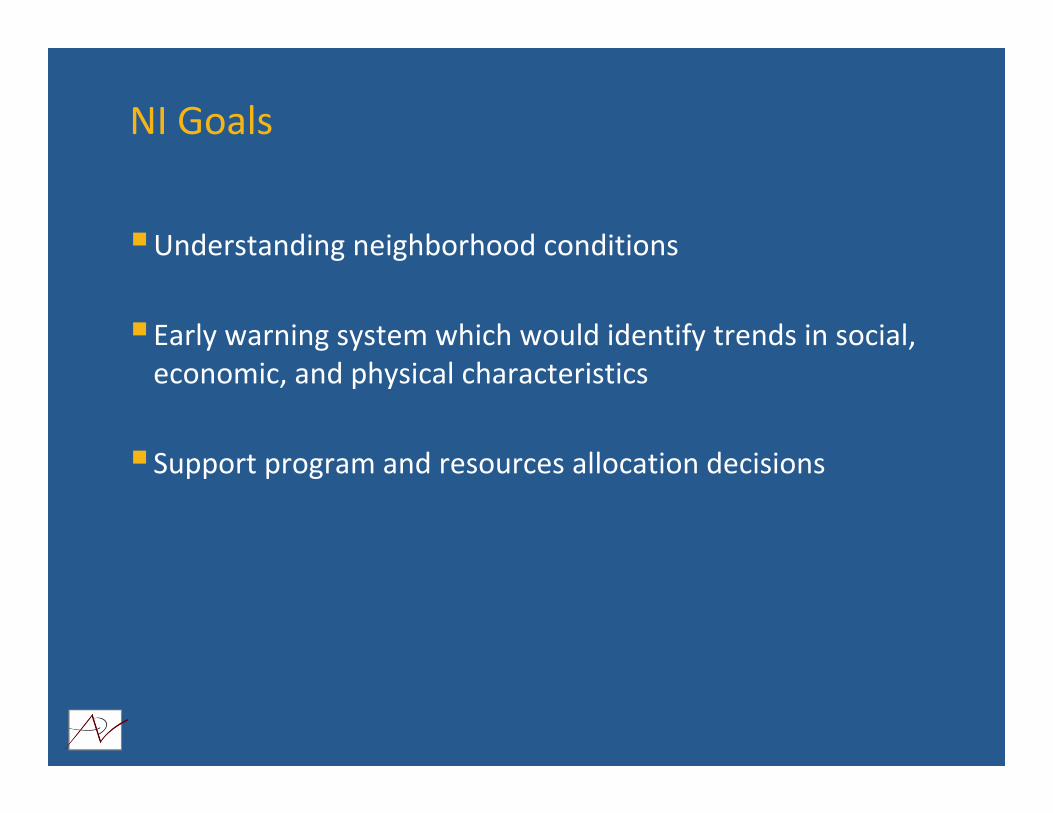
NI Goals
Understanding neighborhood conditions
Early warning system which would identify trends in social, economic, and physical characteristics
Support program and resources allocation decisions
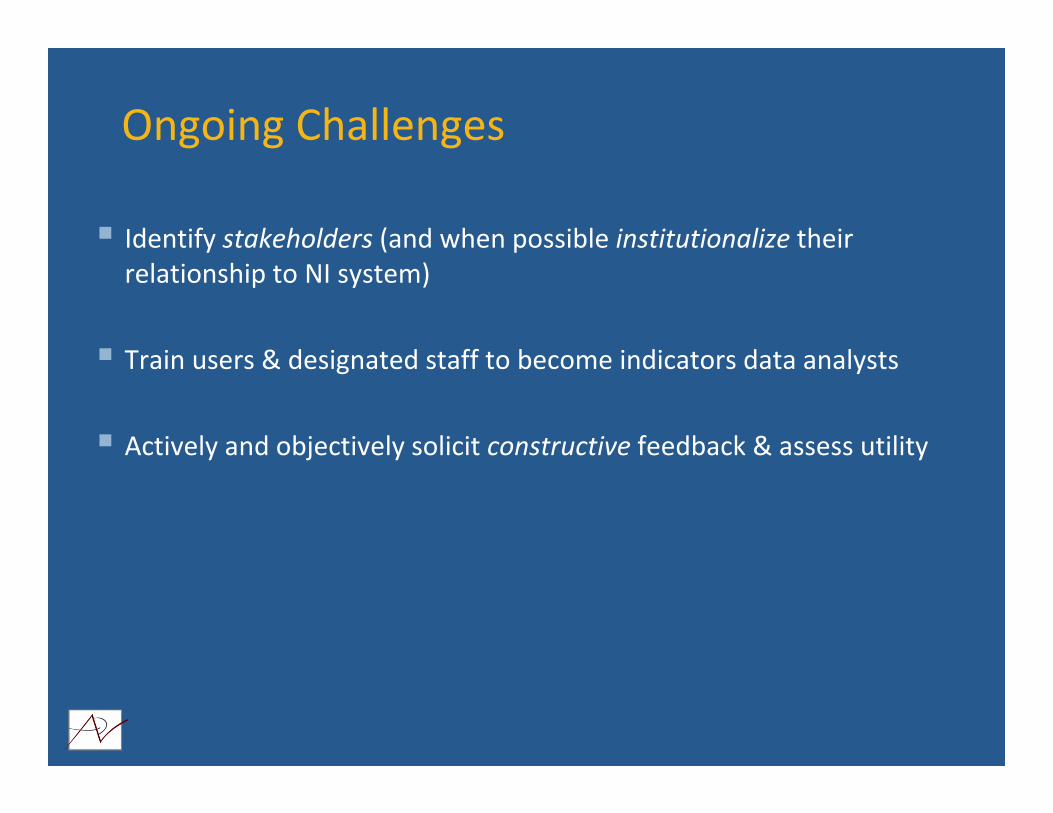
Ongoing Challenges
Identify stakeholders (and when possible institutionalize their relationship to NI system)
Train users & designated staff to become indicators data analysts
Actively and objectively solicit constructive feedback & assess utility
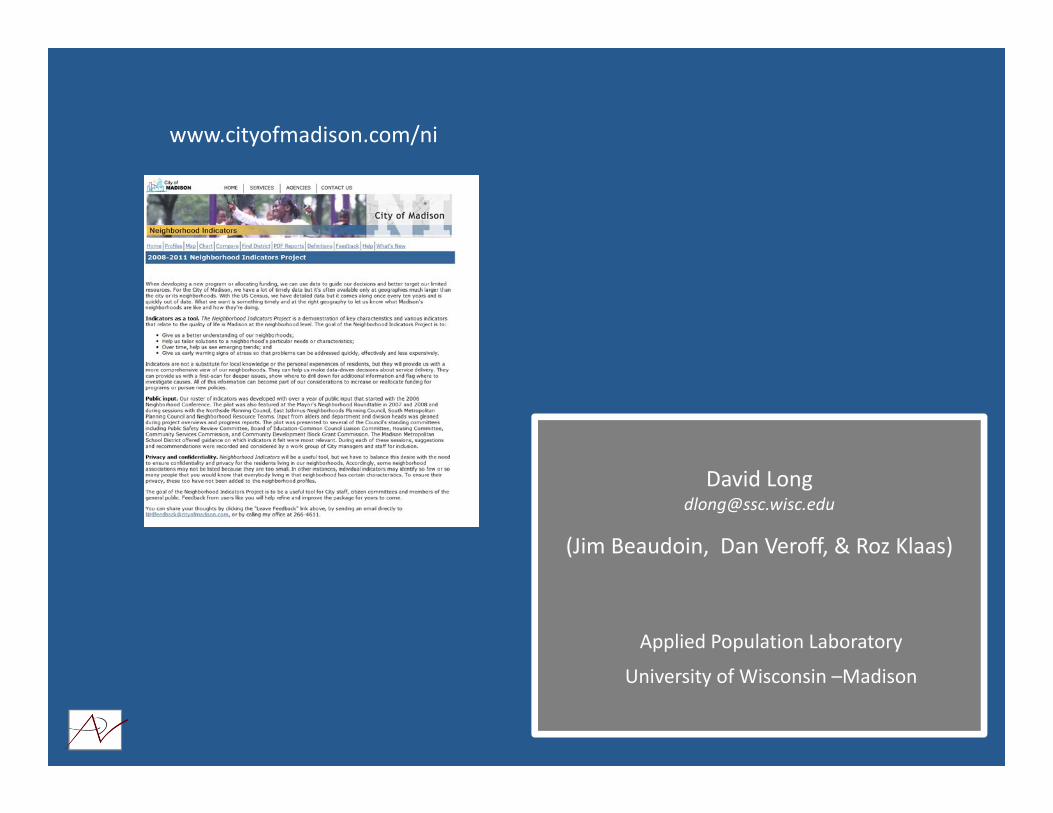
www.cityofmadison.com/ni
Applied Population Laboratory
University of Wisconsin –Madison
David [email protected]
(Jim Beaudoin, Dan Veroff, & Roz Klaas)